
Underground Storage of Green Hydrogen—Boundary Conditions for Compressor Systems


German Aerospace Center, Institute of Networked Energy Systems, Carl-von-Ossietzky-Str. 15, 26129 Oldenburg, Germany
*
Author to whom correspondence should be addressed.
Energies 2022, 15(16), 5972; https://0-doi-org.brum.beds.ac.uk/10.3390/en15165972
Submission received: 25 July 2022
/
Revised: 12 August 2022
/
Accepted: 15 August 2022
/
Published: 18 August 2022
(This article belongs to the Special Issue Advances in Hydrogen Energy Production and Storage)
Abstract
:The large-scale storage of hydrogen in salt caverns, modelled on today’s natural gas storage, is a promising approach to storing renewable energy over a large power range and for the required time period. An essential subsystem of the overall gas storage is the surface facility and, in particular, the compressor system. The future design of compressor systems for hydrogen storage strongly depends on the respective boundary conditions. Therefore, this work analyses the requirements of compressor systems for cavern storage facilities for the storage of green hydrogen, i.e., hydrogen produced from renewable energy sources, using the example of Lower Saxony in Germany. In this course, a hydrogen storage demand profile of one year is developed in hourly resolution from feed-in time series of renewable energy sources. The injection profile relevant for compressor operation is compared with current natural gas injection operation modes.
1. Introduction
The reduction of climate-changing carbon emissions is associated with the need to convert energy systems from fossil energy sources to renewable energies, which currently represent the core infrastructure for a secure energy supply [1]. The gas infrastructure in particular is a key component of the energy transition because of its transport and storage options [2]. For the connection of electricity grids with gas grids, the power-to-gas technology could be utilised to produce hydrogen via water electrolysis from renewable electricity. The technology has great potential in decarbonising different energy sectors such as the heating, transport and chemical industries. [3,4,5]. Currently, some studies suggest that hydrogen could be used as a climate-neutral substitute for natural gas in the future, and thus that the already well-developed natural gas network could be put to further use as a hydrogen network [6]. Furthermore, an initial European hydrogen gas network is in the process of planning by the pipeline operators [7]. Initial investigations show that the conversion of cavern gas storage to hydrogen storage is possible in principle [8].
From a systems engineering perspective, the conversion of the energy carrier in gas storage operation is associated with some challenges. Other concerns regarding hydrogen storage in caverns, such as hydrogen embrittlement and well integrity, are handled among others in [9,10], but are not the focus of this publication. Particularly in the case of hydrogen production from renewable energy sources, the supply and volatility of the energy sources will play a central role in the future as to when and how much hydrogen must be injected and withdrawn, partly in a highly dynamic and flexible manner. Especially the compressor systems, as a coupling point between the gas grid and cavern, must be designed for this task. The core element of this work is therefore to analyse the requirements for compressor systems in a future storage operation. The focus is set on the storage of regionally produced, green hydrogen in cavern gas storage facilities in the exemplary chosen federal state of Lower Saxony in the north of Germany. The state has a great potential for renewable energies as well as for cavern gas storage facilities [11]. Due to the still unclear share of imports in the overall supply [12,13], this paper does not consider hydrogen imports. This topic must be covered in a later analysis with special efforts.
The following work is structured as follows: Section 2 deals with the methodology to establish meaningful boundary conditions for future hydrogen storage operation. Section 3 shows the results of the analysed hydrogen storage demand profile and the differences in natural gas storage operation. These results are discussed in Section 4 and concluded with some interpretation of future demands of work to achieve hydrogen caverns in the near future in Section 5.
2. Materials and Methods
To achieve the goal of designing and modelling concepts for technically feasible and energy-efficient underground storage of green hydrogen, the boundary conditions have to be set in the first step. Especially the design of compressor systems is very sensitive to suction pressure, cavern head pressure and injection demand. Together with high costs for the compressor setup for gas storage facilities, this shows the significance of a meaningful definition of boundary conditions [14]. Therefore, the following sections show up the major aspects of setting the named boundary conditions, after the definition of the balance sheet limits.
2.1. Definition of the Balance Sheet Limits
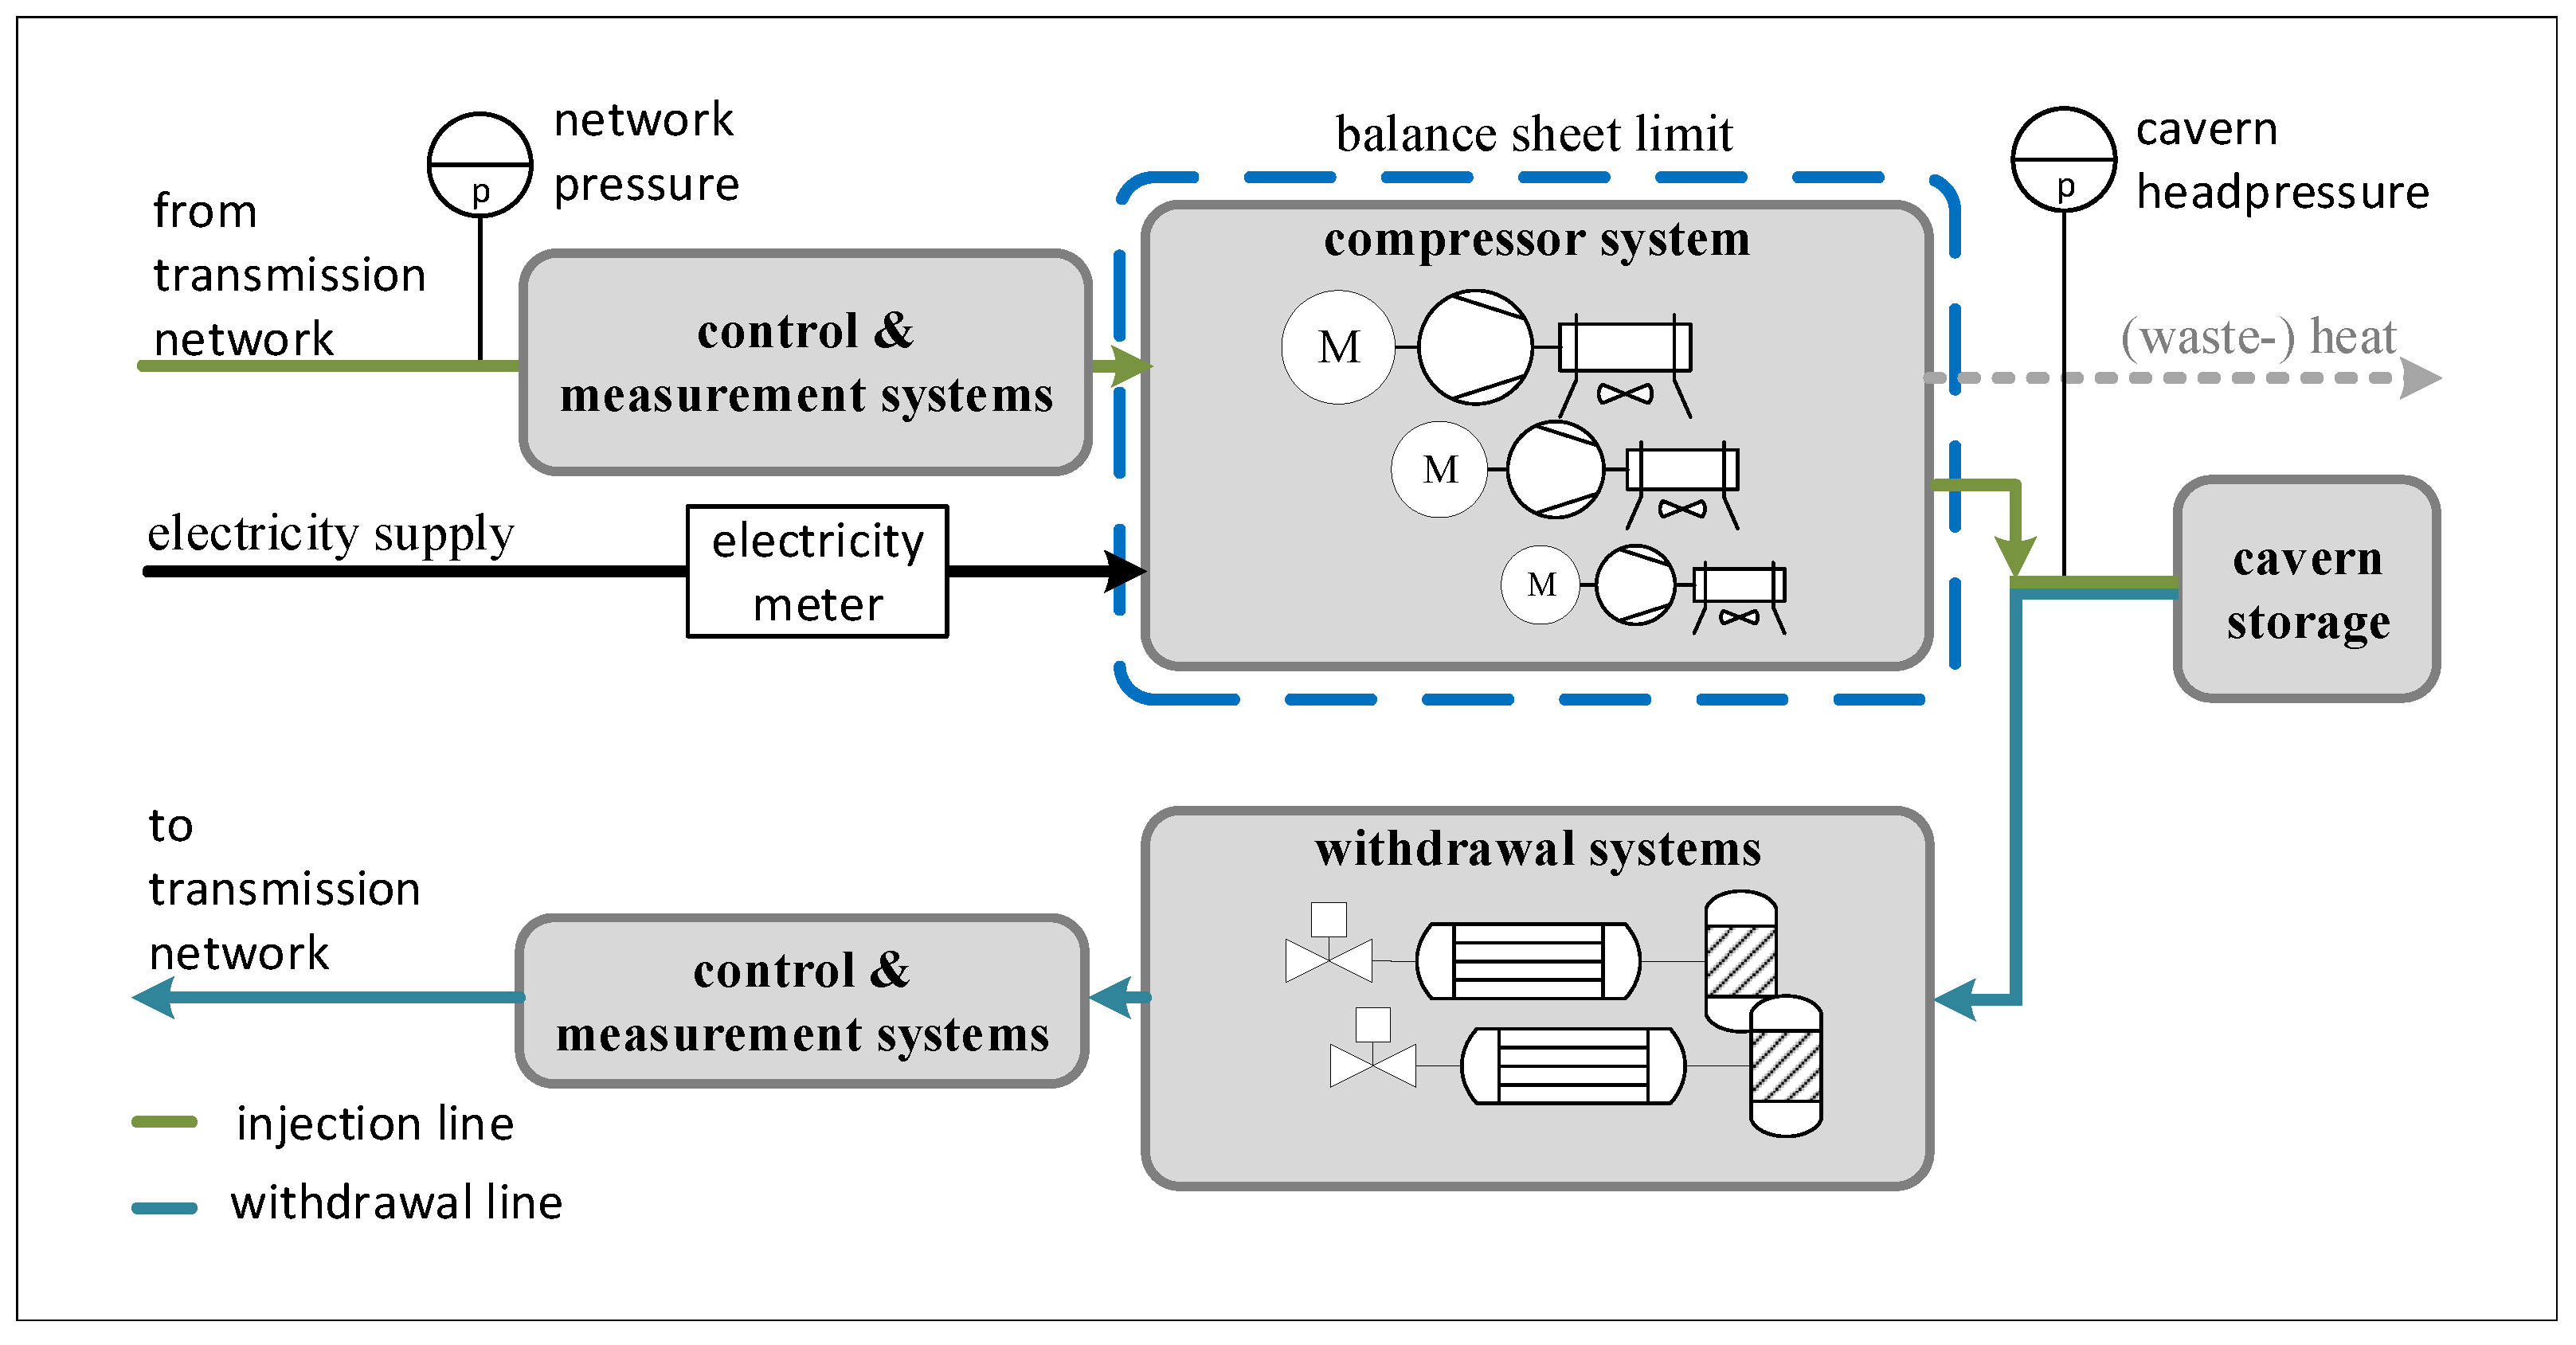
In the first step, it is necessary to define the balance area. Figure 1 shows a simplified gas and energy flow diagram of an exemplary gas storage facility.
The upper half shows the so-called injection line, wherein gas from the transmission network is fed to the compressor system via filtration and volume measurement. The compressor system defines the flow rate and increases the pressure from the network pressure to the pressure level of the cavern head. The process section from the cavern to the transport pipeline is called the withdrawal line and includes gas drying, preheating, if necessary, a control valve and a measuring section [15].
2.2. Pressure in the Transmission Network
The approach for modelling future boundary conditions of underground hydrogen storage is based on the energy demand for the injection process that is mainly dependent on the factors suction pressure, flow rate and cavern head pressure.
The pressure in the transmission network substantially determines the suction pressure of the compressor system during injection and the final pressure for withdrawal. Pressure losses, e.g., from filters and measuring equipment, have an additional influence on the pressure for the individual storage technology. However, these would depend on the plant-specific conditions. For this reason, these pressure losses are not considered. The current pressure in natural gas transmission pipelines varies between 20 and 100 bar depending on the location and the operator [16,17]. In the scenario considered, the natural gas transmission network is converted to a pure hydrogen network so that electrolysis sites would be connected to storage sites. According to initial explorations, this is also considered technically possible [10]. On a small scale and for a different purpose, there are already existing hydrogen pipeline networks [18]. However, as soon as a pure hydrogen transmission network is in place, the question of pressure in the network arises anew. There are two major trends to be mentioned here. On the one hand, the lower volumetric energy density of hydrogen compared to natural gas means that higher-volume flows are required for the same energy transport. This is accompanied by higher pressure losses, which have to be compensated for in an energy-intensive manner. Accordingly, the pressure should be selected as high as possible within the technical limits in order to, at least partially, compensate for the higher operating volume flow and thus reduce the energy demand of the gas transport. In this context, one study mentions a transport pressure range of 50 to 80 bar [19]. On the other hand, the trend for higher network pressure is contrasted by the energy demand for feeding into the transport network. In addition to the energy required to raise the pressure, the required output pressure influences the efficiency of the electrolyser, whereby the level depends on the technology used [20]. Some electrolysis technologies offer the possibility of producing compressed hydrogen without, or at least reducing, additional demand for mechanical post-compression. According to Bensmann [20] and Wulff et al. [21], pressure electrolysis shows a higher efficiency compared to atmospheric electrolysis and downstream, mechanical compression. Table 1 shows a compilation of currently available electrolysers in the power range above 1 MW and their maximum hydrogen output pressure. It shows that the maximum output pressure is currently around 40 bar. In smaller power classes, the first electrolysers with a maximum hydrogen output pressure of up to 100 bar are announced [22].
In the present scenario, the focus will be exemplary on the Lower Saxony region in northwest Germany, which is characterised by a large number of renewable energy sources (such as wind farms and large-scale photovoltaics) as well as underground storage capacities. Figure 2 shows the current locations of installed wind farms and large photovoltaic systems extracted from OpenStreetmap [30], together with the existing salt cavern storage facilities [31] in Lower Saxony.
Accordingly, a relatively small spatial distance between electrolysis and gas storage operations can be assumed, which could also be even diminished by the construction of new salt caverns. This leads to the assumption that the factor of energy demand for hydrogen production and grid feed-in is of greater importance. Besides that, improved energy efficiency in the next years might lead to less transport demand and therefore reduced focus on high-pressure transport. Against this background, it is assumed that the pressure at the handover point between the transmission network and gas storage is 40 bar, i.e., the maximum of what can still be realised without mechanical post-compression according to the current state of electrolysis technology (see Table 1).
2.3. Hydrogen Storage Demand
Another essential element of modelling hydrogen storage boundary conditions is the analysis of the storage profile, i.e., the amount and timing of the volume flow that needs to be injected and withdrawn within a year. In this first approach and for a better overview, a calendar year is chosen here, which is not to be confused with a storage year from April to March. Currently, no data on storage profiles for hydrogen injection and withdrawal in hourly resolution are available in the literature. This is also true for production profiles of green hydrogen. For this reason, a storage-demand profile for green hydrogen is developed below. The definition of so-called green hydrogen is to be set as hydrogen which is produced by means of electrolysis from electricity generated by wind power and photovoltaics [32]. Methodologically, the first step towards the hydrogen profile is therefore the use of a profile for electricity from renewable energies. From this produced energy, a share must be formed that is used to operate the electrolysers. Using the characteristics of electrolysers, a hydrogen production profile can then be formed, which represents the feed-in of the gas into the transport network. Any losses or expenses for gas conditioning, that might be necessary for grid injection, are not considered here. The storage profile results from the difference between the production profile and a hydrogen demand profile.
The methodology is implemented in the first step by using generic feed-in time series for renewable electricity from offshore and onshore wind power as well as photovoltaic. These data sets were developed by the Oeko-Institut e.V. and ForWind GmbH to enable electricity market models to have a uniform data basis [33,34,35,36]. However, these time series also provide an equally ideal basis for calculating the hydrogen production profile. The hourly feed-in capacities from the energy sources mentioned are defined over the course of the year. The data can be scaled via the information on the installed power and adapted to different scenarios. The values used for the installed capacities of renewable energies are based on the results of the study by the Oeko-Institut and the Fraunhofer ISI on the climate protection scenario 2050 and specifically on the so-called Climate Protection Scenario 80. This scenario takes into account a reduction target for greenhouse gas emissions in 2050 of 80% compared to 1990 [37]. In the meantime, there have been more ambitious targets [38], so it can be regarded as a medium scenario. The focus in the following is on the storage of regionally produced hydrogen. The exact amount of installed capacity is not elementary, as the additional share that would be covered by imports is assessed very differently [12,13]. With the aim of presenting representative differences in gas storage between natural gas and hydrogen, a medium scenario of available, renewable feed-in capacities seems appropriate.
The hourly resolution of the data should also be emphasised. Lower resolutions would smooth storage profiles to such an extent that compressor operation could no longer be realistically depicted. Furthermore, the feed-in profile is subdivided at the federal state level in Germany, so that differences in the availability of renewable energy sources are taken into account in the feed-in profiles. This is a clear advantage over a nationwide view, as it also allows local overproduction of electrical energy for gas storage to be taken into account. In accordance with the objective, the federal state of Lower Saxony was chosen as an example. The installed power in this example is 15.8 GW wind power onshore, 21 GW wind power offshore and 12 GW photovoltaic power. Figure 3 shows the annual course from January to December of the electrical feed-in profile of renewable energies () on which the further calculations are based. The curve shows a high dynamic between 0.095 and 39.6 GW. The summer photovoltaic influence plays a subordinate role in combination with generation from wind power.
Of the available renewable feed-in power, a share must be formed that is used for hydrogen production. This is also a question of dimensioning the electrolysis capacity to be installed. The procedure here follows the methodology used in the HYPOS study [39]. Accordingly, peak outputs that occur for less than 500 h per year are curtailed, as the additional electrolysis power to be installed for these periods is not considered economically viable. Since it was not possible to obtain a suitable electrical demand profile, the procedure of the HYPOS study is also applied when deducting the direct demand for electricity. According to this, 10% of the installed capacity from wind energy sources is considered base-load capable, so the feed-in capacities that fall below this value are deducted as direct electrical demand. Only a small proportion remains unused due to curtailment. The power range between the two limits is used to operate the electrolysers. This procedure is intended to represent the first approach to estimating an electrolyser operation using renewable energies. Future optimisation measures consist of the comparison of electrical production and direct demand profiles, as well as in the consideration of the presented properties of some electrolysis systems to be able to be operated above nominal power for a short time [40], which would further avoid shutdowns.
Based on the available electrical input power for the electrolysers, hydrogen production can be calculated. It is assumed that the available electrical power can also be converted within one hour. The conversion of electric power into hydrogen takes place by means of specific energy input for the production of one hydrogen unit. The future energy demand for this is estimated at 44 to 53 kWh/kg [41,42]. Taking into account that electrolyser operation with direct use of fluctuating electricity production does not always represent operation at the optimal operating point, a specific energy input for hydrogen production of 50 kWh/kg, or 4.5 kWh/m (STP), was selected on this basis.
In the next step, this production profile must be contrasted with a demand profile to determine the storage requirements. This demand profile has to be generated synthetically, as no gas demand profile for Germany in hourly resolution could be obtained at the time of the work. However, corresponding gas demand profiles are available from the Austrian Gas Supply. Here, the year 2019 was chosen, as it is not a leap year and also does not contain any special features due to the Corona pandemic [43]. A normalised load profile is generated from this profile by forming hourly shares of the annual demand. In this way, the gas demand profile can also be scaled to deviate annual demand values. For the formation of the hydrogen storage profile, it is assumed that the amount of hydrogen produced in a year is also used in the same year. Accordingly, the demand profile is scaled to the produced quantity. Figure 4 shows the annual course of the different calculated volume flows. The production profile (black) shows a strongly dynamic profile that appears relatively uniform over the year. The demand profile (blue) shows higher demand in the winter months. In the summer months, demand is reduced to about one-third of the winter demand. The hydrogen storage profile (green) is the hourly difference between production and demand. Storage and withdrawal processes occur throughout the year. The lower gas demand in the summer months leads to higher required injection volume flows, whereas higher withdrawal volume flows are required in the winter months.
2.4. Required Cavern Size
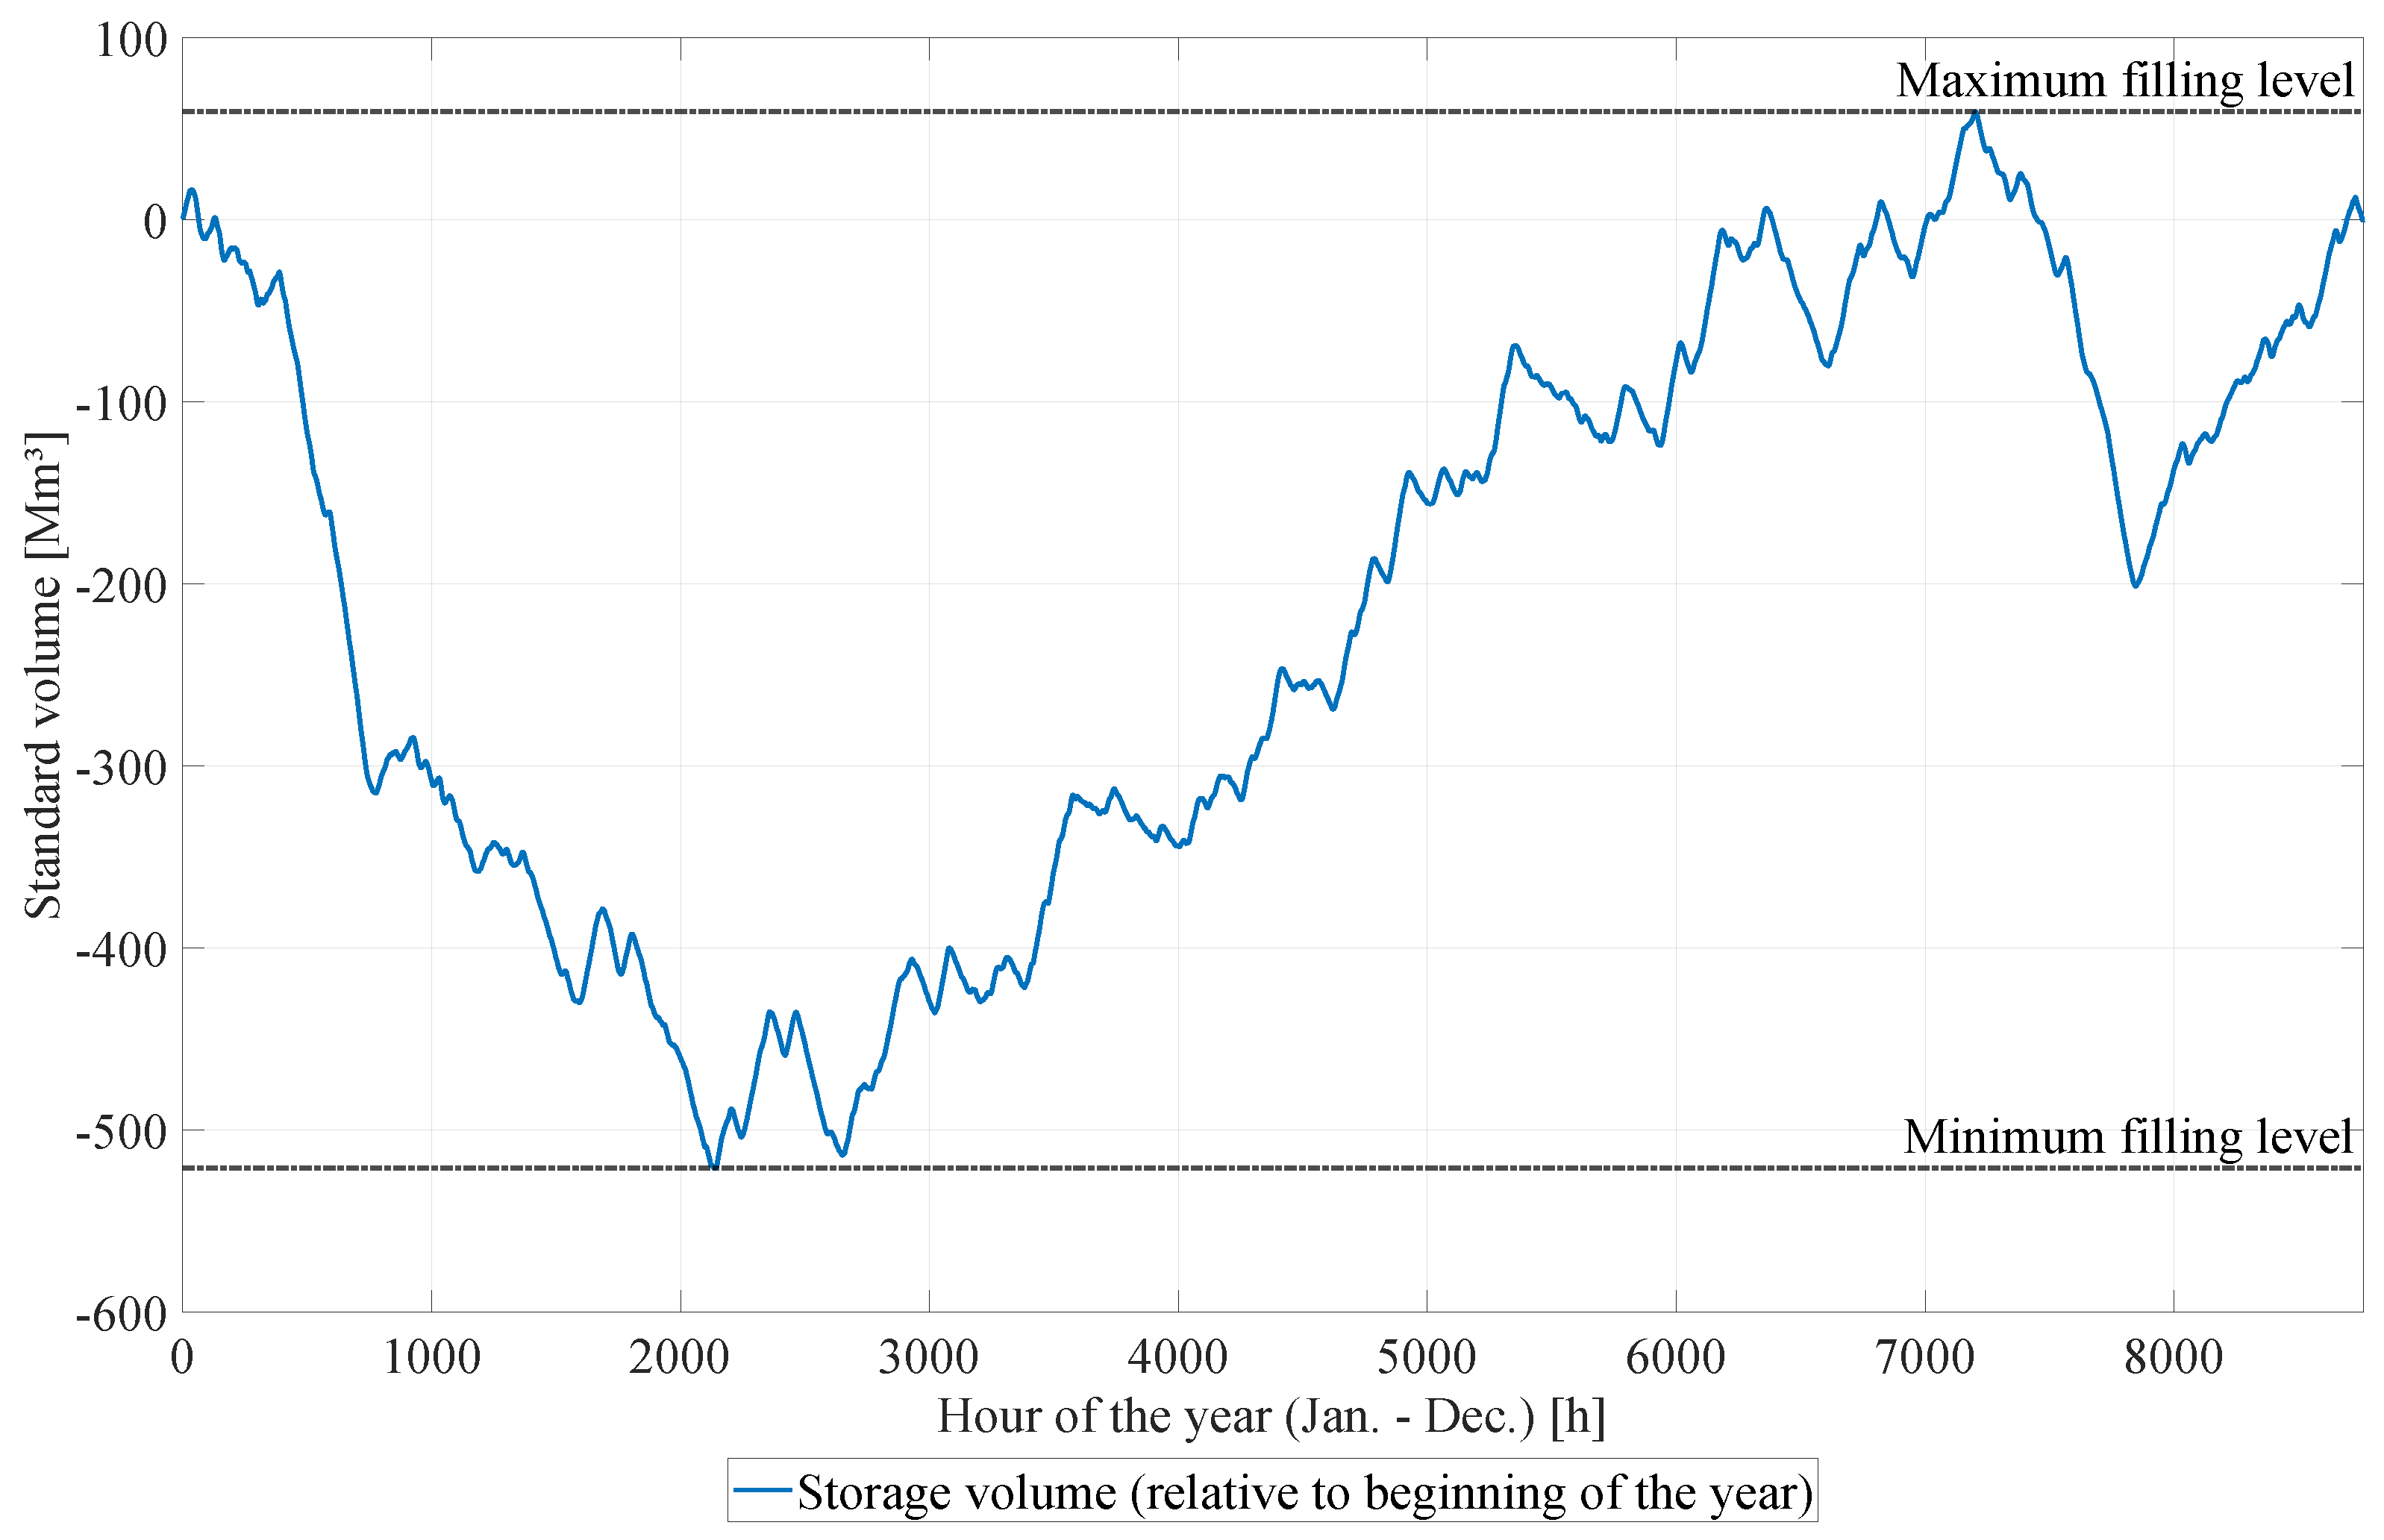
The combination of total storage volume and cavern size has a fundamental influence on the energy demand for injection and withdrawal. The simple selection of a cavern size thus also influences the energy requirement of the compressors. Therefore, a determination of the required cavern size is fundamental in the comparative calculations in order to represent the final pressure realistically over the entire operating range. The required cavern size can be derived from the storage profile. Following the methodology from Schmidt [44], the volume flows of the storage demand profile are accumulated for this purpose. The resulting profile provides the stored gas volume, as shown in blue over the course of the year in Figure 5. The difference between the maximum () and the minimum volume (), indicated by the black dotted lines in Figure 5, forms the necessary working gas volume () of the cavern according to Equation (1).
Using the minimum () and maximum () permissible pressure in the cavern, the required geometric volume () can also be determined from the standard working gas volume () according to Equation (2). The conversion to standard conditions (STP) requires the compressibility factor at maximum () and minimum () cavern pressure, as well as for standard conditions (). Furthermore, the temperature inside the cavern (T) and the standard temperature () and pressure () have to be defined.
3. Results
3.1. Hydrogen Storage Demand Profile
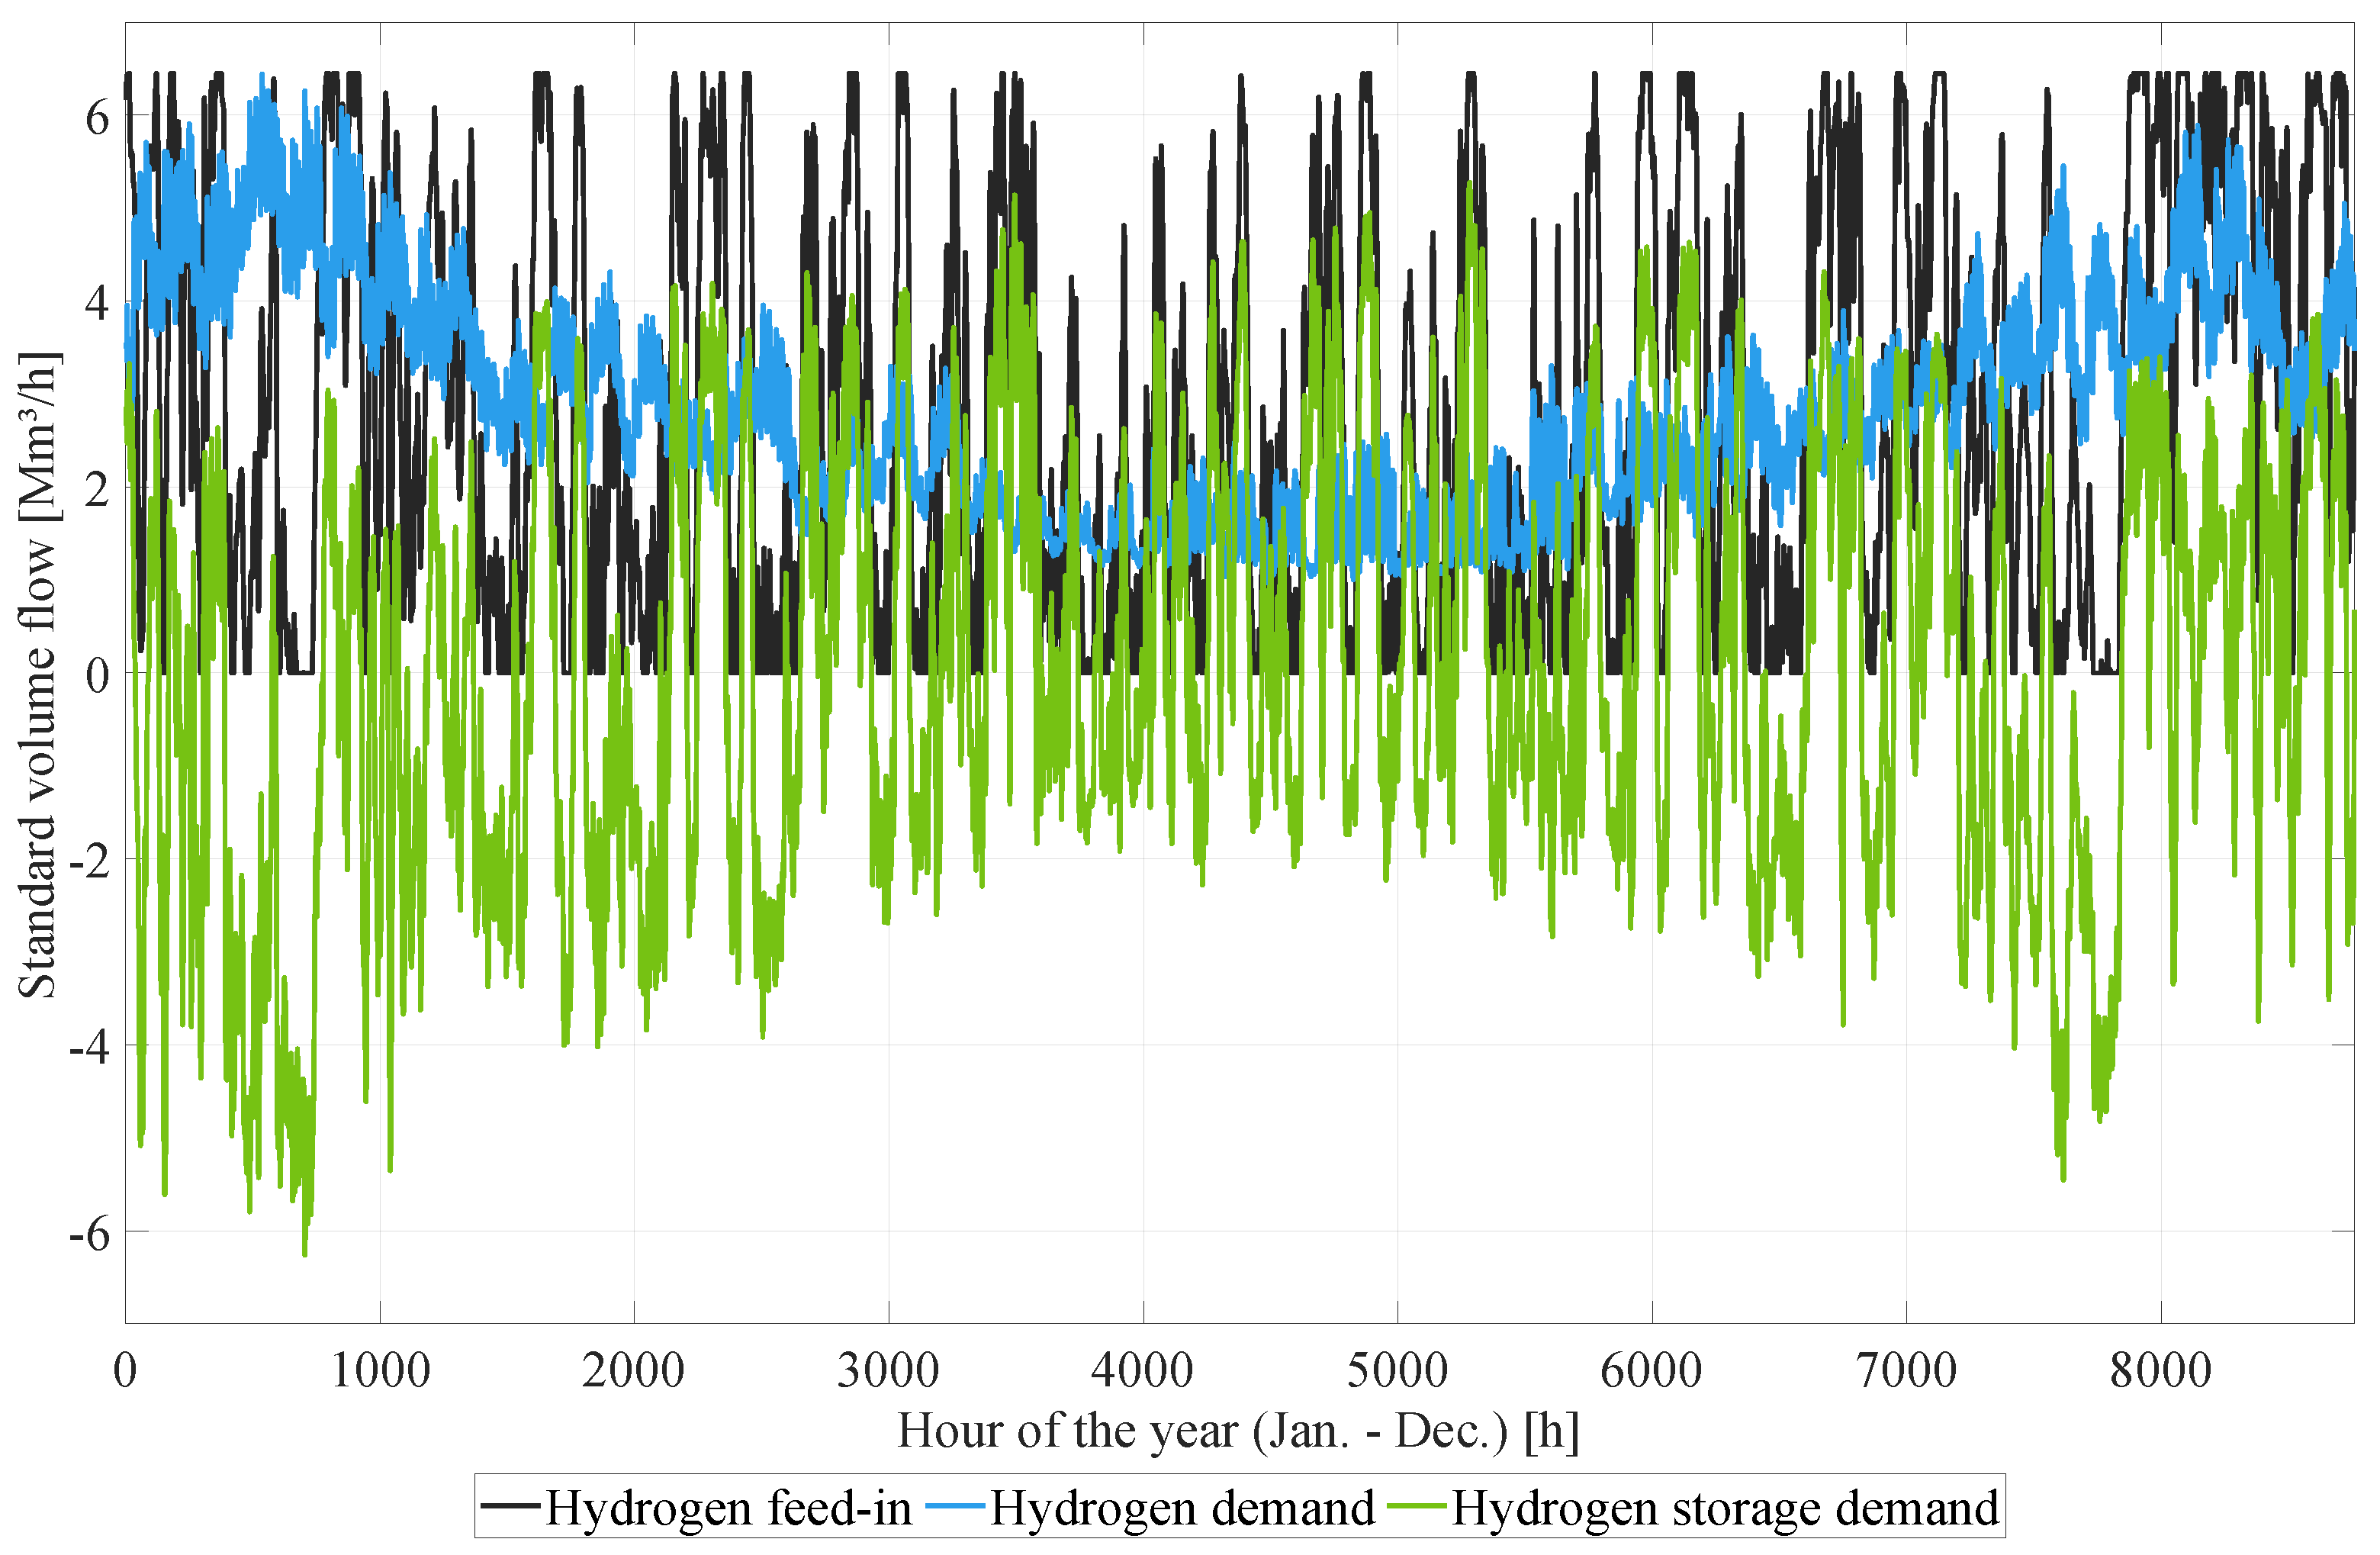
The hydrogen storage demand profile was formed as the difference between hydrogen production and demand, as described above. Taking into account the described boundary conditions, these calculations form the hydrogen storage demand profile for Lower Saxony in 2050. For a better overview and for scaling to the size of a medium gas storage operation, a demand share of 20% was selected. Figure 6 shows the resulting storage demand profile as a volume flow requirement over the course of a calendar year. The volume flow relevant for compressor operation is shown here with a positive sign. This half of the storage demand profile forms the hydrogen injection demand profile, while the negative half represents the hydrogen withdrawal demand profile.
Based on this hydrogen storage demand profile, the necessary cavern size is calculated as described before. The required working gas volume in this case measures 580.3 Mm (STP). For the calculation of the geometric cavern volume, a range of cavern head pressures from 40 to 150 bar is used. A minimum pressure of 40 bar was selected, as this corresponds to the defined pressure in the upstream transport network derived before. Both limits can be seen as a medium case. The mechanisms that influence the cavern temperature are manifold [45,46], but in the first approach, the temperature has been selected to 40 °C on average. The compressibility factors have been interpolated according to pressure and temperature within the databases of AIR LIQUIDE [47], Wischnewski [48] for methane and the Pacific Northwest National Laboratory [49] for hydrogen. On this basis, the required geometric cavern volume of 6.80 Mm is calculated.
3.2. Hydrogen Storage Compared to Natural Gas Storage
In this section, the differences and similarities in gas storage operation between the storage of natural gas and green hydrogen are presented. For this purpose, the calculated standard hydrogen volume flow rates () were converted to the hourly storage capacity () according to Equation (3). The conversion is carried out taking into account the gross calorific value ().
The amount of stored energy is calculated from the sum of the hourly injection capacities, which in this scenario amounts to 6.08 TWh. For comparison, a publicly available injection time series of a comparable natural gas storage facility in Jemgum, Lower Saxony, was used [50]. The time series was first normalised for comparability and scaled to the annual hydrogen energy stored. In this way, the boundary conditions for both injection time series are comparable. Figure 7 presents the comparison of the injection demand flow rates for hydrogen (green) and natural gas (blue) over the course of a calendar year. To illustrate the dynamics, the bottom half of the figure shows a section of a monthly period in summer.
Another aspect in the comparison between natural gas and hydrogen storage is the required cavern size. The stored energy () is in both cases defined by the working gas volume and the gross calorific value (see Equation (4)). In the case of natural gas, type H is selected, i.e., the high calorific type of natural gas. From the ratio of gross calorific values for natural gas () and hydrogen () [51], it is calculated that the hydrogen storage requires a working gas volume () that is about 3.2-times larger than for natural gas considering the same amount of stored energy (see Equation (5)). If the different compressibility factors [47,48,49] are included in the calculation of the geometric volume according to Equation (2), it results that an approximately 4.4-fold larger geometric cavern volume is required for hydrogen storage with the same stored energy. However, this consideration presupposes a similar storage utilisation. Due to different numbers of cycles, i.e., multiple uses of the storage capacity per year, the actual cavern size required may differ. Table 2 shows a comparison of the required storage conditions between the developed hydrogen storage profile and the present natural gas storage profile.
4. Discussion
The results for the derivation of future boundary conditions of underground gas storage have been presented as exemplary for locations in Lower Saxony, Germany. In the following sections, the resulting demand profile and its deviations from the natural gas storage operation are evaluated and discussed.
4.1. Hydrogen Storage Demand Profile
The presented results for a storage demand profile have been gathered by a derivation of the availability of regionally produced green hydrogen in 2050 in combination with a synthetic hydrogen demand profile. In contrast to the production profile, the latter is based on a current natural demand profile. At first glance, this might seem not comparable, but assuming that annual demand is equal to annual production, the demand profile only reflects the trend when which share of the produced hydrogen is required. This way, a meaningful scenario for comparisons can be defined, without making manifold assumptions about the different hydrogen demand sites and their operation regime in the future.
The hydrogen storage demand profile (see Figure 6) is highly dynamic and shows increased injection in summer and increased withdrawal in winter. The calculated cavern size corresponds to an average gas storage facility size in northwest Germany with a number of around ten average caverns [44]. For simplicity, these are considered in the further calculations as a so-called cavern pool, i.e., coupled with full pressure equalisation. The annual stored energy, based on the calorific value of hydrogen, is 6.08 TWh, around three times the capacity of the required cavern volume (2.05 TWh). This makes it clear that the energy storage required here is not purely seasonal, which would result in a cycle number of around one per year. In this case, around 2/3 of the stored energy is stored with a duration of less than a year. Table 2 summarises the calculated cavern data for hydrogen storage.
The shape of the storage demand with high injection demand in summer and withdrawal in winter, shown in Figure 6, is a result of the higher energy demand in the winter months (see Figure 4). Considering also recent publications on hydrogen storage demand profiles for comparison, some similarities and differences can be observed. Major influences on the storage demand profile are both the source and the utilisation of hydrogen. In the publication of Li et al. [52], hydrogen is only generated on the basis of wind energy, which in the region of China is available predominately in winter and spring. Furthermore, there is a predominant energy demand for cooling in summer and autumn. These boundary conditions lead to an injection demand in winter and spring and withdrawal in late summer and autumn, which differs significantly from the developed profile in this work. A further influence on the storage profile is based on the regional energy system. In the publication by Samsatli et al. [53] the storage demand profiles differ according to the geographical location in the United Kingdom. An exemplary cavern storage demand profile shows similarities concerning seasons of injection and withdrawal, but a smaller share of short-term storage demand, due to the existence of other smaller overground storage tanks in other regions. A scenario with similar boundary conditions is presented by Gils et al. [54] for the German energy system. The estimated storage filling levels during the year in this scenario resemble the scenario considered in this paper (see Figure 5), which strengthens the significance of the developed scenario. Moreover, this comparison shows the dependency of the storage demand profile from the characteristics of the regionally available renewable energy sources in combination with the demand profiles, which both are site-dependent. The presented data for the federal state of Lower Saxony should be seen as an example for deriving boundary conditions. The investigation of further locations, subject to the availability of appropriate data, will be part of future research.
4.2. Hydrogen Storage Compared to Natural Gas Storage
In the comparison between hydrogen and natural gas injection regimes, shown in Figure 7, it can be seen that the injection capacities in natural gas operation often form plateaus over many hours. High injection rates are only called up for a few hours per year. It can be said in the case of natural gas that the injection capacities are much more constant compared to fluctuating hydrogen storage demand. This could also be due to contractual agreements on injection capacities [55]. Apart from the two peak capacities in the natural gas profile at 3800 and 5400 h, shown in the upper half of Figure 7, it is clear that the injection capacities in hydrogen operation are consistently higher and shorter-term. Furthermore, it can be observed that hydrogen injection occurs throughout almost the whole year, whereas in natural gas operation there are also phases of several months in winter when no injection is required. One effect of this circumstance could be that e.g., maintenance works on compressor systems can thus be planned less easily in periods without injection, so the need for redundancy in the compressor systems becomes increasingly important here.
Furthermore, it is evident that the required standard volume flows for hydrogen storage are significantly higher, often three to four times higher, than for natural gas storage. This effect is due to the different calorific values of the gases, which in the case of hydrogen are only about 31% of the calorific value of natural gas. Especially the monthly section of Figure 7 makes clear that significantly more dynamic volume flow changes are to be expected with hydrogen storage.
For the design of future compressor setups for hydrogen storage facilities, the following aspects have to be considered. First of all, the higher required standard volume flows to create a need for larger compressor capacities. Another finding is based on the variability of the injection demand. Volume flows that cannot be processed by the storage technology at the appropriate time would lead to a change in pressure in the upstream transport network and ultimately to a shutdown of hydrogen production and upstream renewable energy production. For this reason, a further focus must be placed on fast response and wide-range controllability when designing the compressor. Another solution might be buffer storage systems for the compensation of high dynamic but small capacities. In an upcoming publication, a method is developed for selecting suitable power classes for a cascaded compressor arrangement.
In the case of the natural gas storage profile, only about half as many cycles are needed for hydrogen storage (see Table 2). Despite liberalisation of the natural gas market and short-term trading transactions [15,56], natural gas storage is thus, at least in this case, significantly more seasonal than can be expected for future storage of regionally produced green hydrogen. With regard to the required cavern size, this circumstance leads in this example to the fact that only about 2.4 times the geometric cavern size is needed for the same amount of energy. In regions of scarce geological resources for cavern storage or when overground storage is used, this could become a challenge if the overall energy demand is not reduced accordingly. For the scenario considered in the Lower Saxony region, the required geometric cavern volume does not appear to be a limitation in relation to existing cavern volumes [44,57,58].
5. Conclusions
For the design of future underground hydrogen storages and their technology, it is essential to set meaningful boundary conditions. These boundary conditions include especially the pressure of the transmission network, the required storage flow-rates as well as the necessary cavern size to determine the cavern pressure. For compressor technology in particular, these parameters are fundamental variables on which further design is based. Deviations can have influence on the performance data, efficiencies and even to the constellation not meeting the requirements. Together with the high investment costs for compressors of underground gas storage facilities, this shows the importance of defining sensible boundary conditions. Due to the availability of both, renewable energy and salt caverns, the presented method is exemplary applied for the federal state of Lower Saxony in northwest Germany. In this case, a spatial proximity between renewable energy plants and the gas storage caverns can be expected so that the transmission network pressure has been derived based on the current maximum pressure that electrolysers in the MW power class can realise without mechanical post-compression. Furthermore, a hydrogen storage profile has been developed based on feed-in time series of the expected renewable electricity, specific energy demand for hydrogen production and a derived hydrogen demand profile. For calculation of the energy demand of gas storage facilities, the cavern pressure is also fundamental. To determine this, the required size of the caverns was calculated and used in the model of the gas storage operation.
The results show that the storage of regionally produced, green hydrogen represents significant differences from the current natural gas storage operation. One major difference is that a larger share of storage with a duration shorter than a year can be expected, which leads to the fact that, in this example, the the number of storage cycles is doubled. It can be deduced that with an increasing share of locally generated hydrogen quantities, gas storage facilities, in addition to their function as energy storage, will also increasingly take on the role of pressure stabilisation in the gas grid in order to avoid shutdowns of generation plants. Depending on the scenario, the higher number of cycles also leads to an overestimation of the need for additional cavern volume in the transition to hydrogen infrastructure. Under the assumptions made, it was shown for the storage of regionally produced green hydrogen that only 2.4 times, instead of the 4.4 times volume determined on an energetic basis, is required compared to the storage of the same energy in the form of natural gas. Apart from that, it leads also to a more even distribution of injection phases over the course of a year, which must be taken into account in e.g., compressor maintenance planning and reinforces the role of redundancy of compressor systems in gas storage operations.
A further difference for hydrogen storage operation compared to a natural gas storage operation is that it shows significantly higher dynamic injection and withdrawal requirements with three to four times higher injection standard volume flow. The fluctuations in the storage demand profile for hydrogen are strongly dependent on the renewable energy source characteristics. This will affect the design of the storage facilities. In particular, this applies to compressor systems with an adapted compressor technology selection, control mechanisms and, if applicable, the arrangement of cascaded compressor operation. The implementation of this topic, while maintaining the high efficiency of the overall system, will be part of future research and development tasks. This work has shown a method for deriving the boundary conditions for the underground storage of green hydrogen in salt caverns in a sensible way.
Author Contributions
Conceptualization, H.B., H.L. and M.Z.; methodology, H.B.; software, H.B.; validation, H.B.; formal analysis, H.B.; investigation, H.B.; resources, M.Z.; data curation, H.B.; writing—original draft preparation, H.B.; writing—review and editing, all authors; visualization, H.B. and A.P.; supervision, H.L., M.Z. and A.D.; project administration, M.Z.; funding acquisition, M.Z. and A.D. All authors have read and agreed to the published version of the manuscript.
Funding
This research received no external funding.
Institutional Review Board Statement
Not applicable.
Informed Consent Statement
Not applicable.
Data Availability Statement
Not applicable.
Acknowledgments
The authors would like to thank Bernd Bungert and Oscar Steinmann for their scientific support.
Conflicts of Interest
The authors declare no conflict of interest.
Abbreviations
The following abbreviations are used in this manuscript:
| Dec. | December |
| H2 | Hydrogen |
| Jan. | January |
| NG | Natural gas (type H) i.e., high calorific type of natural gas |
| Mm | million cubic meters |
| M | Electric motor |
| p | pressure |
| PEM | Polymer electrolyte membrane |
| PV | photovoltaic |
| STP | standard temperature (273.15 K) and pressure (101.325 kPa) |
| WGV | Working gas volume |
References
- Henning, H.M.; Palzer, A. ENERGIESYSTEM DEUTSCHLAND 2051—Sektor- und Energieträgerübergreifende, modellbasierte, ganzheitliche Untersuchung zur langfristigen Reduktion Energie-Bedingter CO2-Emissionen durch Energieeffizienz und den Einsatz Erneuerbarer Energien. 2013. Available online: https://www.ise.fraunhofer.de/content/dam/ise/de/documents/publications/studies/Fraunhofer-ISE_Energiesystem-Deutschland-2050.pdf (accessed on 7 August 2021).
- FNB Gas. Netzentwicklungsplan Gas 2020–2030. 2019. Available online: https://www.bundesnetzagentur.de/SharedDocs/Downloads/DE/Sachgebiete/Energie/Unternehmen_Institutionen/NetzentwicklungUndSmartGrid/Gas/NEP_2020/Szenariorahmen2020.pdf?__blob=publicationFile&v=1 (accessed on 1 August 2021).
- Stöckl, F.; Schill, W.P.; Zerrahn, A. Optimal supply chains and power sector benefits of green hydrogen. Sci. Rep. 2021, 11, 1–14. [Google Scholar] [CrossRef] [PubMed]
- Kakoulaki, G.; Kougias, I.; Taylor, N.; Dolci, F.; Moya, J.; Jäger-Waldau, A. Green hydrogen in Europe—A regional assessment: Substituting existing production with electrolysis powered by renewables. Energy Convers. Manag. 2021, 228, 113649. [Google Scholar] [CrossRef]
- Schiebahn, S.; Grube, T.; Robinius, M.; Tietze, V.; Kumar, B.; Stolten, D. Power to gas: Technological overview, systems analysis and economic assessment for a case study in Germany. Int. J. Hydrog. Energy 2015, 40, 4285–4294. [Google Scholar] [CrossRef]
- Gatzen, C.; Lenz, A.K. Wasserstoff zur Dekarbonisierung des Wärmesektors. 2021. Available online: https://www.dvgw.de/medien/dvgw/forschung/berichte/frontiereconomics-h2-im-waermemarkt-studie.pdf (accessed on 16 October 2021).
- Amber Grid, Bulgartransgaz, Conexus, CREOS, DESFA, Elering, Enagás, Energinet, Eustream, FGSZ, FluxSwiss, Fluxys Belgium, Gas Connect Austria, Gasgrid Finland, Gassco, Gasunie, Gas Networks Ireland, GAZ-SYSTEM, GRTgaz, National Grid, NET4GAS, Nordion Energi, OGE, ONTRAS, Plinacro, Plinovodi, REN, Snam, TAG, Teréga, Transgaz. European Hydrogen Backbone—A European Hydrogen Infrastructure Vision Covering 28 Countries. 2022. Available online: https://gasforclimate2050.eu/wp-content/uploads/2022/04/EHB-A-European-hydrogen-infrastructure-vision-covering-28-countries.pdf (accessed on 14 April 2022).
- Urbansky, F. Erster Deutscher Erdgasspeicher wird fit für Wasserstoff. 2020. Available online: https://www.springerprofessional.de/energiespeicher/energiewende/erster-deutscher-erdgasspeicher-wird-fit-fuer-wasserstoff-/17825840 (accessed on 16 October 2021).
- Ugarte, E.R.; Salehi, S. A Review on Well Integrity Issues for Underground Hydrogen Storage. J. Energy Resour. Technol. 2022, 144, 042001. [Google Scholar] [CrossRef]
- Busack, V.; Veenker, M.; Hoffmann, U.; Großmann, A. Power to Gas: Neues Gas in alten Leitungen—Werkstofffragen. Energie|Wasser-Praxis 2014. 2014. Available online: https://www.dvgw.de/medien/dvgw/gas/infrastruktur/ptg_werkstofffragen_1409.pdf (accessed on 7 November 2021).
- Niedersächsisches Ministerium für Umwelt, Energie, B.u.K. Energiewendebericht 2020. 2021. Available online: https://www.umwelt.niedersachsen.de/download/168771/Energiewendebericht_2020.pdf (accessed on 12 September 2021).
- Merten, F.; Scholz, A.; Krüger, C.; Heck, S.; Girard, Y.; Mecke, M.; Goerge, M. Bewertung der Vor- und Nachteile von Wasserstoffimporten im Vergleich zur heimischen Erzeugung. 2020. Available online: https://wupperinst.org/fa/redaktion/downloads/projects/LEE-H2-Studie.pdf (accessed on 3 November 2021).
- Bründlinger, T.; König, J.E.; Frank, O.; Gründig, D.; Jugel, C.; Kraft, P.; Krieger, O.; Mischinger, S.; Prein, D.P.; Seidl, H.; et al. dena-Leitstudie Integrierte Energiewende—Impulse für die Gestaltung des Energiesystems bis 2050. 2018. Available online: https://www.dena.de/fileadmin/dena/Dokumente/Pdf/9261_dena-Leitstudie_Integrierte_Energiewende_lang.pdf (accessed on 19 July 2021).
- Cierniak, S.; Fritze, P. Life Cycle Costs—Reciprocating Compressors in the Focus of Function, Economics and Reliability. In Proceedings of the 2nd European Forum for Reciprocating Compressors; 2001; pp. 6–20. Available online: https://www.recip.org/wp-content/uploads/2022/02/2nd%20EFRC%20Conference%20Proceedings_2001.pdf (accessed on 9 August 2021).
- Katzenbach, B. Komponenten von Erdgasspeicheranlagen. In Handbuch der Gasversorgungstechnik: Logistik-Infrastruktur-Lösungen, 1st ed.; Homann, K., Hüwener, T., Klocke, B., Wernekinck, U., Eds.; DIV Deutscher Industrieverlag GmbH: München, Germany, 2017; pp. 633–657. [Google Scholar]
- Mischner, J. Gastransport—Gasverteilung. In Grundlagen der Gastechnik: Gasbeschaffung—Gasverteilung—Gasverwendung, 8th ed.; Cerbe, G., Lendt, B., Eds.; Carl Hanser Verlag: München, Germany, 2017; Book Section 5; pp. 211–312. [Google Scholar]
- Gastransport Nord GmbH. Netzkarte/Netzauskunft. 2021. Available online: https://gtg-nord.de/de/netzinformationen/netzkarte__netzauskunft.php (accessed on 26 November 2021).
- TÜV NORD GROUP. Hydrogen Pipelines and Hydrogen Grids. 2022. Available online: https://www.tuev-nord.de/en/company/energy/hydrogen/hydrogen-pipelines-grids/ (accessed on 7 July 2022).
- Jens, J.; Graf, D.; Schimmel, M. Market State and Trends in Renewable and Low-Carbon Gases in Europe—A Gas for Climate Report. 2021. Available online: https://gasforclimate2050.eu/wp-content/uploads/2021/12/Gas-for-Climate-Market-State-and-Trends-report-2021.pdf (accessed on 3 December 2021).
- Bensmann, B. Systemanalyse der Druckwasser-Elektrolyse im Kontext von Power-to-Gas-Anwendungen. Ph.D. Thesis, Otto-von-Guericke-Universität Magdeburg, Magdeburg, Germany, 2017. Available online: https://pure.mpg.de/rest/items/item_2506307/component/file_2520739/content (accessed on 12 August 2021).
- Wulff, J.; Hoff, K. Optimierung der Wasserstoff-Wertschöpfungskette von der Erzeugung bis zum Endverbraucher. 2021. Available online: https://www.neuman-esser.de/unternehmen/media/blog/integrierte-loesungen-entlang-der-h2-wertschoepfungskette/ (accessed on 25 November 2021).
- HIAT gGmbH. PEM—Stacks (100 bar). 2021. Available online: https://www.hiat.de/download/210510PEMElectrolyzer100barDE.pdf (accessed on 29 October 2021).
- iGas Energy GmbH. GREEN ELECTROLYZER—Wasserstoff aus Erneuerbaren Energien. 2021. Available online: https://igas-energy.de/fileadmin/individual/igas-energy-de/editor/Broschueren/iGas_green_Elektrolyzer_D__170420.pdf (accessed on 29 November 2021).
- Siemens Energy. Overview of the PEM Silyzer Family. 2020. Available online: https://4echile-datastore.s3.eu-central-1.amazonaws.com/wp-content/uploads/2020/10/10132733/20200930-SE-NEB-PEM-Electrolyzer-and-Applications_EW.pdf (accessed on 29 October 2021).
- H-TEC SYSTEMS GmbH. Protonen-Austausch-Membran (PEM) Elektrolyse. 2021. Available online: https://www.h-tec.com/fileadmin/_processed_/8/5/csm_H-TEC-infografik-gruener-wasserstoff-gross_937d1325e8.png (accessed on 19 October 2021).
- McPhy. Multi-MW to GW Designs to Produce Zero-Carbon Hydrogen at a Large Scale. 2020. Available online: https://cellar-c2.services.clever-cloud.com/com-mcphy/uploads/2020/08/20.05.McPhy_Portfolio_ELY_Augmented_McLyzer_EN.pdf (accessed on 29 October 2021).
- Elogen GmbH. PEM-Electrolysers. 2021. Available online: https://elogenh2.com/wp-content/uploads/2021/04/Elogen_Product_sheet-Elyte260.pdf (accessed on 29 October 2021).
- Green H2 Systems. PEM-Elektrolyseure. 2021. Available online: https://www.green-h2-systems.de/de/Technologie.html (accessed on 29 October 2021).
- Sunfire GmbH, Sunfire-Hylink Alkaline—Technical Data. 2022. Available online: https://www.sunfire.de/files/sunfire/images/content/Sunfire.de%20(neu)/news/Sunfire-Factsheet-HyLink-Alkaline.pdf (accessed on 7 April 2022).
- Pluta, A.; Lünsdorf, O. esy-osmfilter—A Python Library to Efficiently Extract OpenStreetMap Data. J. Open Res. Softw. 2020, 8, 19. [Google Scholar] [CrossRef]
- Pluta, A.; Medjroubi, W.; Diettrich, J.C.; Dasenbrock, J.; Tetens, H.P.; Sandoval, J.E.; Lünsdorf, O. SciGRID_gas—Data Model of the European Gas Transport Network. In Proceedings of the 2022 Open Source Modelling and Simulation of Energy Systems (OSMSES), Aachen, Germany, 4–5 April 2022; pp. 1–7. [Google Scholar] [CrossRef]
- Bundesministerium für Wirtschaft und Energie. Was ist eigentlich grüner Wasserstoff. 2020. Available online: https://www.bmwi-energiewende.de/EWD/Redaktion/Newsletter/2020/07/Meldung/direkt-erklaert.html (accessed on 16 October 2021).
- Koch, M.; Hermann, H.; Flachsbarth, F.; Tambke, J. Erstellung generischer EE-Strom-Einspeisezeitreihen mit unterschiedlichem Grad an fluktuierendem Stromangebot. 2016. Available online: https://www.oeko.de/fileadmin/oekodoc/Begleitdokument_Generische_Wind_PV_Einspeiszeitreihen.pdf (accessed on 2 September 2021).
- ForWind & Öko-Institut. Generische Einspeisezeitreihen der Photovoltaik auf Bundeslandebene für Deutschland im Zeitraum 2020 bis 2050. 2016. Available online: https://www.oeko.de/fileadmin/oekodoc/Datensatz_fuer_generische_Einspeisezeitreihen_der_Photovoltaik_2020_bis_2050.xlsx (accessed on 2 September 2021).
- ForWind & Öko-Institut. Generische Einspeisezeitreihen der Onshore-Windenergie auf Bundeslandebene für Deutschland im Zeitraum 2020 bis 2050. 2016. Available online: http://www.oeko.de/fileadmin/oekodoc/Datensatz_fuer_generische_Einspeisezeitreihen_der_Onshore_Windenergie_2020_bis_2050.xlsx (accessed on 2 September 2021).
- ForWind & Öko-Institut. Generische Einspeisezeitreihen der Offshore-Windenergie auf Bundeslandebene für Deutschland im Zeitraum 2020 bis 2050. 2016. Available online: https://www.oeko.de/fileadmin/oekodoc/Datensatz_fuer_generische_Einspeisezeitreihen_der_Offshore_Windenergie_2020_bis_2050.xlsx (accessed on 2 September 2021).
- Repenning, J.; Emele, L.; Blanck, R.; Böttcher, H.; Dehoust, G.; Förster, H.; Greiner, B.; Harthan, R.; Henneberg, K.; Hermann, H.; et al. Klimaschutzszenario 2050. 2015. Available online: https://www.oeko.de/oekodoc/2451/2015-608-de.pdf (accessed on 17 July 2021).
- Presse- und Informationsamt der Bundesregierung. Klimaschutzgesetz 2021—Generationenvertrag für das Klima. 2021. Available online: https://www.bundesregierung.de/breg-de/themen/klimaschutz/klimaschutzgesetz-2021-1913672 (accessed on 1 October 2021).
- Institut für Energie- und Klimaforschung (IEK-3). Zwanzig20—HYPOS—Machbarkeitsstudie Elektrolyse: Projektbericht im Rahmen von HYPOS. 2015. Available online: https://www.tib.eu/de/suchen?tx_tibsearch_search%5Baction%5D=download&tx_tibsearch_search%5Bcontroller%5D=Download&tx_tibsearch_search%5Bdocid%5D=TIBKAT%3A860345734&cHash=19a1fcf522e2f605f0f8849b5e625fe9#download-mark (accessed on 13 August 2021).
- Milanzi, S.; Spiller, C.; Grosse, B.; Hermann, L.; Kochems, J.; Müller-Kirchenbauer, J. Technischer Stand und Flexibilität des Power-to-Gas-Verfahrens. 2018. Available online: https://www.er.tu-berlin.de/fileadmin/a38331300/Dateien/Technischer_Stand_und_Flexibilit%C3%A4t_des_Power-to-Gas-Verfahrens.pdf (accessed on 4 April 2022).
- Smolinka, T.; Wiebe, N.; Sterchele, P.; Palzer, A.; Lehner, F.; Jansen, M.; Kiemel, S.; Miehe, R.; Wahren, S.; Zimmermann, F. Study IndWEDe—Brief Overview—Industrialisation of Water Electrolysis in Germany: Opportunities and Challenges for Sustainable Hydrogen for Transport, Electricity and Heat. 2018. Available online: https://www.now-gmbh.de/wp-content/uploads/2020/09/181204_bro_a4_indwede-studie_kurzfassung_en_v03-1.pdf (accessed on 1 November 2021).
- Bertuccioli, L.; Chan, A.; Hart, D.; Lehner, F.; Madden, B.; Standen, E. Study on Development of Water Electrolysis in the EU. 2014. Available online: https://www.fch.europa.eu/sites/default/files/FCHJUElectrolysisStudy_FullReport%20(ID%20199214).pdf (accessed on 14 August 2021).
- Energie-Control Austria. Erdgas—Betriebsstatistik 2019. 2021. Available online: https://www.e-control.at/betriebsstatistik_2019?inheritRedirect=true (accessed on 20 September 2021).
- Schmidt, T. Speicherung und Konditionierung von Erdgas. In Grundlagen der Gastechnik, 8th ed.; Cerbe, G., Lendt, B., Eds.; Carl Hanser Verlag: München, Germany, 2017; Book Section 6; pp. 313–347. [Google Scholar]
- Zapf, D. Dimensionierung von Gasspeicherkavernen im Salzstockrandbereich. Ph.D. thesis, Fakultät für Bauingenieurwesen und Geodäsie der Leibniz Universität Hannover, Hannover, Germany, 2014. [Google Scholar]
- Bérest, P.; Louvet, F. Aspects of the thermodynamic behavior of salt caverns used for gas storage. Oil Gas Sci. Technol.—Revue d’IFP Energies Nouvelles 2020, 75, 57. [Google Scholar] [CrossRef]
- AIR LIQUIDE Deutschland GmbH. 1×1 der Gase—Physikalische Daten für Wissenschaft und Praxis, 2nd ed.; Air Liquide Deutschland GmbH: Düsseldorf, Germany, 2006. [Google Scholar]
- Wischnewski, B. Konstanten für Methan. 2021. Available online: http://www.peacesoftware.de/einigewerte/methan.html (accessed on 19 October 2021).
- Pacific Northwest National Laboratory. Hydrogen Compressibility at Different Temperatures and Pressures. 2021. Available online: https://h2tools.org/hyarc/hydrogen-data/hydrogen-compressibility-different-temperatures-and-pressures (accessed on 19 October 2021).
- Astora GmbH. Bewegungsdaten—Speicher Astora. 2021. Available online: https://www.astora.de/transparenz/bewegungsdaten/speicher-astora (accessed on 9 November 2021).
- Cerbe, G.; Lendt, B. Grundlagen der Gastechnik: Gasbeschaffung–Gasverteilung–Gasverwendung, 8th ed.; Carl Hanser Verlag: München, Germany, 2017. [Google Scholar]
- Li, H.; Qin, B.; Jiang, Y.; Zhao, Y.; Shi, W. Data-driven optimal scheduling for underground space based integrated hydrogen energy system. IET Renew. Power Gener. 2022, 16, 2521–2531. [Google Scholar] [CrossRef]
- Samsatli, S.; Staffell, I.; Samsatli, N.J. Optimal design and operation of integrated wind-hydrogen-electricity networks for decarbonising the domestic transport sector in Great Britain. Int. J. Hydrog. Energy 2016, 41, 447–475. [Google Scholar] [CrossRef]
- Gils, H.C.; Gardian, H.; Schmugge, J. Interaction of hydrogen infrastructures with other sector coupling options towards a zero-emission energy system in Germany. Renew. Energy 2021, 180, 140–156. [Google Scholar] [CrossRef]
- Sedlacek, R. Untertage-Gasspeicherung in Deutschland. ERDÖL ERDGAS KOHLE 2008, 124, 453–465. [Google Scholar]
- Trianel GmbH. Digitalisierte Gasspeicherung. 2019. Available online: https://www.trianel.com/webmagazin/digitalisierte-gasspeicherung (accessed on 30 November 2021).
- Donadei, S.; Fleig, S.; Gast, S.; Goerne, G.; Hölzner, M.; Horváth, P.L. Informationssystem Salzstrukturen: Planungsgrundlagen, Auswahlkriterien und Potentialabschätzung für die Errichtung von Salzkavernen zur Speicherung von Erneuerbaren Energien (Wasserstoff und Druckluft): InSpEE: Sachbericht; Leibniz-Informationszentrum Technik und Naturwissenschaften Universitätsbibliothek: Leibzig, Germany, 2016. [Google Scholar] [CrossRef]
- Warnecke, M.; Röhling, S. Underground hydrogen storage—Status quo. Zeitschrift der Deutschen Gesellschaft für Geowissenschaften 2021, 172, 641–659. [Google Scholar] [CrossRef]
Figure 1.
Simplified gas and energy flow diagram of a gas storage facility. Source: Own representation on the basis of information provided by [15].
Figure 1.
Simplified gas and energy flow diagram of a gas storage facility. Source: Own representation on the basis of information provided by [15].

Figure 2.
Overview on wind power plants, large photovoltaic (PV) systems and salt cavern gas storage facilities in Lower Saxony. Source: Own representation based on data from [30,31].

Figure 3.
Annual course of the electrical feed-in profile of renewable energies (offshore and onshore wind power as well as photovoltaic) for Lower Saxony according to the expansion targets planned for 2050 and the Climate Protection Scenario 80. Source: Own representation based on raw data from [33,34,35,36,37].

Figure 4.
Development of the hydrogen storage demand profile (green) as the difference between regional hydrogen production in Lower Saxony (black) and derived hydrogen demand (blue) over the course of a calendar year.
Figure 4.
Development of the hydrogen storage demand profile (green) as the difference between regional hydrogen production in Lower Saxony (black) and derived hydrogen demand (blue) over the course of a calendar year.

Figure 5.
Cumulative hydrogen storage profile over the course of a calendar year for calculating the necessary working gas volume of the cavern. The necessary storage volume is shown relative to the beginning of the year.
Figure 5.
Cumulative hydrogen storage profile over the course of a calendar year for calculating the necessary working gas volume of the cavern. The necessary storage volume is shown relative to the beginning of the year.

Figure 6.
Injection and withdrawal as volume flow demand over the course of a calendar year.

Figure 7.
Comparison of the standard volume flows of injection between natural gas (blue) (based on data from [50]) and hydrogen (green) storage with balanced annual energy quantities, over the course of a calendar year (top) and for the period of one month in summer (bottom).
Figure 7.
Comparison of the standard volume flows of injection between natural gas (blue) (based on data from [50]) and hydrogen (green) storage with balanced annual energy quantities, over the course of a calendar year (top) and for the period of one month in summer (bottom).


Table 1.
Overview of the maximum hydrogen output pressure of currently available PEM and alkaline pressure electrolysers in the power range from 1 MW based on manufacturer data.
Table 1.
Overview of the maximum hydrogen output pressure of currently available PEM and alkaline pressure electrolysers in the power range from 1 MW based on manufacturer data.
| Manufacturer | Type | Power [kW] | Max. Hydrogen Output Pressure [bar] | Source |
|---|---|---|---|---|
| iGas energy GmbH | gEl 160-1250 PEM MD | 1050 | 40 | [23] |
| iGas energy GmbH | gEl 320-1250 PEM MD | 2070 | 40 | [23] |
| Siemens Energy | Silyzer 200 1 | 1250 | 35 | [24] |
| H-TEC Systems | ME450/1400 | 1000 | 30 | [25] |
| McPhy | Augmented McLyzer | 4000 | 30 | [26] |
| elogen | ELYTE 260 | 1680 | 30 | [27] |
| Green H2 Systems | Green Electrolyzer | 1000 | 40 | [28] |
| Sunfire GmbH | Hylink Alkaline | 10,000 | 30 | [29] |
Table 2.
Comparison of the required storage conditions for hydrogen and natural gas storage parameters. Basis of the comparison is the amount of annually stored energy (hydrogen) calculated above. Energy parameters are based on the respective gross calorific values.
Table 2.
Comparison of the required storage conditions for hydrogen and natural gas storage parameters. Basis of the comparison is the amount of annually stored energy (hydrogen) calculated above. Energy parameters are based on the respective gross calorific values.
| Hydrogen | Natural Gas (Type H) | |
|---|---|---|
| Annual stored energy [TWh] | 6.08 | 6.08 |
| Gross calorific value [kWh/m] [51] | 3.54 | 11.449 |
| Required standard working gas volume [Mm] | 580.3 | 360.9 |
| Required geometric volume [Mm] | 6.80 | 2.78 |
| Energy storage capacity of caverns (single filling) [TWh] | 2.05 | 4.13 |
| Average number of cycles (stored energy/capacity) [] | 2.96 | 1.47 |
Publisher’s Note: MDPI stays neutral with regard to jurisdictional claims in published maps and institutional affiliations. |
© 2022 by the authors. Licensee MDPI, Basel, Switzerland. This article is an open access article distributed under the terms and conditions of the Creative Commons Attribution (CC BY) license (https://creativecommons.org/licenses/by/4.0/).
Share and Cite
MDPI and ACS Style
Bekebrok, H.; Langnickel, H.; Pluta, A.; Zobel, M.; Dyck, A. Underground Storage of Green Hydrogen—Boundary Conditions for Compressor Systems. Energies 2022, 15, 5972. https://0-doi-org.brum.beds.ac.uk/10.3390/en15165972
AMA Style
Bekebrok H, Langnickel H, Pluta A, Zobel M, Dyck A. Underground Storage of Green Hydrogen—Boundary Conditions for Compressor Systems. Energies. 2022; 15(16):5972. https://0-doi-org.brum.beds.ac.uk/10.3390/en15165972
Chicago/Turabian StyleBekebrok, Heinz, Hendrik Langnickel, Adam Pluta, Marco Zobel, and Alexander Dyck. 2022. "Underground Storage of Green Hydrogen—Boundary Conditions for Compressor Systems" Energies 15, no. 16: 5972. https://0-doi-org.brum.beds.ac.uk/10.3390/en15165972
Note that from the first issue of 2016, this journal uses article numbers instead of page numbers. See further details here.