Article

Livestock’s Urine-Based Plant Microbial Fuel Cells Improve Plant Growth and Power Generation

by
Wilgince Apollon
1,
Juan Antonio Vidales-Contreras
1,
Humberto Rodríguez-Fuentes
1,
Juan Florencio Gómez-Leyva
2,
Emilio Olivares-Sáenz
1,
Víctor Arturo Maldonado-Ruelas
3,
Raúl Arturo Ortiz-Medina
3,
Sathish-Kumar Kamaraj
4,* and
Alejandro Isabel Luna-Maldonado
1,*
1
Department of Agricultural and Food Engineering, Faculty of Agronomy, Autonomous University of Nuevo León, Francisco Villa S/N, Ex-Hacienda El Canadá, General Escobedo 66050, Nuevo León, Mexico
2
Molecular Biology Laboratory, TecNM-Technological Institute of Tlajomulco (ITTJ), Km 10 Carretera a San Miguel Cuyutlán, Tlajomulco de Zúñiga 45640, Jalisco, Mexico
3
Postgraduate and Research Department, Polytechnic University of Aguascalientes (UPA), Paseo San Gerardo No. 207, Fracc. San Gerardo, Aguascalientes 20342, Mexico
4
Sustainable Environment Laboratory, TecNM-Technological Institute El Llano Aguascalientes (ITEL), Km. 18 Carretera Aguascalientes-San Luis Potosí, El Llano, Aguascalientes 20330, Mexico
*
Authors to whom correspondence should be addressed.
Submission received: 23 August 2022 / Revised: 8 September 2022 / Accepted: 19 September 2022 / Published: 23 September 2022
(This article belongs to the Special Issue Advances in Hydrogen Energy Ⅱ)

Abstract

:

Highlights

What are the main findings?
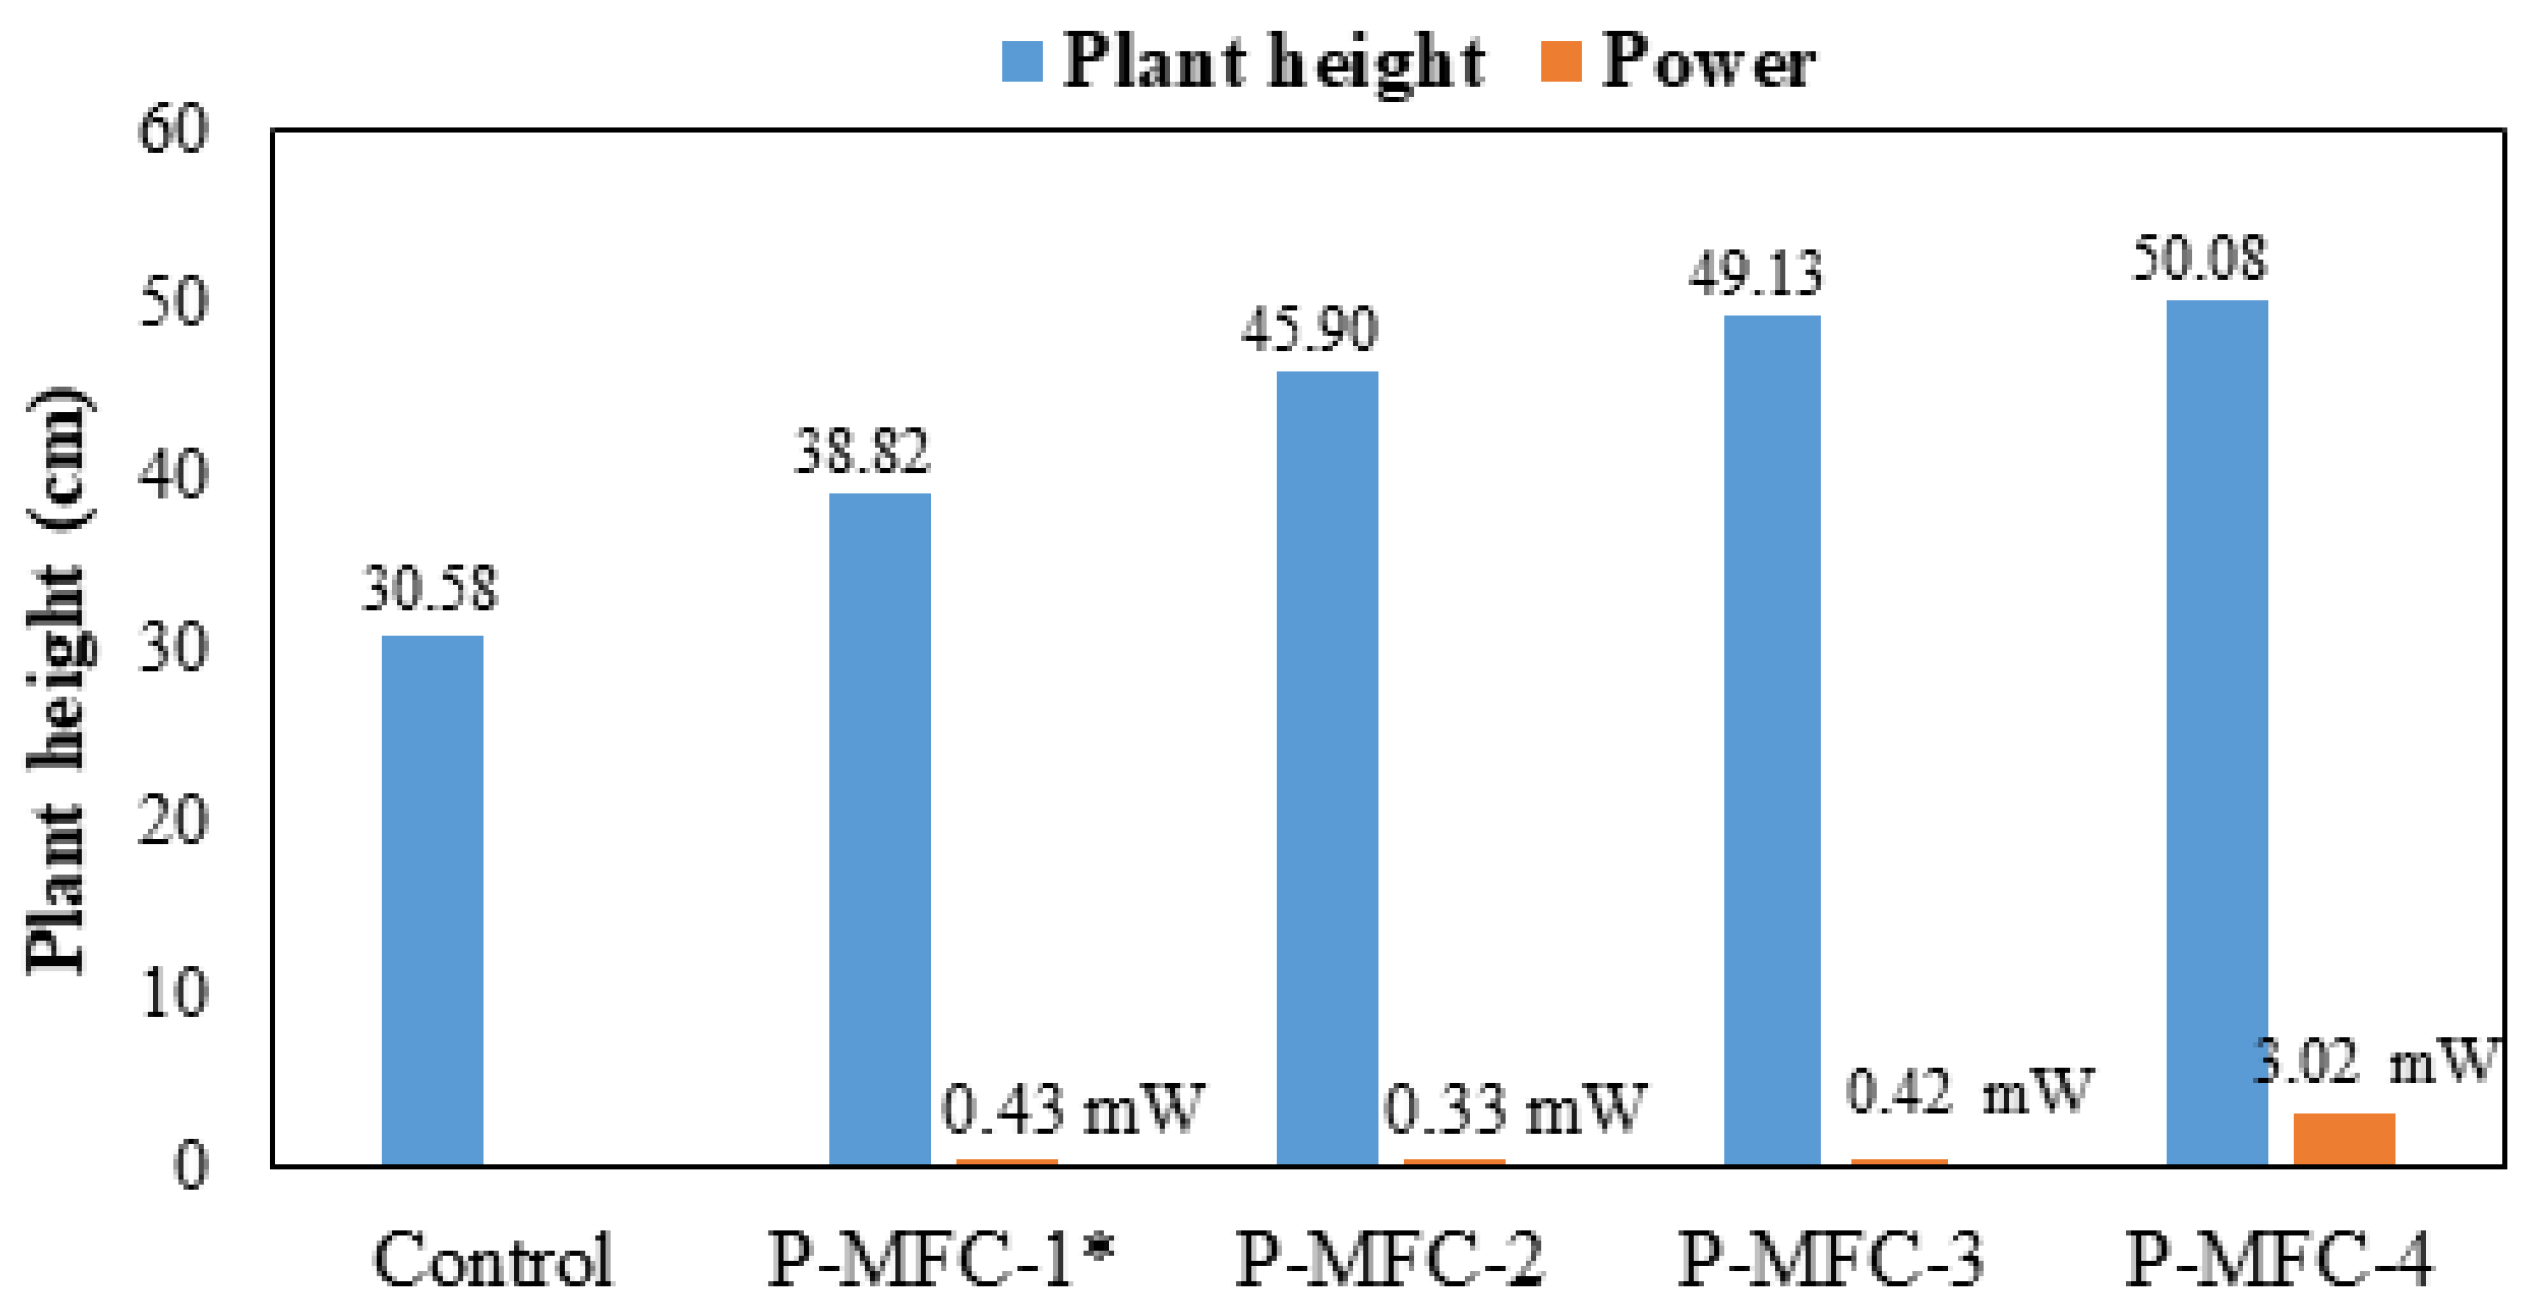
  • P-MFC inoculated with livestock’s urine positively influenced plant biomass.
  • Cow urine significantly improved power generation in Stevia-MFC.
What is the implication of the main finding?
  • The study demonstrated that Stevia-MFC is a novel and cheaper system.
  • Livestock’s urine showed great potential to improve P-MFC technology.

Abstract

Plant microbial fuel cells (P-MFCs) are sustainable and eco-friendly technologies, which use plant root exudates to directly nourish the electrochemically active bacteria (EABs) to generate sustainable electricity. However, their use in evaluating plant growth has been insufficiently studied. In this study, interconnection between plant growth and the production of bioelectricity was evaluated by using P-MFCs inoculated with 642.865 mL ≅ 643 mL of livestock’s urine such as cow urine, goat urine, and sheep urine. The greatest mean stem diameter of 0.52 ± 0.01 cm was found in P-MFC-3 inoculated with goat urine, while the P-MFC-2 treated with cow urine reached a higher average number of roots with a value of 86 ± 2.50 (95% improvement) (p < 0.05). Besides, P-MFC-4 presented greater height of 50.08 ± 0.67 cm. For polarization curve experiment a higher maximum power density of 132 ± 11.6 mW m−2 (931 mA m−2) was reached with cow urine; in turn, with regard to the long-term operation, the same reactor indicated a higher maximum average power density of 43.68 ± 3.05 mW m−2. The study’s findings indicated that Stevia P-MFC inoculated with urine was a good option to increase the biomass amount for the agricultural plants along with power generation. Further, this study opens the way for more investigation of evaluating the impact of P-MFC on plant growth.

1. Introduction

Plant microbial fuel cells (P-MFCs) are sustainable and green technologies that use EABs as a biocatalyst to harvest energy and generate electricity from different types of organic substrates [1,2]. These technologies have attracted the attention of researchers since their implementation in the present, due to their sustainability and low cost [3]. Generally, a microbial fuel cell (MFC) consists of an anode and a cathodic chamber, both separated by a proton exchange membrane (PEM). The main role of the PEM is to prevent electrolytes from migrating from one compartment to another [4]. Recently, MFCs have been used in different fields, such as heavy-metal remediation in wastewater [4,5,6] and in soil [7]. However, the use of MFC in the remediation process of heavy metals in wastewater faces great challenges, as reviewed by Ezziat et al. [8].
On the other hand, the P-MFC technology has been implemented for the continuous generation of bioelectricity by taking advantage of the plants-root exudates [9,10]. This system was implemented for the first time in 2008 by Strik and co-workers [9]. Plant-root exudates are known to be important sources of organic matter that speed up the process [10,11]. In P-MFC, EAB also play an important role in the electron transfer process. There is a symbiotic relationship between plant growth and EAB [12], as well as the performance of bioelectricity. In a review article by Rusyn [13], EABs were reported to play a crucial role in increasing the generation of bioelectricity in P-MFC. Additionally, progress and advancements in photosynthesis-assisted MFC were extensively reviewed by Apollon et al. [14]. Furthermore, an overview of both the configuration of bioelectrochemical systems (BES) and the types of electrode materials, as well as the types of plants that have been used in P-MFC, was highlighted. In addition, the requirements of the generation of bioelectricity in a detailed manner were presented by the authors. Among the requirements for the generation of bioelectricity, plant species were reported as one of the factors that influence the generation of bioenergy, as reviewed by Rusyn [13]; Maddalwar et al. [15]; and Sayed et al. [16]. These above three critical reviews showed the most recent advances in P-MFC technologies, including maximum power density achieved with different plant species. At least 40 plant species have been utilized in P-MFC systems, as reported by Kabutey et al. [17]. Among the plant species employed in P-MFC, we find vascular plants, macrophytes [18], and bryophytes [19,20], as well as grasses of the Spartina anglica plant [21] and the Glyceria maxima plant [22], Sedum spp. [23], wetland cold-resistant plants Caltha palustris [24] and drought-resistant succulents Opuntia spp. [11,12,13,14,15,16,17,18,19,20,21,22,23,24,25]. A tubular P-MFC used in rice fields exhibited power densities between 9.1 mW m−2 and 16.8 mW m−2 [26]. In a study by Arulmani et al. [27], P-MFC embedded with Amaranthus viridis and Triticum aestivum were evaluated for food harvesting and sustainable bioenergy production for 180 days, respectively. The maximum current density of 291.23 ± 7.50 mA m−2 was achieved in P-MFC operated with Triticum aestivum, this being the best reactor. However, these studies did not evaluate all of the plant’s morphological parameters, such as plant height, stem diameter, number of roots, and root length. In addition, the evaluation of the growth of plants in P-MFC systems, while producing energy, has been investigated to a lesser extent. According to the literature, few works report on plant growth with BES such as P-MFC [11,12,13,14,15,16,17,18,19,20,21,22,23,24,25,28].
Furthermore, Stevia rebaudiana, to our knowledge, has not previously been used in P-MFC technologies. This is the first time, to our knowledge, that this plant species was utilized to generate bioelectricity using P-MFC. It is worth mentioning that Stevia rebaudiana is a very important plant worldwide due to its particular characteristics (e.g., sugar substitute). Therefore, inserting this plant species in a P-MFC system could be a very good option for increasing the amount of biomass required to produce sugar. Besides, P-MFC embedded with this category of plant is a new challenge worldwide. This will open avenues for upcoming investigations to improve Stevia biomass.
On the basis of this point, the main objective of this work was to evaluate the performance of P-MFC in terms of plant growth and energy production. In addition, P-MFC inoculated with urine from different domestic animals were employed, to our knowledge, for the first time. The impact of P-MFC on plant morphological parameters was also evaluated in this study. Urine in general was previously reported in MFC as the main source for improving BES performance [29,30]. Besides, its usage in P-MFC is also a viable option to evaluate plant growth parameters; this is because the urine from livestock is an important source of phosphorus and nitrogen for plants. In fact, it can be a cheap and unlimited resource for sustainable agriculture. In addition, the future perspective of this study is to develop high-efficiency P-MFC systems or technologies that could be applied on a large scale at a low cost using innovative and nature materials. Such a technology, converting organic matter into energy stored from P-MFC inoculated with domestic-animal urine using EAB, could be a good option to improve P-MFC efficiencies for their commercial use.

2. Materials and Methods

2.1. Configuration of P-MFC Reactors and Operation

P-MFCs were made from clay cup (Mexico), 20 cm tall with a wall thickness of 3 mm and the inner diameter of diameter 9 cm (according to the previous experiment [29]). For the anode electrode, 648 cm2 of graphite felt (ESGRAF, S.A de C.V., México [diameter of 6 mm]) were utilized. Then, graphite felt was placed in contact with the clay cup’s outer surface, while 270 cm2 of a stainless steel mesh (NYLOMAQ SL PLATE 9.5 mm 610 × 610 mm) were utilized as the air cathode electrode. Single-chamber air-breathing cathode MFCs were previously used with human urine as a by-product of electricity [30]; here, the clay cup membrane acted as a separator among the anode and cathode electrodes. The MFCs (ceramic cylinders) were made from terracotta and was 5 cm tall, with thickness of 3 mm and inner diameter of 2.2 cm. Both systems had practically the same characteristics.
For the operation of P-MFC reactors, Stevia rebaudiana plants consisting of 15 cm height were used; these were previously propagated for 6 months in a greenhouse in Atlacomulco, Municipality of the State of Mexico, Mexico. The P-MFC were inoculated (by using a watering can) with an amount of 642.865 mL ≅ 643 mL of livestock’s urine from cow, goat, and sheep, as described in the previous experiment [31], where the physicochemical analysis of urine was taken into account. The P-MFCs, namely, P-MFC-1* (control, irrigated with 642.865 mL ≅ 643 mL of tap water), P-MFC-2 (inoculated with cow urine), P-MFC-3 (inoculated with goat urine), P-MFC-4 (inoculated with sheep urine), and the control MFC [(operated only with the soil substrate); uninoculated with urine; but irrigated with 642.865 mL ≅ 643 mL of tap water] were evaluated. Figure S1a represents the sketch of the experiment, while in Figure S1b, the establishment of the experiment is depicted as supporting information.

2.2. Physiological Stages of Plants

Monitoring Plant Morphological Parameters

Monthly plant growth was monitored as follows: (i) measuring the height (cm) from the top of the sand bed to the tip, and (ii) counting the number of shoots, as described elsewhere [32]. In addition, the diameter (cm) of the stem was measured with a tape measure. Subsequently, one plant was destroyed by treatment, for which the following parameters were determined: (a) length of roots in cm (Figure S2a), and (b) the number of roots per plant (Figure S2b) as supporting information. This process was repeated every 60 days for a period of 6 months. Subsequently, the standard deviation (SD) was calculated from the data obtained. The impact of P-MFC reactors on plant growth was evaluated. In addition, the relationship between power generation and the amount of biomass produced by the plant was correlated.

2.3. Bioelectricity Monitoring

First, the open circuit voltage (OCV) was monitored and carried out each day at 9 a.m. for 30 days, aided by a Digital Multimeter (BSTEREN brand, Model MUL-282, China). Subsequently, a polarization experiment was performed by manually applying 11 external resistors (within the range of 100 Ω and 20 KΩ) every 10 min from the OCV. According to the results of the polarization curves, anode and cathode wires were connected using a 1000-Ω resistor to close the circuit. The closed-circuit voltage (CCV) was monitored at a time interval of 15 min/datum by employing an automatic acquisition system based on a microcontroller (Arduino, Model 2560 Mega) connected to a personal computer for 30 days. Current and power were calculated using Ohm’s law, as described elsewhere [11]. Then, current and power densities were normalized considering the area (0.0693 m2) of the anode surface of the P-MFC reactor.

2.4. Data Analysis

All statistical analyses in this study were performed with Minitab version 21.1.0 statistical software. One-way ANOVA was utilized to analyze the difference in plant growth parameters among the control plant, P-MFC-1*, P-MFC-2, P-MFC-3, P-MFC-4, and control MFC, applying the Tukey test (p < 0.05). GraphPad Prism version 9.0.1 (1 5 1) software was used to plot the bioelectricity data.

3. Results and Discussion

During the experiment, the mean temperature was 18.5 °C (max. 25.6 °C, and min. 11.6 °C) and precipitation was 40.4 mm (according to the CONAGUA database, Mexico). The substrate used in this study indicated the following characteristics: pH 7.56; electrical conductivity (EC) 1.42 ± 0.11 mS cm−1; MO 5.60; NO3 194.828 ± 25.60 mg L−1; PO43−–P 8.813 ± 1.02 mg L−1; K 70.025 ± 6.90 mg L−1, and cation exchange capacity (CEC), 14.76 ± 2.08 mEq/100 g of soil. The pH and EC of fresh urine were oscillated between 6–6.8 and 8–9.42 mS cm−1, respectively (initial values). The results showed that the three types of livestock’s urine behaved differently with regard to pH and EC during the operation of P-MFCs. Therefore, at the end of the experiment, pH and EC values of the urine were increased by 24 and 76%, respectively. The highest concentration rate of NO3–N (7306 ± 6.11 mg L−1) was found in goat urine, followed by cow urine and sheep urine with concentrations of 3401 ± 19.2 mg L−1 and 504 ± 3.51 mg L−1, respectively. In addition, sheep urine showed highest concentration rate of PO43− of 23.0 ± 1.09 mg L−1 compared to other livestock’s urine (fresh urine). The highest concentrations of K of 1200 ± 6.96 mg L−1 and of 1180 ± 4.78 mg L−1 were achieved in sheep and goat urine, respectively. After P-MFC inoculation (final stage of experiment), the substrate showed high concentrations of NO3–N (4802.520 ± 28.24 mg L−1), and PO43−–P (1.945 ± 0.02 mg L−1), respectively, and in P-MFC inoculated with sheep urine. Followed by P-MFC inoculated with goat urine, P-MFC inoculated with cow urine and P-MFC uninoculated, respectively, NO3–N concentration values of 1978.606 ± 2.87 mg L−1, 697.934 ± 8.45 mg L−1, and 666.004 ± 5.04 mg L−1, were achieved respectively [31].

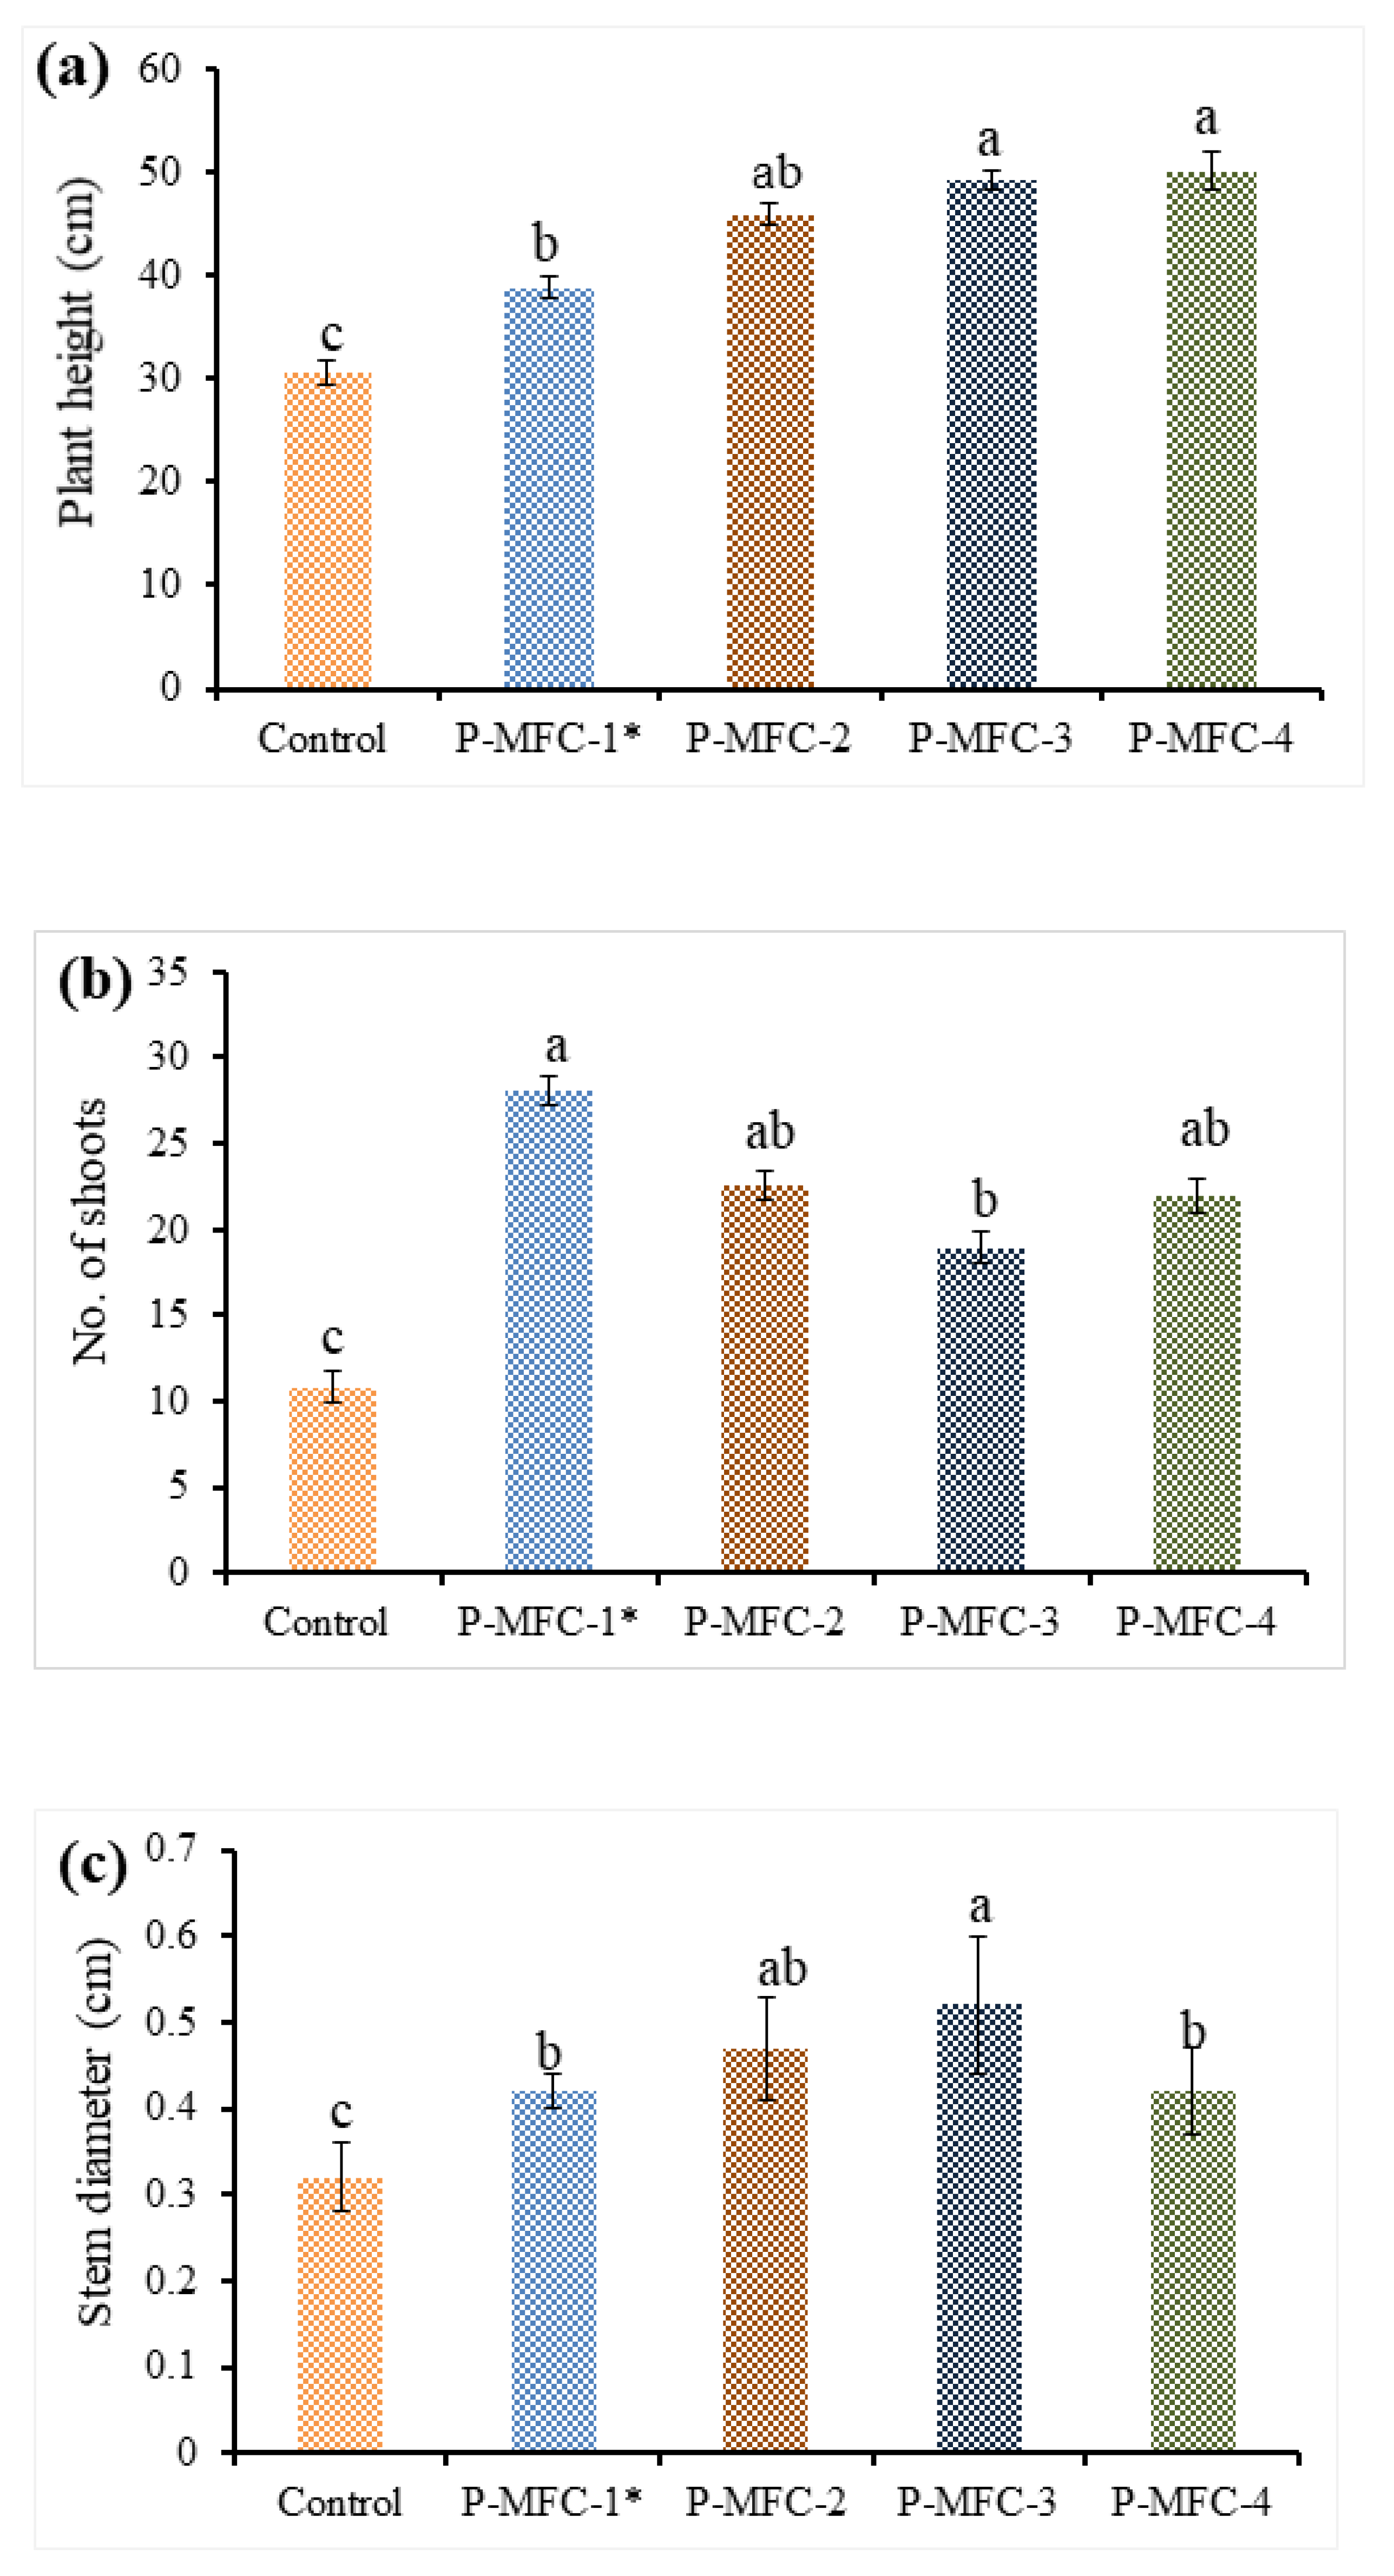
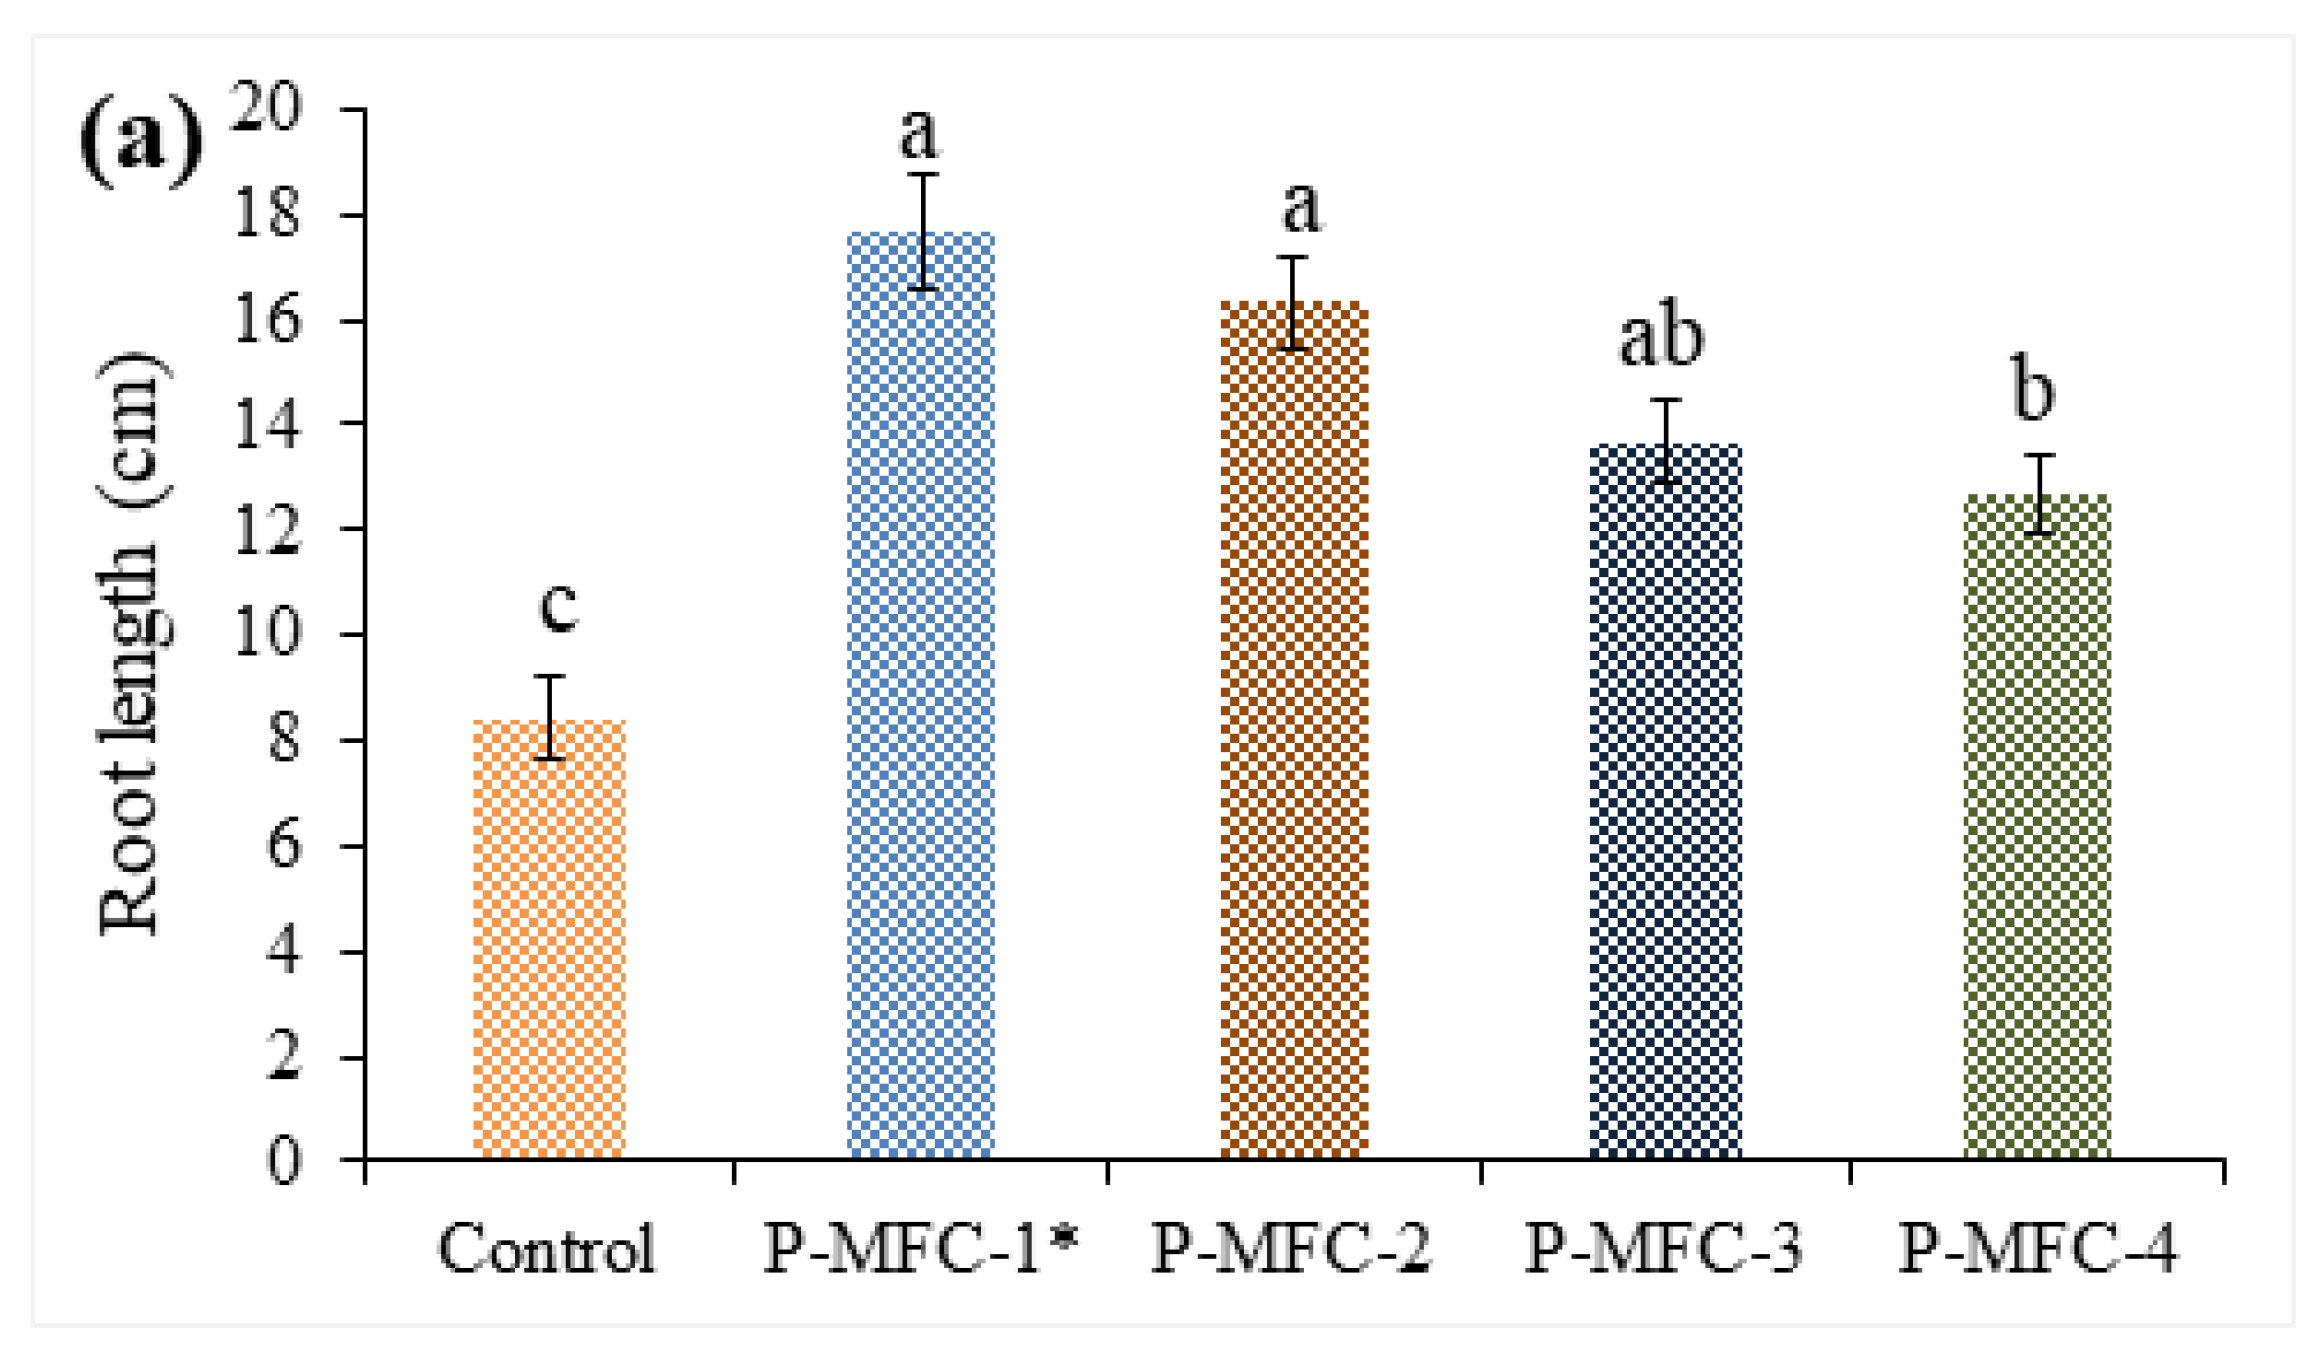
3.1. Plant Growth Monitoring

In this study, the treatment factor (including the urine-dose factor) generated statistically significant results in terms of the height of the Stevia rebaudiana plant. It can be observed that the P-MFCs influenced plant height during this stage of the experiment (Figure 1a). The results showed that P-MFC-3 and P-MFC-4 turned out to be the same and achieved the highest height (with values of 49.13 ± 0.02 and 50.08 ± 0.67 cm, respectively). Meanwhile, the P-MFC-2 turned out to be better than the P-MFC-1* (without inoculation). However, the control plant reached the lowest height in this study. This value was achieved in the control because the plant didn’t receive any treatment during this period. In addition, the P-MFC inoculated with all three types of urine acted positively on the plant’s morphology. On the other hand, there were no significant differences for the time factor, nor for double and triple factors. This means that interactions among the above-mentioned factors are not an option for increasing plant height performance.
Figure 1b represents the number of shoots obtained in Stevia rebaudiana. It can be observed that P-MFC-1* achieved a higher number of shoots (28.06) compared to the other P-MFC, including the control, whereas P-MFC-3 (inoculated with goat urine) achieved the largest diameter (0.52 ± 0.01 cm) with respect to the other evaluated treatments (Figure 1c). The literature reported that the MFC system favors plant growth [33]. This statement was verified in this study. Therefore, the P-MFC-1* reactor did not receive any dose of urine from domestic animals. The study by Helder et al. [33] differs from ours because those authors used another type of treatment, e.g., the Hoagland solution developed with the main function of accelerating plant growth, as well as the manner in which the authors evaluated the growth parameters of the plants. In two recent studies, the morphological behavior of four Opuntia species was evaluated in P-MFC (in a semi-desert environment), by applying to P-MFC 1 L of water [25] and 150 mg L−1 of ammonium nitrate [11] per week for 30 days, respectively. The results revealed that plant growth increased significantly in the presence of P-MFC. However, when ammonium nitrate was applied, there was a substantial improvement (51.97%) in the plant height parameters. In other studies, researchers have observed that plants grown in P-MFC (inoculated with fertilizer) had significant growth (plant length) compared to the control (inoculated) [27,34,35]. The same phenomenon was observed in this study. According to this, it can be argued that both P-MFC and the addition of fertilizers are key factors for accelerating plant growth.
In addition, the treatment factor produced statistically significant results in the root length of Stevia rebaudiana. The best treatments were P-MFC-1* and P-MFC-2, which yielded mean root lengths of 17.43 ± 1.06 and 16.67 ± 0.95 cm, respectively (Figure 2a), followed by P-MFC-3 that achieved a higher root length in terms of the P-MFC-4, and by the control plant. For a number of roots, the best treatment was P-MFC-2, achieving the highest mean of 86 ± 2.50 (Figure 2b), while the P-MFC-1* and P-MFC-4 turned out to be the same. The control plant showed the lowest number of roots in this study. It is noteworthy that an increase (55%) of plant root parameters was observed. Thus, plant roots were found to be permeable in this study. Consequently, this was a good indicator in the plant’s rhizodeposition process [10]. Therefore, root growth influenced the yield of foliar-biomass production. In addition, applying the urine of domestic animals as an inoculant in the P-MFC system positively affected the morphological behavior of the plant. In previous studies, researchers have reported biomass yields of 33 kg m−2 and 1.1 kg m−2, respectively, in Arundinella anomala [33,36], 0.48–6 kg m−2 in Spartina anglica [33,37], and 3.8–23 kg m−2 in Arendo donax [33,38]. Unfortunately, in our study, we did not take into account the amount of biomass in kg m−2. However, only the number of shoots in each treatment was counted as the main index of biomass production. Comparing the previous results obtained in the literature with those found in this study, there is no doubt that bioelectrochemical systems such as P-MFC are technologies that could be implemented in modern agriculture, in that these systems play different roles, including (1) production of bioelectricity, (2) acceleration of the mineralization process (due to the great bacterial activity), and (3) an increase in the amount of biomass produced by plants, etc.
Considering all of the above, it can be argued that there is a proportional relationship between the morphological parameters of the plant and the P-MFC reactors used in this study. In addition, plant growth also depends on other factors, such as (a) the activity of microbes in the mineralization process, (b) the type of substrate, (c) the percentage of organic matter (OM) in the substrate, and (d) the availability of nutrients in the substrate. Furthermore, the neutral pH of the substrate utilized in the study was one of the plant- growth indicators, as reported elsewhere [10,39]. Another explanation that can be given is that plant roots are the main site of the growth of microorganisms. These microorganisms are present in the rhizosphere and are denominated “rhizobacteria”. Numerous living microorganisms positively affect plant growth and nutrient uptake [40]. Many of these microorganisms are plant growth-promoting bacteria (PGPB) [41,42]. For example, plant species such as Artemisa annua tend to attract abundant communities of specific microorganisms associated with the plant’s root, as demonstrated by Shi et al. [12] in their most recent work. A wide diversity of PGPB has been reported in soil, including Agrobacterium, Azotobacter, Azospirillum, Bacillus, and Pseudomonas [43,44,45]. In a critical review article by Olanrewaju et al. [46], the authors reported that PGPB influences plant growth by direct pathways through nitrogen fixation and phosphorus solubilization, as well as through the production of auxin, gibberellin, and cytokinin.
Furthermore, in a study by Jarma-Orozco et al. [47] evaluating the effect of low and high levels of radiation on the main growth rates of Stevia, it was observed that solar radiation was a factor that could influence plant (Stevia) growth. It was found that photosynthesis can reach a point of light saturation near 1200 μmol (photosynthetically active radiation [PAR] m−2 s−1). This was a good indicator for evaluating plant growth parameters. Previous research had shown pH and nutrient availability as other factors that influence the amount of Stevia rebaudiana leaf biomass under hydroponic conditions [48]. However, the authors recommended evaluating the same plant in an open-field experiment to confirm the observed phenomenon. Later, in a study conducted by Mahajan et al. [49], the application of KNO3 via foliar route as a modulator of biomass yield and nutrient absorption for Stevia rebaudiana was reported to be a good option to increase plant growth. A moderate concentration of salts influences both the growth and the yield of a dry biomass of leaves [49].
In summary, we can argue that increasing the amount of biomass produced by Stevia rebaudiana is crucial for industries that process this type of plant. For example, increasing the amount of biomass is currently increasing the production of the sugar substitute to satisfy the high demand worldwide for this product. In addition, the relation between the amount of the number of roots and the number of shoots was observed in this study, i.e., the greater the number of roots, the greater the increase in the number of shoots.

3.2. Bioelectricity Generation

During the experiment, the mean temperature was 18.5 °C (Max. 25.6 °C, and Min. 11.6 °C) and precipitation was 40.4 mm (according to the CONAGUA database, Mexico). According to these results, the substrate used in this study had the following characteristics: pH 7.56; electrical conductivity (EC) 1.42 mS cm−1; MO 5.60; NO3 194.828 mg L−1; PO43−–P 8.813 mg L−1; K 70.025 mg L−1, and cation exchange capacity (CEC), 14.76 mEq/100 g of soil. The pH and EC of fresh urine were oscillated between 6–6.8 and 8–9.42 mS cm−1, respectively (initial values). At the end of the experiment, the pH and EC values of the old urine were increased (24 and 76%, respectively); these ranged between 7–9 and 12–40, respectively [31].

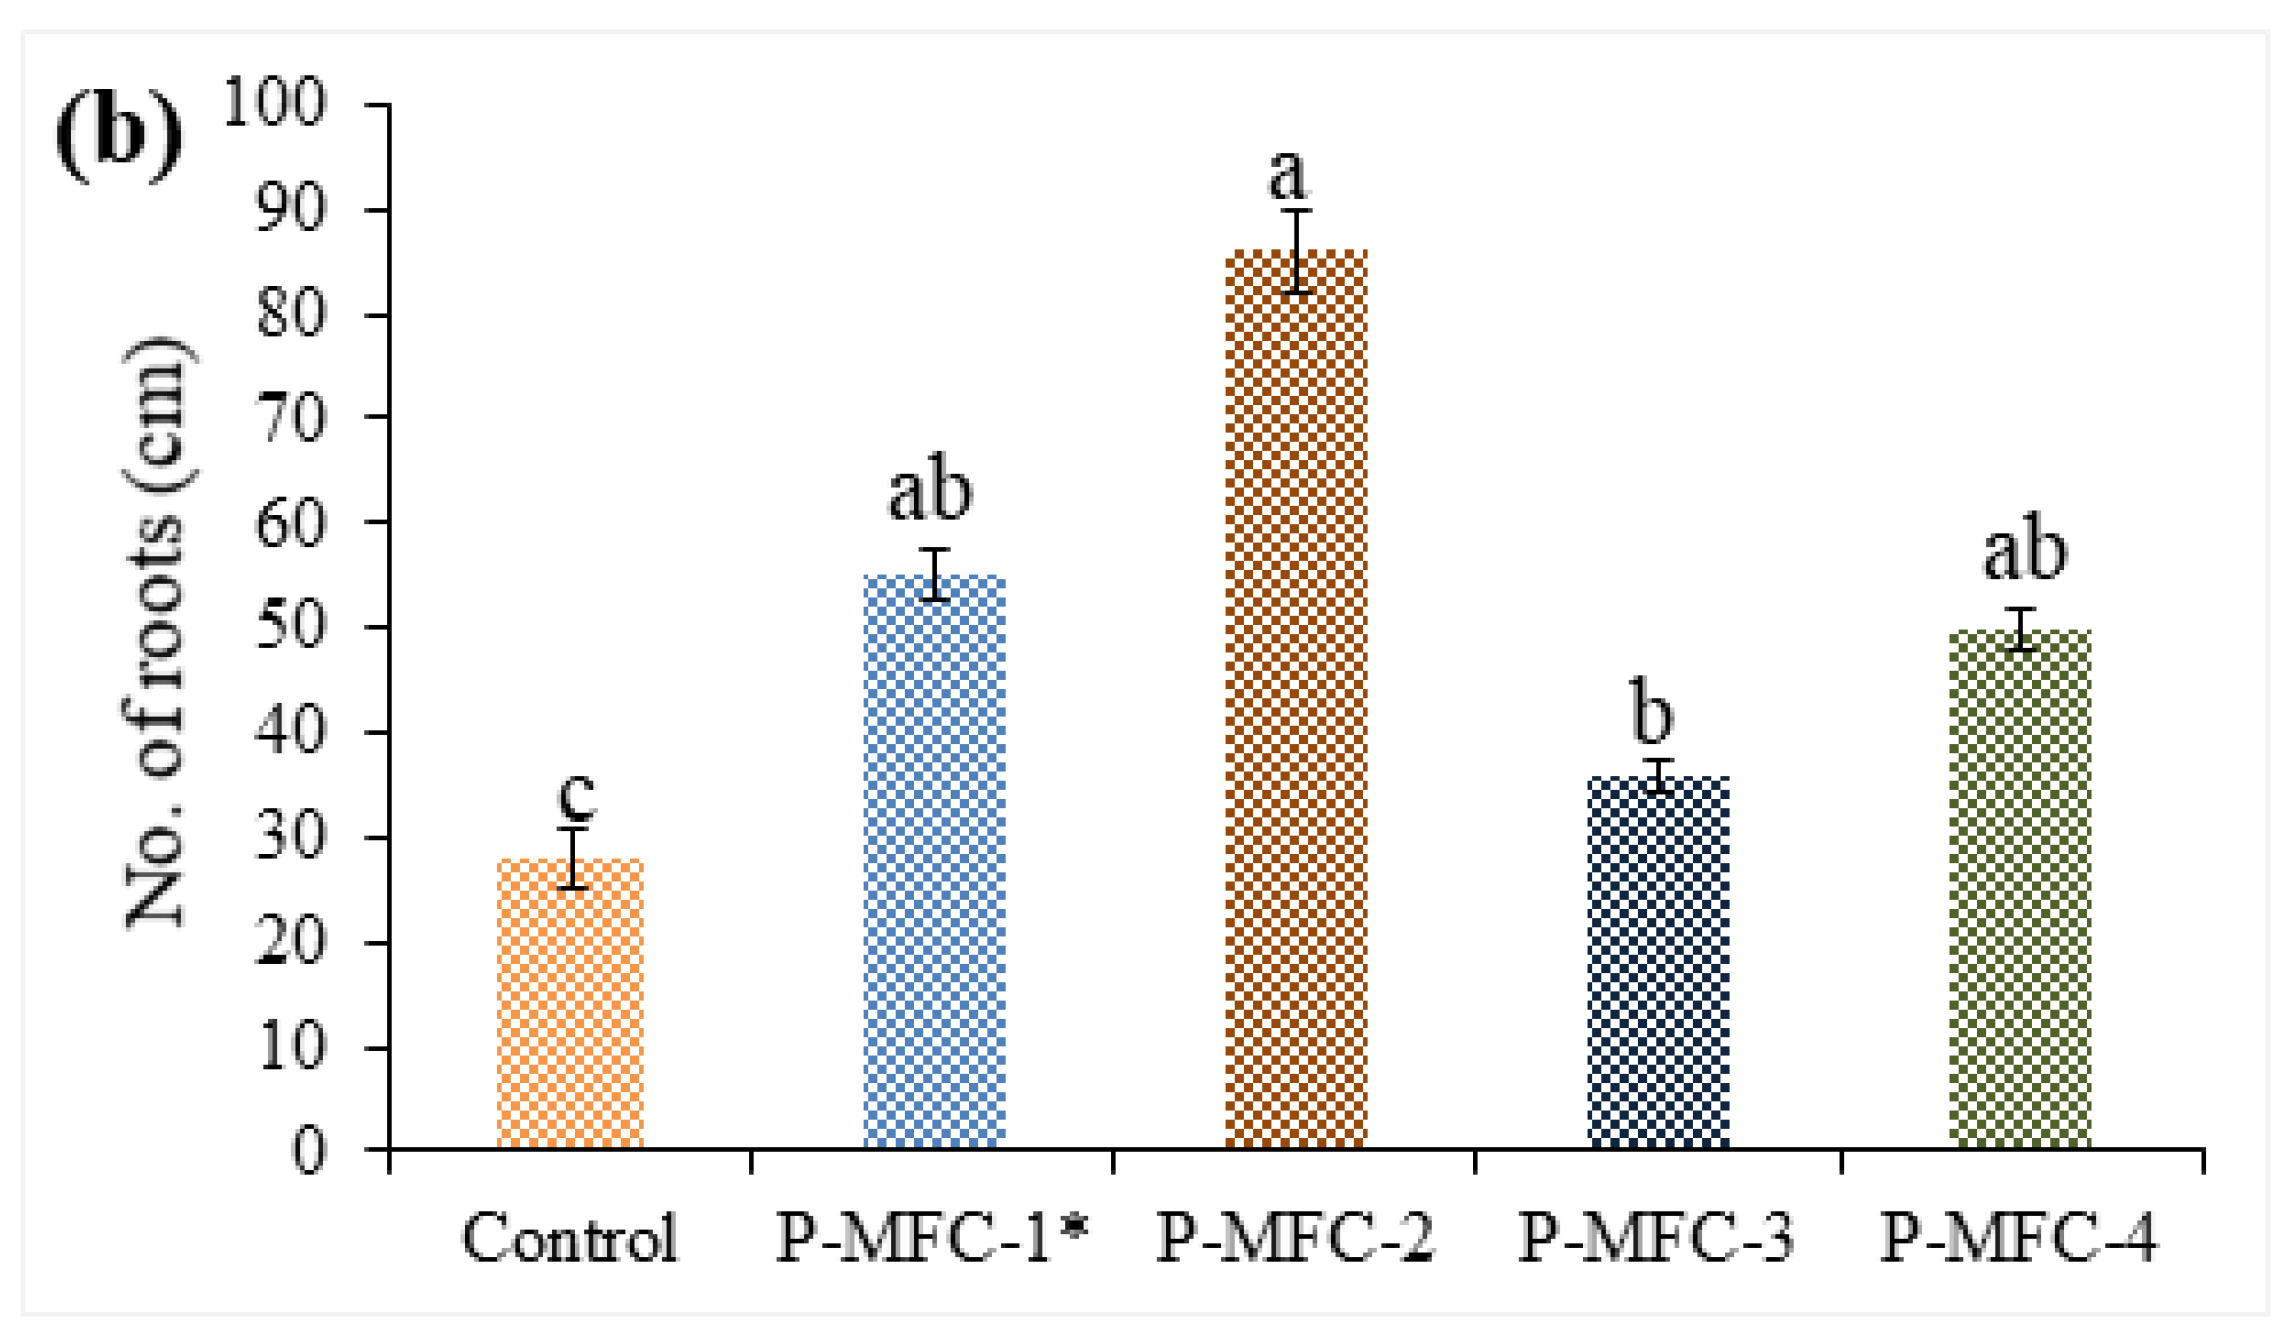
3.2.1. OCV and Polarization Curve

The results revealed that all the reactors evaluated in this study were significantly different in terms of OCV. P-MFC-2 was found to be the most effective reactor in this experiment, achieving the maximum average theoretical OCV of 1.2 V ± 0.07 (1200 mV), followed by P-MFC-1* (0.82 ± 0.01 V; 820 mV), P-MFC-3 (0.78 ± 0.00 V; 780 mV), P-MFC-4 (0.95 ± 0.05 V; 950 mV), and the control MFC (0.44 ± 0.01 V; 440 mV). The OCV results found in the P-MFC reactors were higher than that reported by Syed et al. [50]. The latter authors reported an OCV of 0.65 V (650 mV) from using cattle manure in microbial fuel cells for the generation of green energy. In addition, voltages of 0.2921 V (292.1 mV) and 0.3217 V (321.7 mV) were reported in a study conducted in a rice field [26] testing two types of reactors. These results were inferior to those found in our study. Our results indicated that the application of domestic animals’ urine, both in the P-MFC system as well as in the substrate, had more potential to increase the efficiency of P-MFC. This marked difference between the two studies could be due to several factors, for example, types of electrode materials, voltage monitoring time, the operating conditions of reactors, etc. The study by Syed et al. [50] was performed under laboratory conditions, while our study was conducted in the open field. Additionally, some microorganisms, such as Bacillus subtilis, Streptococcus agalactia, Pseudomonas fragi, Proteus vulgaris, Escherichia coli, and Staphylococcus aureus have been reported in animal’s urine (e.g., cow urine) [51]. On the other hand, previous studies have clearly shown that the application of urine could stimulate or inhibit the soil’s microbial community [52], which is closely linked to soil chemistry. Therefore, the application of urine increases soil moisture [53], which is a good indicator of improving bioelectricity performance.
On the other hand, Figure 3a presents a typical graph of the polarization curves obtained in this study. Higher average energy efficiency was achieved in P-MFC-2, with a value of 931 ± 15.1 mA m−2 when it was inoculated with cow urine, compared to the other P-MFC reactors evaluated in this experiment. Lowest average power generation was exhibited by the control (without plant), achieving a current density of 10 ± 0.08 mA m−2. Figure 3b depicts the performance of power–density curves in this study. It can be observed that the same reactor (P-MFC-2) indicated the highest performance of 132 ± 11.6 mW m−2. This result was higher compared to those reported in previous studies [11,26,28,50,54]. However, in a recent study by Li et al. [55], higher maximum power densities of 1613.3 ± 155.5 and 1185.1 ± 29.1 mW m−2, respectively, were reported in microbial electrochemical systems by optimizing the “anode-collector”. This was a good strategy to increase the performance of the reactor. Hence, Li et al. found that integrating a metal–current collector into the anode electrode was an effective strategy for reducing the power loss of the system. Previous results were higher than those found in our study. This difference was due to the types of systems employed in both studies. Also, the lowest performance was achieved in the control, which yielded a power density of 0.35 mW m−2. The same phenomenon was observed previously, by evaluating the performance of P-MFC embedded with Opuntia spp. under open-field conditions [11,25].
Previously, plant species such as Amaranthus viridis- and Triticum aestivum-mediated P-MFC were utilized [27]. The study showed higher power density of 194.45 mW m m−2 during a single polarization experiment. The study attributed the power–output performance to both the activity of the microorganisms present on the surface of the anode, as well as to the application of organic-rich bioslurry in the reactors. In contrast, in the study by Sharma and Chhabra [56], which evaluated the performance of a photosynthetic P-MFC embedded with Chlamydomonas reinhardtii at the cathode, a maximum power density of 371.34 mW m−2 was achieved (polarization curve). In turn, it was reported that C. reinhardtii could support high power output from a P-MFC and that it is highly resourceful in terms of value-added products. In addition, P-MFC embedded with the same species (C. reinhardtii) exhibited a power density of 1465 mW m−2, which was also superior to those found in this study [57]. The P-MFC and MFC reactors were constructed using zinc–carbon electrodes (inoculated with cattle manure), respectively. According to the results, the MFC with zinc–carbon electrodes had a better power density than other MFC. Other studies demonstrated maximum power densities of 3.27, 0.99, and 5.29 mW m−2 in three types of constructed electroactive wetland (EW), including EW-1, EW-2, and EW-3, respectively [58]. These results were recorded in polarization curve experiments. The study revealed a significant correlation between energy production and the internal resistance of the reactors. As the voltage of the system increased, the internal resistance decreased considerably. Previous studies have shown that the increase in the organic load positively affects the performance of bioelectricity production [59].

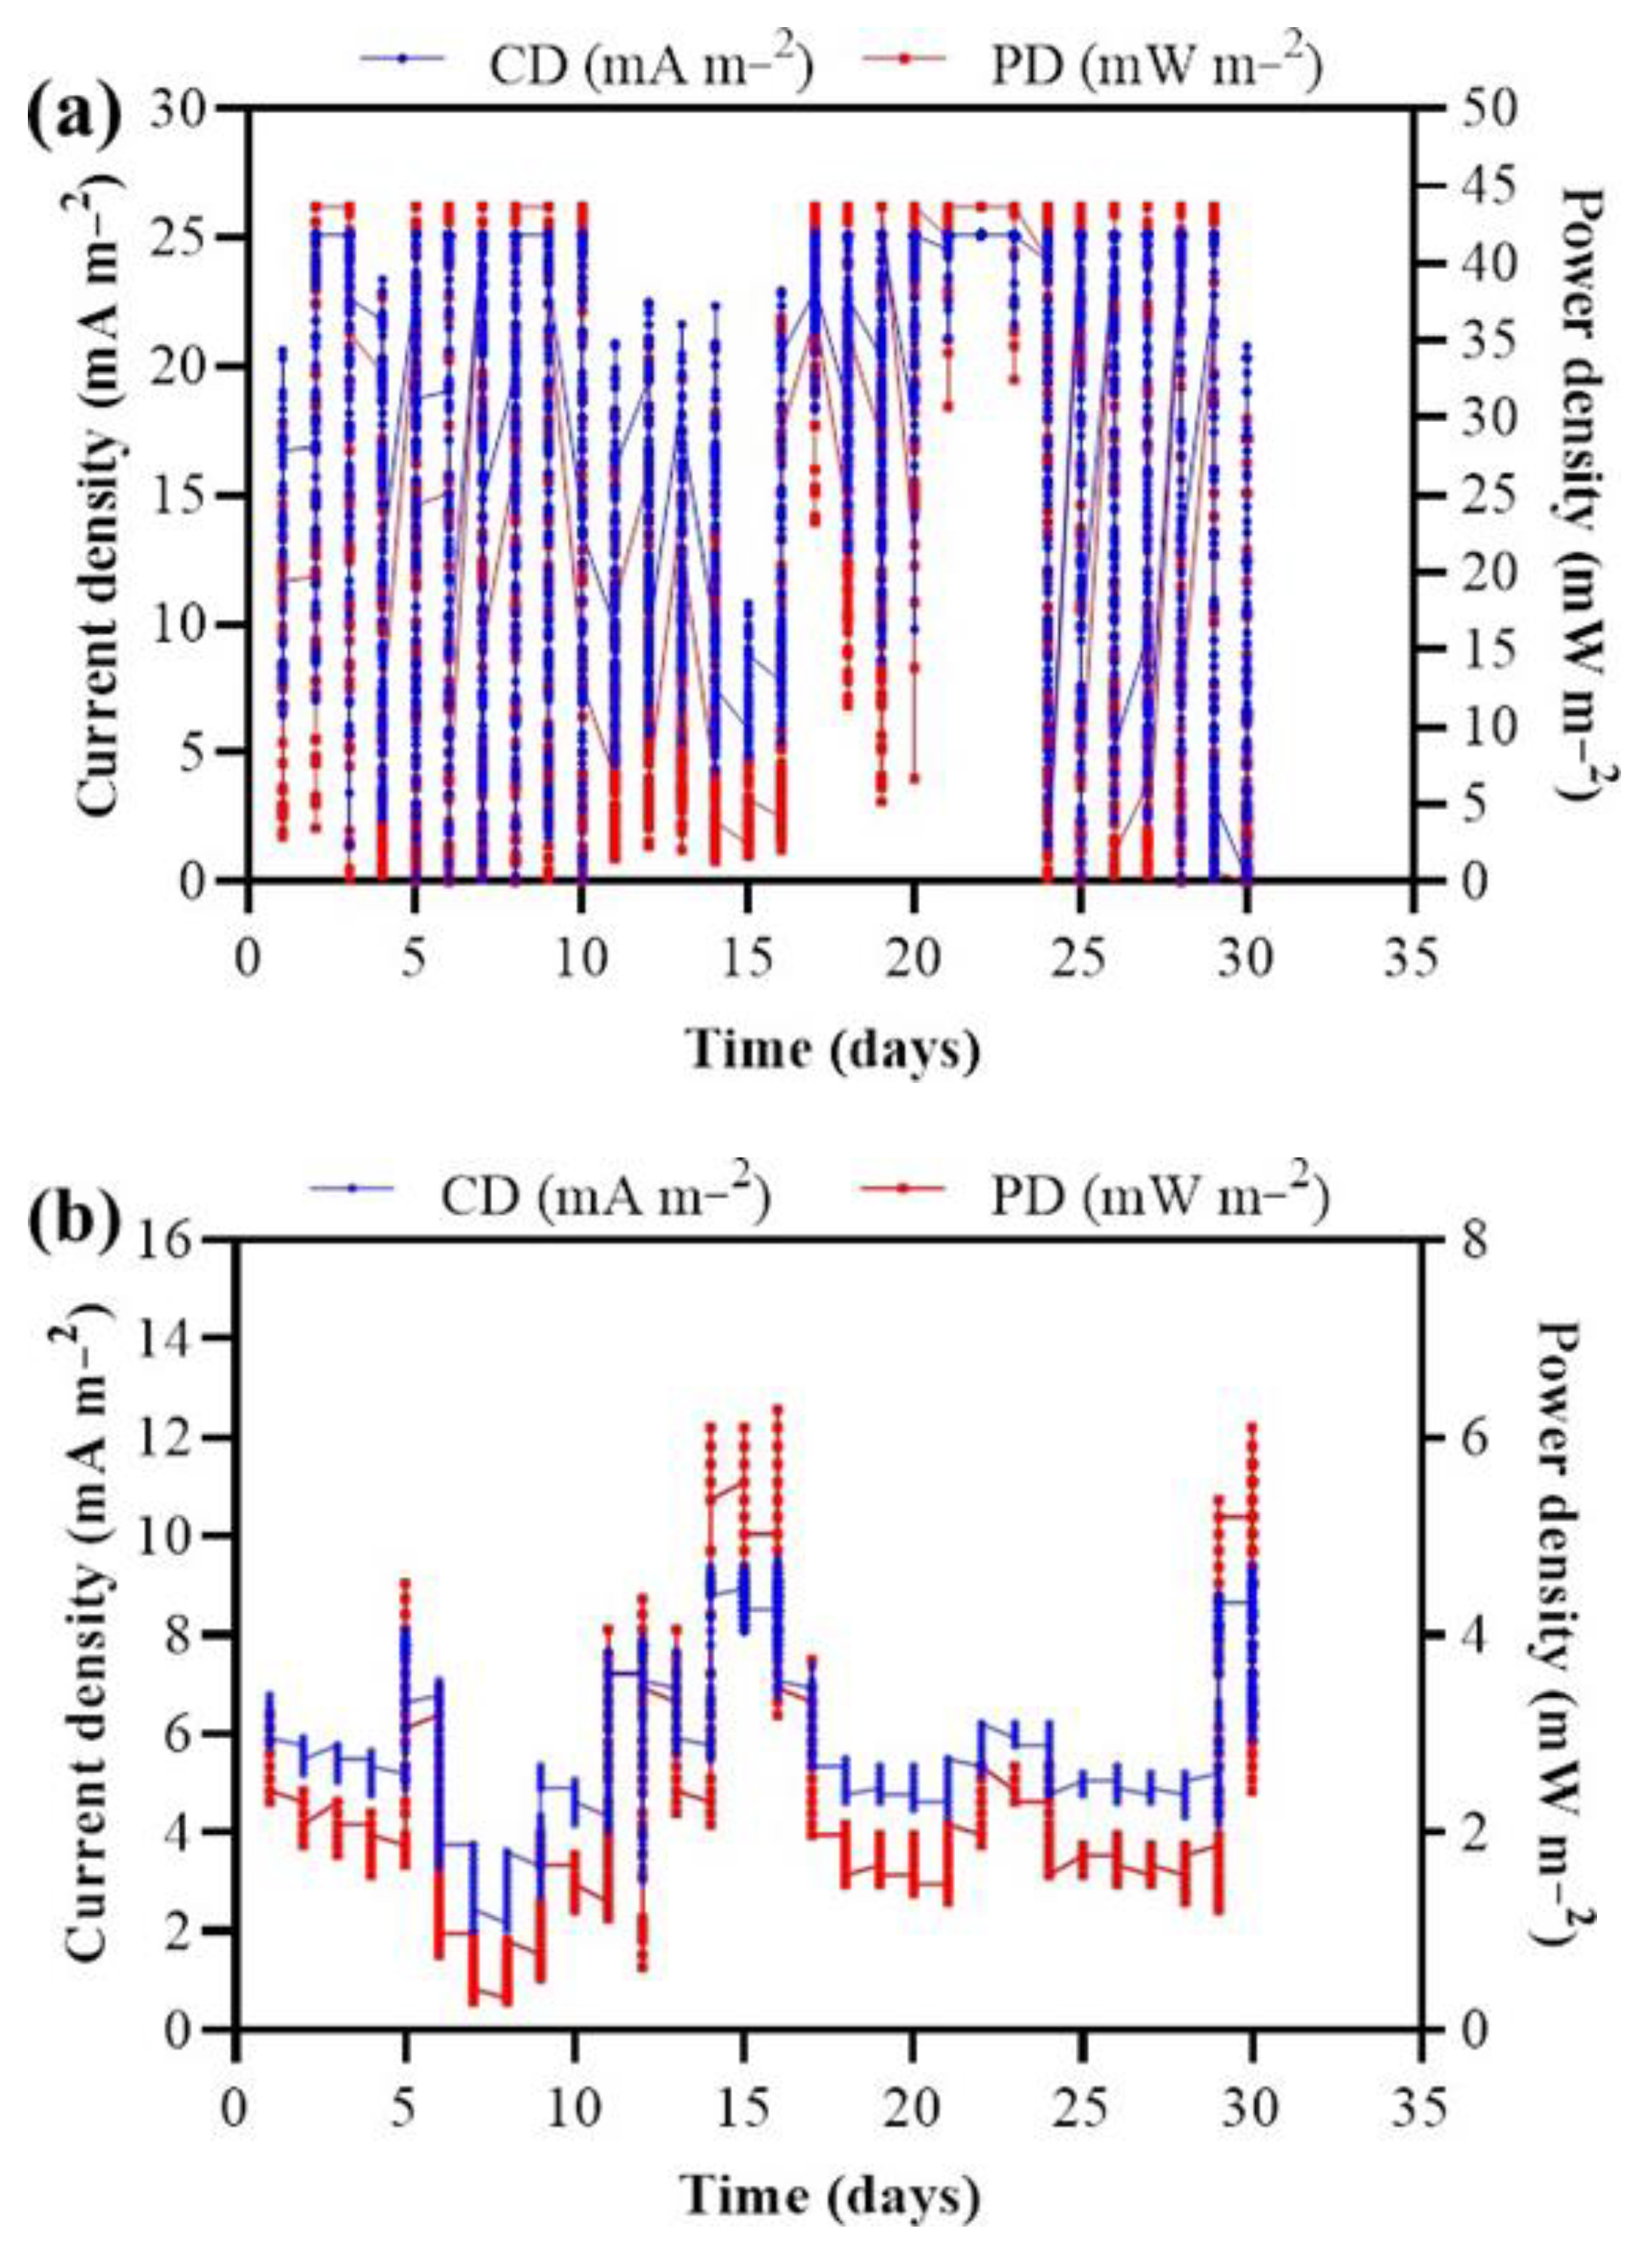
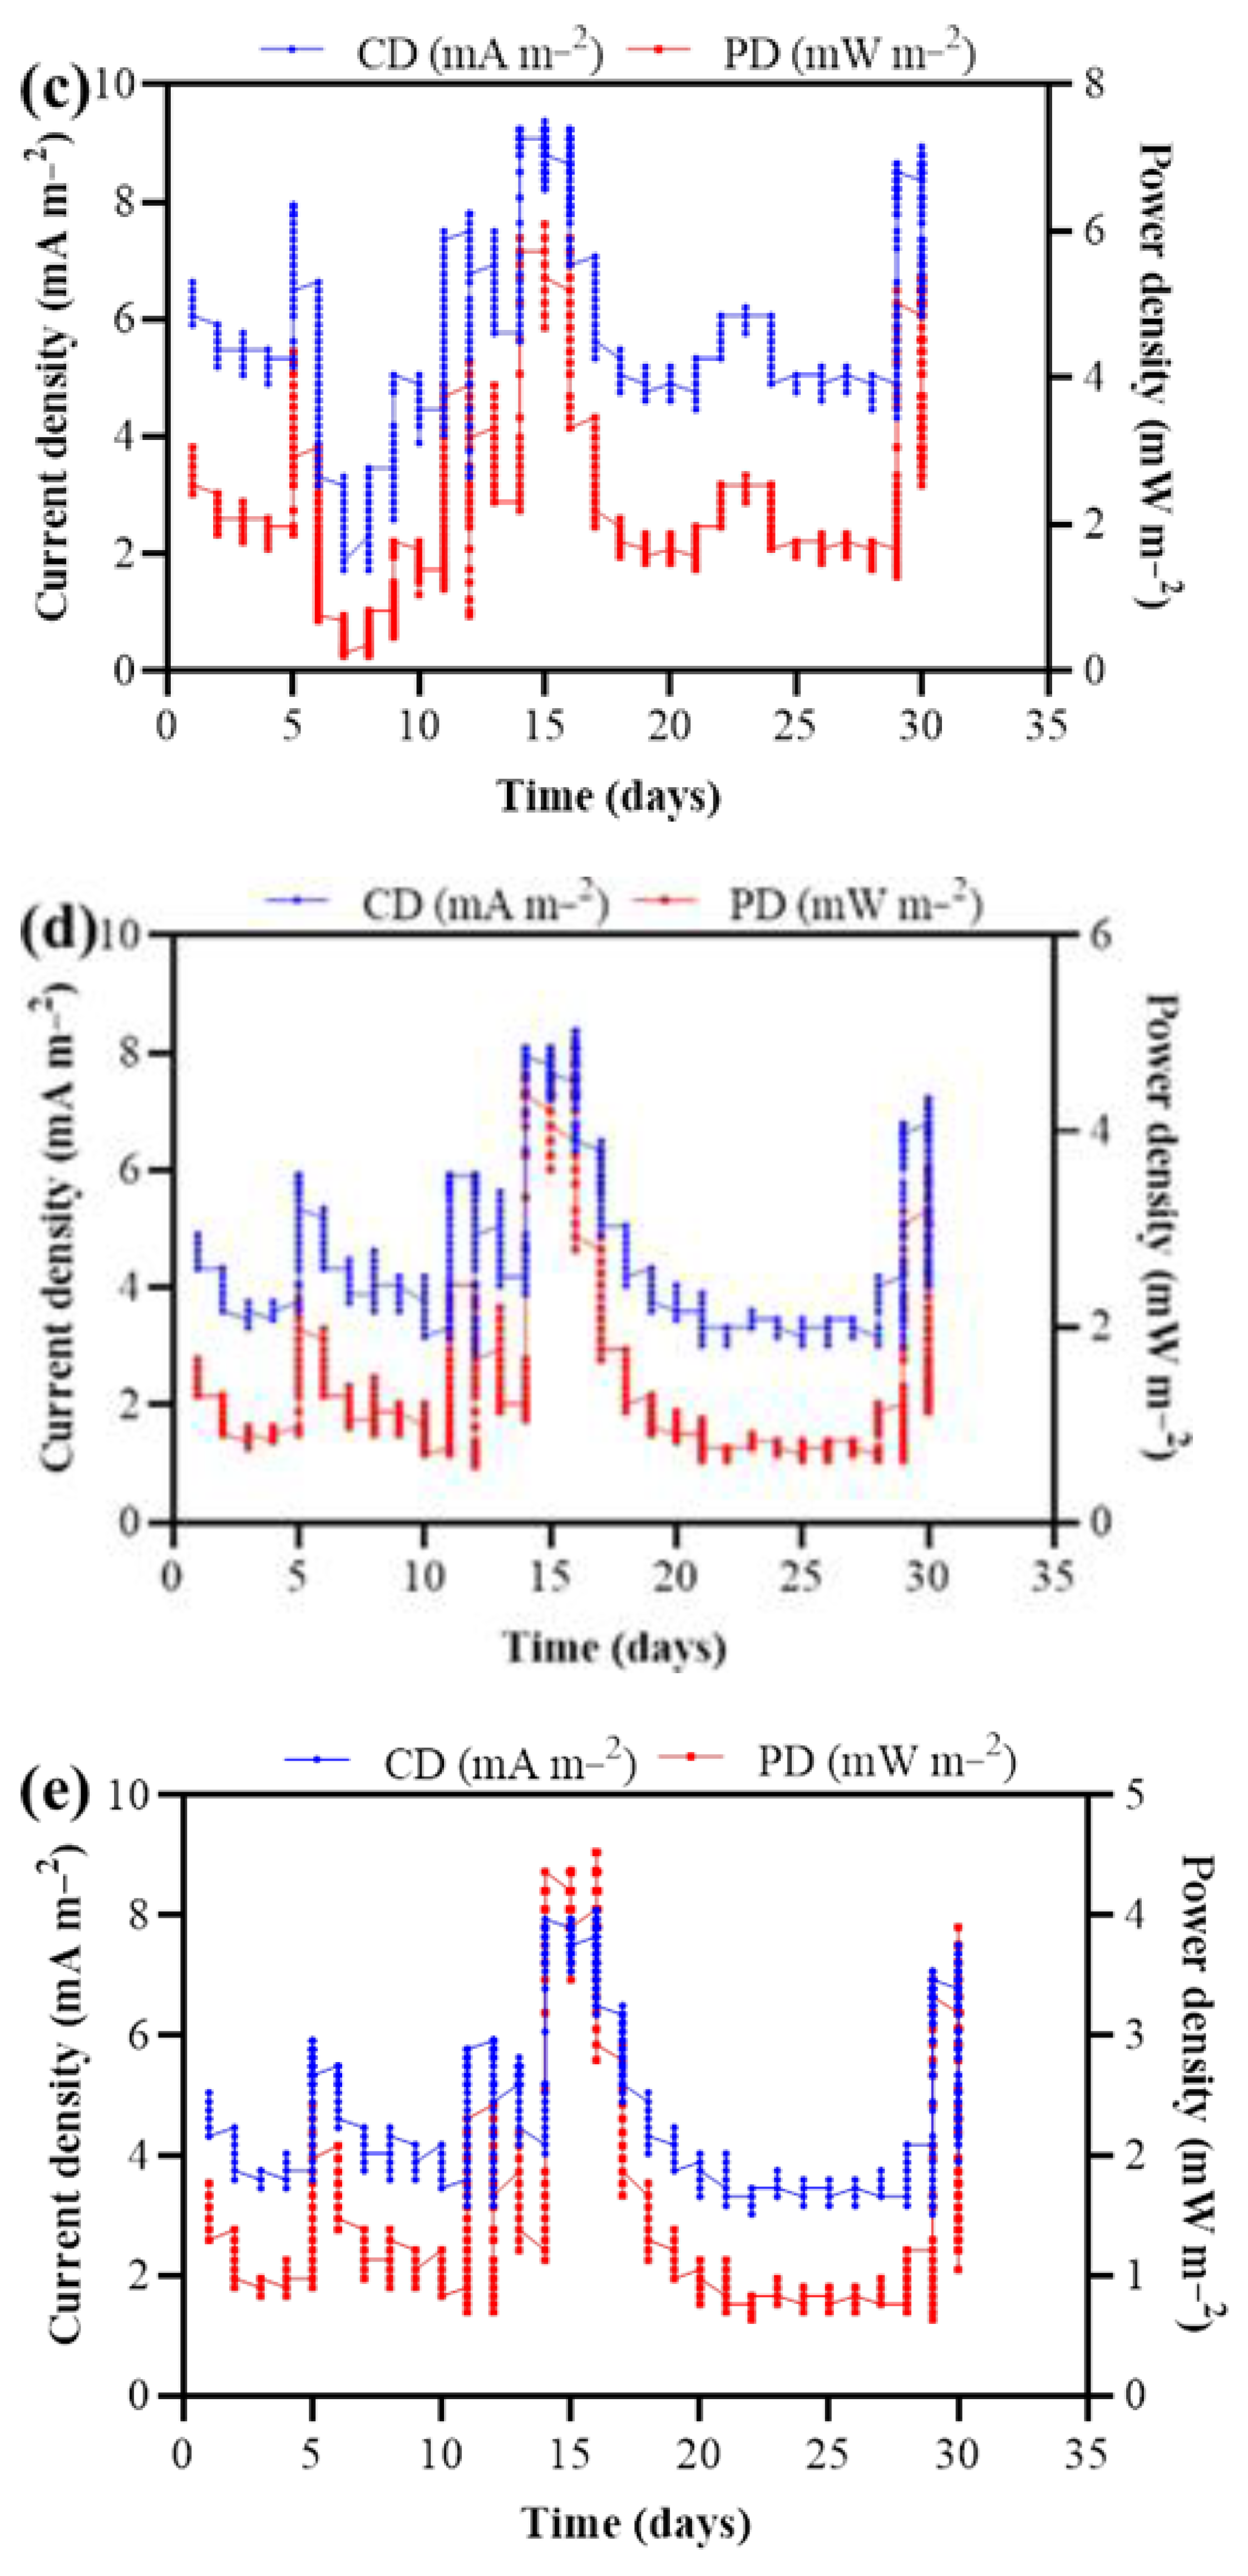
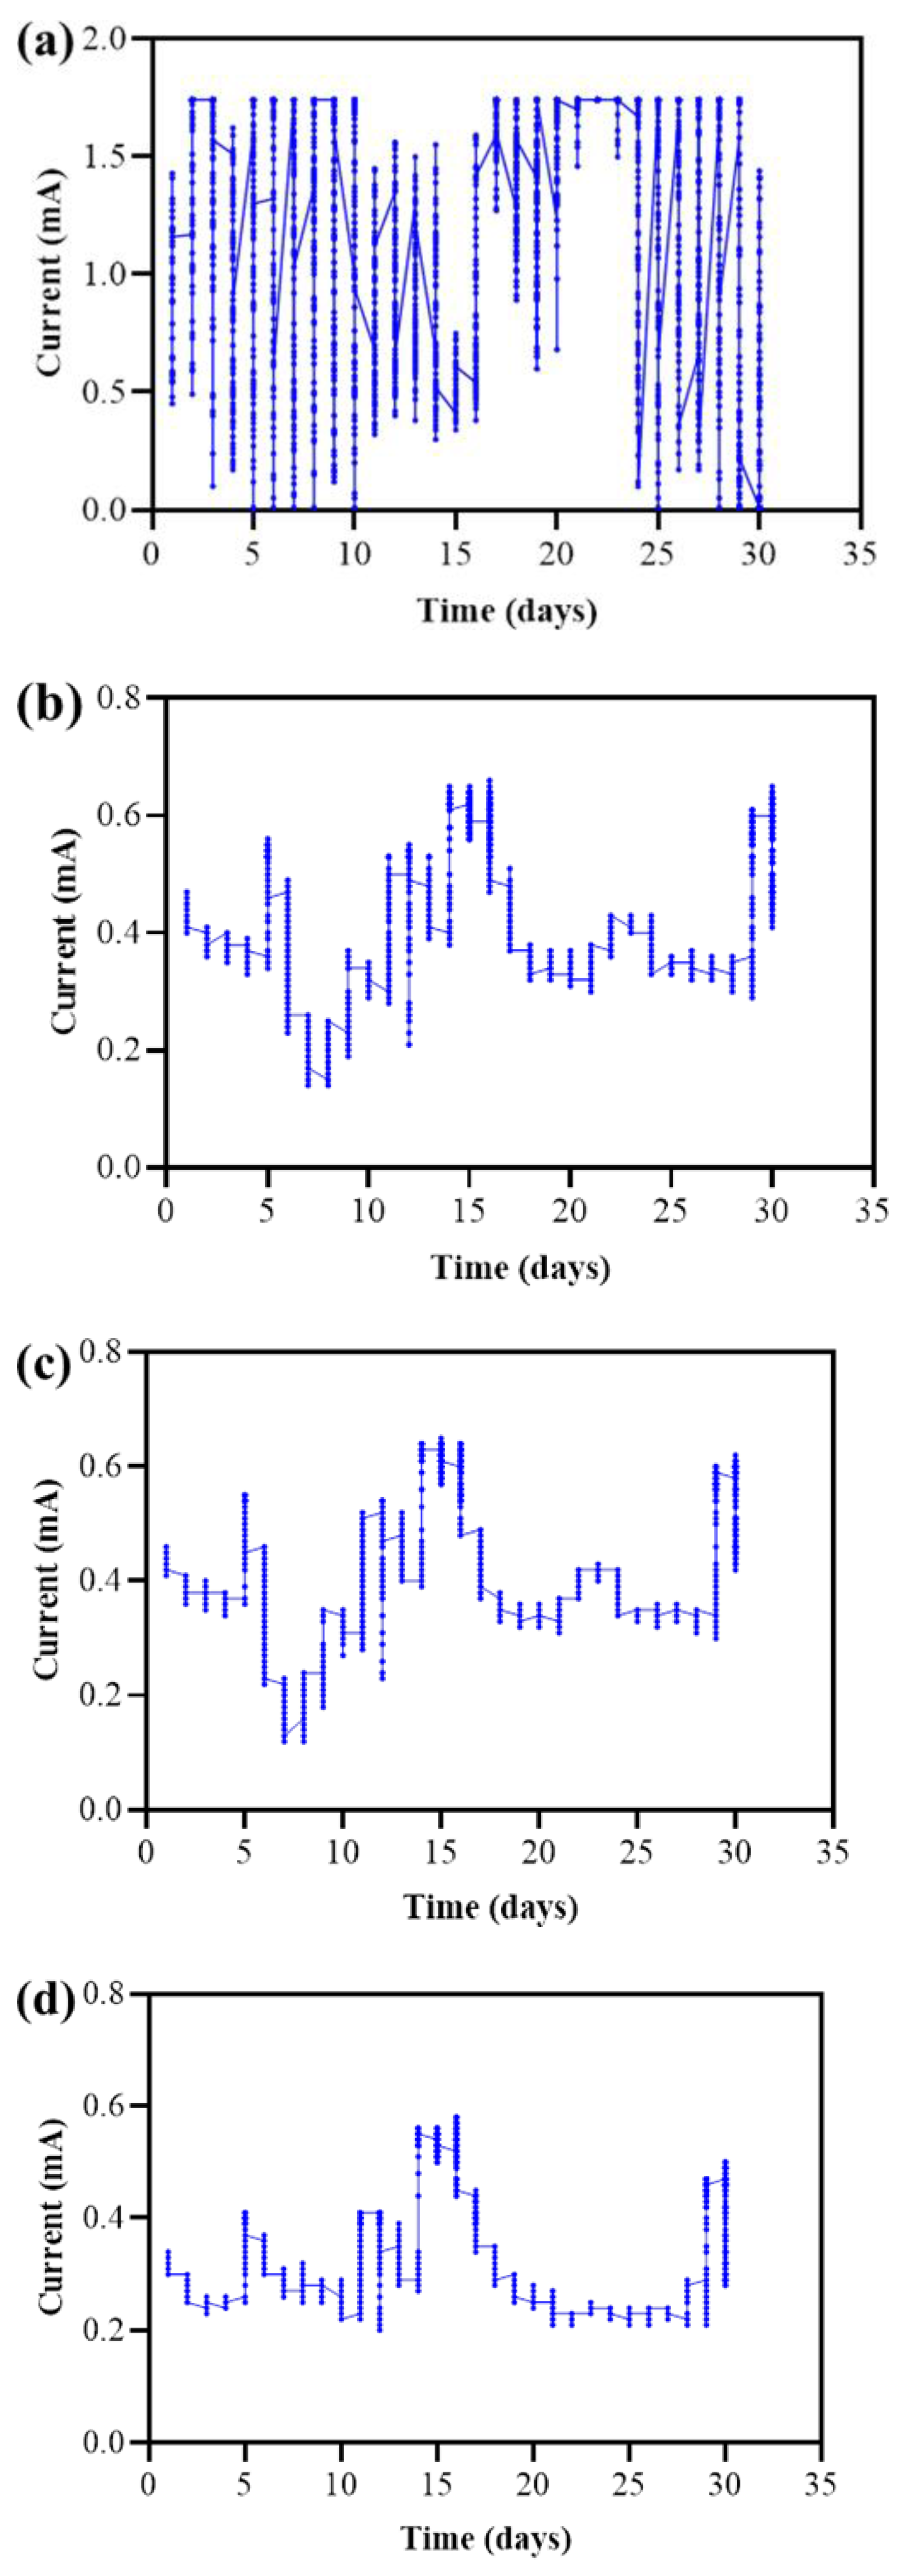
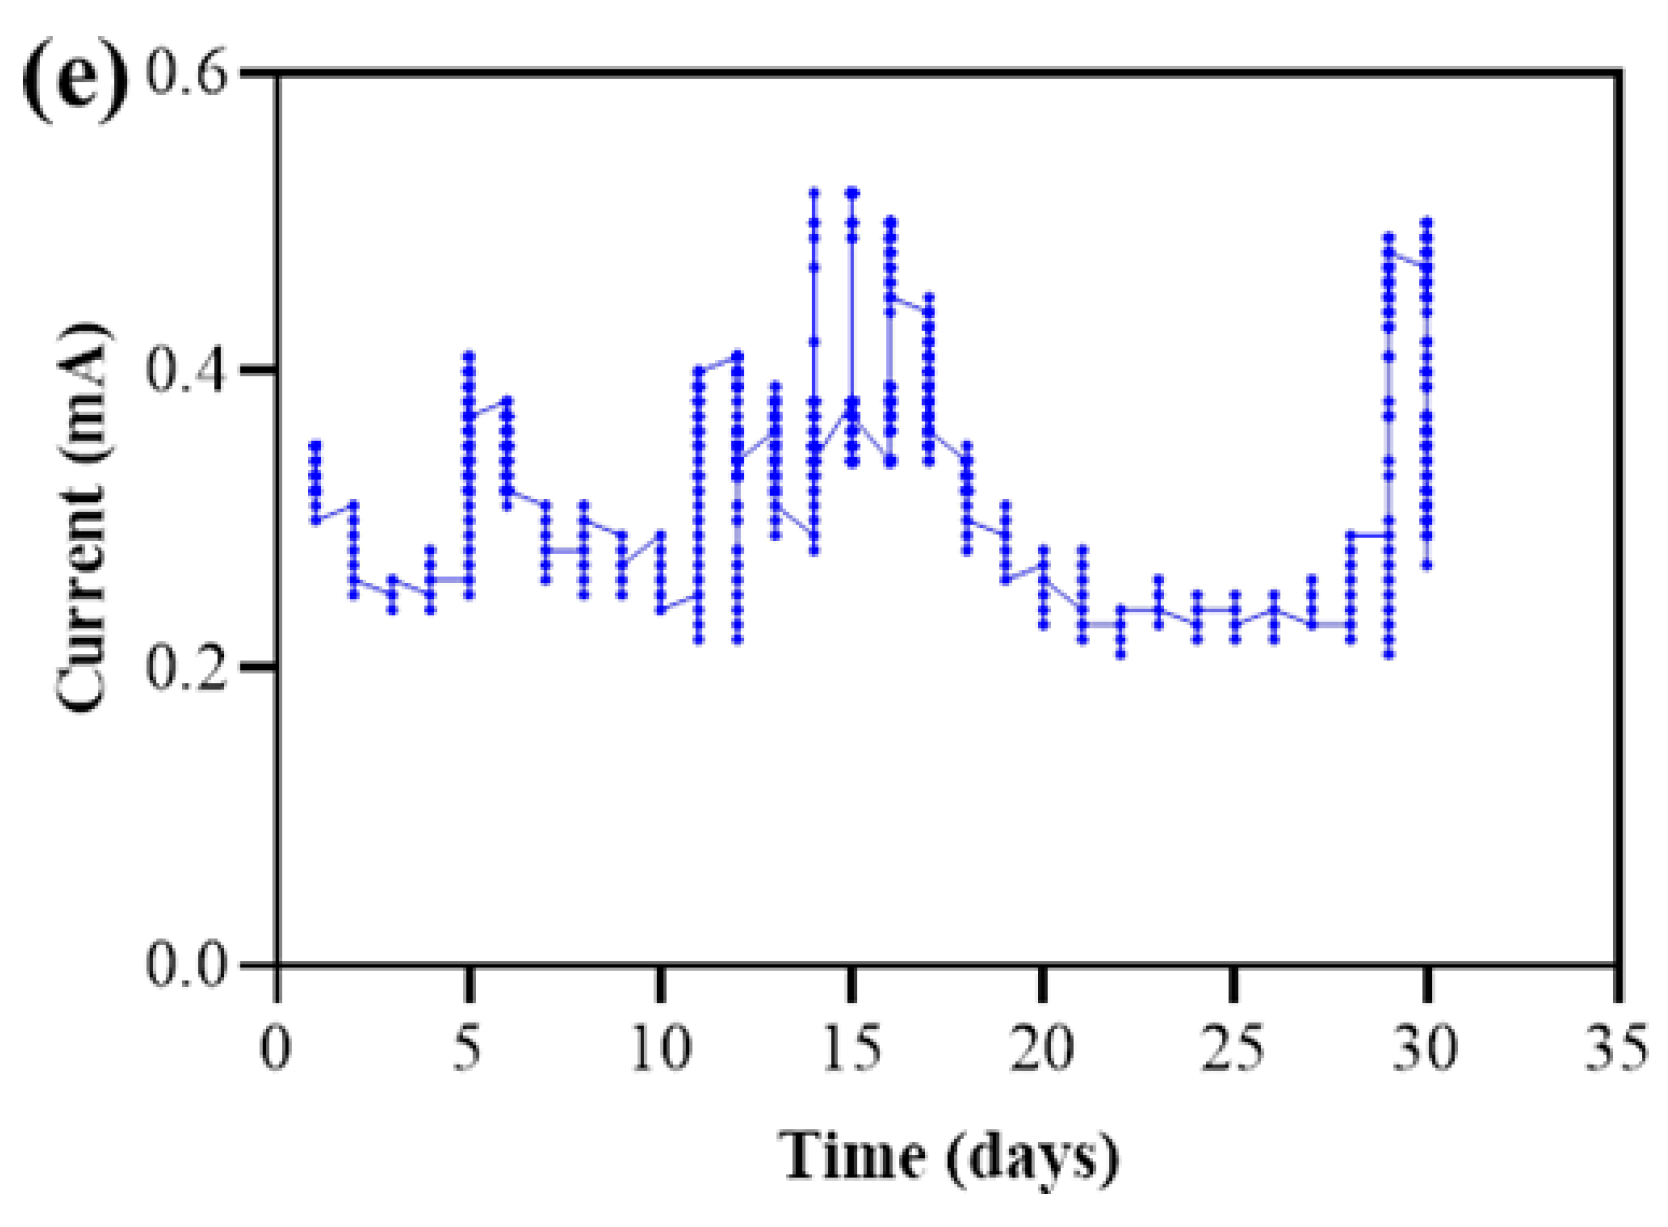
3.2.2. Long-Term Operation of P-MFC Reactors

The results showed that all P-MFC reactors produced bioelectricity during 30 days of operation. As can be observed, the highest maximum average power density of 43.68 ± 3.05 mW m−2 was generated in P-MFC-2 (Figure 4a). This value was achieved on day 2 and was nearly constant at this stage of the study. However, a decrease was observed between days 3 and 10, and on day 11, energy generation decreased to 95.71% (from 43.68 ± 3.05 to 1.87 ± 0.01 mW m−2). This behavior of the generation of bioelectricity was due to a failure of the channels that sent the signal to the automatic voltage-monitoring system during this period. This mishap was only recorded by the P-MFC-2 reactor. Another factor that could be attributed to the low energy production was the lack of humidity in the reactor. A similar phenomenon was also observed in a previous study using P-MFC embedded with Spartina anglica [28]. It was observed that when the anode compartment was dry, the production of bioelectricity tended to be zero. Subsequently, on day 16, an increase of 9.22% (2.06 ± 0.00 mW m−2) was obtained up to day 20. From day 21 to day 24, the reactor demonstrated constant bioelectricity production, and subsequently it presented a different behavior until day 30. The current output obtained in the P-MFC-2 was 25 ± 1.05 mA m−2. Figure 5a presents the behavior of the current in P-MFC-2 during the operation time. The maximum current peak (1.74 ± 0.05 mA) occurred on day 16, and the maximum average voltage of 1.73 ± 0.09 V (1730 mV) was reached under closed-circuit conditions.
Figure 4b shows the generation of bioelectricity in P-MFC-1* (*without inoculation). As can be observed, the highest average power density peak was generated on day 16, reaching a value of 6.28 ± 1.00 mW m−2, for an average current density of 9.37 ± 2.04 mA m−2. Prior to obtaining this performance, a value of 2.79 ± 0.01 mW m−2 had been reached on the P-MFC-1* (on day 1 of system start-up). The increase in energy production in this reactor was 55.57%; however, a decrease was observed from day 17 to day 28. P-MFC-1* is the second reactor in this study that presented a higher performance in terms of power generation. This was followed by P-MFC-3 (Figure 4c), achieving an average power density of 6.09 ± 0.05 mW m−2 (on day 15), for an average current density of 9.73 ± 1.03 mA m−2, while P-MFC-3 showed a decrease in energy production on days 7, 8, and 17–29. Between P-MFC-1* and P-MFC-3, there were no statistically significant differences. Figure 5b,c depict current monitoring in the reactors P-MFC1* and P-MFC-3, respectively. The highest average current output peaks achieved in P-MFC-1* and P-MFC-3 were 0.66 ± 0.03 mA (660 mV) and 0.65 ± 0.02 mA (650 mA), respectively, while P-MFC-4 (Figure 4d) reached an average power density of 4.85 ± 0.08 mW m−2. This value was generated on operating day 16. However, from day 17 to day 29, it can be observed that energy production decreased by 60%; then, an increase of 90% was registered between days 29 and 30. In P-MFC-4 (Figure 5d), a current of 0.58 ± 0.00 mA was obtained with the maximum voltage of 580 mV. On the other hand, the minimum average value of power generation was presented by the control (Figure 4e and Figure 5e), reaching an average power density of 3.46 ± 0.03 mW m−2 (8.08 ± 1.06 mA m−2). In previous studies, lower values were also reported in MFC utilized with control vs. P-MFC [11,25,60]. Sathish-Kumar et al. [60] employed a BES system configured with a clay cup inoculated with a nopal (cactus pear) biogas effluent, which operated for 30 days. The study indicated that the performance of the reactors was due to the bacterial activity on the anode surface [60]. In the studies by Apollon et al. [11] a clay bar-constructed P-MFC was utilized for 30 days. The P-MFC was reported to be a good option for the generation of bioelectricity in the semi-arid region. Besides, Table 1 showed maximum power densities reported in the previous studies with P-MFC operating in different a period of time.
On the other hand, the low generation of bioelectricity in the control could be attributed to a factor such a low OM content, which influences the activity of the bacterial community on the surface of the anode electrode. Low activity of microorganisms in the environment of the bioelectrochemical system gives rise to a total decrease in the production of bioelectricity. This comprises the explanation that we are able to offer concerning this phenomenon. However, there is no doubt that other, unknown factors could cause the low performance of the control.
Furthermore, the results found in this study were higher compared to those reported by Sudirjo et al. [28] in P-MFC operated with activated carbon mixed with marine sediments as anode material. The power density reported in this P-MFC (embedded with S. anglica) was 1.04 mW m−2 (over 2 weeks), which was 42 times lower in relation to P-MFC-2, six times lower than P-MFC-1*, five times lower than P-MFC-3, four times lower with respect to P-MFC-4, and three times lower than the control. Although the control turned out to be lower in this study, it was higher than that reported by Sudirjo et al. [28]. In a recent study by Tongphanpharn et al. [61], P-MFC embedded with Typha orientalis (cattail) and Oryza rufipogon (rice) for remediation of cadmium-contaminated soil were utilized. Voltage generation yields of 137.12 mV ± 13.08 and 350.50 ± 74.89 mV were reported in T. orientalis (cattail) P-MFC and in O. rufipogon (rice) P-MFC, respectively, under open- and closed-circuit conditions for 150 days. However, these power generation results were lower compared to what was reported in our study. This indicates that P-MFC operated with Stevia rebaudiana has greater potential to generate bioelectricity than the aforementioned plant species.
According to the latter, it can be argued that the performance of P-MFC depends on several factors, such as (i) the rate of bacterial growth at the anode [62], (ii) the formation of biofilms on the surface of the anode as a result of the activity of microbes [63] and (iii) the decomposition (oxidation) of organic matter by microbes present on the surface of the anode [64]. According to previous studies, Bacteroidetes, Firmicutes and Proteobacteria are the predominant phyla present in the anode comportment [65,66]. The great effectiveness of microorganisms depends on factors such as pH, temperature, and the types of treatments or the nutrients applied in the reactors [62]. Other factors that influence the generation of bioelectricity with P-MFC include solar radiation [67], plant type (e.g., the types of the metabolic pathways C3, C4, and CAM), monitoring time, condition of operation (e.g., controlled or uncontrolled environment), types of electrode material used, and the size of the reactor employed [28]. Finally, in the study by Kuleshova et al. [68], P-MFC were connected in parallel and series to evaluate their electrogenic properties and potential. The study indicated that both connection types possessed significant power potential, which exhibited increases by a factor of 1.5. However, the P-MFC used in this study were found to be superior with regard to the efficiency produced.
Table 1. Performance of P-MFCs reported in the previous literature.
Type of BESPlant SpeciesType of
Membrane
Anode MaterialCathode MaterialTime of Operation (Days)Max. Power GenerationReference
P-MFCOpuntia joconostle + 150 mg L−1 of NH4NO3/weekCeramic stickGraphite feltZinc sheet306.07 ± 2.41 mW m−2[11]
P-MFCOpuntia robusta + 150 mg L−1 of NH4NO3Ceramic stickGraphite feltZinc sheet302.76 ± 0.21 mW m−2[11]
P-MFCOpuntia albicarpa + 1 L of H2O/weekCeramic stickGraphite feltZinc sheet304.32 mW m−2[25]
P-MFCOpuntia ficus-indica 1 L of H2O/weekCeramic stickGraphite feltZinc sheet300.44 mW m−2[25]
P-MFCOpuntia robusta 1 L of H2O/weekCeramic stickGraphite feltZinc sheet300.31 mW m−2[25]
P-MFCOpuntia joconostle 1 L of H2O/week Ceramic stickGraphite feltZinc sheet300.02 mW m−2[25]
PMFC (I)Oryza sativaTerracotta cylindersGraphite feltGraphite felt70 (10 weeks)9.1 mW m−2[26]
PMFC (II)Oryza sativaTerracotta cylindersGraphite feltGraphite felt70 (10 weeks)16.8 mW m−2 [26]
P-MFC1Amaranthus viridisNACarbons bristle brushesStainless steel alligator180185.23 ± 15.10 mA m−2[27]
P-MFC2Triticum aestivumNACarbons bristle brushesStainless steel alligator180291.23 ± 7.50 mA m−2[27]
P-MFCSpartina anglicaCEMGraphite rodsGraphite Felt1901.04 mW m−2[28]
P-MFCEAB (Chlamydomonas reinhardtii)PEMGraphite feltGraphite felt7–815.21 W m−3[56]
MFCSubstrate -Cattle dug)Nafion (117)Gold-graphiteGold-graphite301465 mW m−2 [57]
MFCNopalClay cupGraphite feltGraphite felt301841.99 mW m−3 [60]
P-MFCTypha orientalisNACarbon feltCarbon felt150137.12 ± 13.08 mV[61]
P-MFCOryza rufipogonNACarbon feltCarbon felt150350.50 ± 74.89 mV[61]
P-MFCOryza sativaNACarbon fiberCarbon fiber109700 mV[67]
P-MFC-1*SteviaClay cupGraphite feltStainless steel mesh306.28 ± 1.00 mW m−2This study
P-MFC-2SteviaClay cupGraphite feltStainless steel mesh3043.68 ± 3.05 mW m−2This study
P-MFC-3SteviaClay cupGraphite feltStainless steel mesh306.09 ± 0.05 mW m−2This study
P-MFC-4SteviaClay cupGraphite feltStainless steel mesh303.46 ± 0.03 mW m−2This study
AC—Activated carbon; PTFE—Polytetrafluoroethylene; MFC—Microbial fuel cell; PEM—Proton xxchange membrane; CEM—Cation xxchange membrane; EAB—Electrochemically active bateria; P-MFC—Plant microbial fuel cell; P-MFC-1*—Control.

3.2.3. Relationship between Power Generation and Plant Growth

The results of power and plant growth are presented in Figure 6. It can be observed that P-MFC-3 and P-MFC-4 showed highest power, respectively, at this stage of study. The power output found in those reactors were 0.42 and 3.02 mW, respectively. For the evaluation of the impact of power generation on plant’s height, it can be observed that this influenced plant growth during the operation of P-MFCs. Being P-MFC-4 the reactor with the highest power and plant height. However, the control plant turned to be the reactor with the lowest height value in this experiment. In contrast, previous studies demonstrated that the control plant turned out to be shorter in terms of height [11,25]. In addition, power generation had a significant effect on the number of roots, as well as on the length of the roots. According to Arulmani et al. [27] plant roots grow deeper in the anode compartment; this has been confirmed in this study. Furthermore, all of the plants grew on the P-MFC. The same phenomenon was observed by Sudirjo et al. [28]. It can be argued that the anode had a significant effect on the plant development process, because the presence of the anode in the plant’s rhizosphere attracts the microorganisms that participate in the plant’s nitrogen fixation process. Also, EC is a key factor in the absorption of nutrients by plants.

4. Conclusions

As can be noted, in this study P-MFCs embedded with Stevia rebaudiana were used to evaluate plant growth and bioelectricity production simultaneously. The results indicated that there were significant differences (p < 0.05) among the evaluated P-MFCs. P-MFC-2 inoculated with cow urine was revealed as the most effective reactor with regard to bioelectricity production. In turn, with respect to plant growth, the study indicated that the P-MFC system had a positive effect on plant morphology parameters; it influenced plant height, the number of shoots, length and number of roots. P-MFC-4 inoculated with sheep urine presented the greater average height of 50.08 ± 0.67 cm. Followed by P-MFC-3 (inoculated with goat urine) achieving the greatest mean stem diameter of 0.52 ± 0.01 cm, the higher average number of roots with a value of 86 ± 2.50 was reached in P-MFC-2 with cow urine. Higher average power density of 43.68 ± 3.05 mW m−2 was found in P-MFC-2 with cow urine. Overall, this study demonstrated that P-MFC inoculated with the livestock’s urine is a good option both to increase the amount of plant biomass and power generation.

Supplementary Materials

The following supporting information can be downloaded at: https://0-www-mdpi-com.brum.beds.ac.uk/article/10.3390/en15196985/s1, Figure S1a,b: (a) Sketch of the experiment with a total area of 19.6 m2, and (b) photograph of the established experiment. T0—absolute control (single plant); T1—P-MFC-1*; T2—P-MFC-2; T3—P-MFC-3, and T4—P-MFC-4; Figure S2a,b: Measurement of (a) root length and (b) the counting of the number of roots per plant.

Author Contributions

W.A.: Conceptualization, Methodology, Investigation, Formal analysis, Writing—original draft, Writing—review & editing. J.A.V.-C.: Conceptualization, Writing—review & editing. H.R.-F.: Writing—review & editing. J.F.G.-L.: Writing—review & editing. E.O.-S.: Formal analysis. V.A.M.-R.: Software, Data curation. R.A.O.-M.: Software, Data curation. S.-K.K.: Conceptualization, Methodology, Supervision, Writing—review & editing. A.I.L.-M.: Conceptualization, Methodology, Software, Writing—review & editing, Project administration, Funding acquisition, Supervision, Validation, Resources. All authors have read and agreed to the published version of the manuscript.

Funding

This research received no external funding.

Data Availability Statement

Not applicable.

Acknowledgments

WA extends his thanks for the Ph.D. grant from the National Council for Science and Technology (CONACYT, for its acronym in Spanish), as well as to the Autonomous University of Nuevo León (UANL, for its acronym in Spanish) through the Subdirectorate of Postgraduate Studies of the Faculty of Agronomy (FA-UANL, for its acronym in Spanish) for his acceptance in the Ph.D. Program. WA also thanks, very particularly, his Doctoral Thesis Committee. In addition, AIL-M and WA thank PAICYT (Programa de Apoyo a la Investigación Científica y Tecnológica)—(CT1519-21) from Autonomous University of Nuevo León for their support. KS-K would like to acknowledge the Technological Development and Innovation projects 2021/Federal Technological Institutes and Centers (TecNM). We are grateful to the anonymous reviewers who have devoted time and effort to reviewing our manuscript. Also, we thank the editors for considering our manuscript in this special issue.

Conflicts of Interest

The authors declare that they have no known competing financial interest or personal relationships that could have appeared to influence the work reported in this paper.

References

  1. Gao, C.; Liu, L.; Yang, F. Development of a novel proton exchange membrane-free integrated MFC system with electric membrane bioreactor and air contact oxidation bed for efficient and energy-saving wastewater treatment. Bioresour. Technol. 2017, 238, 472–483. [Google Scholar] [CrossRef] [PubMed]
  2. Gao, C.; Liu, L.; Yang, F. A novel bio-electrochemical system with sand/activated carbon separator, Al anode and bio-anode integrated micro-electrolysis/electro-flocculation cost effectively treated high load wastewater with energy recovery. Bioresour. Technol. 2018, 249, 24–34. [Google Scholar] [CrossRef] [PubMed]
  3. Chouler, J.; Padgett, G.A.; Cameron, P.J.; Preuss, K.; Titirici, M.M.; Ieropoulos, I.; Di Lorenzo, M. Towards effective small scale microbial fuel cells for energy generation from urine. Electrochim. Acta 2016, 192, 89–98. [Google Scholar] [CrossRef]
  4. Ho, N.A.D.; Babel, S.; Sombatmankhong, K. Bio-electrochemical system for recovery of silver coupled with power generation and wastewater treatment from silver(I) diammine complex. J. Water Process. Eng. 2018, 23, 186–194. [Google Scholar] [CrossRef]
  5. Daud, N.N.M.; Ahmad, A.; Yaqoob, A.A.; Mohamad-Ibrahim, M.N. Application of rotten rice as a substrate for bacterial species to generate energy and the removal of toxic metals from wastewater through microbial fuel cells. Environ. Sci. Pollut. Res. 2021, 28, 62816–62827. [Google Scholar] [CrossRef] [PubMed]
  6. Singh, A.; Kaushik, A. Removal of Cd and Ni with enhanced energy generation using biocathode microbial fuel cell: Insights from molecular characterization of biofilm communities. J. Clean. Prod. 2021, 315, 127940. [Google Scholar] [CrossRef]
  7. Zhang, J.; Cao, X.; Wang, H.; Long, X.; Li, X. Simultaneous enhancement of heavy metal removal and electricity generation in soil microbial fuel cell. Ecotoxicol. Environ. Saf. 2020, 192, 110314. [Google Scholar] [CrossRef]
  8. Ezziat, L.; Elabed, A.; Ibnsouda, S.; El Abed, S. Challenges of microbial fuel cell architecture on heavy metal recovery and removal from wastewater. Front. Energy Res. 2019, 7, 105. [Google Scholar] [CrossRef]
  9. Strik, D.P.B.T.B.; Hamelers, H.V.M.; Snel, J.F.H.; Buisman, C.J.N. Green electricity production with living plants and bacteria in a fuel cell. Int. J. Energy Res. 2008, 32, 870–876. [Google Scholar] [CrossRef]
  10. Helder, M.; Strik, D.P.B.T.B.; Hamelers, H.V.M.; Kuijken, R.C.P.; Buisman, C.J.N. New plant-growth medium for increased power output of the plant-microbial fuel cell. Bioresour. Technol. 2012, 104, 417–423. [Google Scholar] [CrossRef]
  11. Apollon, W.; Valera-Montero, L.L.; Perales-Segovia, C.; Maldonado-Ruelas, V.A.; Ortiz-Medina, R.A.; Gómez-Leyva, J.F.; Vázquez-Gutiérrez, M.A.; Flores-Benítez, S.; Kamaraj, S.K. Effect of ammonium nitrate on novel cactus pear genotypes aided by biobattery in a semi-arid ecosystem. Sustain. Energy Technol. Assess. 2022, 49, 101730. [Google Scholar] [CrossRef]
  12. Shi, Y.; Pan, Y.; Xiang, L.; Zhu, Z.; Fu, W.; Hao, G.; Geng, Z.; Chen, S.; Li, Y.; Han, D. Assembly of rhizosphere microbial communities in Artemisia annua: Recruitment of plant growth-promoting microorganisms and inter-kingdom interactions between bacteria and fungi. Plant Soil 2022, 470, 127–139. [Google Scholar] [CrossRef]
  13. Rusyn, I. Role of microbial community and plant species in performance of plant microbial fuel cells. Renew. Sust. Energ. Rev. 2021, 152, 111697. [Google Scholar] [CrossRef]
  14. Apollon, W.; Luna-Maldonado, A.I.; Kamaraj, S.K.; Vidales-Contreras, J.A.; Rodríguez-Fuentes, H.; Gómez-Leyva, J.F.; Aranda-Ruíz, J. Progress and recent trends in photosynthetic assisted microbial fuel cells: A review. Biomass Bioenergy 2021, 148, 106028. [Google Scholar] [CrossRef]
  15. Maddalwar, S.; Nayak, K.K.; Kumar, M.; Singh, L. Plant microbial fuel cell: Opportunities, challenges, and prospects. Bioresour. Technol. 2021, 341, 125772. [Google Scholar] [CrossRef]
  16. Sayed, E.T.; Abdelkareem, M.A.; Obaideen, K.; Elsaid, K.; Wilberforce, T.; Maghrabie, H.M.; Olabi, A.G. Progress in plant-based bioelectrochemical systems and their connection with sustainable development goals. Carbon Resour. Convers. 2021, 4, 169–183. [Google Scholar] [CrossRef]
  17. Kabutey, F.T.; Zhao, Q.; Wei, L.; Ding, J.; Antwi, P.; Quashie, F.K.; Wang, W. An overview of plant microbial fuel cells (PMFCs): Configurations and applications. Renew. Sust. Energy Rev. 2019, 110, 402–414. [Google Scholar] [CrossRef]
  18. Kabutey, F.T.; Ding, J.; Zhao, Q.; Antwi, P.; Quashie, F.K. Electrical current generation from a continuous flow macrophyte biocathode sediment microbial fuel cell (mSMFC) during the degradation of pollutants in urban river sediment. Environ. Sci. Pollut. Res. 2020, 27, 35364–35380. [Google Scholar] [CrossRef] [PubMed]
  19. Bombelli, P.; Dennis, R.J.; Felder, F.; Cooper, M.B.; Madras Rajaraman Iyer, D.; Royles, J.; Harrison, S.T.; Smith, A.G.; Harrison, C.J.; Howe, C.J. Electrical output of bryophyte microbial fuel cell systems is sufficient to power a radio or an environmental sensor. R. Soc. Open Sci. 2016, 3, 160249. [Google Scholar] [CrossRef] [PubMed]
  20. Rusyn, I.B.; Hamkalo, K. Electro-biosystems with Mosses on Green Roofs. Environ. Res. Eng. Manag. 2020, 76, 20–31. [Google Scholar] [CrossRef] [Green Version]
  21. Wetser, K.; Dieleman, K.; Buisman, C.; Strik, D. Electricity from wetlands: Tubular plant microbial fuels with silicone gas-diffusion biocathodes. Appl. Energy 2017, 185, 642–649. [Google Scholar] [CrossRef]
  22. Timmers, R.A.; Strik, D.P.B.T.B.; Hamelers, H.V.M.; Buisman, C.J.N. Electricity generation by a novel design tubular plant microbial fuel cell. Biomass Bioenergy 2013, 51, 60–67. [Google Scholar] [CrossRef]
  23. Tapia, N.F.; Rojas, C.; Bonilla, C.A.; Vargas, I.T. Evaluation of Sedum as driver for plant microbial fuel cells in a semi-arid green roof ecosystem. Ecol. Eng. 2017, 108, 203–210. [Google Scholar] [CrossRef]
  24. Rusyn, I.B.; Medvediev, O.V.; Valko, B.T. Enhancement of bioelectric parameters of multi-electrode plant–microbial fuel cells by combining of serial and parallel connection. Int. J. Environ. Sci. Technol. 2021, 18, 1323–1334. [Google Scholar] [CrossRef]
  25. Apollon, W.; Kamaraj, S.K.; Silos-Espino, H.; Perales-Segovia, C.; Valera-Montero, L.L.; Maldonado-Ruelas, V.A.; Vázquez-Gutiérrez, M.A.; Ortinz-Medina, R.A.; Flores-Benítez, S.; Gómez-Leyva, J.F. Impact of Opuntia species plant bio-battery in a semi-arid environment: Demonstration of their applications. Appl. Energy 2020, 279, 115788. [Google Scholar] [CrossRef]
  26. Kumar, V.K.; Manmohan, K.; Sreelakshmi, P.M.; Manju, P.; Gajalakshmi, S. Resource recovery from paddy field using plant microbial fuel cell. Process Biochem. 2020, 99, 270–281. [Google Scholar] [CrossRef]
  27. Arulmani, S.R.B.; Gnanamuthu, H.L.; Kandasamy, S.; Govindarajan, G.; Alsehli, M.; Elfasakhany, A.; Pugazhendhi, A.; Zhang, H. Sustainable bioelectricity production from Amaranthus viridis and Triticum aestivum mediated plant microbial fuel cells with efficient electrogenic bacteria selections. Process Biochem. 2021, 107, 27–37. [Google Scholar] [CrossRef]
  28. Sudirjo, E.; Buisman, C.J.N.; Strik, D.P.B.T.B. Activated carbon mixed with marine sediment is suitable as bioanode material for Spartina anglica sediment/plant microbial fuel cell: Plant growth, electricity generation, and spatial microbial community diversity. Water 2019, 11, 1810. [Google Scholar] [CrossRef]
  29. Cid, C.A.; Stinchcombe, A.; Ieropoulos, I.; Hoffmann, M.R. Urine microbial fuel cells in a semi-controlled environment for onsite urine pre-treatment and electricity production. J. Power Sources 2018, 400, 441–448. [Google Scholar] [CrossRef]
  30. Gajda, I.; Obata, O.; Greenman, J.; Ieropoulos, I.A. Electroosmotically generated disinfectant from urine as a by-product of electricity in microbial fuel cell for the inactivation of pathogenic species. Sci. Rep. 2020, 10, 5533. [Google Scholar] [CrossRef] [Green Version]
  31. Apollon, W.; Luna-Maldonado, A.I.; Kamaraj, S.-K.; Vidales-Contreras, J.A.; Rodríguez-Fuentes, H.; Gómez-Leyva, J.F.; Maldonado-Ruelas, V.A.; Ortiz-Medina, R.A. Self-Sustainable Nutrients Reutilization Associated to Electricity Generation from Plant Microbial Fuel Cells. SETA-D-22-00449. SSRN 2022. [Google Scholar] [CrossRef]
  32. Papazoglou, E.G. Arundo donax L. stress tolerance under irrigation with heavy metal aqueous solutions. Desalination 2007, 211, 304–313. [Google Scholar] [CrossRef]
  33. Helder, M.; Strik, D.P.B.T.B.; Hamelers, H.V.M.; Kuhn, A.J.; Blok, C.; Buisman, C.J.N. Concurrent bio-electricity and biomass production in three plant-microbial fuel cells using Spartina anglica, Arundinella anomala and Arundo donax. Bioresour. Technol. 2010, 101, 3541–3547. [Google Scholar] [CrossRef] [PubMed]
  34. Haile, A.; Ayalew, T.W. Comparative study on the effect of bio-slurry and inorganic N-fertilizer on growth and yield of kale (Brassica oleracea L.). Afr. J. Plant Sci. 2018, 12, 81–87. [Google Scholar] [CrossRef]
  35. Chaka, B.A.; Osano, A.M.; Maghanga, J.M.; Magu, M.M. Optimization of bioslurry-available plant nutrients using T. brownii and Acanthaceae spp. Biocatal. Adv. Agric. 2020, 2020, 4526485. [Google Scholar] [CrossRef]
  36. Luo, F.L. Personal Communication; ICG-3; Research Center Jülich: Jülich, Germany, 2009. [Google Scholar]
  37. Swales, A.; MacDonald, I.T.; Green, M.O. Influence of wave and sediment dynamics on cordgrass (Spartina anglica) growth and sediment accumulation on an exposed intertidal flat. Estuaries 2004, 27, 225–243. [Google Scholar] [CrossRef]
  38. Angelini, L.G.; Ceccarini, L.; Nassi o Di Nasso, N.; Bonari, E. Comparison of Arundo donax L. and Miscanthus × giganteus in a long-term field experiment in Central Italy: Analysis of productive characteristics and energy balance. Biomass Bioenergy 2008, 33, 635–643. [Google Scholar] [CrossRef]
  39. Koretsky, C.M.; Haveman, M.; Cuellar, A.; Beuving, L.; Shattuck, T.; Wagner, M. Influence of spartina and juncus on saltmarsh sediments. I. Pore Water Geochemistry. Chem. Geol. 2008, 255, 87–99. [Google Scholar] [CrossRef]
  40. Yadav, A.N.; Kour, D.; Ahluwalia, A.S. Soil and phytomicrobiomes for plant growth and soil fertility. Plant Sci. Today 2021, 8, 1–5. [Google Scholar] [CrossRef]
  41. Lu, T.; Ke, M.; Lavoie, M.; Jin, Y.; Fan, X.; Zhang, Z.; Fu, Z.; Sun, L.; Gillings, M.; Peñuelas, J.; et al. Rhizosphere microorganisms can influence the timing of plant flowering. Microbiome 2018, 6, 3. [Google Scholar] [CrossRef] [Green Version]
  42. Inthama, P.; Pumas, P.; Pekkoh, J.; Pathom-aree, W.; Pumas, C. Plant growth and drought tolerance-promoting bacterium for bioremediation of Paraquat pesticide residues in agriculture soils. Front. Microbiol. 2021, 12, 604662. [Google Scholar] [CrossRef]
  43. Fan, K.; Weisenhorn, P.; Gilbert, J.A.; Chu, H. Wheat rhizosphere harbors a less complex and more stable microbial co-occurrence pattern than bulk soil. Soil Biol. Biochem. 2018, 125, 251–260. [Google Scholar] [CrossRef]
  44. Hassan, M.K.; McInroy, J.A.; Jones, J.; Shantharaj, D.; Liles, M.R.; Kloepper, J.W. Pectin-rich amendment enhances soybean growth promotion and nodulation mediated by Bacillus velezensis strains. Plants 2019, 8, 120. [Google Scholar] [CrossRef]
  45. Disi, J.O.; Mohammad, H.K.; Lawrence, K.; Kloepper, J.; Fadamiro, H. A soil bacterium can shape belowground interactions between maize, herbivores and entomopathogenic nematodes. Plant Soil 2019, 437, 83–92. [Google Scholar] [CrossRef]
  46. Olanrewaju, O.S.; Glick, B.R.; Babalola, O.O. Mechanisms of action of plant growth promoting bacteria. World J. Microbiol. Biotechnol. 2017, 33, 197. [Google Scholar] [CrossRef]
  47. Jarma-Orozco, A.; Combatt-Caballero, E.; Jaraba-Navas, J. Growth and development of Stevia rebaudiana Bert. in high and low levels of radiation. Curr. Plant Biol. 2020, 22, 100144. [Google Scholar] [CrossRef]
  48. Kafle, G.G.; Midmore, D.J.; Gautam, R. Effect of nutrient omission and pH on the biomass and concentration and content of steviol glycosides in stevia (Stevia rebaudiana (Bertoni) Bertoni) under hydroponic conditions. J. Appl. Res. Med. Aromat. Plants 2017, 7, 136–142. [Google Scholar] [CrossRef]
  49. Mahajan, M.; Sharma, S.; Kumar, P.; Pal, P.K. Foliar application of KNO3 modulates the biomass yield, nutrient uptake and accumulation of secondary metabolites of Stevia rebaudiana under saline conditions. Ind. Crop. Prod. 2020, 145, 112102. [Google Scholar] [CrossRef]
  50. Syed, Z.; Sonu, K.; Sogani, M. Cattle manure management using microbial fuel cells for green energy generation. Biofuels Bioprod. Biorefin. 2021, 16, 460–470. [Google Scholar] [CrossRef]
  51. Ahuja, A.; Kumar, P.C.; Verma, A.; Tanwar, R.S. Antimicrobial activities of cow urine against various bacterial strains. Int. J. Adv. Pharm. Res. 2012, 2, 84–87. [Google Scholar]
  52. Bertram, J.E. Effects of Cow Urine and Its Constituents on Soil Microbial Populations and Nitrous Oxide Emissions. Ph.D. Thesis, Lincoln University, Lincoln, New Zealand, 2009. Available online: https://hdl.handle.net/10182/1334 (accessed on 20 August 2022).
  53. Bol, R.; Petersen, S.O.; Christofides, C.; Dittert, K.; Hansen, M.N. Short-term N2O, CO2, NH3 fluxes, and N/C transfers in a Danish grass-clover pasture after simulated urine deposition in autumn. J. Plant Nutr. Soil Sci. 2004, 167, 568–576. [Google Scholar] [CrossRef]
  54. Rossi, R.; Jones, D.; Myung, J.; Zikmund, E.; Yang, W.; Gallego, Y.A.; Logan, B.E. Evaluating a multi-panel air cathode through electrochemical and biotic tests. Water Res. 2019, 148, 51–59. [Google Scholar] [CrossRef] [PubMed]
  55. Li, J.; Liu, G.; Chen, D.; Li, C.; Liang, D.; Wang, F.; Wu, J.; He, W.; Yu, Y.; Feng, Y. Enhanced microbial electrochemical systems performance by optimizing the “anode-collector” collection mode: From enhancement mechanism to construction atrategy. ACS EST Engg. 2022, 2, 263–270. [Google Scholar] [CrossRef]
  56. Sharma, A.; Chhabra, M. Performance evaluation of a photosynthetic microbial fuel cell (PMFC) using Chlamydomonas reinhardtii at cathode. Bioresour. Technol. 2021, 338, 125499. [Google Scholar] [CrossRef]
  57. Kaur, G.; Brar, Y.S.; Kaur, J.; Gupta, A.; Sharma, K.K.; Nima Khalilpoor, N. Management of cattle dung and novel bioelectricity generation using microbial fuel cells: An Ingenious experimental approach. Int. J. Chem Eng. 2021, 2021, 5536221. [Google Scholar] [CrossRef]
  58. Xu, F.; Sun, R.; Wang, H.; Wang, Y.; Liu, Y.; Jin, X.; Kong, Q. Improving the outcomes from electroactive constructed wetlands by mixing wastewaters from different beverage-processing industries. Chemosphere 2021, 283, 131203. [Google Scholar] [CrossRef] [PubMed]
  59. Xu, D.; Xiao, E.-R.; Xu, P.; Zhou, Y.; Zhou, Q.-H.; Xu, D.; Wu, Z.-B. Effects of influent organic loading rates and electrode locations on the electrogenesis capacity of constructed wetland-microbial fuel cell systems. Environ. Prog. Sustain. Energy 2017, 36, 435–441. [Google Scholar] [CrossRef]
  60. Sathish-Kumar, K.; Rivera, A.E.; Murugesan, S.; García-Mena, J.; Maya, O.; Frausto- Reyes, C.; Tapia-Ramírez, J.; Silos-Espino, H.; Caballero-Briones, F. Electricity generation from Nopal biogas effluent using a surface modified clay cup (cantarito) microbial fuel cell. Heliyon 2019, 5, e01506. [Google Scholar] [CrossRef]
  61. Tongphanpharn, N.; Chou, C.-H.; Guan, C.-Y.; Yu, C.-P. Plant microbial fuel cells with Oryza rufipogon and Typha orientalis for remediation of cadmium contaminated soil. Environ. Technol. Innov. 2021, 24, 102030. [Google Scholar] [CrossRef]
  62. Harshitha, G.; Sahoo, A.; Sethy, R. Bioelectricity generation from different biomass feed at anode chamber and to study process parameters in microbial fuel cells. Biocatal. Agric. Biotechnol. 2019, 20, 101191. [Google Scholar] [CrossRef]
  63. Hassan, S.H.; Zohri, A.E.N.A.; Kassim, R.M. Electricity generation from sugarcane molasses using microbial fuel cell technologies. Energy 2019, 178, 538–543. [Google Scholar] [CrossRef]
  64. Yaqoob, A.A.; Mohamad Ibrahim, M.N.; Umar, K.; Bhawani, S.A.; Khan, A.; Asiri, A.M.; AlAmmari, A.M. Cellulose derived graphene/polyaniline nanocomposite anode for energy generation and bioremediation of toxic metals via benthic microbial fuel cells. Polymers 2021, 13, 135. [Google Scholar] [CrossRef]
  65. Li, Z.; Haynes, R.; Sato, E.; Shields, M.; Fujita, Y.; Sato, C. Microbial community analysis of a single chamber microbial fuel cell using potato wastewater. Water Environ. Res. 2014, 86, 324–330. [Google Scholar] [CrossRef] [PubMed]
  66. Sato, C.; Paucar, N.E.; Chiu, S.; Mahmud, M.Z.I.M.; Dudgeon, J. Single-Chamber Microbial Fuel Cell with Multiple Plates of Bamboo Charcoal Anode: Performance Evaluation. Processes 2021, 9, 2194. [Google Scholar] [CrossRef]
  67. Moqsud, M.A.; Hannan, M.A.; Omine, K. Assessment of factors influencing bioelectricity generation in paddy plant microbial cells. Glob. Adv. Res. J. Agric. Sci. 2015, 4, 840–850. [Google Scholar]
  68. Kuleshova, T.E.; Gall’, N.R.; Galushko, A.S.; Panova, G.G. Electrogenesis in plant–microbial fuel cells in parallel and series connections. Tech. Phys. 2021, 66, 496–504. [Google Scholar] [CrossRef]
Figure 1. Effect of P-MFC on Stevia rebaudiana growth parameters: (a) plant height (cm); (b) number of shoots; (c) stem diameter (cm). Means with the same letter for each figure is statistically equal (Tukey, p < 0.05).
Energies 15 06985 g001
Figure 2. Impact of the P-MFC on the Stevia rebaudiana rhizosphere: (a) root length (cm), and (b) number of roots during the study. Means with the same letter for each figure are statistically equal (Tukey, p < 0.05).
Energies 15 06985 g002aEnergies 15 06985 g002b
Figure 3. Results of (a) polarization curves, and (b) power–density curves were performed during the experiment.
Energies 15 06985 g003
Figure 4. Current–density and power–density curves in (a) P-MFC-2, (b) P-MFC-1*, (c) P-MFC-3, (d) P-MFC-4, and (e) control reactors for 30 days. Note: CD—current–density; PD—power–density.
Energies 15 06985 g004aEnergies 15 06985 g004b
Figure 5. Current values obtained during the 30 days of the monitoring of reactors (a) P- MFC-2, (b) P-MFC-1*, (c) P-MFC-3, (d) P-MFC-4, and (e) Control.
Energies 15 06985 g005aEnergies 15 06985 g005b
Figure 6. Plant height vs. power generation in the evaluated P-MFC.
Energies 15 06985 g006
Publisher’s Note: MDPI stays neutral with regard to jurisdictional claims in published maps and institutional affiliations.

