Article

Multi-Criteria Decision-Making Problem for Energy Storage Technology Selection for Different Grid Applications

1
CIDETEC, Basque Research and Technology Alliance (BRTA), Po. Miramón 196, 20014 Donostia-San Sebastián, Spain
2
Fundación CIRCE, Parque Empresarial Dinamiza, Avenida Ranillas 3-D, 1st Floor, 50018 Zaragoza, Spain
3
POLYMAT, University of the Basque Country, UPV/EHU, Avda. Tolosa 72, 20018 Donostia-San Sebastián, Spain
*
Author to whom correspondence should be addressed.
Submission received: 21 September 2022 / Revised: 10 October 2022 / Accepted: 11 October 2022 / Published: 15 October 2022
(This article belongs to the Section D: Energy Storage and Application)

Abstract

:
Grid stability and supply security need to be maintained when generation and consumption mismatches occur. A potential solution to this problem could be using Energy Storage Technologies (EST). Since many alternatives exist, appropriate technology selection becomes a key challenge. Current research focuses on ranking and selecting the most suitable technology, regardless of the grid services to be provided. In this study, a multi-criteria decision making (MCDM) problem is formulated considering fifteen selection criteria and the opinions of five energy storage experts groups. Literature and expert consultation data have been converted to triangular fuzzy (TF) numbers to cope with ambiguity and heterogeneity and eighteen technologies have been ranked applying the Technique for Order Preference by Similarity to Ideal Solution (TOPSIS) method. The proposed method has been implemented on a software tool and assessed in four representative microgrid services of interest for the ENERISLA Project. The results show that pump hydro storage is the most suitable EST for frequency regulation, time shifting and seasonal storage applications, while flywheels best suit inertial response. It is concluded that the proposed methodology provides an intuitive framework for EST selection under multi-agent uncertainty and different grid application scenarios.

1. Introduction

In order for the increase in global temperature to remain below 1.5 °C, it is essential to reach carbon neutrality by 2050. Renewable energy is a keystone if we want to achieve the decarbonization of the sector [1]; it would bring lots of benefits but will also put a lot of stress on electric grids, mainly due to its intermittent and non-controllable nature [2]. New, flexible service providers will be needed to maintain the electric grid’s balance, safety, and reliability [3]. Energy Storage Systems (ESS) will be one of the principal providers of flexibility services. ESS can be installed “behind the meter”, this is, directly in consumers’ homes, or “in front of the meter”, controlled by the DSO [4], or hybridized in Renewable Generation Power Plants to make production profiles more stable and reliable [5].
The increase in renewable energy production will also mean an increase in distributed generation. ESS will be essential if an energy community wants to be able to function on its own [6]. Renewable Energy Sources (RES) like wind and solar are optimal for distributed generation, whereas conventional energy resources such as nuclear, thermal, or hydro must be centralized due to the size of their respective production plants. To reach energy independence in distributed systems, renewable generation must be combined with ESS to match production and demand curves [7]. This is the only task of ESS. Maintaining power quality, this is, maintaining frequencies and voltages within limits, cannot be done exclusively by renewable production. Services such as black start, congestion avoidance, uninterruptible power supply (UPS), and inertia, among others, are flexibility services that can be provided by ESS, making electric grids safer and more reliable while maintaining good power quality [8].
Currently, many grid services and technologies coexist, making EST selection a complex problem. In fact, several decision makers participate in these processes, providing heterogeneous evaluations and different perceptions on the relevance of selection criteria. For this reason, different approaches have been used to identify the most suitable technology. In this regard, MCDM problems represent an alternative to considering all the aforementioned factors and their inherent fuzziness. MCDM are widely used methods in the energy storage field and, specifically, for EST selection. In [9], the most appropriate hydrogen EST for Turkey was selected based on expert opinions and a literature review. In that case, a Buckley extension based fuzzy Analytical Hierarchical Process (Fuzzy-AHP) and linear normalization based fuzzy Grey Relational Analysis combined MCDM methodology was used. Similarly, in [10], the most suitable EST based on certain storage requirements was selected for Shanxi Province. This was done by combining probabilistic dual hesitant fuzzy sets (PHDFS) and a MCDM problem which was solved using a distance-based method. An integrated MCDM model consisting of the Delphi, Analytic Hierarchy Process (AHP) and VIsekriterijumska Optimizcija I Kompromisno Resenje (VIKOR) methods has been proposed to evaluate EST alternatives for Turkey under a hesitant fuzzy environment [11]. In [12], Multi-Attribute Value Theory (MAVT) was applied to assess benefits from EST, focusing on the importance of local priorities for decision-making. The authors of [13] proposed a fuzzy multi-criteria method to compare different heat transfer fluids to assess the feasibility of utilizing molten salt as a storage in concentrated solar plants (CSP). A decision-making method based on PDHFS was constructed based on Einstein norm operators, and the results were compared to those of other studies [14]. Kim et al. provided a literature review of MCDM approaches for sustainable energy planning [15]. All in all, it can be stated that the combination of MCDM approaches and fuzzy numbers to select and rank EST is widely covered in the literature. Nonetheless, the requirements imposed by specific grid services and the question of how EST meet them have not been tackled to date. In fact, grid service requirements like response time, discharge time or number of cycles are crucial aspects that EST need to address. As a consequence, the present paper proposes an intuitive methodology for MCDM problem solving based on TF numbers and the TOPSIS method that considers specific grid service requirements that need to be met by EST. The main contributions of this study are: (1) considering the specific requirements of each grid service and the capability degree of an EST of providing it; (2) defining a ready-to-use methodology to quantify the fuzziness of evaluations and homogenizes gathered information for straightforward implementation on a simulation tool; and (3) considering a wider range of EST, especially among battery storage technologies.
This paper is structured as follows: in Section 2, energy storage technologies and applications are described. Evaluation criteria for technology selection under different grid applications are presented in Section 3. Section 4 focuses on describing the proposed methodology, and Section 5 details the results obtained from applying such a methodology to different grid application scenarios. In Section 6, the conclusions are presented.

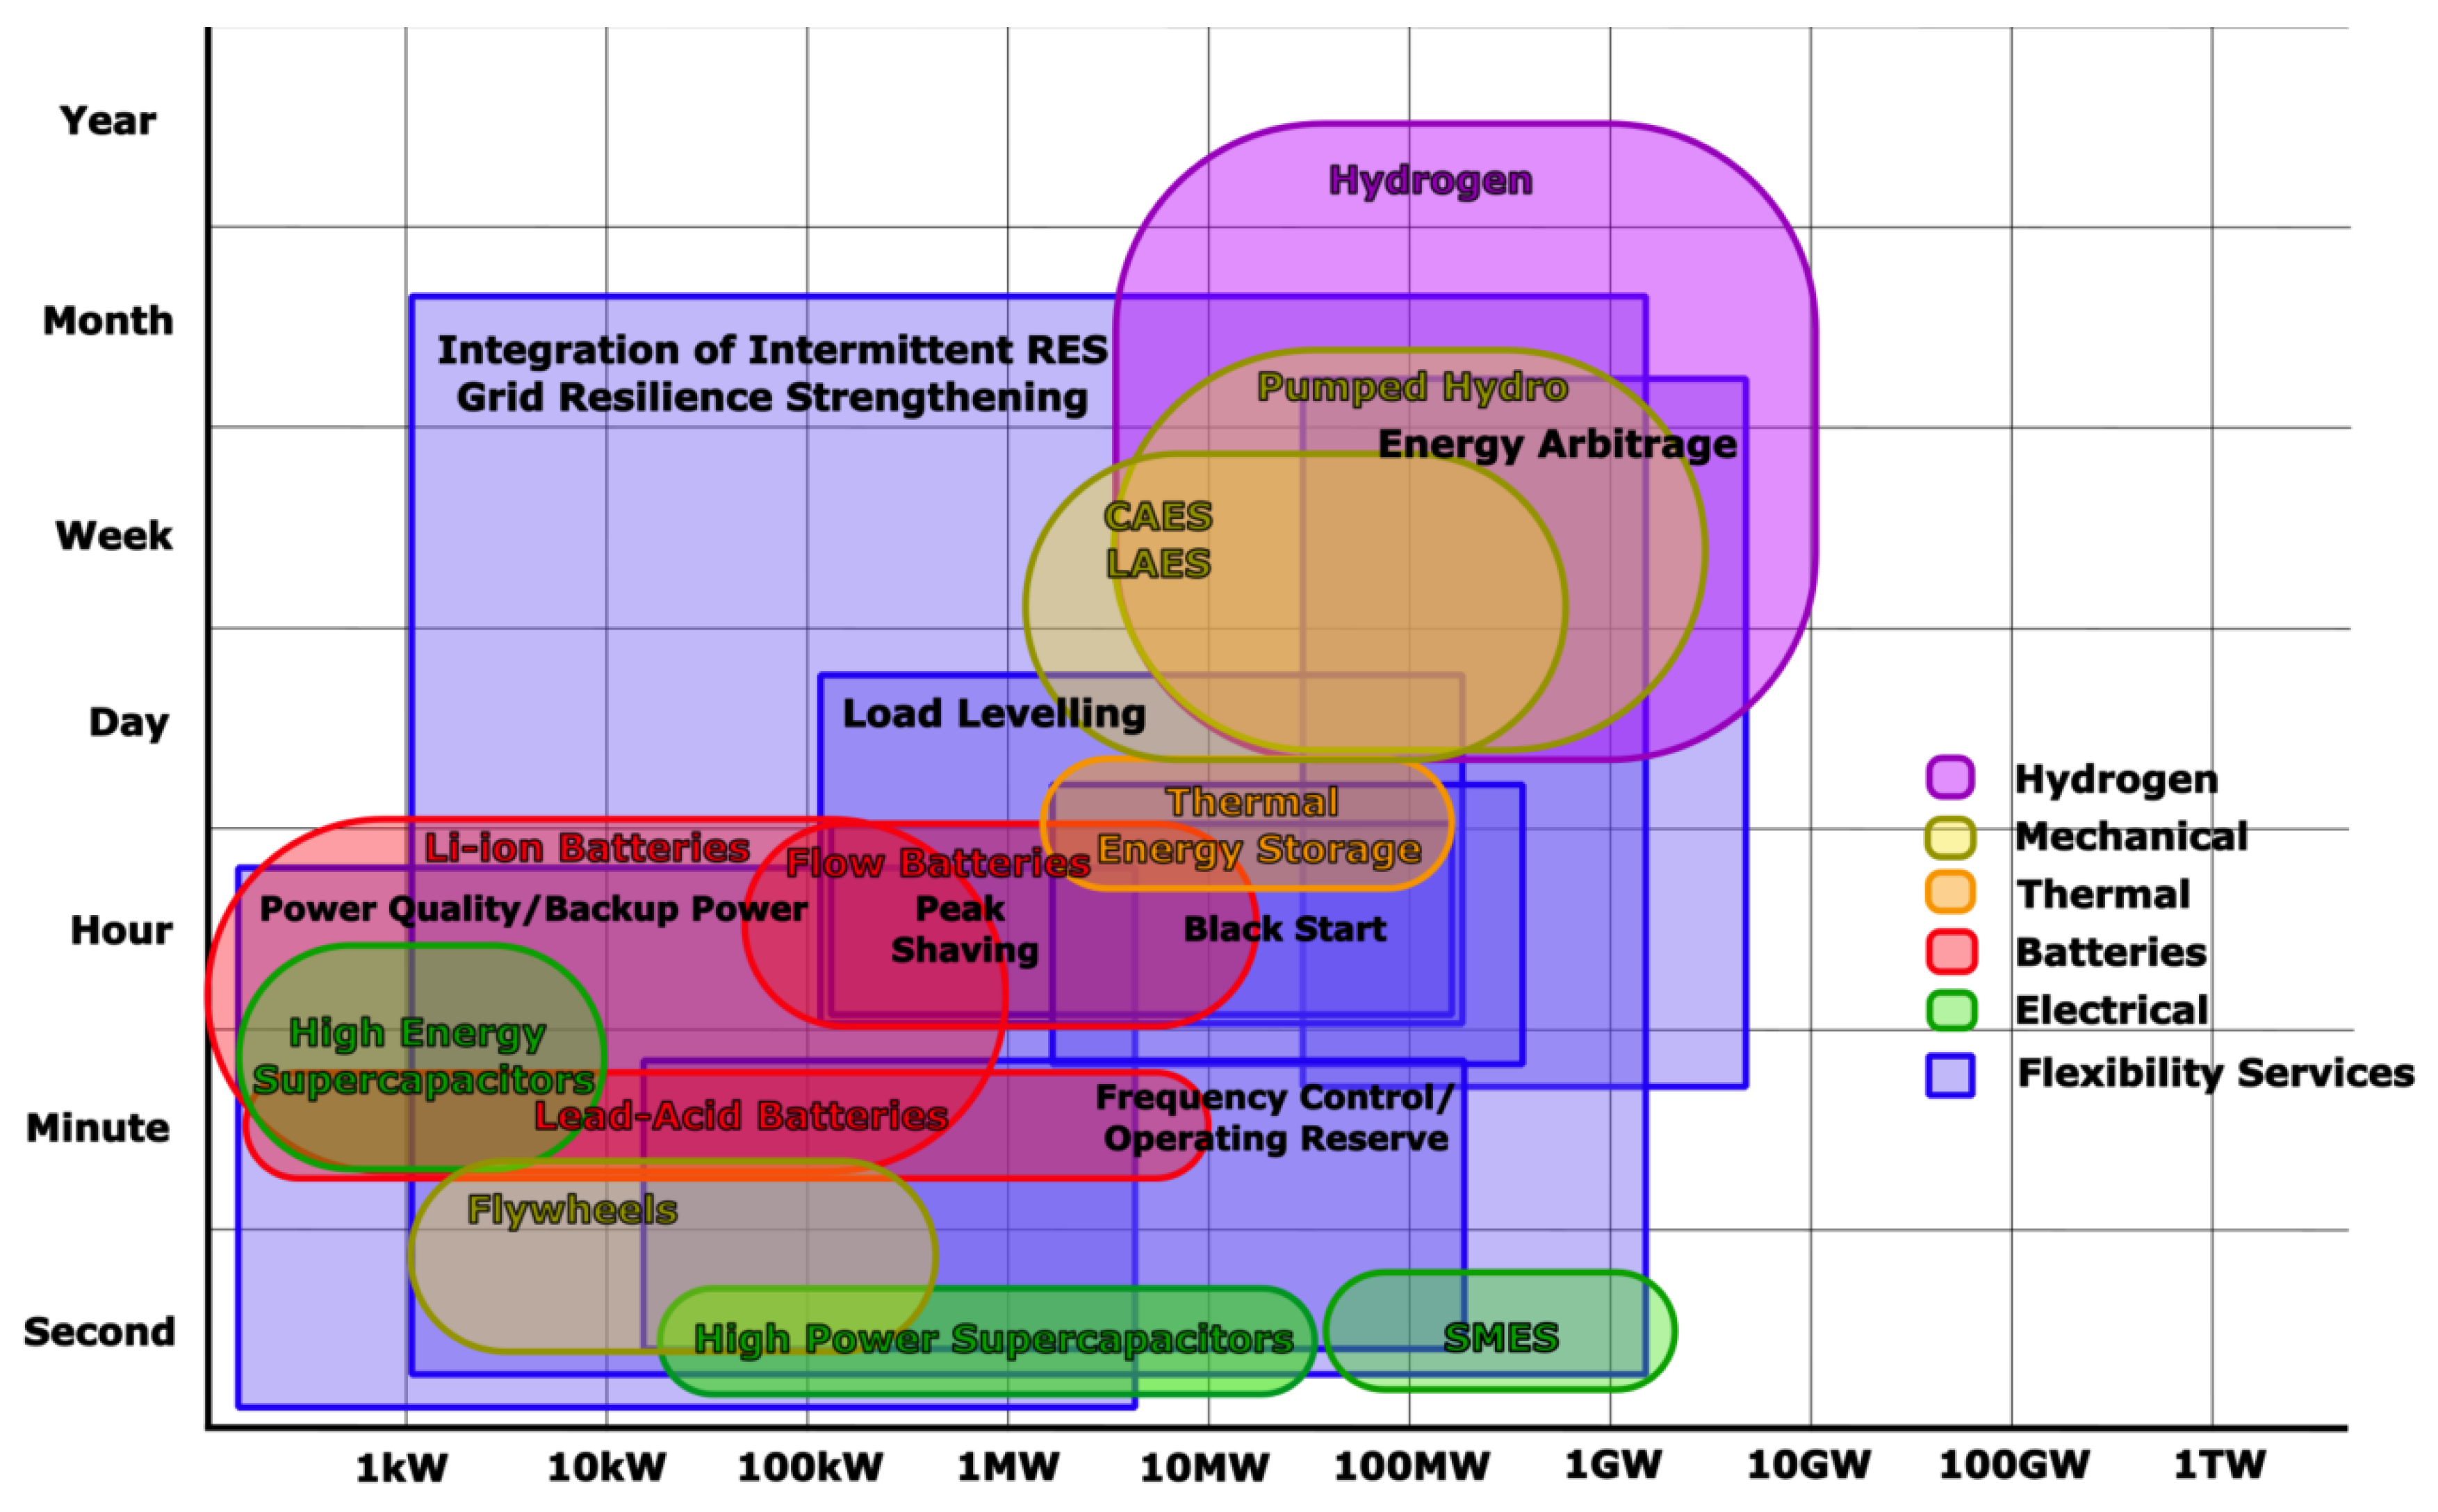
2. Energy Storage Technologies and Applications

2.1. Energy Storage Technologies

Energy storage technologies can be classified according to different parameters like response time, storage duration, or storage method [16]. Nonetheless, the most common classification is based on the storage method [17]. In this regard, energy storage technologies are divided into mechanical, electrical, chemical, electrochemical, and thermal systems.
Currently, the highest global installed storage capacity belongs to mechanical energy storage, accounting for 86,2% of the total ~209,4 GW capacity. Within this category, pumped hydro storage (PHS), compressed air energy storage (CAES), and flywheel energy storage (FES) technologies are highlighted [18]. Electrical energy storage comprises different types of capacitors and superconducting magnetic energy storage (SMES), but these technologies represent a small percentage of the total installed capacity, according to [18]. Chemical energy storage is mainly based on hydrogen but also on natural gas technologies. Installed electrochemical storage accounts for about 13.1 GW of capacity; it is based on different battery types such as lead-acid (LA), lithium-ion (Li-ion), nickel-cadmium (Ni-Cd), high temperature, or flow batteries [18]. As to high temperature batteries, sodium-sulfur (NaS) batteries are the most widespread [18]. Among flow batteries, vanadium redox flow (VRFB) is the most mature alternative [19], but zinc-bromine redox flow batteries (ZnRFB) are also a promising technology. Nonetheless, alternatives which are suitable for longer duration applications such as zinc-air batteries (Zn-air) are being developed. The present study considers eighteen technologies, divided into the abovementioned five categories:
  • Mechanical storage:
    • Pumped Hydro Energy Storage [20]: One form of storing mechanical energy is pumped hydropower storage. It comprises two water reservoirs at different altitudes that can produce power by passing off water through a turbine when it is discharged from the upper to the lower reservoir. This process is repeated for many cycles; therefore, electrical power is required to pump water back to the upper reservoir (recharge).
    • Compressed Air Energy Storage [21]: Compressed air energy storage (CAES) facilities are comparable to pumped-hydro power plants. However, in a CAES plant, ambient air or another gas is compressed and stored under pressure in an underground cavern or container instead of pumping water from a lower to an upper pond during times of extra power. When electricity is needed, heated and expanded air is used to power a generator via an expansion turbine.
    • Flywheel Energy Storage [22]: Flywheels have the attributes of high cycle and long operational life, high round-trip efficiency, high power density, and low environmental impact. A FES consists of a spinning rotor, motor, generator, bearings, a power electronics interface, and containment. The energy stored in a flywheel is defined by the rotor shape and material; electricity is produced by taking advantage of the rotational kinetic energy.
  • Electrical storage:
    • Supercapacitors [23]: In contrast to batteries, supercapacitors (SC) can deliver energy at higher power output and have a larger capacity for energy storage than conventional capacitors. These features, along with their high cyclability and long-term stability, make them a great energy storage technology.
    • Superconducting Magnetic Energy Storage [24]: In SMES, energy is stored in a magnetic field produced by direct current flowing through a superconducting coil that has been cryogenically cooled to a temperature below its superconducting critical temperature. The system is composed of a superconducting coil, a power conditioning system, and a cryogenically cooled refrigerator. Once charged, the superconducting coil current will not degrade, allowing for endless magnetic energy storage.
  • Chemical storage:
    • Hydrogen Energy Storage [25]: Hydrogen technologies are showing great potential in terms of lower energy costs for consumers/prosumers, better quality and security of supply, and lower emissions. Hydrogen can provide flexibility with different technologies, mainly electrolyzers, hydrogen storage, Power to Gas, hydrogen-powered boilers, and fuel cells.
    • Fuel Cells [26]: A fuel cell generates electricity cleanly and effectively by utilizing the chemical energy of hydrogen or other fuels. Electricity, water, and heat are the only by-products if hydrogen is the fuel. In terms of the variety of applications they could be used for, fuel cells are exceptional.
  • Electrochemical storage:
    • Battery Energy Storage Systems [27]: Batteries can convert chemical energy and store it as electricity by means of internal electrochemical reactions. Lithium-ion (Li-ion), sodium-sulfur (NaS), nickel-cadmium (NiCd), nickel-metal hydride, lead acid (LA), and flow batteries stand out among the different types of batteries. Remarkable differences can be highlighted between types regarding energy density, efficiency, or cycle lifetime, but their main advantage over other EST is their scalability [8]. As for Li-ion, lithium iron phosphate (LFP), lithium nickel manganese cobalt (NMC), lithium nickel cobalt aluminum oxide (NCA), lithium titanate oxide (LTO) or lithium manganese oxide (LMO) are the most widely used compounds. Among flow batteries, vanadium redox (VRFB) or zinc bromine redox flow batteries (ZnRFB) are the most promising technologies.
  • Thermal Energy Storage (sensible and latent heat storage) [28]: TES allows the temporary storage of thermal energy at low or high temperatures by cooling or heating (in a thermal reservoir/tank) in a determined period. The advantages of TES systems include their low carbon footprint, energy demand, system maintenance costs, and power capital costs, as well as their flexibility.

2.2. Energy Storage Applications

Flexibility is a concept which is inherent to electrical systems. The International Smart Grid Action Network (ISGAN), after reviewing multiple definitions in the literature, defined flexibility as the “ability of electrical systems to manage changes”. Traditionally, flexibility has been provided mainly by flexible thermal generation and hydraulic power plants to keep the two basic characteristics of the electrical grid constant: frequency and voltage.
Electricity systems are undergoing a paradigm shift with a high penetration of intermittent renewable generation. This new scenario requires new flexibility mechanisms. These mechanisms are understood to be aimed at covering the needs of the electrical system. They can be those focused on voltage control, congestion solution, balancing services, controlled island operation, service restoration, etc. [29].
In our study, four flexibility services have been selected: frequency regulation and inertial response for short-duration applications; time shifting for medium-duration applications; and seasonal storage for long-duration applications. More flexibility services are further explained in [30], and in [31], some International Flexibility Innovation Projects are described.
To gather all the data needed for the selected methodology, an extensive review of the EST literature was undertaken, focused on the technical, economic, environmental, and social characteristics of each EST and its ability to provide certain flexibility services to the grid. Characteristics such as rated power, energy and power density, discharge time, or response time, among others, are studied.
Review papers have been extremely useful to reduce the data gathering process. In [32], an extensive review of EST and their characteristics was presented. Additionally, the paper gives examples of EST which are currently in operation or under development. Other studies, such as [33], provide a very visual review of different EST characteristics using graphs to compare them. Furthermore, this paper provides an overview of some of the problems with existing EST and identifies some promising technologies. A discussion of the operational impact of different EST, i.e., environmental and implementation impacts, as well as detailed classification, is presented in [34].
Apart from the EST characteristics comparison, some other studies [17] have focused on techno-economic and life cycle analyses of EST and comparisons among them. Some others [16] used analyses of the characteristics to provide an overview of optimal EST placement, sizing, and operation, and gave recommendations for requirements or procedures.
For the tool developed in this paper, it was necessary to review not only EST characteristics but also how these EST could provide flexibility services. A review of the role of EST in the ancillary services of a microgrid (MG) is provided in [7]. In this study, flexibility services are explained, especially ancillary services, and a classification of each EST’s ability to provide them is presented. Several pilot energy storage projects and their applications are also described. A similar review has been done in [8], although this time, the paper focused more on key factors, issues, and challenges for the development of EST in future MG applications. A guide for future research directions considering EST impacts on future power systems is given in [19]. That paper also highlights the potential application fields of EST research prototypes based on their architectures, capacities, and operation characteristics. Another extensive review of current and potential electrical EST options for various applications, with their specifications, is presented in [35]. This time, the paper focuses more on where EST would be suited for integration into power generation and distribution systems.
More flexibility service providers will be needed as electric grids tend to have more non-controllable renewable generation sources and distributed systems. The use of EST to mitigate RES fluctuations is studied in [36]. That paper identifies key ESTs and provides an updated review of the literature on ESTs and their application potential in the renewable energy sector. In [37], a simple probabilistic method was developed to predict the ability of energy storage to increase the penetration of intermittent renewable generation. In that paper, different ESTs are compared for their operational suitability over different time scales for the connection of wind generators at locations where they would be limited by the voltage rise.
Although the previously mentioned papers were the most relevant, some other articles describing situations where EST provides flexibility services were also studied. In [38], frequency regulation was provided by a dual controller of a hydropower plant on El Hierro Island. This isolated power system consisted of a hybrid wind pumped-storage hydropower plant and diesel generators. Simulation results showed that the frequency never exceeded the regulation limits thanks to the hydro-pump EST. Frequency support is studied in different articles with different EST. Battery energy storage systems (BESS) are studied in [39]. Four types of BESS, i.e., LA, Li-Ion, NaS, and NiCd, are analyzed in a techno-economic analysis focused on frequency support services. In [40], a study compares the main SoC restoration strategies of grid-scale BESS. It aimed to define which ones were suitable for guaranteeing the reliability of the provision and return on investment. The utilization of EST to improve the frequency response of a low inertia power system was explored in [41]. A methodology was developed to calculate the needed size of EST to provide ancillary services, and it was tested in four different simulation scenarios.
BESS has a wide range of uses, not only for frequency support. In [42], Li-ion, Zn-Air and Redox Flow BESS were installed to solve voltage deviations and congestion problems in a simulated grid in the first scenario. In the second scenario, these BESS were used for Peak Shaving and Energy Shifting services. Controlled island operation or black start services can also be provided by BESS, as shown in [43], where the performance of BESS is evaluated during grid-connected, black start, and islanded operating modes to control the frequency and voltage deviations in the simulated grid. Another report [44] described optimal active and reactive power compensation on a continuously loaded power system using BESS. By adopting a voltage stability evaluation model, the power compensation was able to maintain voltage values inside its operational range.
The increase in RES will bring about a reduction in the physical inertia that traditional generators have. In [45], a novel analytical approach for sizing ESTs to provide inertial support to the grid and maintain frequency stability was proposed. This paper studied not only physical but also virtual inertia, increasing the range of EST that can provide this service. Another issue of RES is the grid congestion which can occur in cases of generation surplus. Pumped hydro storage could help to relieve this congestion, as explained in [46].
In Figure 1, the rated power and discharge time of each EST and the requirements for different flexibility services are paired.
As shown, massive EST like hydrogen, CAES, or PHS are placed in top-right of the figure, meaning that they are suitable for longer duration applications like arbitrage or seasonal RES integration. In contrast, small-scale EST like FES, SC, or FES are more attractive for fast response and short-duration applications. Moreover, in bridging applications like frequency control or load levelling, a wider variety of EST can be used, including battery technologies like Li-ion, LA, or redox flow technologies.
All the data gathered in this section are summarized in Table A1 in Appendix A. The table shows, with a set of colors, the ability of each of the studied ESS to provide different flexibility services.

3. Evaluation Criteria for Energy Storage Technologies
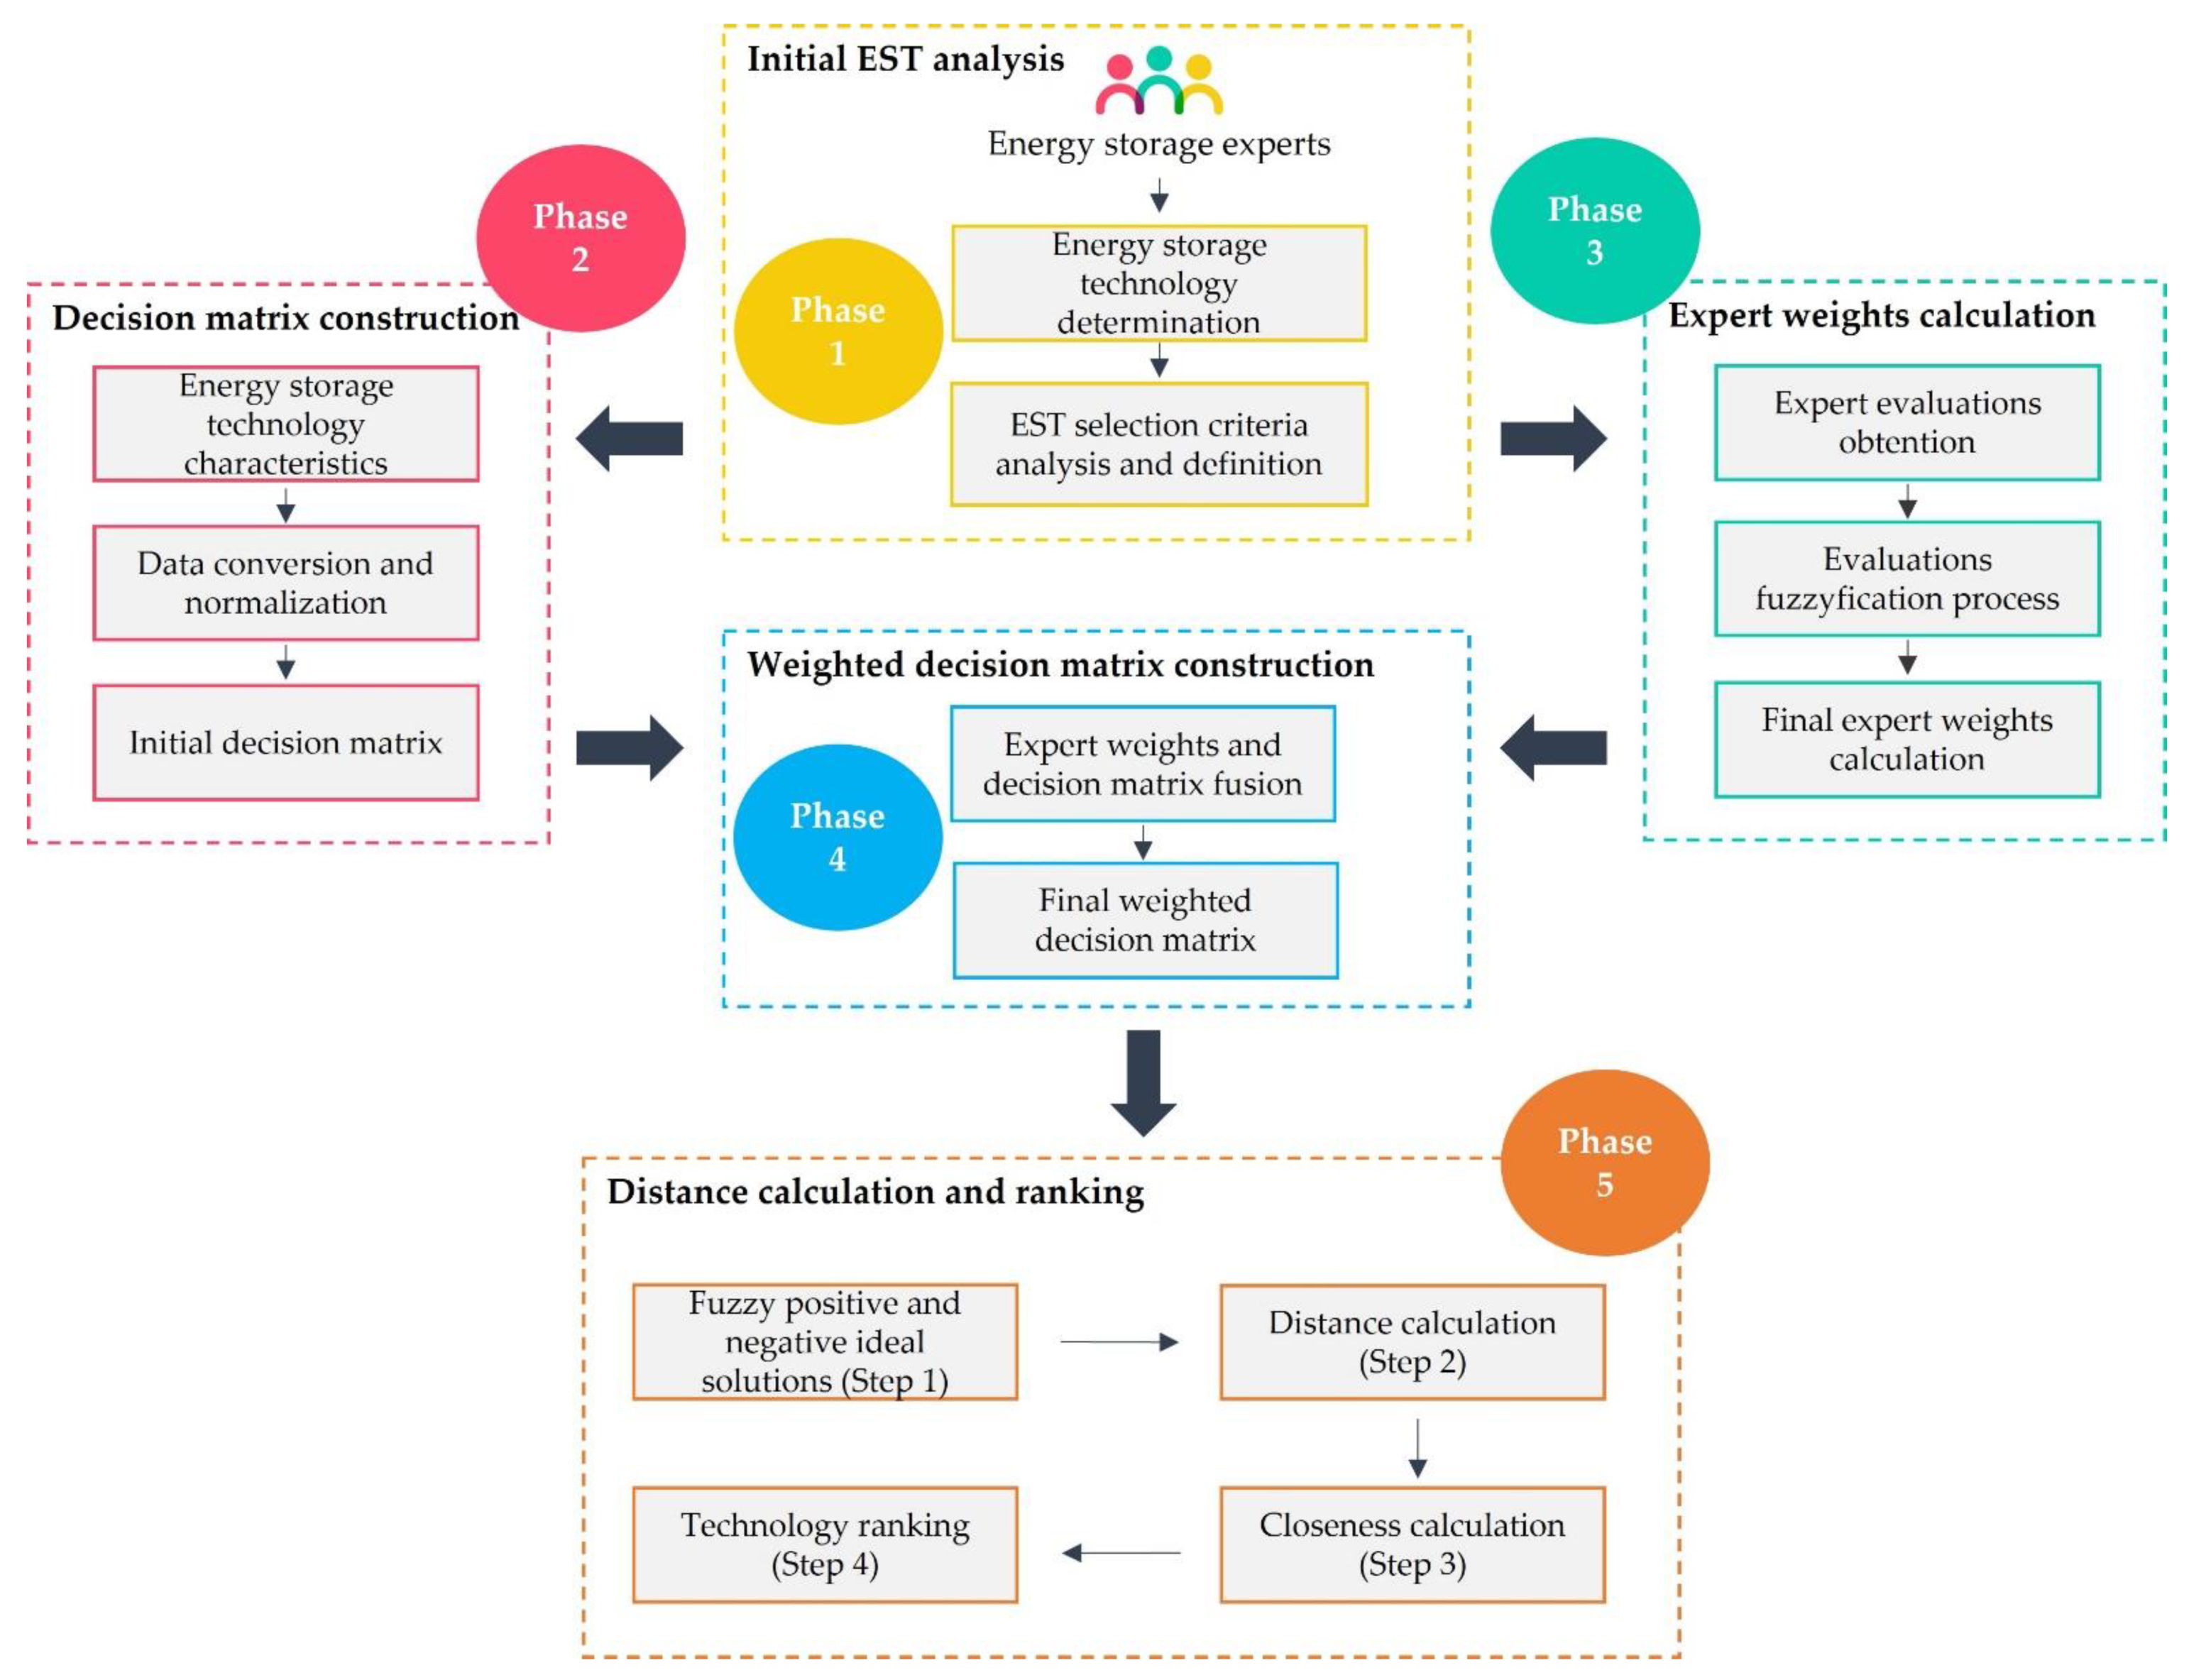
For appropriate EST technology selection, it is necessary to define the most relevant influencing factors for a given application. These factors need to cover the different areas that ESS projects could have an influence on or benefit from, i.e., a multidisciplinary approach needs to be considered. Therefore, some key technical, economic, environmental, and social parameters will be considered. From a technical perspective, the following representative criteria are considered: rated power, roundtrip efficiency, response time, cycle lifetime, discharge time at power rating, maturity level, and self-discharge losses. The technology is thoroughly analyzed, since many characteristics stand out as key aspects depending on the selected grid application of the EST. Among economic factors, power capital cost, energy capital cost, operation and maintenance (O&M) cost and maturity level have been considered. These factors are used to measure not only the initial capital expenditure of each EST, but also the total cost over the whole lifetime. Moreover, power and energy capital costs are considered so that alternatives can be better distinguished for power and/or energy applications. Social and environmental factors include social acceptance level and overall environmental impact indicators, respectively. These two indicators could be represented more in detail by utilizing factors like CO2 intensity, resource consumption, job creation, or government incentive. Nonetheless, these values vary widely depending on the consulted sources and, in some cases, even on the country/region. The considered evaluation criteria for ESS technology selection are represented in Table 1:
Given the selected criteria for the EST selection MCDM problem, in this paper, storage is applied to stationary grid applications. In this regard, renewable generation support services, transmission and distribution grid services, ancillary services, and customer-side services have been considered. Subsequently, the value ranges of the evaluation criteria are shown in Table A2 and Table A3 in Appendix B.

4. Methodology

ESS technology selection is a complex problem requiring evaluations from several decision makers and consideration of different criteria, the relevance of which can be perceived in different ways. Moreover, as presented in the previous section, several EST may be selected, and their suitability varies depending on the application. For this reason, a MCDM problem for EST selection is presented in this section. First, to represent human decision-making ambiguity, the Triangular Fuzzy (TF) number concept is introduced for decision maker evaluations. Then, decision-making matrix data conversion and normalization processes are presented as part of Phase 2 of the proposed methodology. Next, criteria weights and their conversion to TF numbers are described (Phase 3). The decision-making matrix and expert weights are merged in Phase 4. Last, an EST comparative analysis and technology ranking steps are presented. In our research, the TF-based Technique for Order Preference by Similarity to Ideal Solution (TF-TOPSIS) method was applied since it has been considered the most suitable distance-based method (Phase 5). The proposed decision-making process is shown in Figure 2.

4.1. Fuzzy Numbers and Triangular Fuzzy Numbers

Fuzzy numbers were introduced by Zadeh [48] to avoid uncertain information loss which typically exists during evaluation processes. In fact, decision makers are used to give information in terms of fuzzy numbers and intervals. Several variants of fuzzy sets like Hesitant Fuzzy Sets (HFS), Triangular Fuzzy Sets (TFS), or Probabilistic Dual Hesitant Fuzzy Sets (PDHFS) have been developed and utilized in MCDM problems since then.
Triangular fuzzy numbers are one of the most popular fuzzy number types [49]. Moreover, the value of fuzzy linguistic terms is best denoted by TF numbers, according to [50]. These numbers are essentially represented by three points, as follows:
X ˜ = ( l , m , u ) ,
where l and u represent the lower and upper bounds of the fuzzy number, respectively, and m is the optimal value. The numbers represent the degree of fuzziness; therefore, the larger the interval, the higher the degree of fuzziness of the number.
Representation can be provided by means of membership functions, μ ( x ) , as shown below:
μ ( x ) = { 0 ,     x < l x l m l ,       l x m u x u m ,       m x u 0 ,     x > u    
Let A ˜ = ( l 1 , m 1 , u 1 ) and B ˜ = ( l 2 , m 2 , u 2 ) be two triangular fuzzy numbers. The following equations present some basic calculations:
A ˜   B ˜ = ( l 1 + l 2 , m 1 + m 2 , u 1 + u 2 )
A ˜   B ˜ = ( l 1 l 2 , m 1 m 2 , u 1 u 2 )
A ˜     B ˜ = ( l 1 × l 2 , m 1 × m 2 , u 1 × u 2 )
A ˜   B ˜ = ( l 1 l 2 , m 1 m 2 , u 1 u 2 )

4.2. Data Conversion and Normalization (Phase 2)

In MCDM problems, it is common to collect three types of data: intervals, crisp numbers, and linguistic terms. These values need to be transformed into fuzzy type numbers before distance measurement and comparative analysis execution. With this aim, the following approach was considered in the present study, similar to [10]:
(1)
Intervals
Many EST characteristics are usually provided as interval values; for instance, roundtrip efficiency or cost-related values. Intervals comprise a lower ( a i j l ) and an upper bound ( a i j u ) which represent the minimum and maximum value for such a characteristic, respectively. An interval value can be defined as a i j = ( a i j l , a i j u ) . Therefore, before transforming these values, they need to be normalized by:
Normalized   interval :   a * i j = ( a ¯ i j l , a ¯ i j u )
a ¯ i j l = a i j l i = 1 m ( ( a i j l 2 ) + ( a i j u 2 ) ) ,   a ¯ i j u = a i j u i = 1 m ( ( a i j l 2 ) + ( a i j u 2 ) )
After that, the midpoint of the normalized interval values is calculated. To this end, interval values are converted to crisp numbers so that a n   x   z matrix is obtained, where z is the number of ESS criteria and n the number of experts involved in the MCDM problem.
(2)
Crisp numbers
Some other values can be provided as crisp numbers. In this case, data are simply normalized before converting them to TF numbers, since the units of the values may differ. Equation (9) shows how the normalization of crisp numbers has been carried out:
a * i j = a i j i = 1 m ( a i j 2 )
(3)
Linguistic terms
Many ESS characteristics are roughly quantifiable, and as such, are usually expressed in linguistic terms like high, medium, or low. For instance, this could be the case of criteria like the environmental impact or the social acceptance level. Such linguistic terms need to be converted to crisp numbers before being normalized and converted to TF numbers. To achieve this, a numerical equivalency needs to be established for each of the linguistic terms. In this case, a seven-level division was utilized, similarly to the authors of [11]. Table 2 represents the linguistic term transformation process adopted in the present paper:
Once all data have been converted and normalized, the decision-making matrix is constructed ( D m ). The dimensions of the matrix are n   x   z , and it corresponds to a crisp number for each criterion and technology (see Equation (10)). Therefore, it is necessary to apply decision maker weights and convert such normalized crisp numbers to TF numbers. The following section presents the criteria weight calculation method and the fuzzification process.
D m = ( a 11 a 12 a 1 j a 1 t a 21 a 22 a 2 j a 2 t a k 1 a k 2 a k j a k t a z 1 a z 2 a z j a z t ) ,   k = 1 , 2 , ,   z ,     j = 1 ,   2 ,   , t
where t is the number ESS technologies or alternatives and z is the number of evaluation criteria.

4.3. Criteria Weights and Fuzzification Process (Phase 3)

Criteria weights represent how much a given evaluation criterion should be considered, i.e., how relevant an evaluation factor is for the given MCDM problem. These weights are calculated by the evaluation experts participating in the EST selection problem. The evaluation process was carried out by collecting expert opinions through questionnaires that could be implemented in the EST selection tool, with no need for modifications. This tool was developed in the Visual Basic for Application (VBA) environment in order to ease decision-making information insertion and user interaction. Experts usually have different opinions and expertise areas within an EST framework. Therefore, to cope with ambiguity and vagueness in the decision-making problem, TF numbers were utilized to quantify the expert evaluations. An example of an evaluation expert or decision maker criteria weight matrix ( W m ) is presented below:
W m = ( w 11 w 12 w 1 j w 1 n w 21 w 22 w 2 j w 2 n w k 1 w k 2 w k j w k n w z 1 w z 2 w z j w z n ) ,   k = 1 , 2 , ,   z ,     j = 1 ,   2 ,   , n
where z is the number of evaluation criteria and n the number of experts.
Expert evaluations are gathered as linguistic terms; hence, it is necessary to convert them into TF numbers by utilizing a number scale. Therefore, W m , which is an n   x   z matrix, had to be converted to TF format, i.e., to a 3 n   x   z matrix. For the present EST selection problem, the following fuzzy number scale for linguistic terms was used (see Table 3). The proposed number scale had different interval widths to gather the different fuzziness degree of linguistic terms. In fact, intermediate linguistic terms had a wider interval, since they are considered to have a higher inherent fuzziness compared to boundary terms like “no importance” or “absolute importance”, which are usually more precise and provide much clearer information.
The resulting TF decision maker criteria weight matrix would be as follows:
W m T F = ( [ w 11 l   w 11 m w 11 u ] [ w 12 l   w 12 m w 12 u ] [ w 1 n l   w 1 n m w 1 n u ] [ w 21 l   w 21 m w 21 u ] [ w 22 l   w 22 m w 22 u ] [ w 2 n l   w 2 n m w 2 n u ] [ w z 1 l   w z 1 m w z 1 u ] [ w z2 l   w z2 m w z2 u ] [ w z n l   w z n m w z n u ] )
Next, the TF decision maker criteria weight matrix needs to be aggregated so as to have a triangular fuzzy number for each evaluation criteria for its later multiplication with the normalized decision matrix.
W m T F a g g = ( w 1 l   w 1 m w 1 u w 2 l w 2 m w 2 u w z l w z m w z u )

4.4. Weighted Decision Matrix Construction (Phase 4)

Finally, the aggregated criteria weight matrix ( W m T F _ a g g ) is multiplied by the normalized decision matrix ( D m ). The resulting matrix already considers decision maker evaluations for each of the EST decision-making criteria. Hence, it is later used for distance measurements and technology ranking.

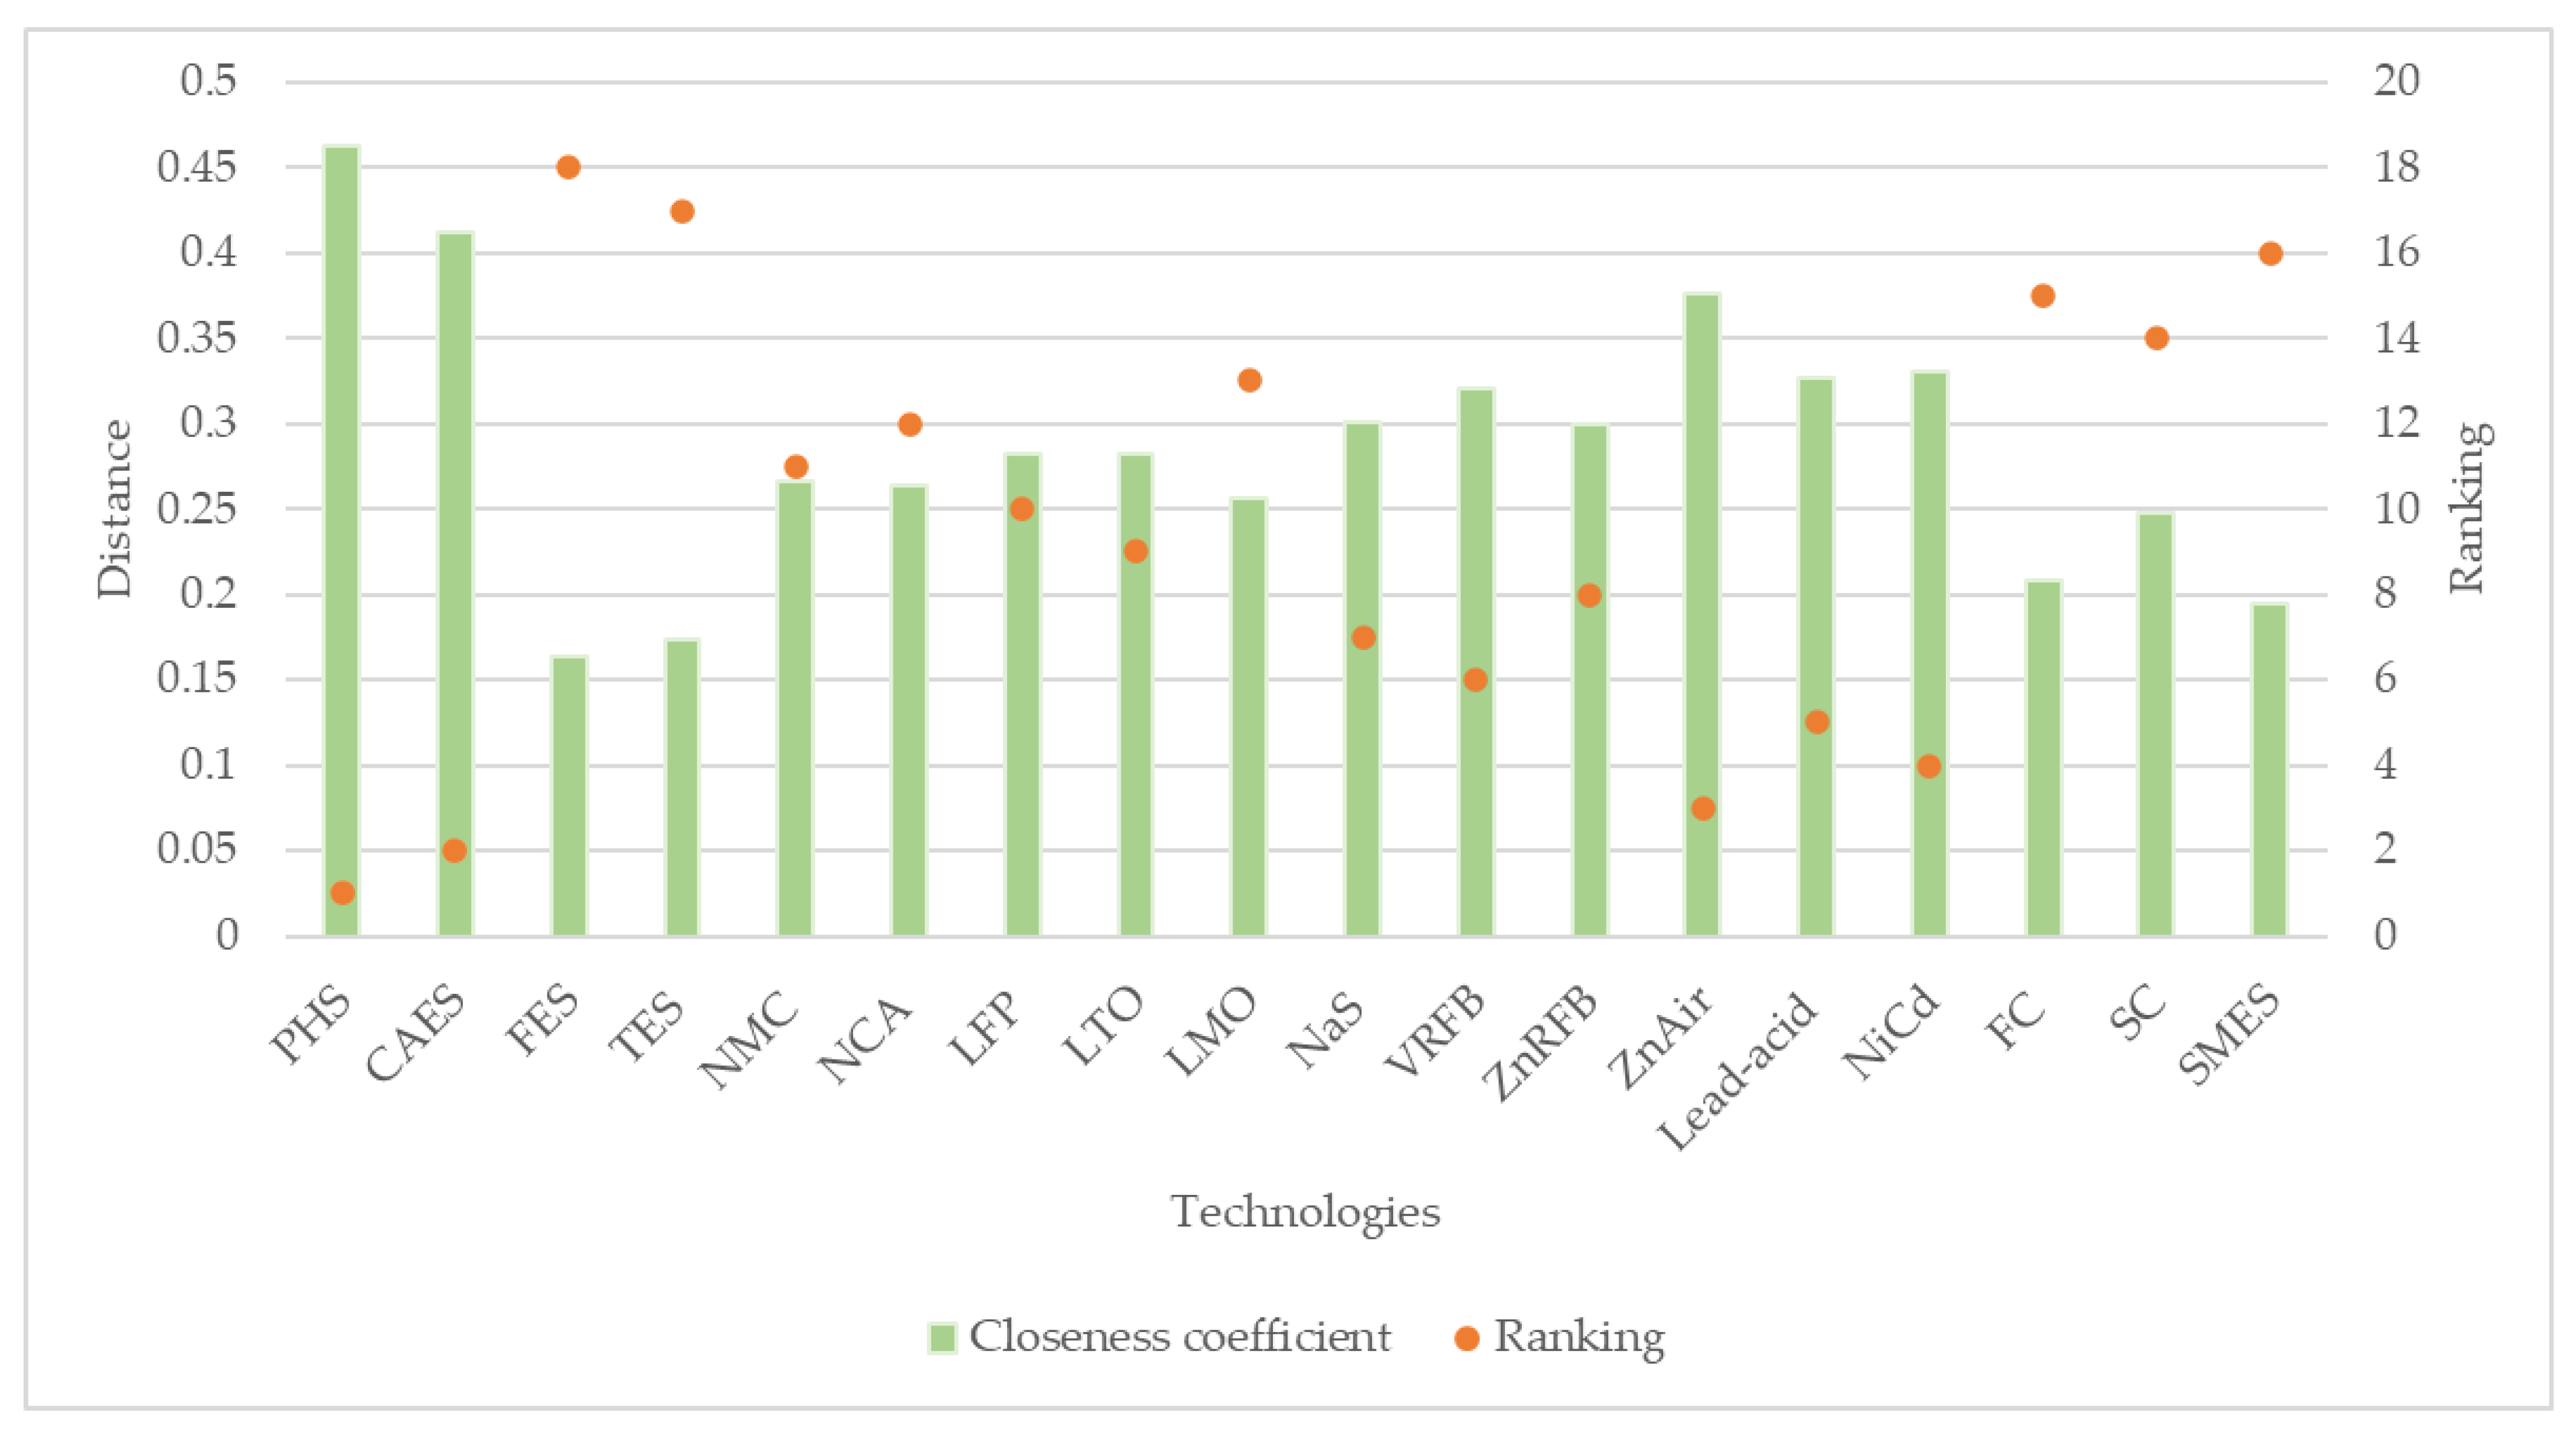
4.5. Comparative Analysis and Ranking (Phase 5)

Different distance-based methods have been developed for MCDM problems aiming to calculate the closeness of a given alternative to an ideal solution based on different approaches. Some commonly used methods are the VIKOR method, developed by Opricovic [51], and the TOPSIS method, introduced by Hwang and Yoon [52]. For all of them, the smaller the distance, the closer the ESS technology is to the target and, therefore, the better it meets the requirements set by decision-makers. In the present methodology, the TOPSIS method was selected as a suitable distance-based method for ESS selection. A brief literature analysis of MCDM studies for technology ranking is provided in Table 4.
The steps of the TF-TOPSIS method are as follows:
Step 1: Fuzzy positive ( F P I S ,   A + ) and negative ( F N I S , A ) ideal solutions are determined for each selection criteria. For that, Equations (14) and (15) are used:
A + = { h 1 + , h 2 + , , h n + } (Fuzzy positive ideal solution, F P I S )
being
h j + = i = 1 m h i j = γ 1 j h 1 j , , γ m j h m j     m a x { γ 1 j , , γ m j }   j = 1 ,   2 ,   ,   n
A = { h 1 , h 2 , , h n } (Fuzzy negative ideal solution, F N I S )
being
h j = i = 1 m h i j = γ 1 j h 1 j , , γ m j h m j     m i n { γ 1 j , , γ m j }   j = 1 ,   2 ,   ,   n
It should be noted that, in this step of the process, it is necessary to differentiate between benefit/positive and cost/negative type of criteria. The FPIS of cost/negative criteria would be the minimum, since it is aimed to minimize costs, and negative criteria should be minimized. In contrast, A + and A are calculated the opposite way.
Step 2: Separation measures ( D i + and D i ) from positive and negative ideal solutions are calculated by determining the Euclidean distance of each TF alternative. For this, the following formulas, as presented by Chen [54], were utilized:
D i + = 1 3 · j = 1 n ( h i j h j + ) 2
D i = 1 3 · j = 1 n ( h i j h j ) 2
Step 3: The closeness coefficient values ( C C i ) for each of the ESS alternatives were calculated using Equation (18).
C C i = D i D i + D i +
The C C i represents the similarity to the worst solution of each alternative, with 0 being the alternative with the least distance (worst condition) and 1 the most distant one (best condition).
Step 4: ESS alternatives are ranked according to their C C i values. Hence, the higher the value, the more suitable the alternative.

5. Case Study

In this section, the results obtained from applying the proposed methodology to the ENERISLA project are presented. In ENERISLA, different energy storage technologies are assessed for different microgrid applications. Eighteen EST were considered in terms of four main criteria which were divided into fifteen sub-criteria. The criteria and technologies were selected after a comprehensive literature analysis and a posterior energy storage expert discussion (Phase 1).
As for the applications for EST, four key grid services were selected. First, a fast response application, i.e., inertial response, was evaluated. Secondly, two bridging applications, i.e., frequency regulation and time-shifting, were selected. Then, the best energy storage technology for seasonal storage remained to be determined. In this way, the proposed methodology can be assessed for a wide spectrum of EST applications.
Once the criteria, technologies, and applications had been determined, five groups of experts became involved. These researchers and engineers were experienced in EST and smart grid applications. Expert opinions were gathered using questionnaires to determine criteria weights. Their evaluations were received in linguistic terms, and therefore, were converted into TF numbers, as shown in Section 5.

5.1. Decision Matrix Construction (Phase 2)

As shown in Figure 2, Phase 2 of the methodology is focused on constructing the decision-making matrix. For that, the EST data gathered during the literature review and expert discussion were used. In this regard, data in the form of interval numbers and linguistic terms were synthesized following the methodology described in Section 5.2.
Regarding interval numbers, the midpoint of the normalized lower and upper bounds was defined as the decision-making value. Regarding the linguistic terms, Table 2 was utilized for further quantification and homogenization of energy storage technology characteristics. Response time and maturity level were converted to crips numbers. The response time characteristic was divided into four categories: <milliseconds (<ms), milliseconds (ms), seconds (s), and minutes (min). Maturity level was considered using a five-level classification (developing, demonstration, commercialized, mature, and very mature). The overall environmental impact and social acceptance level characteristics were considered using the null to absolute linguistic term scale represented in Table 2. The decision-making matrix is presented in Table A4 in Appendix C.

5.2. Expert Weights Calculation (Phase 3)

Expert weights were calculated by means of the fuzzification of the information gathered during expert evaluations. This information was collected in form of linguistic terms using questionnaires. This phase comprised three main steps: first, expert evaluation obtention; second, the evaluation fuzzification process using Table 3; and third, final expert weight calculation by aggregating the resulting TF numbers. The aggregated expert criteria weights for the analyzed scenarios are shown in Table 5.

5.3. Weighted Decision Matrix Construction (Phase 4)

Before distance calculation and EST ranking, the weighted decision matrixes had to be constructed. For each scenario, this was done by multiplying each expert criteria weights matrix by the normalized decision matrix, as described in Section 4.3. Therefore, this matrix gathered expert evaluations and decision matrix data, i.e., the results from Phases 2 and 3 were fused.

5.4. Distance Calculation and Ranking (Phase 5)

The distance calculation was done using Equations (16)–(18). For Scenario 1 (inertial response), the EST distance and ranking results are shown in Figure 3. As shown, the higher the closeness coefficient, the closer the EST is to the target or most suitable alternative, and thus, the better it can comply with application requirements. In this scenario, FES appears to be the most suitable EST. In fact, the closeness coefficient was more than two times higher than the one of the second-best EST, SC (0.472 and 0.272, respectively). Moreover, all battery technologies, SMES, and SC, were considered as technologies capable of providing this service, albeit by means of virtual inertia mechanisms implemented in power electronics and/or control devices. Therefore, since these mechanisms are not as mature as the physical inertia provided by conventional synchronous generators, the obtained C C i was lower. Aiming to take such aspects into consideration, a final adjustment was made to the obtained closeness coefficient values, since the proposed methodology did not consider the capability or incapability degree of each of the EST for the given application. This was done considering the results of the literature analysis represented in Table A1 and following a similar approach to the suitability matrix utilized by IRENA in [55]. In this regard, a three-state suitability matrix was used:
  • If an EST is incapable of providing a service, its C C i is multiplied by 0.
  • If an EST is capable of providing a service in an optimal manner, its C C i is multiplied by 1.
  • If an EST can only provide a service by being hybridized with another technology or alone but not in an optimal manner, its C C i is multiplied by 0.5.

5.5. Scenario Variation and Sensitivity Analysis

A sensitivity analysis was conducted by simulating four different scenarios. The EST ranking and scores were expected widely vary among the scenarios, since energy storage requirements change and, accordingly, so should the expert criteria weights. Following the proposed methodology, the results for the remaining three scenarios were obtained. The closeness and ranking results of Scenario 2 are shown in Figure 4. In this regard, PHS appeared to be the most suitable EST, followed by FES. As shown, all technologies were capable of providing frequency regulation services but in a very different manner. Remarkably, battery-based EST reported better scores for this application. In Scenario 3, PHS was also the most suitable EST, closely followed by CAES. In this case, Zn-air was the most suitable battery-based technology (ranked 3rd). As a difference between Scenarios 2 and 3, in the latter, NaS and flow batteries were preferred over Li-ion batteries (see Figure 5). In Figure 6, the results of Scenario 4 are shown, which correspond to seasonal storage applications. Similar to Scenario 3, PHS was the most suitable EST, followed by CAES. In this case, FES, SC, and SMES were incapable of providing adequate service. TES was also an interesting EST for this application. The remaining EST, while capable of providing this service, reported a very low C C i (<0.2), meaning that they were not suitable for seasonal storage.
The obtained results show that EST ranking varied depending on the grid application, as did the most suitable EST. For instance, for inertial response applications (Scenario (1), the most suitable technology was FES. Nonetheless, it can be seen that it was not suitable for longer duration applications like time-shifting (Scenario 3) or seasonal storage (Scenario 4). For frequency regulation services (Scenario 2), PHS was the most suitable technology. Moreover, the more energy-oriented the application, the higher the score for PHS, as well as its advantage over the other technologies. Among battery technologies, LA and NiCd were the most suitable alternatives overall, closely followed by LFP in power-oriented applications (Scenarios 1 and 2) and by LTO for time-shifting purposes. These results are gathered in Figure 7; they show that the differences between battery technologies and even among the Li-ion family were considered by the proposed EST selection methodology. This underlines that not only the EST characteristics need to be considered, but also the needs of an individual grid application.

5.6. Results Discussion

Qie et al. [10] used PDHFS for EST ranking and selection for penetration scenarios of three unspecified renewables in the Shanxi Province. In contrast, the present methodology was applied to four standard grid applications. Çolak and Kaya [11] selected the optimal EST in different scenarios by changing criteria weights with each other instead of capturing application specificities. A similar approach was utilized by Daim et al. [47], where a fuzzy consistent matrix was validated by changing the relative weights. Murrant and Radcliffe [12] conducted a study for EST selection for specific projects in the northwest region, where three alternatives were considered (PHS, CAES, and NaS). Remarkably, this methodology considered the requirements imposed by a specific grid application in two ways: first, by means of the expert evaluation results and, second, by applying the proposed suitability matrix. Moreover, in this study, a wider variety of EST was evaluated, especially in terms of different battery technologies, which are some of the most promising EST for many future key applications.

6. Conclusions

In the present study, a methodology for energy storage technology selection based on specific grid application requirements has been developed. A detailed literature analysis and expert consultation process were carried out for decision-making data gathering and criteria weight calculation, respectively. In order to cope with ambiguity while capturing opinions and application details, gathered information was converted to triangular fuzzy numbers. For technology selection, the TOPSIS method was utilized as a valuable distance-based method. The developed methodology was applied to four different grid applications of potential interest within the framework of the ENERISLA project and implemented in an EST selection tool developed in VBA. The results showed that technology and application requirements have been considered, since wide variations were observed among scenarios. Some of the strengths of the study are: (1) the specific requirements of each grid service and the capability degree of an EST of providing it were considered; (2) a ready-to-use methodology to quantify, in a precise manner, the fuzziness of evaluations and homogenize the gathered information for straightforward implementation in a software tool was defined; and (3) a wider range of EST was considered, especially among battery storage technologies. All in all, we can say that the proposed methodology is able to make robust decisions in an intuitionistic manner, minimizing decision maker information requests. As for future research lines, a sensitivity analysis varying criteria weights could be done so that the obtained results could be compared to assess the robustness of the method. Additionally, it may be useful to analyze the proposed decision-making problem utilizing different MCDM approaches and fuzzy set variants.

Author Contributions

Conceptualization, A.Z. and Á.M.; investigation, A.Z. and Á.M.; methodology, A.Z..; software, A.Z. and Á.M.; writing—original draft preparation, A.Z. and Á.M; writing—review and editing, A.Z.; supervision, H.-J.G., G.F. and P.M.; project administration, A.Z. All authors have read and agreed to the published version of the manuscript.

Funding

This work has been financed within the initiative “ENERISLA 100% Renewable Isolated Energy Systems”. This Project has received funding from the Centre for the Development of Industrial Technology (CDTI) under the framework of Red Cervera research and innovation programme, grant agreement n° CER-20191002.

Data Availability Statement

Not applicable.

Conflicts of Interest

The authors declare no conflict of interest.

Appendix A

The ability of each EST to provide each flexibility service is shown in this appendix.
Table A1. Ability of different EST for providing flexibility services.
Storage TechnologyPHSCAESFESTESLi-IonRedox FlowLead AcidFCSCSMES
Grid CongestionsEnergies 15 07612 i001Energies 15 07612 i002Energies 15 07612 i003Energies 15 07612 i004Energies 15 07612 i005Energies 15 07612 i006Energies 15 07612 i007Energies 15 07612 i008Energies 15 07612 i009Energies 15 07612 i010
Voltage ControlEnergies 15 07612 i011Energies 15 07612 i012Energies 15 07612 i013Energies 15 07612 i014Energies 15 07612 i015Energies 15 07612 i016Energies 15 07612 i017Energies 15 07612 i018Energies 15 07612 i019Energies 15 07612 i020
Control Island OperationEnergies 15 07612 i021Energies 15 07612 i022Energies 15 07612 i023Energies 15 07612 i024Energies 15 07612 i025Energies 15 07612 i026Energies 15 07612 i027Energies 15 07612 i028Energies 15 07612 i029Energies 15 07612 i030
Black StartEnergies 15 07612 i031Energies 15 07612 i032Energies 15 07612 i033Energies 15 07612 i034Energies 15 07612 i035Energies 15 07612 i036Energies 15 07612 i037Energies 15 07612 i038Energies 15 07612 i039Energies 15 07612 i040
Frequency RegulationEnergies 15 07612 i041Energies 15 07612 i042Energies 15 07612 i043Energies 15 07612 i044Energies 15 07612 i045Energies 15 07612 i046Energies 15 07612 i047Energies 15 07612 i048Energies 15 07612 i049Energies 15 07612 i050
InertiaEnergies 15 07612 i051Energies 15 07612 i052Energies 15 07612 i053Energies 15 07612 i054Energies 15 07612 i055Energies 15 07612 i056Energies 15 07612 i057Energies 15 07612 i058Energies 15 07612 i059Energies 15 07612 i060
Time/Load ShiftingEnergies 15 07612 i061Energies 15 07612 i062Energies 15 07612 i063Energies 15 07612 i064Energies 15 07612 i065Energies 15 07612 i066Energies 15 07612 i067Energies 15 07612 i068Energies 15 07612 i069Energies 15 07612 i070
Peak ShavingEnergies 15 07612 i071Energies 15 07612 i072Energies 15 07612 i073Energies 15 07612 i074Energies 15 07612 i075Energies 15 07612 i076Energies 15 07612 i077Energies 15 07612 i078Energies 15 07612 i079Energies 15 07612 i080
RES intermittency mitigationEnergies 15 07612 i081Energies 15 07612 i082Energies 15 07612 i083Energies 15 07612 i084Energies 15 07612 i085Energies 15 07612 i086Energies 15 07612 i087Energies 15 07612 i088Energies 15 07612 i089Energies 15 07612 i090
RES IntegrationEnergies 15 07612 i091Energies 15 07612 i092Energies 15 07612 i093Energies 15 07612 i094Energies 15 07612 i095Energies 15 07612 i096Energies 15 07612 i097Energies 15 07612 i098Energies 15 07612 i099Energies 15 07612 i100
Demand ManagementEnergies 15 07612 i101Energies 15 07612 i102Energies 15 07612 i103Energies 15 07612 i104Energies 15 07612 i105Energies 15 07612 i106Energies 15 07612 i107Energies 15 07612 i108Energies 15 07612 i109Energies 15 07612 i110
Uninterruptible Power SupplyEnergies 15 07612 i111Energies 15 07612 i112Energies 15 07612 i113Energies 15 07612 i114Energies 15 07612 i115Energies 15 07612 i116Energies 15 07612 i117Energies 15 07612 i118Energies 15 07612 i119Energies 15 07612 i120
Power QualityEnergies 15 07612 i121Energies 15 07612 i122Energies 15 07612 i123Energies 15 07612 i124Energies 15 07612 i125Energies 15 07612 i126Energies 15 07612 i127Energies 15 07612 i128Energies 15 07612 i129Energies 15 07612 i130
Table Legend: Energies 15 07612 i131 ESS tested in simulated or real situations with satisfactory results in providing the service. Energies 15 07612 i132 ESS could be used for the service although not being optimal or the ESS need further development. Energies 15 07612 i133 ESS tested satisfactory in combination with other ESS. Energies 15 07612 i134 ESS unsuitable for that service.

Appendix B

Analyzed EST characteristics are shown in Table A2 and Table A3.
Table A2. Energy storage technology technical characteristics and their value ranges.
Storage TechnologyPHSCAESFESTESNMCNCALFPLTOLMONaSVRFBZnRFBZnAirLead AcidNiCdFCSCSMES
Energy density (Wh/L)1–2 [35], 0.5–1.5 [32]2–6 [35], 3–6 [32]20–80 [32,35]80–250 [35], 100–190 [32]20–400 [35], 355 [27]20–400 [35], 676 [27]20–400 [35], 278 [27]20–400 [35], 177 [27]20–400 [35]150–300 [35], 150–350 [32]25–35 [35], 10–30 [32]55–65 [35]20–1700 [32]50–90 [35], 25–90 [32]15–80 [32,35]500–3000 [32]10–30 [32,35]~6 [35], 0.2–14 [32]
Power density (W/L)~1 [35], 0.5–1.5 [32]~1 [35], 0.5–2 [32]~5000 [35], 40–2000 [32]-1500–10,000 [32,35]1500–10,000 [32,35]1500–10,000 [32,35]1500–10,000 [32,35]1500–10,000 [32,35]140–180 [32,35]~2 [32,35]~25 [35]10–200 [32]10–400 [32,35]80–600 [35], 75–700 [32]> 500 [32]>100,000 [32,35]~2500 [35], 300–4000 [32]
Rated power (MW)100–1000 [57]; 100–5.000 [16]<1000 [57], 4–500 [58]0.01–0.25 [36]0.1–300 [16]0–100 [16]0–100 [16]0–100 [16]0–100 [16]0–100 [16]0.05–34 [16]<100 [59], 0.03–3 [16]<100 [59], 0.05–10 [16]0–0.01 [16]0–40 [16]<40 [36]0.58–8 [16]0.01–0.1 [57], 0–0.3 [16]0.1–10 [8,16]
Efficiency (%)<85 [8]; 65–90 [33]41–75 [56], 42–89 [59]70–96 [33], 90–95 [35]30–60 [15]/ 40–50 [16]95 [61], 92 [60]95 [61], 92 [60]92 [61], 86 [60]96 [60,61]95 [61]<85 [35], 70–85 [32]<80 [8], 60–75 [59]75–85 [17], <75 [16]30–50 [33]<85 [8], 80 [34]80 [34], 70–90 [57]75–90 [33], 25–58 [16]65–99 [33], 90–95 [16]80–99 [33], 80–90 [56]
Self-discharge (%/day)Very small [36,56]Small [56]Very high (100%/day) [8,35]0.05–1 [8,17], Small [15]0.1 [60,61]0.2 [60,61]0.1 [60,61]0.05 [60,61]0.1 [61]None [17], 20 [36]Small [17,36]Very small [17]-0.1 [17]0.2–0.6 [36]0 [17]20–40 [16]10–15 [36]
Response times-min [16]Min [35], s-min [36]ms (<1 cycle) [35,36]Min [32,35]ms-s [8], ms (1/4 cycle) [17]ms-s [8], ms (1/4 cycle) [17]ms-s [8], ms (1/4 cycle) [17]ms-s [8], ms (1/4 cycle) [17]ms-s [8], ms (1/4 cycle) [17]s [8,36]ms (0.001) [8], s [36], <1 ms [16]<1 ms [16]ms [16]5–10 ms [16]20 ms-s [36]s [8], <1 s [16]8 ms [36], ms (1/4 cycle) [16]ms [8], <100 ms [36]
Discharge time (h)1–24 h+ [17,36]1–24 h+ [17,36]<0.025 h [35,57]>4 h [17]; 6 h [32]; 4–13 [16]min-2 h+ [17], min-h [16]min-2 h+ [17], min-h [16]min-2 h+ [17], min-h [16]min-2 h+ [17], min-h [16]min-2 h+ [17], min-h [16]<6 h [8], 4–8 h [37]<8 h [8], 2–12 [37]s- < 10 h [16], 2–5 h [37]s-24 h+ [16]<4 h [8], 1–5 h [37]6–8 h [17], 1–8 h [35]>24 h [16], >12 [37]ms-1 h [16]<0.025 h [57], ms-8 s [36]
Cycle lifetime (cycles)>13,000 [16]; <15,000 [56]10,000–30,000 [33]10,000–100,000 [33]>13,000 [16]1000–2000 [61], >5000 [27]500 [61], 320 [27]>2000 [61], >6000 [27]3000–7000 [61], 10,000 [27]300–700 [61]2500–4500 [17,56]>10,000 [17], 10,000–16,000 [8]1000–3650 [59], 2000+ [16]<500 [33]100–2000 [33], 500–1500 [34]2500 [34], 2000 [57]>20,000 [16]>100,000 [16,57]10,000–100,000 [33]
Lifetime (years).30–60 [16]20–60 [58]> 15 [17], 20 [60]10–30 [35]5–15 [17]5–15 [17]5–15 [17]5–15 [17]5–15 [17]<15 [17,36]5–10 [16,17,36]5–10 [16]-3–15 [36]10–20 [36]5–20+ [16]12 [57], 20+ [16]30 [57], +20 [36]
Table A3. Energy storage technology economic, social and environmental characteristics and their value ranges.
Storage TechnologyPHSCAESFESTESNMCNCALFPLTOLMONaSVRFBZnRFBZnAirLead AcidNiCdFCSCSMES
Power capital cost ($/kW)2000–4300 [16]400–1500 [59], 400–1000 [16]216–162,000 [17], 250–350 [16]200–300 [16]900–4000 [16]900–4000 [16]900–4000 [16]900–4000 [16]900–4000 [16]1000–3000 [16,63]600–1500 [16,63]700–2500 [16,63]100–250 [16]300–600 [16,63]500–1500 [16,63]500–10,000 [16]100–450 [16], 100–300 [63]200–489 [16]
Energy capital cost ($/kWh)5–100 [16,60]2–140 [59], 2–120 [16],5000 [8], 1500–6000 [60], 1000–14,000 [56]3–60 [52], 3–30 [16]237 [62], 200–840 [60]350 [62], 200–840 [60]580 [62], 200–840 [60]1000 [62], 473–1260 [60]200–840 [60]263–735 [60], 300–500 [16,63]150–1000 [16,63], 315–1050 [60]150–1000 [16,63], 525–1680 [60]10–60 [16]200–400 [16], 105–473 [60]300–600 [57], 400–2400 [16]15 [16]300–2000 [16], 500–3000 [63]5000 [36], 1000–72,000 [16]
O&M cost ($/kW)2–10 [17]2–5 [17], 6 [47]5–6 [17]-2–123 [17], 8 [60]2–123 [17], 8 [60]8 [60]6 [60]2–123 [17]50 [47], 8 [60]4–51 [17], 11 [60]3–7 [17], 15 [60]-3–26 [17]4–26 [17]17–48 [17]1–6 [17]2–10 [17]
Maturity levelVery Mature [16,36]Commercialized [36], Mature [16]Commercialized [36]CommercializedCommercialized [27,36]Commercialized [27,36]Commercialized [27,36]Demonstration [16]Demonstration [16]Commercialized [16,36]Commercialized [16,36]Demonstration [16]Developing [16]Mature [36],52, [16]Mature [36], Commercialized [15A]Demonstration [16]Developing [16]Developing [16]
Overall environmental impactMedium-high [16,36]Medium-low [36], Medium-high [15A]Very low [16,36]Low [10]Medium-low [16,36]Medium-low [16,36]Medium-low [16,36]Medium-low [16,36]Medium-low [16,36]High [36], Medium-low [16]Medium-low [16,36]Medium-low [16]Low [16]High [36], Medium-low [16]High [36], Medium-low [16]Low [16]Very low [36], None [16]Low [36], Medium-low [16]
Social acceptance levelVery high, high [10]Very high, high [10]Very high, high [10]Medium [10]High, medium [10]High, medium [10]High, medium [10]High, medium [10]High, medium [10]Very high, highHigh, mediumHigh, mediumVery high, highMedium [10]-Medium, highMedium [10]Medium [10]

Appendix C

The normalized decision-making matrix is represented in Table A4.
Table A4. Normalized decision-making matrix based on literature analysis data.
Storage TechnologyPHSCAESFESTESNMCNCALFPLTOLMONaSVRFBZnRFBZnAirLead AcidNiCdFCSCSMES
Energy density (Wh/L)0.0012040.0026860.0296340.1440030.074050.074050.074050.074050.074050.1875510.0134290.0599780.254490.0588160.0250010.8796380.0134290.002128
Power density (W/L)0.0000070.0000090.0397310.0017180.0404210.0404210.0404210.0404210.0404210.0012920.0000150.0001990.0007090.0013670.0023750.0044720.9932760.01467
Rated power (MW)0.9956910.0695940.0000750.0302660.0099720.0099720.0099720.0099720.0099720.0036230.0004480.0012420.0000060.0039740.0039740.0036910.0000350.001492
Efficiency (%)0.220320.187390.243370.130110.277210.277210.26350.284980.282010.228320.212320.206640.19980.244320.235160.119370.274010.25117
Self-discharge (%/day)0.0009310.0046550.9310750.0047610.0009310.0018620.0009310.0004660.0009310.1862150.0046550.0009310.0018620.0018620.00367100.2766510.115716
Response time000.3560300.237360.237360.356030.237360.237360.118680.237360.237360.118680.237360.237360.118680.356030.35603
Discharge time (h)0.2370630.247730.0002280.2460370.0179520.0179520.0179520.0179520.0179520.2011650.1723780.1095570.4094410.0772150.1041380.7111890.0089780.000228
Cycle lifetime (cycles)0.1391420.1292070.3205490.1297010.0183880.0028770.0258410.0332950.003330.0241010.0909390.0146970.0041370.006460.0162740.1764110.7453810.320549
Lifetime (years)0.564540.46510.260090.232550.116270.116270.116270.116270.116270.116270.094090.094090.094090.096390.188180.138460.208070.33199
Power capital cost ($/kW)0.4485540.1112090.0497710.0404890.2712140.2712140.2712140.2712140.2712140.2528290.141620.1904170.0236030.0657720.1264150.4119350.0303210.046837
Energy capital cost ($/kWh)0.0018910.001060.4014150.0009270.0537980.0537980.0537980.1222140.0537980.0681920.0828470.1375940.0119040.0284650.112570.0037030.0858090.737351
O&M cost ($/kW)0.0492710.0396030.0864380.3472590.2677820.2677820.1318420.1014050.2677820.1352070.1584880.0584370.3472590.0951780.1101450.3472590.2083390.049271
Maturity level0.370680.30890.247120.247120.247120.247120.247120.185340.185340.247120.247120.185340.123560.30890.247120.185340.123560.12356
Overall environ-mental impact0.139010.139010.3475240.2780190.2085140.2085140.2085140.2085140.2085140.2085140.2085140.2085140.2780190.139010.2085140.2780190.3475240.278019
Social acceptance level.0.3162280.3162280.3162280.1581140.2108190.2108190.2108190.2108190.2108190.3162280.2108190.2108190.3162280.1581140.2108190.2108190.1581140.158114

References

  1. Global Warming of 1.5 °C. Available online: https://www.ipcc.ch/sr15/ (accessed on 16 September 2022).
  2. Oladeji, I.; Makolo, P.; Abdillah, M.; Shi, J.; Zamora, R. Security Impacts Assessment of Active Distribution Network on the Modern Grid Operation—A Review. Electronics 2021, 10, 2040. [Google Scholar] [CrossRef]
  3. Vita, V.; Christodoulou, C.; Zafeiropoulos, I.; Gonos, I.; Asprou, M.; Kyriakides, E. Evaluating the Flexibility Benefits of Smart Grid Innovations in Transmission Networks. Appl. Sci. 2021, 11, 10692. [Google Scholar] [CrossRef]
  4. Garcia-Torres, F.; Bordons, C.; Tobajas, J.; Real-Calvo, R.; Santiago, I.; Grieu, S. Stochastic Optimization of Microgrids With Hybrid Energy Storage Systems for Grid Flexibility Services Considering Energy Forecast Uncertainties. IEEE Trans. Power Syst. 2021, 36, 5537–5547. [Google Scholar] [CrossRef]
  5. Headley, A.J.; Copp, D.A. Energy storage sizing for grid compatibility of intermittent renewable resources: A California case study. Energy 2020, 198, 117310. [Google Scholar] [CrossRef]
  6. Bartolini, A.; Carducci, F.; Muñoz, C.B.; Comodi, G. Energy storage and multi energy systems in local energy communities with high renewable energy penetration. Renew. Energy 2020, 159, 595–609. [Google Scholar] [CrossRef]
  7. Kumar, G.V.B.; Palanisamy, K. A Review of Energy Storage Participation for Ancillary Services in a Microgrid Environment. Inventions 2020, 5, 63. [Google Scholar] [CrossRef]
  8. Faisal, M.; Hannan, M.A.; Ker, P.J.; Hussain, A.; Mansor, M.; Blaabjerg, F. Review of Energy Storage System Technologies in Microgrid Applications: Issues and Challenges. IEEE Access 2018, 6, 35143–35164. [Google Scholar] [CrossRef]
  9. Gumus, A.T.; Yayla, A.Y.; Çelik, E.; Yildiz, A. A Combined Fuzzy-AHP and Fuzzy-GRA Methodology for Hydrogen Energy Storage Method Selection in Turkey. Energies 2013, 6, 3017–3032. [Google Scholar] [CrossRef]
  10. Qie, X.; Zhang, R.; Hu, Y.; Sun, X.; Chen, X. A Multi-Criteria Decision-Making Approach for Energy Storage Technology Selection Based on Demand. Energies 2021, 14, 6592. [Google Scholar] [CrossRef]
  11. Çolak, M.; Kaya, İ. Multi-criteria evaluation of energy storage technologies based on hesitant fuzzy information: A case study for Turkey. J. Energy Storage 2020, 28, 101211. [Google Scholar] [CrossRef]
  12. Murrant, D.; Radcliffe, J. Assessing energy storage technology options using a multi-criteria decision analysis-based framework. Appl. Energy 2018, 231, 788–802. [Google Scholar] [CrossRef] [Green Version]
  13. Cavallaro, F. Fuzzy TOPSIS approach for assessing thermal-energy storage in concentrated solar power (CSP) systems. Appl. Energy 2010, 87, 496–503. [Google Scholar] [CrossRef]
  14. Garg, H.; Kaur, G. Algorithm for Probabilistic Dual Hesitant Fuzzy Multi-Criteria Decision-Making Based on Aggregation Operators with New Distance Measures. Mathematics 2018, 6, 280. [Google Scholar] [CrossRef] [Green Version]
  15. Kim, J.; Suharto, Y.; Daim, T.U. Evaluation of Electrical Energy Storage (EES) technologies for renewable energy: A case from the US Pacific Northwest. J. Energy Storage 2017, 11, 25–54. [Google Scholar] [CrossRef]
  16. Das, C.K.; Bass, O.; Kothapalli, G.; Mahmoud, T.S.; Habibi, D. Overview of energy storage systems in distribution networks: Placement, sizing, operation, and power quality. Renew. Sustain. Energy Rev. 2018, 91, 1205–1230. [Google Scholar] [CrossRef]
  17. Rahman, M.M.; Oni, A.O.; Gemechu, E.; Kumar, A. Assessment of energy storage technologies: A review. Energy Convers. Manag. 2020, 223, 113295. [Google Scholar] [CrossRef]
  18. Energy+Storage+Industry+White+Paper+2022+(Summary+Version).pdf. [En línea]. Available online: https://static1.squarespace.com/static/55826ab6e4b0a6d2b0f53e3d/t/62821561e7f0424662ca7f9d/1652692323469/Energy+Storage+Industry+White+Paper+2022+%EF%BC%88Summary+Version%EF%BC%89.pdf (accessed on 30 August 2022).
  19. Nadeem, F.; Hussain, S.M.S.; Tiwari, P.K.; Goswami, A.K.; Ustun, T.S. Comparative Review of Energy Storage Systems, Their Roles, and Impacts on Future Power Systems. IEEE Access 2019, 7, 4555–4585. [Google Scholar] [CrossRef]
  20. Rehman, S.; Al-Hadhrami, L.M.; Alam, M.M. Pumped hydro energy storage system: A technological review. Renew. Sustain. Energy Rev. 2015, 44, 586–598. [Google Scholar] [CrossRef]
  21. Wang, J.; Lu, K.; Ma, L.; Wang, J.; Dooner, M.; Miao, S.; Li, J.; Wang, D. Overview of Compressed Air Energy Storage and Technology Development. Energies 2017, 10, 991. [Google Scholar] [CrossRef] [Green Version]
  22. Amiryar, M.E.; Pullen, K.R. A Review of Flywheel Energy Storage System Technologies and Their Applications. Appl. Sci. 2017, 7, 286. [Google Scholar] [CrossRef]
  23. Khalid, M. A Review on the Selected Applications of Battery-Supercapacitor Hybrid Energy Storage Systems for Microgrids. Energies 2019, 12, 4559. [Google Scholar] [CrossRef] [Green Version]
  24. Vulusala, G.V.S.; Madichetty, S. Application of superconducting magnetic energy storage in electrical power and energy systems: A review. Int. J. Energy Res. 2018, 42, 358–368. [Google Scholar] [CrossRef]
  25. Menendez Agudin, A.; Rocca, R.; Fernández Aznar, G.; Luengo, L.; Zaldivar, D. Hydrogen Technologies to Provide Flexibility to the Electric System: A Review. Renew. Energy Power Qual. J. 2022, 20, 656–661. [Google Scholar] [CrossRef]
  26. Environmental Aspects of Fuel Cells: A Review—ScienceDirect. Available online: https://0-www-sciencedirect-com.brum.beds.ac.uk/science/article/abs/pii/S0048969720353328 (accessed on 26 August 2022).
  27. Hesse, H.C.; Schimpe, M.; Kucevic, D.; Jossen, A. Lithium-Ion Battery Storage for the Grid—A Review of Stationary Battery Storage System Design Tailored for Applications in Modern Power Grids. Energies 2017, 10, 2107. [Google Scholar] [CrossRef] [Green Version]
  28. Enescu, D.; Chicco, G.; Porumb, R.; Seritan, G. Thermal Energy Storage for Grid Applications: Current Status and Emerging Trends. Energies 2020, 13, 340. [Google Scholar] [CrossRef] [Green Version]
  29. Hillberg, E.; Zegers, A.; Herndler, B.; Wong, S.; Pompee, J.; Bourmaud, J.-Y.; Lehnhoff, S.; Migliavacca, G.; Uhlen, K.; Oleinikova, I.; et al. In Proceedings of the Flexibility Needs in the Future Power System, Vienna, Austria, 17 October 2018.
  30. Villar, J.; Bessa, R.; Matos, M. Flexibility products and markets: Literature review. Electr. Power Syst. Res. 2018, 154, 329–340. [Google Scholar] [CrossRef]
  31. Anaya, K.L.; Pollitt, M.G. How to Procure Flexibility Services within the Electricity Distribution System: Lessons from an International Review of Innovation Projects. Energies 2021, 14, 4475. [Google Scholar] [CrossRef]
  32. Koohi-Fayegh, S.; Rosen, M.A. A review of energy storage types, applications and recent developments. J. Energy Storage 2020, 27, 101047. [Google Scholar] [CrossRef]
  33. Sabihuddin, S.; Kiprakis, A.E.; Mueller, M. A Numerical and Graphical Review of Energy Storage Technologies. Energies 2015, 8, 172–216. [Google Scholar] [CrossRef] [Green Version]
  34. Guney, M.S.; Tepe, Y. Classification and assessment of energy storage systems. Renew. Sustain. Energy Rev. 2017, 75, 1187–1197. [Google Scholar] [CrossRef]
  35. Luo, X.; Wang, J.; Dooner, M.; Clarke, J. Overview of current development in electrical energy storage technologies and the application potential in power system operation. Appl. Energy 2015, 137, 511–536. [Google Scholar] [CrossRef] [Green Version]
  36. Behabtu, H.A.; Messagie, M.; Coosemans, T.; Berecibar, M.; Anlay Fante, K.; Kebede, A.A.; Mierlo, J.V. A Review of Energy Storage Technologies’ Application Potentials in Renewable Energy Sources Grid Integration. Sustainability 2020, 12, 10511. [Google Scholar] [CrossRef]
  37. Barton, J.P.; Infield, D.G. Energy storage and its use with intermittent renewable energy. IEEE Trans. Energy Convers. 2004, 19, 441–448. [Google Scholar] [CrossRef]
  38. Sarasúa, J.I.; Martínez-Lucas, G.; Platero, C.A.; Sánchez-Fernández, J.Á. Dual Frequency Regulation in Pumping Mode in a Wind–Hydro Isolated System. Energies 2018, 11, 2865. [Google Scholar] [CrossRef] [Green Version]
  39. Wu, Y.-K.; Tang, K.-T. Frequency Support by BESS—Review and Analysis. Energy Procedia 2019, 156, 187–191. [Google Scholar] [CrossRef]
  40. Rancilio, G.; Rossi, A.; Di Profio, C.; Alborghetti, M.; Galliani, A.; Merlo, M. Grid-Scale BESS for Ancillary Services Provision: SoC Restoration Strategies. Appl. Sci. 2020, 10, 4121. [Google Scholar] [CrossRef]
  41. Shazon, N.H.; Masood, N.A.; Ahmed, H.M.; Deeba, S.R.; Hossain, E. Exploring the Utilization of Energy Storage Systems for Frequency Response Adequacy of a Low Inertia Power Grid. IEEE Access 2021, 9, 129933–129950. [Google Scholar] [CrossRef]
  42. Surve, S.; Rocca, R.; Engeveld, E.; Martínez, D.; Comech, M.; Rivas Ascaso, D. Impact Assessment of Different Battery Energy Storage Technologies in Distribution Grids with High Penetration of Renewable Energies. Renew. Energy Power Qual. J. 2022, 20, 650–655. [Google Scholar] [CrossRef]
  43. Izadkhast, S.; Cossent, R.; Frías, P.; García-González, P.; Rodriguez-Calvo, A. Performance Evaluation of a BESS Unit for Black Start and Seamless Islanding Operation. Energies 2022, 15, 1736. [Google Scholar] [CrossRef]
  44. Adewuyi, O.B.; Shigenobu, R.; Ooya, K.; Senjyu, T.; Howlader, A.M. Static voltage stability improvement with battery energy storage considering optimal control of active and reactive power injection. Electr. Power Syst. Res. 2019, 172, 303–312. [Google Scholar] [CrossRef]
  45. Bera, A.; Chalamala, B.R.; Byrne, R.H.; Mitra, J. Sizing of Energy Storage for Grid Inertial Support in Presence of Renewable Energy. IEEE Trans. Power Syst. 2022, 37, 3769–3778. [Google Scholar] [CrossRef]
  46. Sankaramurthy, P.; Chokkalingam, B.; Padmanaban, S.; Leonowicz, Z.; Adedayo, Y. Rescheduling of Generators with Pumped Hydro Storage Units to Relieve Congestion Incorporating Flower Pollination Optimization. Energies 2019, 12, 1477. [Google Scholar] [CrossRef] [Green Version]
  47. Daim, T.U.; Li, X.; Kim, J.; Simms, S. Evaluation of energy storage technologies for integration with renewable electricity: Quantifying expert opinions. Environ. Innov. Soc. Transit. 2012, 3, 29–49. [Google Scholar] [CrossRef]
  48. Zadeh, L.A. Fuzzy sets. Inf. Control 1965, 8, 338–353. [Google Scholar] [CrossRef] [Green Version]
  49. Nădăban, S.; Dzitac, S.; Dzitac, I. Fuzzy TOPSIS: A General View. Procedia Comput. Sci. 2016, 91, 823–831. [Google Scholar] [CrossRef] [Green Version]
  50. Chen, J.-K.; Chen, I.-S. Aviatic innovation system construction using a hybrid fuzzy MCDM model. Expert Syst. Appl. 2010, 37, 8387–8394. [Google Scholar] [CrossRef]
  51. Opricovic, S.; Tzeng, G.-H. Extended VIKOR method in comparison with outranking methods. Eur. J. Oper. Res. 2007, 178, 514–529. [Google Scholar] [CrossRef]
  52. Hwang, C.-L.; Yoon, K. Multiple Attribute Decision Making; Lecture Notes in Economics and Mathematical Systems; Springer: Berlin/Heidelberg, Germany, 1981; Volume 186, ISBN 978-3-540-10558-9. [Google Scholar]
  53. Ren, J.; Ren, X. Sustainability ranking of energy storage technologies under uncertainties. J. Clean. Prod. 2018, 170, 1387–1398. [Google Scholar] [CrossRef]
  54. Chen, C.-T. Extensions of the TOPSIS for group decision-making under fuzzy environment. Fuzzy Sets Syst. 2000, 114, 1–9. [Google Scholar] [CrossRef]
  55. International Renewable Energy Agency. Electricity Storage Valuation Framework: Assessing System Value and Ensuring Project Viability; International Renewable Energy Agency: Abu Dhabi, United Arab Emirates, 2020. [Google Scholar]
  56. Zhao, H.; Wu, Q.; Hu, S.; Xu, H.; Rasmussen, C.N. Review of energy storage system for wind power integration support. Appl. Energy 2015, 137, 545–553. [Google Scholar] [CrossRef]
  57. Molina, M. Energy Storage and Power Electronics Technologies: A Strong Combination to Empower the Transformation to the Smart Grid. Proc. IEEE 2017, 105, 2191–2219. [Google Scholar] [CrossRef]
  58. Letcher, T.M. Future Energy: Improved, Sustainable and Clean Options for Our Planet, 3rd ed.; Elsevier: Amsterdam, The Netherlands, 2020. [Google Scholar]
  59. Aramendia, I.; Fernandez-Gamiz, U.; Martinez-San-Vicente, A.; Zulueta, E.; Lopez-Guede, J.M. Vanadium Redox Flow Batteries: A Review Oriented to Fluid-Dynamic Optimization. Energies 2021, 14, 176. [Google Scholar] [CrossRef]
  60. Electricity storage and renewables: Costs and markets to 2030. Int. Renew. Energy Agency: Abu Dhabi United Arab. Emir. 2017, 132, 164.
  61. BU-205: Types of Lithium-Ion. Available online: https://batteryuniversity.com/article/bu-205-types-of-lithium-ion (accessed on 31 August 2022).
  62. Breakthrough Batteries. Available online: https://rmi.org/insight/breakthrough-batteries/ (accessed on 31 August 2022).
  63. Sizing and Applications of Battery Energy Storage Technologies in Smart Grid System: A Review. J. Renew. Sustain. Energy 2019, 11, 014105. Available online: https://aip.scitation.org/doi/abs/10.1063/1.5063866 (accessed on 24 August 2022). [CrossRef]
Figure 1. Energy storage technologies and flexibility services related to discharge time and rated power requirements.
Energies 15 07612 g001
Figure 2. Decision-making process phase description for ESS technology selection.
Energies 15 07612 g002
Figure 3. Closeness and ranking results for inertial response (Scenario 1).
Energies 15 07612 g003
Figure 4. Closeness and ranking results for frequency regulation (Scenario 2).
Energies 15 07612 g004
Figure 5. Closeness and ranking results for time-shifting (Scenario 3).
Energies 15 07612 g005
Figure 6. Closeness and ranking results for seasonal storage (Scenario 4).
Energies 15 07612 g006
Figure 7. Ranking results comparison between Scenarios 1 to 4.
Energies 15 07612 g007
Table 1. Evaluation criteria for energy storage technologies, units, and references [10,11,47].
CategoryCriteria
Energy density (Wh/L)
Power density (W/L)
Rated power (MW)
Response time
TechnicalDischarge power at power rating (h)
Roundtrip efficiency (%)
Self-discharge losses (%/day)
Cycle lifetime (cycles)
Lifetime (years)
EconomicPower capital cost ($/kW)
Energy capital cost ($/kWh)
O&M cost ($/kW)
Maturity level
EnvironmentalOverall environmental impact
SocialSocial acceptance level
Table 2. Numerical equivalency scale for linguistic term transformation.
Linguistic TermNumber
Null, Minutes0
Very low, almost none1
Low, Developing, Seconds2
Medium, Demonstration3
High, Commercialized, Milliseconds4
Very high, Mature5
Absolute, Very mature, <Milliseconds6
Table 3. The triangular fuzzy number scale for linguistic terms.
Linguistic TermAcronym Number
lmu
No importance (ni)ni000.1
Very low importance (vli)vli00.10.3
Low importance (li)li0.10.30.5
Medium importance (mi)mi0.30.50.7
High importance (hi)hi0.50.70.9
Very high importance (vhi)vhi0.70.91
Absolute importance (ai)ai0.90.91
Table 4. Literature analysis for ESS technology selection.
MCDM Problem DescriptionRanking MethodType of Fuzzy SetReference
ESS technology selection for the Shanxi Province in ChinaDistance measurement based on [14]PDHFS[10]
ESS technology selection for TurkeyTOPSIS/VIKORHFS[11]
ESS technology selection for wind energy integration in the Pacific Northwest regionFuzzy AHP (selection)TFS[47]
Thermal energy storage assessment for concentrated solar plantsTOPSISTFS[13]
Hydrogen energy storage technology selection in TurkeyFuzzy AHP (selection)Buckley ext. Fuzzy-AHP[9]
ESS technology sustainability rankingTOPSISTFS[53]
ESS technology selection for the county of Cornwall in the UKMAVT (assessment)-[12]
Table 5. Aggregated expert criteria weights for Scenarios 1 to 4.
CriteriaScenario 1Scenario 2Scenario 3Scenario 4
lmulmulmulmu
Energy density (Wh/L)(0.060.220.42)(0.220.420.62)(0.500.700.88)(0.580.780.92)
Power density (W/L)(0.420.620.82)(0.460.660.86)(0.300.500.70)(0.140.300.50)
Rated power (MW)(0.500.700.88)(0.580.780.94)(0.460.660.84)(0.420.620.80)
Response time(0.900.901.00)(0.660.780.9)(0.260.460.66)(0.10.220.38)
Discharge time (h)(0.080.260.46)(0.380.580.78)(0.70.901.00)(0.820.901.00)
Self-discharge (%/day)(0.220.360.54)(0.240.420.62)(0.460.660.82)(0.820.901.000)
Cycle lifetime (cycles)(0.440.620.76)(0.620.820.94)(0.540.740.90)(0.260.460.66)
Lifetime (years)(0.460.660.84)(0.500.700.90)(0.660.860.98)(0.740.901.00)
Efficiency (%)(0.340.540.74)(0.420.620.80)(0.660.860.98)(0.620.820.96)
Power capital cost ($/kW)(0.740.860.98)(0.660.820.96)(0.380.580.76)(0.340.540.74)
Energy capital cost ($/kWh)(0.220.420.62)(0.420.620.80)(0.660.860.98)(0.780.860.98)
O&M cost ($/kW)(0.460.660.84)(0.500.700.88)(0.540.740.92)(0.620.820.96)
Maturity level(0.580.780.94)(0.620.820.96)(0.540.740.92)(0.460.660.84)
Overall environmental impact(0.500.700.88)(0.540.740.92)(0.540.740.92)(0.460.660.84)
Overall social acceptance(0.500.700.88)(0.540.740.92)(0.540.740.92)(0.460.660.84)
Publisher’s Note: MDPI stays neutral with regard to jurisdictional claims in published maps and institutional affiliations.

