
Effect Quantification of BESS Providing Frequency Response on Penetration Limit of VER in Power Systems †

1
Smart Grid Research Division, Korea Electrotechnology Research Institute, Gwangju 61751, Republic of Korea
2
Department of Electrical Engineering, Jeonbuk National University, 567 Baekje-daero, Deokjin-gu, Jeonju 54896, Republic of Korea
*
Author to whom correspondence should be addressed.
†
The present work is an extension of the paper “An Effect Study of BESS based Frequency Response for Increasing the Penetration Limit of VER in Power System” presented to APAP 2021 Conference, Jeju, Republic of Korea, 11–14 October 2021, and this work is a part of the first author’s doctoral dissertation completed in Jeonbuk National University.
Energies 2022, 15(24), 9380; https://0-doi-org.brum.beds.ac.uk/10.3390/en15249380
Submission received: 30 October 2022
/
Revised: 16 November 2022
/
Accepted: 9 December 2022
/
Published: 11 December 2022
(This article belongs to the Special Issue Towards Sustainability of Safe and Flexible Energy — Selected Papers from the 9th international Conference on Advanced Power System Automation & Protection (APAP 2021))
Abstract
:Increasing the penetration of variable energy resources (VER) can reduce the inertia and frequency response performance of power systems supported by replacement synchronous power generation. Therefore, it is necessary to manage the VER penetration limit in power systems for stable operation and to increase the operability to the desired level. This study proposes a method to evaluate and quantify the effect of increasing the penetration limit of VER by controlling a battery energy storage system (BESS). The BESS can provide a fast response, but frequency response performance varies depending on the operating conditions. In the proposed quantification method, various control methods of a BESS, operating conditions of the power system, and penetration conditions of additional VER were analyzed, and the effect of the BESS on increasing the penetration limit of VER was evaluated. This evaluation and analysis enabled the selection of the BESS operating conditions to achieve the target VER capacity in the power system. The proposed quantification method was analyzed through simulations based on the Korean power system model. Therefore, it can contribute to estimating the required performance of the BESS for each system operating condition required to achieve the VER target.
1. Introduction
With the emergence of the eco-friendly paradigm of energy systems, power systems are also undergoing rapid change [1]. Accordingly, in many power systems, the use of variable energy resources (VER), such as photovoltaics (PV) and wind turbine generators (WTG), has dramatically increased. In Korea, according to the VER expansion plan, approximately 51.2 GW of VER is expected to be integrated into the power system by 2030 [2]. However, the variability and intermittent characteristics of VER may affect the stability of the power system. Because these resources are asynchronously connected to power systems through a power-electric device, the inertia-response support to the power system may be limited [3]. Moreover, the replacement of the conventional synchronous generator (SG) that provides inertia and frequency response with VER degrades the frequency control performance of the power system [4,5,6].
One of the measures to maintain frequency stability in power systems is the use of a battery energy storage system (BESS) as a reserve-providing resource [7,8,9,10]. Because the BESS has fast response characteristics, it can provide the rated power within hundreds of milli-seconds under disturbances, such as a generator trip. Owing to these response characteristics of the BESS, it can serve as a major resource that can cater to reduced inertia and frequency stability [11,12,13]. In the Korean power system, a 376 MW BESS is already in operation for providing frequency response [14]. Moreover, the operating regulations for the BESS have been established and specified in power systems [15]. However, because the BESS has different operating characteristics, an appropriate control method is required. In addition, because the frequency response of the BESS has different characteristics depending on the control method, a quantitative evaluation method is required.
In general, the penetration limit of VER is analyzed in terms of the impact on the operation of the power system [16,17]. However, in the case of the strategic VER penetration limit restriction, it can be alleviated to a large extent by additionally securing the reserve power or operational margin additionally required for the operation of the power system. In particular, in the case of frequency stability, because the inertia and response performance of the power system is directly affected by the increase in VER penetration, research based on the operational-performance review is required to secure frequency stability [18]. From this point of view, securing the frequency stability of the power system using BESS can be mainly considered. In many studies, BESS has been used to provide both equivalent inertia and frequency response to improve frequency stability. In [19,20,21], the BESS was used to provide inertia and primary frequency response, and the BESS responds in proportion to the inertial response based on the rate of change of frequency (RoCoF) and frequency deviation. Moreover, the frequency response performance of the power system can be improved to a certain level by supplying active power to the power system from BESS by only applying droop-based control [22,23,24,25,26]. In particular, in these studies, various aspects were reflected in terms of the classification of control modes and management of energy and SoC considering the operational efficiency for long-term operation. In addition, analyses were performed on directly connecting and coordinating with VER to increase the frequency stability and VER penetration [27,28]. Furthermore, because VER is connected not only to the transmission system but also to the distribution system, the application of BESS will be necessary in the future to secure the flexibility of the power system [29,30]. However, because a BESS facility requires high installation costs, the calculation and operation of these facilities with optimal capacity will be required for the economical operation of the power system [31]. Moreover, because the system operator must secure the operational performance for the target VER capacity, it is necessary to quantitatively analyze the contribution effect of the BESS and operate it. Therefore, this study aims to analyze the effect of BESS on the system operation and quantifies its effect according to the operating conditions of the BESS and power system.
The contributions of this study are as follows:
- Proposal of a method for analyzing the contribution effect of BESS to increase the VER penetration limit of the power system.
- Quantification of the BESS control effect according to system operating conditions and BESS control performance for the Korean power system.
- Reference for the capacity determination and control performance of the BESS to secure the power system operation performance for the power system operator.
This study presents an evaluation procedure to quantify the effect of the frequency response of BESS on the increase in the VER penetration limit. An effect analysis of the frequency response of the BESS on the penetration limit of VER was performed by applying various control methods that provide frequency response. The analysis was performed by considering the operating conditions of the future Korean power system considering the expansion plan for VER. Based on this, by quantifying the effect of the BESS increasing the penetration limit of VER, the operating conditions of the BESS to secure the targeted VER capacity in the power system are presented.
2. Frequency Control in Power Systems
The frequency in the power system is a vital operational indicator representing the equilibrium between power supply and demand. Therefore, the system operator must focus on maintaining the frequency within a stable operating range according to operational rules [32]; therefore, power systems have well-established operation criteria for frequency stability.
Typically, frequency control is categorized according to power system characteristics. First, as the primary frequency control, the governor response of the SG is deployed, which arrests frequency drop depending on the frequency deviation using speed droop (SD). Furthermore, the secondary frequency control adjusts the generation set point according to the automatic generation control (AGC), eliminating the steady-state frequency error resulting from the proportion control of the primary frequency control. Next, the tertiary frequency control recovers the SG capability. In addition, the power system has inertia to prevent rapid frequency drop immediately following a disturbance by providing the stored kinetic energy in the rotor section of an SG. Because inertia is difficult to control, the power system requires maintaining an operational state with an appropriate number of generators. In the Korean power system, the criteria for providing frequency control reserves are classified, as described in Table 1.
Moreover, the power system maintains frequency without load disconnection. Therefore, the power system is required to maintain a frequency within the allowable range. In the case of the Korean power system, the frequency must be above 59.70 Hz even when the single generator trips, in accordance with the frequency operation criteria, as shown in Figure 1. Load shedding is sequentially conducted when the frequency decreases below 59.0 Hz.
Therefore, the power system must account for decreasing frequency after the disturbance. In the Korean power system, the reserve that prevents the frequency drop in early stages, namely the primary frequency reserve (PFR), corresponds to the fastest response in the Korean power system. However, there is no countermeasure to the decrease in inertia caused by increasing VER penetration.
As a solution, the BESS can contribute to the inertia through the fast response characteristics of a battery. The BESS has already been included as a primary reserve resource in the Korean power system. However, because the BESS performance can differ depending on the control method, it is necessary to analyze its effect based on various control methods.
3. Control Method of BESS for Frequency Response
In this study, the frequency response effect of the BESS was analyzed based on the frequency performance of the power system. Therefore, the operational method for the BESS is as follows. The analysis was conducted focusing on the contribution effect of BESS in terms of inertia and nadir frequency after disturbance. Therefore, the state of charge (SOC) management part of the BESS was not considered. However, SoC greatly limits the operation of a BESS, and, in actual operation, a method should be considered to manage it within a stable operation range.
3.1. Regulatory Speed-Droop-Based Control
In the typical primary frequency control, resources provide response services through a specific SD value. Generators have different response characteristics depending on the type of power generation. The Korean power system requires a certain range of SD for resources. In the case of ESS, the SD is required to be below 2%.
The first control method to be analyzed provides a frequency response according to the maximum allowable SD () under the operation criteria. The output of BESS () in this control method is determined using (1) [34]:
where is the rated power of BESS, and is the system-frequency deviation.
Because coal-fired generators typically have an SD of 5–10%, compared to the 2% required for the BESS, it appears that BESS requires a more sensitive response. The low capacity of the BESS results in an inefficient frequency response provided with a low-capacity factor. In general, the provision of frequency response through this SD setting can be applied to a BESS, whose primary operational purpose is not frequency regulation.
3.2. PFR Contracted Speed-Droop-Based Control
Most power systems manage the frequency reserve service in the frequency reserve market, and this response requires performance under specific conditions. The response capacity must be provided based on the SD reported in advance to the system operator under frequency fluctuation conditions, such as generator trips.
The Korean power system secures the primary frequency reserve, as shown in (2), by comparing the expected response amount based on the 0.2 Hz frequency and available power. Applying the minimum value of them yields:
where, denotes the total number of SGs. is the SD of the th SG. , , and denote the rated, maximum, and generated power of th SG, respectively.
Because BESS does not participate in dispatch, a method to provide a frequency response with a high capacity factor is considered for its effective operation. The point of performing SD-based control will be semantically the same as the first method. However, in this method, SD is selected and operated according to (3), based on the response amount to be provided for the 0.2 Hz frequency deviation required by the operational BESS system.
where is the primary frequency reserve at 0.2 Hz of frequency deviation, and is the speed droop for providing .
Therefore, the operator selects an appropriate SD within 2% according to operating conditions, purpose, and the constraints of the facility. Thus, the second control method essentially applies the that can provide the maximum output for the frequency deviation of 0.2 Hz by applying it instead of in (1).
3.3. Performance Maximizing Control Method
The performance maximizing (PM) control method supports inertia and frequency recovery through its rapid response capability. In the Korean power system, this control method has already been implemented in the BESS, which is commercially operated for frequency control. The PM control determines the output by monitoring the frequency deviation, RoCoF, and SOC, as shown in Figure 2 [35].
This control method operates with three different control modes to determine the output. Among these control modes, the transient-state control mode, which is activated when RoCoF is excessive, can effectively contribute to frequency stability and inertia using fast-response characteristics.
In the case of transient-state control, if the frequency drops below that of the dead band , and RoCoF continuously exceeds criterion for 0.1 s [36], a response is generated, and it continues until the frequency recovers to the above recovery criterion of . Here, is applied based on the RoCoF during a disturbance analyzed based on the Korean power system in the past. In this case, the value with the smallest absolute value among the RoCoF immediately after a generator failure of a scale above a certain level that may cause a violation of the frequency operation range is applied to effectively respond to the disturbance. In addition, the system frequency bias () is applied as a control gain to provide a frequency response, as shown in (4). Through this response, it can contribute to mitigating the RoCoF as well as the nadir frequency.
In this control, the response characteristic considers the response performance of the power system called, namely, system frequency bias. That is, is applied as a control gain so that the BESS can maintain the system response performance immediately after the disturbance until adequate response performance of the SG, which requires response activation for several seconds or more, is secured. In addition, this method provides a fast and stable response to frequency fluctuations of the power system because it is applied to limit excessive output fluctuations of the response performance of the system due to the BESS.
4. Evaluation of the Performance of Frequency Response by BESS
In this study, the effect of the frequency response provided by each BESS control method is analyzed. In order to achieve this, the effect is evaluated as the contribution to the increase in the penetration power of VER () instead of SG (). The evaluation is quantified based on the conditions of the BESS facility that can provide frequency stability even when VER is integrated into the power system. The evaluation procedure is illustrated in Figure 3.
This procedure is divided into two steps according to the purpose of the analysis. First, the penetration limit MW of VER () is calculated according to the nadir frequency (), which is the operating criterion in the power system. Second, the contribution of BESS is analyzed by examining the operating conditions of BESS () required to accommodate additional VER (). The effect of the BESS on the frequency response is analyzed by quantitatively comparing the results of the control method that contributes to the penetration limit of VER to secure the frequency stability for the same amount of additional VER. The VER and BESS are analyzed by adjusting the operating conditions while changing the respective unit capacities ().
The frequency stability is evaluated on the N-1 criteria for the VER target capacity. Subsequently, to secure the nadir frequency () for a frequency lower than 59.7 Hz, the BESS is integrated into the power system to provide a frequency response. The frequency response effect of the BESS () is evaluated as shown in (5) by obtaining the ratio of the BESS input capacity to the expansion VER, assuming that the frequency operation is a critical point,
The effect on the frequency response of the BESS is analyzed by quantitatively comparing the results of which control method effectively contributes to the penetration of VER to obtain the frequency stability for the same frequency deviation. A performance evaluation indicator for such analysis includes RoCoF and nadir frequency of the power system. Moreover, the inertia of the power system that can be calculated through RoCoF is considered:
where is the nominal frequency of the power system, and denotes an imbalance due to disturbances, such as a generator trip. Based on these evaluation indicators, the effect of increasing the penetration limit of VER through the frequency response of BESS is analyzed by performing a quantitative comparison. In addition, for analyzing the power system dynamic characteristics, the center of inertia (COI) of frequency () is applied based on the information from the online generator. This corresponds to the frequency characteristics of each region being weighted based on the inertia of online generators as in (7), and it is applied as a system frequency representing dynamic characteristics,
where is the frequency of th SG, and denotes an inertia constant of th SG.
5. Case Study
5.1. Power System Model and Description
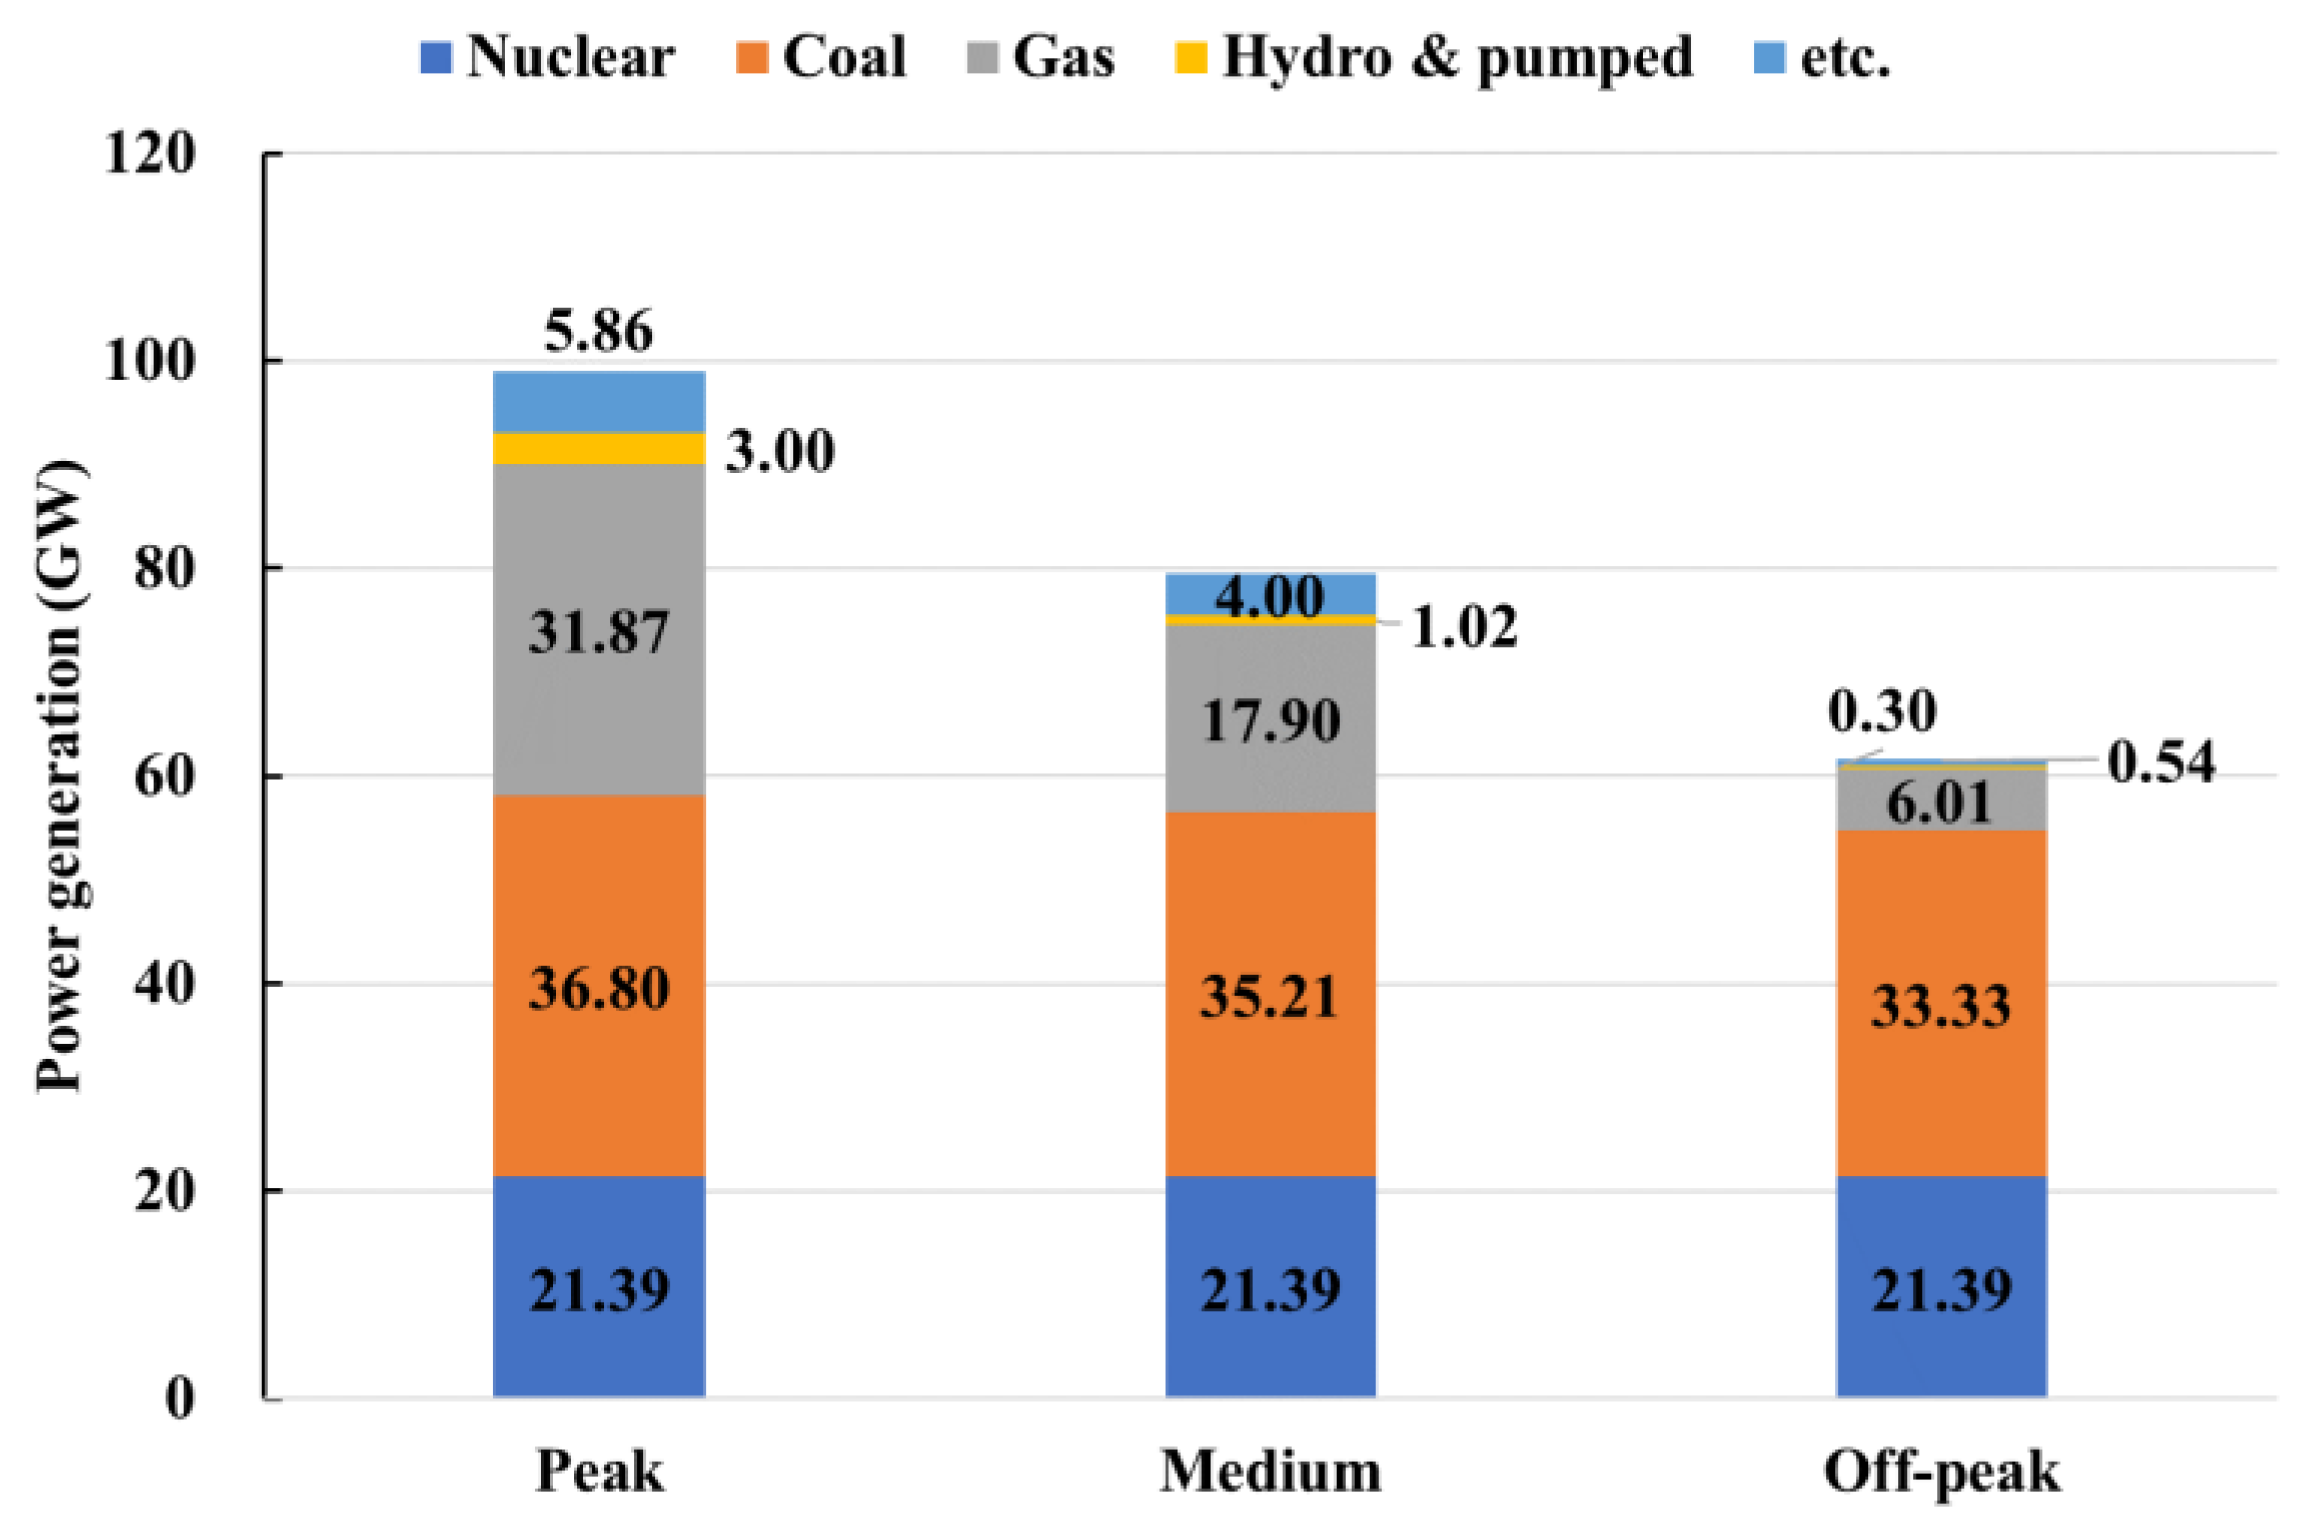
In the case study, the effect of a BESS providing frequency response is analyzed to increase the penetration limit of VER, considering the expansion plan in the Korean power system to be implemented by 2030. This analysis is performed based on the system planning database (DB) established by Korea electric power corporation (KEPCO). Furthermore, it is performed using a power system simulator for engineering (PSS/E) from Siemens PTI (Schenectady, NY, USA), which is a large-scale power system analysis program. In this analysis, conditions at off-peak, medium, and peak load levels are analyzed. The power system operation information related to this is described in Table 2 and Figure 4.
As of 2021, the peak load of the Korean power system was 91.141 GW, and the off-peak load was 54.836 GW. Compared to 2021, in 2030, peak and off-peak demand are expected to increase by 8.53% and 12.28%, respectively. In Korea, nuclear and coal-fired generators have been supplying electricity as base power sources. Accordingly, the power supply of the gas generator changes according to the demand. In the case of the plan DB, VER was not included as a separate review item; therefore, it was reflected based on additional modeling. Considering the expansion plan, the ratio of PV to WTG was applied as 2:1 for the installed capacity of VER. Typically, in the case of a medium-load level for a solar-based power system, such as the Korean power system, VER would account for the high portion of generation.
For modeling VER, based on the guidelines of the western electricity coordinating council (WECC), the PV and permanent magnet synchronous generator (PMSG)-based WTG are modeled using the generic model in PSS/E [37,38]. The portfolio of VER is based on the expansion plan in Korea. The BESS model is analyzed by applying the CBEST model developed by Electric Power Research Institute (EPRI) [39]. The frequency response of BESS is implemented in the part of using an input signal from each control method, as shown in Figure 5.
5.2. Analysis on Penetration Limit of VER
According to the evaluation procedure, it is necessary to determine a penetration limit of VER. In Korea, the aim is to expand the capacity of VER to 51.20 GW by 2030 according to the expansion plan for VER; therefore, the power system needs to analyze whether this target is attainable. As a reference for this analysis, historical data on the power output of VER in the Korean power system were analyzed first. The analysis used the operational data from the 2.21 GW of VER capacity that penetrated the Korean power system for one year in 2017, as shown in Figure 6 [40].
From these data, the average maximum daily capacity factor was derived as 49.80% in spring and autumn, which represent a medium load. Furthermore, the maximum capacity factor was 68.42%. Therefore, it is necessary to operate the power system securing frequency stability even though VER is operated at the maximum capacity factor.
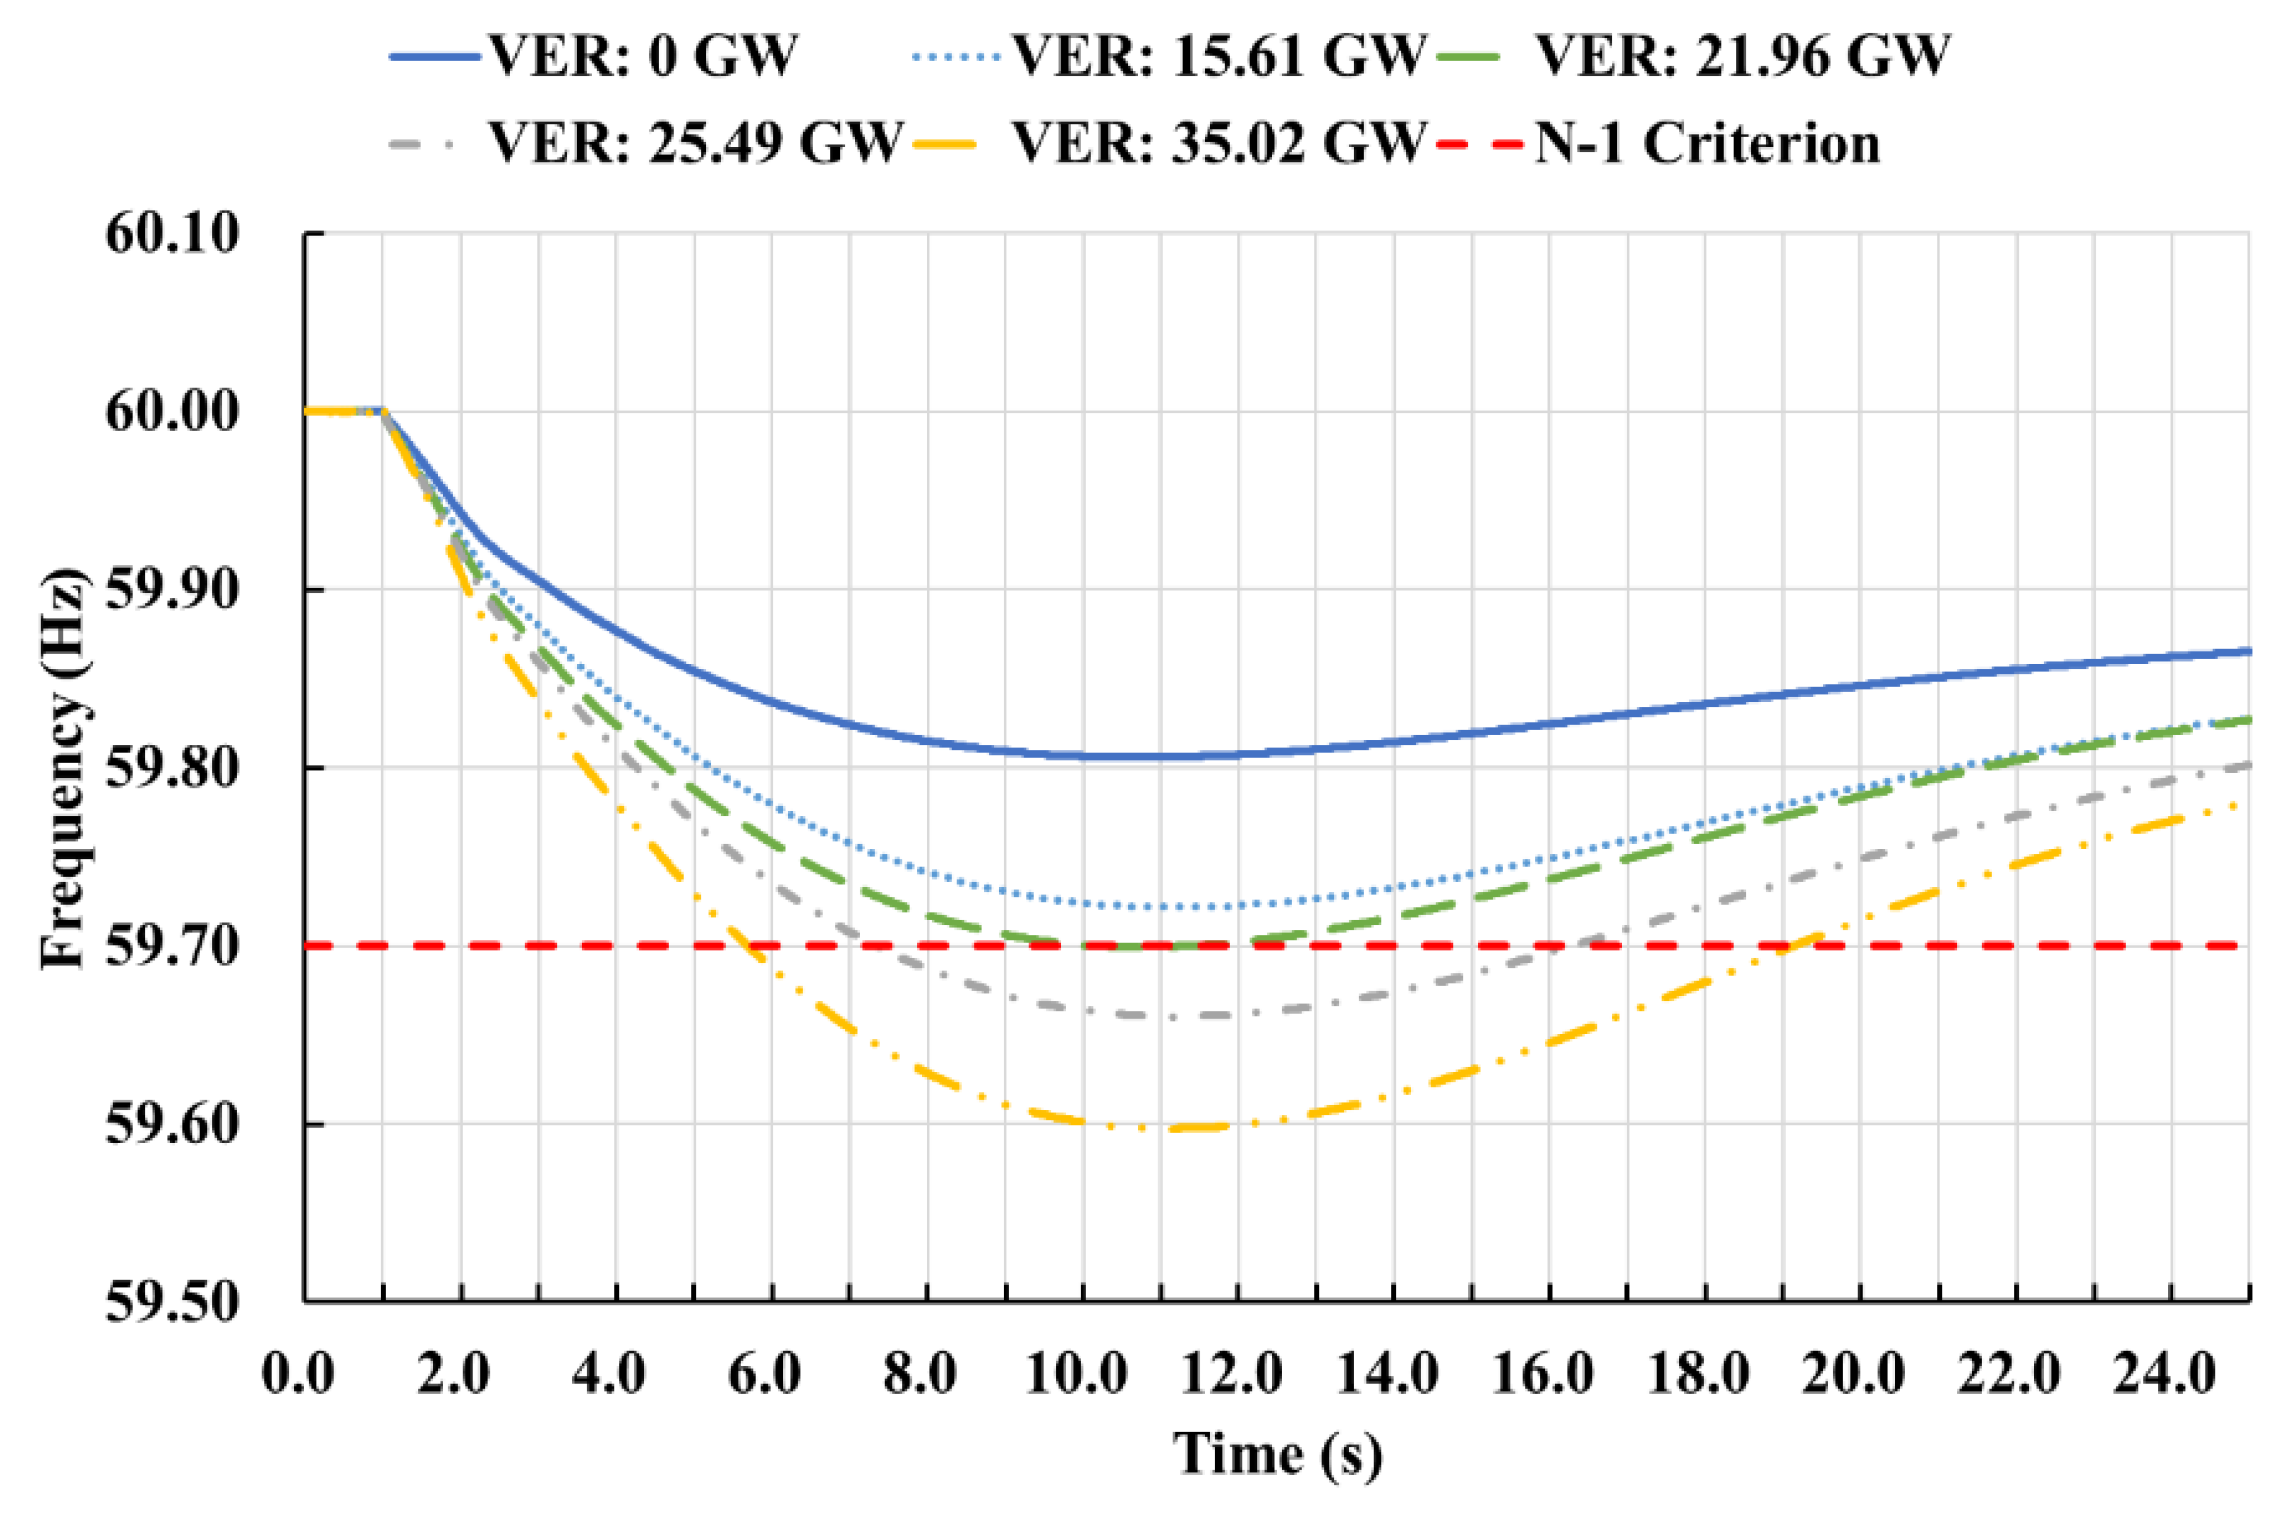
Based on this, the penetration limit of VER was analyzed according to the first step of the evaluation procedure. Figure 7 shows frequency characteristics in the medium-load, derived under the same frequency reserve and N-1 disturbance, by increasing the penetration level of VER.
Through this result, the power system was shown to have a nadir frequency of 59.7 Hz at 21.96 GW VER, which would be the penetration limit. However, it is necessary to secure performance for stable frequency operation even when the penetration of VER is 35.02 GW depending on the maximum capacity factor. Therefore, in this analysis, 51.20 GW of VER was selected as the target capacity, and the maximum capacity factor was applied. Based on the penetration of VER, the effect of increasing the penetration limit of VER with BESS providing frequency response is analyzed to secure the VER target capacity in the future Korean power system. In this analysis, the effect on the VER providing frequency response was not considered.
5.3. Effect Analysis of BESS-Based Frequency Response Characteristics
In this section, the effect of frequency response for each control method of BESS is analyzed to secure the penetration of the VER target capacity. Based on the frequency response characteristics of the BESS, the VER target capacity of the power system was analyzed according to the evaluation procedure, and the results are presented in Figure 8 and Table 3. In order to compare the performance of the BESS, analysis was conducted based on medium- load conditions, and another solution, that is, the additional PFR of SG, was also compared.
Through these results, it was observed that the PM control method effectively contributed to the increase in the penetration limit of VER with minimum capacity compared to other control methods. Furthermore, the control method applied using obtained the penetration of VER with an additional 22 MW. Through these results, the two control methods were found to be effective compared to securing additional primary reserve through SG. However, the control method with an SD of 2% did not effectively use the capacity as much as the BESS was required to accommodate the same amount of VER.
Based on these results, Table 4 describes the evaluation performance through frequency response by the BESS according to the procedure.
These results quantify the evaluation index per 100 MW for each BESS control method. The PM control method appears to have the greatest ability to improve RoCoF, nadir frequency, and system inertia by providing a fast frequency response after a disturbance. Therefore, the PM control method contributes the most to increasing the penetration limit of VER. In terms of nadir frequency, the control method applying also demonstrated a high contribution effect. However, the BESS control method using is not economical because more than four times the installed capacity is required to secure the same VER capacity. In addition, it corresponds to a control that can be inefficient in terms of the power system operation because it cannot effectively utilize the rapid response of the BESS. Therefore, the adjustment of frequency response sensitivity will be necessary to secure frequency stability.
5.4. Effect-Analysis of BESS-Based System Operation Condition
In order to increase the penetration limit of VER, the control strategy of the BESS is considered. However, the contribution effect of BESS differs depending on the operating conditions of the power system. Therefore, this section analyzes the effect of BESS on increasing the penetration limit of VER depending on the operating conditions of the power system. The analysis is based on the PM control method, which has the best contribution effect. Table 5 summarizes the results of this analysis. Figure 9a shows the frequency response characteristics according to the VER penetration conditions for each system operating condition without the BESS. Figure 9b shows the control effect of BESS under medium load as an example result of the analysis.
For the off-peak load, the nadir frequency reached 59.70 Hz when the N-1 contingency of the power system occurred without VER. Thus, a condition occurred where it was impossible to accommodate additional VER. For medium load, the penetration limit of VER corresponded to 21.96 GW. Furthermore, for peak load, it can be confirmed that the power system could be operated within the frequency criteria even when the VER penetrated as much as 54.85 GW, as shown in Figure 9a.
At this time, if the BESS provides a frequency response with an appropriate capacity, it can contribute to securing the frequency stability above 59.70 Hz even under additional penetration of VER. In particular, the contribution effect of the BESS tends to be somewhat higher under low-inertia conditions, such as off-peak load, when the power system operates with few generators. In addition, the BESS exhibits a relatively high performance as the penetration of VER in the power system increases.
From these results, analyzing the response of the BESS is important to secure frequency stability and meet the VER target capacity under the operating conditions of the power system. Therefore, it will be necessary to quantify the effect of BESS according to the operational conditions of the BESS and the power system.
5.5. Effect-Quantification of BESS on Penetration Limit of VER
To effectively manage the penetration level of VER in the power system, the analysis of the operating conditions of the power system and how the performance of the BESS participating in the response can contribute to the operation is necessary. Therefore, in this section, the contribution effect of BESS is quantified and analyzed based on the results discussed previously.
First, as analyzed in Section 5.3, the response sensitivity of the BESS directly affects the penetration limit of the VER; therefore, the BESS Effect MW is analyzed depending on the SD, which represents the response sensitivity, as shown in Figure 10. Here, Controls #2 and #3 correspond to SD-response performance of 0.33 and 0.05%, respectively.
When the BESS provides a frequency response with a sensitive SD, it effectively increases the penetration limit of VER with less capacity. However, when the SD is lower than the sensitive SD of less than 0.05%, the contribution effect of BESS tends to be saturated. In addition, if the BESS provides a frequency response with an extremely sensitive SD, overcompensation of frequency may occur depending on the capacity of the BESS and operating conditions of the power system; therefore, a stable range of SD must be established.
Next, the effect of BESS on increasing the penetration limit of VER based on the PM control method according to the operational conditions of the power system is analyzed. As mentioned in 5.4, when the response method of the BESS is the same, the contribution effect is inversely proportional to the inertia of the power system, as shown in Figure 11.
In particular, according to the analysis result of this study, through the comparison between the high- and low-inertia conditions, it was confirmed that the BESS effective MW could be increased up to 3.33 times. This is because the frequency response performance of the power system easily changes when the power system inertia is low.
Finally, by synthesizing the results of the additional analysis and the above, the effect of BESS on the penetration limit of VER is produced and presented on a two-dimensional color map graph, as shown in Figure 12.
Depending on the inertia of the power system and the sensitivity of the frequency response provided by the BESS, the effect of BESS on the penetration limit of VER can be derived in proportional form. In Figure 12, lighter colors indicate a high effect of increasing the penetration limit of VER, and conversely, darker colors indicate that it is lowered. Combining the above results, the lower the inertia of the power system and the more sensitive the response performance of the BESS, the higher the effective MW can be achieved with the same facility investment of BESS. Therefore, it is necessary to manage the operating condition of BESS to quantitatively and stably manage the penetration of the targeted VER capacity by the power system.
6. Discussion
The proposed evaluation procedure can also be applied to the BESS analysis to secure the frequency response performance of the power system. Based on the presented results, BESS, which is sensitive to the initial reaction after a disturbance, can secure the same VER even with a small capacity. Therefore, it is necessary to apply the operation settings in terms of economic facility and system operation. The presented analysis may have some differences depending on the size and power supply configuration of the power system; however, the BESS contribution can be calculated by applying the same method. In this study, the results were analyzed only in terms of MW of BESS to secure frequency stability after a disturbance. Therefore, for the energy-related part, a separate management plan should be established by referring to the battery life, efficiency, and operating characteristics of the power system, as in [33].
Based on these results, the owner of the BESS can actively operate the BESS and can apply the operating characteristics, so that settlement through the provision of reserve power is advantageous. Power system operators can derive additionally secured BESS facilities according to the operational target VER or stability performance, and the BESS can be used to cope with future power system operations.
7. Conclusions
In this study, various control methods of BESS for providing frequency response were analyzed. The effect of BESS on the penetration limit of VER according to the expansion plan of VER in the Korean power system was quantitatively analyzed and compared. The results revealed that the more sensitive the frequency response control method, the higher the nadir frequency and increase in the penetration limit of VER. That is, in the case of the PM control method, it was observed that the RoCoF was effectively improved when the frequency response was provided right after the disturbance, and the target VER capacity was met with only 329 MW of BESS facility under medium-load level. In addition, it was shown through additional analysis that the effect of the BESS on the increase in the VER penetration limit differs according to the inertia of the power system.
Therefore, the power system operators need to quantitatively analyze and manage the impact of BESS for stable VER penetration and power system operation. In this respect, the proposed method and results of this study can be regarded as a reference that can effectively help in future power system operations.
Author Contributions
Methodology, W.Y.C. and K.S.K.; software, W.Y.C.; validation, W.Y.C. and K.S.K.; investigation, W.Y.C.; writing—original draft preparation, W.Y.C. and H.-J.Y.; writing—review and editing, W.Y.C.; supervision, K.S.K.; funding acquisition, H.-J.Y. All authors have read and agreed to the published version of the manuscript.
Funding
This work is supported by the Korea Agency for Infrastructure Technology Advancement (KAIA) grant funded by the Ministry of Land, Infrastructure and Transport (Grant RS-2022-00143652).
Acknowledgments
This work is supported by the Korea Agency for Infrastructure Technology Advancement (KAIA) grant funded by the Ministry of Land, Infrastructure and Transport (Grant RS-2022-00143652).
Conflicts of Interest
The authors declare no conflict of interest.
References
- United Nations Framework Convention on Climate Change. (UNFCC), “Paris agreement”. In Proceedings of the UNFCCC Climate Change Conference—COP21, Paris, France, 30 November 2015.
- Wang, Y.; Silva, V.; Lopez-Botet-Zulueta, M. Impact of high penetration of variable renewable generation on frequency dynamics in the continental Europe interconnected system. IET Renew Power Gener. 2016, 10, 10–16. [Google Scholar] [CrossRef]
- Thomas, A. Wind Power in Power Systems, 2nd ed.; Wiley: Hoboken, NJ, USA, 2012; pp. 49–751. [Google Scholar]
- Modi, N.; Yan, R. Low Inertia Power Systems: Frequency Response Challenges and a Possible Solution. In Proceedings of the Australasian Universities Power Engineering Conference (AUPEC), Brisbane, Australia, 25–28 September 2016. [Google Scholar] [CrossRef]
- Gu, H.; Yan, R.; Saha, T.K. Minimum synchronous inertia requirement of renewable power systems. IEEE Trans. Power Syst. 2018, 33, 1533–1543. [Google Scholar] [CrossRef] [Green Version]
- Ahmadyar, A.S.; Riaz, S.; Verbič, G.; Chapman, A.; Hill, D.J. A framework for assessing renewable integration limits with respect to frequency performance. IEEE Trans. Power Syst. 2018, 33, 4444–4453. [Google Scholar] [CrossRef]
- Zhai, Q.; Meng, K.; Dong, Z.Y.; Ma, J. Modeling and analysis of lithium battery operations in spot and frequency regulation service markets in Australia electricity market. IEEE Trans. Ind. Inform. 2017, 13, 2576–2586. [Google Scholar] [CrossRef]
- Kim, W.-W.; Shin, J.-S.; Kim, J.-O. Operation Strategy of Multi-Energy Storage System for Ancillary Services. IEEE Trans. Power Syst. 2017, 32, 4409–4417. [Google Scholar] [CrossRef]
- Shazon, M.N.H.; Masood, N.-A.; Ahmed, H.M.; Deeba, S.R.; Hossain, E. Exploring the Utilization of Energy Storage Systems for Frequency Response Adequacy of a Low Inertia Power Grid. IEEE Access 2021, 9, 129933–129950. [Google Scholar] [CrossRef]
- Cao, X.; Zhao, N. A cooperative management strategy for battery energy storage system providing Enhanced Frequency Response. Energy Rep. 2022, 8, 120–128. [Google Scholar] [CrossRef]
- Liu, H.; Zhang, C.; Peng, X.; Zhang, S. Configuration of an Energy Storage System for Primary Frequency Reserve and Inertia Response of the Power Grid. IEEE Access 2021, 9, 41965–41975. [Google Scholar] [CrossRef]
- Brivio, C.; Mandelli, S.; Merlo, M. Battery energy storage system for primary control reserve and energy arbitrage. Sustain Energy Grids Netw. 2016, 6, 152–165. [Google Scholar] [CrossRef]
- Brogan, P.V.; Best, R.J.; Morrow, D.J.; McKinley, K.; Kubik, M.L. Effect of BESS response on frequency and RoCoF during underfrequency transients. IEEE Trans. Power Syst. 2019, 34, 575–583. [Google Scholar] [CrossRef] [Green Version]
- Department of Ministry of Knowledge Economy. (MKE) in Korea. K-ESS. 2020. Available online: www.motie.go.kr/motie/ne/presse/press2/bbs/bbsView.do?bbs_cd_n=81&bbs_seq_n=67853 (accessed on 18 August 2021).
- Korea Power Exchange (KPX). Detailed Oper Regul Cost Eval. 2022. Available online: https://new.kpx.or.kr/board.es?mid=a10205020000&bid=0031&act=view&list_no=67952 (accessed on 13 October 2022).
- Gwon, H.N.; Choi, W.Y.; Kook, K.S. Evaluation Method for Penetration Limit of Renewable Energy Sources in Korean Power System. Energies 2019, 12, 4207. [Google Scholar] [CrossRef] [Green Version]
- Habib, A.; Sou, C.; Hafeez, H.M.; Arshad, A. Evaluation of the effect of high penetration of renewable energy sources (RES) on system frequency regulation using stochastic risk assessment technique (an approach based on improved cumulant). Ren. Energy 2018, 127, 204–212. [Google Scholar] [CrossRef]
- Adrees, A.; Papadopoulos, P.N.; Milanovic, J.V. A framework to assess the effect of reduction in inertia on system frequency response. In Proceedings of the 2016 IEEE Power and Energy Society General Meeting (PESGM), Boston, MA, USA, 17–21 July 2016. [Google Scholar] [CrossRef] [Green Version]
- Knap, V.; Chaudhary, S.K.; Stroe, D.; Swierczynski, M.; Craciun, B.; Teodorescu, R. Sizing of an energy storage system for grid inertial response and primary frequency reserve. IEEE Trans. Power Syst. 2016, 31, 3447–3456. [Google Scholar] [CrossRef] [Green Version]
- Jung, J.-Y.; Cho, Y.-S.; Min, J.-H.; Song, H. An Operation Strategy of ESS for Enhancing the Frequency Stability of the Inverter-Based Jeju Grid. Energies 2022, 15, 3086. [Google Scholar] [CrossRef]
- Datta, U.; Kalam, A.; Shi, J. Battery Energy Storage System for Aggregated Inertia-Droop Control and a Novel Frequency Dependent State-of-Charge Recovery. Energies 2020, 13, 2003. [Google Scholar] [CrossRef] [Green Version]
- Guan, M. Scheduled Power Control and Autonomous Energy Control of Grid-Connected Energy Storage System (ESS) With Virtual Synchronous Generator and Primary Frequency Regulation Capabilities. IEEE Trans. Power Syst. 2022, 37, 942–954. [Google Scholar] [CrossRef]
- Zhu, D.; Zhang, Y.A. Optimal coordinated control of multiple battery energy storage systems for primary frequency regulation. IEEE Trans. Power Syst. 2019, 34, 555–565. [Google Scholar] [CrossRef]
- Turk, A.; Sandelic, M.; Noto, G.; Pillai, J.R.; Chaudhary, S.K. Primary frequency regulation supported by battery storage systems in power system dominated by renewable energy sources. J. Eng. 2019, 2019, 4986–4990. [Google Scholar] [CrossRef]
- Hua, Y.; Shentu, X.; Xie, Q.; Ding, Y. Voltage/Frequency Deviations Control via Distributed Battery Energy Storage System Considering State of Charge. Appl. Sci. 2019, 9, 1148. [Google Scholar] [CrossRef] [Green Version]
- Shim, J.W.; Verbič, G.; Kim, H.; Hur, K. On Droop Control of Energy-Constrained Battery Energy Storage Systems for Grid Frequency Regulation. IEEE Access 2019, 7, 166353–166364. [Google Scholar] [CrossRef]
- Liu, J.; Wen, J.; Yao, W.; Long, Y. Solution to short-term frequency response of wind farms by using energy storage systems. IET Ren. Power Gener. 2016, 10, 669–678. [Google Scholar] [CrossRef]
- Tan, J.; Zhang, Y. Coordinated control strategy of a battery energy storage system to support a wind power plant providing multi-timescale frequency ancillary services. IEEE Trans. Sustain. Energy 2017, 8, 1140–1153. [Google Scholar] [CrossRef]
- Adewumi, O.B.; Fotis, G.; Vita, V.; Nankoo, D.; Ekonomou, L. The Impact of Distributed Energy Storage on Distribution and Transmission Networks’ Power Quality. Appl. Sci. 2022, 12, 6466. [Google Scholar] [CrossRef]
- Sijakovic, N.; Terzic, A.; Fotis, G.; Mentis, I.; Zafeiropoulou, M.; Maris, T.I.; Zoulias, E.; Elias, C.; Ristic, V.; Vita, V. Active System Management Approach for Flexibility Services to the Greek Transmission and Distribution System. Energies 2022, 15, 6134. [Google Scholar] [CrossRef]
- Pan, X.; Xu, H.; Song, J.; Lu, C. Capacity optimization of battery energy storage systems for frequency regulation. In Proceedings of the IEEE International Conference on Automation Science and Engineering (CASE), Gothenburg, Sweden, 24–28 August 2015; pp. 1139–1144. [Google Scholar] [CrossRef]
- Korea Power Exchange (KPX). Operating Criteria for Ancillary Service July 2021.
- Choi, W.Y.; Kook, K.S. An Evaluation Methodology of Frequency Response from Various Resources for Increasing the Penetration of Renewable Energy Sources in the Power System. Trans. Korean Inst. Electr. Eng. 2022, 71, 1054–1061. [Google Scholar] [CrossRef]
- Anderson, P.M.; Fouad, A.A. Power System Control and Stability, 2nd ed.; Wiley: Hoboken, NJ, USA, 2003; pp. 622–630. [Google Scholar]
- Choi, W.Y.; Kook, K.S.; Yu, G.R. Control strategy of BESS for providing both virtual inertia and primary frequency response in the Korean power system. Energies 2019, 12, 4060. [Google Scholar] [CrossRef] [Green Version]
- Han, J.B.; Kook, K.S.; Chang, B.-H. A study on the criteria for setting the dynamic control mode of battery energy storage system in power systems. Trans. Korean Inst. Electr. Eng. 2013, 62, 444–450. [Google Scholar] [CrossRef]
- Western Electricity Coordinating Council (WECC). WECC PV Power Plant Dynamic Modeling Guide, WECC Renewable Energy Modeling Task Force; WECC: Salt Lake City, UT, USA, 2014. [Google Scholar]
- Western Electricity Coordinating Council (WECC). Specification of the Second Generation Generic Models for Wind Turbine Generators; WECC: Salt Lake City, UT, USA, 2013. [Google Scholar]
- PSS/E, 34th ed.; Model Library; Siemens PTI: Schenectady, NY, USA, 2019.
- Choi, W.Y.; Jo, G.R.; Lee, J.H.; Kook, K.S. A Performance Evaluation and its Quantification Method of Frequency Response from RES based on Grid Connection Code in Korean Power System. Trans. Korean Inst. Electr. Eng. 2020, 69, 1859–1865. [Google Scholar] [CrossRef]
Figure 1.
Frequency operation rule in the Korean power system.

Figure 2.
Simplified control scheme of the performance maximizing (PM) control method, Reprinted from Ref. [35].
Figure 2.
Simplified control scheme of the performance maximizing (PM) control method, Reprinted from Ref. [35].

Figure 3.
Flowchart of the evaluation procedure for analyzing the frequency response contribution effect of BESS.
Figure 3.
Flowchart of the evaluation procedure for analyzing the frequency response contribution effect of BESS.

Figure 4.
Generation profile in each system operating condition.

Figure 5.
Power system simulator for engineering (PSS/E) CBEST model-based block diagram of battery energy storage system (BESS).
Figure 5.
Power system simulator for engineering (PSS/E) CBEST model-based block diagram of battery energy storage system (BESS).

Figure 6.
Generation characteristics of variable energy resource (VER)-based on daily output characteristic during a year.
Figure 6.
Generation characteristics of variable energy resource (VER)-based on daily output characteristic during a year.

Figure 7.
Frequency response characteristics under the N-1 disturbance depending on the penetration of VER under the medium load.
Figure 7.
Frequency response characteristics under the N-1 disturbance depending on the penetration of VER under the medium load.

Figure 8.
Frequency dynamic characteristics under critical conditions by control method of BESS.

Figure 9.
Analysis of the effect of BESS on increasing the penetration limit of VER: (a) Frequency response characteristics according to the penetration of VER under different load levels. (b) Analysis of the effect of BESS on increasing the penetration limit of VER under medium load.
Figure 9.
Analysis of the effect of BESS on increasing the penetration limit of VER: (a) Frequency response characteristics according to the penetration of VER under different load levels. (b) Analysis of the effect of BESS on increasing the penetration limit of VER under medium load.

Figure 10.
Analysis of BESS Effect MW according to SD.

Figure 11.
Analysis of BESS Effect MW according to System Inertia.

Figure 12.
Analysis of BESS Effect MW depending on operation condition.


Table 1.
Reserve criteria for frequency ancillary service in the Korean power system, Adapted from Ref. [33].
Table 1.
Reserve criteria for frequency ancillary service in the Korean power system, Adapted from Ref. [33].
| Index | Reserve | Resource | Activating Time | Sustaining Time | |
|---|---|---|---|---|---|
| Frequency control reserve | 700 | AGC + ESS | 5 min | 30 min | |
| Restoration reserve | Primary | 1000 | G/F + ESS | 10 s | 5 min |
| Secondary | 1400 | AGC | 10 min | 30 min | |
| Tertiary | 1400 | Manual dispatch | 30 min | - | |
| Total | 4500 | ||||
Table 2.
Power system operation condition for the analysis.
| Index | Parameter | Value | |
|---|---|---|---|
| Frequency reserve | PFR | 1000 (MW) | |
| Frequency stability criteria (N−1) | 59.70 (Hz) | ||
| 1460 (GW) | |||
| System operatingcondition | Peak | 98.92 (GW) | |
| Number of SG | 301 | ||
| Inertia constant | 4.76 (s) | ||
| Medium | 79.79 (GW) | ||
| Number of SG | 183 | ||
| Inertia constant | 4.76 (s) | ||
| Off-peak | 61.57 (GW) | ||
| Number of SG | 116 | ||
| Inertia constant | 4.54 (s) | ||
Table 3.
Effect analysis according to evaluation index by frequency response control method of BESS.
Table 3.
Effect analysis according to evaluation index by frequency response control method of BESS.
| Index | Base Case | Control#1 (Regulatory) | Control#2 (PFR Contract) | Control#3 (PM) | Extra PFR |
|---|---|---|---|---|---|
| (MW) | N/A | 1485.2 | 347.4 | 329.0 | 654.5 |
| RoCoF (Hz/s) | −0.090 | −0.089 | −0.088 | −0.084 | −0.090 |
| System Inertia (GWs) | 485.82 | 493.89 | 495.31 | 520.73 | 485.04 |
| Nadir Frequency (Hz) | 59.60 | 59.70 | 59.70 | 59.70 | 59.70 |
| (MW) | N/A | 8.80 | 37.60 | 39.7 | N/A |
Table 4.
Analysis on evaluation performance of control methods by BESS.
| Index (100 MW Based) | Control#1 (Regulatory) | Control#2 (PFR Contract) | Control#3 (PM) |
|---|---|---|---|
| RoCoF (mHz/s) | 0.10 | 0.51 | 1.90 |
| System Inertia (GWs) | 0.54 | 2.73 | 10.61 |
| Nadir Frequency (mHz) | 6.89 | 29.64 | 30.61 |
| (GW) | 0.88 | 3.76 | 3.97 |
Table 5.
Summary of the effect of BESS on increasing penetration limit of VER by system operating conditions.
Table 5.
Summary of the effect of BESS on increasing penetration limit of VER by system operating conditions.
| Load Level | Penetration Limit of VER (GW) | Additional VER (GW) | System Inertia (GWs) | Required Capacity of BESS (MW) | Effect.MWBESS (MW) |
|---|---|---|---|---|---|
| Off-peak (61.57 GW) | 0 | 5 | 417.13 | 120.31 | 41.56 |
| 10 | 394.57 | 169.19 | 59.11 | ||
| Medium (79.79 GW) | 21.96 | 5 | 543.83 | 163.55 | 30.57 |
| 10 | 514.86 | 291.39 | 34.32 | ||
| 13.06 | 485.82 | 329.00 | 39.67 | ||
| Peak (98.92 GW) | 54.85 | 5 | 675.95 | 281.98 | 17.73 |
Publisher’s Note: MDPI stays neutral with regard to jurisdictional claims in published maps and institutional affiliations. |
© 2022 by the authors. Licensee MDPI, Basel, Switzerland. This article is an open access article distributed under the terms and conditions of the Creative Commons Attribution (CC BY) license (https://creativecommons.org/licenses/by/4.0/).
Share and Cite
MDPI and ACS Style
Choi, W.Y.; Kook, K.S.; Yoo, H.-J. Effect Quantification of BESS Providing Frequency Response on Penetration Limit of VER in Power Systems. Energies 2022, 15, 9380. https://0-doi-org.brum.beds.ac.uk/10.3390/en15249380
AMA Style
Choi WY, Kook KS, Yoo H-J. Effect Quantification of BESS Providing Frequency Response on Penetration Limit of VER in Power Systems. Energies. 2022; 15(24):9380. https://0-doi-org.brum.beds.ac.uk/10.3390/en15249380
Chicago/Turabian StyleChoi, Woo Yeong, Kyung Soo Kook, and Hyeong-Jun Yoo. 2022. "Effect Quantification of BESS Providing Frequency Response on Penetration Limit of VER in Power Systems" Energies 15, no. 24: 9380. https://0-doi-org.brum.beds.ac.uk/10.3390/en15249380
Note that from the first issue of 2016, this journal uses article numbers instead of page numbers. See further details here.