1. Introduction
The rapidly growing developing market of shared urban mobility brings with it newer and newer technical solutions. Initially, classic bicycles were one of the main means of transport used in shared mobility systems. In recent years, the shared mobility market has been increasingly filled with electric scooters [
1]. Classic bikes used in shared mobility systems have been dominated by scooters, which can be found on every street in larger cities. An alternative to scooters has become bicycles with electric assistance. Electric bikes are becoming more popular and accessible [
2,
3,
4]. In 2019, the market for electric bicycles in shared mobility systems was estimated to be 28%, and in 2020, it was already 44%. It is expected that in the coming years, the share of electric bicycles in vehicle sharing systems will continue to grow [
5]; therefore, electric bikes will undoubtedly replace traditional bicycles in public bicycle rental systems.
The safe use of an electric bike requires that the rider has some experience in choosing the right assistance mode. Dangerously fast assisted driving is often observed, according to the following principle: “I can do more with power assistance”. Manufacturers of electric bicycles are introducing a number of safeguards, consisting mainly of disconnecting the electric drive when the pedals stop rotating or there is no noticeable pressure on the pedals. Sometimes, speed limits are also applied, which is very important when driving in the city. An electric bike has a much higher weight than a traditional bike and requires more power to move. At the same time, it allows people with a poor physical condition and diseases that exclude excessive physical activity to move. An important research problem is the comparison of the energy efficiency of electric and traditional bicycles, as well as the difference in purchase and operating costs, in the context of the profitability of the rental company. Optimization of energy consumption and, thus, maintenance costs of vehicles used in shared mobility systems is very important. The increased costs generated by electric vehicles will ultimately result in an increase in the price of renting bicycles. It is therefore important to use the battery efficiently, which will translate into overcoming longer distances using electric motor support.
Customers of public bike rental schemes are people who vary greatly in their experience in driving electric bikes, as well as their physical condition and health. According to the authors, it is becoming expedient to look for an intelligent electric assistance control system that would provide only as much additional energy to the cyclist–bicycle system as is needed at a given moment to move at a fixed and safe speed. Such a system would have to continuously and online monitor the mechanical parameters of the bike (e.g., speed, cadence, power generated by the human on the pedals) and human performance (e.g., pulse, pressure, saturation). An additional advantage of using this type of system would be savings in electricity consumption, which are part of the postulate of sustainable development. The introduction of an intelligent assistance system would mean recognizing that an electric bike from a public rental system is to serve only the needs of transport customers and will not be used, for example, for recreational and sports purposes. However, before such a system is created, it is first necessary to develop tools for assessing the energy efficiency of electric bicycles and mathematical models of control and simulation of bicycle dynamics. Second, a system to measure and acquire data needed to control the assistance should be chosen. For obvious reasons, the data measurement and acquisition system must be low budget. The authors asked themselves whether the technologies used in bicycle computers could be used for this purpose. Bicycle computers have become a typical and popular tool for recording the basic parameters of the route and the condition of the cyclist, used by both professional cyclists and amateurs using bicycles for recreational purposes [
6]. As is standard, the computer records data from the built-in GPS module and from the barometric altimeter and thermometer. After installing additional measuring devices, it is possible to record, among others: speed converted from wheel rotation, cadence, power, pedaling asymmetry, pedaling effectiveness, pedaling smoothness and the cyclist’s heart rate.
The bicycle computer and bikes used for the research, the test route and additional measurement sensors mounted on the bikes were discussed in the first part of this article. The first part of this article [
7] proposed methods for processing and filtering data from the GPS module and the barometric altimeter. Data defining the trajectory of the bicycle’s movement were analyzed, and an average route was determined on their basis. The height of the averaged route above sea level and its slope were also determined. The second part focuses on data obtained from external sensors. The aim of the research was to evaluate the recorded data in terms of their suitability for the scientific evaluation of the anthropotechnical cyclist–bicycle system. Among other things, this type of data could be used to compare the energy efficiency of electric bicycles with conventional bicycles, to design systems that optimize the cyclist’s effort and to prepare cycling simulators.
It is obvious that a bicycle computer cannot be treated as a professional measuring apparatus. However, it has a number of advantages that make it a tool for measuring and recording data. The advantages include: easy installation on bikes, low weight, aerodynamic shapes, a large number of recorded parameters, easy attachment of additional transducers and low energy consumption of dedicated transducers. In addition, the low purchase cost (at the smartphone level) makes it possible to use multiple meters at the same time (simultaneous testing), and it is also possible to obtain data from the cycling community (many people have such equipment). The bicycle computer practically does not disturb the experiment compared to the professional equipment that should be mounted on the bicycle.
2. Materials and Methods
The studies used four bicycles: two electric-assisted bicycles and two conventional bicycles. All rides were carried out by the same cyclist on the same route with a length of approximately 2.7 km and a difference in elevation of approximately 25 m. Since the main purpose of the study was the evaluation of electric bicycle energy, many more measurements were carried out and many more parameters were measured than were later used to evaluate the bicycle computer as a tool for measurement and data acquisition. A measurement kit was used to record the data, which included the bicycle computer ELEMNT ROAM, Wahoo CADENCE, Wahoo SPEED, TICKR and a dual pedal system with a built-in power sensor, Look Exact. More details on the bikes used, the measuring sensors and the test route can be found in the first part of the article [
7], in which the quality of the trajectory, distance and slope data was evaluated. This part of the article focuses on velocity, cadence and power data. Electric bike rides were performed in four available assistance modes (Eco, Tour, Sport, Turbo) and without assistance. Conventional bikes were used for comparison with electric bikes in terms of power demand during the test route.
The cycling computer records data at a frequency of 1 Hz. Methods used in signal processing and time series analysis can be used to analyze them. It can be noted that these are nonperiodic and nonstationary signals. In the analysis of data on speed and distance traveled, elementary methods of numerical differentiation (of various orders) and signal integration were used. However, they introduce additional noise, and the results require the use of smoothing filters. The speed measured with an additional sensor (from the wheel) may differ from the speed calculated from GPS coordinates due to the slope of the route. In the case of a test route with a slight slope, these differences were negligibly small. One of the important elements of cycling technique is the choice of the right gear ratio. A method to detect the gear ratio used at a given moment of riding was proposed on the basis of cadence and speed data, as well as available bicycle gear ratios. Due to the freewheel, it should be taken into account that, in certain circumstances, it is not possible to clearly determine the gear ratio. An analysis of the recorded power signals generated by the roverist in various assistance modes was carried out. The aim was to show that a person would not be able to use the support on their own in an optimal way. To evaluate the asymmetry of power distribution to the pedals, the k-mean clustering method was used. To assess the condition of the cyclist, methods were used to study the correlation of pulse and power signals and cadence. The following analyses of the data recorded by the bicycle computer used information on the height above sea level of the test route, which was determined in the first part of the article based on data from the digital terrain model (DTM) [
7].
3. Evaluation of Velocity Data
As is standard, the bicycle computer calculates the speed from the change in GPS coordinates over time. Due to the noise of the GPS data, this method is subject to a significant error. Currently, a method of calculating speed based on the delay of satellite signals, due to the Doppler effect, is being developed. Research shows that this method of determining speed is much more accurate [
8]. Perhaps soon this method will also be implemented in bicycle computers.
The computer can also alternately record speed data from a speed sensor, if such a sensor is additionally installed on the bike and paired with the computer. Such data should be much more accurate. However, they depend on entering the correct value of the outer diameter of the wheel into the measurement system. The error thus caused will be a systematic error and can be easily corrected by comparison with the GPS data.
In the vast majority of cases, speed transducers work on the principle of magnetic sensors and require a magnet to be mounted on the wheel. One of the traditional bikes used for the tests was equipped with such a speed measurement system. More modern speed converters do not need a magnet to detect wheel revolutions. Instead, a three-axis accelerometer is used to determine the rotation of the hub and thus the speed. Such a transducer was mounted on one of the electric bikes used for the tests.
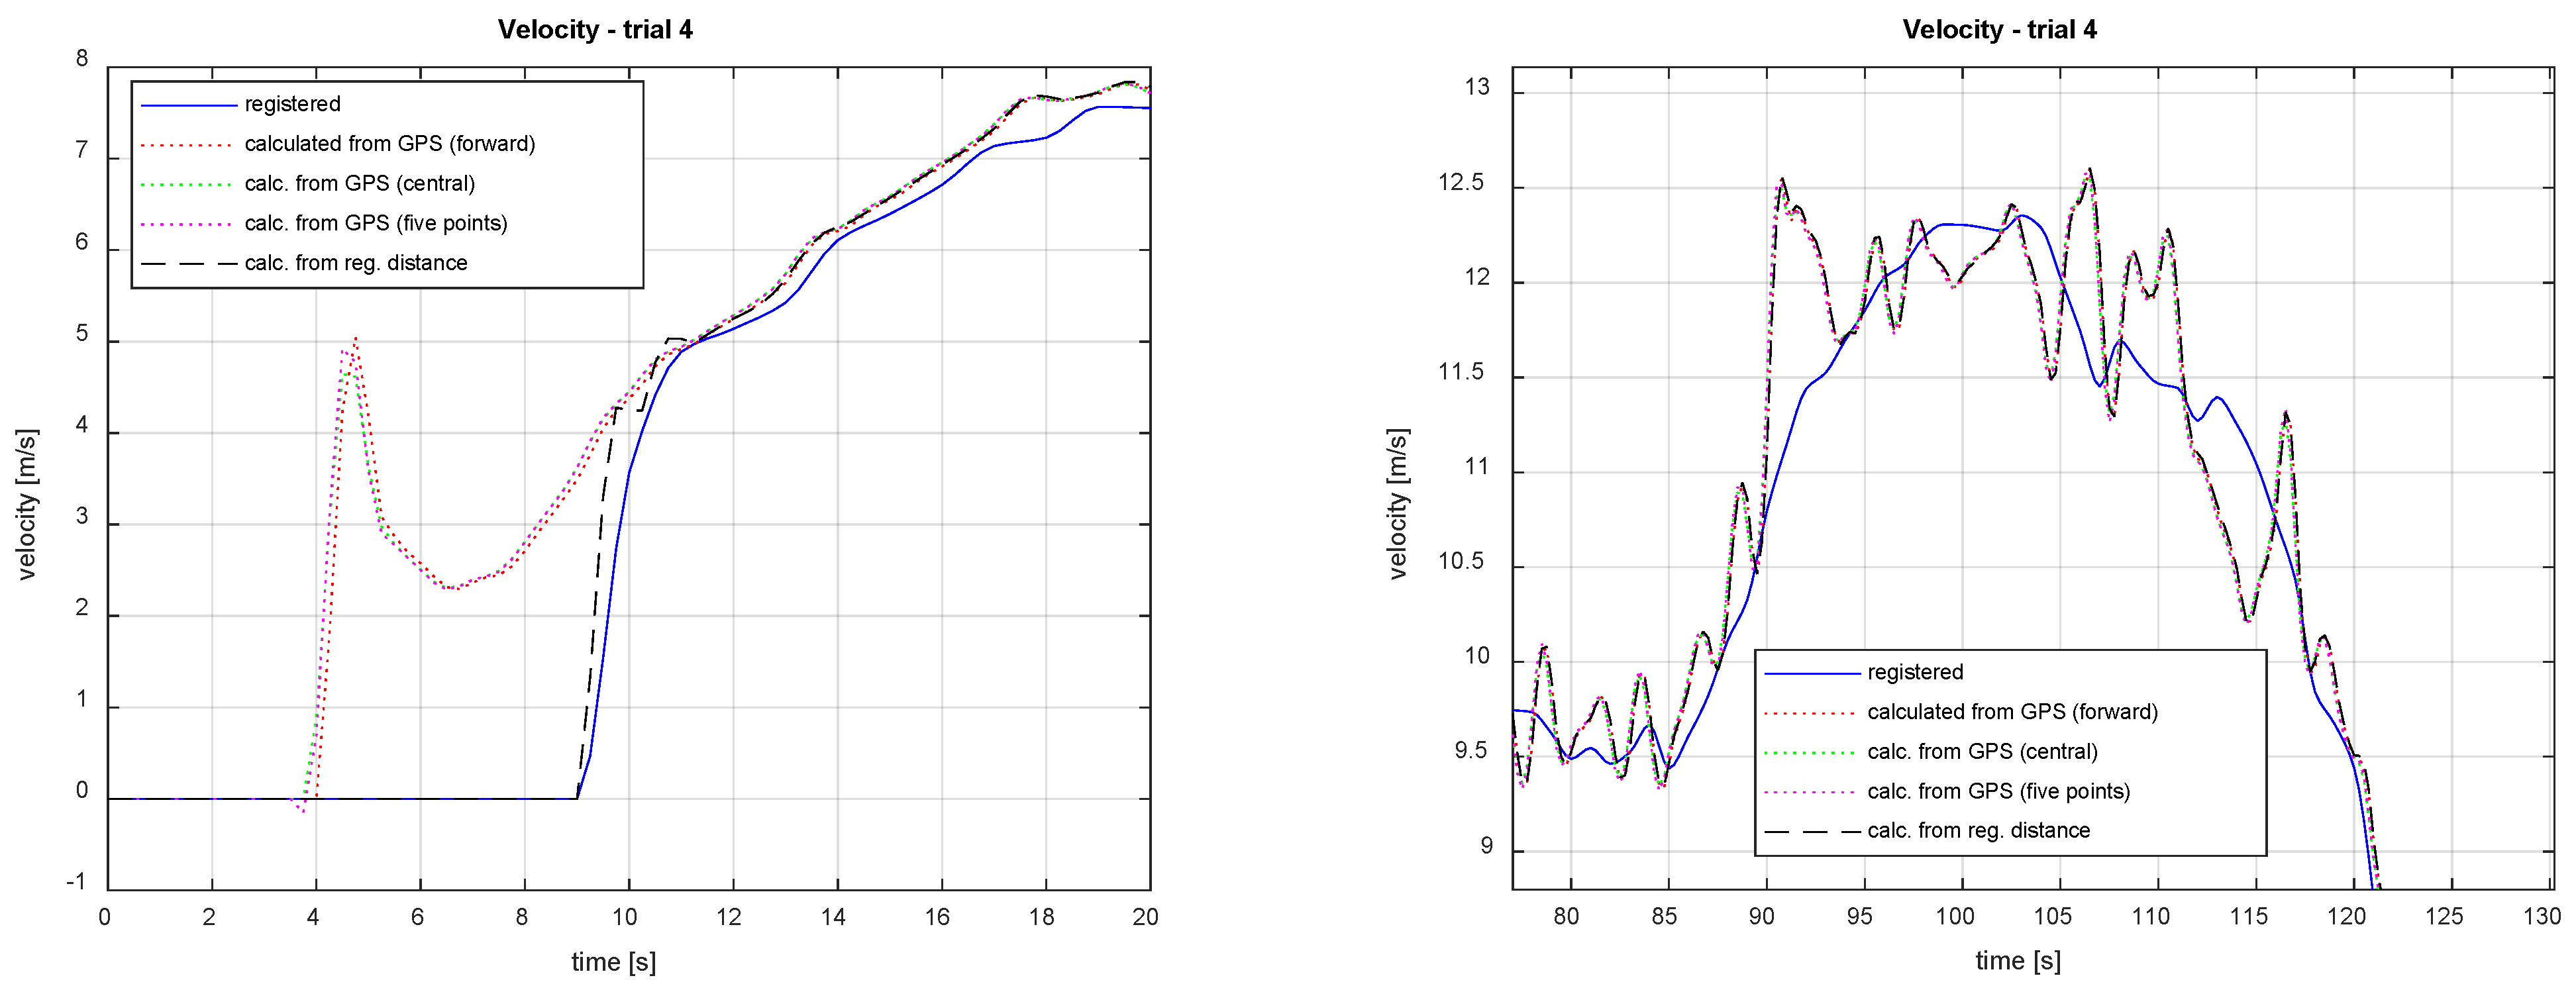
Figure 1 shows exemplary speed charts recorded by a bicycle computer and calculated numerically from GPS coordinates (using three numerical differentiation methods: forward and central difference, five-point scheme) and also from the recorded distance traveled. At the very beginning of the movement, it is visible that the non-zero signal of the speed recorded by the computer appears with a certain delay. It is most likely the effect of using an averaging filter. This is also evidenced by the fact that the speed calculated from the recorded GPS coordinates is greater than zero at that time. The recorded speed signal is much smoother than the signals calculated from GPS data post factum. At the same time, the choice of the method of determining the speed by numerical differentiation is of no great importance, as can be seen in the enlarged fragment of the diagram (
Figure 2). The averaging of the speed signal by the bicycle computer is also evidenced by small differences between the recorded distance and the distance calculated directly from the speed by integration using the trapezoidal method (
Figure 3).
Figure 4 compares exemplary graphs of the speeds recorded on the basis of the speed sensor data and those calculated numerically. In this case, there is no difference in the beginning of the movement. It is not known if the cycling computer also smoothed the signal received from the speed sensor. As stated before, numerically calculated speed signals are characterized by significant oscillations in relation to the recorded signal.
4. Cadence
Further analysis was limited to the data recorded for one of the electric bicycles. A wireless cadence sensor that does not require a magnet mounted on a crank was used.
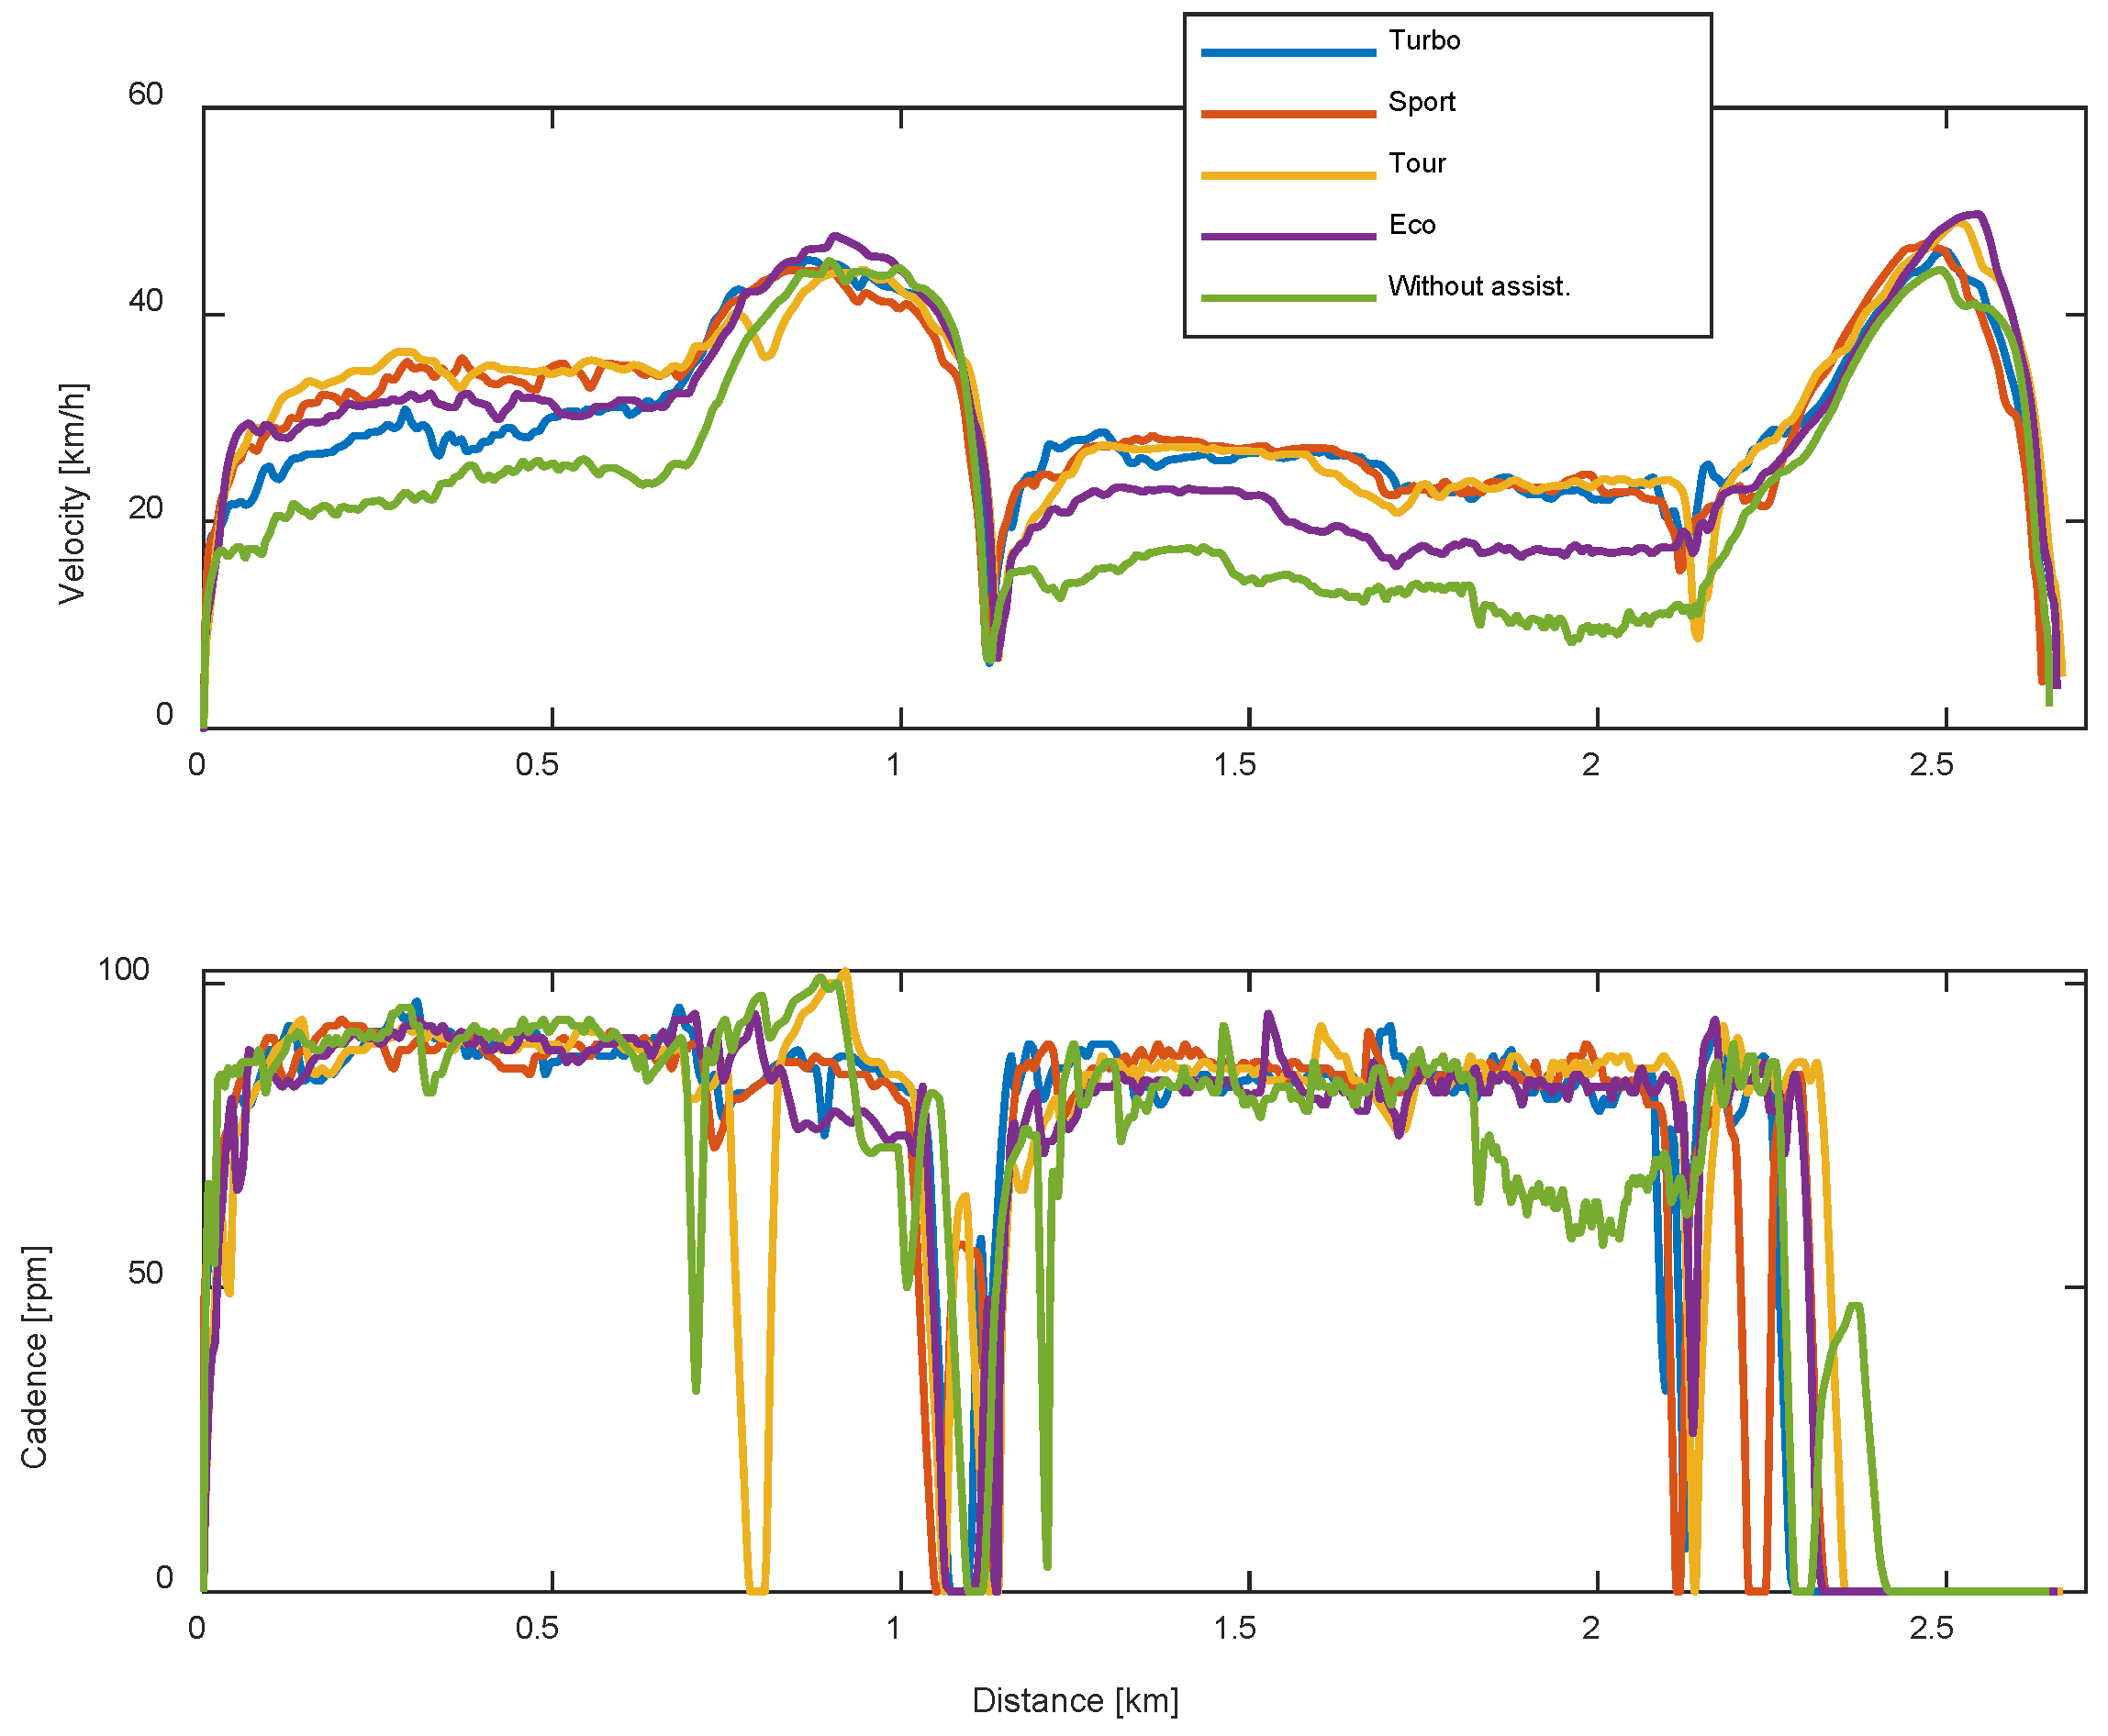
Figure 5 shows the recorded cadence and speed signals of this bike for four different assist modes and without assist. It can be seen that in all assist modes, the rider kept the cadence at a similar level, but the assisted speeds were higher. This means that with power assistance, the rider used higher gears.
Based on the speed and cadence signals, the current gear ratio of the bike can be determined while driving. An exception is made when the freewheel engages, for example, when going downhill. Then, the cadence is not directly related to the driving speed, and the value of the gear ratio is undefined. Since both the speed and cadence signals are highly noisy, the calculated gear ratio does not correspond exactly to the value that would result from dividing the number of teeth in the rear cassette by the number of teeth in the front (
Figure 6). In the case of calculations based on the speed recorded by the bicycle computer, a jump in the value is observed at the very beginning of the test, which results from the fact that the speed value is too low, probably due to the averaging filter used.
The used bicycle has wheels with the following numbers of teeth in the rear cassette: 11, 13, 15, 17, 19, 21, 24, 28, 32, 37, 42. The front sprocket only has 20 teeth, but due to the power steering system, it moves 2.5 times faster than the pedal crank (which is also the case in non-assist mode). The gear ratio, resulting directly from the number of teeth, is shown in
Figure 6 (dotted line). On the graph, some of the available gear ratios can be recognized, but the signal is noisy. The gear ratios were calculated from formula (1):
where
and
are the angular velocity of the crankshaft (cadence 2.5) and the angular velocity of the rear wheel (calculated from the linear velocity), respectively.
If the gear ratios of the bicycle are known, a simple classifying function can be built, automatically assigning the actual allowable values to the noisy signal of the calculated gear ratio, except when the freewheel is engaged (
Figure 7). The gear ratio data can be used to evaluate the driving technique [
9].
5. Power, Power Balance and Torque Effectiveness Data
As in the case of the cadence, the analysis was limited to the data recorded for one of the electric bicycles. Power metering pedals were used that measure power and cadence simultaneously and analyze power balance, pedaling (torque) effectiveness and smoothness. There are systems that measure power using the measurement of the forces on the crank [
10]. In laboratory conditions, optical systems for image analysis are also used [
11].
Figure 8 shows the human-generated power in different assist modes depending on the position along the route. In addition, it is shown how the altitude of the route changed, meaning that the generated power can be compared with the slope of the route. The recorded power signal shows a very high variability. The power values in the subsequent sampling times differ significantly. This is shown in
Figure 9, which shows the calculated forward difference of power signals in the turbo and unassisted modes. Over one second, the cyclist made, on average, less than two turns of the crank, and theoretically, during this time, he could rapidly change the force on the pedals. However, it is more likely to smoothly adapt the power to the increasing demand for it, for example, when climbing a hill. Unfortunately, with the sampling rate of 1 s, it is impossible to determine what is the cause of such large jumps in the power value. This means that, as with other data (e.g., GPS), the frequency of recording power every second is insufficient.
In practice, two methods are used to calculate the average power [
12]. The first of them, average angular velocity power (AAV), determines the average power per crank revolution on the basis of relationship (2):
where
—crank length;
—angular speed of the crank averaged per revolution (
T—period of one revolution);
—averaged force on pedals (
N—number of samples per revolution).
The second more precise method, instantaneous angular velocity power (
IAV), calculates power based on dependence (3):
and requires sampling of instantaneous force and rotational speed. Unfortunately, the manufacturer of the power measurement pedals used in this research does not specify which calculation method it uses (probably AAV) [
12].
The average human power generated in the turbo mode was 100 W less than the power needed to drive in the unassisted mode (
Figure 10). At the same time, the average speed of the test route covered was significantly higher in the assisted modes. This means that the cyclist did not behave rationally and did not try to optimize their effort. Unfortunately, it is a human factor that will be difficult to eliminate during the trials.
The bicycle computer determines and stores a series of information which allows for diagnosing pedaling asymmetries, which depend on the individual, and the biomechanical characteristics of each cyclist [
13,
14]. Professionals try to eliminate asymmetry through proper training. Even a preliminary analysis of the recorded data as a function of the distance traveled (
Figure 11) shows that the asymmetry of pedaling depends on the assist mode. It is greater in turbo and sport modes, which is when the power delivered by the rider is lower. In general, the advantage of the right side over the left side is visible. The ideal values would be close to 50%.
The figure (
Figure 12) shows the asymmetry of the power distribution to the pedals of the cyclist performing the tests, in the case of two extreme support modes: turbo and without. The L/R power balance is presented in this case as a function of human-generated power. The points on the graph are divided into five subsets using the k-mean clustering method. In turbo mode, where the power demand does not exceed 250 W, the asymmetry decreases with increasing power. A similar tendency occurs in the unassisted mode, except that after exceeding 250 W, the asymmetry increases again. Similar conclusions can also be reached by analyzing the graph (
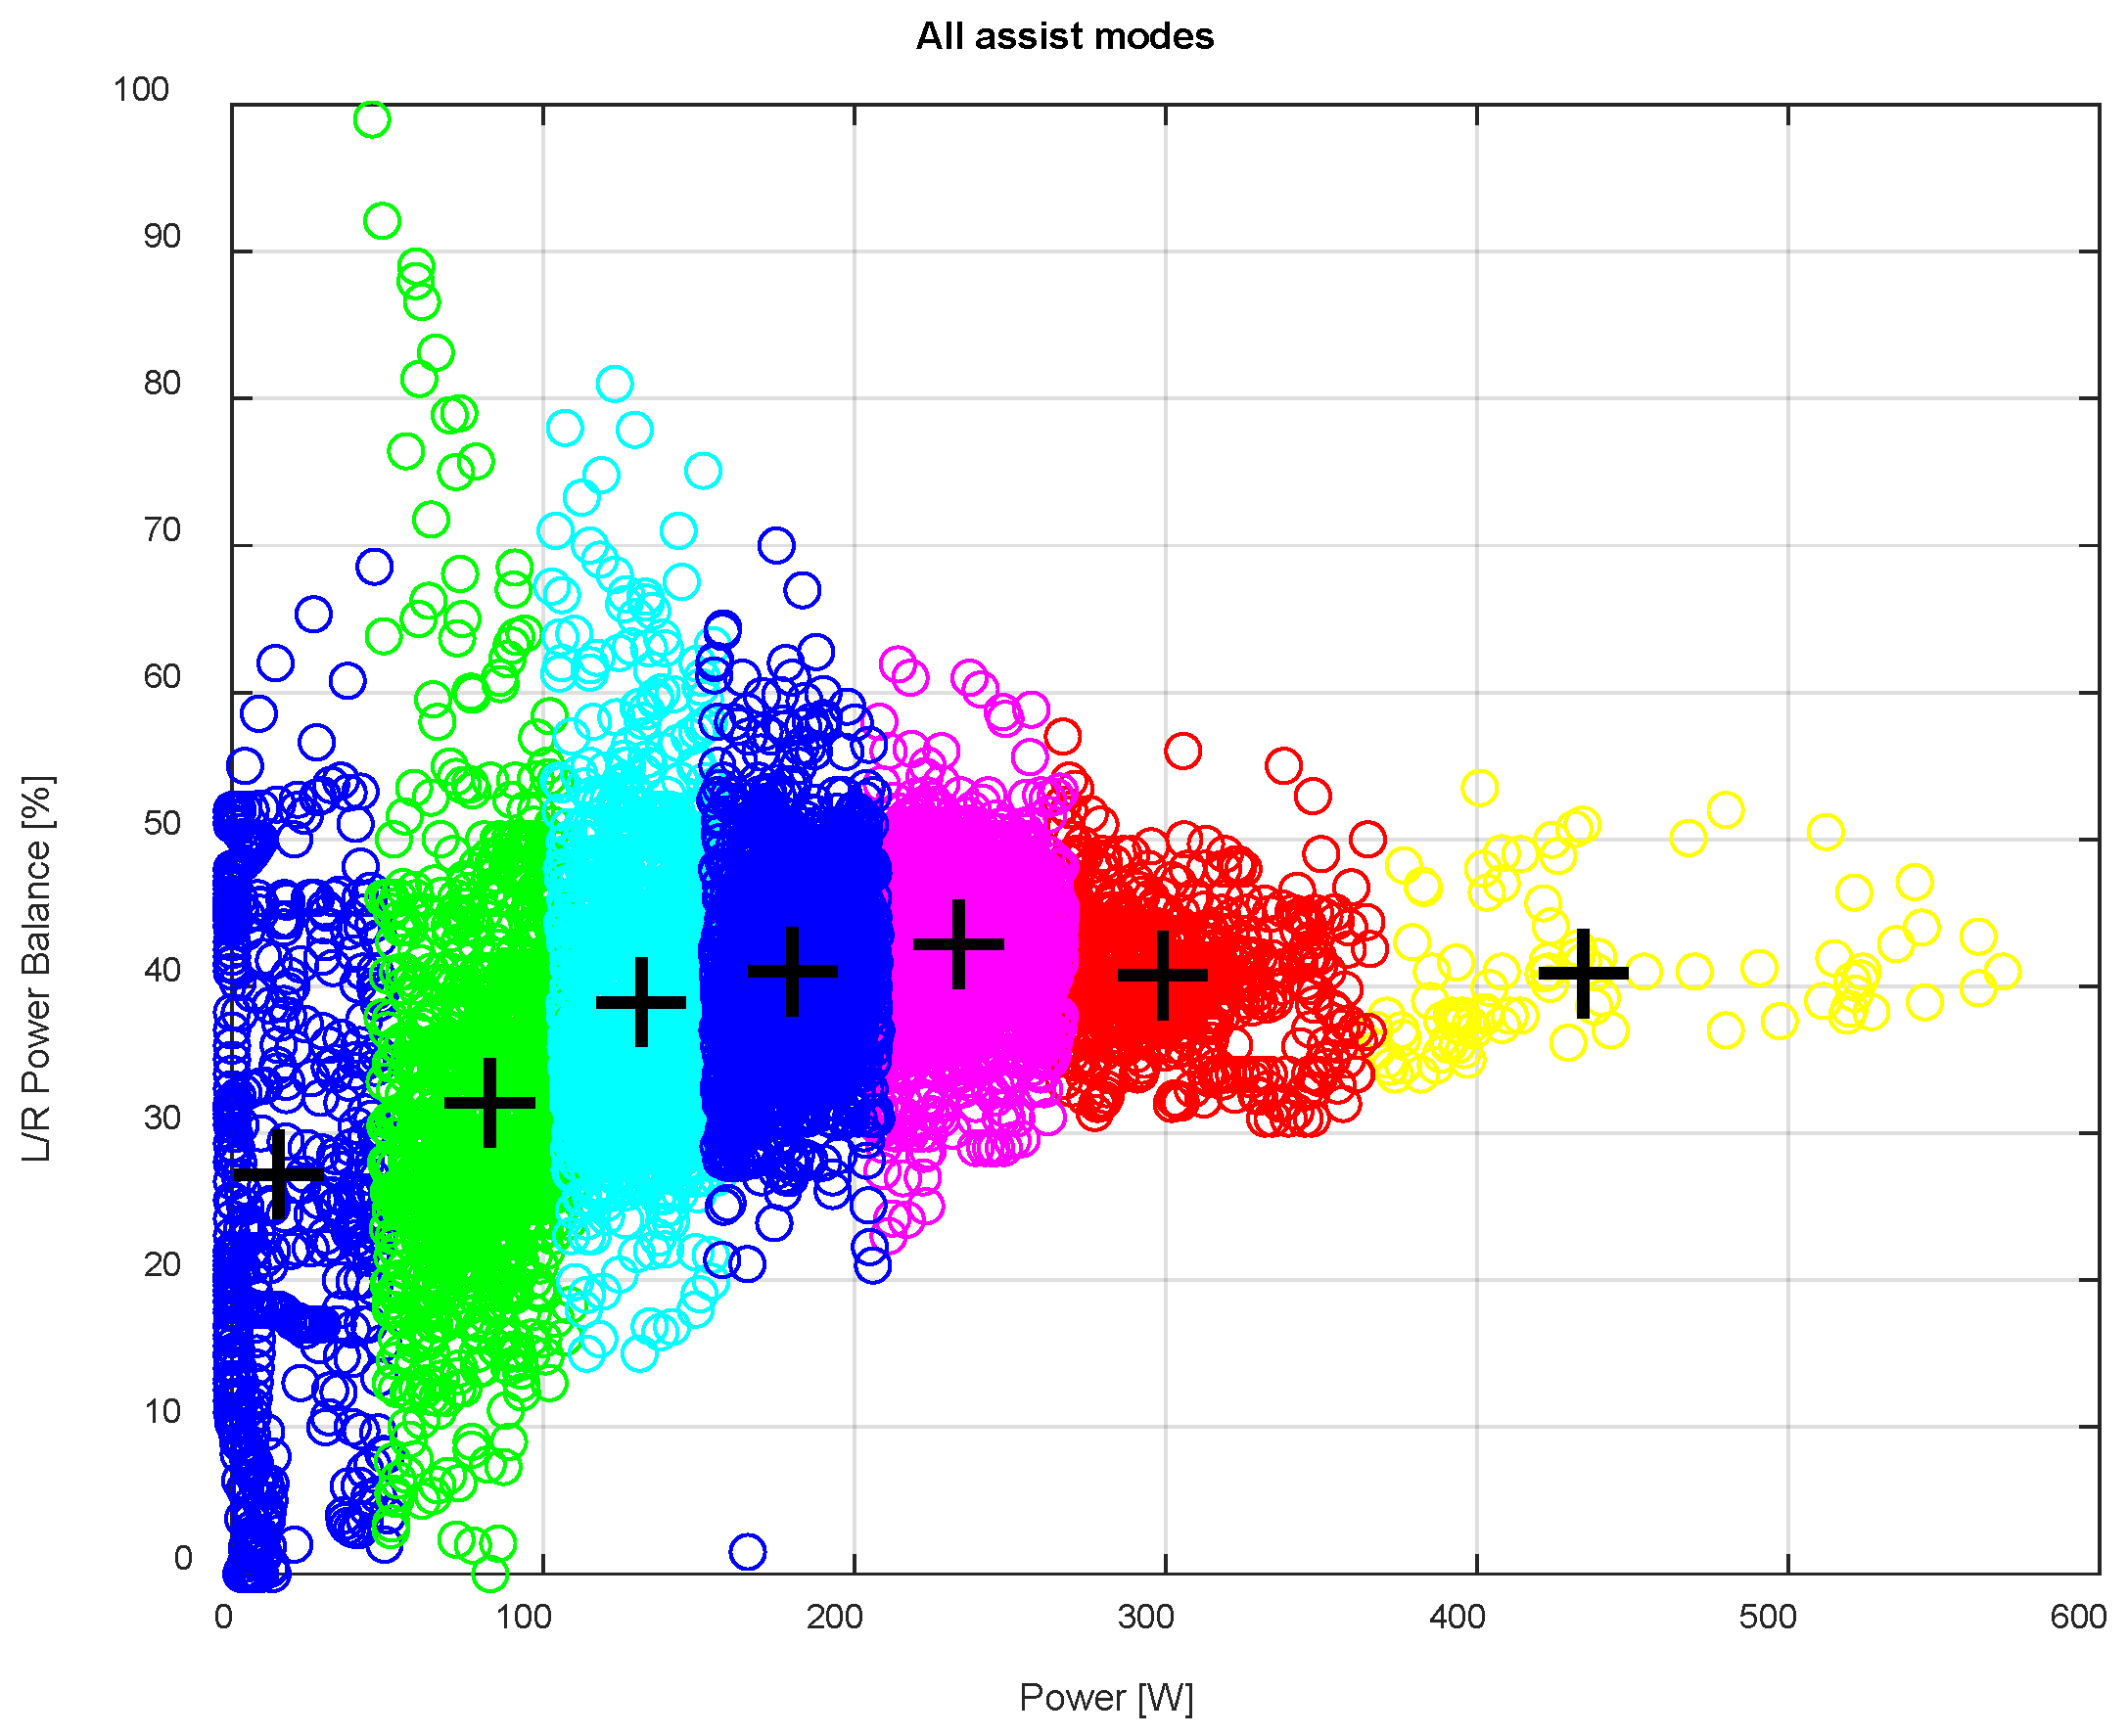
Figure 13), which collected the results from all five support modes.
The efficiency of the drive torque transmission to the pedals is calculated from Formula (4) [
12]:
where
and
are the highest and lowest peak power values per crank revolution, respectively.
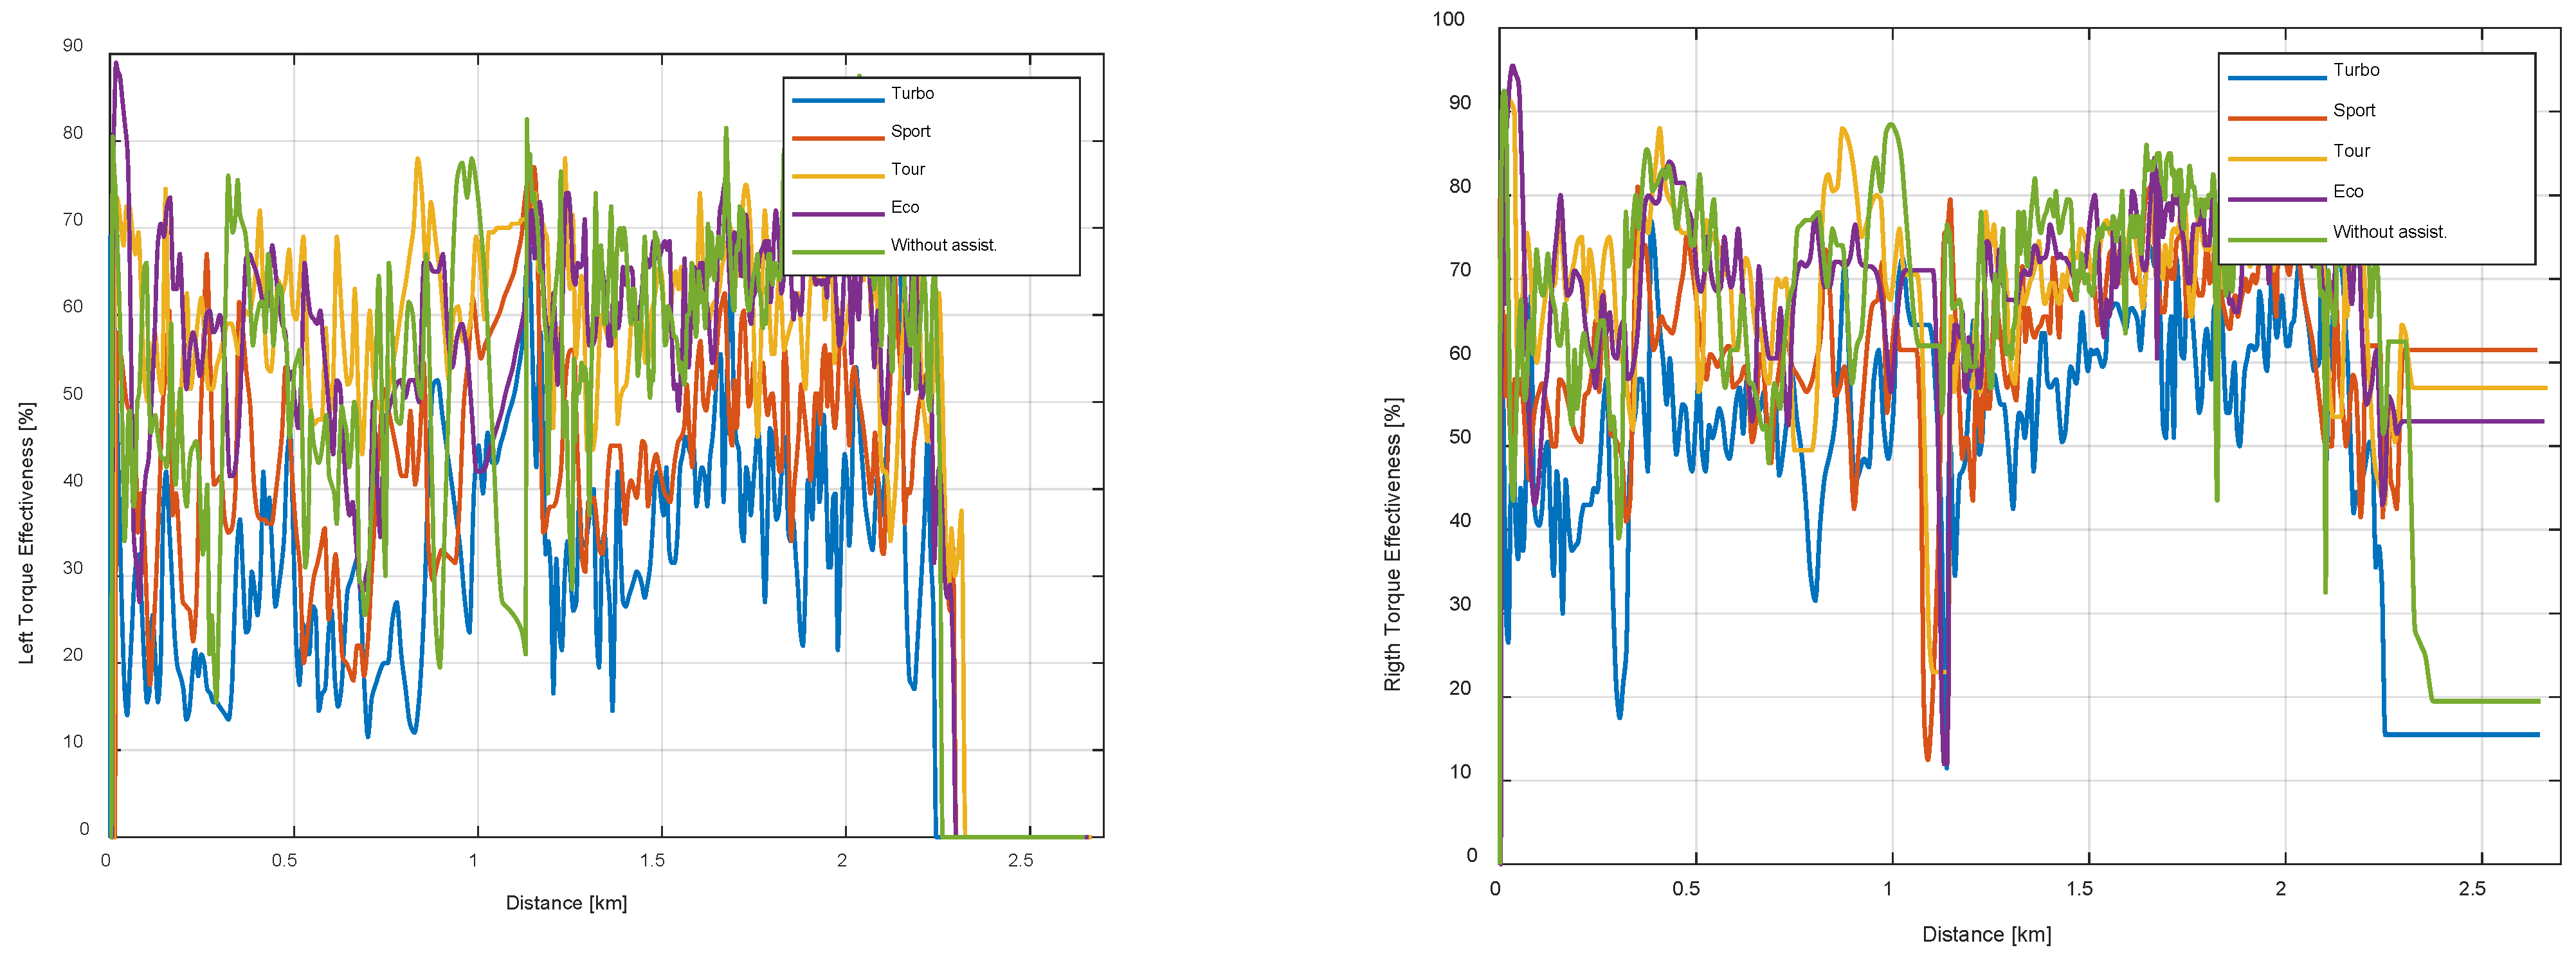
The metering system provides information on pedaling efficiency for the left and right pedals separately. Pedaling efficiency is slightly inferior to the left side. Interestingly, the efficiency in the turbo mode is clearly lower than in the non-assist mode (
Figure 14).
Pedaling smoothness is obtained from formula (5) [
6]:
where
Pavg and
Pmax are the averaged and highest power values during one crank revolution, respectively.
As stated before, the smoothness of pedaling decreases in the assisted modes (
Figure 15); this effect is most clearly visible in the turbo mode. Perhaps the reason could be found in some overdrive of the power steering system. When changing from a traditional to an electric bike, a cyclist has to adapt to new conditions.
The evaluation of the quality of data related to the torque and power transmitted by the cyclist would require additional tests with the use of specialized equipment for measuring crank speed and pedal force with a much higher sampling rate. This type of research was carried out for pedals with power measurement from another company [
15].
6. Cyclist Health—Pulse Data
The cycling computer records the rider’s current heart rate, which it receives from a sensor attached to the rider’s wrist. A rider’s heart rate is influenced by their effort while riding, which is dependent on the generated power and cadence.
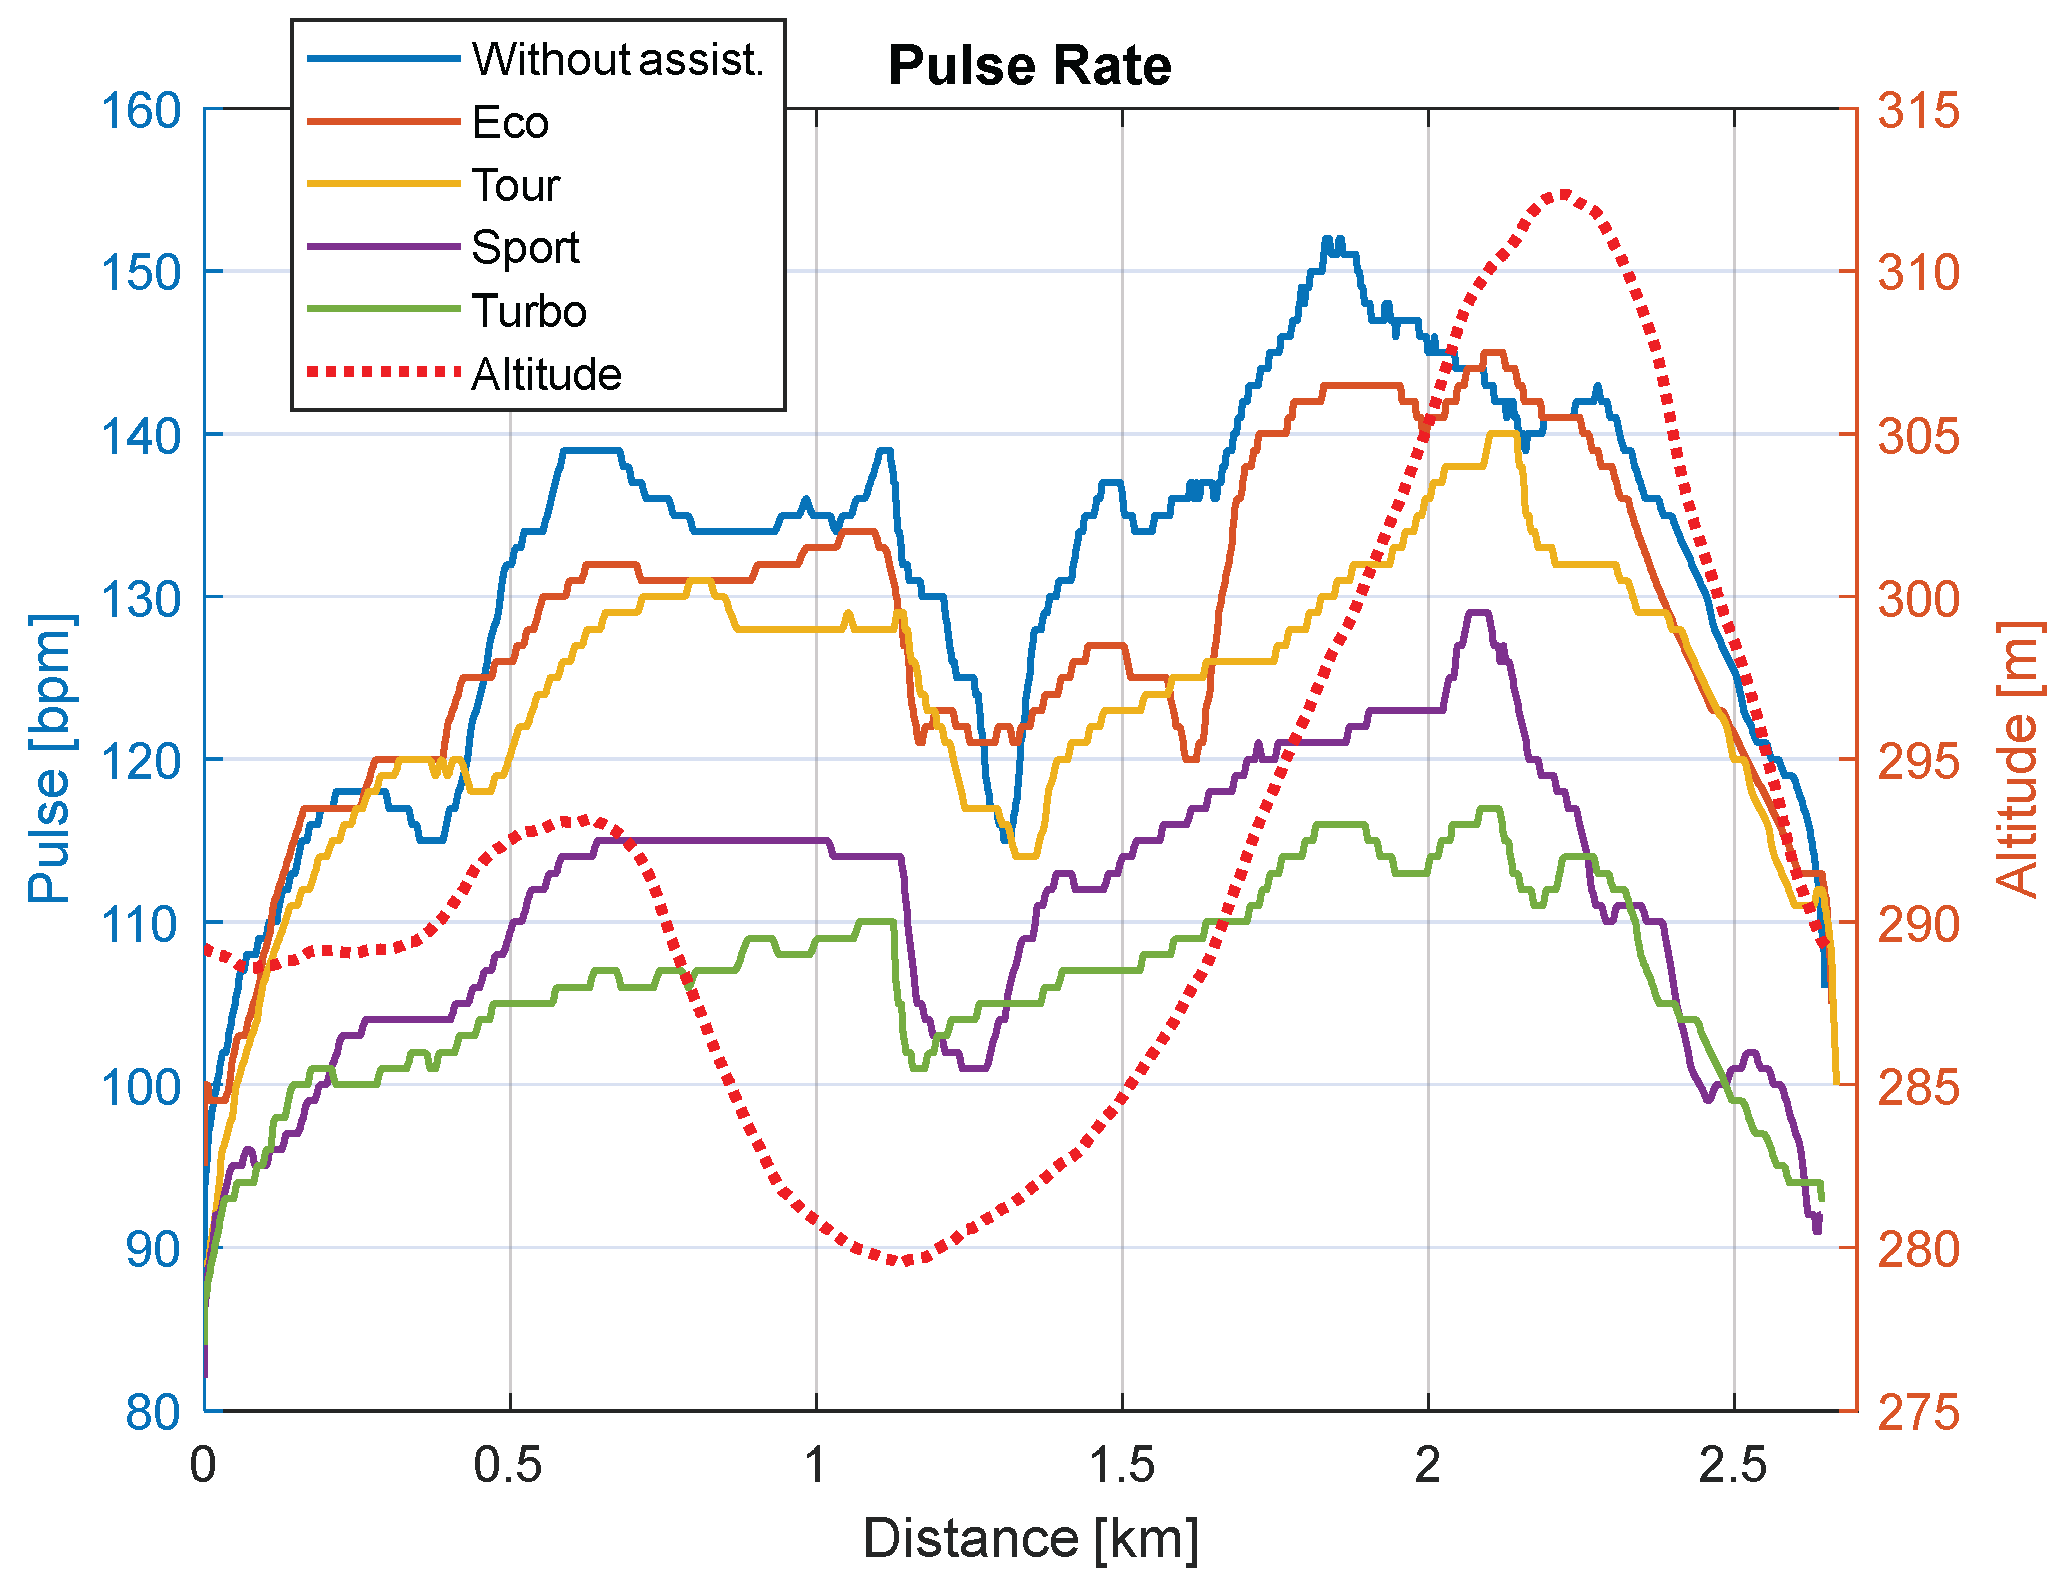
Figure 16 shows the recorded heart rate values while riding an e-bike in the different assist modes. Pulse values were related to the distance traveled, which allows showing the relationship of the pulse with the inclination of the route and the effort of the cyclist while riding. Obviously, the heart rate increases the least in maximum assist mode and is highest in non-assist mode. We can also see changes in the heart rate associated with changes in the slope of the route. The nature of the charts is significantly influenced by the human factor. As shown in
Figure 17, the rider moves much faster in the assisted modes, although they may have conserved energy.
Physiologists observe two characteristic phenomena, namely, heart rate response lag and heart rate drift upward [
9,
16,
17]. The first is a delayed response of the body to the increased (reduced) effort and is seen in the shift in time of the peaks in the heart rate graph and the persistence of elevated heart rate even after exercise has stopped (
Figure 18). The second is a systematic increase in heart rate to a certain limit value despite the effort being kept at an almost constant level. This effect is also seen in
Figure 18 in the range from 300 to 360 s.
The cross-correlation method can be used to investigate the delay between the signals. In order to assess the magnitude of the delay in the pulse signal, the correlation between the pulse and cadence signals as well as the pulse and power generated by the cyclist was investigated. Before that, all signals were normalized with their maximum values. The correlation between the cadence signal and the heart rate signal is slightly higher than the power generated by the rider and the heart rate. The graphs show the maximum values of the correlation in various electric bike riding modes and the determined mutual delays of the signals (
Figure 19). In both cases, there is a time shift in the signals in the range from about 17 to 30 s. The delay is also influenced by the assisted or unassisted riding mode, i.e., the rider’s effort level [
18]. The lags are the smallest in turbo mode, which seems obvious as the least effort is spent in this mode.
It should be emphasized that the presented results are unique and characteristic of the cyclist who conducted the tests. They can vary considerably depending on the individual characteristics of the organism and the level of training.
7. Discussion
According to the authors’ knowledge, there are no examples of similar data-derived analyses obtained from bicycle computers in the literature; hence, it is not possible to compare the results. Only in [
12] were algorithms for determining the average power per revolution used. The examples presented for the analysis of data related to the measurement of driving speed show that the best results are obtained if an additional speed sensor is mounted on the bike. Speed can also be determined numerically on the basis of GPS data. It has been shown that it is best to use the simplest method, i.e., the forward difference method. The numerical differential method generates noise, which can be eliminated by using averaging filters. The bicycle computer in the absence of a speed sensor also uses GPS data and averaging, but the algorithms selected by the computer manufacturer are not known. On the basis of the cadence and speed data, it is theoretically possible to determine what the gear ratio was. However, this task is made difficult by the humming cadence and speed data, the low sampling rate and the ability to ride on a freewheel. In the case of an intelligent e-bike assistance system, the decision to change gears should be made by an automaton, not a human. An alternative is to use existing automatic or continuously variable transmission solutions [
19,
20]. Data on average power per rotation provided by the rider along with speed and cadence will be key control variables in intelligent electric bike assist systems. The analyses carried out have shown that the quality of these data is sufficient. It would only be necessary to increase the sampling rate so that it is greater than the maximum frequency of the rotation of the crank (cadence). An important advantage of a bicycle computer is the ability to use cheap devices that monitor the efficiency of the cyclist. Pulse measurements, possibly pressure and saturation, will constitute the second group of variables controlling intelligent assistance systems. The sampling rate of 1 Hz is sufficient in this case.
8. Conclusions
Recording data with a frequency of 1 s is insufficient and reduces the usefulness of the recorded signal for later analyses. The same applies to the speed signal that the computer calculates from the GPS data. A much smoother speed signal can be obtained by using an additional specialized sensor for measuring speed connected to a computer using ANT+ technology. Of course, in this case, recording with a higher frequency would be very advantageous.
Cadence data can be obtained from the cycling computer from a dedicated sensor or from pedals with power measurement. The recorded cadence signal is quite smooth, and the sampling rate of 1 s seems acceptable. Based on the cadence and speed signals, the current gear ratio of the bicycle can be calculated, with the proviso that, in the case of freewheel operation, the result is ambiguous. The obtained gear values are strongly noisy. When the gear ratios of the bicycle resulting from the number of gear teeth are known, a simple classifying function can be built to identify the actual gear ratio on the route.
The power signal transmitted by the cyclist fluctuates significantly more than you might expect. There is no doubt that logging a power signal every 1 s is insufficient. In the case of the cyclist who performed the tests, the analysis showed asymmetry in pedaling. The power transmitted to the right pedal was greater than to the left pedal. Interestingly, this asymmetry was greater in the power-assisted modes. In general, the asymmetry was greater when the power delivered by the rider was lower. There was also an optimal power level with the lowest pedaling asymmetry. Similar comments can be made for the efficiency and smoothness of pedaling. In power assist modes, these indicators deteriorate. It seems that the control system providing the additional electrical power overdrives the dose of energy, and the rider has a hard time adjusting to it.
Recording a heart rate signal every 1 s seems acceptable. Based on heart rate and cadence or power output, the delays in the rider’s physiological response to exercise can be detected. Electric assist significantly lowers the rider’s pulse. Using the rider’s heart rate information to control the dose of power in assist modes can be considered.
Summarizing the results of the analyses carried out in both parts of this article, it can be stated that the frequency of data recording by the bicycle computer is too low, which makes subsequent analyses difficult. It seems that it should be at least in the 4–5 Hz range. This is a postulate that the manufacturers of this type of device may consider in the future. Another problem is the lack of information about internal data processing algorithms, in particular the smoothing filters used.
Taking into account all the advantages and disadvantages of a bicycle computer presented above and in the first part of this article [
7], it can be finally concluded that it is a tool that can be successfully used in the research of anthropotechnical cyclist–bicycle systems. According to the authors, the data recorded by the bicycle computer can be used successfully to assess the energy efficiency of electric bicycles and to develop simulation models of bicycle dynamics. This will be the subject of further research.
This is a necessary step to further develop the concept and algorithms of an intelligent assistance system on electric bicycles. Thanks to such a system, an electric bike rented in the public system would become even more accessible to a wide group of users with different physical predispositions. The system would also improve traffic safety. Currently, it is not possible to download data from a bicycle computer in online mode and transfer it to the power control system. In the case of building such a system, it seems more likely to use ANT+ technology to communicate with the necessary sensors. Another way is to cooperate with bicycle computer manufacturers.
Author Contributions
Conceptualization, A.K., T.M. and Z.S.; methodology, A.K., T.M. and Z.S.; software, A.K., T.M. and Z.S.; validation, A.K., T.M. and Z.S.; formal analysis, A.K., T.M. and Z.S.; investigation, A.K., T.M. and Z.S.; resources, A.K., T.M. and Z.S.; data curation, A.K., T.M. and Z.S.; writing—original draft preparation, A.K., T.M. and Z.S.; writing—review and editing, A.K., T.M. and Z.S.; visualization, A.K., T.M. and Z.S.; supervision, A.K., T.M. and Z.S.; project administration, A.K., T.M. and Z.S.; funding acquisition, A.K., T.M. and Z.S. All authors have read and agreed to the published version of the manuscript.
Funding
This research received no external funding.
Institutional Review Board Statement
Not applicable.
Informed Consent Statement
Not applicable.
Data Availability Statement
The data presented in this study are available on request from the authors.
Conflicts of Interest
The authors declare no conflict of interest.
References
- UTO Poland Portal. The Market of e-Scooters. Available online: https://utopolska.pl/rynek-detaliczny-hulajnog-elektrycznych/. (accessed on 28 December 2021).
- Czech, P.; Turon, K.; Urbanczyk, R. Bike-Sharing as an Element of Integrated Urban Transport System. In Advanced Solutions of Transport Systems for Growing Mobility Book Series Advances in Intelligent Systems and Computing; Sierpinski, G., Ed.; Springer International Publishing: Berlin, Germany, 2018; Volume 631, pp. 103–111. [Google Scholar]
- Turoń, K.; Kubik, A.; Chen, F. When, What and How to Teach about Electric Mobility? An Innovative Teaching Concept for All Stages of Education: Lessons from Poland. Energies 2021, 14, 6440. [Google Scholar] [CrossRef]
- Turoń, K.; Kubik, A.; Chen, F. Electric Shared Mobility Services during the Pandemic: Modeling Aspects of Transportation. Energies 2021, 14, 2622. [Google Scholar] [CrossRef]
- Shared Micromobility State of the Industry Report. Available online: https://nabsa.net/wp-content/uploads/2020/10/NABSA-2020-State-of-the-Industry-Report.pdf. (accessed on 28 December 2021).
- Okraszewska, R.; Grzelec, K.; Jamroz, K. Developing a cycling subsystem as part of a sustainable mobility strategy: The case of Gdansk. Sci. J. Sil. Univ. Technol. 2016, 92, 87–99. [Google Scholar] [CrossRef]
- Matyja, T.; Kubik, A.; Stanik, Z. Possibility to Use Professional Bicycle Computers for the Scientific Evaluation of Electric Bikes: Trajectory, Distance, and Slope Data. Energies 2022, 15, 758. [Google Scholar] [CrossRef]
- Sathyamorthy, D.; Shafii, S.; Fitry, M.; Amin, Z.; Jusoh, A.; Ali, S. Evaluation of the accuracy of global positioning system (GPS) speed measurement via GPS simulation. Def. S T Tech. Bull. 2015, 8, 51–62. [Google Scholar]
- Cho, C.; Yun, M.; Yoon, C.; Lee, M. An ergonomic study on the optimal gear ratio for a multi-speed bicycle. Int. J. Ind. Ergon. 1999, 23, 95–100. [Google Scholar] [CrossRef]
- Balbinot, A.; Milani, C.; Nascimento, J.D.S.B. A New Crank Arm-Based Load Cell for the 3D Analysis of the Force Applied by a Cyclist. Sensors 2014, 14, 22921–22939. [Google Scholar] [CrossRef] [PubMed] [Green Version]
- Quintana-Duque, J.-C.; Dahmen, T.; Saupe, D. Estimation of Torque Variation from Pedal Motion in Cycling. Int. J. Comput. Sci. Sport 2015, 14, 1–17. [Google Scholar]
- Favero Electronisc SRL. Influence of Angular Velocity of Pedaling on the Accuracy of the Measurement of Cyclist Power. Research Article. Available online: https://www.dcrainmaker.com/images/2018/05/Influence-of-Angular-Velocity-of-Pedaling-on-the-Accuracy-of-the-Measurement-of-Cyclist-Power.pdf (accessed on 28 December 2021).
- Korff, T.; Romer, L.; Mayhew, I.; Martin, J. Effect of Pedaling Technique on Mechanical Effectiveness and Efficiency in Cyclists. Med. Sci. Sports Exerc. 2007, 39, 991–995. [Google Scholar] [CrossRef] [PubMed] [Green Version]
- Yamashitaa, K.; Matsudaa, A.; Ishikuraa, K.; Takagia, H.; Otsukab, S. Visualization of pedaling technique using cleat-size biaxial load cells. Procedia Eng. 2013, 60, 415–421. [Google Scholar] [CrossRef] [Green Version]
- Rodríguez-Rielves, V.; Lillo-Beviá, J.R.; Buendía-Romero, Á.; Martínez-Cava, A.; Hernández-Belmonte, A.; Courel-Ibáñez, J.; Pallarés, J.G. Are the Assioma Favero Power Meter Pedals a Reliable Tool for Monitoring Cycling Power Output? Sensors 2021, 21, 2789. [Google Scholar] [CrossRef] [PubMed]
- Molkkari, M.; Angelotti, G.; Emig, T.; Räsänen, E. Dynamical heart beat correlations during running. Sci. Rep. 2020, 10, 13627. [Google Scholar] [CrossRef] [PubMed]
- Nimmerichter, A.; Eston, R.; Bachl, N.; Williams, C. Longitudinal monitoring of power output and heart rate profiles in elite cyclists. J. Sports Sci. 2011, 29, 831–839. [Google Scholar] [CrossRef] [PubMed]
- Theurel, J.; Theurel, A.; Lepers, R. Physiological and cognitive responses when riding an electrically assisted bicycle versus a classical bicycle. Ergonomics 2012, 55, 773–781. [Google Scholar] [CrossRef] [PubMed]
- Automatic Transmission Is the Future of E-Bike Drivetrains. Available online: https://revonte.com/ (accessed on 28 December 2021).
- Research Project on Smart e-Bikes. Smart e-Bike Monitoring System. 2018. Available online: http://www.smart-ebikes.com/smart-ebikes/smart-e-bikes-monitor-system-sems/ (accessed on 28 December 2021).
Figure 1.
Example of velocity data.
Figure 1.
Example of velocity data.
Figure 2.
Enlarged parts of the speed chart.
Figure 2.
Enlarged parts of the speed chart.
Figure 3.
The difference between the recorded distance and the distance calculated from the speed signal.
Figure 3.
The difference between the recorded distance and the distance calculated from the speed signal.
Figure 4.
An example of the speed chart recorded on the basis of the speed sensor readings.
Figure 4.
An example of the speed chart recorded on the basis of the speed sensor readings.
Figure 5.
Examples of recorded cadence and speed signals in various assist modes.
Figure 5.
Examples of recorded cadence and speed signals in various assist modes.
Figure 6.
Gear ratios calculated from cadence and speed signals.
Figure 6.
Gear ratios calculated from cadence and speed signals.
Figure 7.
The results of the current gear ratio automatic detection.
Figure 7.
The results of the current gear ratio automatic detection.
Figure 8.
The power generated by the rider in a variety of assist modes.
Figure 8.
The power generated by the rider in a variety of assist modes.
Figure 9.
Change in the power value in subsequent moments of the sampling time.
Figure 9.
Change in the power value in subsequent moments of the sampling time.
Figure 10.
Comparison of average power and speed in different assist modes.
Figure 10.
Comparison of average power and speed in different assist modes.
Figure 11.
Left/right power balance.
Figure 11.
Left/right power balance.
Figure 12.
Left/right power balance as a function of power.
Figure 12.
Left/right power balance as a function of power.
Figure 13.
Left/right power balance as a function of power for all modes simultaneously.
Figure 13.
Left/right power balance as a function of power for all modes simultaneously.
Figure 14.
Left/right torque effectiveness.
Figure 14.
Left/right torque effectiveness.
Figure 15.
Left/right pedal smoothness.
Figure 15.
Left/right pedal smoothness.
Figure 16.
Graph of heart rate as a function of the distance traveled and the support mode.
Figure 16.
Graph of heart rate as a function of the distance traveled and the support mode.
Figure 17.
Distance travel speeds depending on the assist mode.
Figure 17.
Distance travel speeds depending on the assist mode.
Figure 18.
Power generated in a run without assistance and heart rate changes.
Figure 18.
Power generated in a run without assistance and heart rate changes.
Figure 19.
Delays in HR signals to cadence (left) and to power (right).
Figure 19.
Delays in HR signals to cadence (left) and to power (right).
| Publisher’s Note: MDPI stays neutral with regard to jurisdictional claims in published maps and institutional affiliations. |
© 2022 by the authors. Licensee MDPI, Basel, Switzerland. This article is an open access article distributed under the terms and conditions of the Creative Commons Attribution (CC BY) license (https://creativecommons.org/licenses/by/4.0/).


