
Modelling of Liquid Hydrogen Boil-Off
by
 ,
,
Saif Z. S. Al Ghafri
1,2, 
Adam Swanger
3,
Vincent Jusko
1,
Arman Siahvashi
1,
Fernando Perez
1,
Michael L. Johns
1,2 and
Eric F. May
1,2,* 1
Fluid Sciences and Resources Division, Department of Chemical Engineering, Faculty of Engineering and Mathematical Sciences, The University of Western Australia, Crawley, WA 6009, Australia
2
Future Energy Exports Cooperative Research Centre, 35 Stirling Hwy, Crawley, WA 6009, Australia
3
NASA Kennedy Space Centre, Cryogenics Test Laboratory, UB-G, KSC, Merritt Island, FL 32899, USA
*
Author to whom correspondence should be addressed.
Energies 2022, 15(3), 1149; https://0-doi-org.brum.beds.ac.uk/10.3390/en15031149
Submission received: 17 December 2021
/
Revised: 20 January 2022
/
Accepted: 29 January 2022
/
Published: 4 February 2022
(This article belongs to the Special Issue Thermodynamics for Net-Zero Energy Systems)
Abstract
:A model has been developed and implemented in the software package BoilFAST that allows for reliable calculations of the self-pressurization and boil-off losses for liquid hydrogen in different tank geometries and thermal insulation systems. The model accounts for the heat transfer from the vapor to the liquid phase, incorporates realistic heat transfer mechanisms, and uses reference equations of state to calculate thermodynamic properties. The model is validated by testing against a variety of scenarios using multiple sets of industrially relevant data for liquid hydrogen (LH2), including self-pressurization and densification data obtained from an LH2 storage tank at NASA’s Kennedy Space Centre. The model exhibits excellent agreement with experimental and industrial data across a range of simulated conditions, including zero boil-off in microgravity environments, self-pressurization of a stored mass of LH2, and boil-off from a previously pressurized tank as it is being relieved of vapor.
1. Introduction
As the world’s population grows and nations further develop, global energy demand is set to increase substantially. To minimize the associated increase in greenhouse gas emissions, a transition away from fossil fuels is required. Liquid hydrogen (LH2) [1,2,3] will play a key role in this transition [4] as it is clean-burning and can function as a store of energy generated from zero- or low-carbon sources, such as renewables or natural gas combined with carbon capture and storage. However, at ambient temperatures, hydrogen is a gas and thus occupies substantial volume. To overcome this, hydrogen can be liquefied by cooling to approximately 20 K (−253 °C) at atmospheric pressure [5,6,7]. The resulting temperature difference between the volume of stored liquid and the ambient environment ensures that heat ingress into the LH2 is inevitable, which can cause it to evaporate [8]. The evaporated vapor is termed boil-off gas (BOG) [9,10,11,12,13] and its generation leads to a pressure increase in the relevant storage tank in a process known as self-pressurization, necessitating venting of the tank into the atmosphere and loss of valuable hydrogen. Depending on the insulation quality and the tank’s surface-to-volume ratio, BOG generation can be on the order of 0.4% per day for a 50 m3 cryogenic tank and 0.06% per day for a 20,000 m3 LH2 tank [14]. Additionally, heat ingress causes the vapor temperature to increase faster than that of the liquid due to the vapor’s higher thermal diffusivity (α = κ/ρ·cp), resulting in heat conduction across the vapor–liquid interface, and thus a temperature gradient in the top layer of the liquid phase with the interface at a higher temperature than the bulk liquid: this is known as thermal stratification [15,16,17,18,19,20,21,22,23].
For planned future large-scale LH2 storage and transport applications involving land-based tanks and sea-borne vessels with capacities from around 50,000 to 160,000 m3 and above, the management of BOG is crucial from both an economic and safety perspective. However, enabling BOG management on such scales represents a significant technical challenge that is yet to be resolved [24,25,26]. Tools that can accurately estimate BOG production are particularly important in the context of industrial-scale LH2 storage, as the capital expense to design and implement such systems is large, and experimental testing at a relevant pilot-scale can be cost-prohibitive with the results obtained making it difficult to translate to full-scale if their description is entirely empirical [27,28]. A high-fidelity, physically-based BOG model would allow developers to iterate through full-scale vessel layouts completely within the design space, enabling cost and time savings by better informing decisions on the overall development path and strategy [7].
Currently, the space industry is an important user of LH2, with long duration storage of cryogenic hydrogen being essential in orbital transfer vehicles, the upper stages of rockets, and deep space exploration probes [29,30,31,32,33,34]. Boil-off is particularly important during atmospheric departure, where frictional drag forces result in substantial heat ingress into the containment vessel, thereby increasing vapor temperature and pressure [31]. If the warmer stratified layers enter the rocket propellant feed system, pump cavitation can occur, which could potentially destroy the rocket [35]. Additionally, as this stratified mass is unusable as fuel, it becomes a liability to the payload capacity of the rocket [36]. The impact of boil-off limitations on future long-term Mars missions is described in detail by Schaffer [37], who found that the payload weight of the cryogenic propulsion stages is considerably influenced by the boil-off rate. To reduce the impact of boil-off, designs incorporating multi-layer insulation, minimal tank thermal connection points, and deployable sun shields have been proposed [37]. An accurate and robust BOG model is thus required to model the storage of LH2 in rockets and spacecraft, and thereby verify the performance of newly designed LH2 storage systems.
Many computational fluid dynamics (CFD) and thermodynamic boil-off models have been developed for cryogenic liquids such as liquefied natural gas (LNG), including models based on heat ingress and subsequent BOG rates and those accounting for heat transfer between the vapor and liquid phases [38,39,40,41,42,43,44,45,46,47,48,49,50,51,52,53,54,55]. Migliore et al. [44] developed a non-equilibrium numerical model that allows for the vapor phase to be at a higher temperature than the liquid phase. This was then expanded by Huerta and Vesovic [39] to include more realistic heat transfer mechanisms in the vapor phase. Both models consider heat ingress in the vapor and liquid phases separately and enable heat transfer between the two phases across the interfacial surface area. More recently, a non-equilibrium model was proposed by Wang et al. [46] to simulate LNG during storage and refuelling. However, these models were developed for LNG mixtures in specific scenarios and limited experimental or industrial data were available to verify simulations conducted using these models [56,57]. Furthermore, these models tend to use cubic equations of state for thermodynamic calculations, which are not optimised for the most accurate description of LNG, let alone liquid hydrogen.
We have previously [58,59] presented a boil-off model based on a superheated vapor assumption similar to the non-equilibrium methods presented in the literature. This model is flexible with regards to the fluid type, utilises reference Helmholtz equations of state [60,61] for the thermodynamic property calculations and, most importantly, has physically-based parameters that are anchored by high-quality experimental data for pure fluids measured using a custom BOG apparatus. The model’s performance for LNG was then validated against data measured for binary and multi-component mixtures of light hydrocarbons and N2. However, to correctly use this model for the description of liquid hydrogen storage and boil-off, it must adequately capture the influence of conversions between the two spin isomers, orthohydrogen. and parahydrogen. In particular, at the cryogenic storage conditions where liquid hydrogen is stored, the equilibrium fraction of parahydrogen is around 99.8%. However, non-equilibrium models need to also describe a vapor phase at a higher temperature, for which the concentration of orthohydrogen may be non-negligible. The temperature dependent equilibrium orthohydrogen–parahydrogen ratio can be calculated using Equations (1) and (2) [62].
Here, N is the rotational quantum number, k is the Boltzmann constant, E is the energy of the Nth rotational state, B0 = 7.36 meV is the rotational constant of the hydrogen molecule, and D0 = 7.69 × 10⁻³ meV and H0 = 6.45 × 10⁻³ meV are the rotational energy distortion constants [63]. Unfortunately, most implementations of the reference Helmholtz equations of state for parahydrogen and orthohydrogen developed by Leachman et al. [64] require the user to independently evaluate Equations (1) and (2) to determine the ortho–para ratio at each temperature.
At room temperature at equilibrium, so-called normal hydrogen comprises 75% ortho- and 25% para-hydrogen molecules (See Equations (1) and (2)). At absolute zero, all the hydrogen molecules must be in a rotational ground state and thus 100% para-hydrogen [65]. For liquid hydrogen at its normal boiling point (20.3 K), the equilibrium para-hydrogen content is 99.8%. Liquefaction processes use heterogeneous catalysts to ensure this equilibrium ratio is attained to prevent the exothermic ortho- to para-hydrogen conversion from occurring during storage [66]. However, because of its larger thermal diffusivity, the gas phase above the stored liquid hydrogen will generally be warmer than the liquid leading to the reverse, endothermic conversion of para- to ortho-hydrogen [67]. In the absence of suitable heterogeneous catalysts, the conversion is very slow and occurs over the order of a few days. Hence, any dynamic model that assumes the hydrogen vapor is at the equilibrium ortho–para ratio corresponding to its temperature might incorrectly represent the system’s dynamic energy balance and, consequently, the boil-off rate. Several proposals based on exploiting the endothermic para–ortho conversion for cooling purposes and/or to reduce boil-off [67,68,69,70] have been considered; these efforts would be facilitated by a BOG model able to account for a vapor that is not at compositional or thermal equilibrium with the liquid.
To our knowledge, the only model developed for BOG studies of LH2 is that reported by Petitpas [7], who modified a MATLAB (MathWorks, Natick, MA, USA) code previously developed by the National Aeronautics and Space Administration (NASA) to estimate boil-off losses along the entire LH2 pathway, from liquefaction to dispensing. Boil-off from the storage tank during the transfer of LH2 from a supply trailer to the storage tank was found to be one of the most important sources of hydrogen loss. While many studies [71,72,73,74,75,76,77,78,79,80,81,82,83,84] have investigated how to minimize boil-off losses and empirically determined that top fill (spray) is the most effective way to reduce transfer losses during loading, the underlying physics remains poorly understood. Petitpas used his model to empirically determine the dependence of heat transfer into the storage tank on the level of LH2 fill, with heat fluxes varying from approximately 2.2 W/m2 when nearly full, to 1.0 W/m2 when empty for a 12.5 m3 vertical storage tank. It was also shown that appreciable temperature gradients (thermal stratification) may exist within the fluid contained by the vessel.
Here, we present an improved version of the superheated vapor (SHV) model developed previously [58,59] that is capable of simulating liquid hydrogen storage. The model is flexible with regards to the spin isomer composition of the hydrogen in each phase, tank geometry, and associated heat transfer, allowing the simulation of a wide range of scenarios. This more rigorous modelling approach is then used to simulate a range of liquid hydrogen storage experiments conducted at NASA and the Lawrence Livermore National Laboratory [27,53,75,78].
2. Model Description
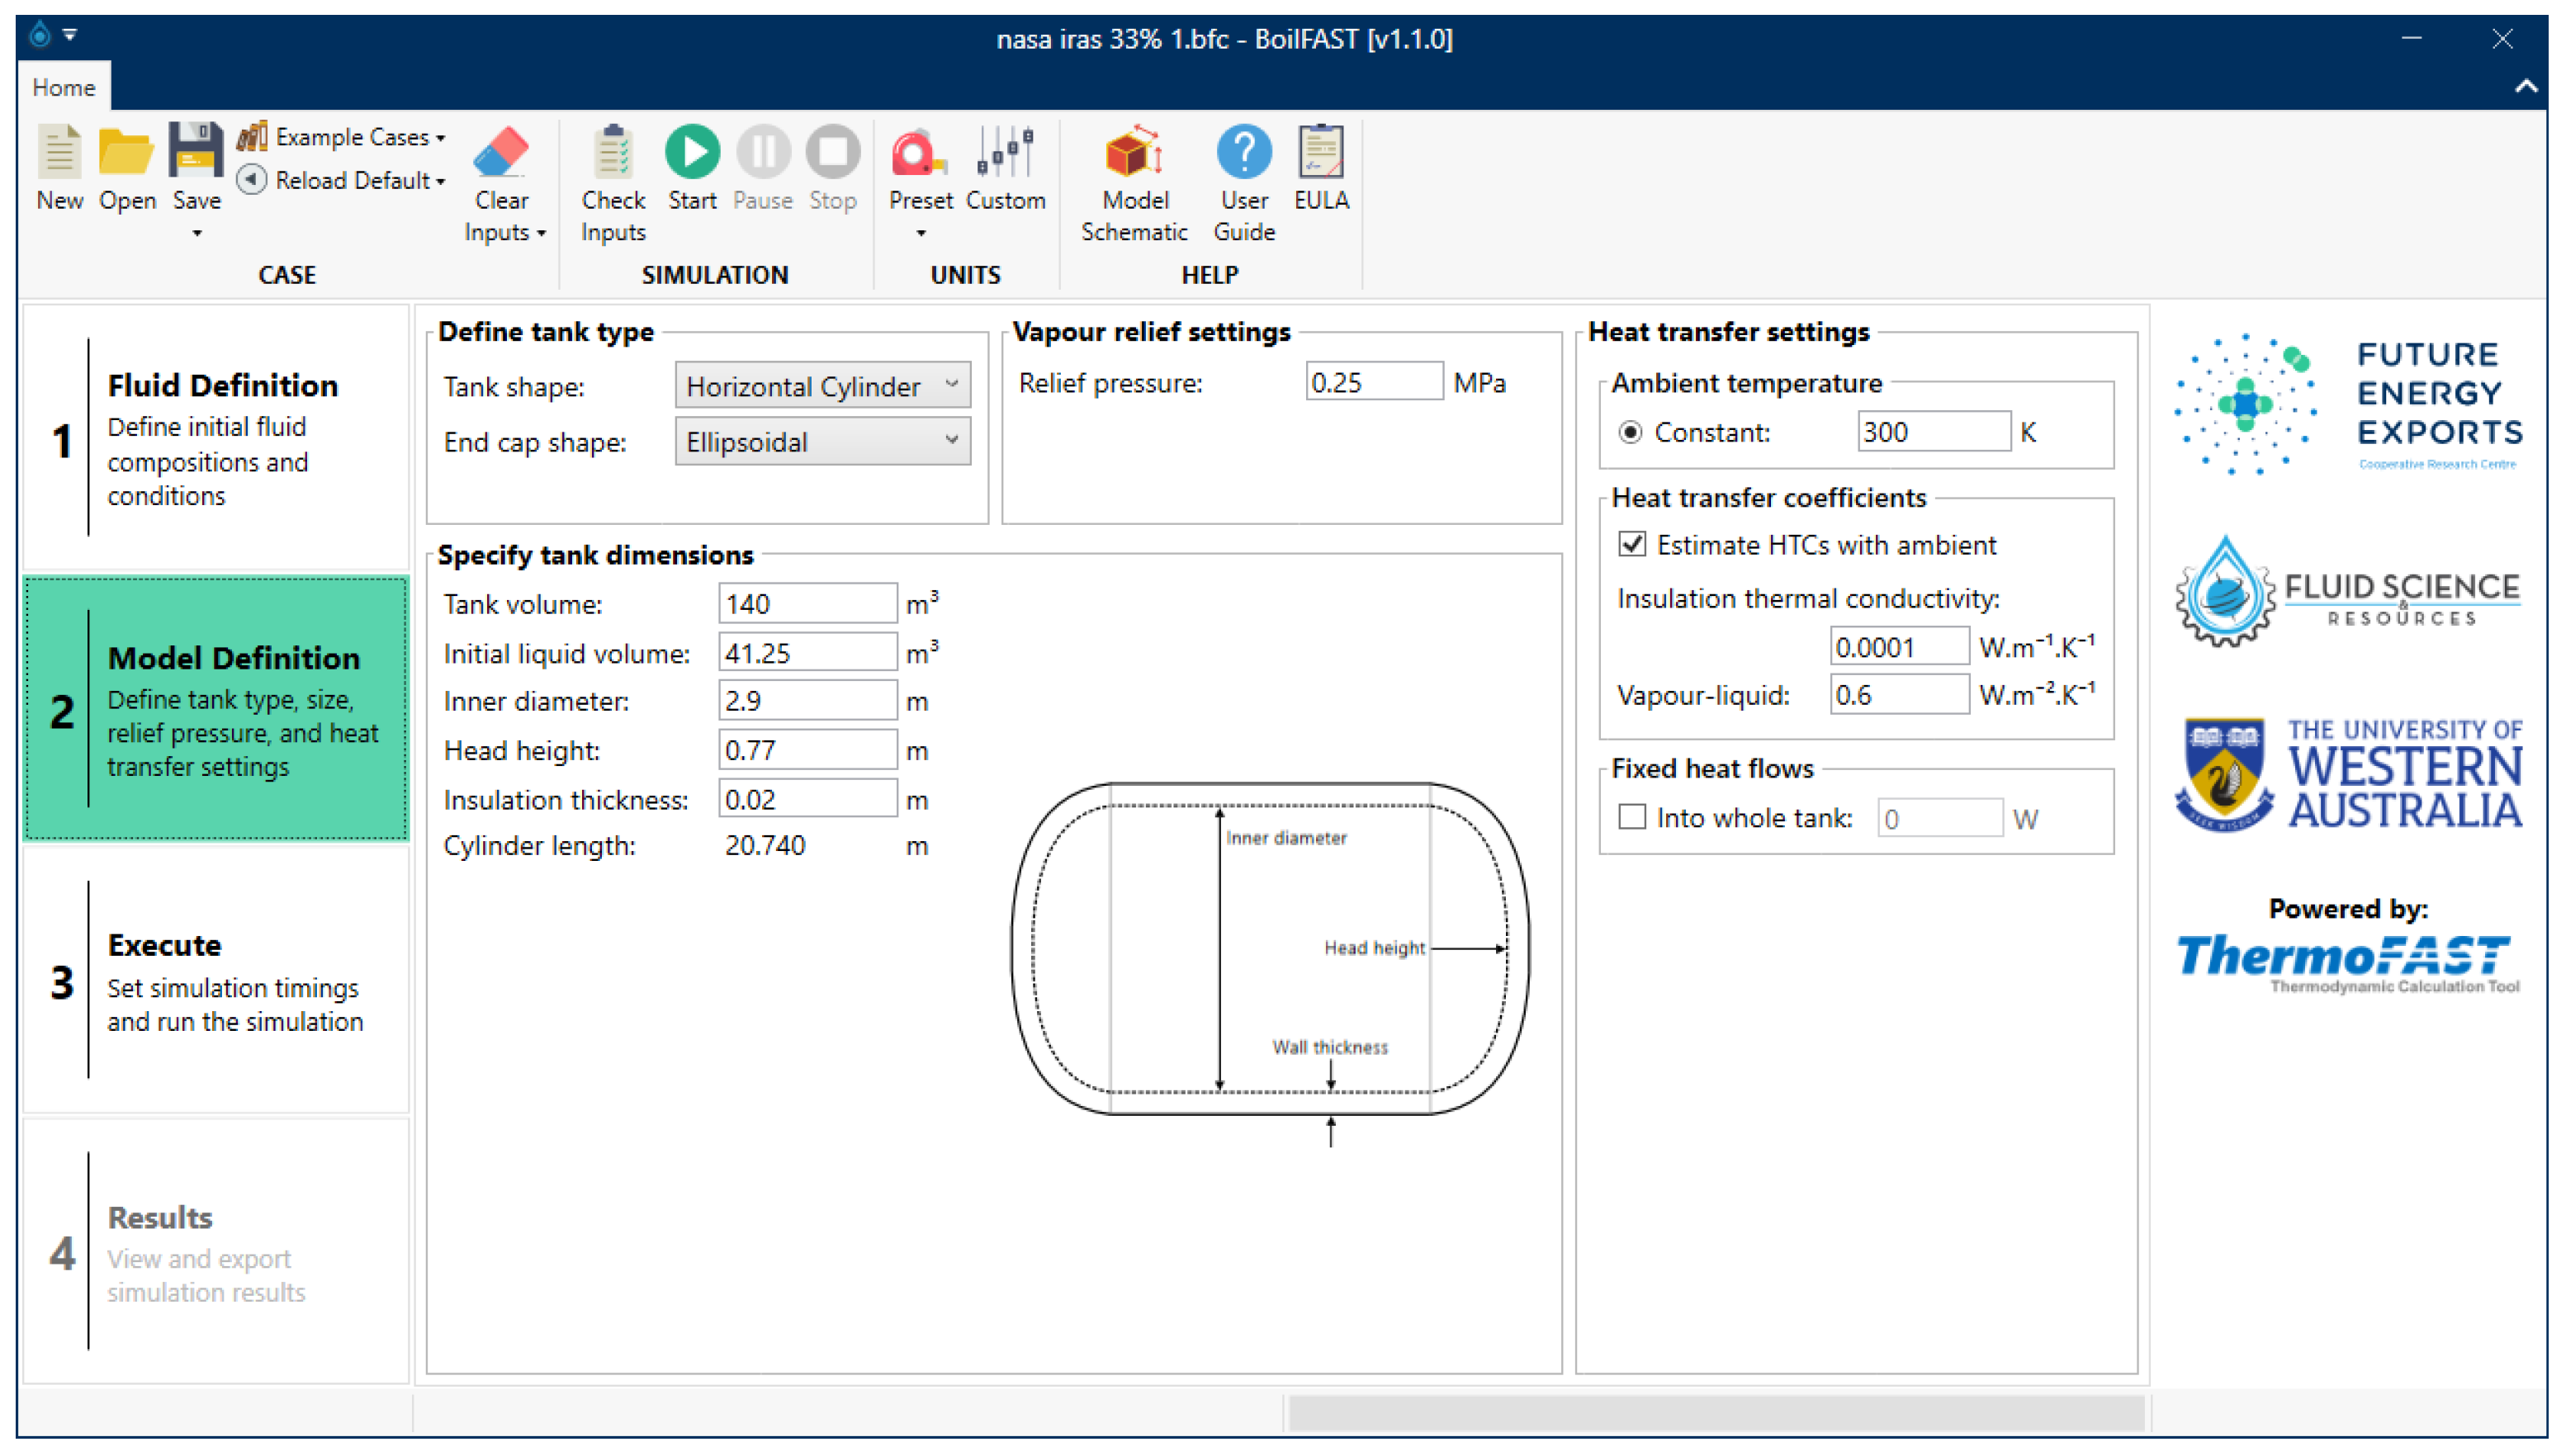
The freely available software package BoilFAST (UWA Fluid Sciences and Resources Division, Perth, Australia) [85] contains an implementation of the extended SHV model within a Dynamic Link Library (DLL) that is accessed via a Graphical User Interface (GUI) in a Windows environment. This allows the user to easily set up a simulation, selecting from a range of tank geometries, thermodynamic models, boundary conditions, and compositions, and run the simulation using the SHV model, as well as view or export the results. An image of the BoilFAST GUI is shown in Figure 1. The GUI allows the user to simulate boil-off for many industrially important fluids including LH2. To this end, a range of fluid components can be selected in the GUI, including both spin isomers of hydrogen and equilibrium and normal hydrogen. The latter is included to facilitate future comparisons of BOG generation in systems that have been cooled too rapidly and have not equilibrated the spin isomer ratio.
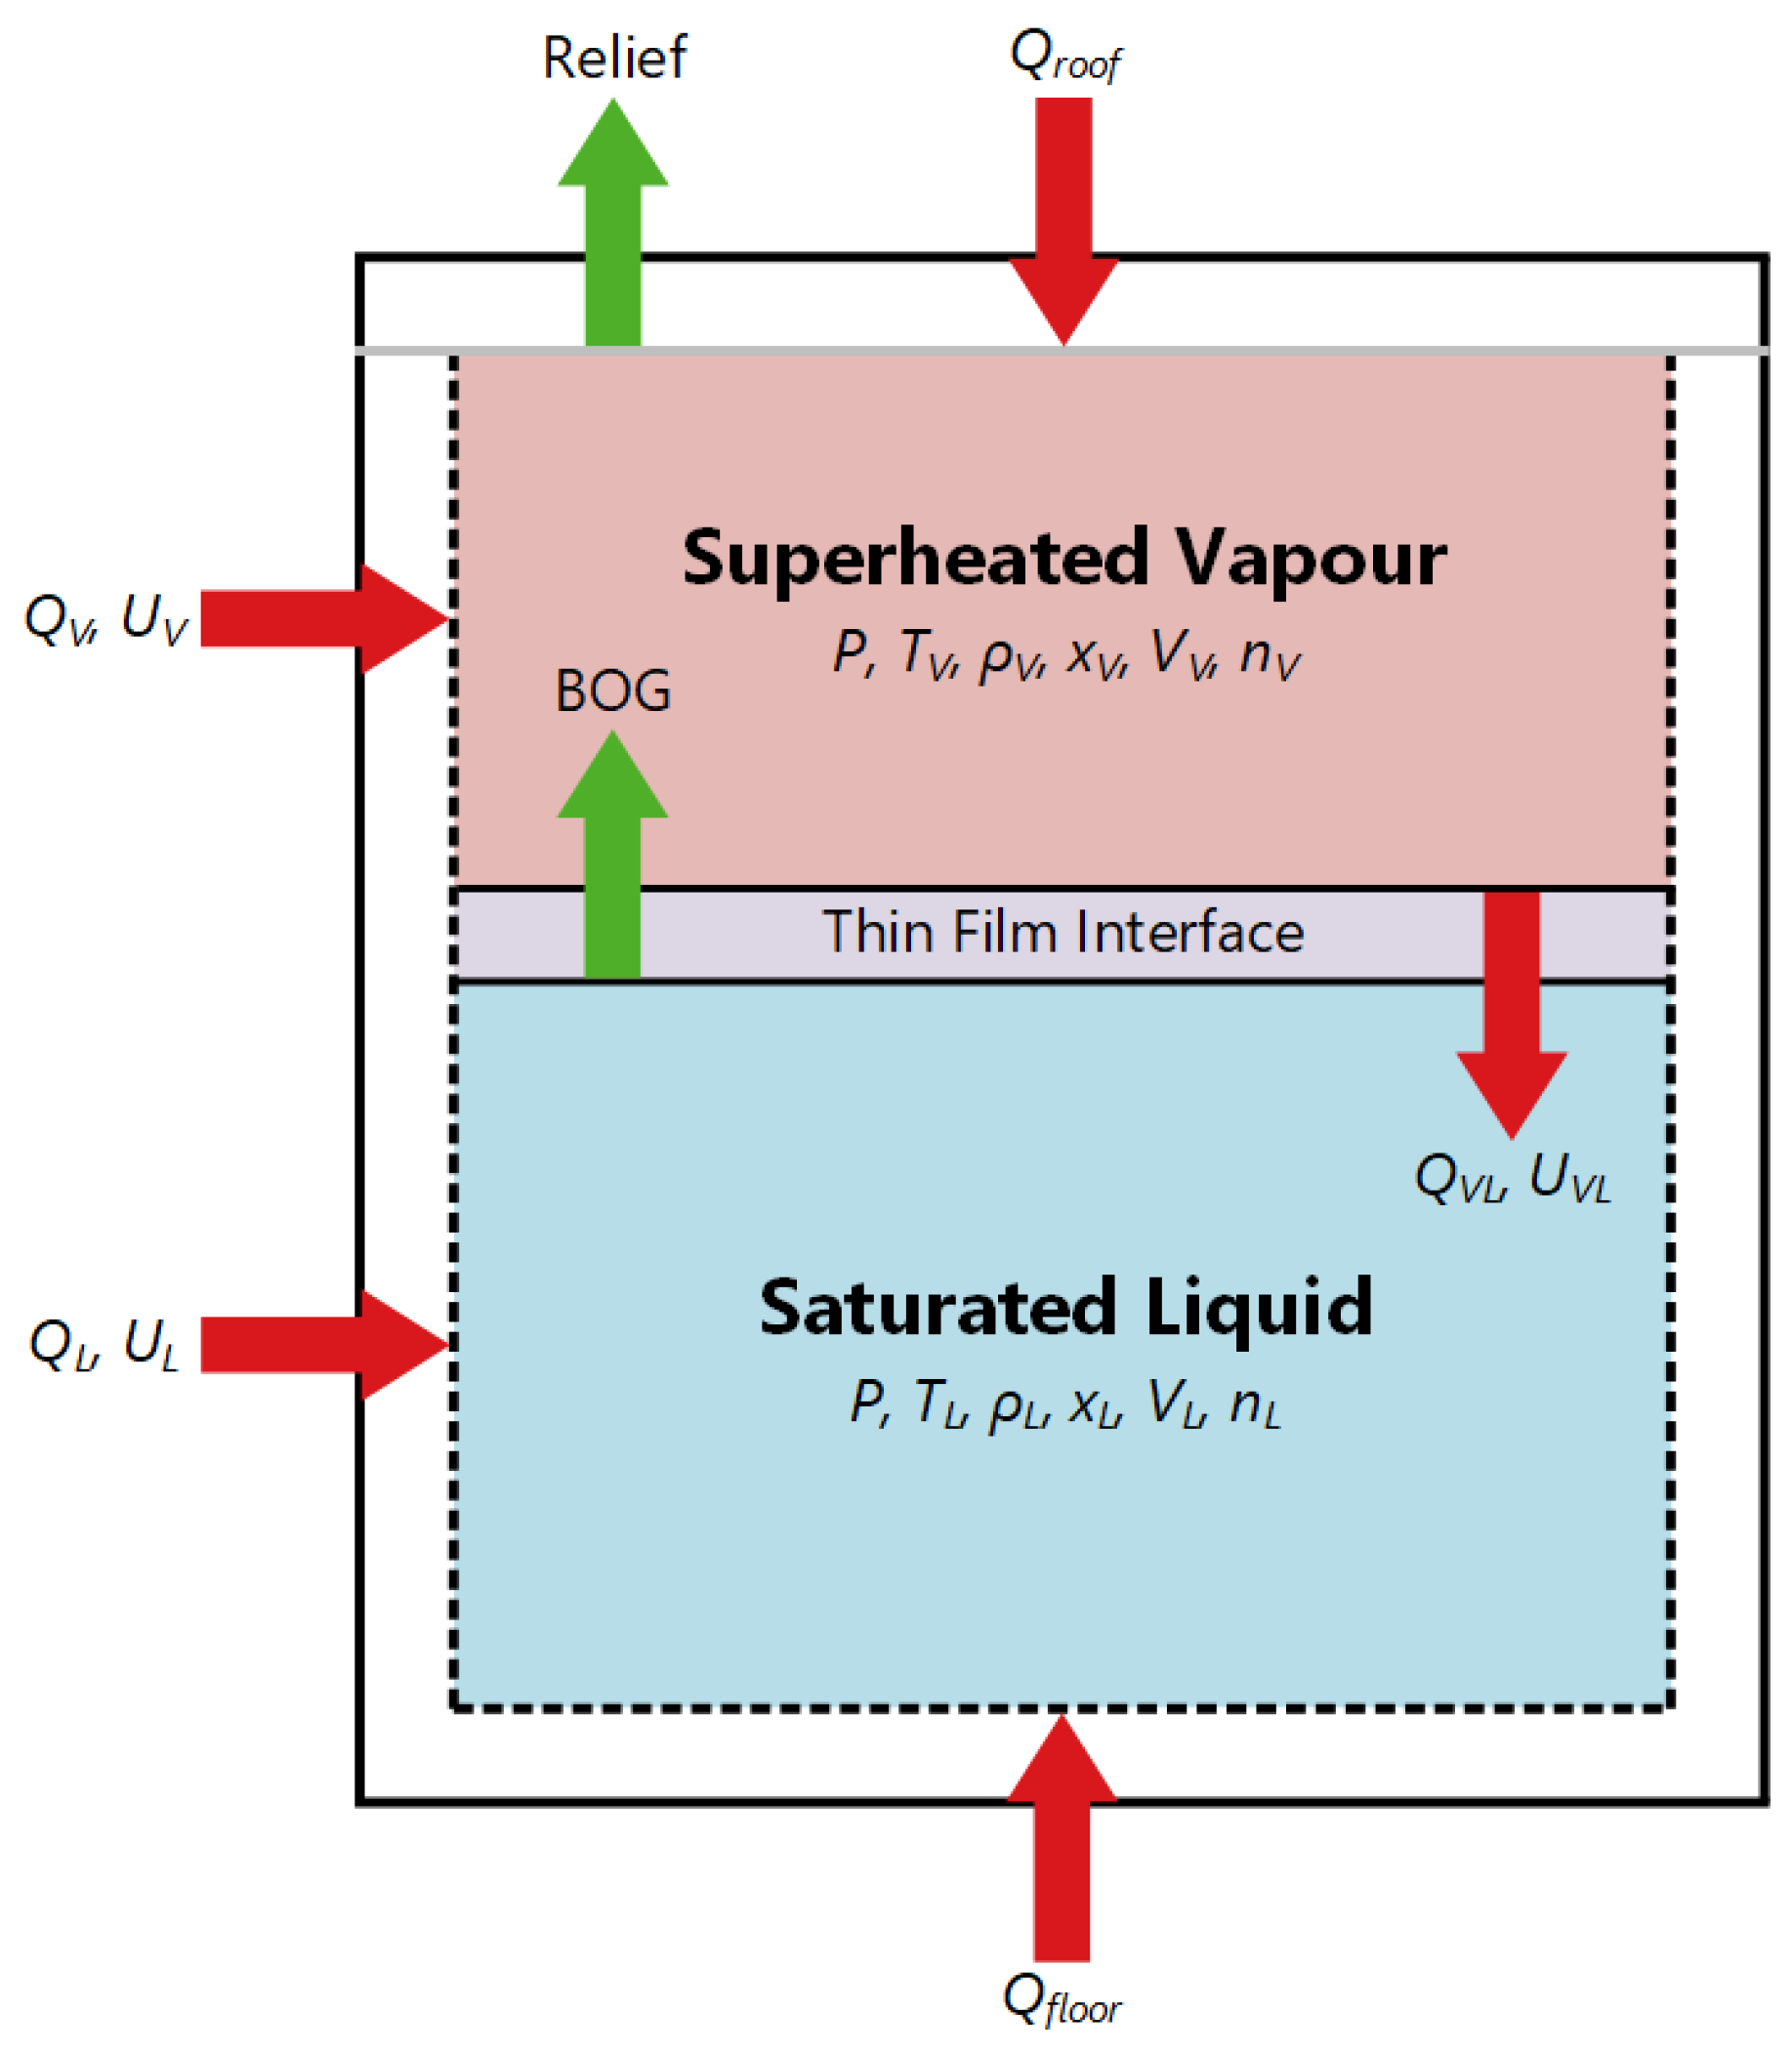
Figure 2 and Equations (3) through (13) convey the key concepts and equations underlying the SHV model by reference to a vertically-oriented cylindrical storage tank. The relationships defining heat ingress in each phase, QL (Equation (3)) and QV (Equation (4)), are calculated as a function of the phase contact area with the tank walls, AL and AV; the overall heat transfer coefficients through the tank walls, UL and UV; and the differences between the ambient temperature, Tboundary, and phase temperatures, TL and TV. This represents the combined effect of all the modes of heat transfer between the tank contents and the environment. The overall heat transfer coefficients in Equations (3) and (4) are estimated by considering the heat transfer by convection at the interior and exterior walls, by conduction through the wall, and radiant heat transfer from the inner tank wall to the fluid (using standard correlations given in Ref. [45]). These values are largely dependent on the tank geometry, material properties of the tank walls and insulation, fluid properties, and the temperature differential between the phases and ambient conditions. If details of the tank construction are insufficient, one or both may be adjusted to match the experimental data—in particular, the BOG rate. The final heat transfer process considered is from the vapor to the liquid phase, denoted as QVL, and is evaluated using (Equation (5)), which considers the net heat transfer across the interface by taking into account the evaporation and condensation effects. The heat transfer coefficient, UVL, is dependent on a variety of factors, including the tank geometry, fluid properties, and the orientation of the phase interface; it is this parameter that Perez et al. [58] adjusted to calibrate the results observed for liquid nitrogen in their custom BOG apparatus. This then allowed for the reliable estimation of the boil-off rate and self-pressurization to be made for LNG mixtures studied in the same apparatus. The model also allows the user to specify a fixed heat transfer rate though the tank floor (Qfloor) and/or roof (Qroof) if required, allowing for a better approximation of the industrial conditions—where tanks are often bottom heated to prevent ground freezing. If these terms are not set to zero, the BoilFAST implementation of the SHV model automatically adjusts its calculation of AL and/or AV to exclude the areas of the floor and roof, respectively.
Mass transfer is considered at two locations, the liquid (molar) boil-off to the vapor phase, , and vapor relieved through the vent valve, . The boil-off rate, , and quantity,, are determined by Equations (8) and (9), respectively, as the change in liquid quantity between time steps. Similarly, the relief rate, , and amount, , in Equations (10) and (11) are estimated by the change in the total molar quantity of the fluid within the tank between time steps. With the heat and mass transfer defined, the model consolidates these variables into the phase energy balances given by Equations (6) and (7). The right-hand sides of Equations (6) and (7) contain the bulk energy balances for the liquid and vapor phases, respectively; each of which is considered to equal the total enthalpy change of the respective phase over a given time step, which can be calculated using an equation of state (EOS).
The initial conditions of the liquid and vapor in the tank are defined based on the system pressure, assuming a saturated liquid in equilibrium with the vapor phase. The reference EOS models of Leachman et al. [64] for both hydrogen spin isomers and normal hydrogen have been implemented together with Equations (1) and (2) for the equilibrium ortho–para ratio. These are used to calculate the necessary thermodynamic properties: enthalpy, density, and saturated liquid temperature. Using these properties, the amounts of liquid, nL, vapor, nV, total amount of fluid within the system, nF, and the fraction of the system contents in the liquid phase, Lf, can be calculated via Equations (12) and (13), respectively. The specified time step interval, Δt, is used to determine the total amount of heat entering the liquid and vapor phases from the boundary and the amount of heat transferred to the liquid phase from the vapor phase, as given by Equations (3)–(5).
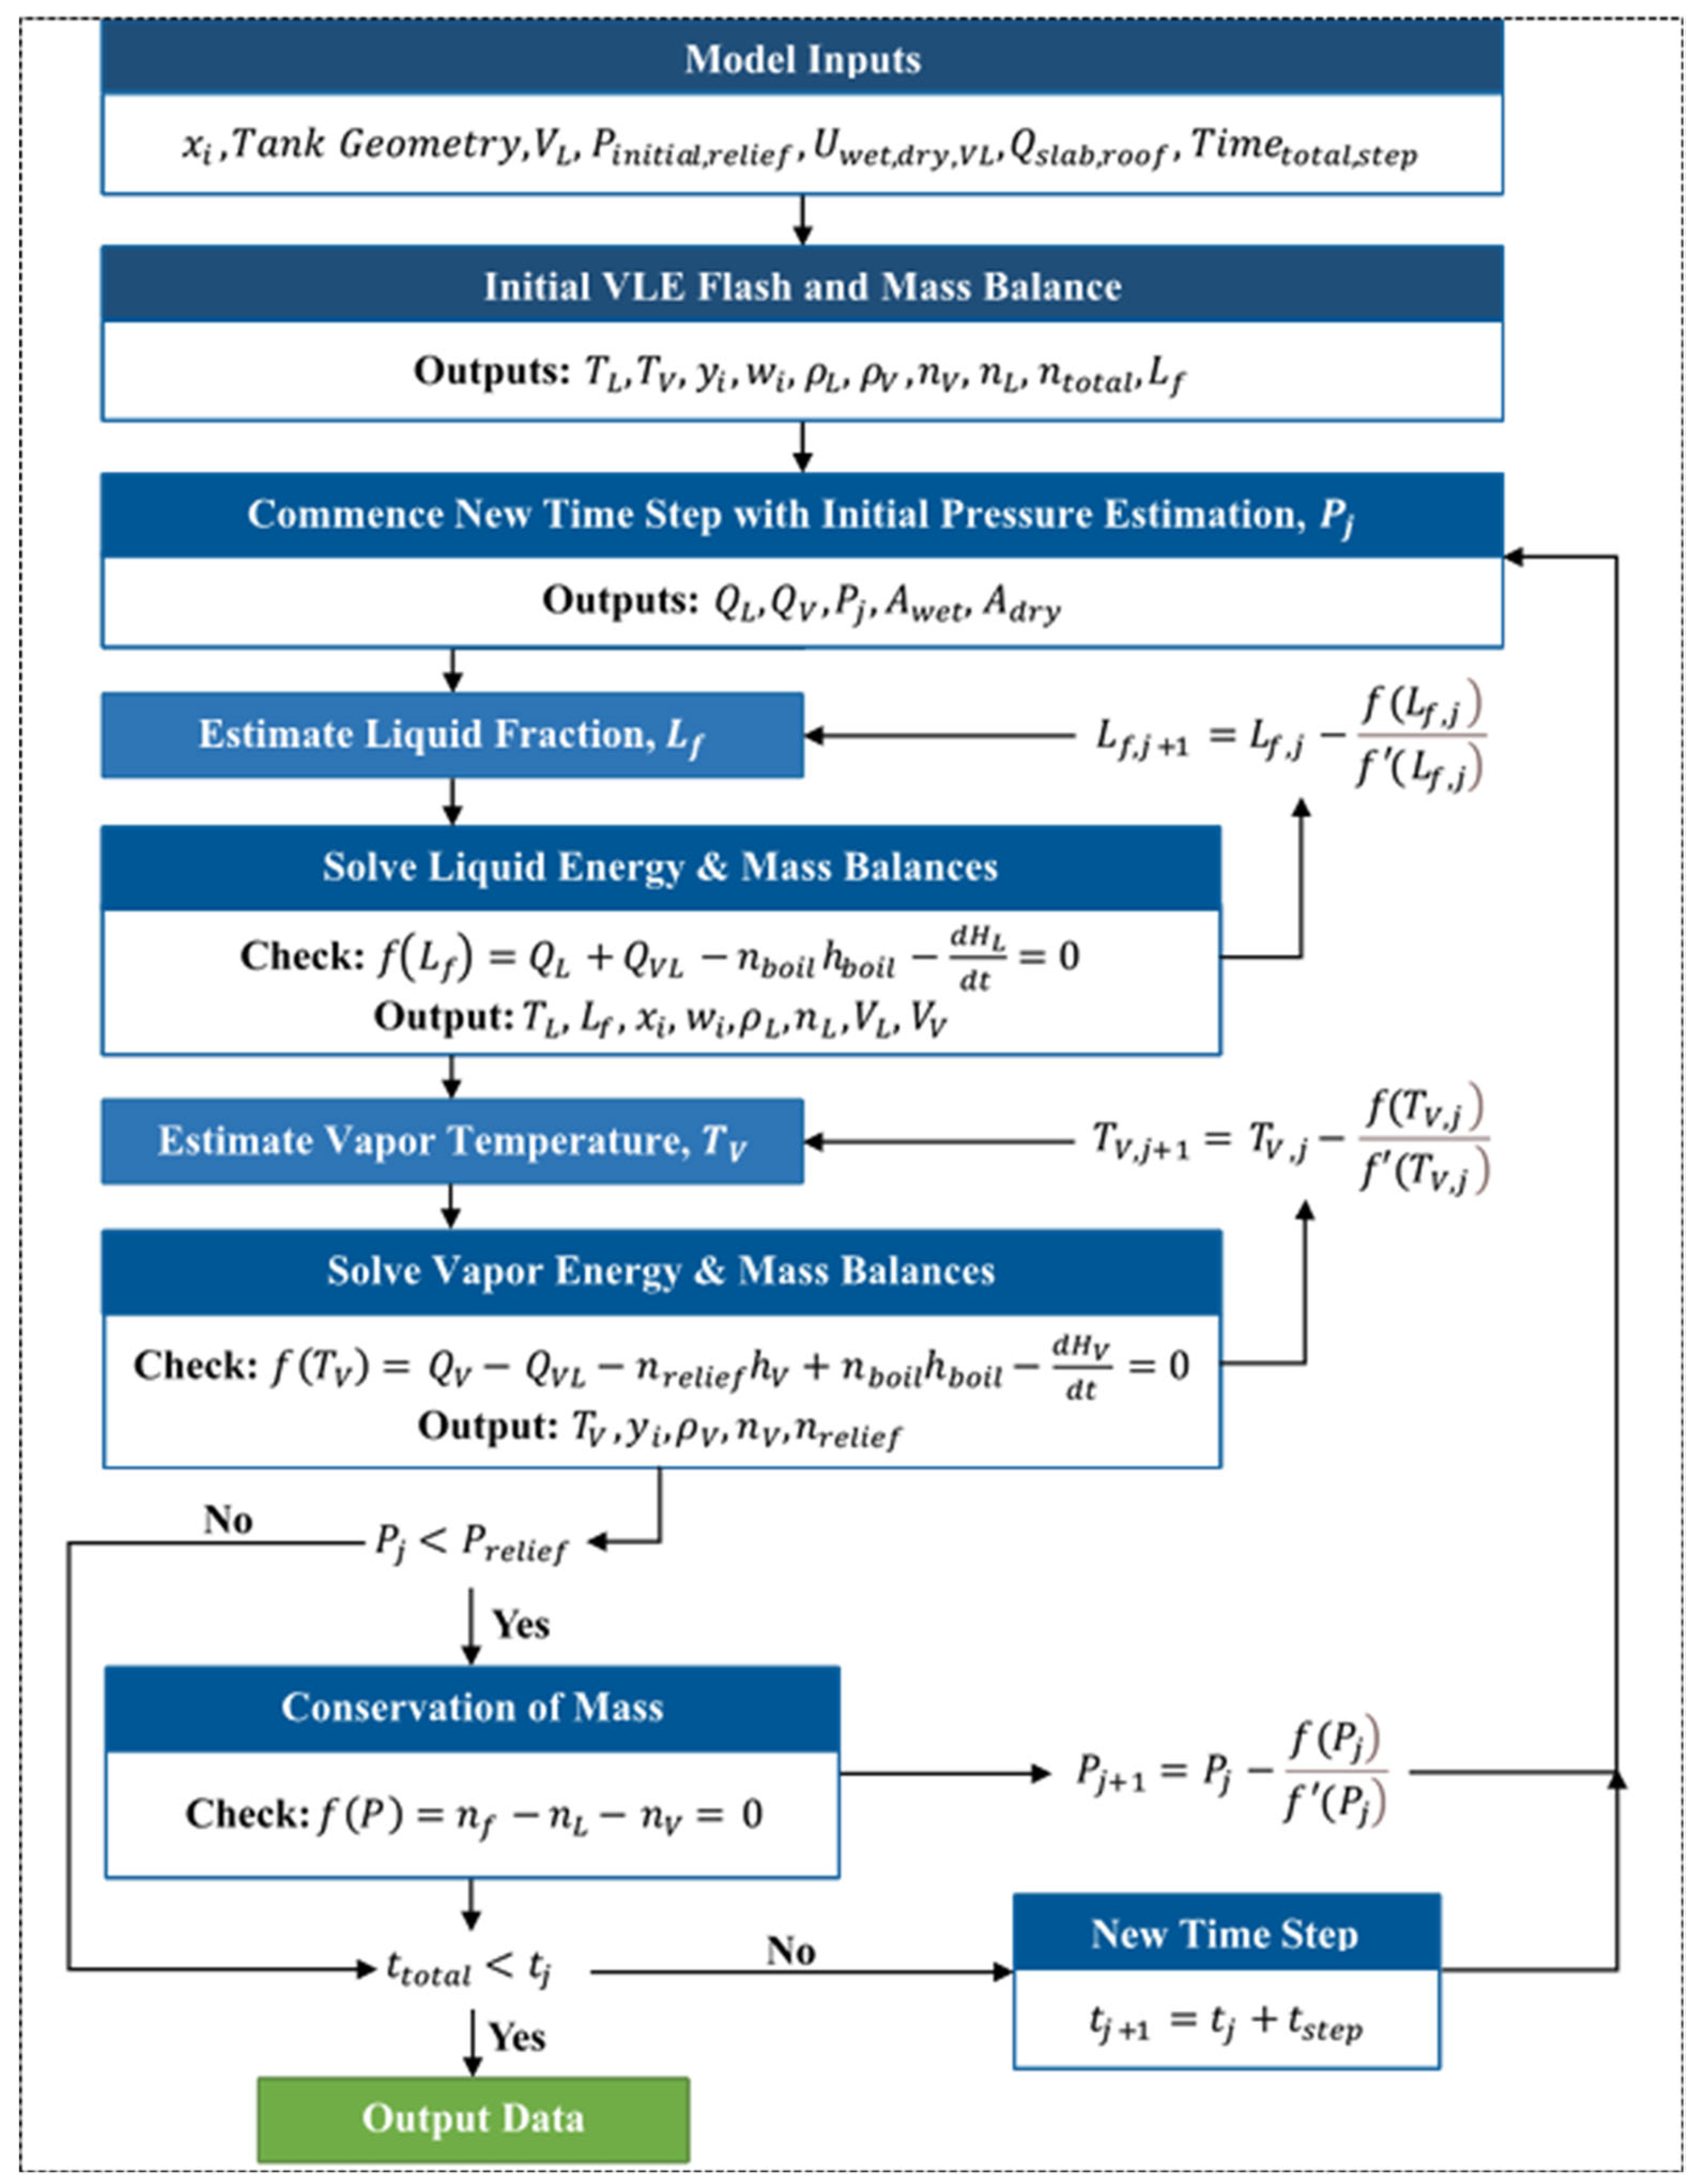
Assuming a saturated liquid temperature, TL, the liquid energy balance (Equation (6)) iterates until convergence by applying a root-finding algorithm, as shown in Figure 3. This yields the liquid fraction, Lf, which in turn gives the amount of liquid, nL. By solving the liquid energy and mass balances, the volumes of liquid and vapor, liquid (xi) and boil-off (wi) composition, and the amount of vapor leaving the liquid (nboil), Equation (9) during one timestep can be found. To find the vapor temperature, the vapor energy balance is iteratively solved (Equation (7)). During this process, the amount of vapor relieved, nrelief, vapor composition (yi), and the thermodynamic properties of the vapor phase are also found. The vapor temperature is taken to be the average temperature for the vapor phase.
During self-pressurization, the calculation procedure of the system pressure includes the phase energy balances, adjustment of pressure using a root-finding algorithm (as shown in Figure 3), and calculating the overall system mole balance as defined in Equation (12). This ensures that nrelief is zero (no venting) during the pressure build-up stage (i.e., nF,j−1-nL-nV = 0 for all time steps).
3. Results and Discussion
3.1. Model Testing and Validation
In our related work [58,59], we tested and validated the SHV model against our experimental data for pure liquid nitrogen [58] and LNG-like binary mixtures of methane and ethane [59]. The model calculations were also compared against literature data reported by the Gas Research Institute [56] for six different LNG weathering tests, and those reported by Harper and Powars [57] for a self-pressurization test from 283 kPa to 1585 kPa in an advanced on-vehicle LNG fuel system. The model has also been compared against the self-pressurization calculations reported by Wang et al. [46] for a horizontal storage tank, and the BOG calculations of Migliore et al. [44] for a standard LNG storage vertical tank with a 165,000 m3 capacity. Good agreement exists between the SHV model and each of the sources from all of the comparisons listed above. Recently [86], the model’s performance was compared against BOG data obtained for ternary mixtures of methane, ethane, and nitrogen using our apparatus [58] and an LNG mixture used as rocket fuel conducted at Kennedy Space Centre (NASA) [87]. However, no quantitative comparisons have yet been made for liquid hydrogen applications. Here, the industrial and experimental data of LH2 boil-off and tank self-pressurization are compared with corresponding estimations made using BoilFAST to validate its use for liquid hydrogen storage applications.
3.2. LH2 Refrigeration and Storage System at NASA
BoilFAST was used to simulate LH2 boil-off experiments conducted in a vacuum-jacketed 125 m3 storage tank capacity at NASA’s Kennedy Space Centre, equipped with an 80-layer multilayer insulation (MLI) system. This tank incorporates an Integrated Refrigeration and Storage (IRAS) system [75], which maintains the liquid in a zero boil-off state through the use of an internal cryogenic heat exchanger connected to an external Brayton cycle refrigerator. The IRAS geometric properties of the horizontal capsule tank with a 2:1 ellipsoidal head [88] and parameters used by the simulation are outlined in Table 1. At the initial tank pressure of 111 kPa, hydrogen has a saturation temperature of 20.6 K and para-hydrogen content of 99.8%.
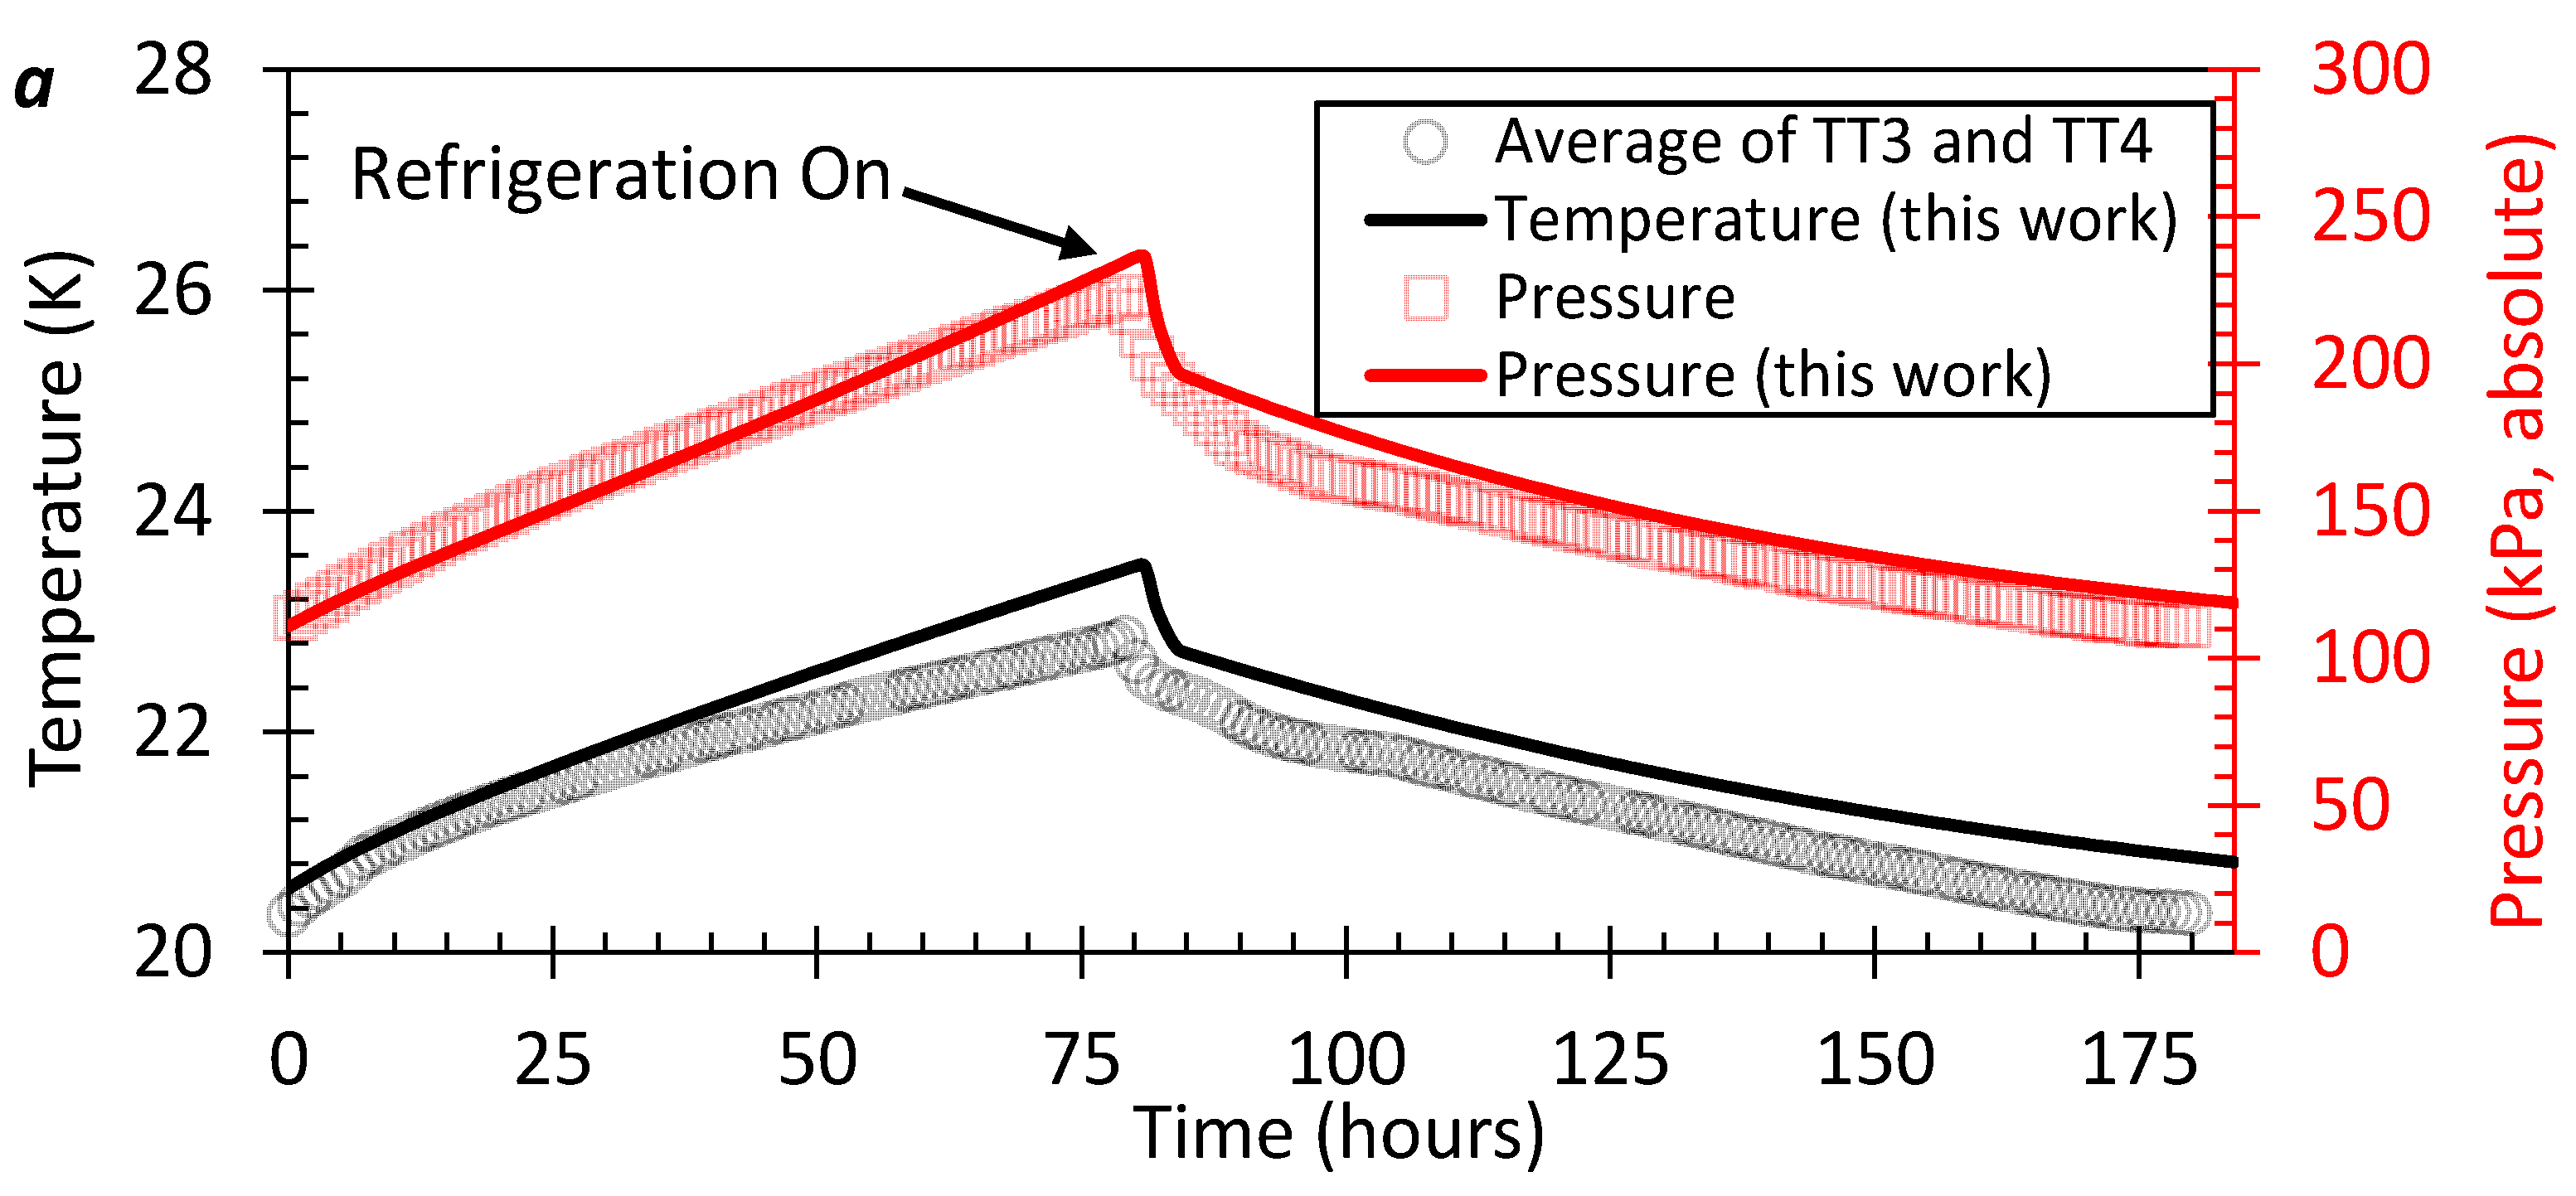
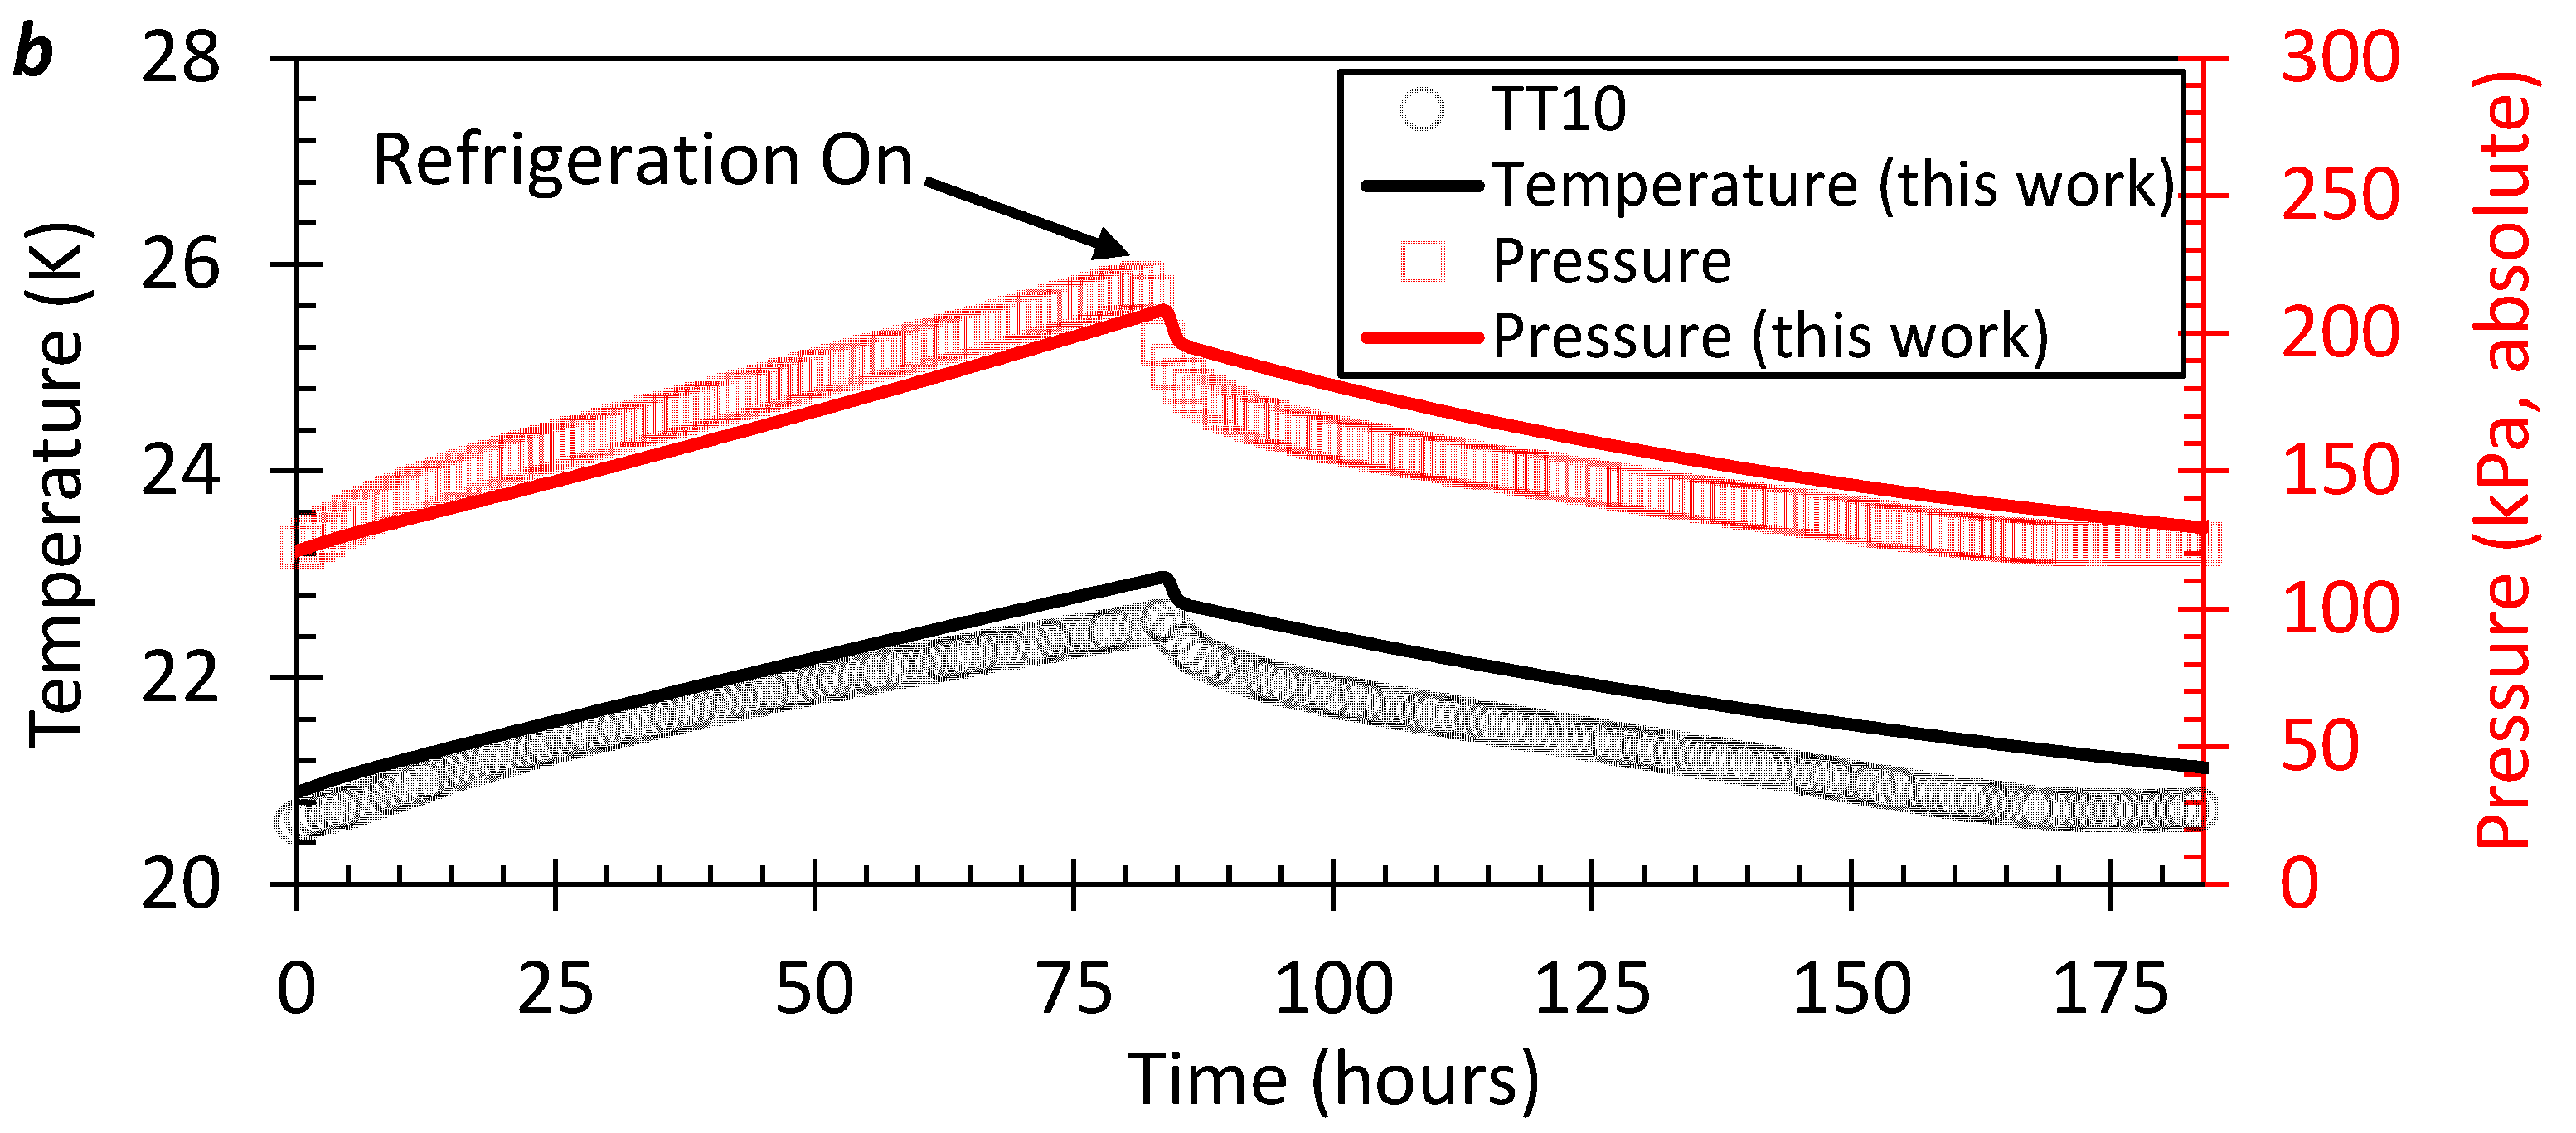
The experiments conducted involved a ‘duty-cycle’ mode, where the refrigeration system was turned off for approximately 80 h, then turned on for 92 h to remove the accumulated heat leak. Comparisons between the experimental data (symbols) and simulation (solid curves) are shown in Figure 4 for 33% and 67% liquid fill levels. The overall heat transfer coefficients UL and UV were predicted as the sum of two convection terms to account for the heat transfer between the tank wall and adjacent fluid layer, and a conductive term describing heat ingress through the tank wall:
where Ao is the outer surface area, Ae is the heat transfer area, Ai is the inner surface area, x is the insulation layer thickness, ke is the effective thermal conductivity of the multilayer insulation, and hi and ho are the internal and external convection coefficients. Fesmire and Johnson presented comprehensive heat flux and effective thermal conductivity data for 26 different MLI systems across the full relevant pressure range (from high vacuum to ambient pressure) [89]. The closest test series to the actual MLI used in the horizontal IRAS tank is test FP3-A 128 (80 layers, 21 mm thick). The mean effective thermal conductivity of this IRAS MLI system was 0.14 mW·m−1·K−1; this value was used in Equation (14). The internal and external convection coefficients were predicted using an empirical correlation relating the Nusselt and Rayleigh numbers [45]. Using Equation (14), the average values of UL and UV during the simulation were found to be 0.0066 W·m−2·K−1. In this work, the heat transfer coefficient across the vapor–liquid interface UVL (0.6 W·m−2·K−1) was determined empirically from a fit to the experimental vapor temperature data; this will be resolved in future work.
Overall, the BoilFAST calculations are in good agreement with the experimental data for both the 33% (Figure 4a) and 67% (Figure 4b) fill experiments. The model represents the pressurization and subsequent depressurization for both experiments, well only slightly deviating in the pressurization rate during the initial heat leak and at the activation of the IRAS. The temperatures measured closest to the vapor–liquid interface in each case are compared with the model calculations. In Figure 4a, sensors TT3 and TT4 were located several centimetres below and above the vapour–liquid interface, respectively [78], with the average of their readings taken to be the best experimental representation of the interface’s temperature. This estimate of the interface temperature is in good agreement with the model’s estimation of the dynamic liquid temperature during refrigeration, noting that the model represents the liquid as a homogenous saturated fluid with a temperature set by the tank pressure (i.e., a uniform liquid with the interface’s temperature). For Figure 4b, sensor TT10, located at the 61% fill level [78], was closest to the vapor–liquid interface (approximately 13 cm below); the measured temperature was lower than that estimated because the liquid also thermally stratified as discussed by Notardonato et al. [75]. The liquid temperature estimated by the model is the saturation value corresponding to the tank pressure, which will always be higher than temperatures measured by sensors immersed in the bulk liquid phase (below the interface) due to stratification. The SHV model currently implemented in BoilFAST assumes the liquid phase is saturated and thermally homogenous. Nevertheless, the agreement between the current model and the experimental data at two different filling levels is encouraging, particularly given the application of refrigeration, which could be modelled in BoilFAST by using an ambient temperature of 20 K (below that of the tank contents).
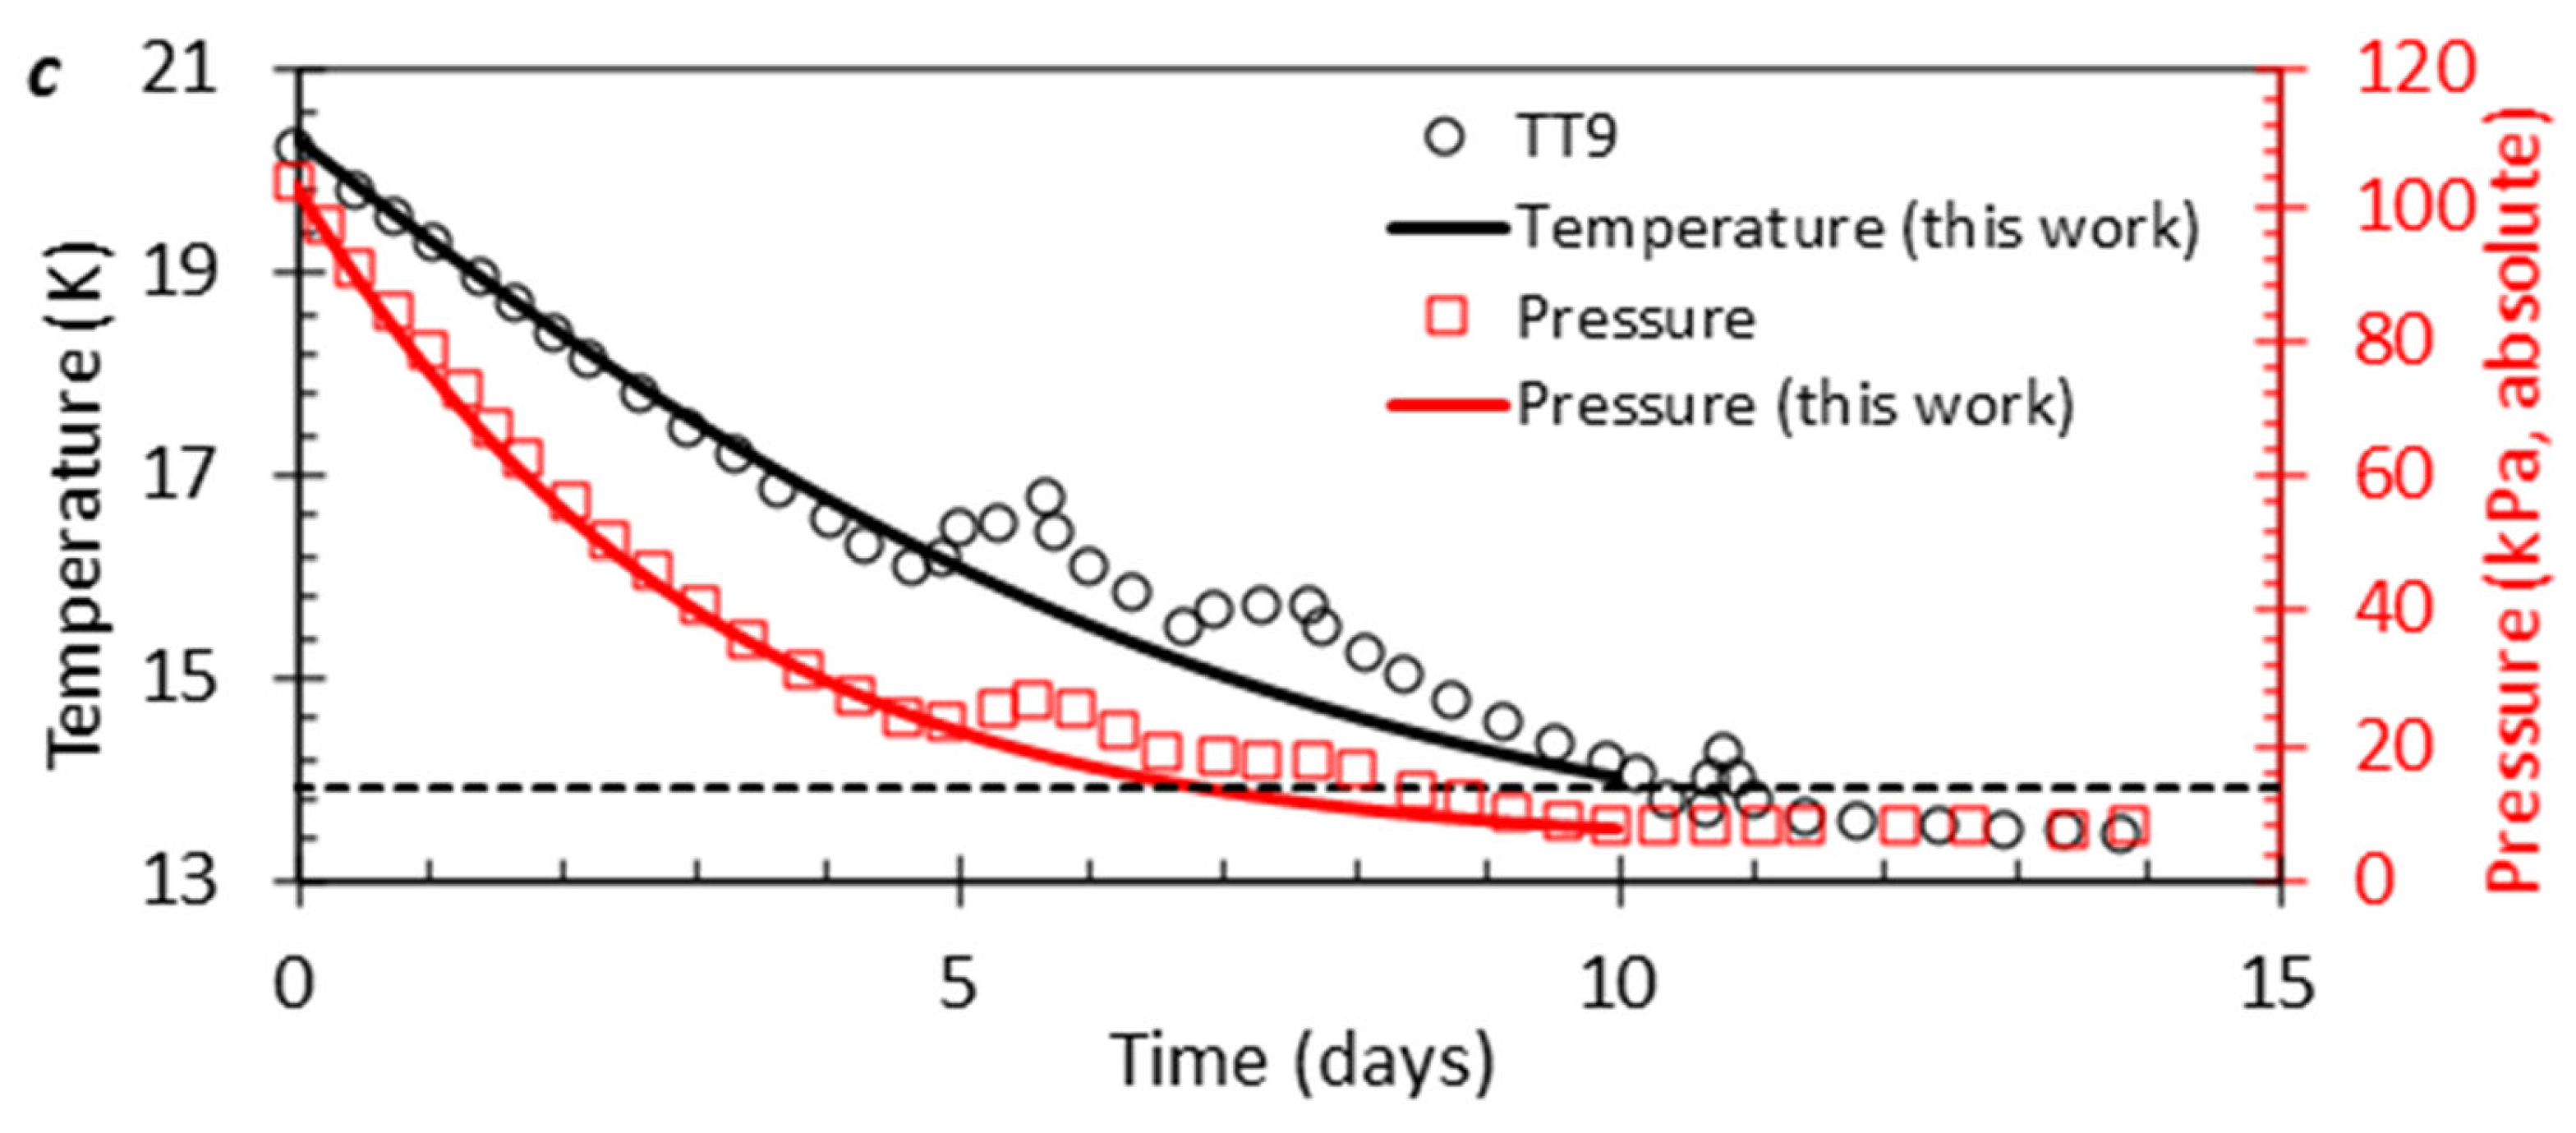
Additionally, BoilFAST was used to simulate experiments investigating the densification of stored LH2 by cooling below the triple point (13.8033 K [64]) conducted using the IRAS system [78]. The first densification experiment involved 57.5 m3 of LH2 at atmospheric pressure (46% full) and was subjected to refrigeration for 14 days total, reaching the triple point after roughly 10 days. BoilFAST was used to simulate the period of IRAS refrigeration until the triple point was reached; a comparison of the model’s results with the experimental data is shown in Figure 4c. The liquid temperature estimation closely aligns with the experimental results, except for an irregularity in the data occurring in the range of 125 to 250 h, which was caused by temporary issues with the refrigeration system. The resultant pressure decline in the tank is also well represented, with the same deviation observed in the middle of the experiment. This capability of the model to simulate storage at sub-atmospheric pressures is highly relevant to LH2 applications in microgravity environments, including the cryogenic storage systems needed for future long-term space missions [90].
3.3. Self Pressurization of Spherical LH2 Storage Tank at NASA
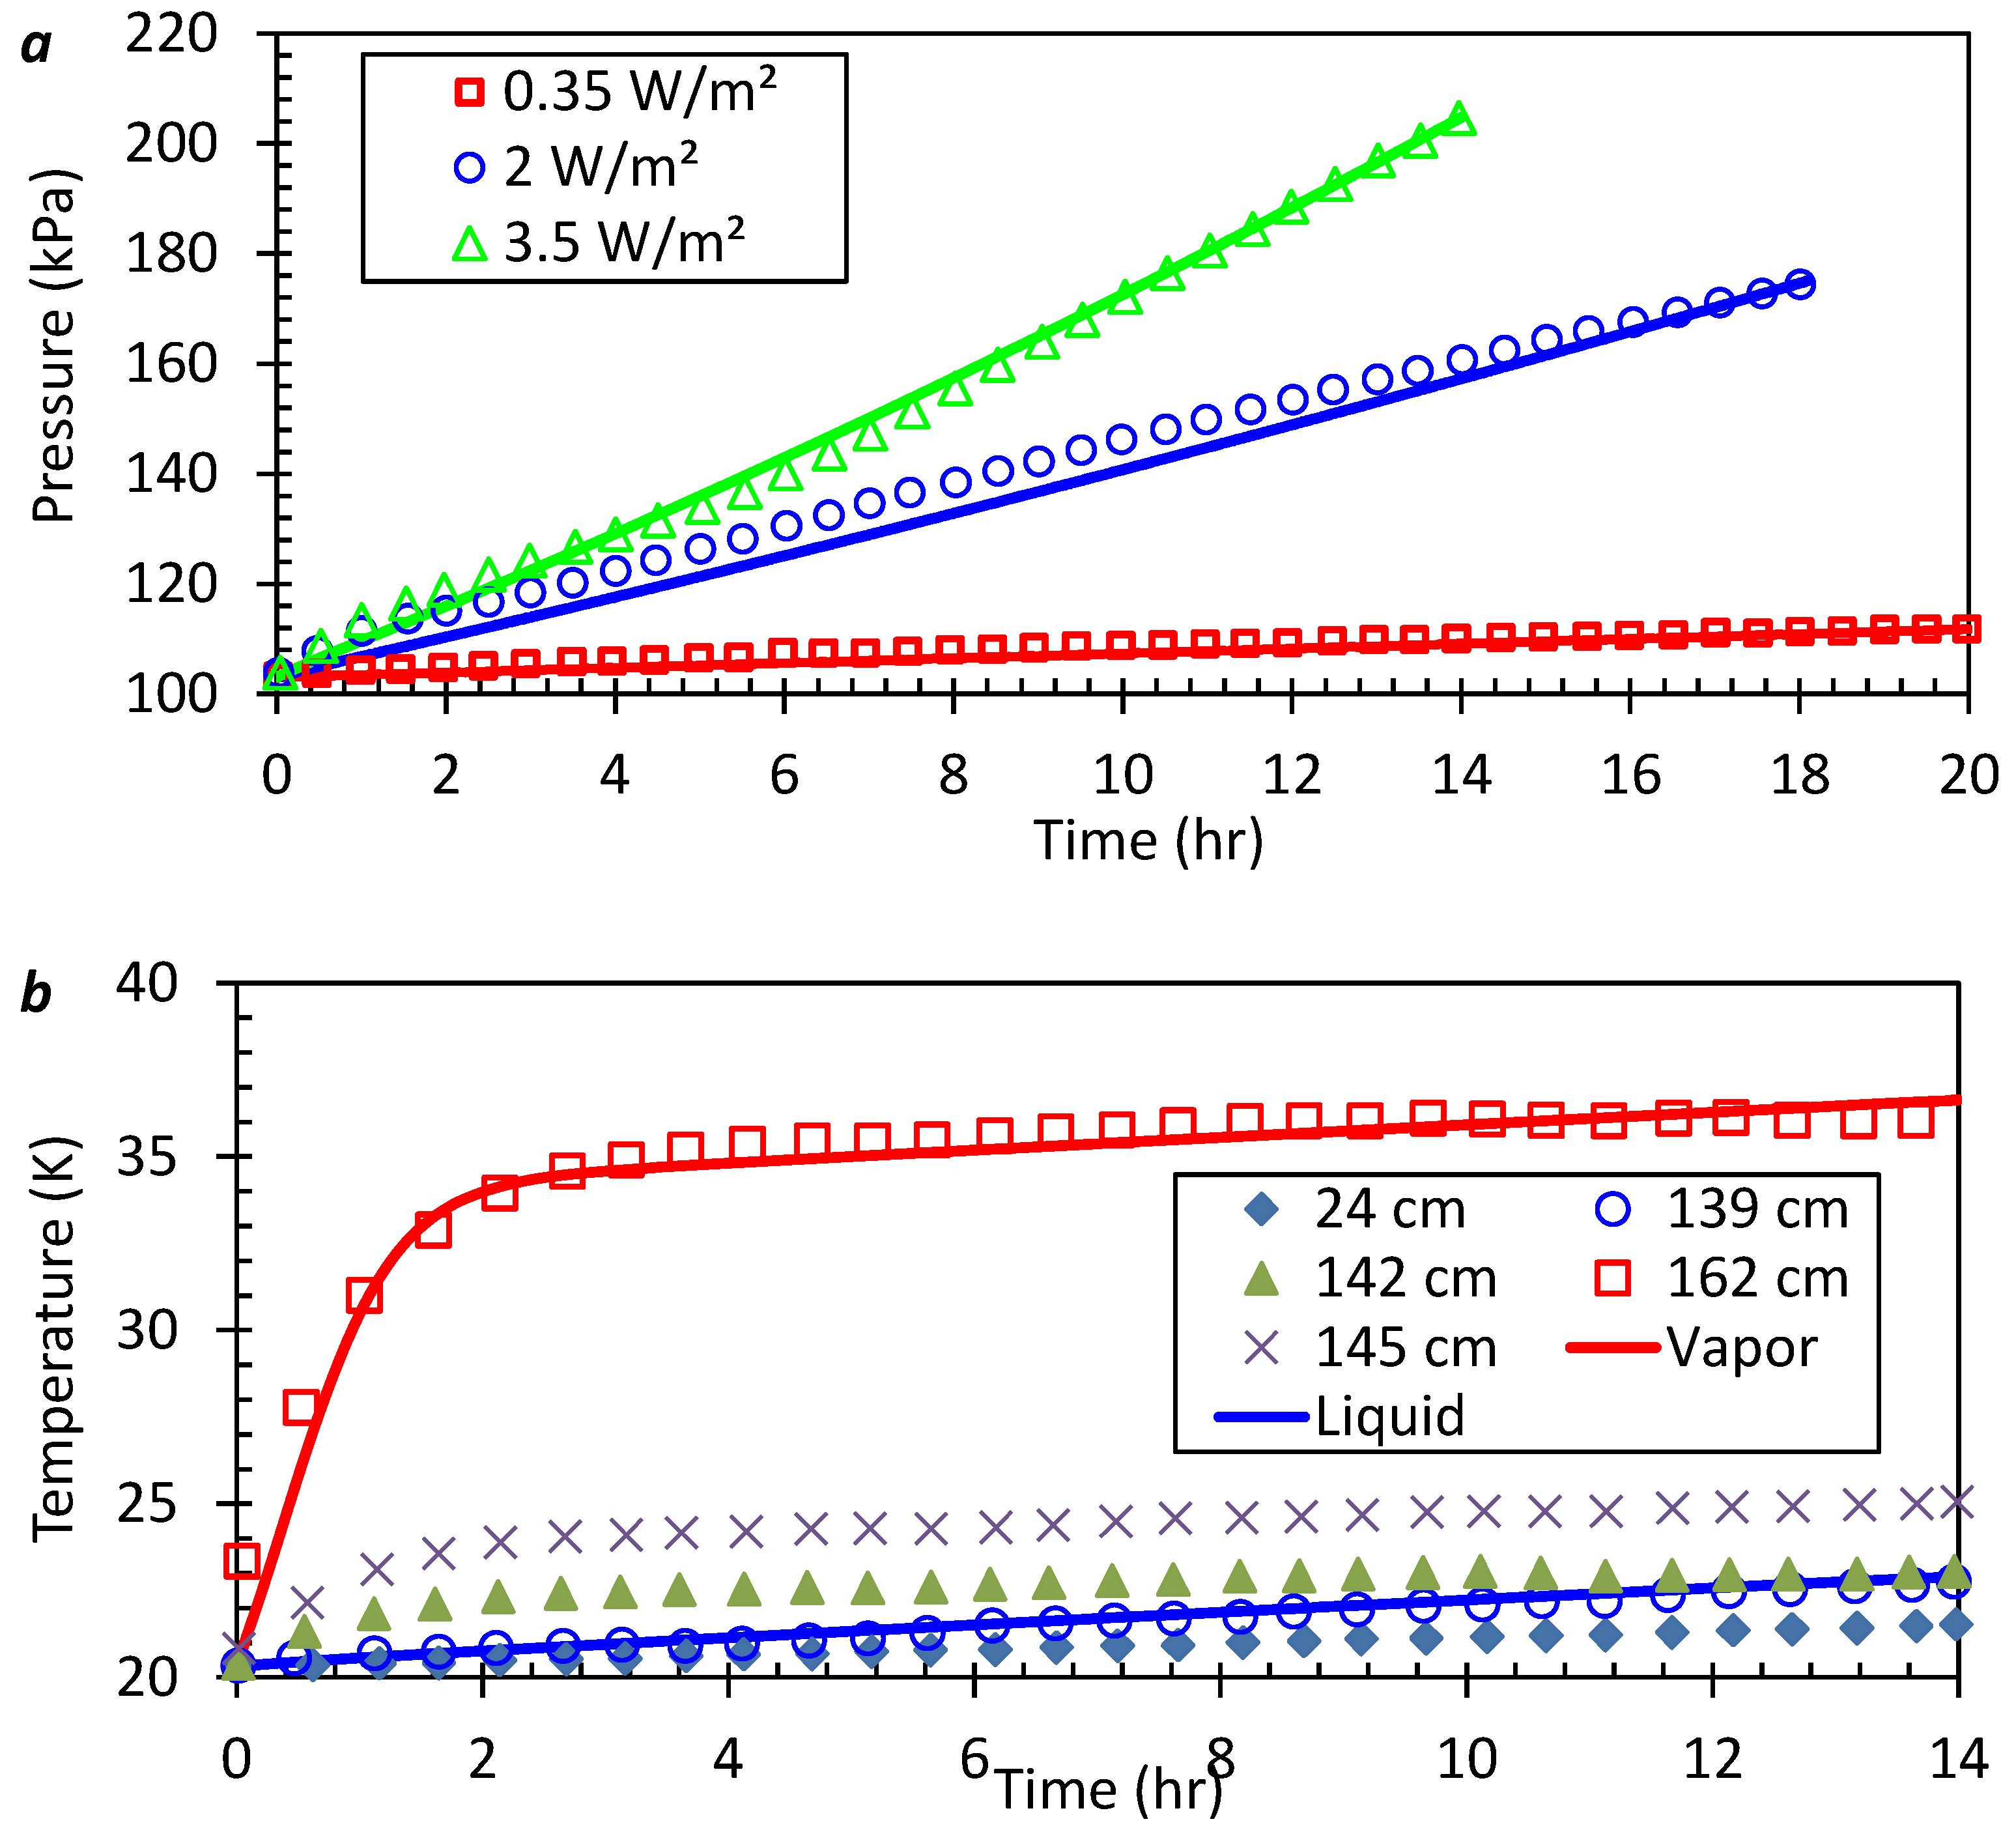
An experiment conducted at NASA’s Glenn Research Centre (formerly Lewis Research Centre) by Hasan et al. [53] investigated the self-pressurization and thermal stratification of a LH2 storage tank subject to three heat fluxes between 0.35 and 3.5 W/m2-, hereafter referred to as Tests 1–3. The experimental setup consisted of an ellipsoidal 4.89 m3 storage tank, modelled here as a sphere that was 83–84% full of LH2. Liquid nitrogen and electrical resistance heaters were used to cool and warm, respectively, the encompassing cylindrical cryoshroud chamber and achieve the desired heat flux [53]. The tank is insulated with two blankets of MLI, each having seventeen Mylar layers; however, the thickness of the insulation layer was not stated by Hasan et al. [53]. The heat transfer parameters used when simulating the three cases are given in Table 2. The ambient temperatures were sourced from Hasan et al. [53]. The ambient-vapor and ambient-liquid heat transfer coefficients were simply estimated based on the measured experimental heat fluxes, the prevailing ambient (boundary) temperature, and the initial system temperature response. It was not possible to use existing correlations to estimate these values in this case as there are insufficient details concerning the insulation system used and uncertainly as to how the use of the electrical resistance heaters can be incorporated into such calculations. A vapor–liquid heat transfer coefficient, UVL = 1.04 W/m2/K, was chosen as this best matched the average vapor temperature behaviour presented by Hasan et al. [53] for the 3.5 W/m2 case. In our previous work modelling LNG boil-off [59], we found that a UVL of 4.0 W/m2/K produced the best match for the experiment. However, this value depends in part on the tank, fluid, and vapor–liquid interface geometry—the LNG experiments were conducted in a 0.0067 m3 vertical cylinder, while the cases modelled here were conducted in a 4.89 m3 ellipsoidal tank.
The self-pressurization results for Tests 1 to 3 for 0.35 to 3.5 W/m2 are shown in Figure 5a and are in excellent agreement with the BoilFAST estimates denoted by the solid curves. Some deviation exists with the data’s curvature in Test 2 (2 W/m2); however, this potentially reflects that the heat flux at the beginning of the experiment was initially slightly larger than the average value. Stratification in both the liquid and vapor phases is observed for all tests, particularly for the highest heat flux of 3.5 W/m2, as shown in Figure 5b. The temperatures recorded by the Resistance Temperature Detector (RTD) sensors, which measure temperature using the electrical resistance of the sensor material at varying heights from the bottom of the tank, clearly depict this phenomenon—where sensors above a height of 140 cm are stated to be in the ullage region (vapor space) [53]. As a result, the sensor at a height of 139 cm is close to the liquid–vapor interface and is well represented by the model’s liquid temperature estimation. The tank has an internal height of 183 cm, thus the sensor located at a height of 162 cm is located approximately in the centre of the vapor space. The temperatures recorded by this sensor are in excellent agreement with the vapor temperature calculated by BoilFAST.
3.4. Boil-Off Losses along the LH2 Pathway
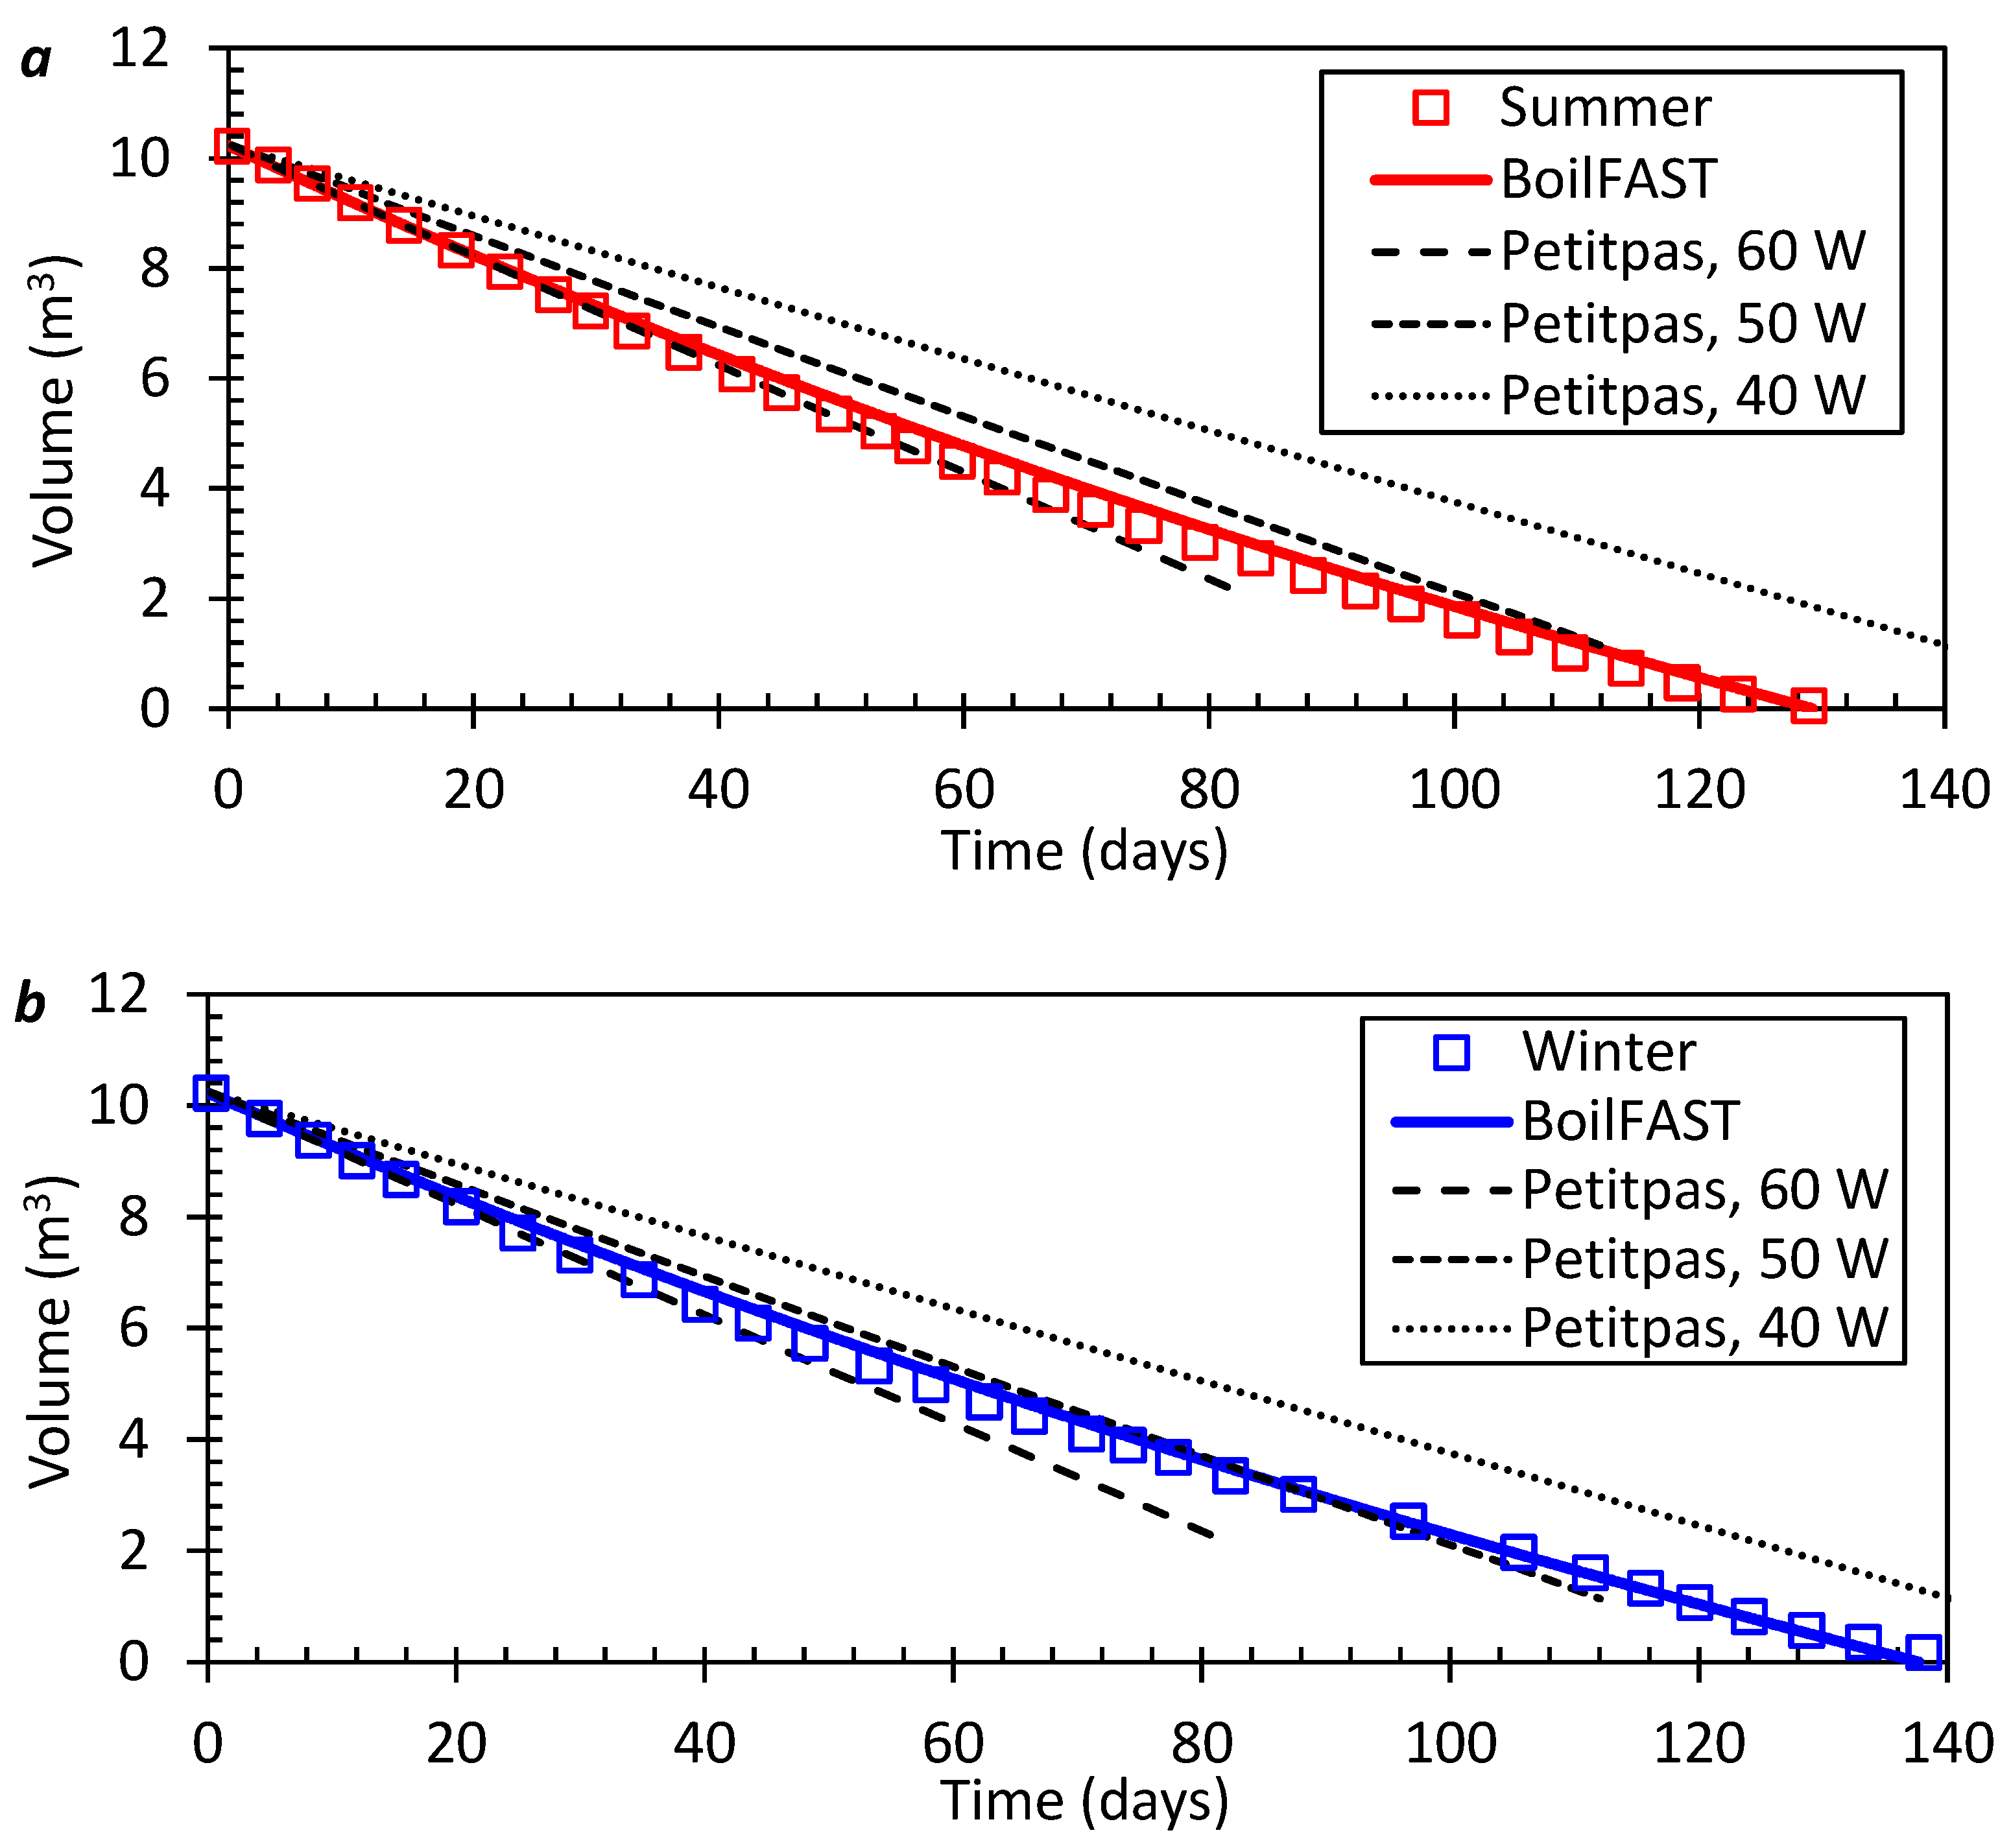
In the work of Petitpas [27], a 12.5 m3 LH2 Dewar tank with a 2 m internal diameter at the Lawrence Livermore Cryogenic Hydrogen Test Facility was subjected to ambient heat ingress to measure the change in liquid volume over summer versus winter. For this experiment, the relief pressure was set to 310 kPa and the initial fill volume of LH2 was 10.2 m3. Throughout the experiment, the system remained ‘static’, meaning no mass transfer across the system boundary (such as refuelling) occurred. Petitpas also presented a model to estimate the boil-off losses based on their experimental data. This model ignores the insulation in the energy balance, instead assuming a constant rate of heat ingress into the tank; 50 W was found to yield the closest estimate to the experimental data. Here, instead of using a constant heat ingress rate of 50 W in BoilFAST, this rate was used to estimate the overall heat transfer coefficients between each phase and the ambient environment of 0.0045 W·m−2·K−1 for both UV and UL, a value consistent with the range of U (0.0027–0.0102) W·m−2·K−1 that was estimated for similar multi-layer insulation systems [88]. A vapor–liquid heat transfer coefficient, UVL = 0.15 W/m2/K was chosen as this best matched the vapor temperature data reported by Petitpas [27]. The experimental results are shown in Figure 6, alongside estimates made using BoilFAST and the model of Petitpas [27]. The resulting simulation matched the experimental data well, capturing the variable heat ingress rate evident in the slightly non-linear experimental data.
4. Summary
A robust, efficient, and flexible simulation tool, BoilFAST, has been developed to estimate the boil-off from liquid hydrogen storage using a non-equilibrium approach. The results presented in this work show that the results from the BoilFAST simulations are in good agreement with the experimental data from multiple large-scale liquid hydrogen storage tests measured across a range of conditions. The SHV model implemented in BoilFAST has the potential to become a valuable tool for the hydrogen industry through the reliable estimation of self-pressurization and boil-off rates for a variety of scenarios and customisable tank geometries. This will enable for better design and simulation of the liquid hydrogen storage infrastructure—in particular, BOG management systems such as compressors—and by informing tank insulation requirements. This work also demonstrates that the existing engineering correlations for manually estimating wall-fluid heat transfer coefficients (UL and UV) are sufficiently accurate to allow a robust representation of BOG phenomena across a range of tank sizes, geometries, and fluids—including liquid hydrogen, which provided adequate detail regarding the insulation used. This tool will enable the storage of liquid hydrogen to be further optimized in both the energy and space industries. Future improvements to BoilFAST will focus on calculating the vapour–liquid heat transfer coefficients for different tank geometries and insulation systems, describing any thermal stratification of the liquid phase, and being able to simulate hydrogen storage filling and draining operations.
Author Contributions
S.Z.S.A.G.: methodology, project administration, supervision, visualization, writing—original draft; A.S. (Adam Swanger): methodology, formal analysis, investigation; V.J.: software, methodology, formal analysis, investigation, visualization, writing—review and editing; A.S. (Arman Siahvashi): investigation; F.P.: investigation; M.L.J.: writing—review and editing; E.F.M.: funding acquisition, supervision, writing—review and editing. All authors have read and agreed to the published version of the manuscript.
Funding
This work was supported by the Future Energy Exports CRC (www.fenex.org.au, accessed 1 February 2022) whose activities are funded by the Australian Government’s Cooperative Research Centre Program. This is FEnEx CRC Document 2021/20.RP0.001-FNX-0001.
Institutional Review Board Statement
Not applicable.
Conflicts of Interest
The authors declare no conflict of interest.
References
- Raab, M.; Maier, S.; Dietrich, R.-U. Comparative techno-economic assessment of a large-scale hydrogen transport via liquid transport media. Int. J. Hydrogen Energy 2021, 46, 11956–11968. [Google Scholar] [CrossRef]
- Nakano, A.; Shimazaki, T.; Sekiya, M.; Shiozawa, H.; Ohtsuka, K.; Aoyagi, A.; Iwakiri, T.; Mikami, Z.; Sato, M.; Sugino, Y.; et al. Research and development of liquid hydrogen (LH2) temperature monitoring system for marine applications. Int. J. Hydrogen Energy 2021, 46, 15649–15659. [Google Scholar] [CrossRef]
- Ugurlu, A.; Oztuna, S. How liquid hydrogen production methods affect emissions in liquid hydrogen powered vehicles? Int. J. Hydrogen Energy 2020, 45, 35269–35280. [Google Scholar] [CrossRef]
- Dong, K.; Hochman, G.; Zhang, Y.; Sun, R.; Li, H.; Liao, H. CO2 emissions, economic and population growth, and renewable energy: Empirical evidence across regions. Energy Econ. 2018, 75, 180–192. [Google Scholar] [CrossRef]
- Abe, A.; Nakamura, M.; Sato, I.; Uetani, H.; Fujitani, T. Studies of the large-scale sea transportation of liquid hydrogen. Int. J. Hydrogen Energy 1998, 23, 115–121. [Google Scholar] [CrossRef]
- Gursu, S.; Lordgooei, M.; Sherif, S.A.; Veziroǧlu, T.N. An optimization study of liquid hydrogen boil-off losses. Int. J. Hydrogen Energy 1992, 17, 227–236. [Google Scholar] [CrossRef]
- Petitpas, G. Boil-Off Losses along the LH2 Pathway; Lawrence Livermore National Laboratory: Livermore, CA, USA, 2018. [Google Scholar]
- Wang, J.; Li, Y.; Wang, L.; Xia, S.; Ren, J.; Mao, H.; Xu, Y. Numerical investigation on subcooled pool film boiling of liquid hydrogen in different gravities. Int. J. Hydrogen Energy 2021, 46, 2646–2657. [Google Scholar] [CrossRef]
- Tan, H.; Zhao, Q.; Sun, N.; Li, Y. Enhancement of energy performance in a boil-off gas re-liquefaction system of LNG carriers using ejectors. Energy Convers. Manag. 2016, 126, 875–888. [Google Scholar] [CrossRef]
- Lin, Y.; Ye, C.; Yu, Y.-Y.; Bi, S.-W. An approach to estimating the boil-off rate of LNG in type C independent tank for floating storage and regasification unit under different filling ratio. Appl. Therm. Eng. 2018, 135, 463–471. [Google Scholar] [CrossRef]
- Querol, E.; Gonzalez-Regueral, B.; García-Torrent, J.; García-Martínez, M.J. Boil off gas (BOG) management in Spanish liquid natural gas (LNG) terminals. Appl. Energy 2010, 87, 3384–3392. [Google Scholar] [CrossRef]
- Kurle, Y.M.; Wang, S.; Xu, Q. Simulation study on boil-off gas minimization and recovery strategies at LNG exporting terminals. Appl. Energy 2015, 156, 628–641. [Google Scholar] [CrossRef]
- Shin, Y.; Lee, Y.P. Design of a boil-off natural gas reliquefaction control system for LNG carriers. Appl. Energy 2009, 86, 37–44. [Google Scholar] [CrossRef]
- Verfondern, K. Safety Considerations on Liquid Hydrogen; Forschungszentrum Jülich GmbH: Jülich, Germany, 2007; p. 27. ISBN 978-3-89336-530-2. [Google Scholar]
- Kang, M.; Kim, J.; You, H.; Chang, D. Experimental investigation of thermal stratification in cryogenic tanks. Exp. Therm. Fluid Sci. 2018, 96, 371–382. [Google Scholar] [CrossRef]
- Gursu, S.; Sherif, S.A.; Veziroglu, T.N.; Sheffield, J.W. Analysis and Optimization of Thermal Stratification and Self-Pressurization Effects in Liquid Hydrogen Storage Systems—Part 1: Model Development. J. Energy Resour. Technol. 1993, 115, 221–227. [Google Scholar] [CrossRef]
- Choi, S.W.; Lee, W.I.; Kim, H.S. Numerical analysis of convective flow and thermal stratification in a cryogenic storage tank. Numer. Heat Transf. Part A Appl. 2017, 71, 402–422. [Google Scholar] [CrossRef]
- Ferrin, J.L.; Perez-Perez, L.J. Numerical simulation of natural convection and boil-off in a small size pressurized LNG storage tank. Comput. Chem. Eng. 2020, 138, 106840. [Google Scholar] [CrossRef]
- Ren, J.-J.; Shi, J.-Y.; Liu, P.; Bi, M.-S.; Jia, K. Simulation on thermal stratification and de-stratification in liquefied gas tanks. Int. J. Hydrogen Energy 2013, 38, 4017–4023. [Google Scholar] [CrossRef]
- Saleem, A.; Farooq, S.; Karimi, I.A.; Banerjee, R. CFD Analysis of Stratification and Rollover Phenomena in an Industrial-Scale LNG Storage Tank. Ind. Eng. Chem. Res. 2020, 59, 14126–14144. [Google Scholar] [CrossRef]
- Shi, J.Q.; Beduz, C.; Scurlock, R.G. Numerical modelling and flow visualization of mixing of stratified layers and rollover in LNG. Cryogenics 1993, 33, 1116–1124. [Google Scholar] [CrossRef]
- Mawire, A. Experimental and simulated thermal stratification evaluation of an oil storage tank subjected to heat losses during charging. Appl. Energy 2013, 108, 459–465. [Google Scholar] [CrossRef]
- Ghaddar, N.K.; Al-Marafie, A.M.; Al-Kandari, A. Numerical simulation of stratification behaviour in thermal storage tanks. Appl. Energy 1989, 32, 225–239. [Google Scholar] [CrossRef]
- Kalanidhi, A. Boil-off in long-term stored liquid hydrogen. Int. J. Hydrogen Energy 1988, 13, 311–313. [Google Scholar] [CrossRef]
- Sakamoto, Y.; Kobayashi, H.; Naruo, Y.; Takesaki, Y.; Nakajima, Y.; Kabayama, K.; Sato, T. Investigation of boiling hydrogen flow characteristics under low-pressure conditions—Flow regime transition characteristics. Int. J. Hydrogen Energy 2021, 46, 8239–8252. [Google Scholar] [CrossRef]
- Sherif, S.A.; Zeytinoglu, N.; Veziroǧlu, T.N. Liquid hydrogen: Potential, problems, and a proposed research program. Int. J. Hydrogen Energy 1997, 22, 683–688. [Google Scholar] [CrossRef]
- Petitpas, G. Simulation of boil-off losses during transfer at a LH2 based hydrogen refueling station. Int. J. Hydrogen Energy 2018, 43, 21451–21463. [Google Scholar] [CrossRef]
- Zuo, Z.Q.; Sun, P.J.; Jiang, W.B.; Qin, X.J.; Li, P.; Huang, Y.H. Thermal stratification suppression in reduced or zero boil-off hydrogen tank by self-spinning spray bar. Int. J. Hydrogen Energy 2019, 44, 20158–20172. [Google Scholar] [CrossRef]
- Haberbusch, M.S.; Stochl, R.J.; Culler, A.J. Thermally optimized zero boil-off densified cryogen storage system for space. Cryogenics 2004, 44, 485–491. [Google Scholar] [CrossRef]
- Majumdar, A.K.; Steadman, T.E.; Maroney, J.L.; Sass, J.P.; Fesmire, J.E. Numerical modeling of propellant boil-off in a cryogenic storage tank. AIP Conf. Proc. 2008, 985, 1507–1514. [Google Scholar]
- Bailey, T.E.; Fearn, R.F. Analytical and Experimental Determination of Liquid-Hydrogen Temperature Stratification; Springer: Boston, MA, USA, 1964; pp. 254–264. [Google Scholar]
- Plachta, D.; Stephens, J.; Johnson, W.; Zagarola, M. NASA cryocooler technology developments and goals to achieve zero boil-off and to liquefy cryogenic propellants for space exploration. Cryogenics 2018, 94, 95–102. [Google Scholar] [CrossRef] [Green Version]
- Sun, X.-W.; Guo, Z.-Y.; Huang, W. Passive zero-boil-off storage of liquid hydrogen for long-time space missions. Int. J. Hydrogen Energy 2015, 40, 9347–9351. [Google Scholar] [CrossRef]
- Zheng, Y.; Chang, H.; Chen, J.; Chen, H.; Shu, S. Effect of microgravity on flow boiling heat transfer of liquid hydrogen in transportation pipes. Int. J. Hydrogen Energy 2019, 44, 5543–5550. [Google Scholar] [CrossRef]
- Tatom, J.W.; Brown, W.H.; Knight, L.H.; Coxe, E.F. Analysis of Thermal Stratification of Liquid Hydrogen in Rocket Propellant Tanks; Springer: Boston, MA, USA, 1964; pp. 265–272. [Google Scholar]
- Joseph, J.; Agrawal, G.; Agarwal, D.; Pisharady, J.; Kumar, S.S. Effect of Insulation Thickness on Pressure Evolution and Thermal Stratification in a Cryogenic Tank. Appl. Therm. Eng. 2016, 111, 1629–1639. [Google Scholar] [CrossRef]
- Schaffer, M. A Study of Cryogenic Propulsive Stages for Human Exploration beyond Low Earth Orbit; International Astronautical Federation: Paris, France, 2012. [Google Scholar]
- Miana, M.; del Hoyo, R.; Rodrigálvarez, V. Comparison of evaporation rate and heat flow models for prediction of Liquefied Natural Gas (LNG) ageing during ship transportation. Fuel 2016, 177, 87–106. [Google Scholar] [CrossRef]
- Huerta, F.; Vesovic, V. A realistic vapour phase heat transfer model for the weathering of LNG stored in large tanks. Energy 2019, 174, 280–291. [Google Scholar] [CrossRef]
- Miana, M.; Hoyo, R.D.; Rodrigálvarez, V.; Valdés, J.R.; Llorens, R. Calculation models for prediction of Liquefied Natural Gas (LNG) ageing during ship transportation. Appl. Energy 2010, 87, 1687–1700. [Google Scholar] [CrossRef]
- Chen, Q.S.; Wegrzyn, J.; Prasad, V. Analysis of temperature and pressure changes in liquefied natural gas (LNG) cryogenic tanks. Cryogenics 2004, 44, 701–709. [Google Scholar] [CrossRef]
- Adom, E.; Islam, S.; Ji, X. Modelling of Boil-Off Gas in LNG Tanks: A Case Study. Int. J. Eng. Technol. 2010, 2, 292–296. [Google Scholar]
- Pellegrini, L.A.; Moioli, S.; Brignoli, F.; Bellini, C. LNG Technology: The Weathering in Above-Ground Storage Tanks. Ind. Eng. Chem. Res. 2014, 53, 3931–3937. [Google Scholar] [CrossRef]
- Migliore, C.; Salehi, A.; Vesovic, V. A non-equilibrium approach to modelling the weathering of stored Liquefied Natural Gas (LNG). Energy 2017, 124, 684–692. [Google Scholar] [CrossRef]
- Migliore, C. Modelling the Weathering Process of Stored Liquefied Natural Gas (LNG); Imperial College London: London, UK, 2016. [Google Scholar]
- Wang, Z.; Sharafian, A.; Mérida, W. Non-equilibrium thermodynamic model for liquefied natural gas storage tanks. Energy 2020, 190, 116412. [Google Scholar] [CrossRef]
- Migliore, C.; Tubilleja, C.; Vesovic, V. Weathering prediction model for stored liquefied natural gas (LNG). J. Nat. Gas Sci. Eng. 2015, 26, 570–580. [Google Scholar] [CrossRef] [Green Version]
- Effendy, S.; Khan, M.S.; Farooq, S.; Karimi, I.A. Dynamic modelling and optimization of an LNG storage tank in a regasification terminal with semi-analytical solutions for N2-free LNG. Comput. Chem. Eng. 2017, 99, 40–50. [Google Scholar] [CrossRef]
- Krikkis, R.N. A thermodynamic and heat transfer model for LNG ageing during ship transportation. Towards an efficient boil-off gas management. Cryogenics 2018, 92, 76–83. [Google Scholar] [CrossRef]
- Qu, Y.; Noba, I.; Xu, X.; Privat, R.; Jaubert, J.-N. A thermal and thermodynamic code for the computation of Boil-Off Gas—Industrial applications of LNG carrier. Cryogenics 2019, 99, 105–113. [Google Scholar] [CrossRef]
- Kumar, S.P.; Prasad, B.V.S.S.S.; Venkatarathnam, G.; Ramamurthi, K.; Murthy, S.S. Influence of surface evaporation on stratification in liquid hydrogen tanks of different aspect ratios. Int. J. Hydrogen Energy 2007, 32, 1954–1960. [Google Scholar] [CrossRef]
- Barsi, S.; Kassemi, M. Numerical and experimental comparisons of the self-pressurization behavior of an LH2 tank in normal gravity. Cryogenics 2008, 48, 122–129. [Google Scholar] [CrossRef]
- Hasan, M.M.; Lin, C.S.; van Dresar, N.T.; Park, F. Self-pressurization of a flightweight liquid hydrogen storage tank subjected to low heat flux. In Proceedings of the ASME/AIChE National Heat Transfer Conference, Minneapolis, MN, USA, 1 January 1991. [Google Scholar]
- Roh, S.; Son, G. Numerical study of natural convection in a liquefied natural gas tank. J. Mech. Sci. Technol. 2012, 26, 3133–3140. [Google Scholar] [CrossRef]
- Roh, S.; Son, G.; Song, G.; Bae, J. Numerical study of transient natural convection in a pressurized LNG storage tank. Appl. Therm. Eng. 2013, 52, 209–220. [Google Scholar] [CrossRef]
- Kountz, K.J. Weathering of On-Board Storage Tanks. Project Final Report; IGT Project 32034-02; Institute of Gas Technology: Des Plaines, IL, USA, 1999. [Google Scholar]
- Harper, G.; Powars, C. Advanced Liquid Natural Gas Onboard Storage System. 2003. Available online: https://www.osti.gov/biblio/835120-advanced-liquid-natural-gas-onboard-storage-system (accessed on 16 December 2021).
- Perez, F.; Al Ghafri, S.Z.S.; Gallagher, L.; Siahvashi, A.; Ryu, Y.; Kim, S.; Kim, S.G.; Johns, M.L.; May, E.F. Measurements of boil-off gas and stratification in cryogenic liquid nitrogen with implications for the storage and transport of liquefied natural gas. Energy 2021, 222, 119853. [Google Scholar] [CrossRef]
- Al Ghafri, S.Z.; Perez, F.; Park, K.H.; Gallagher, L.; Warr, L.; Stroda, A.; Siahvashi, A.; Ryu, Y.; Kim, S.; Kim, S.G.; et al. Advanced Boil-Off Gas Studies for Liquefied Natural Gas. Appl. Therm. Eng. 2021, 189, 116735. [Google Scholar] [CrossRef]
- Kunz, O.; Wagner, W. The GERG-2008 Wide-Range Equation of State for Natural Gases and Other Mixtures: An Expansion of GERG-2004. J. Chem. Eng. Data 2012, 57, 3032–3091. [Google Scholar] [CrossRef]
- Monika, T.; Markus, R.; Eric, F.M.; Eric, W.L.; Roland, S. EOS-LNG: A Fundamental Equation of State for the Calculation of Thermodynamic Properties of Liquefied Natural Gases. J. Phys. Chem. Ref. Data 2019, 48, 033102. [Google Scholar]
- Barrón-Palos, L.; Alarcon, R.; Balascuta, S.; Blessinger, C.; Bowman, J.D.; Chupp, T.E.; Covrig, S.; Crawford, C.B.; Dabaghyan, M.; Dadras, J.; et al. Determination of the parahydrogen fraction in a liquid hydrogen target using energy-dependent slow neutron transmission. Nucl. Instrum. Methods Phys. Res. Sect. A Accel. Spectrometers Detect. Assoc. Equip. 2011, 659, 579–586. [Google Scholar] [CrossRef]
- Silvera, I.F. The solid molecular hydrogens in the condensed phase: Fundamentals and static properties. Rev. Mod. Phys. 1980, 52, 393–452. [Google Scholar] [CrossRef]
- Leachman, J.W.; Jacobsen, R.T.; Penoncello, S.G.; Lemmon, E.W. Fundamental Equations of State for Parahydrogen, Normal Hydrogen, and Orthohydrogen. J. Phys. Chem. Ref. Data 2009, 38, 721–748. [Google Scholar] [CrossRef]
- Boeva, O.A.; Odintzov, A.A.; Solovov, R.D.; Abkhalimov, E.V.; Zhavoronkova, K.N.; Ershov, B.G. Low-temperature ortho–para hydrogen conversion catalyzed by gold nanoparticles: Particle size does not affect the rate. Int. J. Hydrogen Energy 2017, 42, 22897–22902. [Google Scholar] [CrossRef]
- Skaugen, G.; Berstad, D.; Wilhelmsen, Ø. Comparing exergy losses and evaluating the potential of catalyst-filled plate-fin and spiral-wound heat exchangers in a large-scale Claude hydrogen liquefaction process. Int. J. Hydrogen Energy 2020, 45, 6663–6679. [Google Scholar] [CrossRef]
- Petitpas, G.; Aceves, S.M.; Matthews, M.J.; Smith, J.R. Para-H2 to ortho-H2 conversion in a full-scale automotive cryogenic pressurized hydrogen storage up to 345 bar. Int. J. Hydrogen Energy 2014, 39, 6533–6547. [Google Scholar] [CrossRef]
- Ubaid, S.; Xiao, J.; Zacharia, R.; Chahine, R.; Bénard, P. Effect of para–ortho conversion on hydrogen storage system performance. Int. J. Hydrogen Energy 2014, 39, 11651–11660. [Google Scholar] [CrossRef]
- Peng, J.K.; Ahluwalia, R.K. Enhanced dormancy due to para-to-ortho hydrogen conversion in insulated cryogenic pressure vessels for automotive applications. Int. J. Hydrogen Energy 2013, 38, 13664–13672. [Google Scholar] [CrossRef]
- Sherman, A.; Lanham, M. Cooling by Conversion of Para to Ortho-Hydrogen; NASA Goddard Space Flight Centre: Greenbelt, MD, USA, 1983.
- Moran, M.; Nyland, T.E.D. Hydrogen no-vent testing in a 5 cubic foot (142 L) tank using spray nozzle and spray bar liquid injection. In Proceedings of the 28th Joint Propulsion Conference and Exhibit: American Institute of Aeronautics and Astronautics, Nashville, TN, USA, 6–8 July 1992. [Google Scholar]
- Moran, M.E.; Nyland, T.W.; Driscoll, S.L. Hydrogen No-Vent Fill Testing in a 34 Liter (1.2 Cubic Foot) Tank; NASA: Washington, DC, USA, 1992.
- Chato, D. Ground testing for the no-vent fill of cryogenic tanks—Results of tests for a 71 cubic foot tank. In Proceedings of the 29th Joint Propulsion Conference and Exhibit: American Institute of Aeronautics and Astronautics, Monterey, CA, USA, 1 June 1993. [Google Scholar]
- Taylor, W.; Chato, D. Improved thermodynamic modelling of the no-vent fill process and correlation with experimental data. In Proceedings of the 26th Thermophysics Conference, Honolulu, HI, USA, 24–26 June 1991. [Google Scholar]
- Notardonato, W.U.; Swanger, A.M.; Fesmire, J.E.; Jumper, K.M.; Johnson, W.L.; Tomsik, T.M. Zero boil-off methods for large-scale liquid hydrogen tanks using integrated refrigeration and storage. IOP Conf. Ser. Mater. Sci. Eng. 2017, 278, 012012. [Google Scholar] [CrossRef]
- Notardonato, W.U.; Swanger, A.M.; Fesmire, J.E.; Jumper, K.M.; Johnson, W.L.; Tomsik, T.M. Final test results for the ground operations demonstration unit for liquid hydrogen. Cryogenics 2017, 88, 147–155. [Google Scholar] [CrossRef] [Green Version]
- Notardonato, W.U.; Johnson, W.L.; Swanger, A.M.; Tomsik, T. Ground operations demonstration unit for liquid hydrogen initial test results. IOP Conf. Ser. Mater. Sci. Eng. 2015, 101, 012081. [Google Scholar] [CrossRef] [Green Version]
- Swanger, A.M.; Notardonato, W.U.; Fesmire, J.E.; Jumper, K.M.; Johnson, W.L.; Tomsik, T.M. Large scale production of densified hydrogen to the triple point and below. IOP Conf. Ser. Mater. Sci. Eng. 2017, 278, 012013. [Google Scholar] [CrossRef] [Green Version]
- Kim, Y.; Lee, C.; Park, J.; Seo, M.; Jeong, S. Experimental investigation on no-vent fill process using tetrafluoromethane (CF4). Cryogenics 2016, 74, 123–130. [Google Scholar] [CrossRef]
- Wang, L.; Li, Y.; Li, C.; Zhao, Z. CFD investigation of thermal and pressurization performance in LH2 tank during discharge. Cryogenics 2013, 57, 63–73. [Google Scholar] [CrossRef]
- Wang, L.; Li, Y.; Zhang, F.; Ma, Y. Performance analysis of no-vent fill process for liquid hydrogen tank in terrestrial and on-orbit environments. Cryogenics 2015, 72, 161–171. [Google Scholar] [CrossRef]
- Jin, L.; Park, C.; Cho, H.; Lee, C.; Jeong, S. Experimental investigation on chill-down process of cryogenic flow line. Cryogenics 2016, 79, 96–105. [Google Scholar] [CrossRef]
- Kim, K.J.; Jin, L.; Kim, Y.; Jeong, S. Experimental Investigation on No Vent Fill Process of Cryogenic Liquid. In Proceedings of the 27th International Ocean and Polar Engineering Conference, San Francisco, CA, USA, 25–30 June 2017; International Society of Offshore and Polar Engineers. p. 8. [Google Scholar]
- Ma, Y.; Li, Y.; Zhu, K.; Wang, Y.; Wang, L.; Tan, H. Investigation on no-vent filling process of liquid hydrogen tank under microgravity condition. Int. J. Hydrogen Energy 2017, 42, 8264–8277. [Google Scholar] [CrossRef]
- Jusko, V.; Al Ghafri, S.Z.S.; May, E.F. BoilFAST v1.1.0; Fluid Sciences and Resources Division, The University of Western Australia: Perth, Australia, 2021. [Google Scholar]
- Ghafri, S.Z.A.; Swanger, A.; Park, K.H.; Jusko, V.; Ryu, Y.; Kim, S.; Kim, S.G.; Zhang, D.; Seo, Y.; Johns, M.L.; et al. Advanced Boil-Off Gas Studies of Liquefied Natural Gas used for the Space and Energy Industries. Acta Astronaut 2021, 190, 444–454. [Google Scholar] [CrossRef]
- Rose, L.; Swanger, A.M.; Notardonato, W.U.; Fesmire, J.E.; Gleeson, J.; Carro, R. Integrated Refrigeration and Storage of LNG for Compositional Stability. In Proceedings of the Cryogenic Engineering Conference and International Cryogenic Materials Conference, Hartford, CT, USA, 21–25 July 2019. [Google Scholar]
- Swanger, A.M.; Notardonato, W.U.; Jumper, K.M. ASME Section VIII Recertification of a 33,000 Gallon Vacuum-Jacketed LH2 Storage Vessel for Densified Hydrogen Testing at NASA Kennedy Space Center; NASA/Langley Research Center: Hampton, VA, USA, 2015.
- Fesmire, J.E.; Johnson, W.L. Cylindrical cryogenic calorimeter testing of six types of multilayer insulation systems. Cryogenics 2018, 89, 58–75. [Google Scholar] [CrossRef]
- Tesny, E.M.; Hauser, D.M. Thermal Modeling of Zero Boil Off Tank Experiment. In AIAA Propulsion and Energy 2019 Forum; American Institute of Aeronautics and Astronautics: Reston, VA, USA, 2019. [Google Scholar]
Figure 1.
The BoilFAST Graphical User Interface (GUI), which is used to set up and run simulations using the SHV model.
Figure 1.
The BoilFAST Graphical User Interface (GUI), which is used to set up and run simulations using the SHV model.

Figure 2.
A conceptual schematic of the superheated vapor model implemented in BoilFAST, showing the heat and mass transfer processes considered for a storage tank exchanging heat with the ambient environment.
Figure 2.
A conceptual schematic of the superheated vapor model implemented in BoilFAST, showing the heat and mass transfer processes considered for a storage tank exchanging heat with the ambient environment.

Figure 3.
The super-heated vapor model implemented in BoilFAST for calculating pressure build-up and BOG flowrate. Q: heat transferred during the time interval Δt; H and h: phase and phase’s specific enthalpies; ρ: phase density; r: tank radius; V: phase volume; nboil: amount of liquid converted into vapor; nrelief: amount of vapor relieved (BOG); U: overall heat transfer coefficients; A: contact surface or interfacial area; subscripts VL, L, and V: the interface and liquid- and vapor-filled sections of the cell, respectively; xi, yi, and wi: mole fractions of component i in the liquid, vapor, and interface, respectively; and subscripts j, j − 1, and j + 1: current, previous, and next time steps, respectively.

Figure 4.
Comparison between the BoilFAST calculations (solid curves) and experimental data (symbols) obtained from a LH2 horizontal storage tank at NASA’s Kennedy Space Centre. (a) 33% duty-cycle experiment, (b) 67% duty-cycle experiment, and (c) 46% densification experiment to hydrogen’s triple point, which is indicated using a dashed line. TT4, TT10, and TT9 correspond to temperature sensors located at different depths inside the horizontal storage tank.


Figure 5.
Comparison between the BoilFAST calculations (solid curves) and experimental data (symbols) obtained from a LH2 storage tank at NASA’s Glenn Research Centre. (a) self- pressurization for three different heat fluxes; (b) stratified temperature for a heat flux of 3.5 W/m2 (Test 3), where sensors above 140 cm were in the tank’s ullage region (vapor space).

Figure 6.
Changes in liquid volume in the 12.5 m3 Dewar tank during (a) summer and (b) winter. Symbols correspond to the published experimental data while dotted and solid lines correspond to model calculations from the work of Petitpas and BoilFAST, respectively.
Figure 6.
Changes in liquid volume in the 12.5 m3 Dewar tank during (a) summer and (b) winter. Symbols correspond to the published experimental data while dotted and solid lines correspond to model calculations from the work of Petitpas and BoilFAST, respectively.


Table 1.
LH2 tank dimensions and simulation parameters.
| Tank Properties | Fluid Properties | ||
|---|---|---|---|
| Inner Diameter | 2.896 m | Fill Levels | 33%, 67% |
| Insulation Thickness | 0.021 m | Ambient Temperature | 300 K |
| Head Height | 0.7715 m | UVL | 0.6 W/m2/K |
| Initial Pressure | 111 kPa | Refrigeration Rate | Max.: 880 W |
Table 2.
Summary of the BoilFAST model inputs used to simulate the LH2 self-pressurization experiments conducted at NASA’s Glenn Research Centre.
Table 2.
Summary of the BoilFAST model inputs used to simulate the LH2 self-pressurization experiments conducted at NASA’s Glenn Research Centre.
| Heat Flux (W/m2) | Ambient T. (K) | UL (W/m2/K) | UV (W/m2/K) | UVL (W/m2/K) |
|---|---|---|---|---|
| 0.35 | 83 | 0.014 | 0.014 | 1.04 |
| 2 | 294 | 0.0245 | 0.0245 | 1.04 |
| 3.5 | 350 | 0.0351 | 0.0351 | 1.04 |
Publisher’s Note: MDPI stays neutral with regard to jurisdictional claims in published maps and institutional affiliations. |
© 2022 by the authors. Licensee MDPI, Basel, Switzerland. This article is an open access article distributed under the terms and conditions of the Creative Commons Attribution (CC BY) license (https://creativecommons.org/licenses/by/4.0/).
Share and Cite
MDPI and ACS Style
Al Ghafri, S.Z.S.; Swanger, A.; Jusko, V.; Siahvashi, A.; Perez, F.; Johns, M.L.; May, E.F. Modelling of Liquid Hydrogen Boil-Off. Energies 2022, 15, 1149. https://0-doi-org.brum.beds.ac.uk/10.3390/en15031149
AMA Style
Al Ghafri SZS, Swanger A, Jusko V, Siahvashi A, Perez F, Johns ML, May EF. Modelling of Liquid Hydrogen Boil-Off. Energies. 2022; 15(3):1149. https://0-doi-org.brum.beds.ac.uk/10.3390/en15031149
Chicago/Turabian StyleAl Ghafri, Saif Z. S., Adam Swanger, Vincent Jusko, Arman Siahvashi, Fernando Perez, Michael L. Johns, and Eric F. May. 2022. "Modelling of Liquid Hydrogen Boil-Off" Energies 15, no. 3: 1149. https://0-doi-org.brum.beds.ac.uk/10.3390/en15031149
Note that from the first issue of 2016, this journal uses article numbers instead of page numbers. See further details here.