
Voltage Profiles Improvement in a Power Network with PV Energy Sources—Results of a Voltage Regulator Implementation

 ,
,  ,
,
Abstract
:1. Introduction
- The On-Load Tap Changer (OLTC) is able to change the voltage in the supplying power substation. In the paper [6], power fluctuations, and thus voltage variations, were limited by means of an OLTC. It was also shown in the article [7] that if there is an OLTC in the distribution network, it is not necessary to control the reactive power of PV inverters. The disadvantage of this solution could be a limited number of switchings, but the current solutions allow for a high number of them [8]. However, it is not always possible to use an OLTC; an example may be a grid in which PV sources are present in only one circuit. In such a case, global voltage regulation at the power substation level could improve power quality in one circuit but degrade in others. Another disadvantage could be inability to mitigate the three-phase unbalance.
- The Static VAR Compensator (SVC) is an electronic device that controls the voltage level by providing reactive power in the node. Commonly, it consists of a coupling transformer, thyristor valves, reactors, and capacitors. This device can inject reactive shunt compensation for a dynamic voltage control. If the voltage level in the node with a SVC is constant, the SVC should vary the reactive power in the node [12]. However, the low-voltage networks are characterized by a high R/X ratio, so the reactive power impact on the voltage level is not sufficient [13].
- The Distribution Static Synchronous Compensator (D-STATCOM) is a static compensator, which is re-adapted for distribution systems. It consists of energy storage devices, an AC filter, a three-phase inverter, and a coupling transformer for the shunt connection with the distribution network [14]. Unfortunately, the cost of the device is high, and it is related to storage devices.
- In the Power Factor Control (PFC) solution, the reactive power control is performed by the PV inverters [15]. It is possible to install devices that can control the reactive power in the node with PV sources. In the article [16], a Distributed μ-STATCOM was presented, which controls the reactive power flow in the node with PV sources. However, this solution is based on the voltage control by the reactive power, which, in low-voltage networks, is ineffective.
- The publication [17] proposed a Dynamic Voltage Restorer (DVR). This device can control the voltage level by two-level step regulation (large and small step). It can also be designed with a small energy storage unit or energy sources in order to obtain operation in a continuous way.
- The Step-Voltage Regulator (SVR) is based on an autotransformer, connected in series with the power network, with multiple taps and a servomechanism that allows the selection of the most appropriate output voltage level by mechanically changing the winding coupling [18]. In addition, by this device, the voltage asymmetry can be reduced [19]. In the publication [20], the SVR was used for the asymmetry reduction in a medium-voltage network. A very similar device, which is also connected to the network in series, is an Active Voltage Regulation Transformer (AVRT), presented in the paper [21].
- Despite the above-mentioned devices being able to work separately, there are some publications where the cooperation of those devices for additional advantages is presented. In the article [22], a central regulation for devices such OLTC, SVR, and PV inverters was discussed. In the publication [23], the cooperation of an SVC device with distributed sources was proposed. In the paper [24], several SVR devices operated in cascade and, in this case, it was necessary to apply central regulation.
2. Materials and Methods
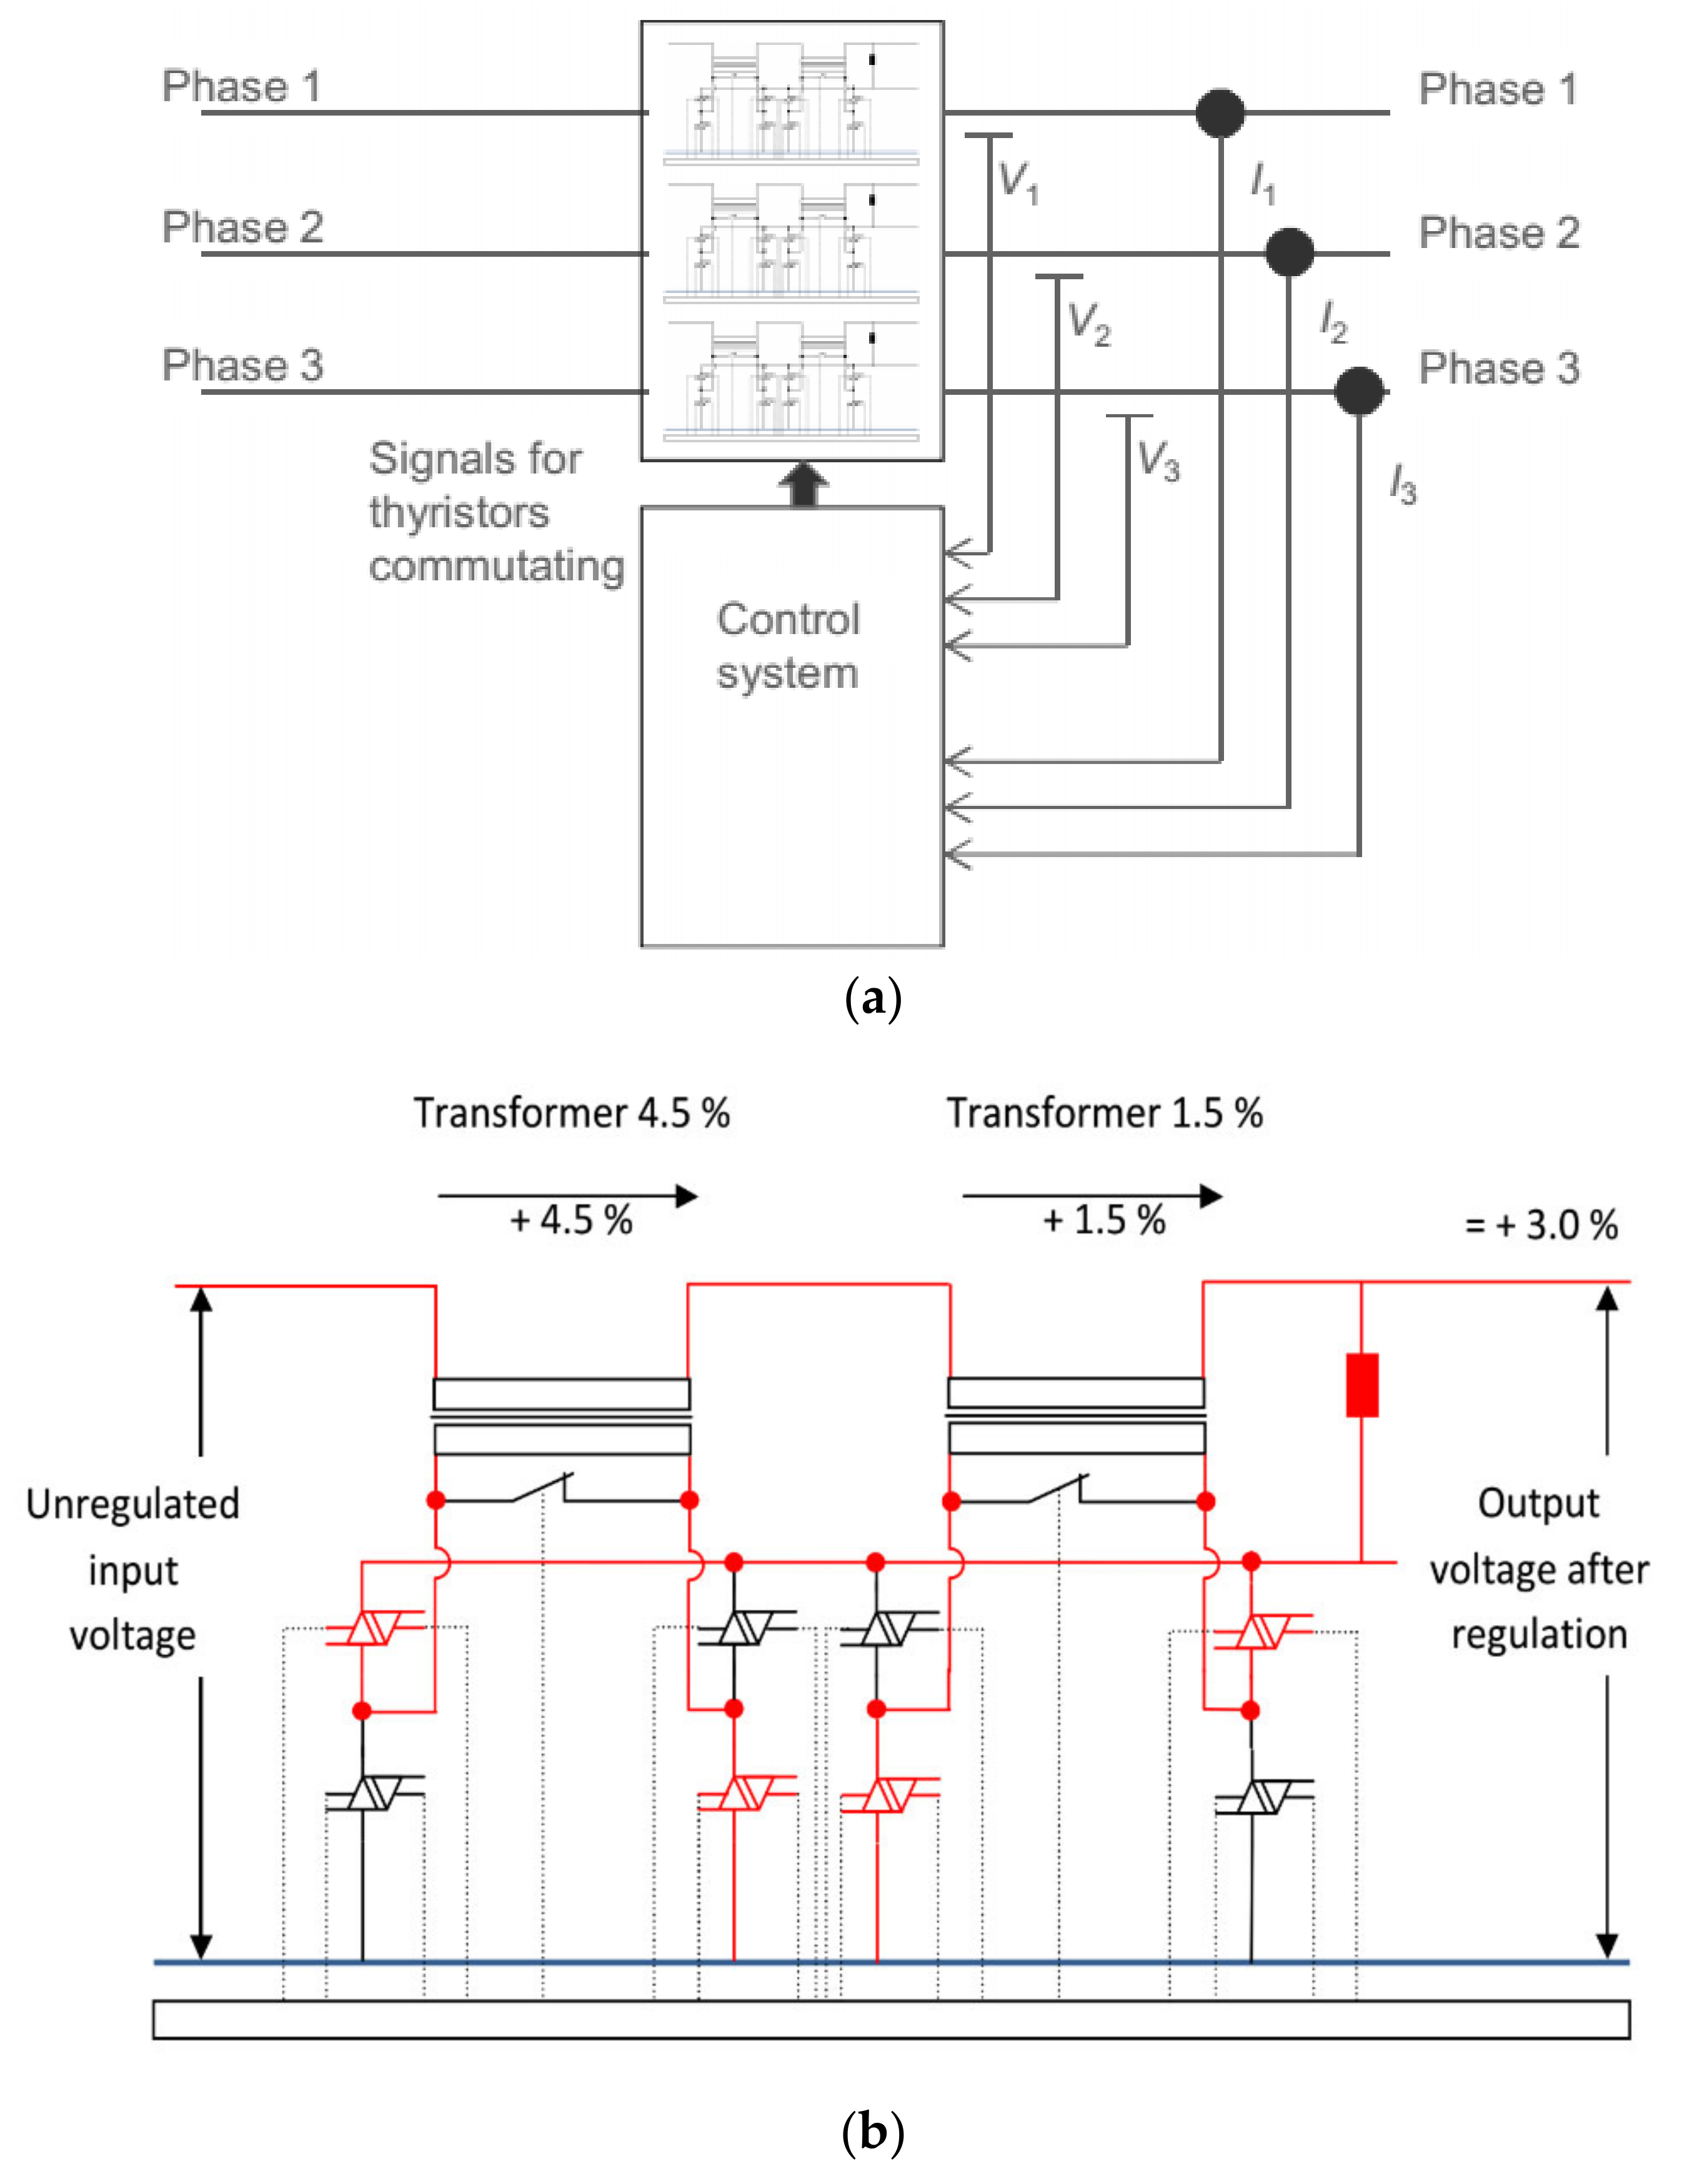
2.1. Description of the LVR-sys Regulator
2.2. Description of the Analyzed Network
- The voltage at the power substation is within range: 235 ÷ 247 V (before the LVR-sys implementation).
- The voltage in the power substation is set slightly higher than the nominal value due to the relatively high length of circuit ‘100’ (14 nodes) and the low cross-section of the wires (4 × Al 25), and there is a high voltage drop on circuit ‘100’.
- In the absence of PV sources, the voltage in the network was correct; the average rms voltage from 10 min measurements did not fall below the lower limit value of 0.9 Vn, i.e., 207 V, at the final node 114.
- In the case of power generation by PV sources, the voltage value sometimes (especially in sunny summer days) increases beyond the permissible upper limit of 1.1 Vn, i.e., 253 V, in the low-voltage network. This has been confirmed by measurements carried out deep inside in the network and not directly at the consumer’s origin of the electrical installation.
- The voltage reduction on the transformer substation is not possible, because, during peak load (approx. 6 a.m.), when there is no power generation by the PV sources, the voltage at the end of the circuit would be too low.
- The power network requires reconstruction (cable cross-section 25 mm2); when replacing cables with cables with a larger cross-section, one should expect an improvement in the voltage situation in the network. Nevertheless, such an investment takes time. For this reason, the possibility of using the LVR-sys voltage regulator as a temporary solution, pending the modernization of the line, was tested.
2.3. Description of the Experiment
- In the supply substation in the ‘100’ circuit, this location is marked as ‘A’ and the results of the measurements are marked as (VA, PA).
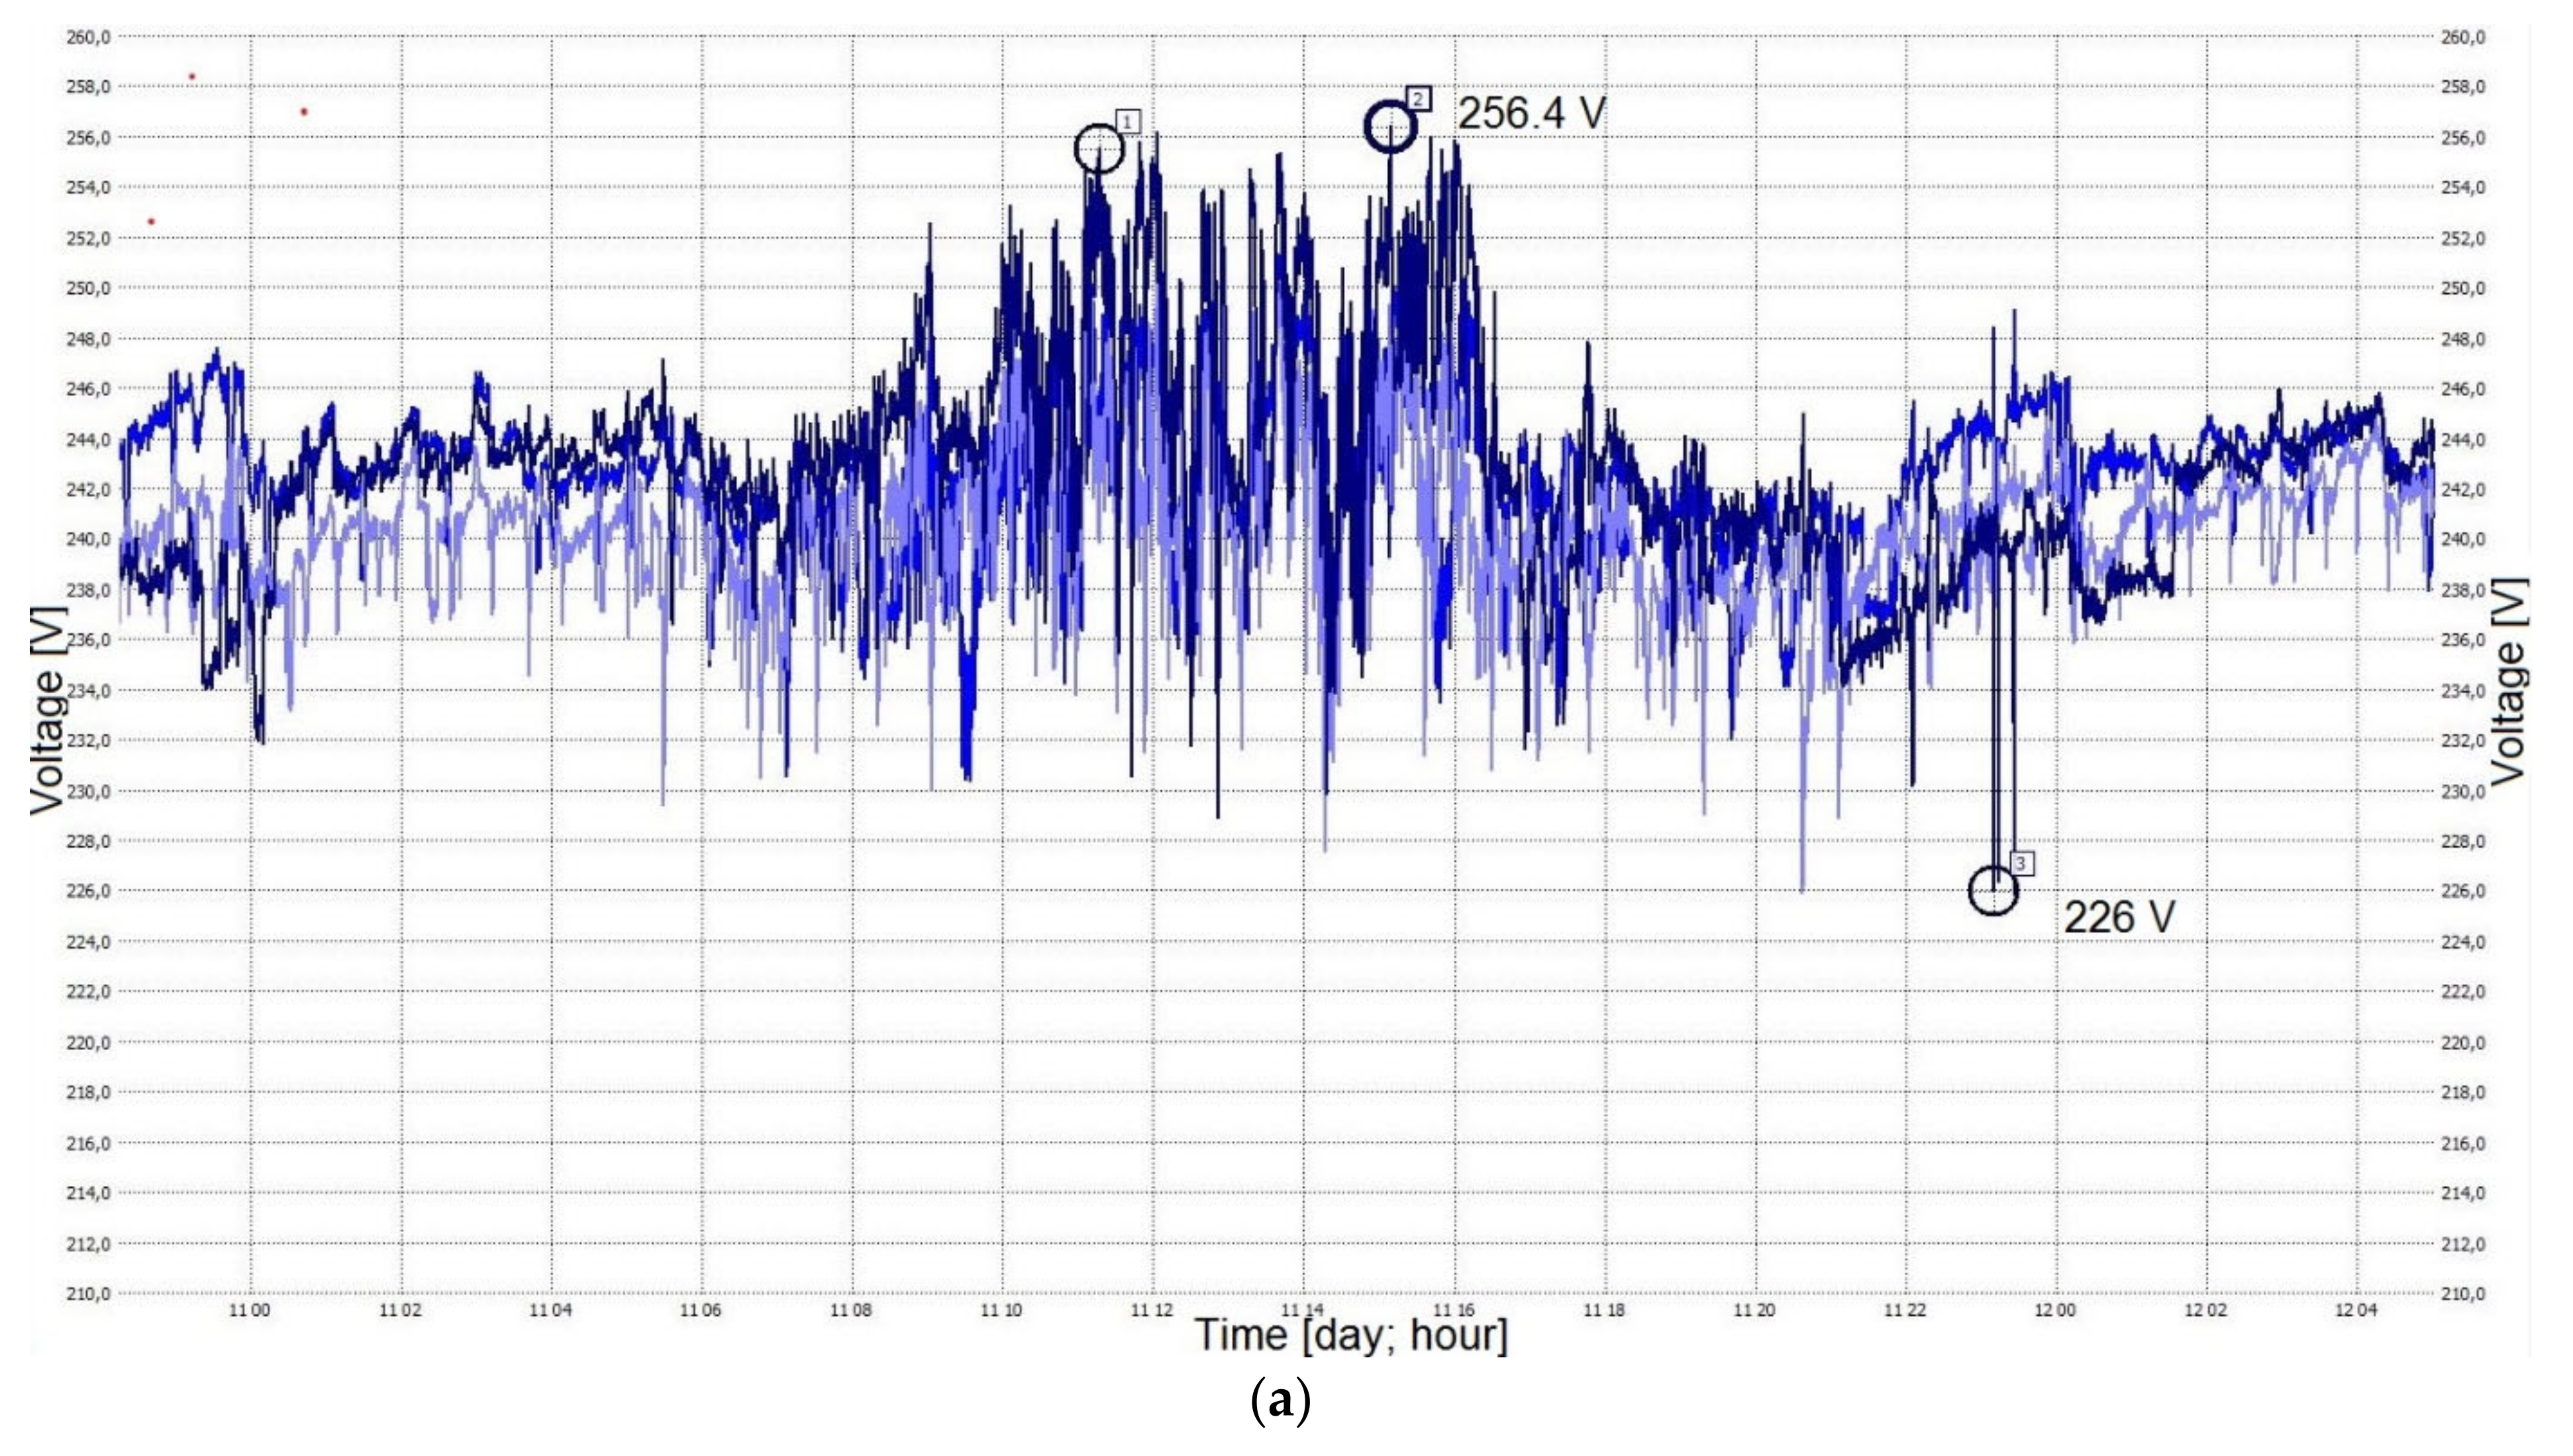
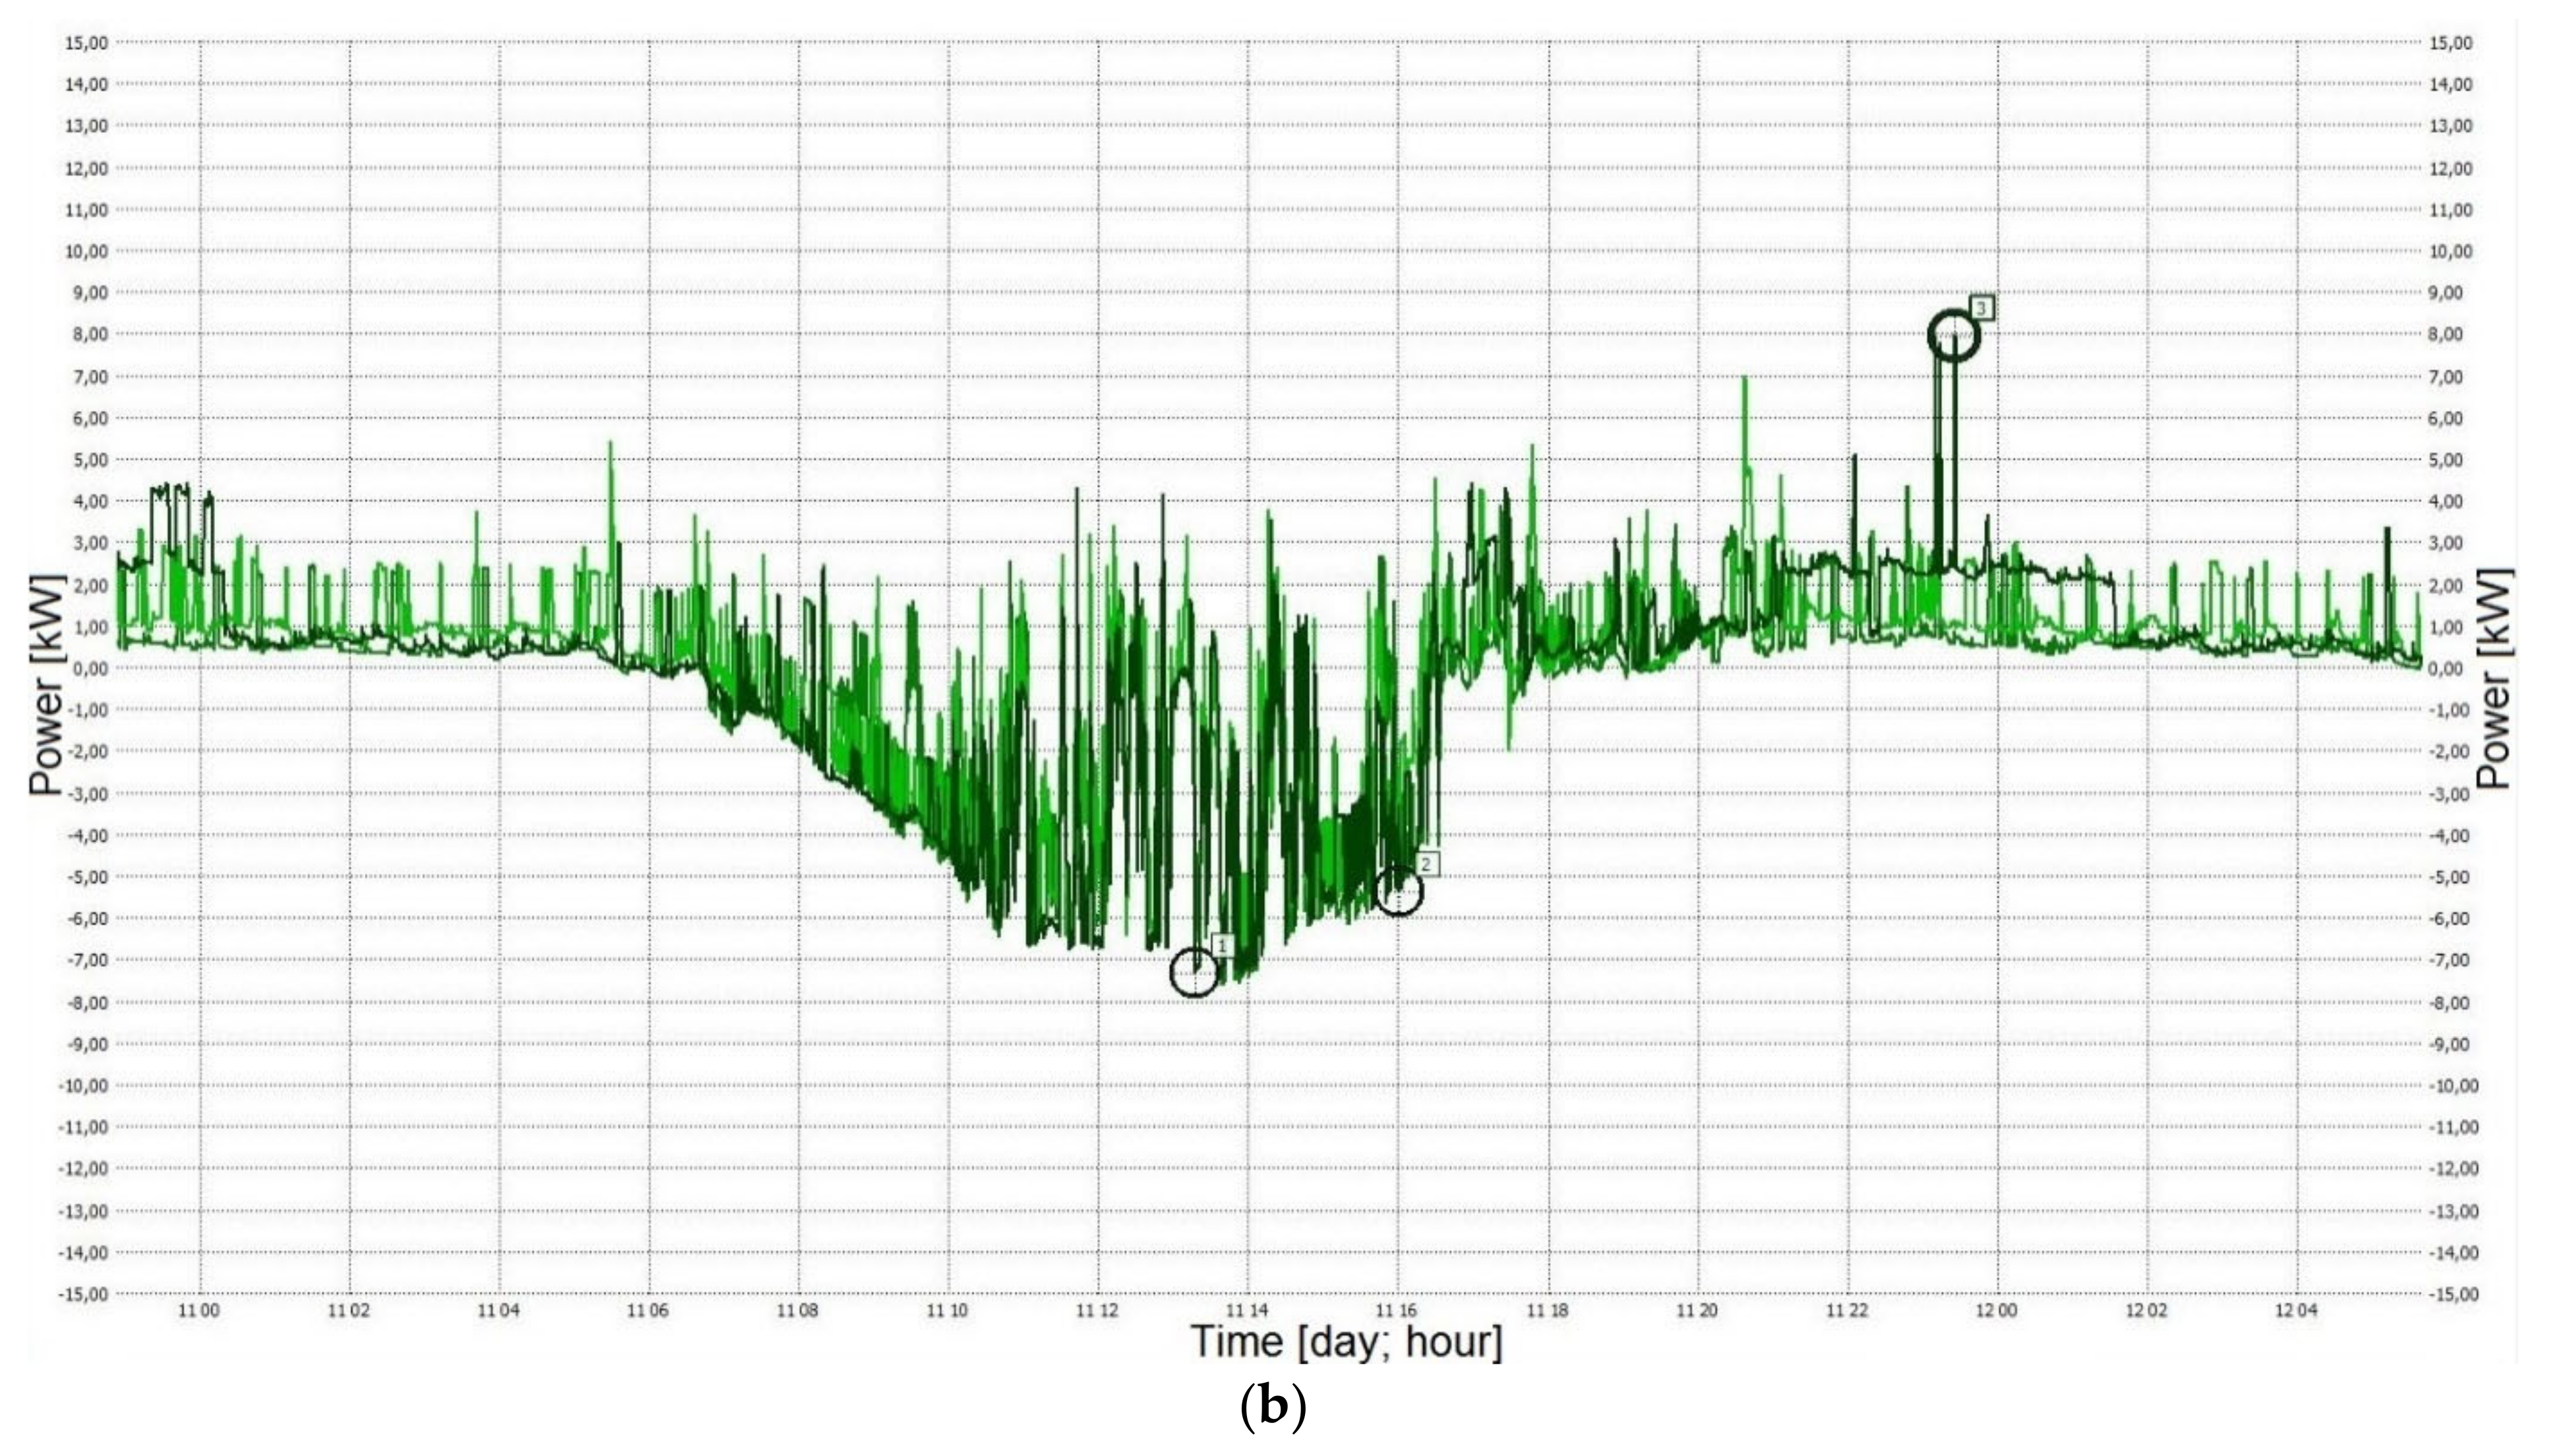
- In the node upstream of the LVR-sys regulator, in Figure 2, it is node no. 105; this location is marked as ‘B’ and the results of the measurements are marked as (VB, PB).
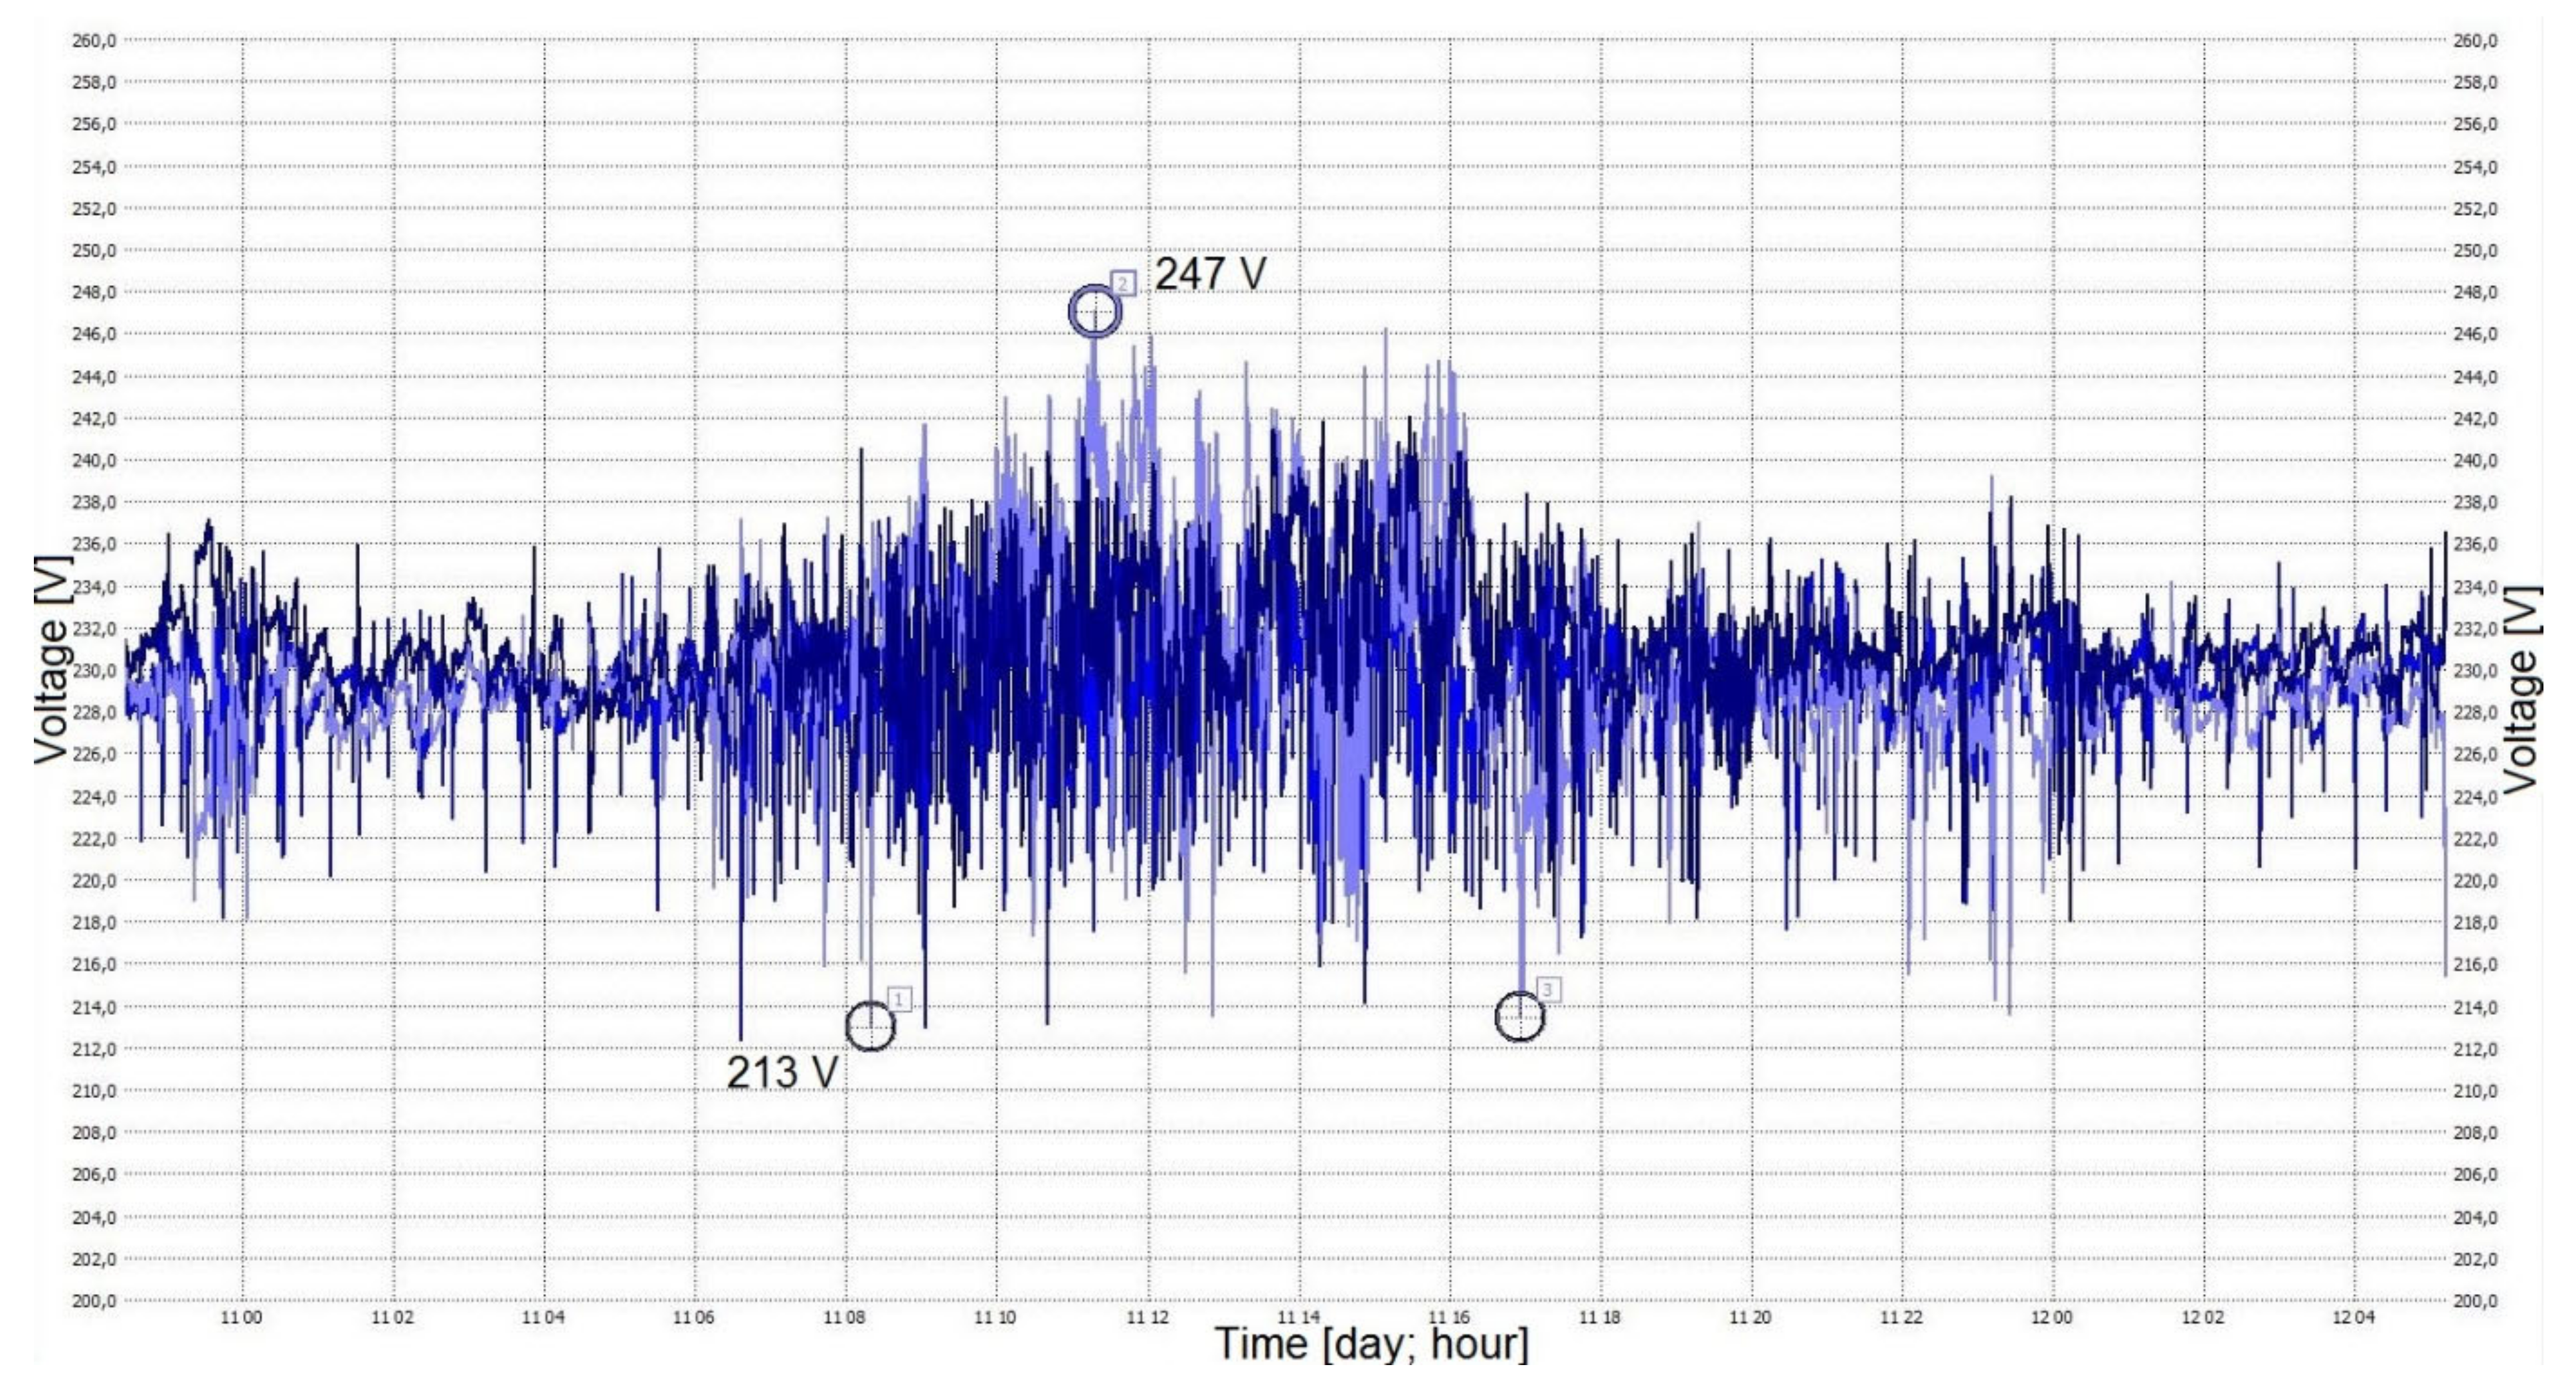
- In the node farthest from the supply substation, in Figure 2, it is node no. 114; this location is marked as ‘C’ and the results of the measurements are marked as (VC, PC).
3. Results
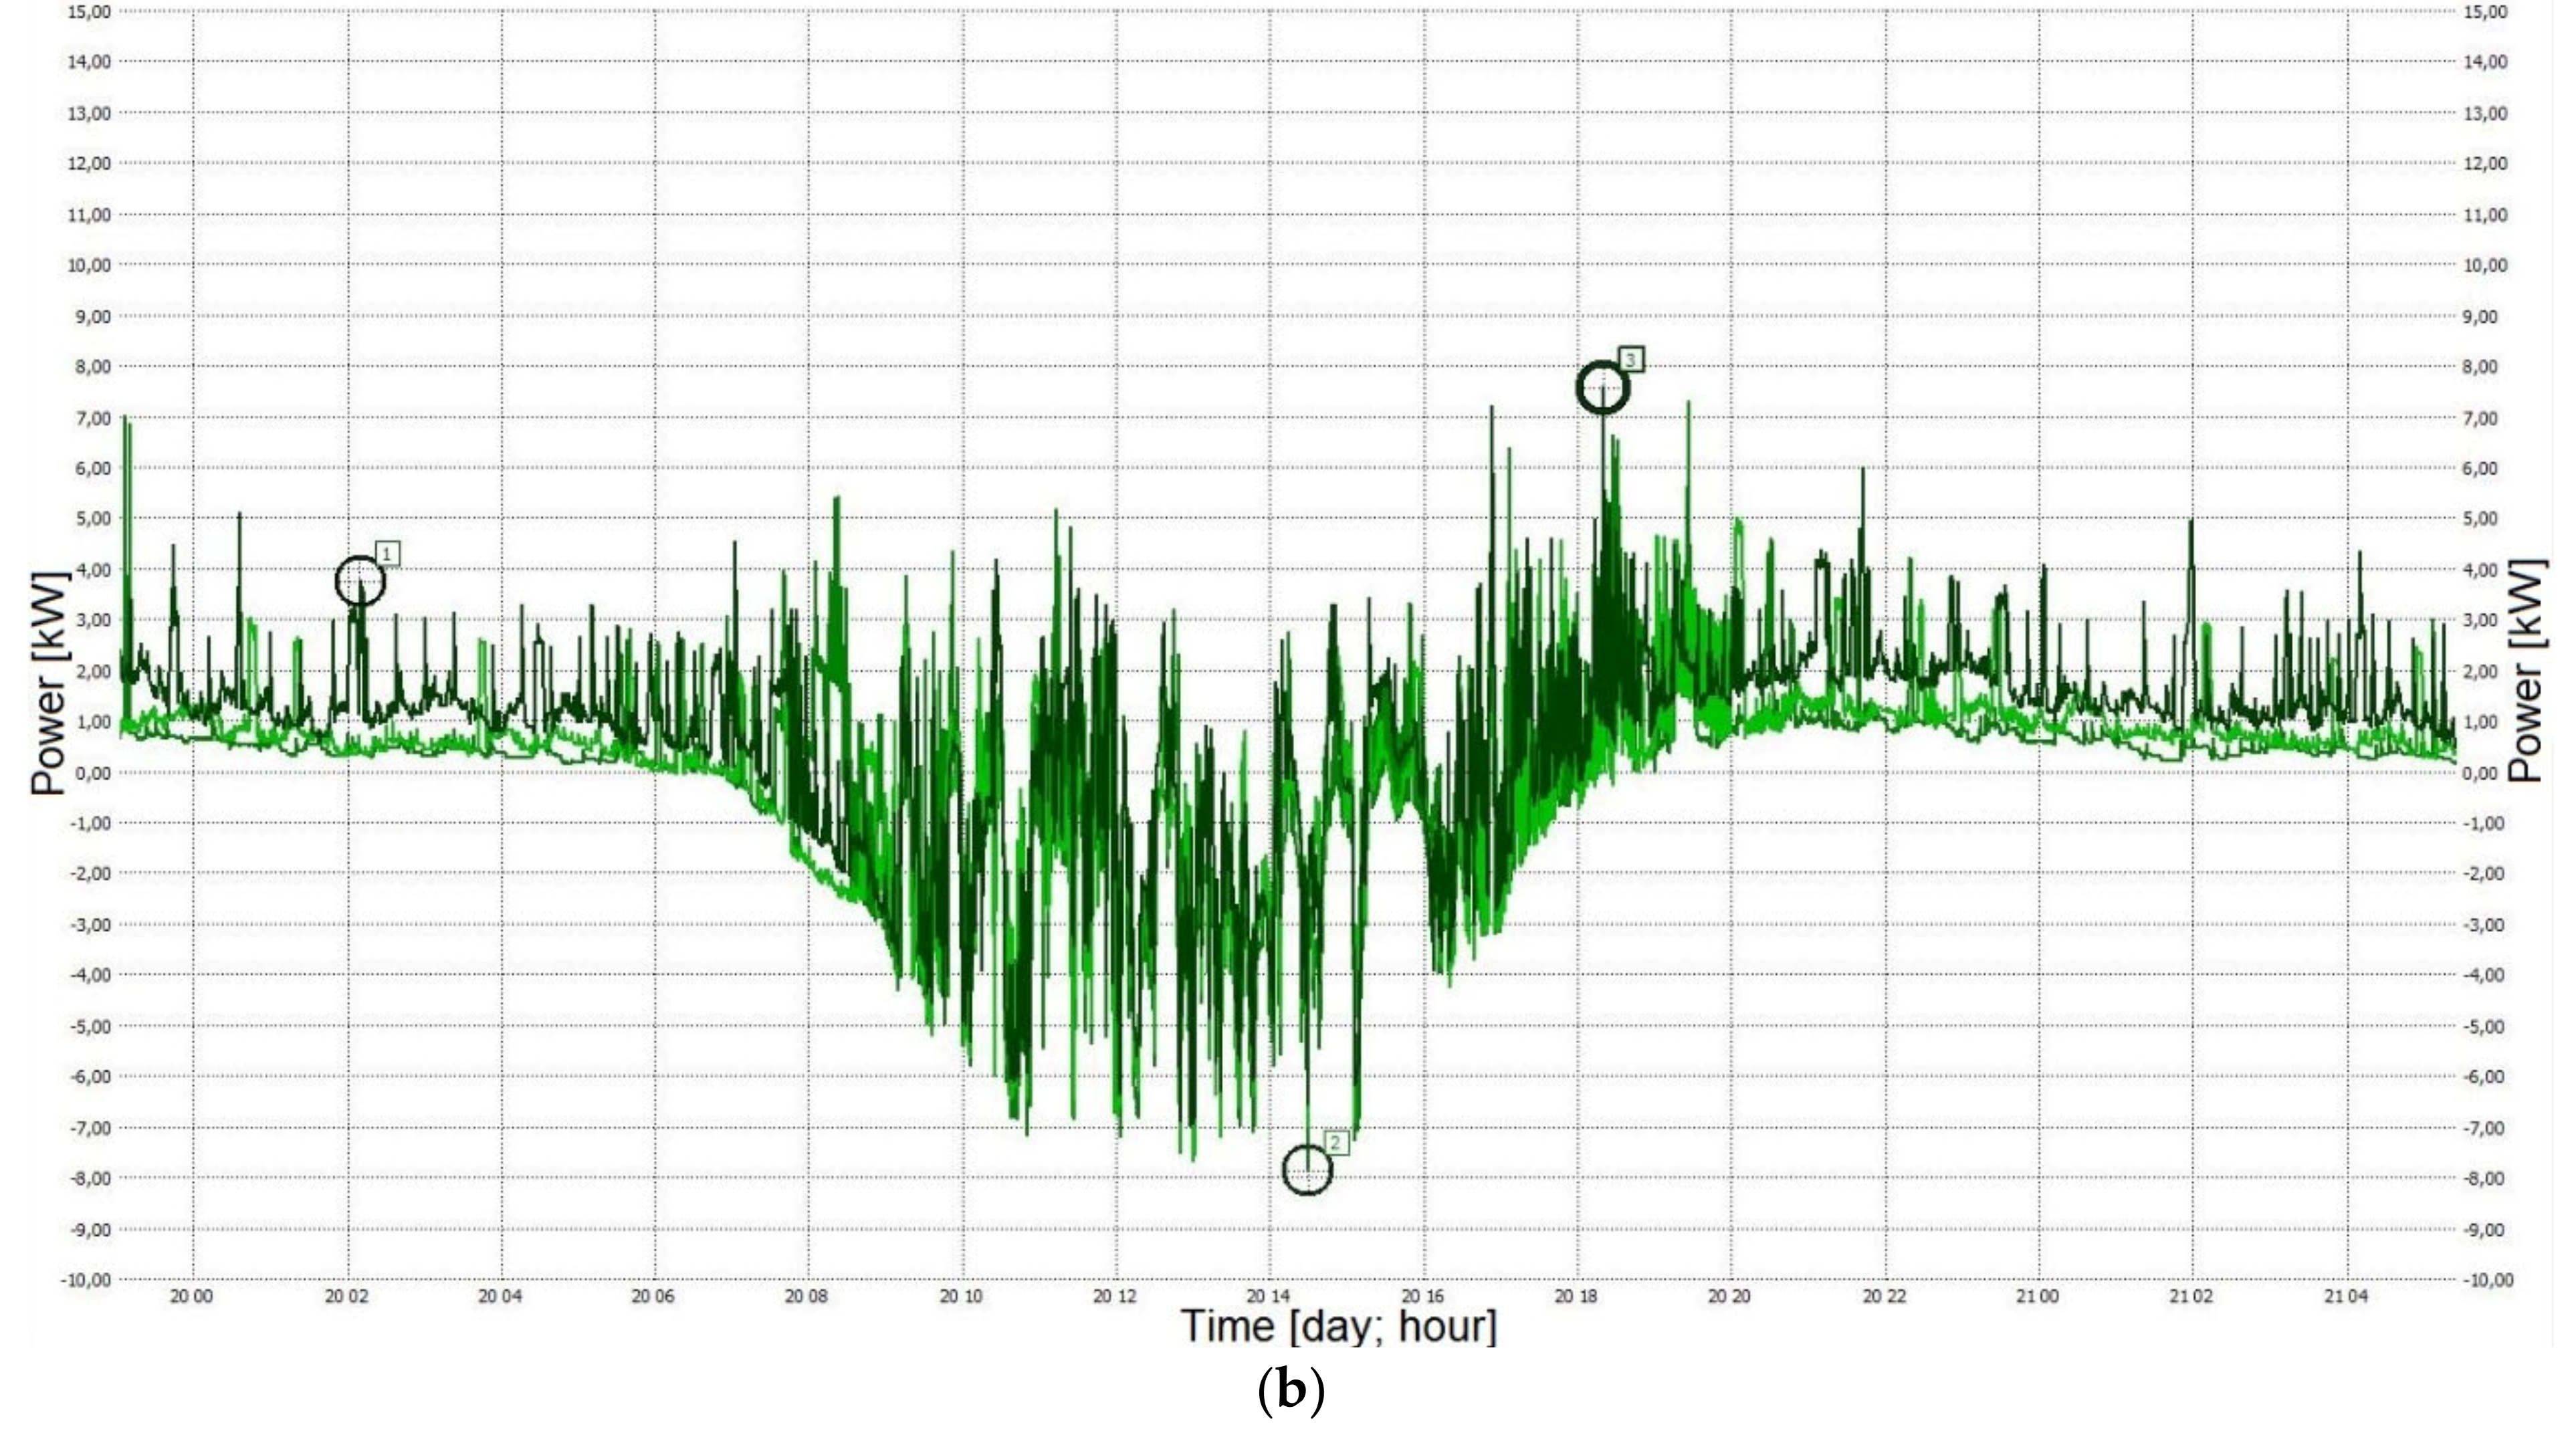
3.1. Case A: Without Regulator LVR-sys in the Network
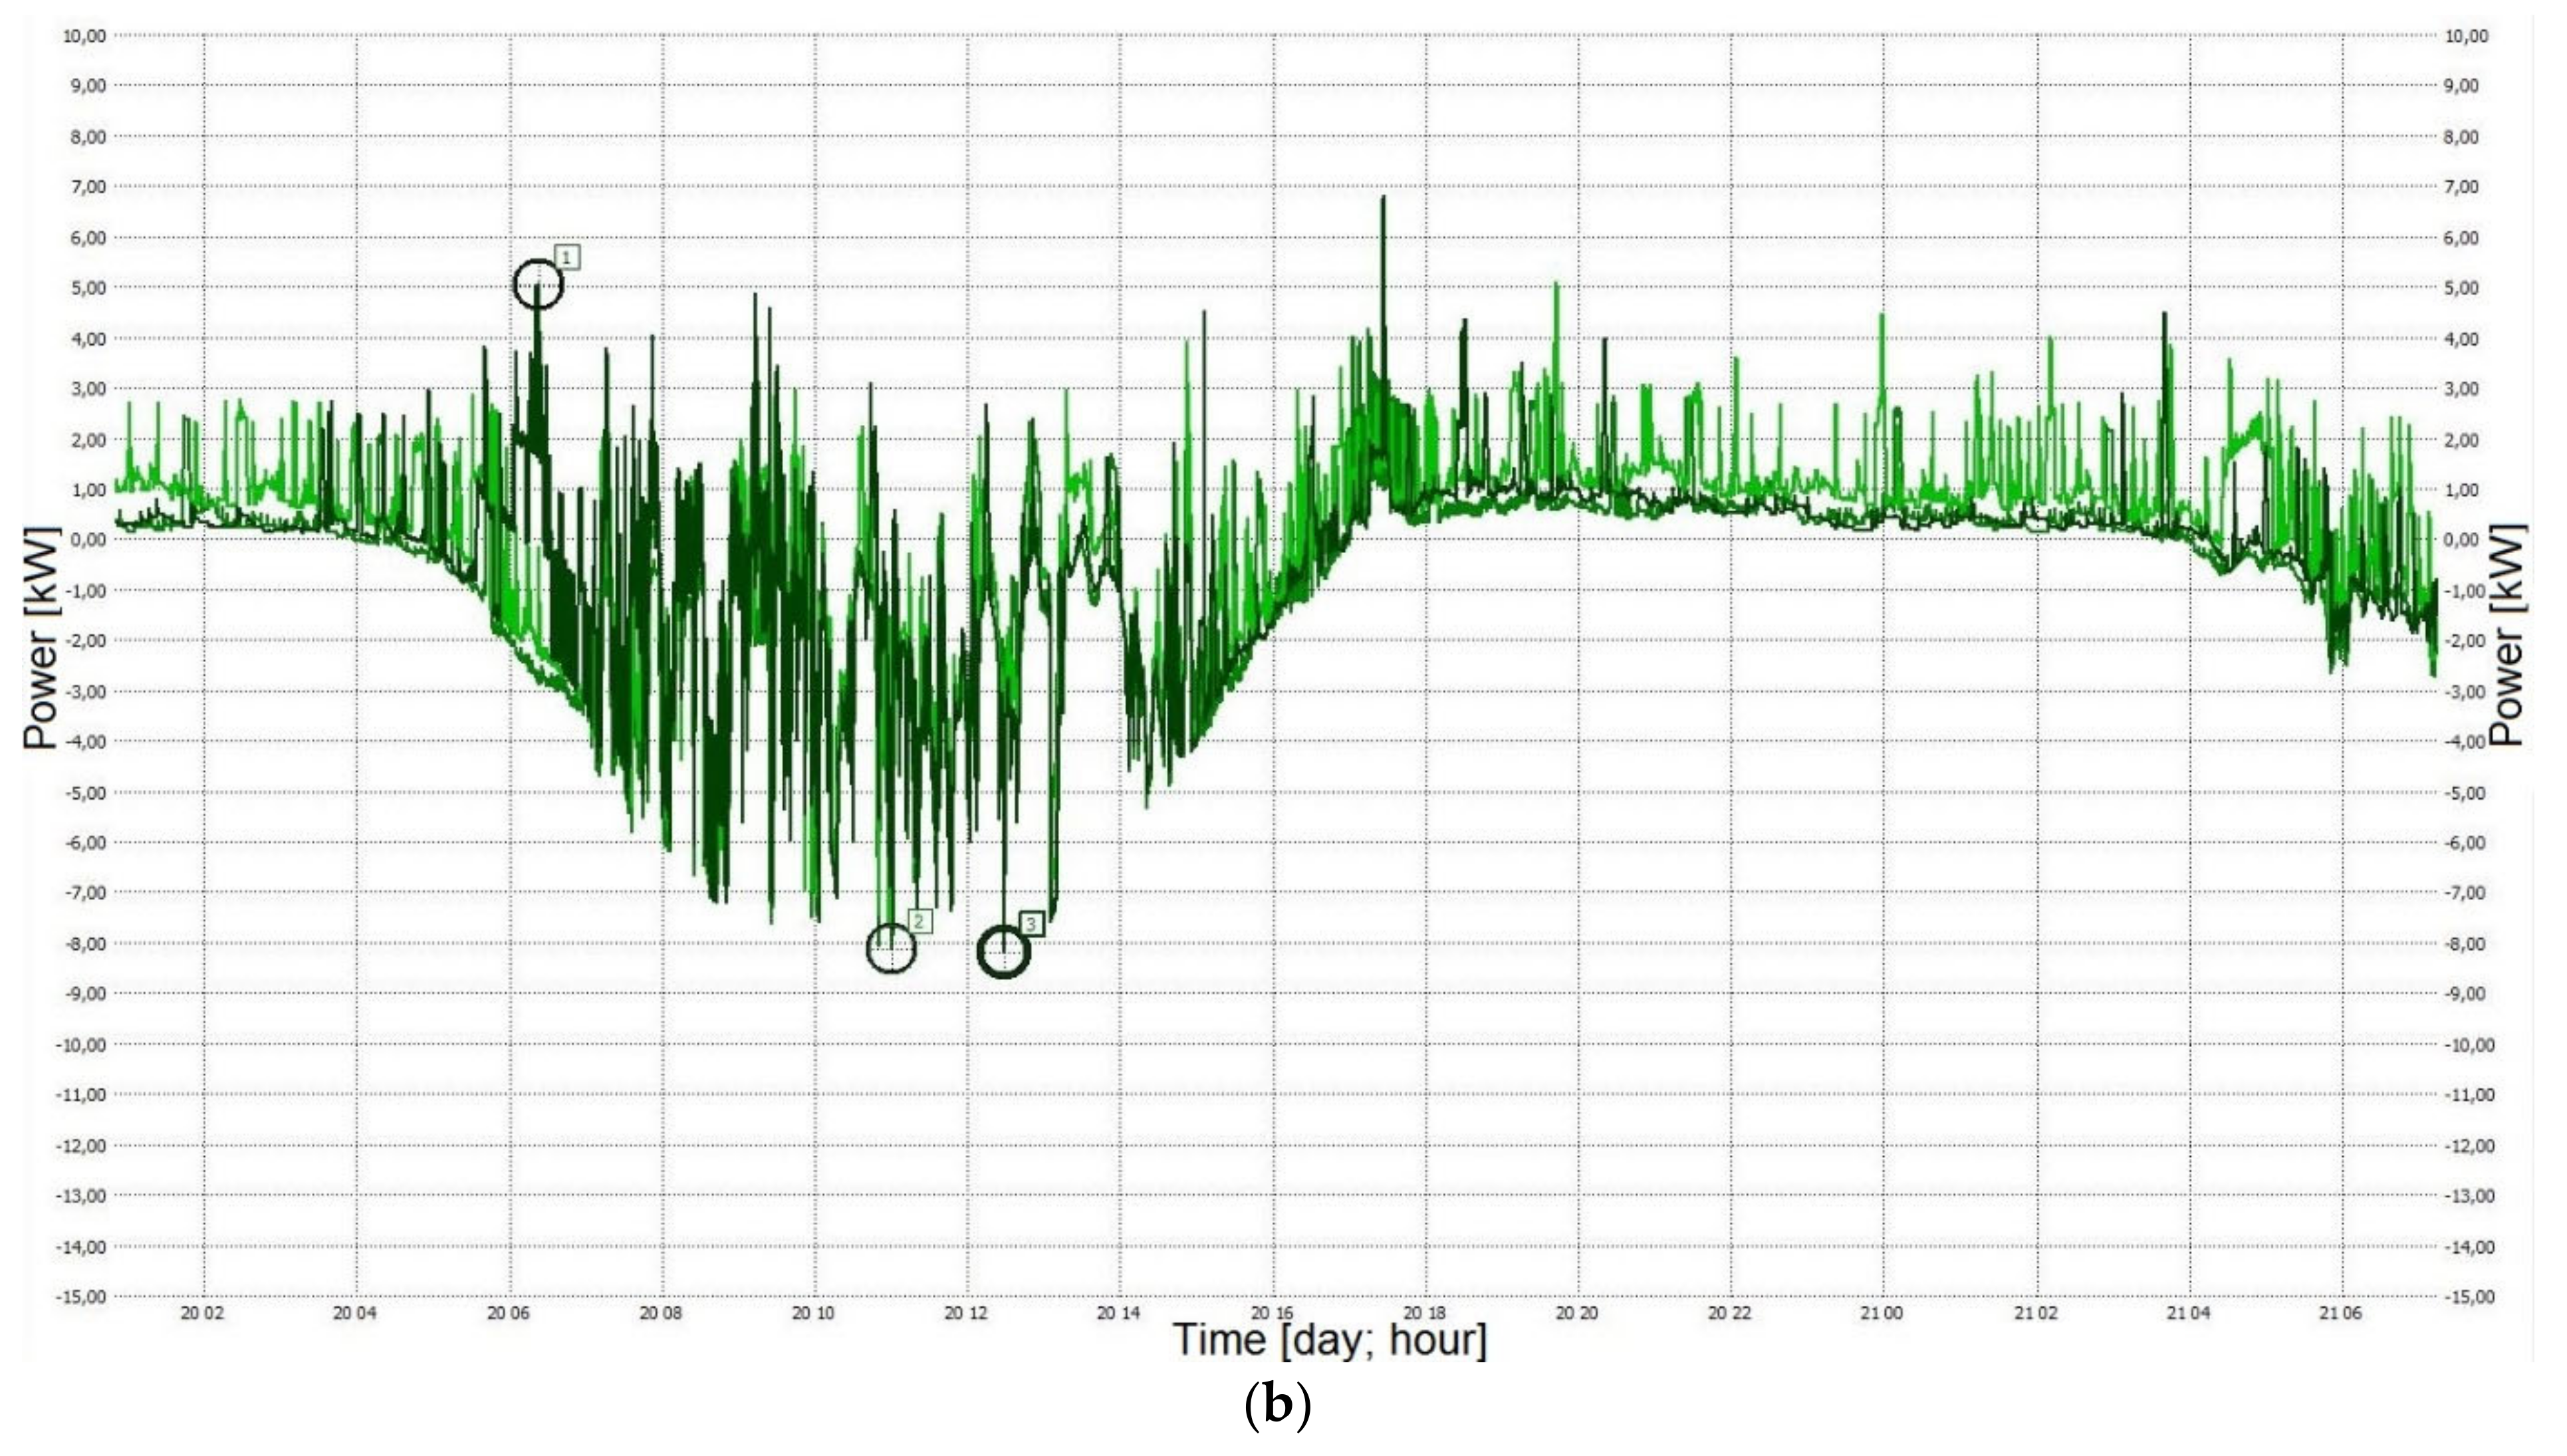
3.2. Case B: With Regulator LVR-sys in the Network
- VA = (235.3 ÷ 246.8) V;
- VB = (226 ÷ 256.4) V;
- VC = (213 ÷ 247) V.
4. Conclusions
- The regulator LVR-sys improved the voltage levels in the network.
- The voltage at the farthest node no. 114 after installing the regulator was within the normative range, i.e., (207 ÷ 253 V). The recorded values were (207.6 ÷ 262) V before LVR-sys implementation, and (213 ÷ 247) V after LVR-sys implementation.
- The device increased the voltage regulation possibilities in the network.
- It is important to be able to set the voltage at the output of the regulator, thanks to which it is possible to limit the range of voltage variation and to adjust the voltage value to the individual needs of the network.
- Due to the fact that the power produced by PV sources did not change (approx. 8 kW per phase), after installation of the LVR-sys, the voltage at the input of the LVR-sys also remained unchanged.
- A device of this type can effectively support power system operators in preventing voltage problems in the most difficult cases (until the major reconstruction of the low-voltage network in a given area is completed).
Author Contributions
Funding
Institutional Review Board Statement
Informed Consent Statement
Data Availability Statement
Conflicts of Interest
References
- Regulation of the Minister of Economy of 4 May 2007 on the Detailed Conditions for the Operation of the Power System (Dz.U. z 2007, Nr 93, Poz. 623, in Polish). Available online: http://Isap.Sejm.Gov.Pl/Isap.Nsf/DocDetails.Xsp?Id=wdu20070930623 (accessed on 14 May 2021).
- CENELEC (European Committee for Electrotechnical Standardization). EN 50160:2010; Voltage Characteristics of Electricity Supplied by Public Electricity Networks; European Committee for Electrotechnical Standardization: Brussels, Belgium, 2010. [Google Scholar]
- Pijarski, P.; Jędrychowski, R.; Adamek, S.; Miller, P. Optimization of the Selection of Power Supply Points for Buildings Equipped with PV Installations in Urban Areas. In Proceedings of the 2019 Progress in Applied Electrical Engineering (PAEE), Koscielisko, Poland, 17–21 June 2019; pp. 1–4. [Google Scholar]
- Szultka, A.; Szultka, S.; Czapp, S.; Zajczyk, R. Voltage Variations and Their Reduction in a Rural Low-Voltage Network with PV Sources of Energy. Electronics 2021, 10, 1620. [Google Scholar] [CrossRef]
- Tonkoski, R.; Lopes, L.A.; El-Fouly, T.H. Coordinated Active Power Curtailment of Grid Connected PV Inverters for Overvoltage Prevention. IEEE Trans. Sustain. Energy 2010, 2, 139–147. [Google Scholar] [CrossRef]
- Elrayyah, A.; Singh, N.K. Autonomous Control Strategy for Reliable OLTC Operation under PV Power Fluctuation with Effective Voltage Regulation. In Proceedings of the 2020 IEEE Energy Conversion Congress and Exposition (ECCE), Detroid, Michigan, USA, 11–15 October 2020; pp. 2766–2772. [Google Scholar]
- Hashemi, S.; Østergaard, J.; Degner, T.; Brandl, R.; Heckmann, W. Efficient Control of Active Transformers for Increasing the PV Hosting Capacity of LV Grids. IEEE Trans. Ind. Inform. 2016, 13, 270–277. [Google Scholar] [CrossRef] [Green Version]
- Gao, J.; Ge, J.; Zhang, J.; Hu, X.; Li, T.; Wu, J.; Su, Y. Hardware Circuit Design of On-Load Voltage Regulation Switch Based on High Power IGBT. In Proceedings of the 2017 IEEE 2nd Advanced Information Technology, Electronic and Automation Control Conference (IAEAC), Chongqing, China, 25–26 March 2017; pp. 22–25. [Google Scholar]
- Zhu, Q.; Chang, F.; Zang, Z.; Li, Z.; Xv, W.; Lv, B. Research on Effective Location of Energy Storage in High-Permeability Photovoltaic Distribution Network. In Proceedings of the 2019 IEEE 3rd International Electrical and Energy Conference (CIEEC2019), Beijing, China, 7–9 September 2019; pp. 1048–1053. [Google Scholar]
- Szultka, A.; Szultka, S.; Czapp, S.; Lubosny, Z.; Malkowski, R. Integrated Algorithm for Selecting the Location and Control of Energy Storage Units to Improve the Voltage Level in Distribution Grids. Energies 2020, 13, 6720. [Google Scholar] [CrossRef]
- Bereczki, B.; Hartmann, B. LV Grid Voltage Control with Battery Energy Storage Systems. In Proceedings of the EEEIC/I&CPS Europe 2020 IEEE International Conference on Environment and Electrical Engineering and 2020 IEEE Industrial and Commercial Power Systems Europe (EEEIC/I&CPS Europe), Madrid, Spain, 9–12 June 2020; pp. 1–5. [Google Scholar]
- Latorre, H.F.; Ghandhari, M.; Söder, L. Active and Reactive Power Control of a VSC-HVdc. Electr. Power Syst. Res. 2008, 78, 1756–1763. [Google Scholar] [CrossRef]
- Szultka, A.; Malkowski, R.; Czapp, S.; Szultka, S. Impact of R/X Ratio of Distribution Network on Selection and Control of Energy Storage Units. In Proceedings of the Information and Digital Technologies (IDT), Zilina, Slovakia, 5–7 July 2017; pp. 359–364. [Google Scholar]
- Hock, R.T.; de Novaes, Y.R.; Batschauer, A.L. A Voltage Regulator for Power Quality Improvement in Low-Voltage Distribution Grids. IEEE Trans. Power Electron. 2017, 33, 2050–2060. [Google Scholar] [CrossRef]
- Fawzy, T.; Premm, D.; Bletterie, B.; Goršek, A. Active Contribution of PV Inverters to Voltage Control–from a Smart Grid Vision to Full-Scale Implementation. E Elektrotechnik Inf. 2011, 128, 110–115. [Google Scholar] [CrossRef]
- Shoubaki, E.; Essakiappan, S.; Bhowmik, P.; Manjrekar, M.; Enslin, J.; Laval, S.; Vukojevic, A.; Handley, J. Distributed μ-STATCOM for Voltage Support and Harmonic Mitigation on Low Voltage Networks. In Proceedings of the 2017 IEEE Applied Power Electronics Conference and Exposition (APEC), Tampa, FL, USA, 26–30 March 2017; pp. 925–930. [Google Scholar]
- Sagha, H.; Mokhtari, G.; Arefi, A.; Nourbakhsh, G.; Ledwich, G.; Ghosh, A. A New Approach to Improve PV Power Injection in LV Electrical Systems Using DVR. IEEE Syst. J. 2017, 12, 3324–3333. [Google Scholar] [CrossRef]
- Casolino, G.M.; Di Nitto, B.; Russo, M. Modeling, Testing and Configurating a Transformer for LV Active User Voltage Regulation. In Proceedings of the 2018 International Symposium on Power Electronics, Electrical Drives, Automation and Motion (SPEEDAM), Amalfi, Italy, 20–22 June 2018; pp. 1196–1202. [Google Scholar]
- Nakadomari, A.; Shigenobu, R.; Senjyu, T. Optimal Control and Placement of Step Voltage Regulator for Voltage Unbalance Improvement and Loss Minimization in Distribution System. In Proceedings of the 2020 IEEE Region 10 Conference (TENCON), Osaka, Japan, 16–19 November 2020; pp. 1013–1018. [Google Scholar]
- Bai, F.; Yan, R.; Saha, T.K.; Eghbal, D. A New Remote Tap Position Estimation Approach for Open-Delta Step-Voltage Regulator in a Photovoltaic Integrated Distribution Network. IEEE Trans. Power Syst. 2017, 33, 4433–4443. [Google Scholar] [CrossRef] [Green Version]
- Pimenta, A.; Costa, P.B.; Paraíso, G.M.; Pinto, S.F.; Silva, J.F. Active Voltage Regulation Transformer for AC Microgrids. In Proceedings of the 2020 IEEE 9th International Power Electronics and Motion Control Conference (IPEMC2020-ECCE Asia), Nanjing, China, 30 May–3 June 2020; pp. 2012–2017. [Google Scholar]
- Ciocia, A.; Boicea, V.A.; Chicco, G.; Di Leo, P.; Mazza, A.; Pons, E.; Spertino, F.; Hadj-Said, N. Voltage Control in Low-Voltage Grids Using Distributed Photovoltaic Converters and Centralized Devices. IEEE Trans. Ind. Appl. 2018, 55, 225–237. [Google Scholar] [CrossRef]
- Kojovic, L.A. Coordination of Distributed Generation and Step Voltage Regulator Operations for Improved Distribution System Voltage Regulation. In Proceedings of the 2006 IEEE Power Engineering Society General Meeting, Montreal, QC, Canada, 18–22 June 2006; p. 6. [Google Scholar]
- Yoshizawa, S.; Yamamoto, Y.; Yoshinaga, J.; Hayashi, Y.; Sasaki, S.; Shigetou, T.; Nomura, H. Novel Voltage Control of Multiple Step Voltage Regulators in a Distribution System. In Proceedings of the ISGT 2014, Istanbul, Turkey, 12–15 October 2014; pp. 1–5. [Google Scholar]
- ASTAT. Available online: https:/astat.pl/Produkty/System-Regulacji-Napiecia-Sieci-Nn-Lvr-Sys-a-Eberle-Lvr-Sys/ (accessed on 7 September 2021).
- System Regulacji Niskiego Napięcia LVRSys™. Available online: https://astat.pl/pliki/JEE/System_regulacji_napiecia_sieci_nn/LVR_Sys.pdf (accessed on 7 September 2021).


| Step | Transformer 1.5% | Transformer 4.5% |
|---|---|---|
| −6.0% | −1.5% | −4.5% |
| −4.5% | 0 | −4.5% |
| −3.0% | +1.5% | −4.5% |
| −1.5% | −1.5% | 0 |
| 0% | 0 | 0 |
| +1.5% | +1.5% | 0 |
| +3.0% | −1.5% | +4.5% |
| +4.5% | 0 | +4.5% |
| +6.0% | +1.5% | +4.5% |
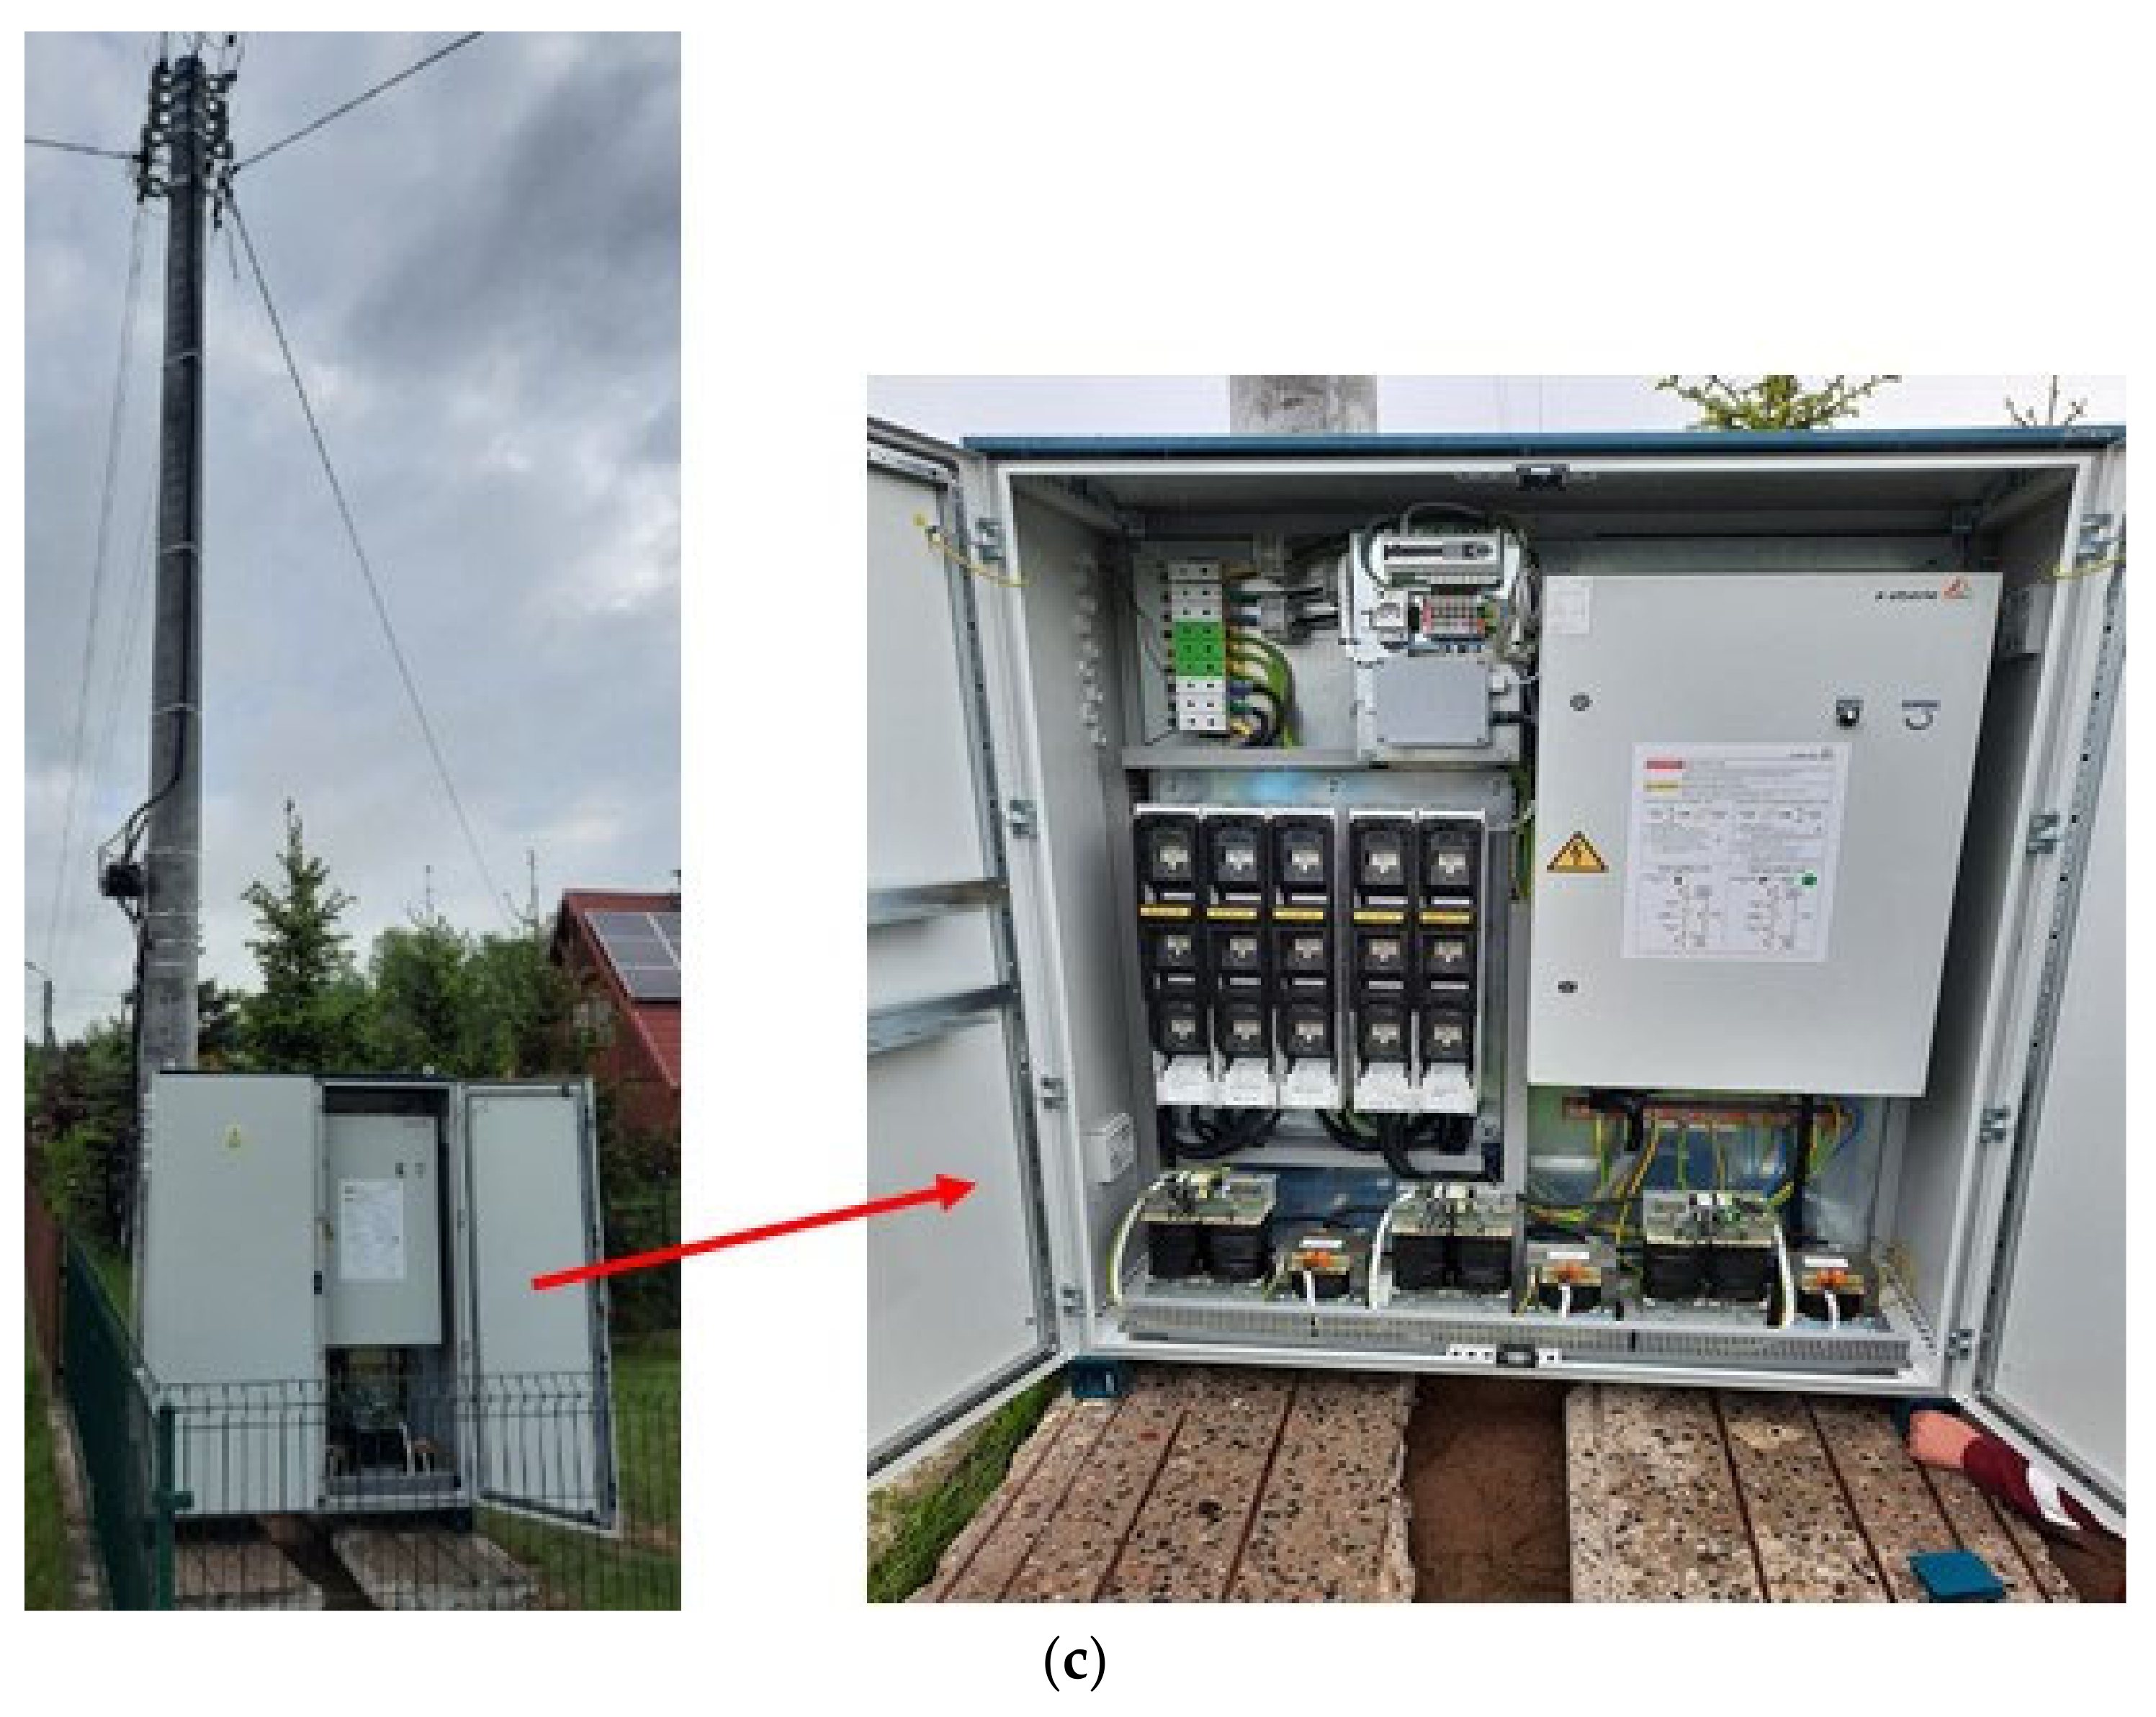
| Parameter | Value |
|---|---|
| Power | 144 kVA |
| Regulation area | +/−6% |
| Rated voltage | 400 V |
| Rated current | 200 A |
| Rated frequency | 50 Hz |
| Degree of protection | IP 54 |
| Type of electrical system | TN-C |
Publisher’s Note: MDPI stays neutral with regard to jurisdictional claims in published maps and institutional affiliations. |
© 2022 by the authors. Licensee MDPI, Basel, Switzerland. This article is an open access article distributed under the terms and conditions of the Creative Commons Attribution (CC BY) license (https://creativecommons.org/licenses/by/4.0/).
Share and Cite
Szultka, A.; Szultka, S.; Czapp, S.; Karolak, R.; Andrzejewski, M.; Kapitaniak, J.; Kulling, M.; Bonk, J. Voltage Profiles Improvement in a Power Network with PV Energy Sources—Results of a Voltage Regulator Implementation. Energies 2022, 15, 723. https://0-doi-org.brum.beds.ac.uk/10.3390/en15030723
Szultka A, Szultka S, Czapp S, Karolak R, Andrzejewski M, Kapitaniak J, Kulling M, Bonk J. Voltage Profiles Improvement in a Power Network with PV Energy Sources—Results of a Voltage Regulator Implementation. Energies. 2022; 15(3):723. https://0-doi-org.brum.beds.ac.uk/10.3390/en15030723
Chicago/Turabian StyleSzultka, Agata, Seweryn Szultka, Stanislaw Czapp, Robert Karolak, Marcin Andrzejewski, Jacek Kapitaniak, Marcin Kulling, and Jan Bonk. 2022. "Voltage Profiles Improvement in a Power Network with PV Energy Sources—Results of a Voltage Regulator Implementation" Energies 15, no. 3: 723. https://0-doi-org.brum.beds.ac.uk/10.3390/en15030723