Article

Assessing Validity of Employing Surveying Methods to Capture Data on Topography to Determine Hydrological and Topographic Parameters Essential for Selecting Locations for the Construction of Small Hydropower Plants

by
Anita Kwartnik-Pruc
1,* and
Aneta Mączyńska
2
1
Department of Engineering Surveying and Civil Engineering, Faculty of Mining Surveying and Environmental Engineering, AGH University of Science and Technology, 30-059 Kraków, Poland
2
Geodetic and Construction Company “Geo-Bud”, 26-220 Stąporków, Poland
*
Author to whom correspondence should be addressed.
Submission received: 1 February 2022 / Accepted: 15 February 2022 / Published: 18 February 2022
(This article belongs to the Special Issue Energy Potential and Energy Intensity of Real Estates)

Abstract

:
Renewable energy sources have begun to arouse interest worldwide. The UN Sustainable Development Agenda has defined access to affordable, reliable, sustainable and modern energy as one of its main goals. This paper contains a description of the research on the assessment of the validity of employing surveying methods to capture topographic data in order to select locations suitable for small hydropower plants. For the purpose of this study, a section of a natural watercourse with the surrounding area was measured by means of the photogrammetric method using unmanned aerial vehicles (UAVs) and, for comparison, by means of the precise positioning method using the GNSS system with the RTN kinematic technique (GNSS RTN). Publicly available measurement data from airborne laser scanning (LIDAR) were also used for the analyses. In order to assess the accuracy of the methods employed, the discrete data describing the relief were analysed, and then continuous data in raster form were analysed. The analyses were performed with the use of an automatic method of height comparison and analysis of cross-sections on DEM and DSM. In the last stage of the work, the hydrological parameters were analysed, i.e., the slope of the land and the watercourse flow values determined based on the DEM captured from various surveying methods. What is unique about this work is: (1) the use of spatial data with a high resolution acquired from UAVs to search for locations for the construction of small hydroelectric power plants and assessment of their usefulness in this regard; (2) assessment of the accuracy and quality of the hydrological and morphological parameters of the area important for the selection of the location for the construction of small hydropower plants, performed based on spatial data depicting the actual area of the land measured in the field; (3) assessment of the quality of the hydrological modelling necessary to find the location. The performed surveys and analyses allowed for the identification of the advantages and disadvantages of the surveying methods employed to capture data on the topography of land as well as indications of the optimal data source.

1. Introduction

Increasing environmental pollution and climate change have led to the development of renewable energy sources [1,2,3]. One of these is water, which currently provides 19% of the planet’s electricity [4,5,6]. Hydroelectric power plants, and especially small hydropower plants, are considered to be one of the most attractive energy sources, since they interfere less with the natural environment than large hydropower structures [7,8,9,10].
In Poland, a hydroelectric power plant with a capacity of less than 5 MW is defined as a small hydropower plant, whereas in most European Union countries, power plants with a capacity of up to 10 MW are considered to be small [11,12,13]. The first hydropower plants were built as early as in the nineteenth century [14,15]. Since then, a significant development in this sector all over the world can be observed [4,16,17,18]. In Poland, however, only 12% of the water resources are utilised to produce energy [4]. In other European countries, this ratio is much higher, e.g., reaching 80% in Germany [3]. According to [4], Poland has a very large potential for the development of hydropower, which it will use in the future.
In order to best use the energy potential of a small hydropower plant, an appropriate location for its construction should be selected. GIS analyses are very helpful in choosing the location, which significantly accelerates the work, as stated in Odiji et al. [19], Othman et al. [20], Al-Juboori and Guven [21], and Bezabih [22]. These analyses have already been used to search for potential locations for hydropower plants around the world, e.g., in Thailand [23], Korea [24], South Africa [25], Iran [26], Italy [27,28], Turkey [29], Ireland [30], India [31,32], Brazil [11] and in the United States [33,34].
GIS tools and multi-criteria analyses are used not only to find locations suitable for small hydropower plants, but also for other renewable energy sources, such as wind or solar energy [35,36,37,38], and even biomass energy [39,40].
When choosing sites for small hydropower plants, multiple factors should be taken into account, including environmental (ecological) [28,41,42], economic [18,28,43], social [23,41], topographic [5,43,44,45,46,47], geological [13,48], technical [41,49], hydrological [5,45,46,47] and legal (administrative) ones [50,51]. The literature review carried out for the purposes of this study revealed that, in different parts of the world, different criteria are used to select a location for a hydropower plant. Moreover, these criteria are segregated differently. Therefore, the most important criteria are listed and systematised in Table 1 below.
The criteria presented in Table 1 will not always be equally relevant to select a location for a specific investment, as stated in [52]. There, the authors presented a method of weighting individual criteria with regard to their significance. The conducted literature review demonstrated that despite the fact that different criteria were used in different countries, the analyses always considered topographic factors representing the morphological features of the land, such as slope, slope exposure or height. Based on topographic parameters, hydrological parameters are determined, i.e., the water network or the direction of water flow in a given area, which are necessary to determine the energy potential of a given water investment.
As it is stated in [53], there are numerous factors influencing the choice of locations for the construction of hydroelectric power plants, but the most important are the topography and its characteristic features, because they determine the possible energy potential of a small hydropower plant. GIS tools, which enable easy and quick site analysis, can be used to determine the morphological features of the area [5,52]. They also allow for the determination of the characteristic features of the relief, i.e., height above sea level, slope, length of the watercourse or the direction of the runoff [11,29]. So far, site analyses for the purpose of selecting locations for hydropower plants have mainly been based on the digital elevation model (DEM) in the raster form, created from satellite images with a low field resolution—of the order of several metres [11,26,27,54]—or with the use of remote sensing data, based on which, by means of image classification, elements such as water reservoirs were identified [55,56,57,58].
The related research and studies initially focused on proposing algorithms that, based on the DEM in the raster form, would model the direction of water flow in a given area [59,60,61]. Subsequent analyses focused on the search for low-resolution raster image processing algorithms to determine the flow directions that best described the flow patterns [62,63]. This was necessary because, according to Paz and Collischonn [27], the DEM resolution had a significant effect on errors in determining parameters significant for defining the energy potential or other parameters used in hydrological modelling [64,65]. These errors are greater for rasters with a lower field resolution.
Due to the fact that the DEM field resolution affects the accuracy of determining the parameters necessary to search for potential construction sites for small hydropower plants, the analyses in this study were carried out on images with much higher resolution. The first aim of the study was to verify whether spatial data with very high field resolutions, of the order of several centimetres, were needed to find locations for the construction of small hydroelectric power plants, or whether data with much lower accuracy, of the order of 1 m, would be sufficient. So far, for the purposes of determining hydrological parameters, only DEM models with maximum spatial resolutions of 1 m have been analysed and compared, firmly stating that they yielded better results than models with resolutions of several dozen metres [64]. It has never been analysed before as to whether it is necessary and needed to use DEM models with spatial resolutions higher than 1 m for this purpose.
The second aim of the study was to verify whether the higher quality of spatial data depicting the topography of the area surrounding the watercourse would significantly affect the values of the determined topographic and hydrological parameters important to find locations for the construction of hydropower plants.
The analyses were limited to topographic and hydrological criteria only, as the other criteria are used differently in different parts of the world. Moreover, it will not always be possible to clearly determine the accuracy of their determination, as they will not depend on exact data.
These analyses were performed on a DEM created from a field survey using modern surveying methods. The survey was carried out by means of the increasingly popular low-altitude aerial photogrammetry method using unmanned aerial vehicles (UAVs), which significantly facilitated and accelerated the work [66,67,68,69,70]. The second measurement method used was the airborne laser scanning method (LIDAR), which allowed for obtaining different DEM resolutions depending on the land cover [71,72,73,74]. LIDAR is also useful for measuring and modelling land around water-covered areas, as proven by Endreny and Wood [65].
The heights and the real land surface measured by the Global Navigation Satellite Systems (GNSS) Real Time Network (RTN) method were used as reference data to determine the accuracy of the relief and hydrological modelling parameters. The survey using the GNSS RTN technique was necessary because the data from LIDAR and UAV only allow surveys of the land cover (digital surface model (DSM)), not the surface itself (DEM).
The diagram of the conducted analyses is illustrated in Figure 1.
In the first stage of the research, the area surrounding the watercourse was surveyed using two methods. The first surveying method employed—GNSS RTN—allowed for the measurement of the land around the watercourse, i.e., the surface without any land cover, which consisted of vegetation growing near the river (trees, bushes, grasses). The second surveying method using UAVs allowed only for the measurement of the area together with the land cover. The data from the third method (LIDAR) also allowed only for the measurement of the area together with its land cover. The survey performed with two methods (UAV, GNSS RTN) was necessary because UAV data and LIDAR data required the noise, i.e., the entire land cover, to be removed in order to determine the features of the relief. It was possible to remove the land cover with the use of automatic algorithms that were characterised by various errors. Therefore, in order to assess the accuracy with which the land cover can be removed, leaving the DEM alone for analysis, it was necessary to measure the relief actually present in the field using the GNSS RTN method.
In the second stage of the research, a digital surface model (DSM) and a digital elevation model (DEM) were created from the measured point cloud from UAV data in Agisoft software. In the next stage of the research, the quality of spatial data describing the actual surface of the studied area (DEM) was analysed. For this purpose, the first stage of the research involved the analysis of the discrete data describing the relief and then of the continuous data in raster form. In order to assess the accuracy of the DEM and other parameters, a method was used comparing the heights of points captured from LIDAR and UAV with the heights measured directly in the field using the GNSS RTN method. A similar approach to assess the quality of the DEM has already been used by Gołuch et al. [75], Liu [76] and Estornell et al. [77].
The quality analysis performed for discrete and continuous data was necessary because only discrete data (single point measurement) were obtained during field surveys. For the hydrological analyses necessary to determine land features essential for the location of small hydropower plants, it is the continuous surface of the entire area surrounding the watercourse that is essential, and not individual measurement points. Therefore, with the use of appropriate interpolation algorithms, a continuous surface (raster data) representing the area from the measurement points was created. The interpolation algorithms used allowed only for the approximation of the actual surface with a certain accuracy, and not to describe it precisely. Therefore, in order to reliably evaluate the accuracy, an evaluation was performed for discrete and continuous data. The analyses were conducted using the automatic method of comparing heights and the analysis of cross-sections on DEM and DSM (Figure 1).
A comparative analysis of the cross-sections and slopes created from the DEM and DSM was necessary, as it made it possible to indirectly assess the quality of the DEM and DSM models used in the research and to directly assess the quality of the determined topographic parameters created on the ground surface data processed to a continuous (raster) form.
During the last stage of the work, the hydrological parameters determined based on the DEM captured from various surveying methods were analysed in order to finally assess the need to use high-resolution spatial data for the selection of locations for small hydropower plants.
GIS analyses were used for the research. The use of GIS spatial analyses to search for sites for the construction of small hydropower plants is not unusual, as it has previously been the subject of research [38,53,54,78]. However, it is unique to use spatial data with a high resolution acquired from UAVs for this purpose and to assess their usefulness in this regard. So far, GIS spatial analyses in hydrological modelling have been performed mainly based on data captured from satellite images with a low field resolution (images with a ground sample distance of several metres) and LIDAR data with spatial data acquisition accuracy of one metre. The use of other, more precise measurement methods, i.e., UAV and GNSS RTN, for this purpose will allow for the assessment of their effectiveness and for the verification of the correctness of the procedures applied. Another innovative aspect of this study is the assessment of the accuracy and quality of the hydrological and morphological parameters of the area relevant for the selection of the location for small hydropower plants, performed on spatial data presenting the actual area of the land alone, measured in the field. So far, all analyses of this type were performed based on the land surface created only as a result of noise filtration in the form of land cover (trees, bushes, grasses), without examining the effect of the filtration accuracy on the quality of the hydrological parameters acquired. Another novelty in the study was the assessment of the quality of the hydrological modelling itself, necessary to find the location. This assessment was carried out based on the survey of the actual course of the watercourse in the field performed using the GNSS RTN method and the water network automatically generated by the software based on the DEM.

2. Materials and Methods

For the purposes of this study, a section of a natural watercourse was measured, i.e., the Czysta River flowing through Kozia Wola in Konecki county in Poland (Figure 2).
A natural lowland watercourse was selected as the subject of the research. The objective was to check whether the algorithms used will also be helpful for small flows and slopes. It was assumed that if the algorithms determining the parameters necessary to search for the location for hydroelectric power plants are successful for small values of slopes and flows, they will be even more correctly determined for higher values. The measurement covered approximately 500 m of the Czysta River flowing through Kozia Wola in Poland (Figure 2). The slope of the river in the analysed area was only about 3.5‰.
In Poland, average flows are not defined for small watercourses such as the Czysta River. Average flows are determined only for the main watercourses. The Czysta River is the left tributary of the larger Drzewiczka River with an average flow of 6 m3/s [79]. For the needs of the analyses, due to the lack of a specific flow for the Czysta River, the average flow of the watercourse was assumed to be as for the Drzewicza River: at the level of 6 m3/s [79].

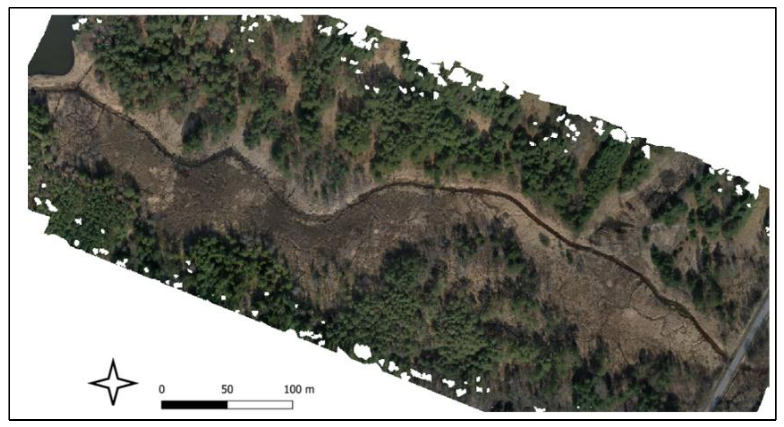
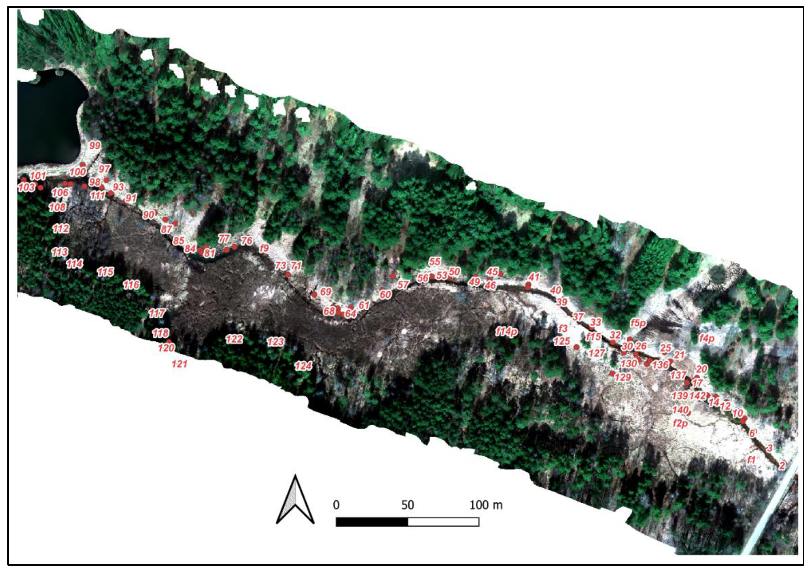
2.1. Field Work and Data Used

The watercourse and the surrounding area were surveyed by the photogrammetric method using unmanned aerial vehicles (UAVs). During the field work, DJI Matrice 210 RTK v2 (SZ DJI Technology Co., Shenzhen, China) was used to obtain photos for the orthomosaic elaboration (Figure 3). The pass was carried out in good weather conditions (clear sky) at an altitude of 85 m above ground level. The duration of the pass was about 20 min. The photos were taken with the X5S camera (SZ DJI Technology Co., Shenzhen, China) with a resolution of 5280 × 3956 px. The size of the ground sample distance was about 4 cm. A total of 192 photos were taken during the pass. The research covered an area of approximately 6 ha (Figure 3).
Before the pass, 11 ground control points (GCPs) were surveyed. The points were evenly distributed in the research area. The survey was performed using the GNSS RTN kinematic technique with the GPS TRIMBLE R6 receiver (Trimble Inc., Sunnyvale, CA, USA). The value of the position dilution of precision (PDOP) coefficient for the measured points fell within the range of 1.3–2.1. Adjustment data for real-time GNSS observations were taken from the VRSNet system.
Data processing was performed in Agisoft Metashape software (Agisoft LLC, St. Petersburg, Russia). For georeferencing, photos with a determined RTK position and one ground control point were used. The survey and data processing were performed using the method presented in [80]. In this method, thanks to the integration of the RTK system with the UAV, the coordinates of the centre of the projections were saved in the metadata in the target coordinate system. After loading the photos into the Agisoft Metashape photogrammetry software, the first stage of processing was carried out immediately, in which the block of photos is aligned. The approximate elements of the external orientation of the photos did not need to be postprocessed because they already have their coordinates determined by the RTK survey. In the aerotriangulation process, only one ground control point was used in accordance with the recommendations of Wywiał [80] in order to precisely fit the model to the physical land surface. According to [80], the use of the GCP allows for increasing the height accuracy of the model from 0.19 m to 0.04 m. The spatial accuracy (X, Y, Z) of the model fit calculated in the Agisoft Metashape software was 2.2 cm. In order to identify the actual error in determining the coordinates of the points on the orthophotomosaic, 10 control points (not participating in the alignment) were measured in the field using the GNSS RTN method. Then, using the coordinates of the points captured from the GNSS RTN survey and the coordinates determined based on the orthophotomosaic, the root mean square error (RSME) was calculated for the spatial data (in the horizontal and vertical planes), which was 7.6 cm. As a result of the study, an orthophotomosaic and a point cloud (in a regular grid every 0.5 m) showing the surface of the analysed area were obtained.
Based on the measurement data from the UAV, it is possible to create a model of the surface only (DEM) as well as of the surface with land cover (DSM). During the survey, the surface is measured together with the land cover (noise). Thus, in order to obtain the model of the surface only (DEM), filtration of the noise, i.e., of the land cover, has to be performed. The DEM and DSM models for the analysed area were created in the Agisoft software based on the measured point cloud presenting the relief of the analysed area together with its cover.
At the same time, the analyses were performed using the measurement data available in Poland from airborne laser scanning (LIDAR) in the form of a cloud of measurement points with specific XYZ coordinates from the ISOK system (National Protection IT System). The density of the point distribution in the analysed area was uneven and was 4–6 points/m2 [81]. According to the assumptions of Head Office of Geodesy and Cartography (GUGiK), the vertical accuracy (mean error) of the airborne laser scanning (ALS) point cloud on paved areas should be 0.1–0.15 m [81], while the horizontal accuracy should be 0.4–0.5 m [82]. In fact, as proven in Pawłuszek et al. [83], the vertical accuracy of the data from the National Protection IT System varies and depends on the land cover. For bushy areas, the mean error in determining the height on the DEM is about 0.25 m [83].
Based on the measurement data from LIDAR (as in the case of UAVs), the surface is surveyed together with its cover. Thus, in order to obtain the model of the surface only (DEM), the noise in the form of land cover must be filtered. The current software allows for the creation of a model of only the surface from LIDAR data after filtering the noise, i.e., the land cover. In this work, the authors used DEM and DSM in the raster form, which was made available by the Head Office of Geodesy and Cartography.
In order to assess the quality of data describing the land surface surveyed using photogrammetric methods, an additional survey of the land surface was performed by the precise positioning method using the GNSS system with the RTN kinematic technique (GNSS RTN) with the GPS TRIMBLE R6 receiver. The value of the position dilution of precision coefficient for the measured points was lower than the permissible value in Poland of 6.5. Adjustment data for real-time GNSS observations were taken from the “VRSNet” system. During the field work, about 170 points representing the relief were surveyed. According to Ćwiąkała et al. [84], the surveying accuracy of field details using the GNSS RTN technique was: 0.02 m for horizontal details (XY—in the horizontal plane) and 0.04 m for vertical details (Z—in the vertical plane). Figure 4 illustrates the points measured using the GNSS RTN method, representing the actual relief of the analysed area. The measurement points were not evenly distributed due to the difficult field conditions. The analysed area, in particular in the southern part, was very wet.

2.2. Methods

At the beginning of the work, the quality of the spatial data describing the surface of the studied area was analysed. For this purpose, the spatial data captured from surveys using photogrammetric (UAV and LIDAR) and surveying (GNSS RTN) methods were compared. The data from the GNSS RTN method were used as reference data for comparison, as they represented the real land surface.
In the first stage of the work, the “cloud to cloud” comparison was made, i.e., the focus was only on the discrete point heights analyses captured from various surveying methods. Due to the fact that the accuracy of the digital elevation model was affected by the ground coverage, the field details around the watercourse were divided into three groups, i.e., slopes around the watercourse, grass (meadows) and forested areas. The terrain heights at the points measured in the field using the GNSS RTN technique (reference data) were compared with the terrain heights at the points read from the point clouds (UAV and LIDAR). Due to the fact that the density of the points from the LIDAR and UAV methods was different, two comparisons were carried out.
The first comparison consisted of calculating the difference in heights between the terrain height at the point measured in the field using the GNSS RTN technique and the terrain height at the nearest point from the LIDAR and UAV clouds (Figure 5A). The second comparison consisted of calculating the difference in heights between the terrain height at the point directly measured in the field using the GNSS RTN technique and the mean terrain height at the points from the cloud for a given buffer zone, i.e., a zone distant from the measured point by a given distance (Figure 5B). The buffer zone radius around the points measured using the GNSS RTN technique was assumed for LIDAR data at the level of 0.25 m, and for the UAV data at the level of 0.5 m due to the lower density of points.
Then, the quality of the spatial data describing the surface of the studied area was analysed. For this purpose, in the first stage, the value of the variance was calculated using Equation (1) for the height difference σ d H M I N 2 determined based on the terrain height at the points measured directly in the field using the GNSS RTN technique and the terrain height at the points from the UAV and LIDAR clouds located at the closest distance from the point measured using the GNSS RTN technique in the given buffer zone (Figure 5A).
σ d H M I N 2 = i = 1 n H R T N i H d M I N i 2 n 1
where
  • σ d H M I N 2 —estimator of variance of height difference,
  • H R T N i —terrain height at the point measured by the GNSS RTN technique,
  • H d M I N i —terrain height at the point measured by the UAV and LIDAR technique lying at the closest distance from the point measured by the GNSS RTN technique,
  • i —next item observation,
  • n —number of observations.
In the next stage of the work, using Equation (2), the variance value was calculated for the height difference ( σ d H M E A N 2 ) determined based on the terrain height at the points measured in the field using the GNSS RTN technique and the mean terrain height at the points from the UAV and LIDAR clouds lying in the given buffer zone around the point measured using the GNSS RTN technique (Figure 5B).
σ d H M E A N 2 = i = 1 n H R T N i H M E A N i 2 n 1
where:
  • σ d H M E A N 2 —estimator of variance of height difference,
  • σ d H M E A N 2 —terrain height at the point measured by the GNSS RTN technique,
  • σ d H M E A N 2 i—mean height of the points measured by the UAV and LIDAR technique lying in the buffer zone around the point measured by GNSS RTN technique,
  • i —next item observation,
  • n —number of observations.
The estimated value of the variance according to Equations (1) and (2) demonstrated the size of the dispersion between the heights at the points measured by the UAV and LIDAR methods and the actual terrain height measured by the GNSS RTN method.
Then, using Equation (3), the accuracy of the estimated value of the variance was calculated for the compared heights σ σ d H 2 of the points measured in the field using the GNSS RTN technique and determined based on the UAV and LIDAR point clouds. The value calculated in accordance with Equation (3) allowed for the assessment of the accuracy of estimating the value of the dispersion between the actual terrain heights and the heights measured by the UAV and LIDAR methods.
σ σ d H 2 = 2 n 1 * σ d H M E A N / M I N 2
where:
  • σ σ d H 2 —precision of the estimated value of the variance of height difference,
  • σ d H M E A N / M I N 2 estimator of variance of height difference,
  • n —number of observations.
In the next stage of the work, using Equation (4), the value of the standard deviation was calculated for the height difference ( σ d H ) determined based on the terrain height at the points measured in the field using the GNSS RTN technique and the heights determined from the UAV and LIDAR point clouds. The value of the standard deviation was calculated for both points closest to the point measured using GNSS RTN in the given buffer zone, as well as the mean height of the points lying in the buffer zone around the point measured using the GNSS RTN technique.
σ d H = σ d H M E A N / M I N 2
where:
  • σ d H —estimator of standard deviation of height difference,
  • σ d H M E A N / M I N 2 —estimator of variance of height difference.
The estimated value of the standard deviation in accordance with Equation (4) demonstrated the precision with which the heights at the points measured by the UAV and LIDAR methods were determined. In this example, the value of the standard deviation calculated according to Equation (4) may be a measure of the quality of the discrete data describing the land surface.
In the last stage of the work, using Equation (5), the accuracy of the estimated value of the standard deviation was calculated for the compared heights ( σ d H ) of the points measured in the field using the GNSS RTN technique and determined based on the UAV and LIDAR point clouds.
σ σ d H = σ σ d H 2
where:
  • σ σ d H —precision of the estimated value of the standard deviation of height difference,
  • σ σ d H 2 —precision of the estimated value of the variance of height difference.
The values of the parameters calculated with the use of Equations (1)–(5) allowed for a full assessment of the accuracy of determining the heights at the points measured by the UAV and LIDAR methods. This was necessary because the accuracy (quality) of discrete data describing the land surface could directly affect the quality of the elevation model, which will be used for the hydrological modelling of the watercourse flow.
In the second stage of the work, the heights were compared based on the data processed to a continuous form, i.e., the analyses were performed on raster data. The DEM (interpolated land surface) and the DSM (interpolated land surface with the cover) in the high-resolution raster form (ground sample distance—0.04 m) were used, created in Agisoft software for data from the method using the UAV, as well as the DEM and the DSM downloaded from the Head Office of Geodesy and Cartography website, created from the LIDAR data as part of the National Protection IT System project [82]. The data collected from the Head Office of Geodesy and Cartography were in the GRID structure with a mesh size of one metre [81]. At this stage, the terrain heights at the points read from the raster created from the point cloud ( H D E M U A V / L I D A R i ) were compared with the heights at the points directly measured in the field using the GNSS RTN technique ( H R T N i ) . The heights were compared in the QGIS software. It was a fully automatic process using the SAGA GIS “add raster values to points” overlay. Then, using Equation (6), the value of the variance was calculated for the height difference σ d H 2 determined based on the heights of points measured in the field using the GNSS RTN technique and the heights determined from the UAV and the LIDAR point clouds processed into the raster form.
σ d H 2 = i = 1 n H R T N i H D E M U A V / L I D A R i 2 n 1
where:
  • σ d H 2 —estimator of variance of height difference,
  • H R T N i —terrain height at the point measured by the GNSS RTN technique,
  • H D E M U A V / L I D A R i —height of the point from the DEM raster created from the UAV and LIDAR data,
  • i —next item observation,
  • n —number of observations.
After calculating the value of the variance using Equation (4), the value of the standard deviation for the height difference was calculated. Then, using Equations (3) and (5), the accuracy of the estimated value of the standard deviation was calculated for the compared heights σ σ d H at the points measured in the field using the GNSS RTN technique and determined based on the digital elevation model created from the UAV and LIDAR point clouds.
The second accuracy analysis for the raster data (discrete data converted to a continuous form) was necessary because the terrain model (DEM, DSM) from the LIDAR data, which was used for hydrological analyses, was taken from the Head Office of Geodesy and Cartography. Therefore, it was necessary to verify the accuracy with which it determined the actual land surface in the analysed area. The analysis of the model accuracy for the UAV data also had to be carried out, because the software used provided only the mean error of the model creation, without distinguishing between individual field details (slopes, grasses, forests).
The raster accuracy analysis was performed using Equations (3)–(6). The estimated value of the variance, calculated in accordance with Equation (6), demonstrated the size of the dispersion between the point heights read from the rasters and the actual terrain height measured by the GNSS RTN method. The estimated value of the standard deviation in accordance with Equation (4) presented the accuracy of determining the height at the points based on the rasters from the UAV and LIDAR methods. The standard deviation parameter in this example will be a measure of the quality of the continuous model representing the land surface.
In the third stage of the work, a DEM was created in the SAGA GIS software, based on the terrain heights measured at characteristic points using the GNSS RTN technique. Creating a DEM from the points measured directly in the field using the GNSS RTN technique was necessary for the final verification of the hydrological parameters calculated based on the elevation model in a continuous form (raster), created from the UAV and LIDAR data. Several algorithms were used to interpolate the land surface, including “inverse distance”, “triangulation”, “natural neighbour” and “nearest neighbour”. A description of the algorithms used can be found in [85]. Then, the heights at the points read from the DEM rasters (created with the algorithms “inverse distance”, “triangulation”, “natural neighbour”, and “nearest neighbour”) were compared with the terrain heights at the points directly measured in the field using the GNSS RTN technique. The height comparison was made in the QGIS software using the SAGA GIS “add raster values to points” overlay. Then, using Equation (7), the variance value was calculated for the height difference σ d H 2 determined based on the heights at the points measured in the field using the GNSS RTN technique and the heights automatically read from the DEM rasters.
σ d H 2 = i = 1 n H R T N i H D E M R T N i 2 n 1
where:
  • σ d H 2 —estimator of variance of height difference,
  • H R T N i —terrain height at the point measured by the GNSS RTN technique,
  • H D E M R T N i —height of the point from the DEM raster created from data of GNSS RTN,
  • i —next item observation,
  • n —number of observations.
After calculating the value of the variance using Equation (4), the value of the standard deviation for the height difference ( σ d H ) was calculated. Then, with the use of Equations (3) and (5), the accuracy of the estimated value of the standard deviation was calculated for the compared heights σ σ d H of the points measured in the field using the GNSS RTN technique and determined based on the DEM created from the GNSS RTN survey. The analysis of the raster accuracy with the use of the above Equations was necessary to select the optimal algorithm for interpolating the land surface. The estimated value of the variance, calculated according to Equation (7), demonstrated the size of the dispersion between the point heights read from the rasters and the actual terrain height measured by the GNSS RTN method. The estimated value of the standard deviation according to Equation (4) presented the accuracy of determining the point heights based on the rasters created with various algorithms. The standard deviation parameter in this example will be a measure of the quality of the continuous model representing the land surface.
Then, in order to accurately compare the DEM rasters, cross-sections through the watercourse bed were also made. The cross-sections were generated automatically in the QGIS software at an average distance of 25 m. Figure 6 illustrates only selected cross-sections, which are visualised later in the work.
In the fourth stage of the work, cross-sections were generated in the QGIS software through the watercourse bed for the processed point cloud from the UAV, LIDAR methods to a continuous form—the DEM and DSM rasters created using the “inverse distance” method from the GNSS RTN survey. Then, slope cross-sections were also generated along the same measurement lines. The analysis of the cross-sections and slopes was performed separately for the DEM (land surface) and the DSM (land surface with the cover). Subsequently, using SAGA GIS software, based on previously created DEMs, a slope map was generated for better visualisation of the area.
In the last stage of the work, using the Hydrology library of the SAGA GIS software, DEM raster cells were determined, in which the water flow accumulated in a given area. Knowing the places where water accumulates in a given area, we can determine the direction of its flow. In addition, we can also visualise the water network in a given area.
Then, using the method presented in [86], consisting of the reclassification of the raster using the mean value of the watercourse flow in a given area, the values of the actual watercourse flow in each cell of the raster were defined by determining the actual course of the Czysta River. Hydrological parameters were determined on the DEM acquired from all surveying methods, and also based on the actual area of the land only, measured by the GNSS RTN method. Thus, it was possible to assess the quality of the hydrological and morphological parameters of the land, important for the selection of the location for the construction of small hydropower plants, made based on the spatial data depicting the actual area of the land alone measured in the field, and not only the area created by the filtration of the noise in the form of land cover. It allowed for the examination of the influence of the accuracy of the performed filtration on the quality of the hydrological parameters obtained. Moreover, the measurement of the actual course of the watercourse in the field using the GNSS RTN technique and its comparison with the water network generated in the software based on the DEM enabled the quality assessment of the performed hydrological modelling.

3. Results

This chapter presents the results of the accuracy analysis of the spatial data describing the land surface captured using the LIDAR, UAV and GNSS RTN methods. The results and analysis of the differences in the calculated parameters of hydrological modelling used in the search for potential locations for the construction of small hydropower plants are also presented.

3.1. Analysis of the Accuracy of Spatial Data Describing Land Surface and Selection of an Interpolation Algorithm for Modelling Land Surface for Data from the GNSS RTN Method

Table 2 presents the results of the first comparison of point heights based on discrete data. Columns 9 and 5 (Table 2) summarise the calculated differences in heights between the point measured in the field using the GNSS RTN technique, and the height of the nearest point from the LIDAR and UAV clouds (Figure 5A). Columns 7 and 11 (Table 2) summarise the differences in heights between the height of the point measured directly in the field using the GNSS RTN technique and the mean height of the points from the cloud for a given buffer zone (Figure 5B). Then, using Equations (1), (2), and (4), the variance and standard deviation values were calculated for the compared height differences, depending on the land cover (slope, grass, forest). Successively, using Equations (3) and (5), the accuracy of determining the variance and standard deviation was estimated. The results are presented in Table 2.
The calculated values of the variance ( σ d H 2 ) and the standard deviation σ d H of the height differences vary depending on the land cover. The values of the variance and standard deviation for both surveying methods (UAV, LIDAR) are the highest for forested areas. For the remaining types of land cover, the mean errors in determining the height from the LIDAR and UAV clouds differ depending on the method used. UAV data have lower error values for slopes ( σ d H M I N = 0 , 2   ±   0.1   m ,     σ d H M E A N = 1.6 m   ±   0.9   m ) and grasses ( σ d H M I N = 0.1   ±   0.1   m , σ d H M E A N = 1.9 m   ±   1.3   m ), while LIDAR data have the lowest error values for forested land ( σ d H M I N = 5.3   ±   3.7   m , σ d H M E A N = 3.3   m   ±   2.3   m ). The general error in determining the heights for all analysed points, without distinguishing the type of land cover, by the first method using the points closest to the measurement point is σ d H M I N = 3.1   ±   1.6   m for the UAV data, and σ d H M I N = 3.3   ±   1.7   m for the LIDAR data. On the other hand, by means of the method using the average point height from the cloud located in the given buffer zone, the general error is σ d H M E A N = 2.7   ±   1.4   m for the UAV, and σ d H M E A N = 3.4 ± 1.8   m for the LIDAR. Therefore, when analysing the results, it can be concluded that regardless of the comparison method (the method of the closest point and the method of mean heights in the buffer zone), the mean error in determining the heights is lower for the UAV method. However, this does not mean that the UAV method is better for each type of land cover, because the mean error for forested areas measured by the LIDAR method is smaller. To sum up, it should be stated that the height measurement using the LIDAR method gives more accurate results for forested areas, and in the remaining areas, the UAV surveying method is more accurate. When analysing Table 2, it can also be noticed that there are significantly more outliers (marked in red in Table 2) for the LIDAR points. This is confirmed by the value of the total variance (a measure of data scatter) for the LIDAR data, which is: σ d H 2 M I N = 11.0   ±   2.9   m and σ d H M E A N 2 = 11.7   ±   3.3   m . The value of the variance, regardless of the comparison method (the closest point method and the method of mean heights in the buffer zone) is at a similar level. This is confirmed by the conclusion drawn earlier that the LIDAR surveying method should be used in forested areas, and in other cases the UAV method should be used. The dispersion of the height values (the variance value) by the LIDAR method is smaller only for forested areas, and in other cases (grasses and slopes), the UAV method has a lower dispersion of accuracy.
Table A1, constituting Appendix A, contains the results of the second comparison of the point heights determined on the data processed into a continuous form (raster). Column 2 (Table A1) summarises the point heights measured directly in the field using the GNSS RTN technique ( H R T N i ) . Columns 3 and 5 (Table A1) summarise the point heights automatically read from the DEM rasters created from the UAV and LIDAR point clouds ( H D E M U A V / L I D A R i ) . Columns 7 and 8 (Table A1) summarise the point heights automatically read from the DSM rasters created from the UAV and LIDAR point clouds ( H D S M U A V / L I D A R i ) . Columns 4 and 6 (Table A1) summarise the differences between the heights at the points read from the DEM rasters created from the UAV and LIDAR point clouds with the point heights measured directly in the field using the GNSS RTN technique d H R T N D E M i . Column 8 (Table A1) summarises height differences between the heights of the points read from DSM rasters created from the UAV and LIDAR point clouds with the point heights measured directly in the field with the use of the GNSS RTN technique d H R T N D S M i . Then, using Equation (6), the value of the variance for the height differences σ d H 2 determined based on the point heights measured in the field with the GNSS RTN technique and the heights determined from the UAV and LIDAR point clouds converted to raster form were calculated. Then, using Equations (3)–(5), the standard deviation of height differences ( σ d H ) and the accuracy of its determination ( σ ( σ d H ) ) were estimated. Based on the performed calculations, it was found that the value of the standard deviation for the DEM in the raster form captured from the survey by the UAV method was σ d H = 0.17   ±   0.6   m , and that by the LIDAR method was σ d H = 0.39   ±   0.13   m (Table A1). The mean value of the height difference ( M E A N d H ) of the points read from the DSM for the UAV and LIDAR methods was 1.40 m (Table 2). Taking into account the studied area (non-urbanised, covered with vegetation), it can be concluded that the accuracy of determining the height on the created DEM model in the raster form is high. Comparing the values of the mean errors or for the continuous data (Table A1) and discrete data (Table 2), it can be noticed that the errors are much smaller for the land surface interpolated to the continuous form (raster) than for the discrete data. Therefore, it can be concluded that the terrain model created in the continuous form (DEM, DSM) yields a better accuracy of height determination than the heights determined for individual points from the UAV and LIDAR clouds. This is very important information as all hydrological analyses are performed on the terrain model processed to a raster form. As the analyses demonstrated, the low accuracy of the height determination for discrete data (single points from the cloud) did not directly translate into the accuracy of the model itself. When interpolating the terrain at the stage of creating the DEM terrain model, outliers are rejected, which are much more difficult to identify and reject during the discrete analysis (of single points). As a result, the error for the continuous data (raster) is smaller.
In the next stage of the work, the discrete data measured by the GNSS RTN method, representing the surface of the land alone, were processed into a continuous raster form. Four algorithms were used to create the DEM: “inverse distance”, “triangulation”, “natural neighbour” and “nearest neighbour”. It was necessary to assess the quality of the hydrological and topographic parameters determined on the DEM from other surveying methods (UAV, LIDAR). In order to select the best interpolation algorithm, the height comparison was performed. The results are presented in Table A2.
Table A2, constituting Appendix B, presents the results of the third comparison of the point heights. Column 2 (Table A2) summarises the point heights measured directly in the field using the GNSS RTN technique. Columns 3, 5, 7, and 9 (Table A2) summarise the point heights automatically read from the DEM rasters created from land surface surveys carried out in the field using the GNSS RTN technique ( H D E M R T N i ) using the following algorithms: “inverse distance”, “triangulation”, “natural neighbour” and “nearest neighbour”. Columns 4, 6, 8, and 10 (Table A2) summarise the differences between the point heights automatically read from the DEM rasters with the point heights measured directly in the field using the GNSS RTN technique d H R T N D E M i . Then, using Equation (7), the value of the variance was calculated for height differences σ d H 2 . Subsequently, using Equations (3)–(5), the standard deviation of the height differences ( σ d H ) and the accuracy of its determination ( σ ( σ d H ) ) were estimated. Based on the performed calculations, it was found that the value of the standard deviation for DEM in the raster form from the “inverse distance” method was σ d H = 0.08   ±   0.03   m , and from the “nearest neighbour” method it was σ d H = 0.02   ±   0.01   m (Table A2). For the other two methods, “triangulation” and “natural neighbour”, the errors were very large (Table A2).
Then, in order to finally verify the DEM rasters created by the four methods—“inverse distance”, “triangulation”, “natural neighbour” and “nearest neighbour”—cross-sections were generated through the watercourse bed in the QGIS software (Table 3). The cross-sections were generated every 25 m on average. Only exemplary cross-sections along the lines illustrated in Figure 6 are given below.
Based on the results presented in Table A2 and Table 3, it was found that the “inverse distance” algorithm would be the optimal interpolation algorithm. The “inverse distance” algorithm determines the real terrain height with high accuracy (Table A2). Moreover, by analysing the cross-sections (Table 3), it can be concluded that this algorithm correctly presents the “real” relief observed in the field. The “nearest neighbour” algorithm has the greatest accuracy σ d H = 0.02   ±   0.01   m (Table A2), but does not fully reflect the “real” relief (Table 3).

3.2. Analysis of Cross-Sections and Slopes Created on the Terrain Model in the Form of the DEM Raster

Another parameter important for the selection of sites for the construction of hydropower plants, apart from the height above sea level, is the slope of the land. Therefore, in the next stage of the work, for the land surface alone (DEM) and for the land surface with land cover (DSM), cross-sections through the Czysta River bed and a cross-section along the main axis of the watercourse were generated in the QGIS software, every 25 m on average (Table 4). The cross-sections were created for the processed point cloud from the UAV and LIDAR methods to a continuous form (the DEM and DSM raster) and a raster created using the “inverse distance” method from the GNSS RTN survey. The main cross-section was generated based on the measured course of the river in the field. Only exemplary cross-sections along the lines illustrated in Figure 6 are given below.
By analysing the cross-sections, it can be concluded that the shape of the riverbed is maintained for all the surveying methods (LIDAR, UAV, GNSS RTN). However, it is easier to reduce noise generated by bushes from the LIDAR data, which can be noticed in the cross-sections 13, 15, 17 (Table 4). It is also clearly noticeable when we analyse slopes in the cross-sections (Table 5), where the noise on the DEM from the UAV is so large that it distorts the image on the cross-section. When analysing the cross-sections, it can be noticed that the UAV data are much more sensitive to noise in the form of dense vegetation than the LIDAR data. In the cross-sections, considerably greater vibrations for the UAV data than for the LIDAR data can be observed. The UAV data have much greater field accuracy than the LIDAR data and are therefore more susceptible to noise.
The greater susceptibility of the UAV data to noise also translates into the value of the next topographic parameter, which is the slope. As can be seen in Table 5, the vibrations in the cross-sections for the UAV data are so large that they disturb the image of the entire cross-section. As a result, the slope values for the UAV data become unreliable.

3.3. Analysis of Hydrological Parameters

Based on the previously determined topographic parameters, in the last stage of the work, the determination of hydrological parameters important in hydrological modelling for the purpose of selecting the location for the construction of small hydropower plants was commenced. In the first stage of the work with the use of QGIS software, a map of slopes was created based on the previously prepared DEMs (Figure 7).
As illustrated in Figure 7, on the map generated from the digital elevation model created from the LIDAR data, the outline of the Czysta River bed is clearly visible, which is noticeable thanks to the steeper slopes running along the watercourse bed. On the slope map generated with the use of the UAV data, the bed and the slopes along the river are less distinguishable. This is due to the very high detail of spatial data captured from UAVs.
In the last stage of the work, the average and actual flow of the watercourse was determined, which was necessary when choosing locations for the construction of hydropower plants, because the energy potential of the designed structures is determined based on the flows. For this purpose, with the use of SAGA GIS software, DEM raster cells were determined, in which the water flow is accumulated in a given area. Then, knowing the places where water accumulates in a given area, the direction of its flow was determined indirectly. This allowed for the visualisation of the water network in the analysed area (Figure 8). As can be noted in Figure 8, the most developed water network was generated based on the LIDAR surveying data. The reason for this may lie in the larger area used for the analysis of the catchment area, as the LIDAR method raster covered the largest area. The water network generated based on the DEM from the UAV is hardly visible.
In the last stage of the work, using the method presented in [86] involving the reclassification of the raster using the mean watercourse flow in a given area (equal to 6 m3/s), the values of the actual watercourse flow in each raster cell were defined. Therefore, the actual course of the Czysta River in the field was specified. In Figure 9, the actual course of the river in the field measured by the GNSS RTN method is marked in red, while the course of the river generated in the QGIS software, determined based on the actual flow values in each raster cell, is marked in white.
Based on a comparison of the course of the watercourse surveyed in the field using the GNSS RTN method and generated from DEM, it is possible to evaluate the hydrological modelling. As illustrated in Figure 9, the algorithm worked best for the DEM created from the LIDAR data. For LIDAR data, hydrological modelling produced good results. The generated river course corresponded to that actually measured in the field by the GNSS RTN method. For the UAV data illustrated in Figure 9, the results are not as good. The reason for this may, first of all, be the area of the analysed catchment, which was much larger for the LIADR data than for the UAV, and secondly, the slope values generated from the UAV data based on which the slope map and flow values were generated.

4. Discussion

Based on the conducted analysis of discrete and continuous data describing the land surface captured by the following methods: GNSS RTN, UAV, LIDAR, it was found that the data in the continuous (raster) form modelled the land surface more accurately. Discrete data in the form of a point cloud captured by the LIDAR and UAV methods, especially for areas covered with dense vegetation, had very low accuracy—even a few metres in extreme cases. However, these errors were eliminated at the stage of processing them into a continuous form. The mean error for the DEM from the UAV survey was 0.17 m, and for LIDAR data it was 0.39 m. This is very important information, because all hydrological analyses are performed on the terrain model converted to a raster form. As the analyses demonstrated, the low accuracy of the height determination for discrete data (single points from the cloud) did not directly translate into the accuracy of the model itself. When interpolating the area at the stage of creating the DEM, outliers, which are much more difficult to identify and reject during the discrete analysis (single points), were rejected. As a result, the error for continuous data (raster) was smaller. It can therefore be concluded that the accuracy of determining the value of the first of the topographic parameters important for the selection of the location of small hydropower plants, which is the height, determined based on the DEM in the raster form from UAV and LIDAR, is sufficient.
Comparing the cross-sections made on the surface model created from the LIDAR and UAV data (after removing the noise in the form of land cover surrounding the watercourse) with the cross-sections made on the surface model created based on the measurement data representing the actual terrain relief measured by the GNSS RTN method, it can be concluded that the general cross-section of the riverbed was maintained for all measurement methods. A more extensive cross-sectional analysis demonstrated, however, that it was easier to remove noise (bushes) from the DSM constructed using LIDAR data, compared to UAV data. High sensitivity to noise can be noticed in the cross-sections made based on the DEM constructed using the UAV data. The course of bushes on LIDAR cross-sections is less varied, which makes it easier to remove. The high susceptibility of UAV data to dense vegetation makes the slopes generated on the DEM from UAV unreliable. The unremoved noise in the form of the land cover from the DEM distorts the image of the slopes in the UAV cross-sections. This problem only occurs when cross-sections are generated for an area densely covered with high vegetation, i.e., trees. For the remaining areas, this problem does not occur. It can therefore be concluded that the accuracy of determining the value of the second of the topographic parameters for the selection of the location for the construction of small hydropower plants, which is the slope of the land, determined based on the DEM in the raster form from UAV, is not always sufficient (areas covered with dense vegetation).
The highly detailed and noise-sensitive DEM constructed using UAV data affects the values of hydrological parameters necessary to find the location for the construction of small hydropower plants. The values of hydrological parameters, i.e., the direction of water flow in a given area or the value of water flow, are generated based on the slope of the land, and if its values are not entirely reliable for the entire area, the hydrological parameters are not correctly determined either. In the case of the UAV data, hydrological modelling did not produce as good results as for the LIDAR data.
Another disadvantage of the high-resolution DEM from UAVs is that they have a limited range. Data to create the DEM from UAVs are obtained during photogrammetric passes. The UAV pass should be carried out in accordance with EU regulations [87,88]. These regulations limit the flight range beyond the visual range of the UAV’s operator, the so-called beyond visual line of sight (BVLOS), up to 2 km. For flights with a range exceeding 2 km, it is necessary to obtain appropriate approval from the Civil Aviation Authority of the country concerned. Therefore, in order to capture large-scale data, several stations will be needed to perform surveys. This results in longer measuring times and higher costs. During the hydrological analyses, the studied area has a very significant influence on the values of the calculated hydrological coefficients. With a larger area for analysis, it is possible to generate a larger catchment area from which the parameters are calculated.
LIDAR data with average spatial (metre) accuracy are publicly available in most countries. Therefore, the area that can be analysed is not limited. In addition, the cost of data acquisition from LIDAR, both in Poland and in other countries, amounts to zero, because the data are free. Data from UAVs are still very expensive due to the innovations they provide in the field of surveying.
The analyses carried out for the purpose of this study demonstrated that the data from UAVs, despite the very high field accuracy (centimetre), are not always suitable for generating topographic and hydrological parameters relevant for the selection of the location for the construction of small hydroelectric power plants. Data from UAVs will work well in less forested areas. In areas covered with dense and particularly high vegetation, the LIDAR data, despite a much lower field resolution, will be better. This is a very important conclusion, because based on hydrological parameters, especially the value of the flow rate, the energy potential of a given water investment is determined with the use of GIS tools. If these parameters are not fully determined correctly, the estimate of the energy potential will be less reliable.

5. Conclusions

GIS spatial analyses are widely used in decision-making processes. However, in order to make the right decision, it is necessary to select the source of data for the analysis correctly in terms of functionality and economy. Based on the conducted research, it can be concluded that modern surveying methods are useful for spatial data acquisition for the purpose of selecting the location for the construction of small hydropower plants. The surveying data acquired by the photogrammetric method using LIDAR are particularly useful. As the analyses show, although the LIDAR data have a much lower resolution than the UAV data, they are sufficient for this purpose. The advantage of the LIDAR method is also the availability of data for larger areas, and thus the possibility of using a much larger area of the catchment area for analysis. This is especially important when calculating the flow accumulation. The UAV data, despite their high accuracy, are not always suitable for the analysis of the morphological features of the terrain, such as slopes. As a result, the flow accumulation maps that are generated using the slope information obtained from the UAVs do not always reflect the actual water network present in the field. This is due to the problems with filtering out the land cover from the DEM created from the data obtained from the UAV. On the other hand, the exact data we acquire as a result of using this surveying method can be used at the investment design stage. This method, however, requires planning and execution of a pass for each object separately, while LIDAR data are often captured systemically for entire regions and even countries.
The presented research confirmed the validity of using LIDAR data with metre accuracy to search for locations for the construction of hydropower plants, while concluding that it is not justified to use high-resolution (centimetre accuracy) UAV data for this purpose if LIDAR data are publicly available.
The presented research covers only topographic and hydrological criteria—among the most important criteria taken into account when selecting locations for the construction of small hydropower plants. Obviously, the decision to choose a site for such an investment is also influenced by other criteria (Table 1), the catalogue of which may differ depending on the country or region. Cooperation between specialists in various fields in a given country and the use of data from various sources for multi-criteria GIS analyses are key to the correct selection of the location for the construction of small hydropower plants.

Author Contributions

Conceptualization, A.M. and A.K.-P.; methodology, A.M.; software, A.M.; validation, A.M. and A.K.-P.; formal analysis, A.M.; investigation, A.M.; resources, A.M.; data curation, A.K.-P.; writing—original draft preparation, A.M.; writing—review and editing, A.K.-P.; visualization, A.M.; supervision, A.K.-P.; project administration, A.K.-P.; funding acquisition, A.M. All authors have read and agreed to the published version of the manuscript.

Funding

This research received no external funding.

Institutional Review Board Statement

Not applicable.

Informed Consent Statement

Not applicable.

Acknowledgments

The authors are thankful to Szymon Sobura, the assistant at the Department of Geodesy and Geomatics, Faculty of Environmental, Geomatics and Energy Engineering, Kielce University of Technology, for sharing the UAV data used in this work. The authors are especially thankful to Szymon Sobura for creating the orthophotomosaic and digital elevation model, which was necessary for the preparation of the paper.

Conflicts of Interest

The authors declare no conflict of interest.

Appendix A

Table A1. Comparison of point heights measured in the field using the RTN technique with point heights read from the DEM and DSM created from the LIDAR and UAV point clouds; source: own elaboration.
Point No. H R T N i [ m ] H D E M U A V i [ m ] d H R T N D E M i [ m ] H D E M L I D A R i [ m ] d H R T N D E M i [ m ] H D S M U A V i [ m ] H D S M L I D A R i [ m ] d H D S M i [ m ]
123456789
1254.55254.370.17254.350.19254.37254.53−0.16
10253.10252.860.24254.30−1.20252.86254.66−1.80
100252.08251.930.15252.17−0.09251.93252.19−0.26
101252.16251.830.33251.460.70251.83251.630.20
102252.15251.840.31251.480.67251.84251.600.24
103252.21252.070.14252.060.14252.07252.070.00
104251.31251.310.00251.46−0.15251.68251.600.08
105251.63251.470.16251.620.01251.47251.64−0.17
106251.70251.540.17251.660.04251.54251.78−0.24
107251.32251.37−0.05251.280.04251.37251.51−0.14
108251.82251.750.08251.760.07251.75260.77−9.02
109251.39251.41−0.02251.45−0.06251.41251.54−0.14
11254.60254.510.09254.77−0.17254.51260.84−6.33
110251.33251.65−0.31251.280.05252.21258.29−6.08
111251.37251.370.00251.41−0.03251.37251.43−0.05
112251.70251.73−0.03251.80−0.09266.09259.516.58
113252.07252.010.06251.880.20252.01253.80−1.80
114251.90251.850.05251.95−0.06251.85255.48−3.63
115251.92252.06−0.14252.00−0.08252.06253.34−1.29
116252.05252.14−0.08252.11−0.05261.34258.203.14
117252.96252.930.03252.920.04252.93257.10−4.17
118253.19253.60−0.41253.27−0.08262.12259.372.75
119252.90253.27−0.38252.890.00253.27253.55−0.27
12253.02252.840.18254.37−1.35252.84255.99−3.16
120253.66254.41−0.75253.67−0.01254.41254.020.38
121253.49254.15−0.66253.490.00254.15254.35−0.20
122252.77252.760.01252.78−0.01252.86256.19−3.32
123252.69252.75−0.05252.590.10261.59260.421.16
124252.89252.96−0.08252.830.06252.96255.42−2.46
125253.25253.230.02253.35−0.09253.23253.39−0.16
126253.29253.210.09253.45−0.16253.21253.59−0.38
127253.55253.62−0.07253.62−0.06253.62254.65−1.03
128253.63253.590.03253.67−0.05253.59254.50−0.91
129253.79253.730.06253.84−0.04253.73256.31−2.58
13254.65254.590.06254.600.04254.59254.67−0.08
130253.69253.670.02253.79−0.10253.67254.55−0.88
131253.48253.49−0.01253.420.06253.49253.77−0.28
132253.25253.120.13253.28−0.03253.12253.36−0.23
133253.56253.490.06253.63−0.08253.49253.76−0.27
134253.62253.530.08253.73−0.12253.53253.76−0.23
135252.92252.800.13253.29−0.37252.80253.32−0.53
136253.16253.25−0.09253.34−0.18253.25256.17−2.91
137253.27253.38−0.11253.43−0.15253.38253.91−0.53
138253.65253.66−0.01254.36−0.71253.66254.54−0.88
139253.75253.82−0.08254.33−0.59253.82255.23−1.41
14253.08252.920.16254.32−1.24252.92254.93−2.01
140253.96253.880.07254.35−0.39253.88256.00−2.11
141253.92253.810.10254.34−0.42253.81255.75−1.94
142253.72253.610.11254.30−0.58253.61254.34−0.73
15253.27252.990.28254.33−1.07252.99254.34−1.35
16253.84253.580.26254.39−0.55253.58257.18−3.60
17252.93252.690.24254.35−1.42252.69255.80−3.12
18253.04253.030.01254.34−1.30253.03256.19−3.16
19253.97253.870.10254.36−0.39253.87256.81−2.94
2253.30253.030.27254.28−0.98253.03255.62−2.59
20254.72254.550.17254.670.04254.55254.71−0.16
21254.72254.480.24254.700.02254.48255.94−1.45
22252.79252.720.08253.36−0.57252.72254.00−1.28
23253.84253.630.21253.770.06253.63257.98−4.35
24254.36254.240.12254.270.09254.24254.50−0.26
25254.30254.120.17254.32−0.02254.12254.34−0.22
26253.57253.340.23253.67−0.09253.34253.79−0.45
27252.81252.740.07253.28−0.47252.74255.22−2.48
28253.70253.510.19253.600.10253.51253.65−0.14
29254.31254.110.19254.50−0.19254.11254.56−0.45
3254.35254.250.10254.36−0.01254.25257.39−3.14
30253.13252.920.21253.29−0.16252.92256.91−3.99
31252.82252.640.18253.26−0.44252.64253.38−0.74
32254.71254.640.08254.81−0.10254.64257.33−2.69
33254.32254.160.16254.220.10254.16254.25−0.09
34252.93252.660.27253.33−0.40252.66253.42−0.76
35254.05253.920.13254.07−0.02253.92258.56−4.64
36253.91253.780.12253.620.28253.78255.87−2.09
37252.79252.670.12253.28−0.49252.67254.31−1.63
38253.75253.560.18254.00−0.25253.56254.45−0.89
39252.88253.04−0.16253.46−0.58253.04253.70−0.66
4253.15252.860.29254.30−1.15252.86258.28−5.42
40253.72253.620.10253.89−0.17253.62256.09−2.47
41254.43254.220.21254.400.03254.22254.46−0.24
42253.77253.560.21253.600.17253.56253.85−0.29
43252.69252.84−0.15253.35−0.66252.84253.38−0.53
44254.16253.880.28254.110.05253.88254.13−0.25
45254.34254.150.19254.330.01254.15254.43−0.28
46252.80252.610.19252.640.15252.61252.67−0.06
47253.64253.390.25253.72−0.07253.39253.75−0.36
48254.17254.030.14253.990.18254.03257.90−3.86
49252.91252.750.16252.910.00252.75254.79−2.05
5254.09253.870.22254.34−0.25253.87260.84−6.97
50253.89253.620.27253.850.04253.62253.90−0.28
51254.18253.960.22253.470.71253.96254.12−0.16
52253.09252.860.23252.880.21252.86253.22−0.37
53253.02252.730.30253.06−0.04252.73253.12−0.39
54252.74252.710.03252.80−0.06252.71252.82−0.11
55253.55253.360.19253.540.01253.36253.73−0.37
56252.83252.720.11252.780.05252.72253.28−0.55
57252.76252.630.13252.81−0.05252.63252.94−0.31
58253.61253.350.26253.62−0.01253.35256.66−3.31
59254.27254.160.11254.260.01254.16255.25−1.08
6253.14253.020.12254.36−1.22253.02261.32−8.30
60252.84252.670.17252.750.08252.67252.85−0.18
61253.54253.470.07253.61−0.07253.47253.72−0.25
62252.97252.950.02253.21−0.25252.95253.36−0.41
63253.77253.620.15253.680.10253.62254.39−0.77
64252.81252.780.03252.96−0.15252.78253.06−0.28
65253.70253.590.11253.690.01253.59253.76−0.17
66252.72252.73−0.01252.93−0.20252.73252.97−0.24
67252.69253.04−0.35252.82−0.13253.04252.940.10
68252.84252.740.09252.810.02252.74252.94−0.20
69253.09252.910.18253.080.01252.91253.08−0.17
7254.24254.090.16254.32−0.08254.09255.47−1.38
70252.75252.80−0.05252.82−0.07252.80252.87−0.07
71252.89252.800.09252.860.03252.80255.35−2.55
72252.52252.450.07252.490.04252.45252.75−0.30
73252.65252.480.17252.430.22252.48252.75−0.27
74252.66252.520.14252.250.41252.52252.61−0.09
75252.74252.550.19252.620.12252.55252.76−0.21
76252.40252.350.04252.140.25252.35255.56−3.20
77252.72252.490.23252.660.07252.49253.72−1.23
78252.56252.64−0.08252.130.43252.64253.93−1.30
79252.43252.310.12252.020.41252.31255.57−3.27
8253.04252.870.18254.30−1.26252.87259.57−6.71
80253.03252.820.21253.000.02252.82257.19−4.37
81252.42252.57−0.16252.350.07252.57254.60−2.03
82252.88252.760.12252.820.06252.76256.61−3.85
83252.31252.55−0.24252.32−0.01252.55253.10−0.56
84251.84251.90−0.06251.92−0.09251.90251.97−0.07
85251.74251.90−0.17251.74−0.01251.90253.57−1.67
86252.30252.130.16252.32−0.03252.13252.85−0.72
87251.79251.760.03251.780.01251.76253.75−1.98
88252.71252.570.14252.640.07252.57254.97−2.40
89253.18253.060.12253.150.03253.06253.24−0.18
9254.31254.120.19254.37−0.06254.12254.43−0.31
90251.49251.350.14251.72−0.24251.35252.23−0.88
91253.34253.200.14253.190.15253.20258.76−5.56
92251.52251.53−0.01251.75−0.23251.53252.22−0.69
93252.55252.350.20252.520.03252.35258.35−6.00
94252.57252.380.19252.63−0.06252.38257.64−5.25
95251.38251.42−0.04251.47−0.08251.42252.02−0.59
96251.41251.240.17251.55−0.14251.24251.97−0.73
97252.54252.410.13252.430.11252.41252.56−0.14
98251.41251.61−0.20251.46−0.05251.61251.75−0.14
99252.52252.310.21252.56−0.04252.31252.56−0.25
f1253.90253.900.00254.33−0.43253.90255.04−1.14
f10252.91252.93−0.02253.17−0.26252.93253.24−0.31
f10p252.96252.920.03253.16−0.21252.92253.23−0.31
f11252.22252.210.00252.42−0.20252.21252.42−0.21
f11p252.23252.210.01252.42−0.19252.21252.42−0.21
f12252.07252.19−0.12251.680.39252.19252.050.14
f13252.09252.090.00251.390.70252.09251.980.11
f14252.94252.930.01253.10−0.16252.93253.55−0.62
f14p252.95252.930.01253.10−0.16252.93253.55−0.61
f15253.40253.360.03253.41−0.02253.36253.60−0.24
f15p253.35253.36−0.01253.41−0.06253.36253.60−0.24
f1p253.85253.90−0.05254.33−0.48253.90255.03−1.13
f2253.79253.87−0.08254.35−0.55253.87254.40−0.53
f2p253.76253.87−0.11254.35−0.59253.87254.40−0.53
f3253.22253.200.02253.41−0.19253.20253.46−0.26
f3p253.21253.200.01253.41−0.20253.20253.46−0.26
f4255.76255.80−0.04255.95−0.20255.80255.96−0.16
f4p255.78255.80−0.02255.96−0.18255.80255.96−0.16
f5254.91254.94−0.03255.11−0.20254.94255.15−0.21
f5p254.92254.94−0.02255.11−0.19254.94255.15−0.21
f6253.98253.960.02253.480.50253.96254.12−0.15
f6p253.96253.960.00253.470.49253.96254.11−0.15
f7253.24253.240.00253.49−0.26253.24253.54−0.31
f7p253.23253.23−0.01253.49−0.26253.23253.54−0.31
f8252.67252.69−0.02252.93−0.26252.69252.96−0.27
f8p252.66252.69−0.03252.93−0.27252.69252.96−0.27
f9252.88252.840.04252.95−0.07252.84253.22−0.37
f9p252.90252.840.06252.95−0.05252.84253.22−0.37
M I N d H [m]0.00 0.00 0.00
M A X d H [m]0.751.429.02
M E A N d H [m]0.130.241.40
σ d H   m 0.170.392.28
σ σ d H   m 0.06 0.130.75

Appendix B

Table A2. Comparison of point heights read automatically from the DEM rasters created from field surveys using the GNSS RTN technique; source: own elaboration.
Point No H R T N i [ m ] H D E M R T N i [ m ] d H R T N D E M i [ m ] H D E M R T N i [ m ] d H R T N D E M i [ m ] H D E M R T N i [ m ] d H R T N D E M i [ m ] H D E M R T N i [ m ] d H R T N D E M i [ m ]
TRIANGULATIONINVERSE DISTANCENATURAL
NEIGHBOUR
NEAREST
NEIGHBOUR
12345678910
1254.55254.460.09254.430.12254.460.09254.540.01
10253.10253.27−0.16253.26−0.16253.26−0.16253.11−0.01
100252.08252.070.01252.070.01252.060.02252.080.00
101252.16252.130.03252.140.01252.130.02252.160.00
102252.15252.120.03252.140.01252.120.03252.150.00
103252.21252.180.02252.190.02252.180.03252.210.00
104251.31251.41−0.10251.38−0.07251.44−0.13251.310.00
105251.63251.65−0.02251.65−0.02251.67−0.04251.630.00
106251.70251.690.01251.700.00251.700.01251.700.00
107251.32251.36−0.04251.34−0.02251.37−0.05251.320.00
108251.82251.84−0.01251.83−0.01251.85−0.02251.820.00
109251.39251.40−0.01251.40−0.01251.40−0.02251.390.00
11254.60254.510.09254.470.13254.510.09254.600.00
110251.33251.36−0.02251.35−0.02251.36−0.02251.330.00
111251.37251.38−0.01251.39−0.02251.39−0.01251.370.00
112251.70251.75−0.04251.72−0.02251.77−0.07251.700.00
113252.070.00252.07252.070.000.00252.07252.070.00
114251.90251.96−0.06251.900.00251.98−0.09251.900.00
115251.92251.93−0.01251.920.00251.92−0.01251.920.00
116252.05252.06−0.01252.050.00252.07−0.01252.050.00
117252.96252.940.02252.960.00252.940.02252.960.00
118253.19253.190.00253.180.00253.190.00253.190.00
119252.90252.94−0.05252.92−0.02252.95−0.05252.900.00
12253.02253.16−0.15253.15−0.14253.18−0.17253.020.00
120253.66253.560.10253.630.03253.560.10253.660.00
121253.490.00253.49253.490.000.00253.49253.490.00
122252.77252.79−0.02252.770.00252.79−0.02252.770.00
123252.69252.72−0.02252.70−0.01252.72−0.03252.690.00
124252.89252.90−0.01252.890.00252.90−0.02252.890.00
125253.25253.250.00253.250.00253.250.00253.250.00
126253.29253.30−0.01253.300.00253.30−0.01253.290.00
127253.55253.540.01253.550.00253.540.02253.550.00
128253.63253.630.00253.630.00253.630.00253.630.00
129253.79253.770.02253.780.01253.770.02253.790.00
13254.65254.520.12254.530.11254.510.13254.640.00
130253.69253.680.01253.680.01253.680.01253.690.00
131253.48253.460.02253.480.00253.450.03253.480.00
132253.25253.250.01253.27−0.02253.250.01253.250.00
133253.56253.530.03253.540.02253.530.03253.560.00
134253.62253.560.05253.570.05253.550.06253.620.00
135252.92253.01−0.09253.00−0.07253.03−0.11252.93−0.01
136253.16253.19−0.03253.19−0.02253.19−0.03253.160.00
137253.27253.31−0.04253.29−0.02253.31−0.03253.270.00
138253.65253.600.05253.630.01253.590.05253.650.00
139253.75253.740.00253.740.00253.750.00253.740.00
14253.08253.22−0.14253.18−0.10253.24−0.16253.080.00
140253.96253.940.01253.950.01253.930.02253.960.00
141253.92253.910.00253.910.01253.910.01253.910.00
142253.72253.700.02253.710.01253.690.03253.720.00
15253.27253.37−0.10253.31−0.04253.38−0.11253.270.00
16253.84253.810.03253.750.09253.800.04253.820.02
17252.93253.08−0.15253.09−0.16253.11−0.18252.94−0.01
18253.04253.16−0.13253.15−0.11253.21−0.18253.040.00
19253.97253.940.04253.870.11253.900.08253.970.01
2253.30253.55−0.25253.52−0.22253.57−0.27253.34−0.04
20254.72254.710.01254.660.05254.710.01254.710.00
21254.72254.700.02254.680.05254.700.02254.720.00
22252.79252.96−0.17252.96−0.16253.03−0.24252.81−0.02
23253.84253.750.09253.720.12253.730.11253.810.02
24254.36254.320.04254.310.04254.290.06254.360.00
25254.30254.32−0.02254.280.02254.32−0.02254.300.00
26253.57253.58−0.01253.570.01253.59−0.01253.59−0.02
27252.81252.93−0.12252.99−0.18253.01−0.20252.87−0.06
28253.70253.560.14253.570.13253.540.15253.670.03
29254.31254.260.04254.240.07254.250.05254.300.00
3254.35254.180.17254.190.16254.160.19254.310.04
30253.13253.19−0.06253.18−0.06253.21−0.08253.130.00
31252.82252.92−0.10252.89−0.07252.96−0.14252.820.00
32254.71254.640.07254.630.08254.620.10254.710.00
33254.32254.280.04254.250.07254.260.06254.320.00
34252.93253.09−0.16253.01−0.07253.10−0.16252.930.00
35254.05254.020.03253.980.07254.010.04254.040.00
36253.91253.740.17253.710.20253.610.30253.850.06
37252.79252.98−0.18253.02−0.23253.00−0.21252.90−0.11
38253.75253.680.06253.660.08253.680.06253.720.02
39252.88252.96−0.09252.97−0.10252.98−0.10252.880.00
4253.15253.28−0.13253.35−0.20253.35−0.20253.18−0.03
40253.72253.77−0.05253.710.01253.78−0.06253.720.00
41254.430.00254.43254.390.030.00254.43254.430.00
42253.77253.660.11253.650.12253.570.20253.730.03
43252.69252.82−0.13252.85−0.15252.84−0.15252.70−0.01
44254.16254.150.01254.150.02254.160.00254.160.00
45254.34254.220.12254.300.04254.250.09254.340.00
46252.80252.84−0.04252.87−0.07252.85−0.05252.800.00
47253.64253.600.05253.620.03253.590.05253.640.00
48254.17254.090.08254.100.07254.080.09254.170.00
49252.91252.99−0.08252.99−0.08252.99−0.08252.910.00
5254.09253.910.18254.000.09253.900.19254.060.03
50253.89253.840.04253.890.00253.850.03253.890.00
51254.18253.870.31253.980.20253.860.32254.050.13
52253.09253.15−0.06253.30−0.22253.16−0.07253.14−0.06
53253.02253.05−0.02253.07−0.05253.05−0.03253.020.00
54252.74252.77−0.03252.77−0.03252.78−0.04252.740.00
55253.55253.56−0.01253.540.01253.56−0.02253.540.00
56252.83252.85−0.02252.84−0.01252.84−0.01252.830.00
57252.76252.79−0.04252.78−0.02252.79−0.03252.760.00
58253.61253.600.01253.600.01253.600.01253.610.00
59254.27254.130.14254.050.22254.100.17254.260.01
6253.14253.22−0.08253.30−0.16253.24−0.10253.15−0.01
60252.84252.93−0.10252.98−0.15252.94−0.11252.840.00
61253.54253.460.08253.420.12253.460.07253.450.09
62252.97253.04−0.07253.08−0.12253.06−0.09252.99−0.02
63253.77253.690.09253.700.08253.690.09253.770.00
64252.81252.84−0.03252.84−0.03252.84−0.04252.800.00
65253.70253.530.17253.500.20253.490.21253.690.01
66252.72252.79−0.07252.78−0.06252.79−0.07252.720.00
67252.69252.73−0.03252.72−0.03252.72−0.03252.690.00
68252.84252.820.02252.830.01252.800.03252.840.00
69253.09253.080.01253.080.01253.080.01253.090.00
7254.24254.140.10254.120.12254.140.11254.230.01
70252.75252.750.00252.750.00252.75−0.01252.750.00
71252.89252.890.00252.880.01252.890.00252.890.00
72252.52252.510.02252.510.01252.500.03252.520.00
73252.65252.590.05252.610.03252.570.07252.650.00
74252.66252.660.00252.69−0.03252.650.01252.660.00
75252.74252.730.01252.710.03252.730.01252.740.00
76252.40252.45−0.05252.43−0.04252.46−0.07252.400.00
77252.72252.710.01252.710.01252.710.01252.720.00
78252.56252.560.00252.560.00252.550.01252.560.00
79252.43252.45−0.02252.44−0.01252.45−0.02252.430.00
8253.04253.17−0.12253.20−0.16253.18−0.14253.05−0.01
80253.03252.970.06252.970.06252.960.07253.030.00
81252.42252.44−0.03252.44−0.02252.45−0.03252.420.00
82252.88252.730.15252.810.08252.740.14252.880.00
83252.31252.35−0.04252.38−0.07252.39−0.08252.33−0.02
84251.84251.88−0.04251.87−0.03251.90−0.07251.840.00
85251.74251.75−0.02251.76−0.02251.76−0.02251.740.00
86252.30252.290.00252.290.00252.31−0.02252.290.00
87251.79251.82−0.02251.82−0.03251.82−0.03251.790.00
88252.71252.640.07252.690.02252.660.06252.710.00
89253.18253.040.14253.020.16253.000.18253.140.04
9254.31254.290.03254.210.10254.260.06254.310.01
90251.49251.60−0.11251.62−0.13251.65−0.16251.490.00
91253.34253.210.13253.230.11253.150.18253.340.00
92251.52251.60−0.08251.60−0.08251.63−0.11251.520.00
93252.55252.520.04252.520.04252.510.04252.550.00
94252.57252.500.06252.510.05252.500.07252.570.00
95251.38251.43−0.05251.42−0.04251.43−0.05251.380.00
96251.41251.46−0.05251.45−0.04251.47−0.06251.410.00
97252.54252.510.03252.510.04252.500.05252.540.00
98251.41251.43−0.03251.43−0.03251.43−0.03251.410.00
99252.520.00252.52252.510.010.00252.52252.520.00
f1253.90253.92−0.03253.870.02253.96−0.06253.870.03
f10252.91252.92−0.01252.99−0.08252.910.00253.05−0.14
f10p252.96252.900.05252.99−0.03252.900.06253.05−0.09
f11252.22252.210.00252.210.00252.210.01252.22−0.01
f11p252.23252.210.02252.210.01252.210.02252.220.00
f12252.07252.060.01252.070.00252.070.01252.070.00
f13252.09252.060.02252.080.00252.080.01252.090.00
f14252.94252.940.00252.950.00252.950.00252.940.00
f14p252.95252.940.00252.950.00252.950.00252.940.00
f15253.40253.390.01253.380.02253.370.03253.370.02
f15p253.35253.39−0.04253.38−0.02253.37−0.01253.37−0.02
f1p253.85253.92−0.08253.87−0.03253.96−0.11253.87−0.02
f2253.79253.790.00253.770.02253.760.03253.770.02
f2p253.76253.79−0.04253.77−0.02253.760.00253.77−0.02
f3253.22253.210.01253.220.00253.200.02253.220.00
f3p253.21253.210.01253.22−0.01253.200.01253.22−0.01
f4255.760.00255.76255.750.000.00255.76255.76−0.01
f4p255.780.00255.78255.750.020.00255.78255.760.02
f5254.91254.910.00254.900.01254.900.00254.91−0.01
f5p254.92254.910.01254.900.02254.900.01254.910.01
f6253.98253.850.14253.980.00253.840.14254.04−0.05
f6p253.96253.840.12253.98−0.02253.840.12254.04−0.08
f7253.24253.31−0.07253.25−0.01253.32−0.08253.26−0.02
f7p253.23253.31−0.08253.25−0.02253.31−0.09253.26−0.03
f8252.67252.78−0.11252.70−0.03252.82−0.15252.670.01
f8p252.66252.78−0.12252.70−0.04252.81−0.15252.67−0.01
f9252.88252.880.01252.880.00252.870.01252.89−0.01
f9p252.90252.880.03252.880.02252.870.03252.890.01
M I N d H [m]0.00 0.00 0.00 0.00
M A X d H [m]255.780.23255.780.14
M E A N d H [m]9.020.059.030.01
σ d H   m 47.860.0847.860.02
σ σ d H   m 15.79 0.03 15.79 0.01

References

  1. Janke, J.R. Multicriteria GIS Modeling of Wind and Solar Farms in Colorado. Renew. Energy 2010, 35, 2228–2234. [Google Scholar] [CrossRef]
  2. Ahmad, A.; Khalid, S.; Qaisar, S.H.; Gourav, T. The Contemporary Scenario of Indian Renewable Energy Sector. Int. Res. J. Environ. Sci. 2014, 3, 82–89. [Google Scholar]
  3. Manzano-Agugliaro, F.; Taher, M.; Zapata-Sierra, A.; Juaidi, A.; Montoya, F.G. An Overview of Research and Energy Evolution for Small Hydropower in Europe. Renew. Sustain. Energy Rev. 2017, 75, 476–489. [Google Scholar] [CrossRef]
  4. Igliński, B. Hydro Energy in Poland: The History, Current State, Potential, SWOT Analysis, Environmental Aspects. Int. J. Energy Water Resour. 2019, 3, 61–72. [Google Scholar] [CrossRef] [Green Version]
  5. Tamm, O.; Tamm, T. Verification of a Robust Method for Sizing and Siting the Small Hydropower Run-of-River Plant Potential by Using GIS. Renew. Energy 2020, 155, 153–159. [Google Scholar] [CrossRef]
  6. Shu, J.; Qu, J.J.; Motha, R.; Xu, J.C.; Dong, D.F. Impacts of Climate Change on Hydropower Development and Sustainability: A Review. IOP Conf. Ser. Earth Environ. Sci. 2018, 163, 12126. [Google Scholar] [CrossRef]
  7. Singh, V.K.; Singal, S.K. Operation of Hydro Power Plants-a Review. Renew. Sustain. Energy Rev. 2017, 69, 610–619. [Google Scholar] [CrossRef]
  8. Botelho, A.; Ferreira, P.; Lima, F.; Pinto, L.M.C.; Sousa, S. Assessment of the Environmental Impacts Associated with Hydropower. Renew. Sustain. Energy Rev. 2017, 70, 896–904. [Google Scholar] [CrossRef]
  9. Kumar Sharma, A.; Thakur, N.S. Assessing the Impact of Small Hydropower Projects in Jammu and Kashmir: A Study from North-Western Himalayan Region of India. Renew. Sustain. Energy Rev. 2017, 80, 679–693. [Google Scholar] [CrossRef]
  10. Ioannidou, C.; O’Hanley, J.R. Eco-Friendly Location of Small Hydropower. Eur. J. Oper. Res. 2018, 264, 907–918. [Google Scholar] [CrossRef] [Green Version]
  11. Larentis, D.G.; Collischonn, W.; Olivera, F.; Tucci, C.E.M. Gis-Based Procedures for Hydropower Potential Spotting. Energy 2010, 35, 4237–4243. [Google Scholar] [CrossRef]
  12. Kentel, E.; Alp, E. Hydropower in Turkey: Economical, Social and Environmental Aspects and Legal Challenges. Environ. Sci. Policy 2013, 31, 34–43. [Google Scholar] [CrossRef]
  13. European Small Hydropower Association—ESHA. Guide on How to Develop a Small Hydropower Plant; European Small Hydropower Association: Bruxelles, Belgium, 2004; 151p. [Google Scholar]
  14. Pang, M.; Zhang, L.; Ulgiati, S.; Wang, C. Ecological Impacts of Small Hydropower in China: Insights from an Energy Analysis of a Case Plant. Energy Policy 2015, 76, 112–122. [Google Scholar] [CrossRef]
  15. Berga, L. The Role of Hydropower in Climate Change Mitigation and Adaptation: A Review. Engineering 2016, 2, 313–318. [Google Scholar] [CrossRef] [Green Version]
  16. Morales, S.; Álvarez, C.; Acevedo, C.; Diaz, C.; Rodriguez, M.; Pacheco, L. An Overview of Small Hydropower Plants in Colombia: Status, Potential, Barriers and Perspectives. Renew. Sustain. Energy Rev. 2015, 50, 1650–1657. [Google Scholar] [CrossRef]
  17. Wagner, B.; Hauer, C.; Schoder, A.; Habersack, H. A Review of Hydropower in Austria: Past, Present and Future Development. Renew. Sustain. Energy Rev. 2015, 50, 304–314. [Google Scholar] [CrossRef]
  18. Ahlborg, H.; Sjöstedt, M. Small-Scale Hydropower in Africa: Socio-Technical Designs for Renewable Energy in Tanzanian Villages. Energy Res. Soc. Sci. 2015, 5, 20–33. [Google Scholar] [CrossRef] [Green Version]
  19. Odiji, C.; Adepoju, M.; Ibrahim, I.; Adedeji, O.; Nnaemeka, I.; Aderoju, O. Small Hydropower Dam Site Suitability Modelling in Upper Benue River Watershed, Nigeria. Appl. Water Sci. 2021, 11, 136. [Google Scholar] [CrossRef]
  20. Othman, A.A.; Al-Maamar, A.F.; Al-Manmi, D.A.; Liesenberg, V.; Hasan, S.E.; Obaid, A.K.; Al-Quraishi, A.M.F. GIS-Based Modeling for Selection of Dam Sites in the Kurdistan Region, Iraq. ISPRS Int. J. Geo Inf. 2020, 9, 244. [Google Scholar] [CrossRef] [Green Version]
  21. Al-Juboori, A.M.; Guven, A. Hydropower Plant Site Assessment by Integrated Hydrological Modeling, Gene Expression Programming and Visual Basic Programming. Water Resour. Manag. 2016, 30, 2517–2530. [Google Scholar] [CrossRef]
  22. Bezabih, A.W. Evaluation of Small Hydropower Plant at Ribb Irrigation Dam in Amhara Regional State, Ethiopia. Environ. Syst. Res. 2021, 10, 1. [Google Scholar] [CrossRef]
  23. Rojanamon, P.; Chaisomphob, T.; Bureekul, T. Application of Geographical Information System to Site Selection of Small Run-of-River Hydropower Project by Considering Engineering/Economic/Environmental Criteria and Social Impact. Renew. Sustain. Energy Rev. 2009, 13, 2336–2348. [Google Scholar] [CrossRef]
  24. Yi, C.-S.; Lee, J.-H.; Shim, M.-P. Site Location Analysis for Small Hydropower Using Geo-Spatial Information System. Renew. Energy 2010, 35, 852–861. [Google Scholar] [CrossRef]
  25. Ballance, A.; Stephenson, D.; Chapman, R.A.; Muller, J. A Geographic Information Systems Analysis of Hydro Power Potential in South Africa. J. Hydroinform. 2000, 2, 247–254. [Google Scholar] [CrossRef] [Green Version]
  26. Cai, X.; Ye, F.; Gholinia, F. Application of Artificial Neural Network and Soil and Water Assessment Tools in Evaluating Power Generation of Small Hydropower Stations. Energy Rep. 2020, 6, 2106–2118. [Google Scholar] [CrossRef]
  27. Palla, A.; Gnecco, I.; La Barbera, P.; Ivaldi, M.; Caviglia, D. An Integrated GIS Approach to Assess the Mini Hydropower Potential. Water Resour. Manag. 2016, 30, 2979–2996. [Google Scholar] [CrossRef]
  28. Jeftenić, G.; Rašeta, A.; Kolaković, S.; Panić, M.; Kolaković, S.; Mandić, V. A Methodology Proposal for Selecting the Optimal Location for Small Hydropower Plants. Teh. Vjesn. 2021, 28, 1462–1470. [Google Scholar] [CrossRef]
  29. Yuksel, I.; Demirel, I.H. Investigation of the Optimal Method for Determining Hydropower Potential of Small Streams: A Case Study Batman Basin in Turkey. Arab. J. Geosci. 2021, 14, 580. [Google Scholar] [CrossRef]
  30. Connolly, D.; MacLaughlin, S.; Leahy, M. Development of a Computer Program to Locate Potential Sites for Pumped Hydroelectric Energy Storage. Energy 2010, 35, 375–381. [Google Scholar] [CrossRef]
  31. Kusre, B.C.; Baruah, D.C.; Bordoloi, P.K.; Patra, S.C. Assessment of Hydropower Potential Using GIS and Hydrological Modeling Technique in Kopili River Basin in Assam (India). Appl. Energy 2010, 87, 298–309. [Google Scholar] [CrossRef]
  32. Ramachandra, T.V.; Shruthi, B.V. Spatial Mapping of Renewable Energy Potential. Renew. Sustain. Energy Rev. 2007, 11, 1460–1480. [Google Scholar] [CrossRef]
  33. Hall, D.G.; Cherry, S.J.; Reeves, K.S.; Lee, R.D.; Carroll, G.R.; Sommers, G.L.; Verdin, K.L. Water Energy Resources of the United States with Emphasis on Low Head/Low Power Resources; U.S. Department of Energy Office of Scientific and Technical Information: Washington, DC, USA, 2004. [CrossRef]
  34. Wang, M.; Hjelmfelt, A.; Garbrecht, J. DEM Aggregation for Watershed Modeling. J. Am. Water Resour. Assoc. 2007, 36, 579–584. [Google Scholar] [CrossRef]
  35. Papadaki, M.; Andonidakis, E.; Tsoutsos, T.; Stavrakakis, G. A Multicriteria Decision Making Methodology for Sustainable Energy Development. Fresenius Environ. Bull. 2003, 12, 426–430. [Google Scholar]
  36. Watson, J.J.W.; Hudson, M.D. Regional Scale Wind Farm and Solar Farm Suitability Assessment Using GIS-Assisted Multi-Criteria Evaluation. Landsc. Urban Plan. 2015, 138, 20–31. [Google Scholar] [CrossRef]
  37. Hallam, C.R.A.; Alarco, L.; Flannery, W.; Leffel, A. GIS Decision Model for Global Replication of Hybrid Closed-Loop Renewable Energy Systems. In Proceedings of the PICMET ’12: Technology Management for Emerging Technologies, Vancouver, BC, Canada, 29 July–2 August 2012; pp. 2832–2841. [Google Scholar]
  38. Jankowski, P. Integrating Geographical Information Systems and Multiple Criteria Decision-Making Methods. Int. J. Geogr. Inf. Syst. 1995, 9, 251–273. [Google Scholar] [CrossRef]
  39. Jeong, J.S.; Ramírez-Gómez, Á. Renewable Energy Management to Identify Suitable Biomass Facility Location with GIS-Based Assessment for Sustainable Environment. Energy Procedia 2017, 136, 139–144. [Google Scholar] [CrossRef]
  40. Perpiñá Castillo, C.; Martinez-Llario, J.; Pérez-Navarro, A. Multicriteria Assessment in GIS Environments for Siting Biomass Plants. Land Use Policy 2013, 31, 326–335. [Google Scholar] [CrossRef]
  41. Mladineo, N.; Margeta, J.; Brans, J.P.; Mareschal, B. Multicriteria Ranking of Alternative Locations for Small Scale Hydro Plants. Eur. J. Oper. Res. 1987, 31, 215–222. [Google Scholar] [CrossRef]
  42. Tzoraki, O. Operating Small Hydropower Plants in Greece under Intermittent Flow Uncertainty: The Case of Tsiknias River (Lesvos). Challenges 2020, 11, 17. [Google Scholar] [CrossRef]
  43. Serpoush, B.; Khanian, M.; Shamsai, A. Hydropower Plant Site Spotting Using Geographic Information System and a MATLAB Based Algorithm. J. Clean. Prod. 2017, 152, 7–16. [Google Scholar] [CrossRef]
  44. Cyr, J.-F.; Landry, M.; Gagnon, Y. Methodology for the Large-Scale Assessment of Small Hydroelectric Potential: Application to the Province of New Brunswick (Canada). Renew. Energy 2011, 36, 2940–2950. [Google Scholar] [CrossRef]
  45. Setiawan, D. Potential Sites Screening for Mini Hydro Power Plant Development in Kapuas Hulu, West Kalimantan: A GIS Approach. Energy Procedia 2015, 65, 76–82. [Google Scholar] [CrossRef] [Green Version]
  46. Panić, M.; Urošev, M.; Milanović Pešić, A.; Brankov, J.; Bjeljac, Ž. Small Hydropower Plants in Serbia: Hydropower Potential, Current State and Perspectives. Renew. Sustain. Energy Rev. 2013, 23, 341–349. [Google Scholar] [CrossRef]
  47. Belmonte, S.; Núñez, V.; Viramonte, J.G.; Franco, J. Potential Renewable Energy Resources of the Lerma Valley, Salta, Argentina for Its Strategic Territorial Planning. Renew. Sustain. Energy Rev. 2009, 13, 1475–1484. [Google Scholar] [CrossRef]
  48. Susilowati, Y.; Irasari, P.; Kumoro, Y.; Nur, W.H.; Yunarto, Y. Micro Hydropower Plant Potential Study Based on Landsat 8 Operational Land Imager Satellite Data. Bull. Electr. Eng. Inform. 2021, 10, 3167–3177. [Google Scholar] [CrossRef]
  49. Carapellucci, R.; Giordano, L.; Pierguidi, F. Techno-Economic Evaluation of Small-Hydro Power Plants: Modelling and Characterisation of the Abruzzo Region in Italy. Renew. Energy 2015, 75, 395–406. [Google Scholar] [CrossRef]
  50. Kaldellis, J.K. The Contribution of Small Hydro Power Stations to the Electricity Generation in Greece: Technical and Economic Considerations. Energy Policy 2007, 35, 2187–2196. [Google Scholar] [CrossRef]
  51. Tsoutsos, T.; Maria, E.; Mathioudakis, V. Sustainable Siting Procedure of Small Hydroelectric Plants: The Greek Experience. Energy Policy 2007, 35, 2946–2959. [Google Scholar] [CrossRef]
  52. Nur, W.H.; Yuliana, Y.; Susilowati, Y.; Kumoro, Y.; Yunarto, Y. Overview about GIS Multi-Criteria Spatial Analysis for Micro Hydropower Plant Site Suitability in South Ogan Komering Ulu District, South Sumatera, Indonesia. Bull. Electr. Eng. Inform. 2021, 10, 1024–1034. [Google Scholar] [CrossRef]
  53. Punys, P.; Dumbrauskas, A.; Kvaraciejus, A.; Vyciene, G. Tools for Small Hydropower Plant Resource Planning and Development: A Review of Technology and Applications. Energies 2011, 4, 1258–1277. [Google Scholar] [CrossRef] [Green Version]
  54. Coskun, H.G.; Alganci, U.; Eris, E.; Agıralioglu, N.; Cigizoglu, H.K.; Yilmaz, L.; Toprak, Z.F. Remote Sensing and GIS Innovation with Hydrologic Modelling for Hydroelectric Power Plant (HPP) in Poorly Gauged Basins. Water Resour. Manag. 2010, 24, 3757–3772. [Google Scholar] [CrossRef]
  55. Zonkouan, B.R.V.; Bachri, I.; Beda, A.H.J.; N’Guessan, K.A.M. Monitoring Spatial and Temporal Scales of Shoreline Changes in Lahou-Kpanda (Southern Ivory Coast) Using Landsat Data Series (TM, ETM+ and OLI). Geomat. Environ. Eng. 2021, 16, 145–158. [Google Scholar] [CrossRef]
  56. Koulibaly, C.T.; Ayoade, J.O. The Application of GIS and Remote Sensing in a Spatiotemporal Analysis of Coastline Retreat in Rufisque, Senegal. Geomat. Environ. Eng. 2021, 15, 55–80. [Google Scholar] [CrossRef]
  57. Dudhani, S.; Sinha, A.K.; Inamdar, S.S. Assessment of Small Hydropower Potential Using Remote Sensing Data for Sustainable Development in India. Energy Policy 2006, 34, 3195–3205. [Google Scholar] [CrossRef]
  58. Mączyńska, A.; Kwartnik-Pruc, A. Accuracy of determination of the running of the shoreline on orthophotomap. In Proceedings of the Geographic Information Systems Conference and Exhibition “GIS ODYSSEY 2018”, Perugia, Italy, 11–14 September 2018; pp. 346–353. [Google Scholar]
  59. O’Donnell, G.; Nijssen, B.; Lettenmaier, D.P. A Simple Algorithm for Generating Streamflow Networks for Grid-Based, Macroscale Hydrological Models. Hydrol. Process. 1999, 13, 1269–1275. [Google Scholar] [CrossRef]
  60. Reed, S. Deriving Flow Directions for Coarse-Resolution (1–4 Km) Grided Hydrologic Modeling. Water Resour. Res. 2003, 39, 3–11. [Google Scholar] [CrossRef]
  61. Suliman, M.; Samiullah, S.; Ali, M. Identification of Potential Groundwater Recharge Sites in a Semi-Arid Region of Pakistan Using Saaty’s Analytical Hierarchical Process (AHP). Geomat. Environ. Eng. 2021, 16, 53–70. [Google Scholar] [CrossRef]
  62. Olivera, F.; Lear, M.S.; Famiglietti, J.S.; Asante, K. Extracting Low-resolution River Networks from High-resolution Digital Elevation Models. Water Resour. Res. 2002, 38, 13–18. [Google Scholar] [CrossRef] [Green Version]
  63. Paz, A.R.; Collischonn, W. River Reach Length and Slope Estimates for Large-Scale Hydrological Models Based on a Relatively High-Resolution Digital Elevation Model. J. Hydrol. 2007, 343, 127–139. [Google Scholar] [CrossRef]
  64. Zhao, Z.; Benoy, G.; Chow, T.L.; Rees, H.W.; Daigle, J.-L.; Meng, F.-R. Impacts of Accuracy and Resolution of Conventional and LiDAR Based DEMs on Parameters Used in Hydrologic Modeling. Water Resour. Manag. 2010, 24, 1363–1380. [Google Scholar] [CrossRef]
  65. Endreny, T.A.; Wood, E.F. Maximizing Spatial Congruence of Observed and DEM-Delineated Overland Flow Networks. Int. J. Geogr. Inf. Sci. 2003, 17, 699–713. [Google Scholar] [CrossRef]
  66. Sobura, S. Calibration of Non-Metric UAV Camera Using Different Test Fields. Geod. Cartogr. 2021, 47, 111–117. [Google Scholar] [CrossRef]
  67. Ćwiąkała, P.; Gruszczyński, W.; Stoch, T.; Puniach, E.; Mrocheń, D.; Matwij, W.; Matwij, K.; Nędzka, M.; Sopata, P.; Wójcik, A. UAV Applications for Determination of Land Deformations Caused by Underground Mining. Remote Sens. 2020, 12, 1733. [Google Scholar] [CrossRef]
  68. Puniach, E.; Gruszczyński, W.; Ćwiąkała, P.; Matwij, W. Application of UAV-Based Orthomosaics for Determination of Horizontal Displacement Caused by Underground Mining. ISPRS J. Photogramm. Remote Sens. 2021, 174, 282–303. [Google Scholar] [CrossRef]
  69. Gruszczyński, W.; Matwij, W.; Ćwiąkała, P. Comparison of Low-Altitude UAV Photogrammetry with Terrestrial Laser Scanning as Data-Source Methods for Terrain Covered in Low Vegetation. ISPRS J. Photogramm. Remote Sens. 2017, 126, 168–179. [Google Scholar] [CrossRef]
  70. Cienciała, A.; Sobolewska-Mikulska, K.; Sobura, S. Credibility of the Cadastral Data on Land Use and the Methodology for Their Verification and Update. Land Use Policy 2021, 102, 105204. [Google Scholar] [CrossRef]
  71. Akay, A.E.; Oğuz, H.; Karas, I.R.; Aruga, K. Using LiDAR Technology in Forestry Activities. Environ. Monit. Assess. 2009, 151, 117–125. [Google Scholar] [CrossRef]
  72. Susaki, J. Adaptive Slope Filtering of Airborne LiDAR Data in Urban Areas for Digital Terrain Model (DTM) Generation. Remote Sens. 2012, 4, 1804–1819. [Google Scholar] [CrossRef] [Green Version]
  73. Liu, H.; Zhao, Y.; Wang, L.; Liu, Y. Comparison of DEM Accuracies Generated from Different Stereo Pairs over a Plateau Mountainous Area. J. Mt. Sci. 2021, 18, 1580–1590. [Google Scholar] [CrossRef]
  74. Singh, M.K.; Snehmani; Gupta, R.D.; Bhardwaj, A.; Joshi, P.K.; Ganju, A. High Resolution DEM Generation for Complex Snow Covered Indian Himalayan Region Using ADS80 Aerial Push-Broom Camera: A First Time Attempt. Arab. J. Geosci. 2015, 8, 1403–1414. [Google Scholar] [CrossRef]
  75. Gołuch, P.; Borkowski, A.; Jóźków, G. Badanie Dokładności NMT Interpolowanego Na Podstawie Danych Lotniczego Skaningu Laserowego Systemu ScaLARS/Study of Accuracy of DTM Interpolated from Airborne Laser Scanning Data of ScaLARS System. Acta Sci. Pol. Geod. Dercr. Terrarum 2008, 7, 37–47. [Google Scholar]
  76. Liu, X. Accuracy Assessment of Lidar Elevation Data Using Survey Marks. Surv. Rev. 2011, 43, 80–93. [Google Scholar] [CrossRef] [Green Version]
  77. Estornell, J.; Ruiz, L.A.; Velázquez-Martí, B.; Hermosilla, T. Analysis of the Factors Affecting LiDAR DTM Accuracy in a Steep Shrub Area. Int. J. Digit. Earth 2011, 4, 521–538. [Google Scholar] [CrossRef] [Green Version]
  78. Voivontas, D.; Assimacopoulos, D.; Mourelatos, A.; Corominas, J. Evaluation of Renewable Energy Potential Using a GIS Decision Support System. Renew. Energy 1998, 13, 333–344. [Google Scholar] [CrossRef]
  79. Koślacz, R.; Suligowski, R.; Szymanek, B.; Daszkiewicz, J. Small Retention Program for the Świętokrzyskie Voivodeship; No. 071; Świętokrzyski Board of Amelioration and Water Facilities in Kielce: Kielce, Poland, 2006. [Google Scholar]
  80. Wywiał, M. BLS from RTK. Is it worth it? Geodata 2019, 6, 18–21. [Google Scholar]
  81. Węzyk, P. Handbook for Participants of Training with the Use of LIDAR.; GUGIK: Warsaw, Poland, 2015. [Google Scholar]
  82. Maslanka, M. Technical Specification of Products Developed under the Task Acquiring Altitude Data in Aviation Laser Scanning Technology; GUGIK: Warsaw, Poland, 2015. [Google Scholar]
  83. Pawłuszek, K.; Borkowski, A.; Ziaja, M. Ocena Dokładności Wysokościowej Danych Lotniczego Skaningu Laserowego Systemu ISOK Na Obszarze Doliny Rzeki Widawy. Acta Sci. Pol. Geod. Descr. Terrarum 2014, 13, 27–37. [Google Scholar]
  84. Ćwiąkała, P.; Gabryszuk, J.; Krawczy, K.; Krzyżek, R.; Leń, P.; Oleniacz, G.; Puniach, E.; Siejka, Z.; Justyna, W.-L. GNSS Technology and Its Application in Realization and Control Measurements; WSIE: Rzeszów, Poland, 2015. [Google Scholar]
  85. Olaya, V.; Conrad, O. Chapter 12. Geomorphometry in SAGA. In Geomorphometry; Hengl, T., Reuter, H., Eds.; Elsevier: Amsterdam, The Netherlands, 2009; Volume 33, pp. 293–308. [Google Scholar] [CrossRef]
  86. Dąbrowski, A. The Concept of Locating Small Hydropower Plants on the Example of the Gwda River. Master’s Thesis, University of Adam Mickiewicz in Poznań, Poznań, Poland, 2012. [Google Scholar]
  87. Regulations Commission Delegated Regulation (EU) 2019/945 of 12 March 2019 on Unmanned Aircraft Systems and on Third-Country Operators of Unmanned Aircraft Systems; The European Commission: Luxembourg, 2019.
  88. Commission Implementing Regulation (EU) 2019/947 of 24 May 2019 on the Rules and Procedures for the Operation of Unmanned Aircraft; The European Commission: Luxembourg, 2019.
Figure 1. Diagram of the conducted analyses.
Energies 15 01527 g001
Figure 2. Location of the analysed area, (a) general location, (b) detailed location.
Energies 15 01527 g002
Figure 3. Orthophotomosaic illustrating the subject of the analyses and the surrounding area; source: orthophotomosaic created by Szymon Sobura.
Energies 15 01527 g003
Figure 4. Points measured in the field using GNSS RTN method against orthophotomosaic; source: orthophotomosaic created by Szymon Sobura; measurement and drawing—own elaboration.
Energies 15 01527 g004
Figure 5. Comparison of “cloud to cloud” heights.
Energies 15 01527 g005
Figure 6. Location of selected cross-sections; orthophotomosaic created by Szymon Sobura; illustration—own elaboration.
Energies 15 01527 g006
Figure 7. Slope map generated from the DEM created based on survey data using photogrammetric methods with the UAV and LIDAR; source: own elaboration.
Energies 15 01527 g007
Figure 8. Flow accumulation map generated from DEM created based on surveying data by photogrammetric methods using UAV, LIDAR and GNSS/RTN; source: own elaboration.
Energies 15 01527 g008
Figure 9. Flow map generated from the DEM created based on surveying data by photogrammetric methods using UAV, LIDAR and GNSS/RTN; source: own elaboration.
Energies 15 01527 g009
Table 1. Multi-criteria analysis of the elements essential to select the location for the construction of small hydroelectric power plants; source: own elaboration.
Environmental/Ecological Criteria
in the Context of Minimising the Impact of Building Structures on the Surrounding Environment
Economic Criteria
in the Context of Increasing the Efficiency of Small Hydropower Plants
Social Criteria
in the Context of the Profits from the Construction of the Power Plant for the Local Society
Topographic and Geological Criteria Technical (Engineering) Criteria
in the Context of Increasing the Efficiency of Small Hydropower Plants
Hydrological CriteriaLegal and Administrative Criteria
in the Context of Constraints Related to the Possibility of Building and Locating Structures
  • Maintaining minimum flow of the water course
  • Minimisation of flooded area
  • Maintaining stability of slopes
  • Low movement of earth masses
  • The least possi-ble disturbance of the water-course ecosystem
  • Maintaining direction of watercourse flow
  • Maintaining water quality in watercourse
  • Valuation of investment costs, costs of maintenance and operation of a water plant in a given period of time
  • The assessment should take the following costs into account:
  • Direct costs:
  • Preparatory work
  • Environment protection
  • Construction work
  • Hydraulic equipment
  • Electrical equipment
  • Transmission lines modernisation costs
  • Indirect costs:
  • Administrative and engineering costs
  • Unexpected expenses
  • Increased employment
  • Local development of technical infrastructure (road, electricity, telecommunications networks)
  • Extension of public utility buildings
  • Economic development of local market
  • Tourism development
  • Terrain height
  • Slope
  • Land cover (use)
  • Slope exposure
  • Size of the area to be flooded
  • Watercourse length
  • Distance from the river
  • Geological composition of rock formations in the area (susceptibility to landslides)
  • Maximum power of a hydropower plant (maximum water flow rate)
  • Maximum annual electricity production
  • Minimum length of the transmission line (the longer the energy flow, the greater the energy losses)
  • Maximum ratio of annual electricity capacity (maximum land slope)
  • Direction of watercourse flow
  • Watercourse flow rate
  • Energy potential (calculated from flow)
  • Tank size
  • Legal and administrative restrictions depending on legal provisions in a given area
  • Restrictions related to environmental protection zones
Table 2. Comparison of point heights measured in the field using the GNSS RTN technique with point heights read from LIDAR and UAV point clouds; source: own elaboration.
Field DetailPoint No.GNSS
RTN
UAV CloudLIDAR Cloud
H R T N   [ m ] H d M I N [ m ] d H d M I N [ m ] H M E A N [ m ] d H M E A N [ m ] H d M I N [ m ] d H d M I N [ m ] H M E A N [ m ] d H M E A N [ m ]
1234567891011
Slopes94252.6252.40.2252.50.1252.7−0.1256.3−3.7
95251.4251.5−0.1244.56.9 251.6−0.2251.6−0.2
88252.7252.50.2252.70.1252.70258.6−5.9
87251.8251.9−0.1251.9−0.1251.80251.9−0.1
65253.7253.50.2253.50.2253.8−0.1253.8−0.1
66252.7253−0.3252.9−0.1252.9−0.2252.9−0.1
59254.3254.20.1254.10.2254.3−0.1254.5−0.2
60252.8252.60.2252.90252.70.1252.70.1
38253.8253.60.1253.60.2254.1−0.3254.1−0.3
39252.9253.1−0.3252.90253.6−0.7253.5−0.6
32254.7254.50.2254.60.2254.8−0.1258.7−4.0
31252.8253.4−0.6252.80253.3−0.5253.2−0.4
23253.8253.70.1253.70.2253.9−0.1256.9−3.0
22252.8253−0.3252.80253.6−0.8253.6−0.8
16253.8253.60.2253.60.2254.5−0.6
17252.9252.90.1252.80.2254.4−1.4
9254.3254.30254.20.1254.5−0.2254.5−0.2
10253.12530.1253.10254.3−1.2
3254.4254.20.2254.20.1254.5−0.2257.7−3.3
4253.22530.1253.10.1252.7−0.1260.6−7.4
σ   2 d H   m σ d H M I N   2 = 0.0   σ d H M E A N   2 = 2.5   σ d H M I N   2 = 3.3   σ d H M E A N   2 = 8.8
σ d H   m σ d H M I N = 0.2 σ d H M E A N = 1.6 σ d H M I N = 1.8   σ d H M E A N = 3.0
σ σ d H 2   m σ σ d H M I N 2 = 0.0 σ σ d H M E A N 2 = 0.8 σ σ d H M I N 2 = 1.1 σ σ d H M E A N 2 = 3.1
σ σ d H [m] σ σ d H M I N = 0.1 σ σ d H M E A N = 0.9 σ σ d H M I N = 1.0   σ σ d H M E A N = 1.8
Grasses140254.0253.90.1253.90.1254.4−0.4254.4−0.4
134253.6253.60.1253.60.1253.8−0.2253.8−0.2
127253.6253.50.1253.6−0.1253.6−0.1254.6−1.1
125253.3253.20.1253.20.0253.30.0253.3−0.1
41254.4254.20.3254.30.2254.6−0.1254.5−0.1
71252.9252.70.2252.70.2252.80.1252.80.1
84251.8251.90252.0−0.1252.0−0.2252.0−0.2
99252.5252.8−0.2252.9−0.4252.60.0252.6−0.1
108251.8251.80257.6−5.8251.80.0258.7−6.9
141253.9253.70.2253.80.2254.3−0.4258.0−4.0
σ   2 d H   m σ d H M I N   2 = 0.0   σ d H M E A N   2 = 3.8   σ d H M I N   2 = 0.0 σ d H M E A N   2 = 7.2
σ d H   m σ d H M I N = 0.1 σ d H M E A N = 1.9 σ d H M I N = 0.2   σ d H M E A N = 2.7
σ σ d H 2   m σ σ d H M I N 2 = 0.0 σ σ d H M E A N 2 = 1.8 σ σ d H M I N 2 = 0.0 σ σ d H M E A N 2 = 3.4
σ σ d H [m] σ σ d H M I N = 0.1 σ σ d H M E A N = 1.3 σ σ d H M I N = 0.2   σ σ d H M E A N = 1.8
Forests113252.1251.90.2251.90.1252.2−0.1253.5−1.4
116252.1261.3−9.3258.4−6.3266.1−14.1259.5−7.4
117253.0252.80.2252.70.2255.2−2.2255.4−2.4
118253.2253.10.1253.00.2253.3−0.1253.3−0.1
119252.9252.70.3252.70.2252.90.0252.90.0
120253.7253.30.3253.30.4253.7−0.1253.7−0.1
121253.5253.20.3253.20.3253.6−0.1253.6−0.1
122252.8252.60.2257.8−5.0252.80.0252.80.0
123252.7262.0−9.3257.1−4.4259.0−6.3257.7−5.0
124252.9263.5−10.6259.3−6.4256.5−3.6256.3−3.4
σ   2 d H   m σ d H M I N   2 = 31.7   σ d H M E A N   2 = 14.1   σ d H M I N   2 = 28.3 σ d H M E A N   2 = 11.1
σ d H   m σ d H M I N = 5.6 σ d H M E A N = 3.7 σ d H M I N = 5.3   σ d H M E A N = 3.3
σ σ d H 2   m σ σ d H M I N 2 = 14.9 σ σ d H M E A N 2 = 6.6 σ σ d H M I N 2 = 13.3 σ σ d H M E A N 2 = 5.2
σ σ d H [m] σ σ d H M I N = 3.9 σ σ d H M E A N = 2.6 σ σ d H M I N = 3.7   σ σ d H M E A N = 2.3
Total σ   2 d H   m σ d H M I N   2 = 9.9   σ d H M E A N   2 7.2 σ d H M I N   2 = 11.0 σ d H M E A N   2 = 11.7
σ d H   m σ d H M I N = 3.1 σ d H M E A N = 2.7 σ d H M I N = 3.3   σ d H M E A N = 3.4
σ σ d H 2   m σ σ d H M I N 2 = 2.6 σ σ d H M E A N 2 = 1.9 σ σ d H M I N 2 = 2.9 σ σ d H M E A N 2 = 3.3
σ σ d H [m] σ σ d H M I N = 1.6 σ σ d H M E A N = 1.4 σ σ d H M I N = 1.7   σ σ d H M E A N = 1.8
Table 3. Cross-sections generated on the DEM created from GNSS RTN survey; source: own elaboration.
Cross-Section No.DEM
LEGEND Energies 15 01527 i001
1 Energies 15 01527 i002
3 Energies 15 01527 i003
5 Energies 15 01527 i004
7 Energies 15 01527 i005
11 Energies 15 01527 i006
13 Energies 15 01527 i007
15 Energies 15 01527 i008
17 Energies 15 01527 i009
19 Energies 15 01527 i010
21 Energies 15 01527 i011
MAIN AXIS Energies 15 01527 i012
Table 4. Cross-sections of the watercourse bed on the DEM and DSM in raster form; source: own elaboration.
Cross-Section No.DEMDSM
LEGEND Energies 15 01527 i013 Energies 15 01527 i014
1 Energies 15 01527 i015 Energies 15 01527 i016
3 Energies 15 01527 i017 Energies 15 01527 i018
5 Energies 15 01527 i019 Energies 15 01527 i020
7 Energies 15 01527 i021 Energies 15 01527 i022
11 Energies 15 01527 i023 Energies 15 01527 i024
13 Energies 15 01527 i025 Energies 15 01527 i026
15 Energies 15 01527 i027 Energies 15 01527 i028
17 Energies 15 01527 i029 Energies 15 01527 i030
19 Energies 15 01527 i031 Energies 15 01527 i032
21 Energies 15 01527 i033 Energies 15 01527 i034
MAIN AXIS Energies 15 01527 i035 Energies 15 01527 i036
Table 5. Slope of land on cross-sections through watercourse bed on the DEM and DSM in raster form; source: own elaboration.
Cross-Section No.DEMDSM
LEGEND Energies 15 01527 i037 Energies 15 01527 i038
1 Energies 15 01527 i039 Energies 15 01527 i040
3 Energies 15 01527 i041 Energies 15 01527 i042
5 Energies 15 01527 i043 Energies 15 01527 i044
7 Energies 15 01527 i045 Energies 15 01527 i046
11 Energies 15 01527 i047 Energies 15 01527 i048
13 Energies 15 01527 i049 Energies 15 01527 i050
15 Energies 15 01527 i051 Energies 15 01527 i052
17 Energies 15 01527 i053 Energies 15 01527 i054
19 Energies 15 01527 i055 Energies 15 01527 i056
21 Energies 15 01527 i057 Energies 15 01527 i058
MAIN AXIS Energies 15 01527 i059 Energies 15 01527 i060
Publisher’s Note: MDPI stays neutral with regard to jurisdictional claims in published maps and institutional affiliations.

