
A Review of the Status of Fossil and Renewable Energies in Southeast Asia and Its Implications on the Decarbonization of ASEAN


Abstract
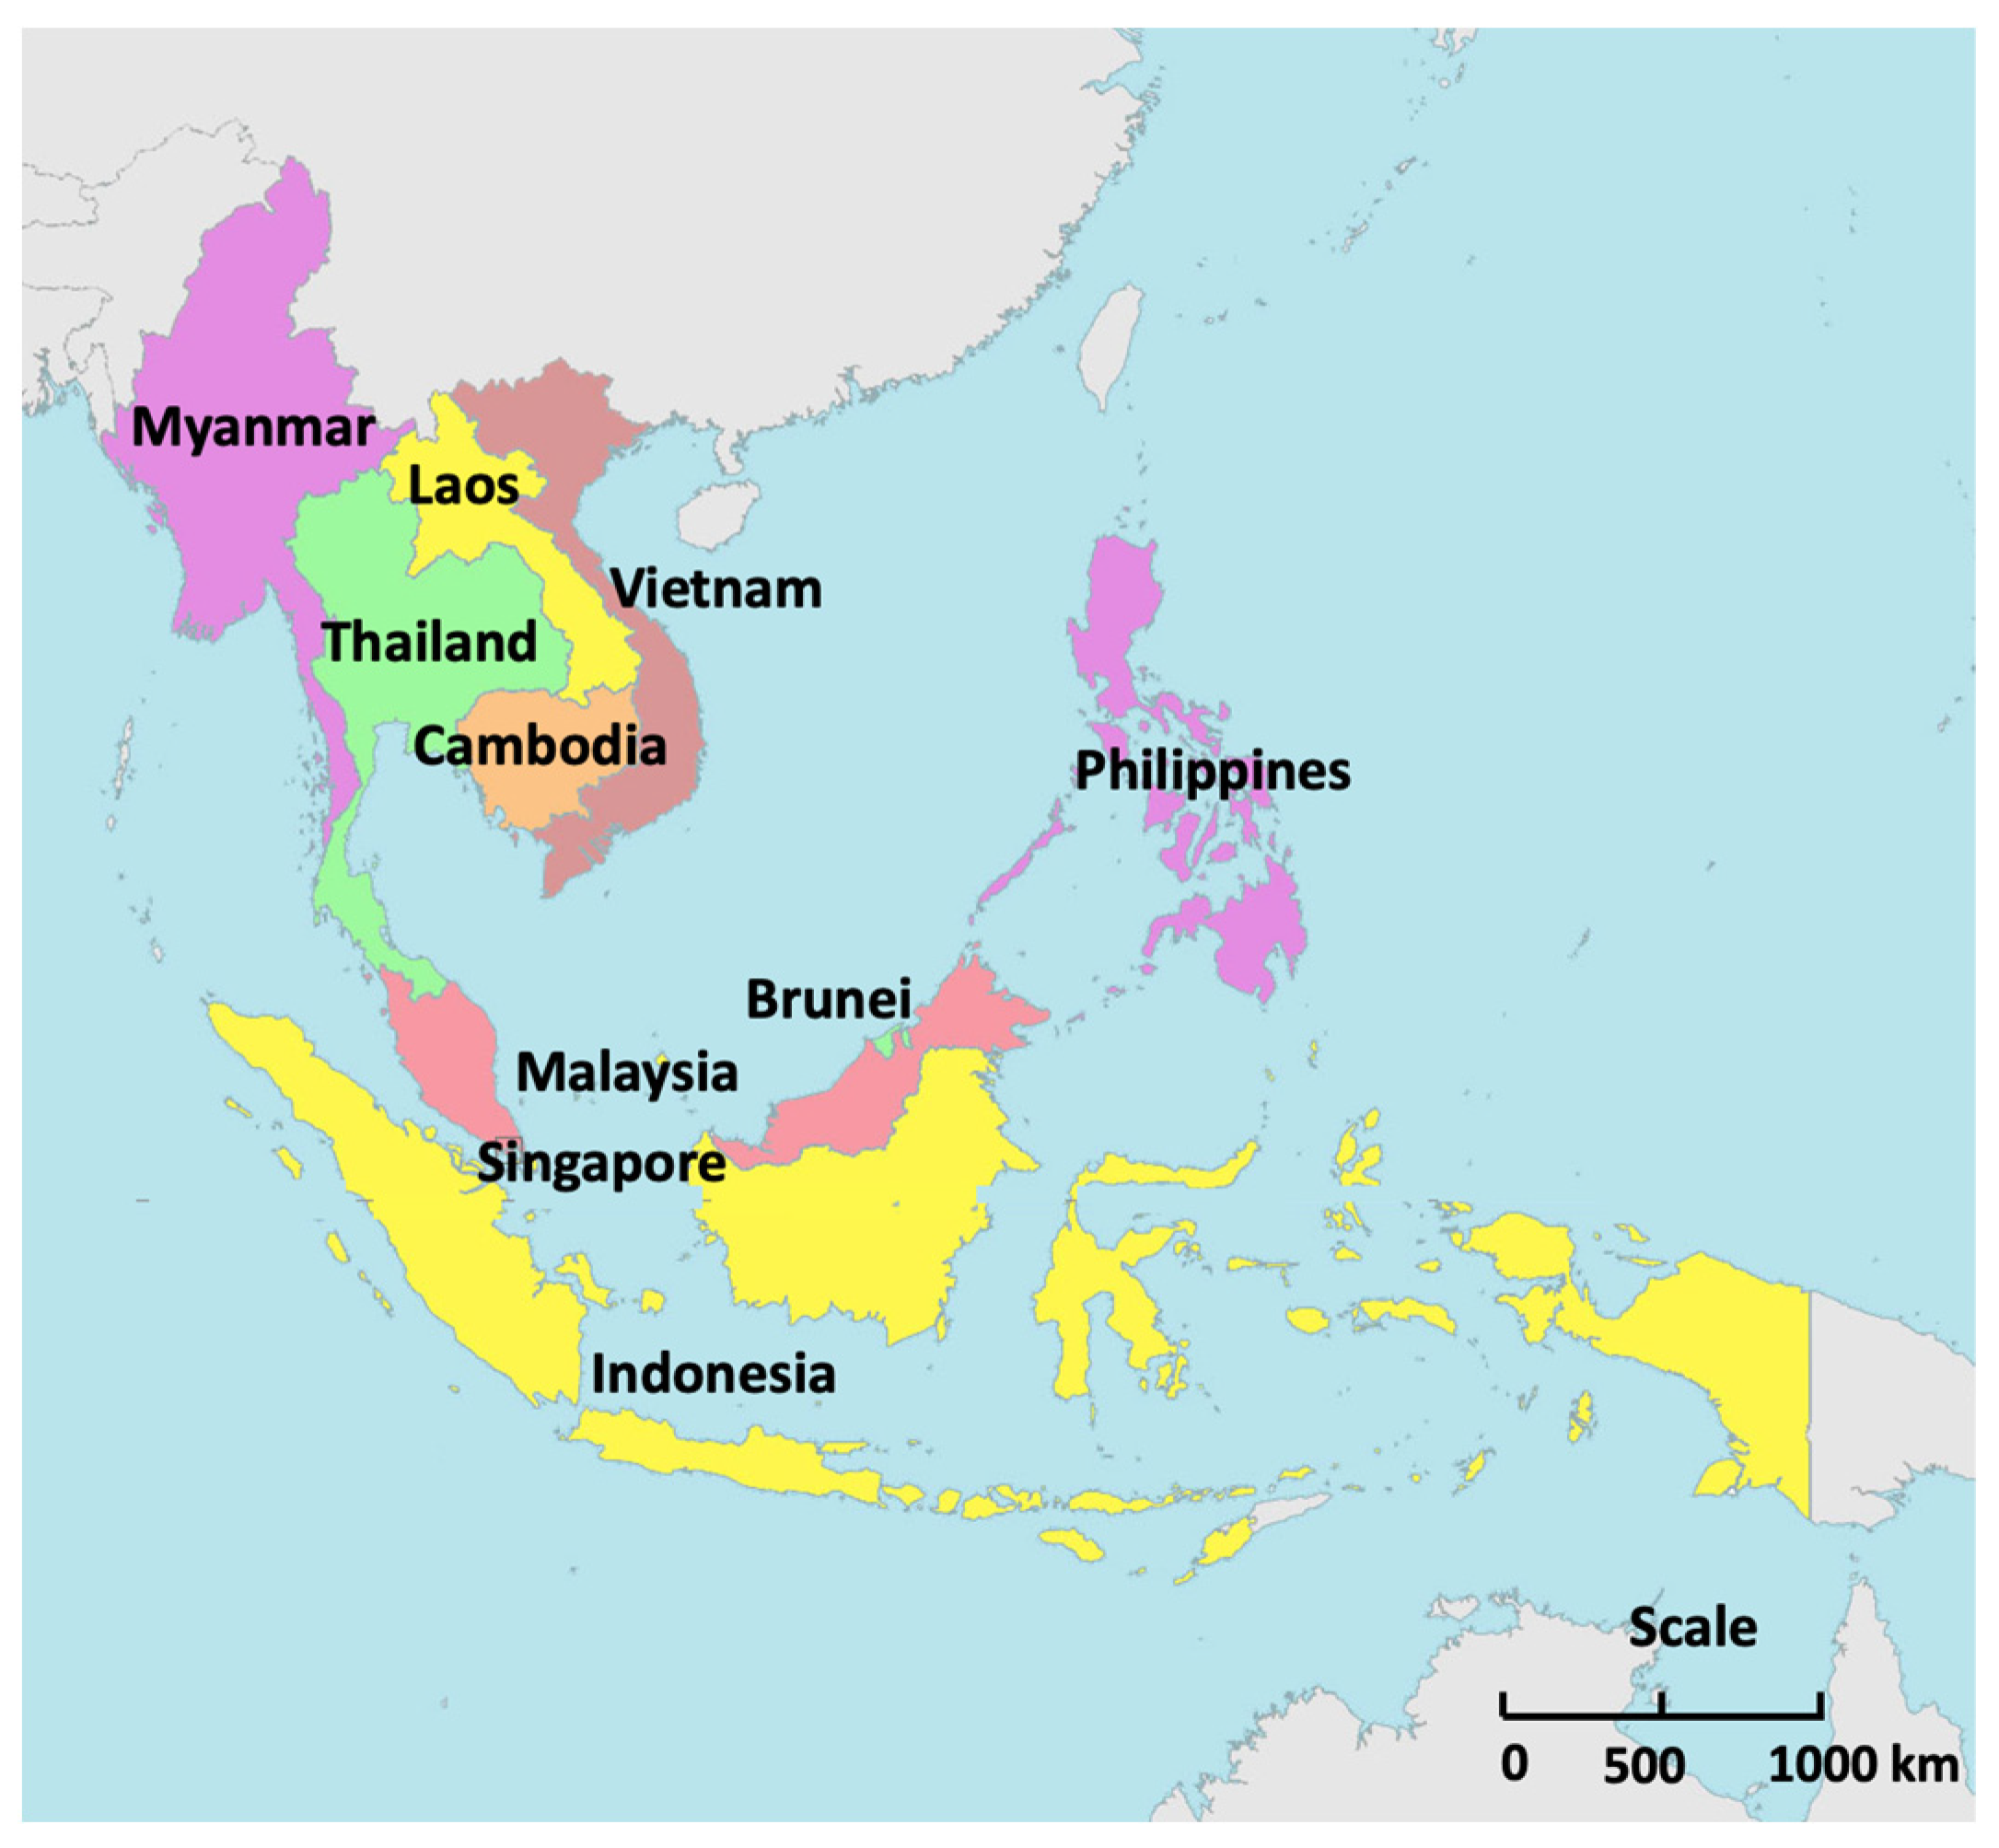
:1. Introduction
2. Objective and Methodology
3. Energy Resources in ASEAN
3.1. Status of Renewable Energies in ASEAN
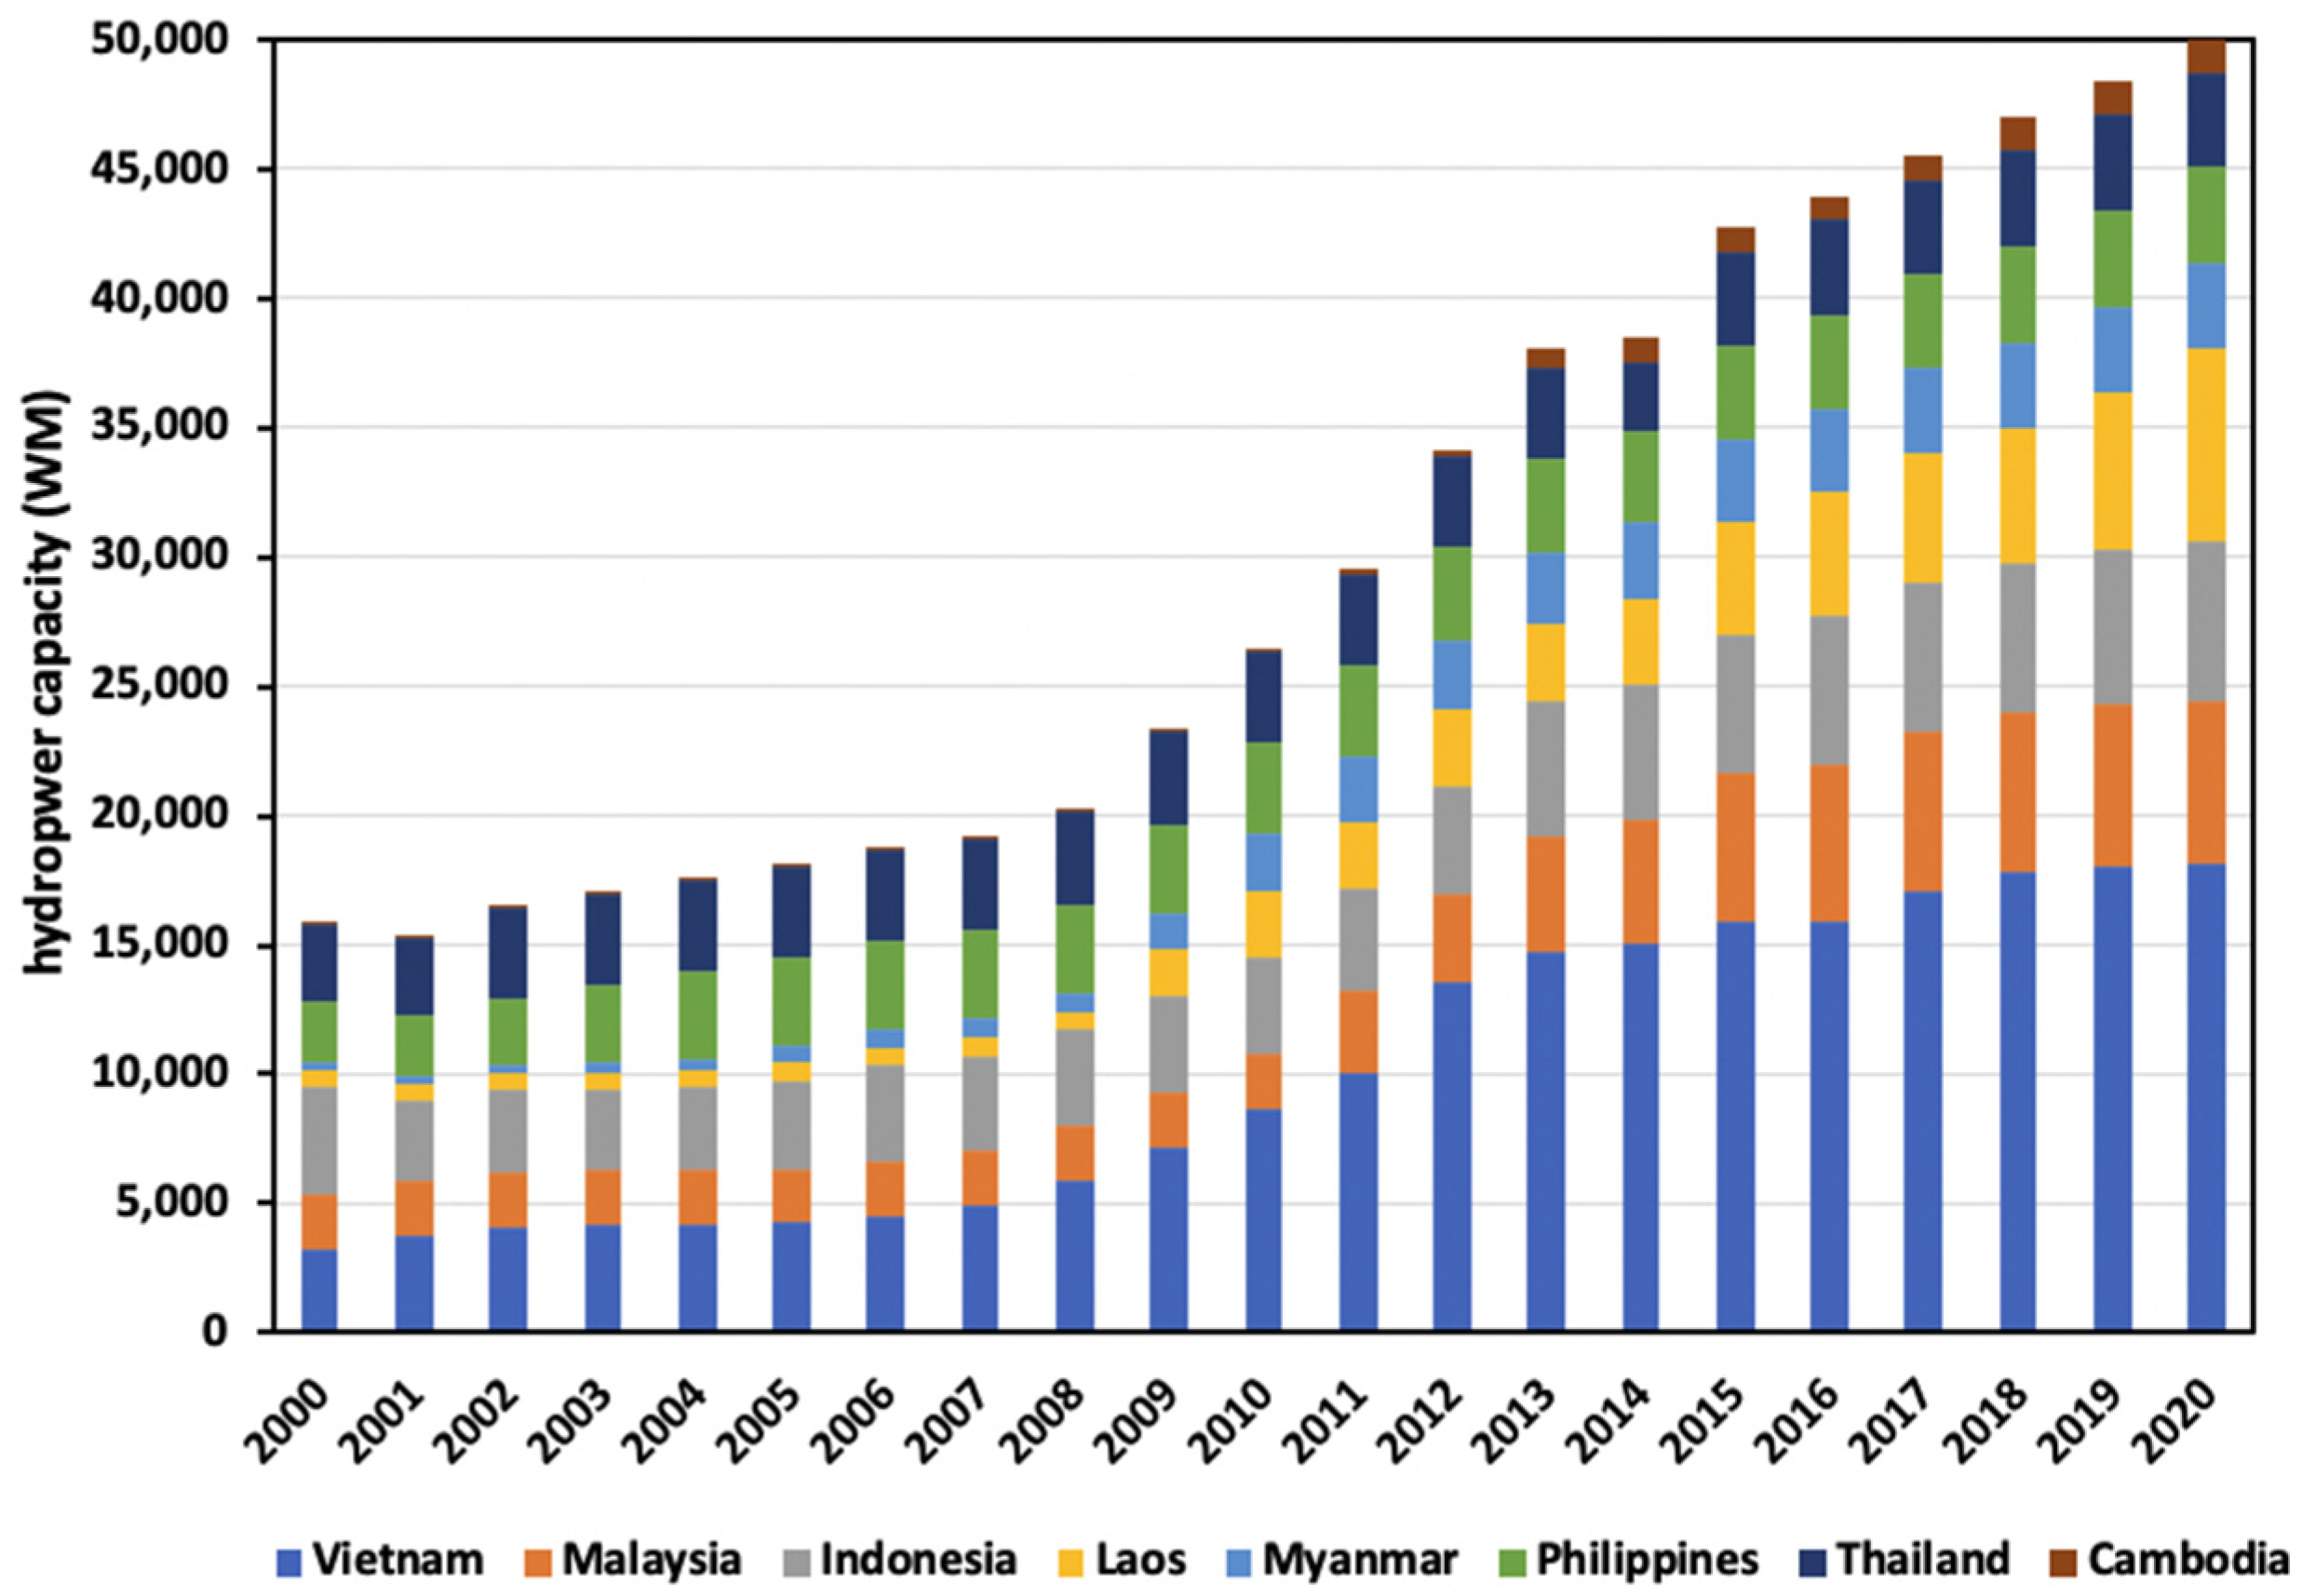
3.1.1. Hydropower Resources
3.1.2. Sustainability Issues with Hydropower

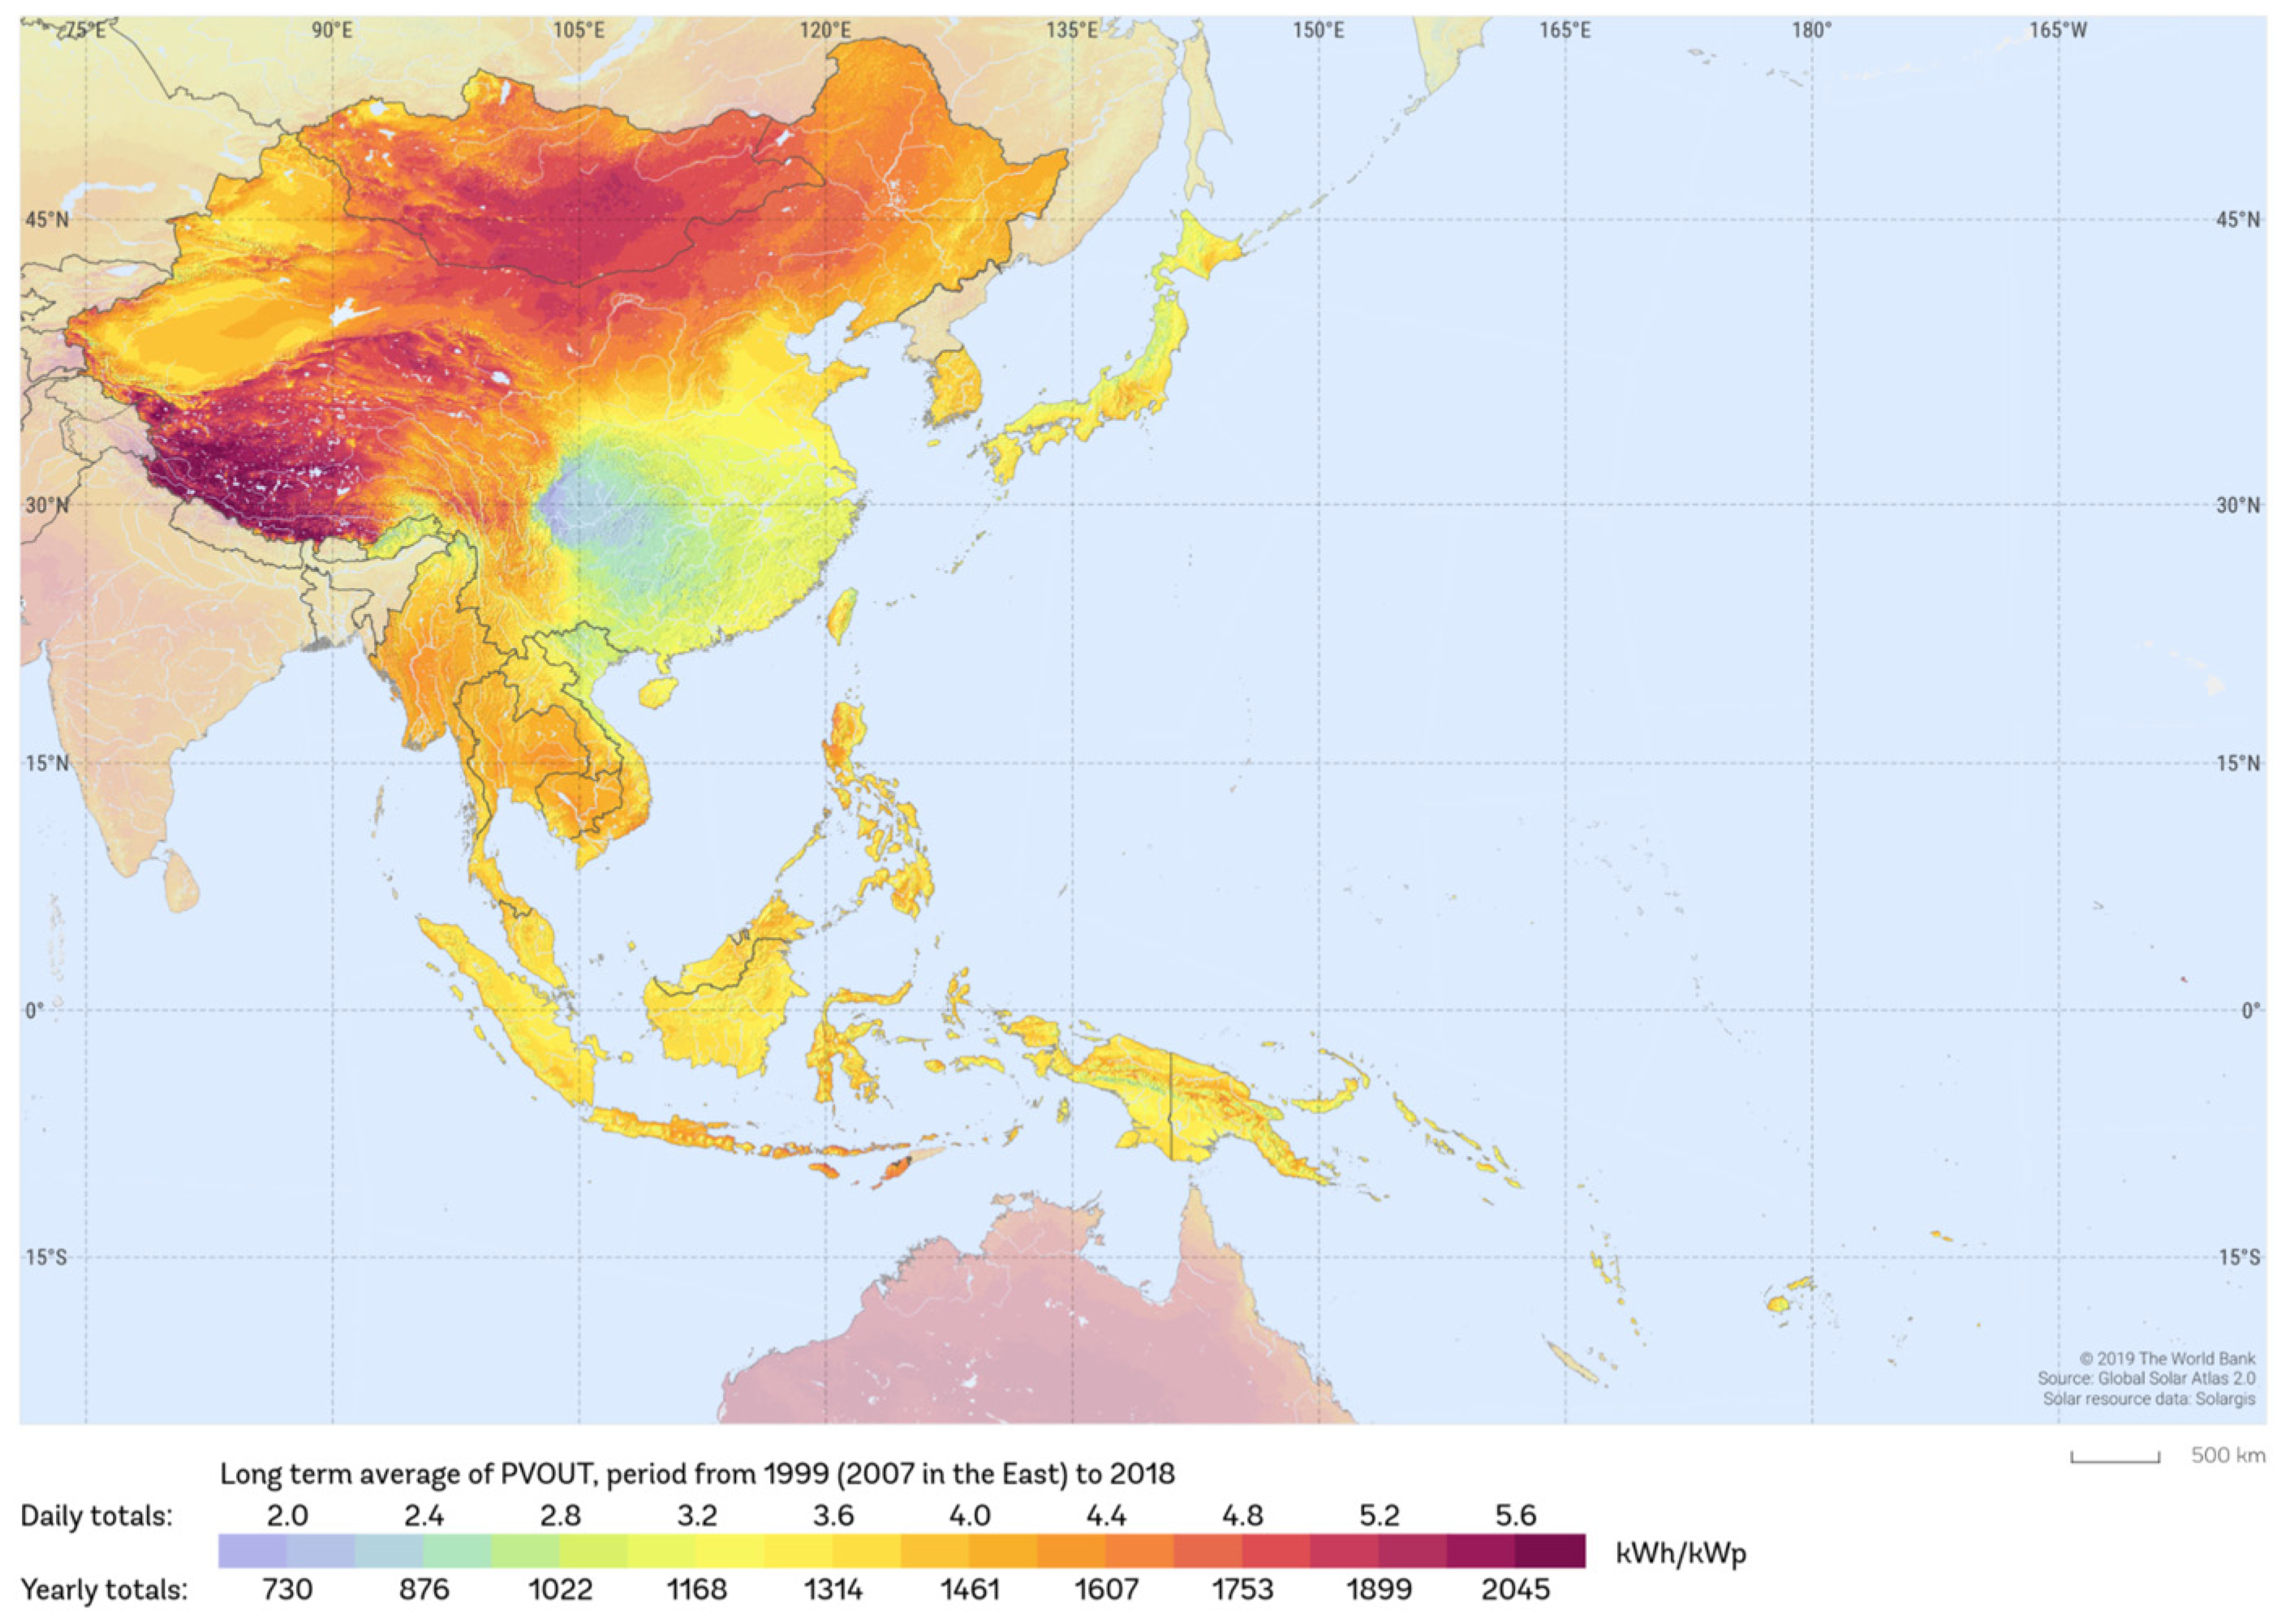
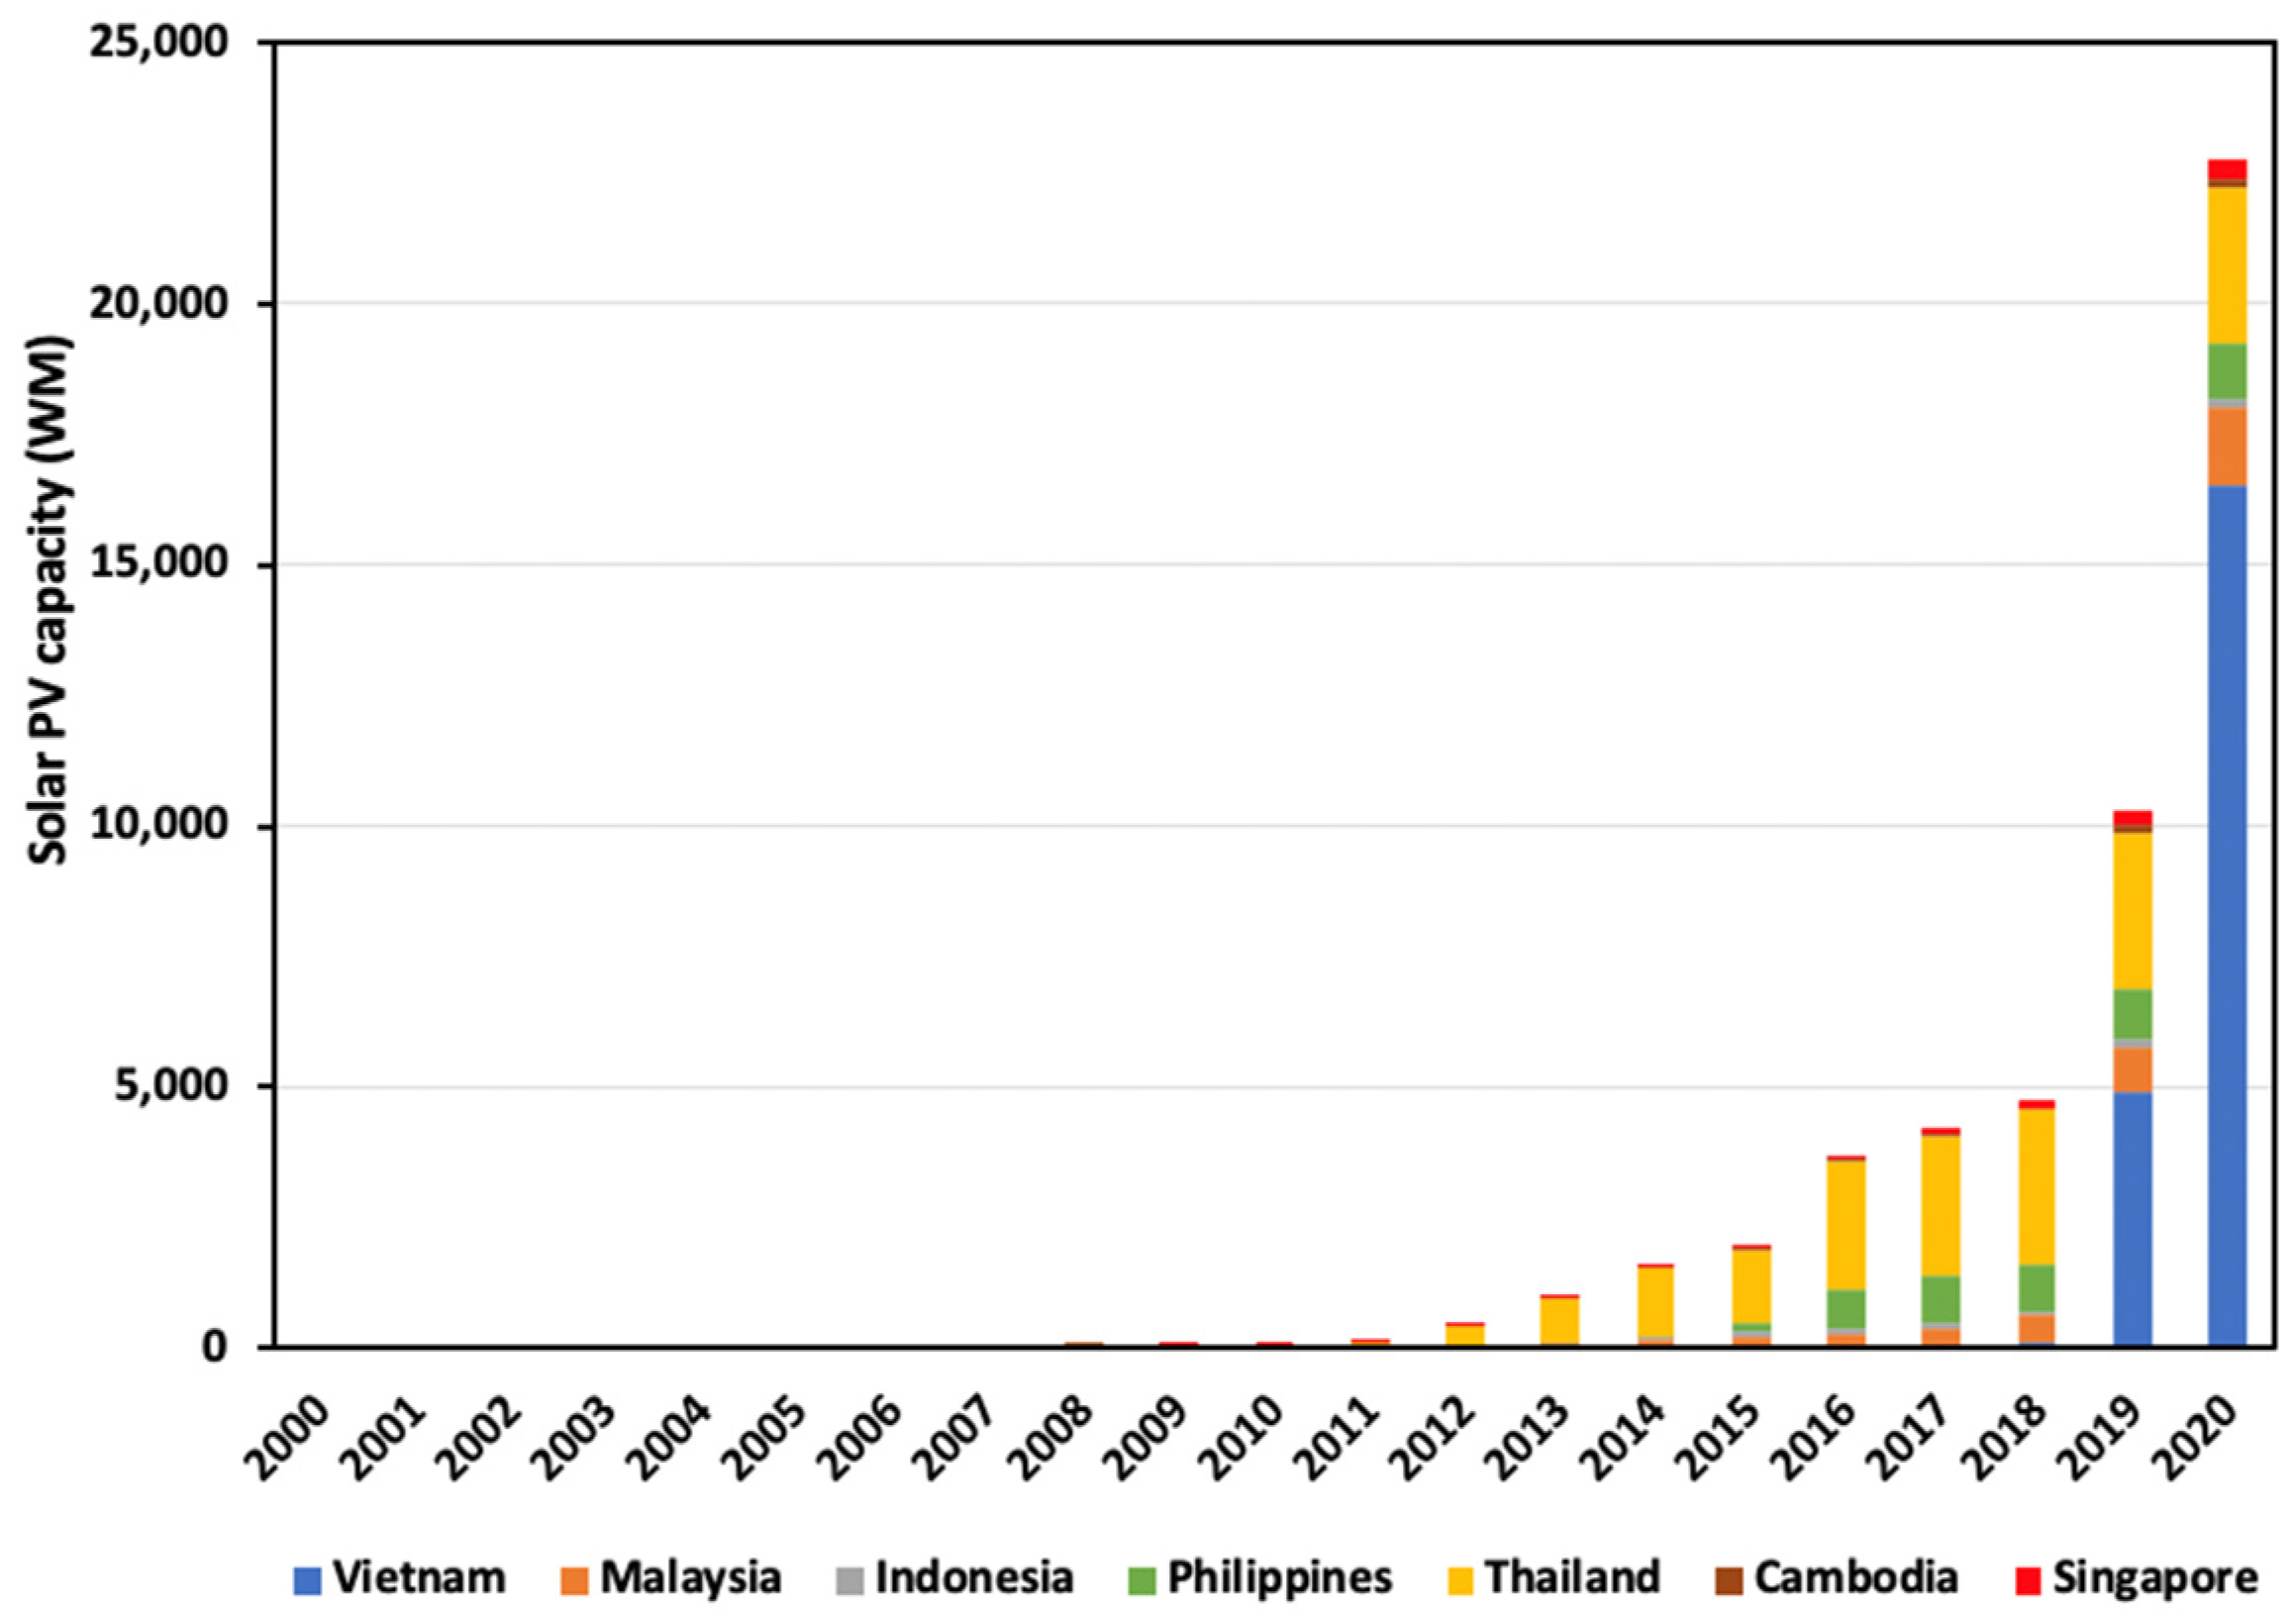
3.1.3. Solar PV
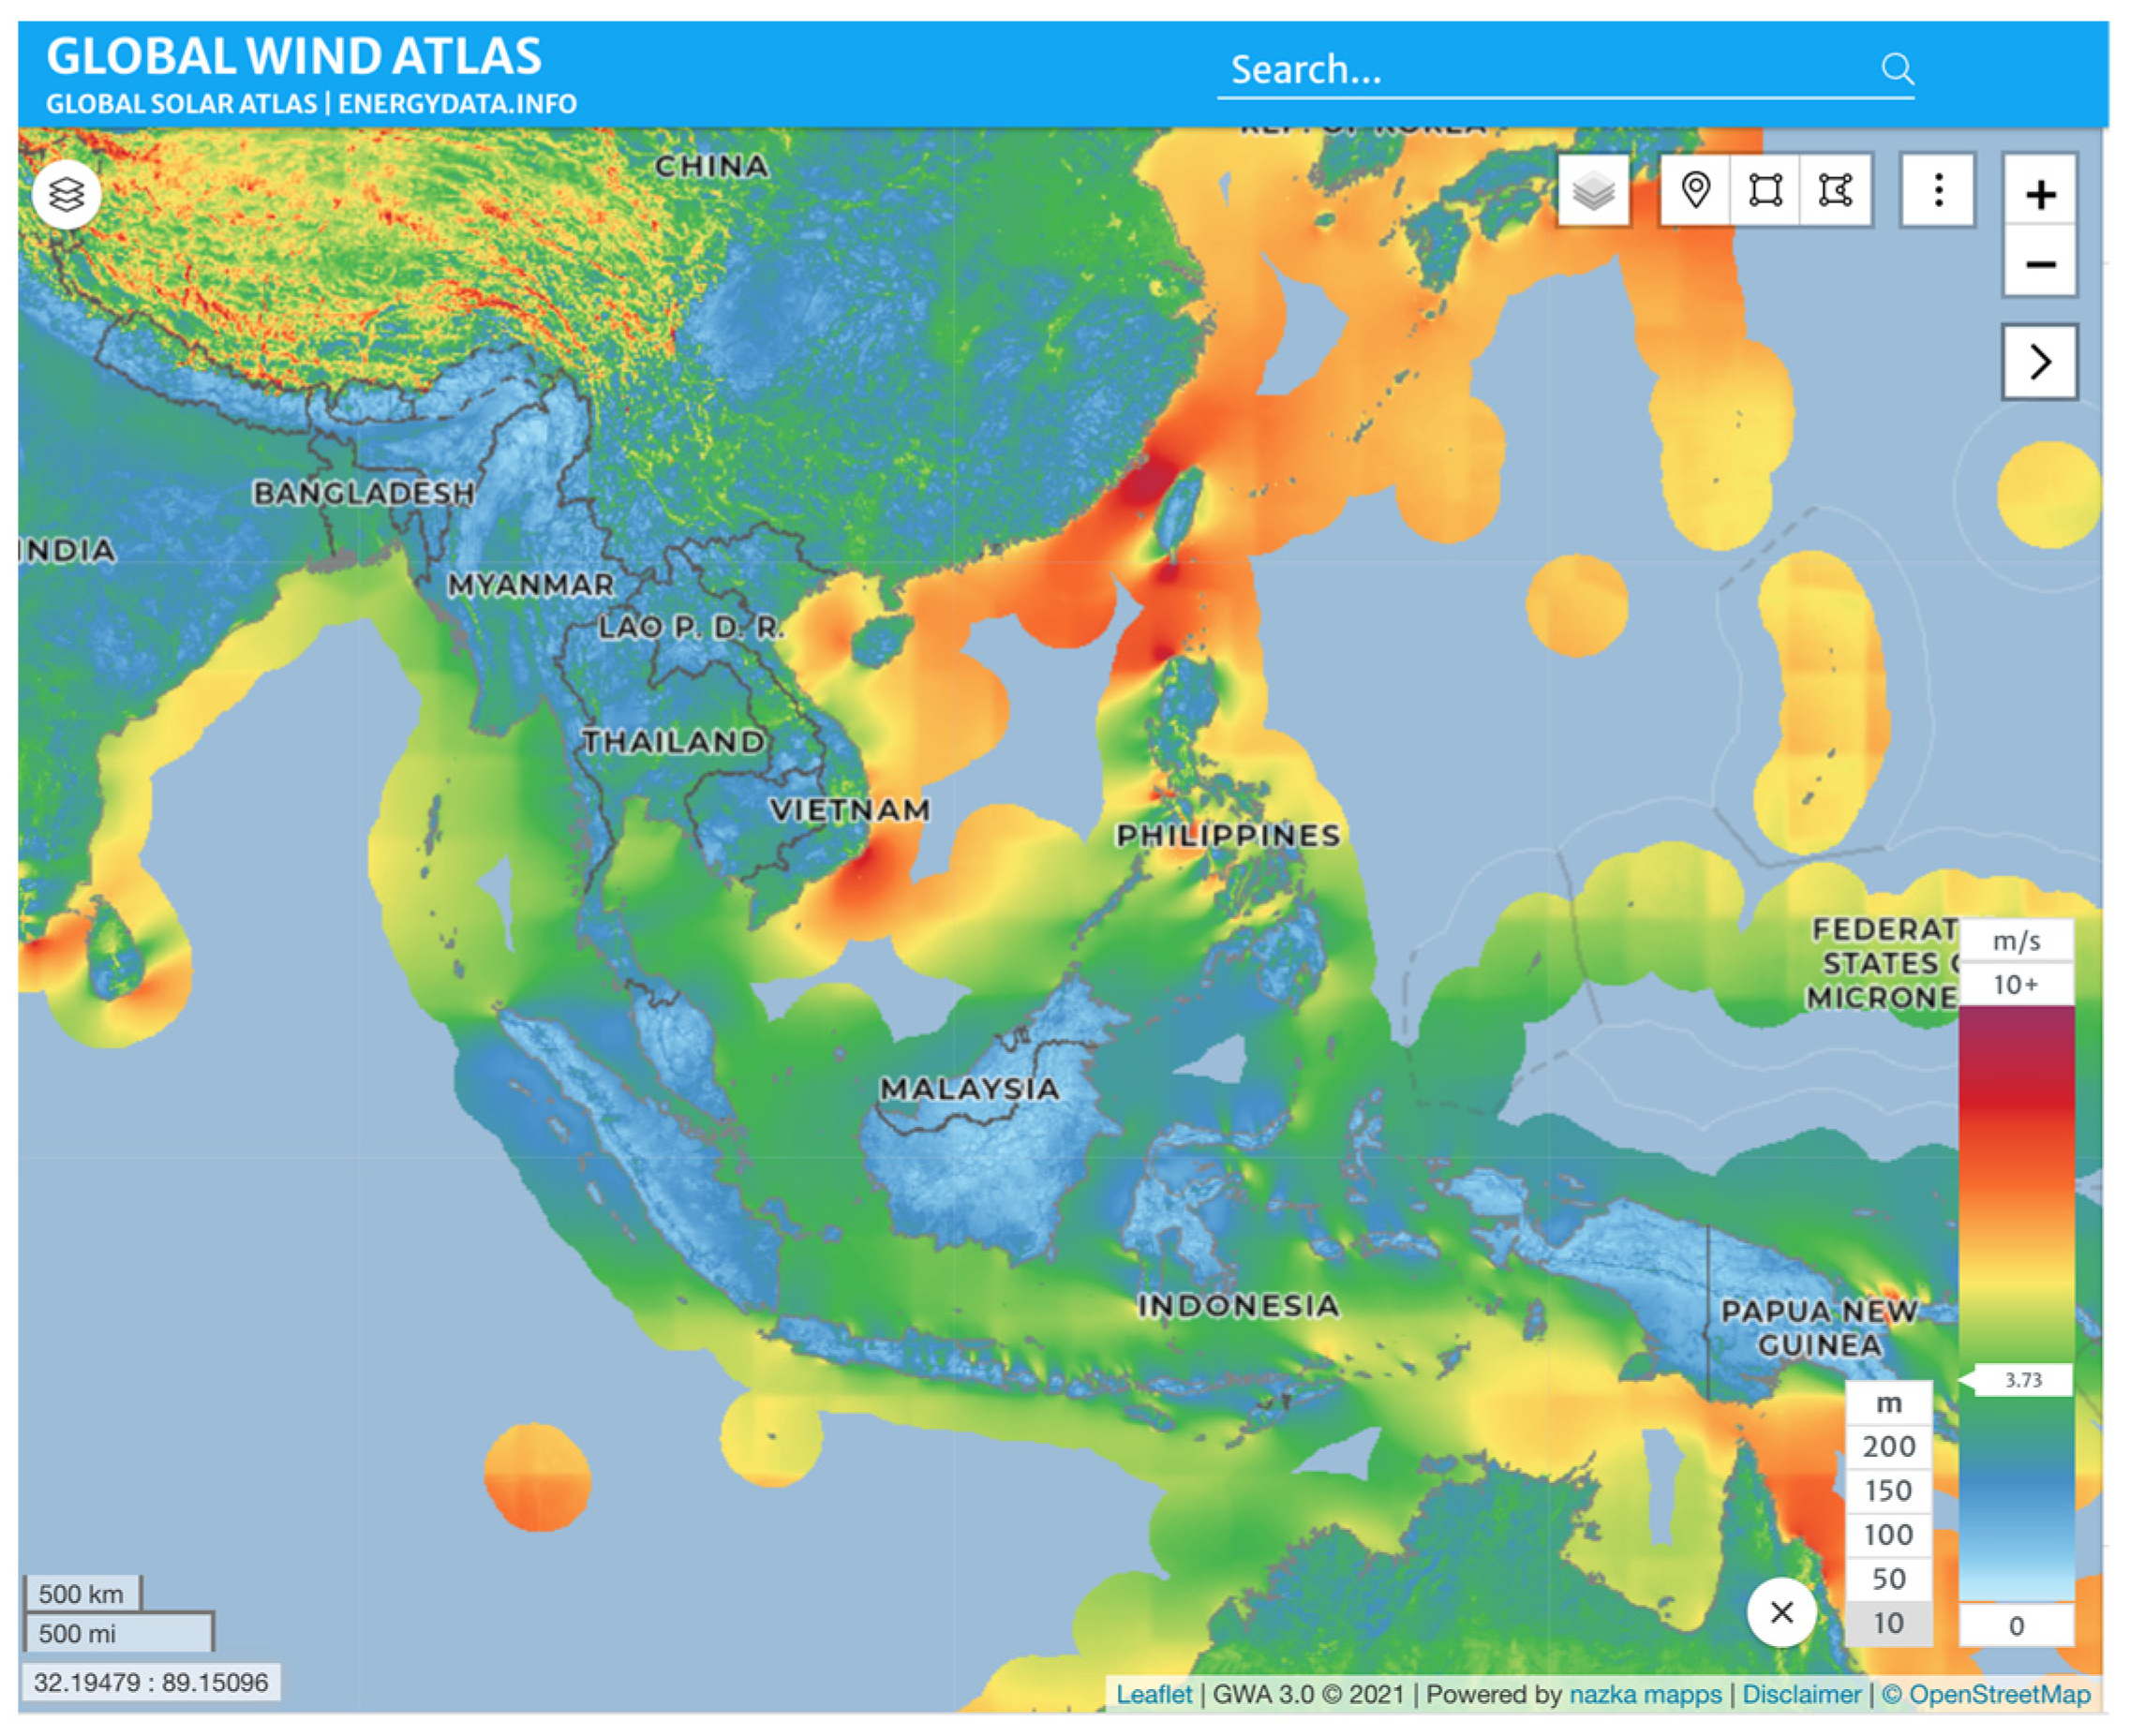
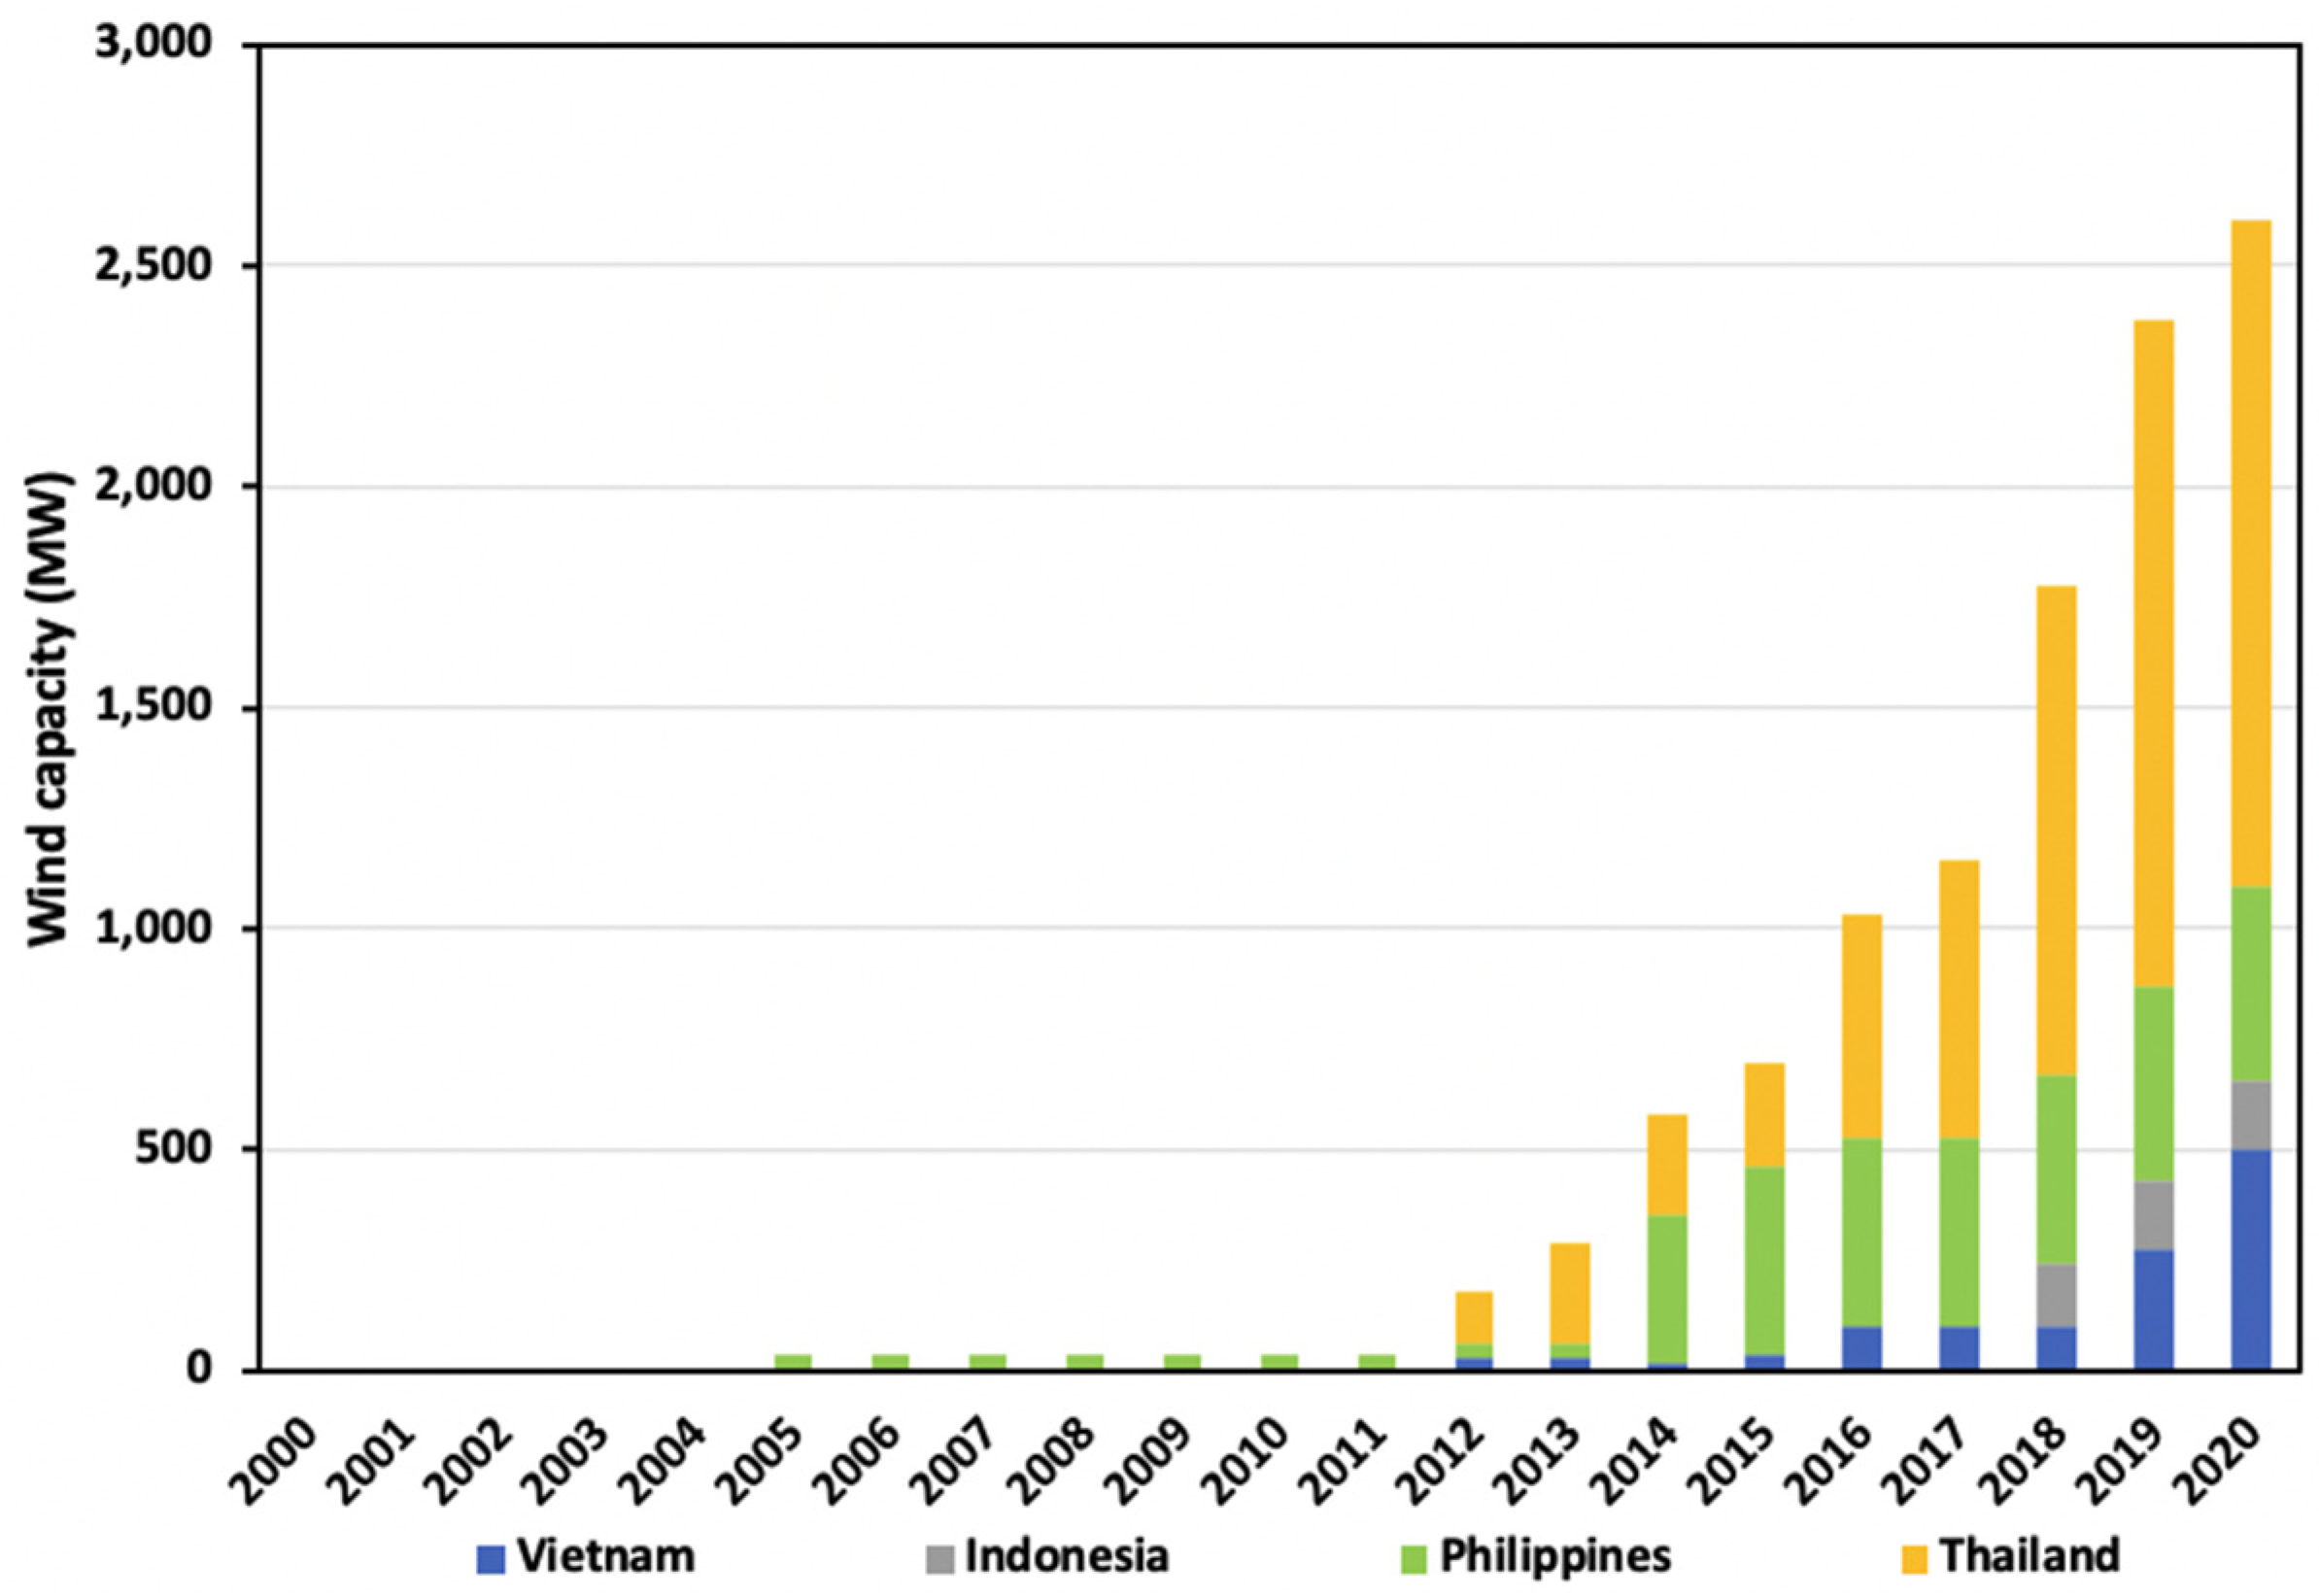
3.1.4. Wind
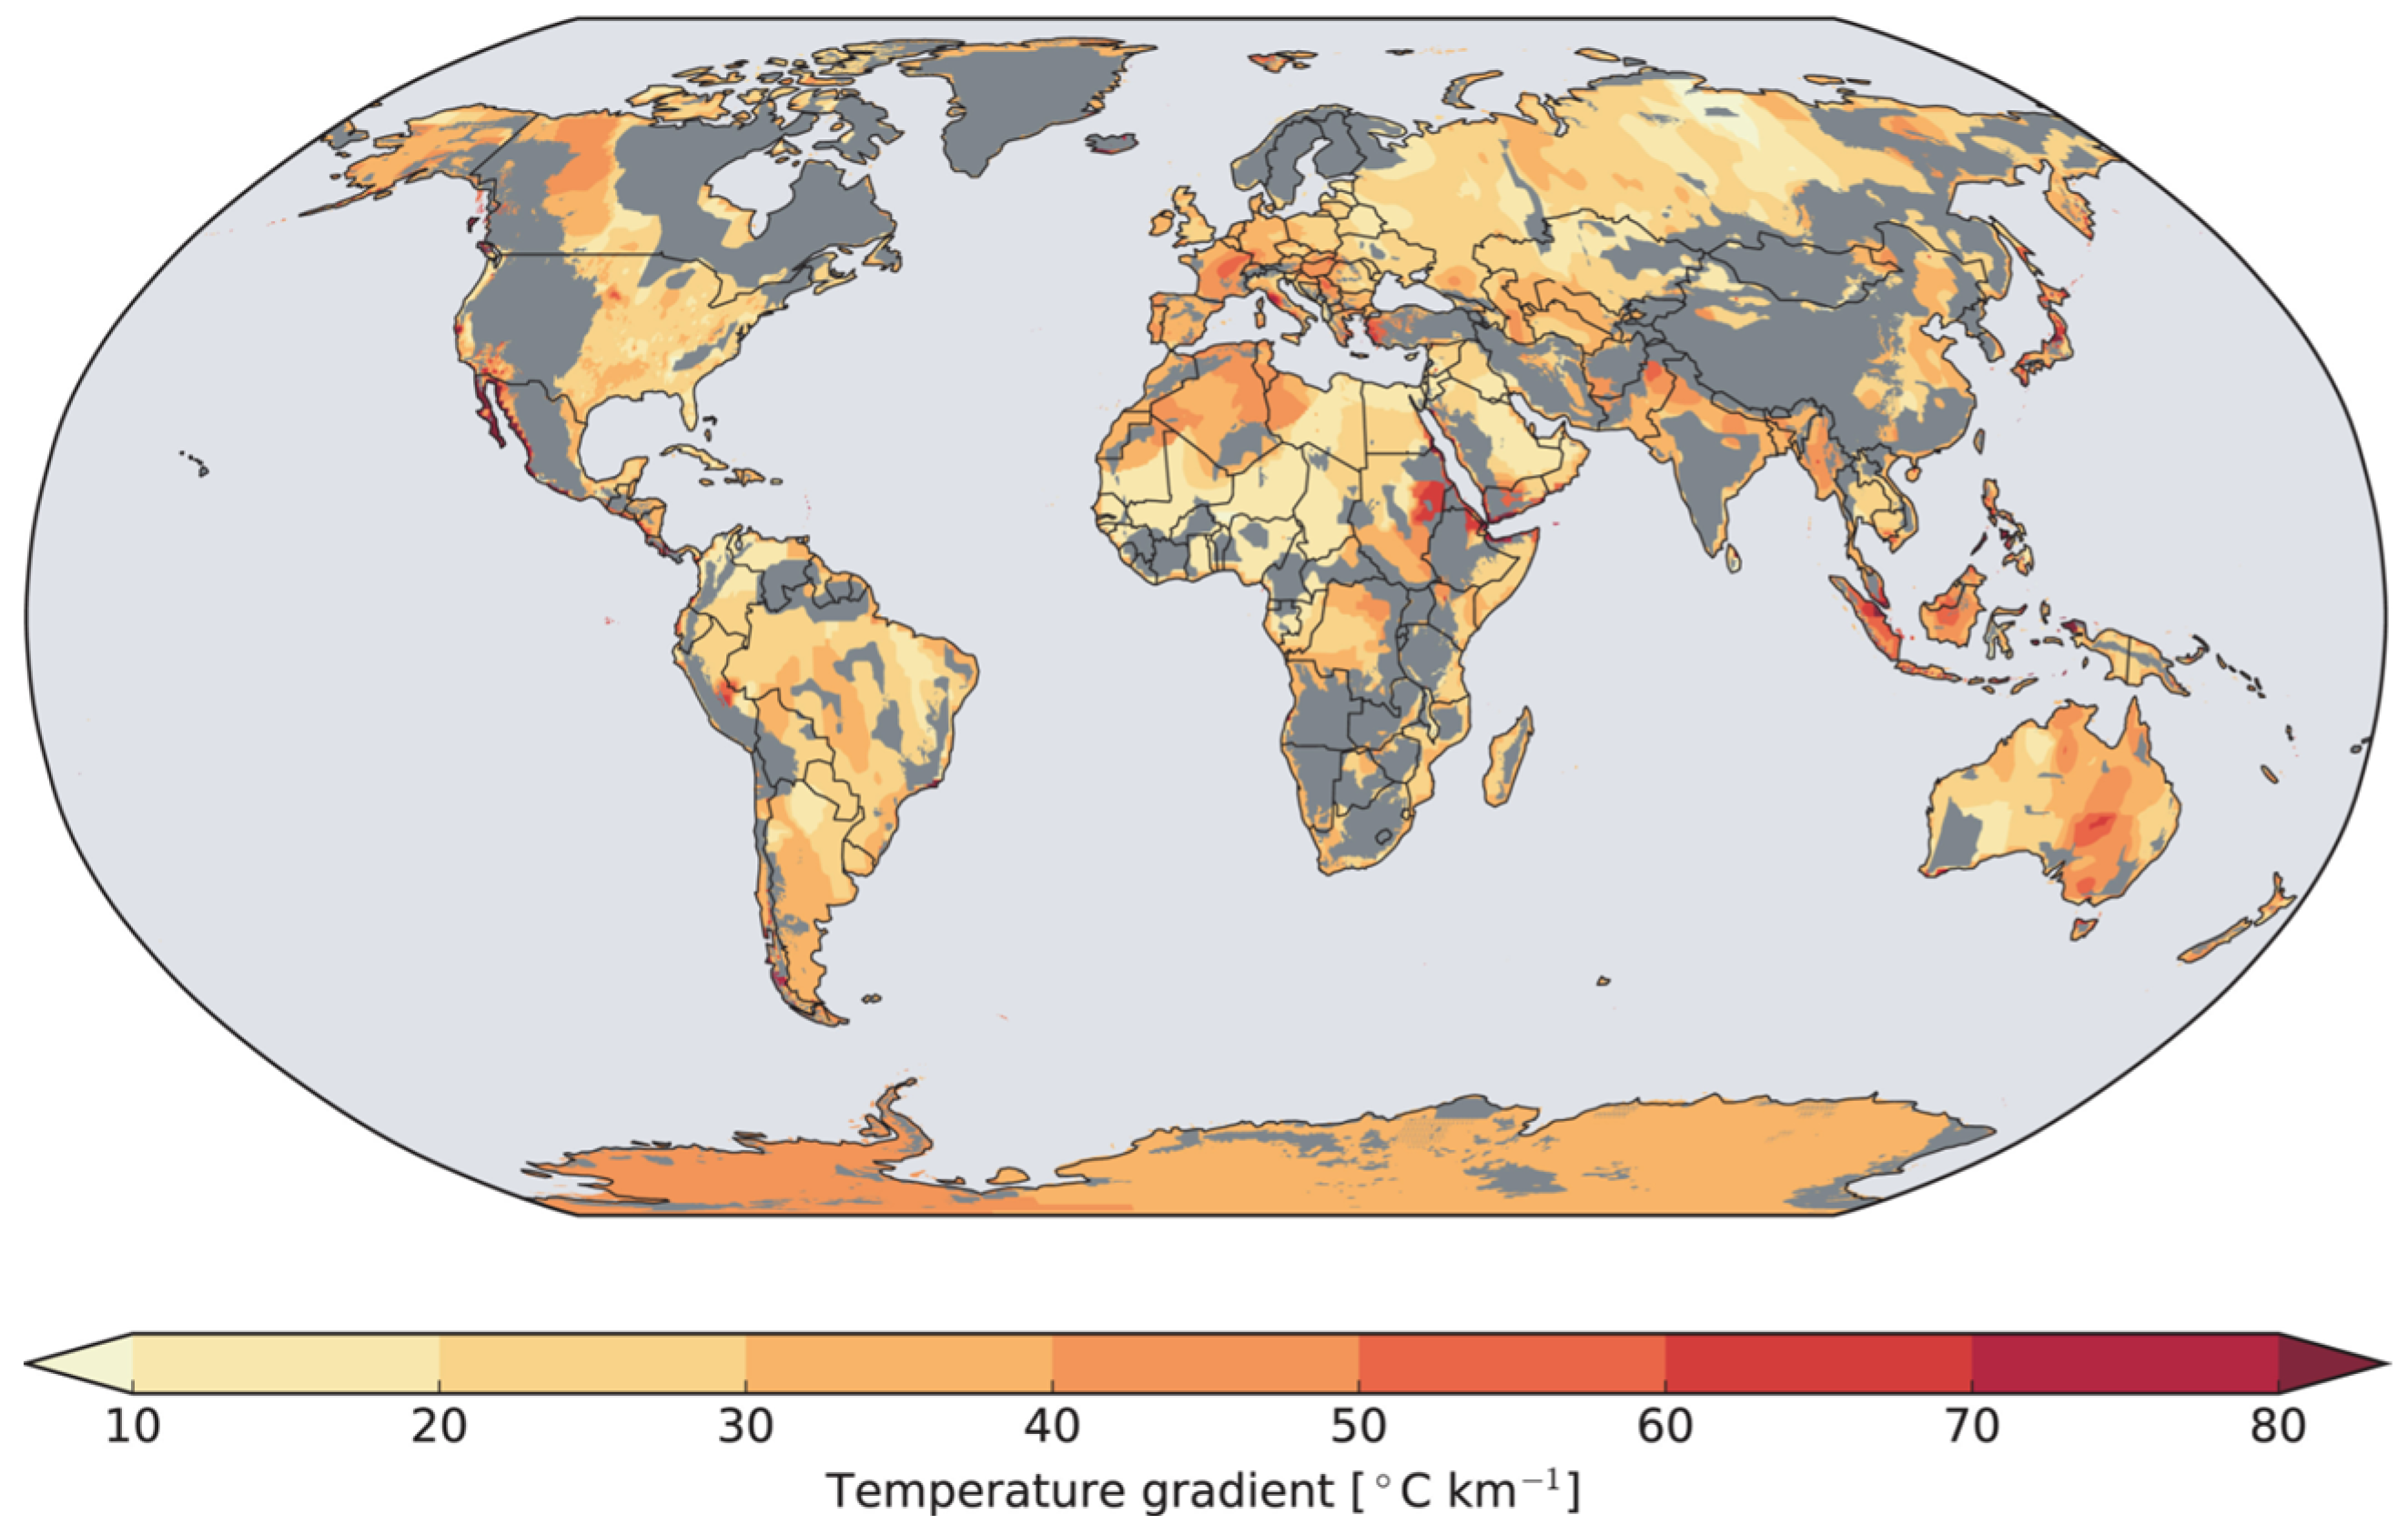
3.1.5. Geothermal
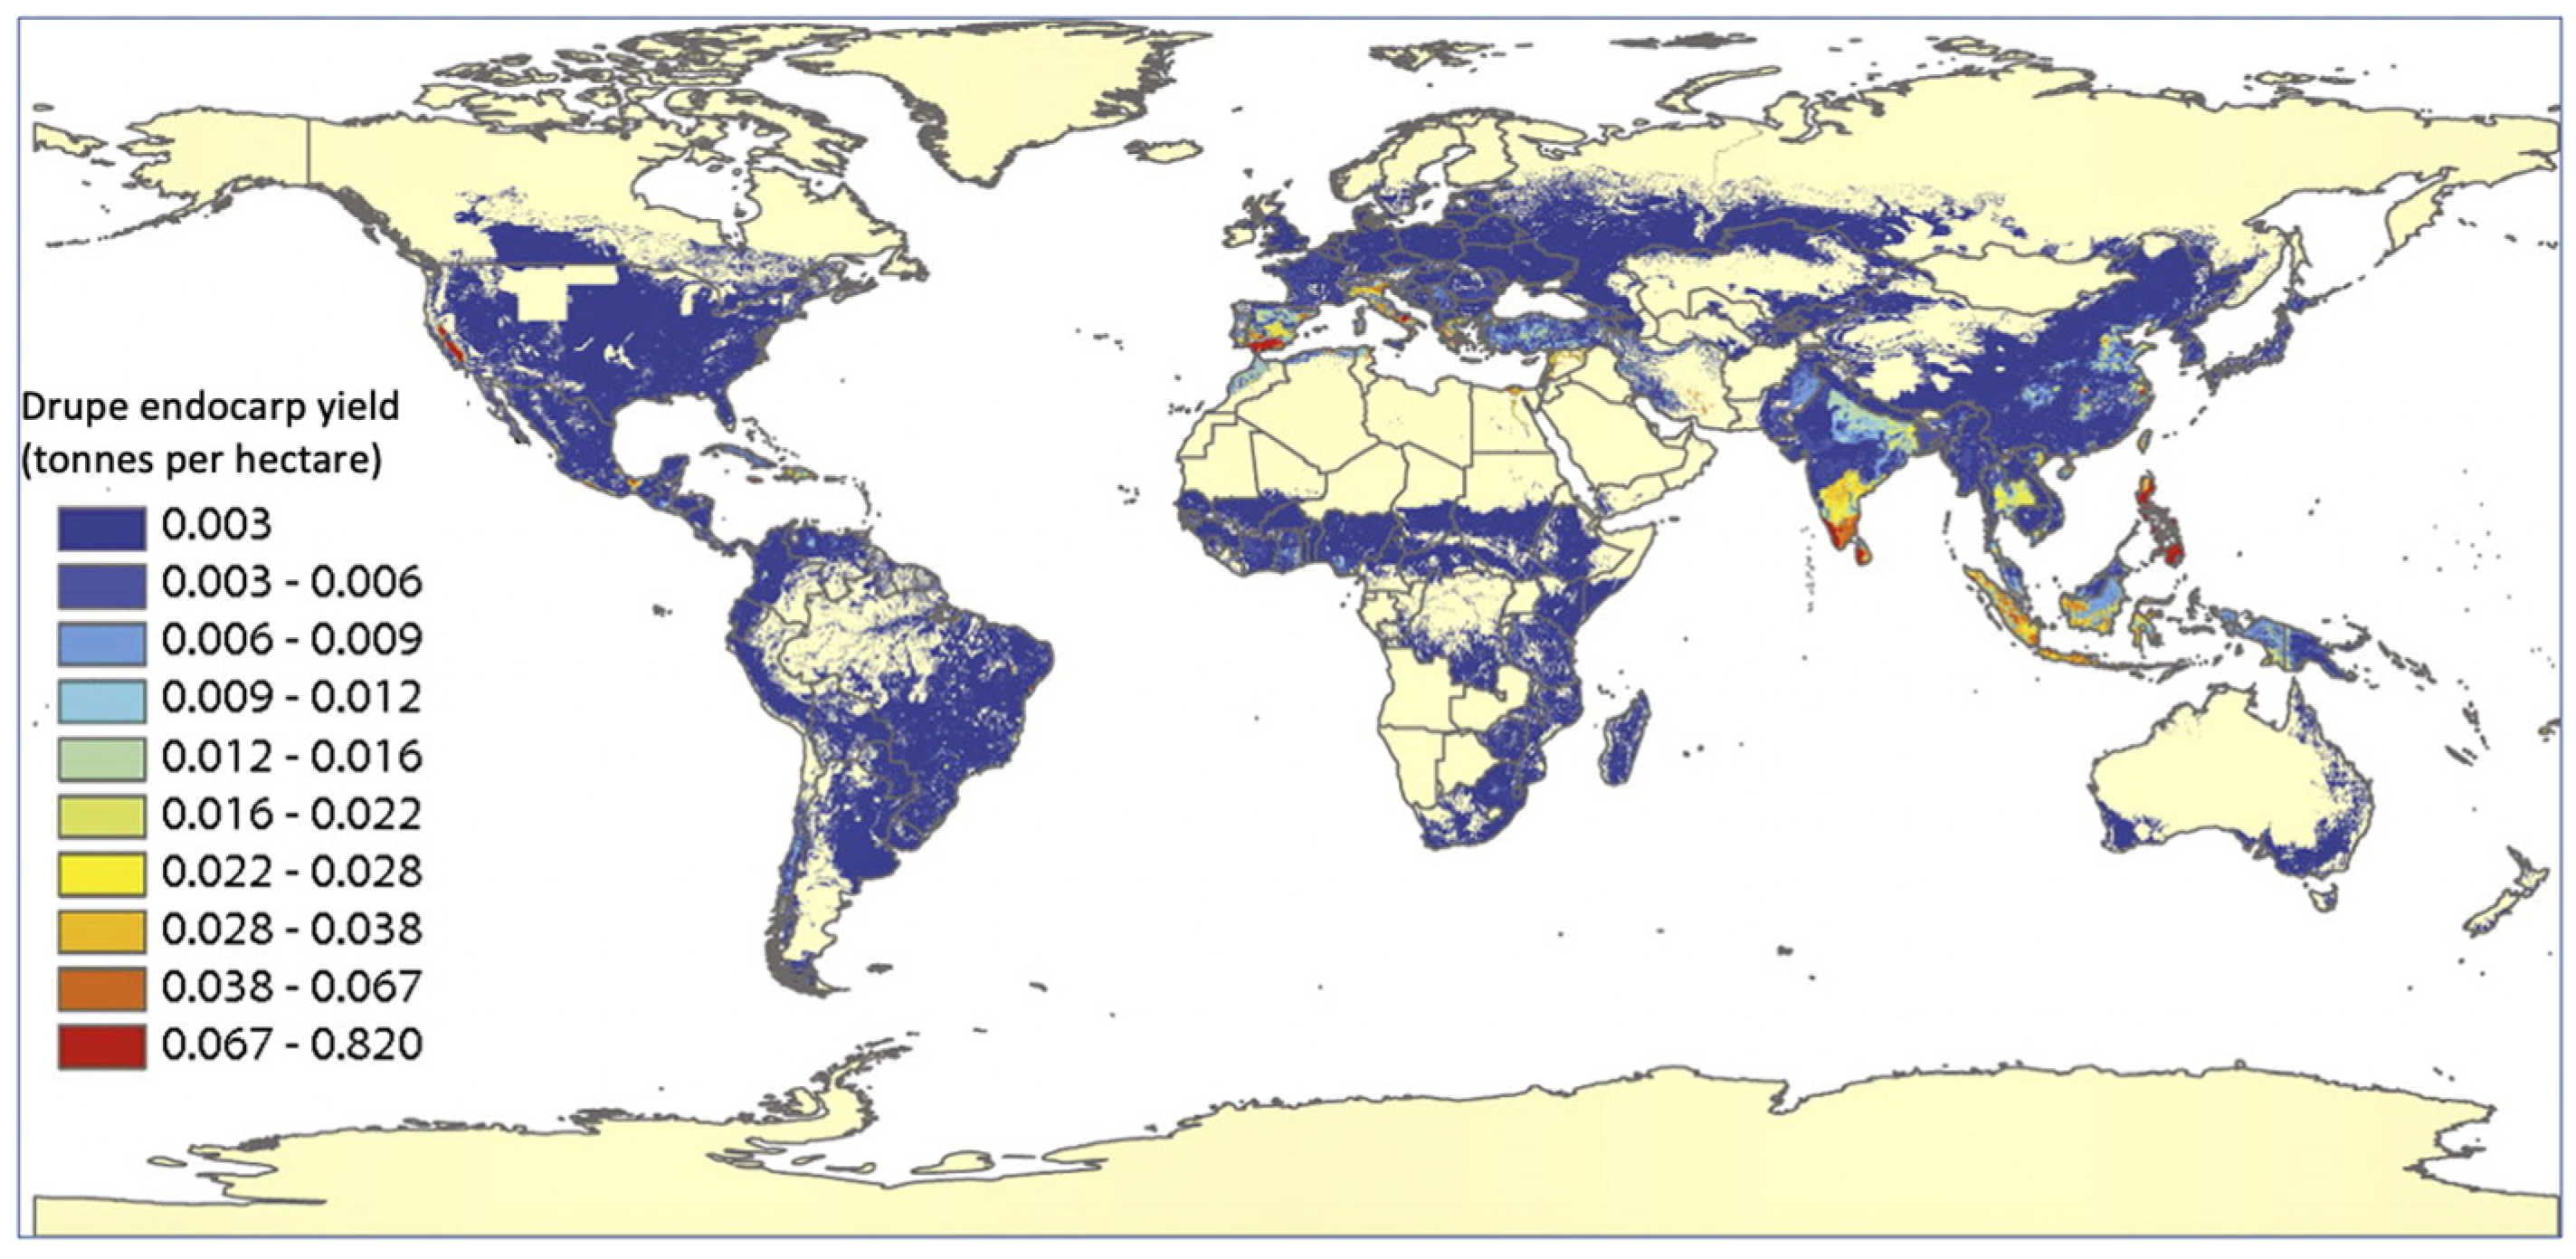
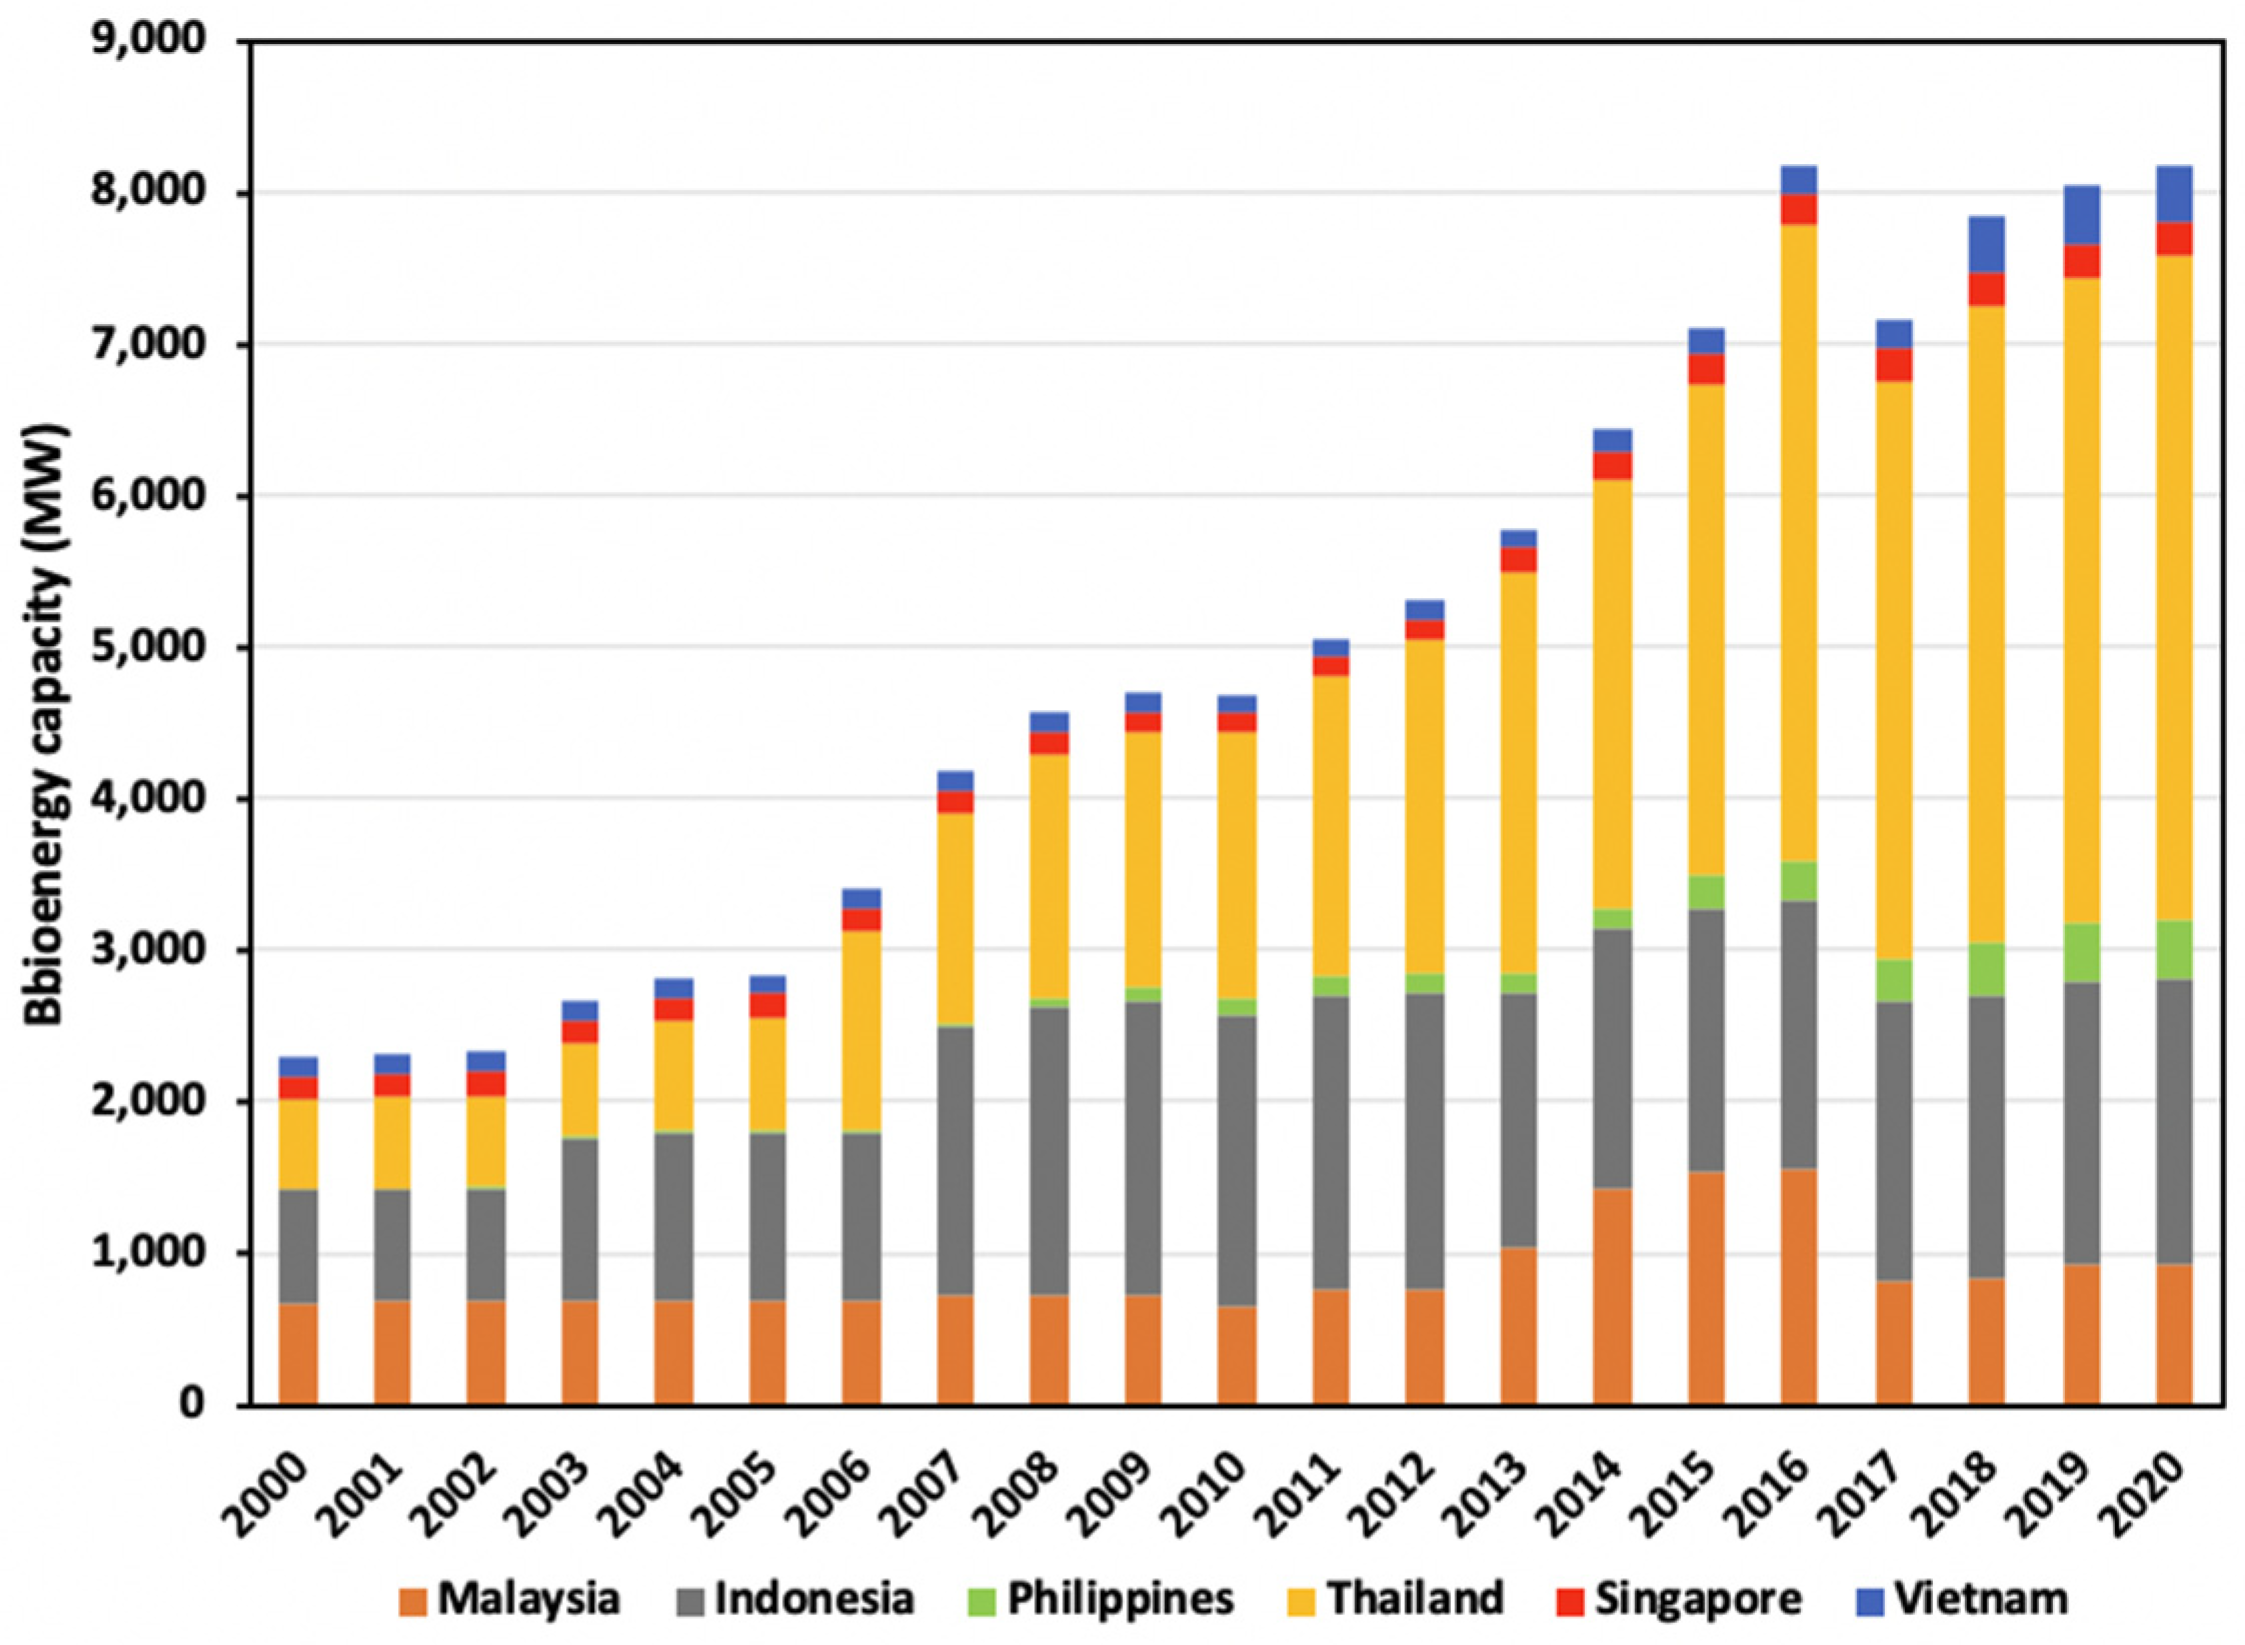
3.1.6. Bioenergy
3.1.7. Sustainability Issues with Bioenergy
3.2. Status of Fossil and Nuclear Energies in ASEAN
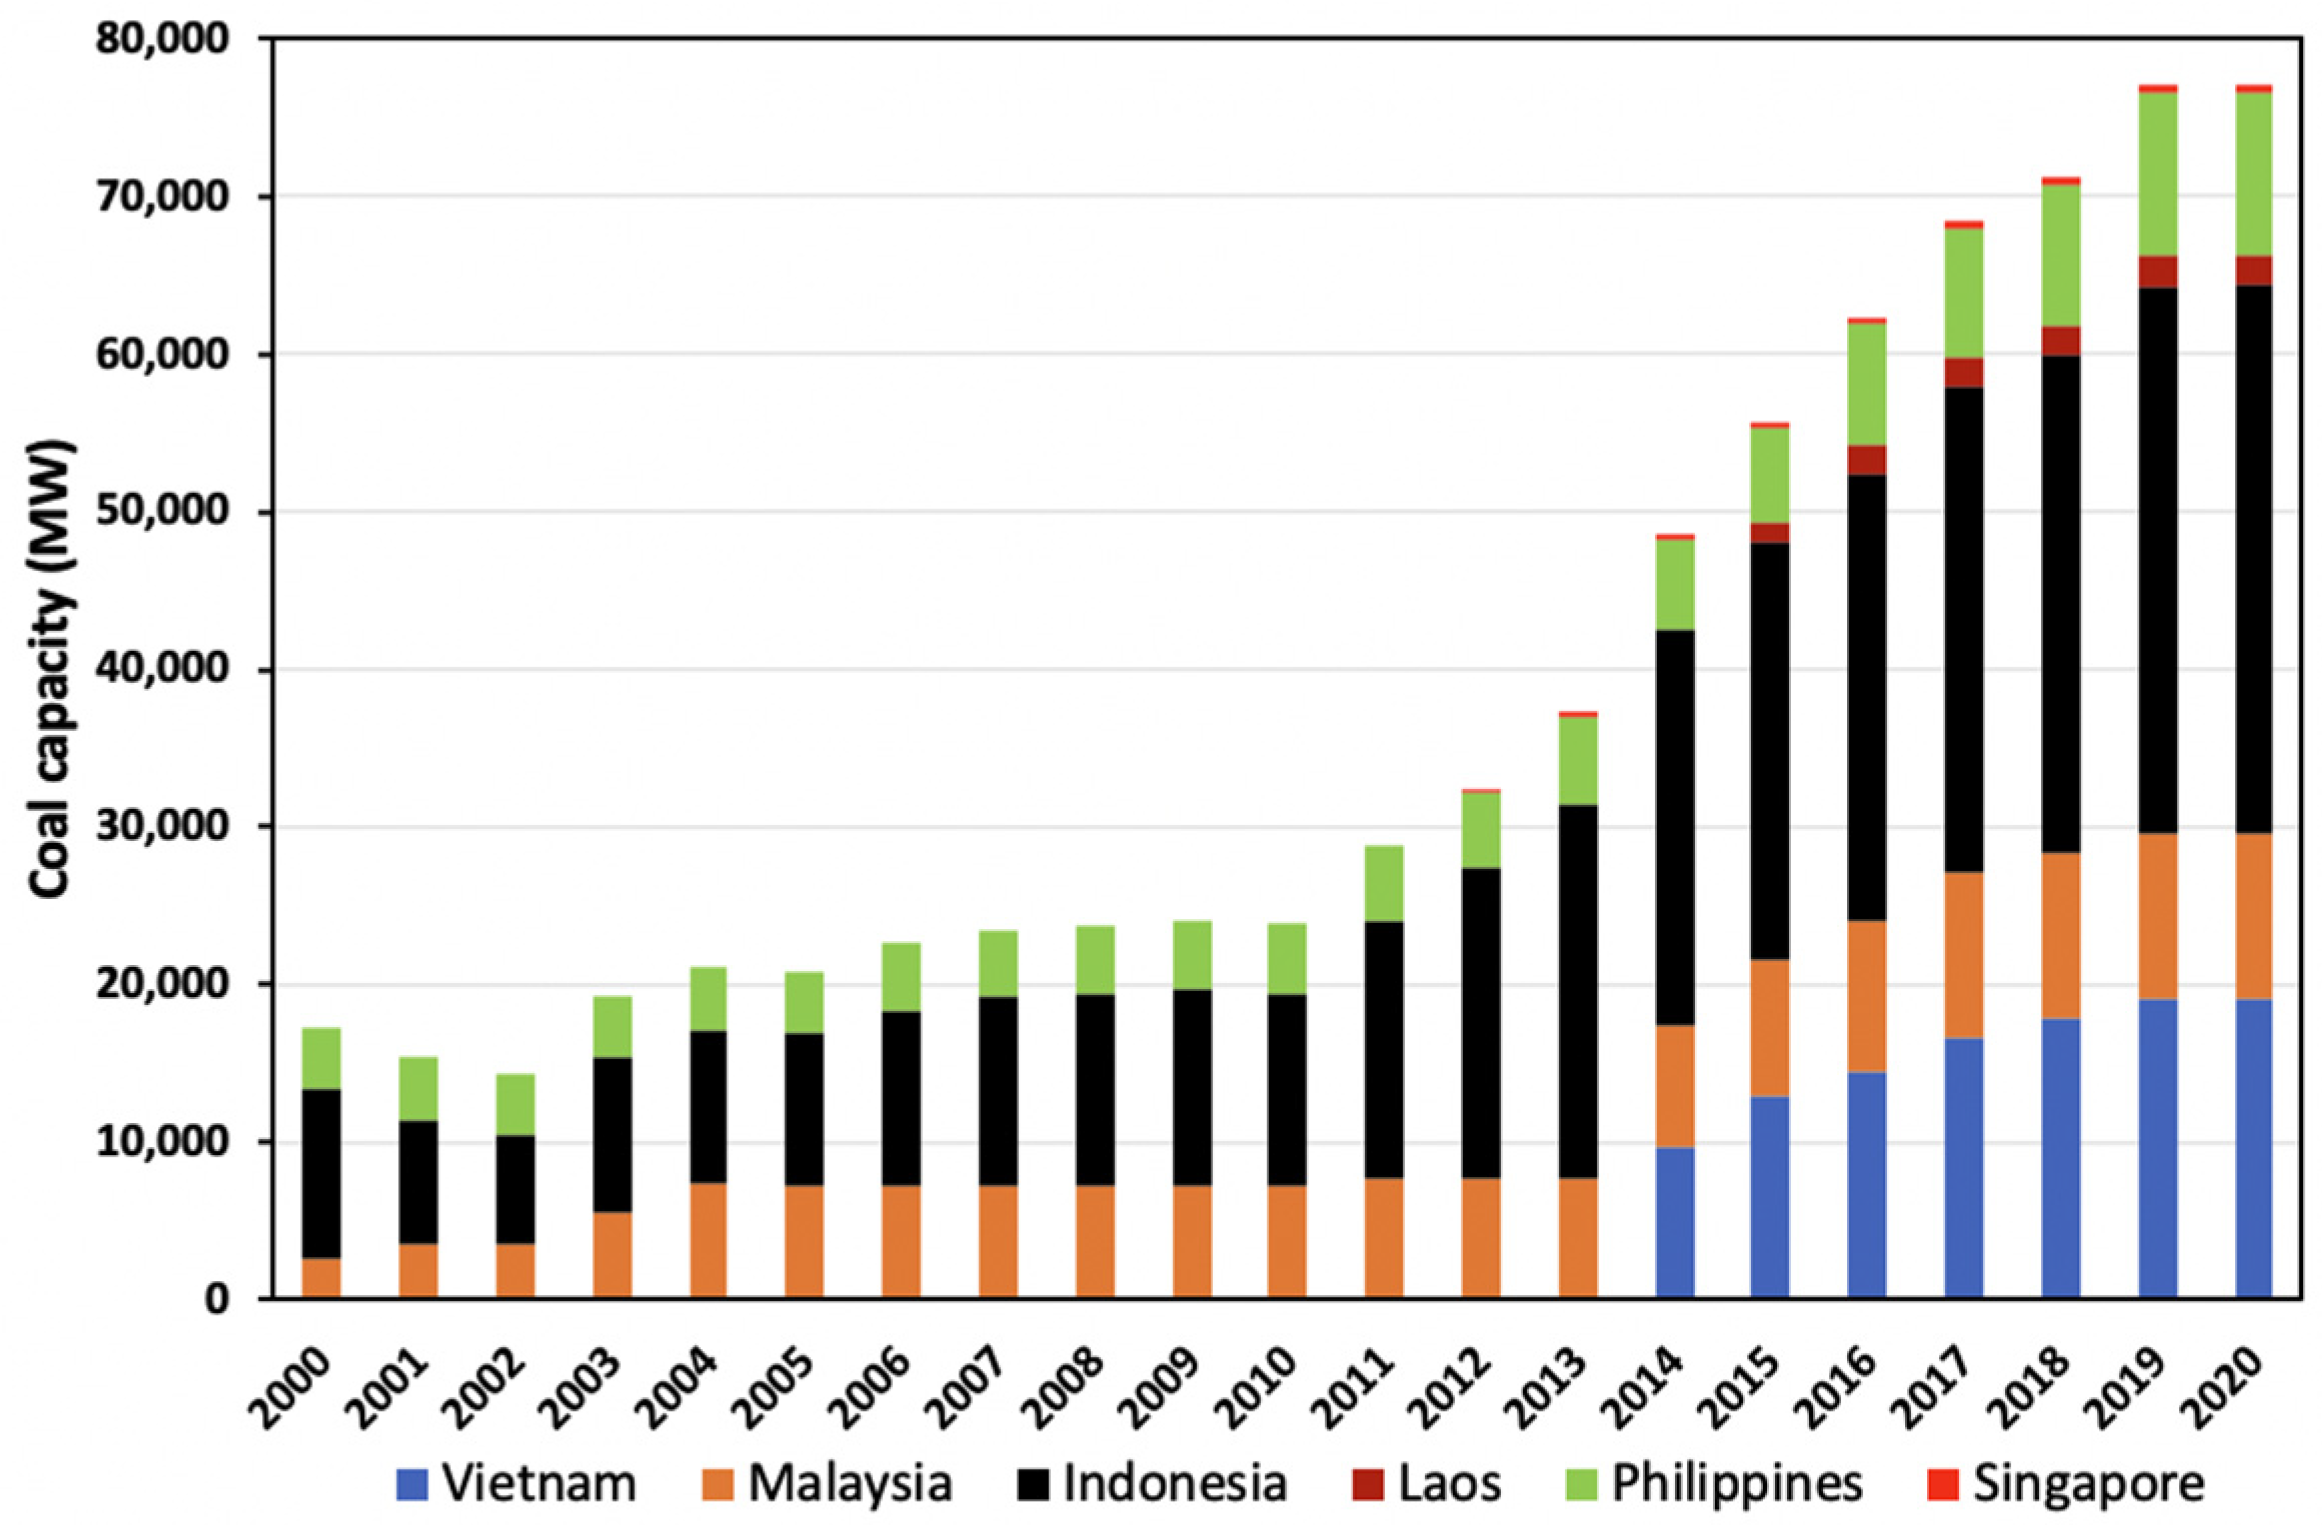
3.2.1. Coal
3.2.2. Sustainability Issues with Coal
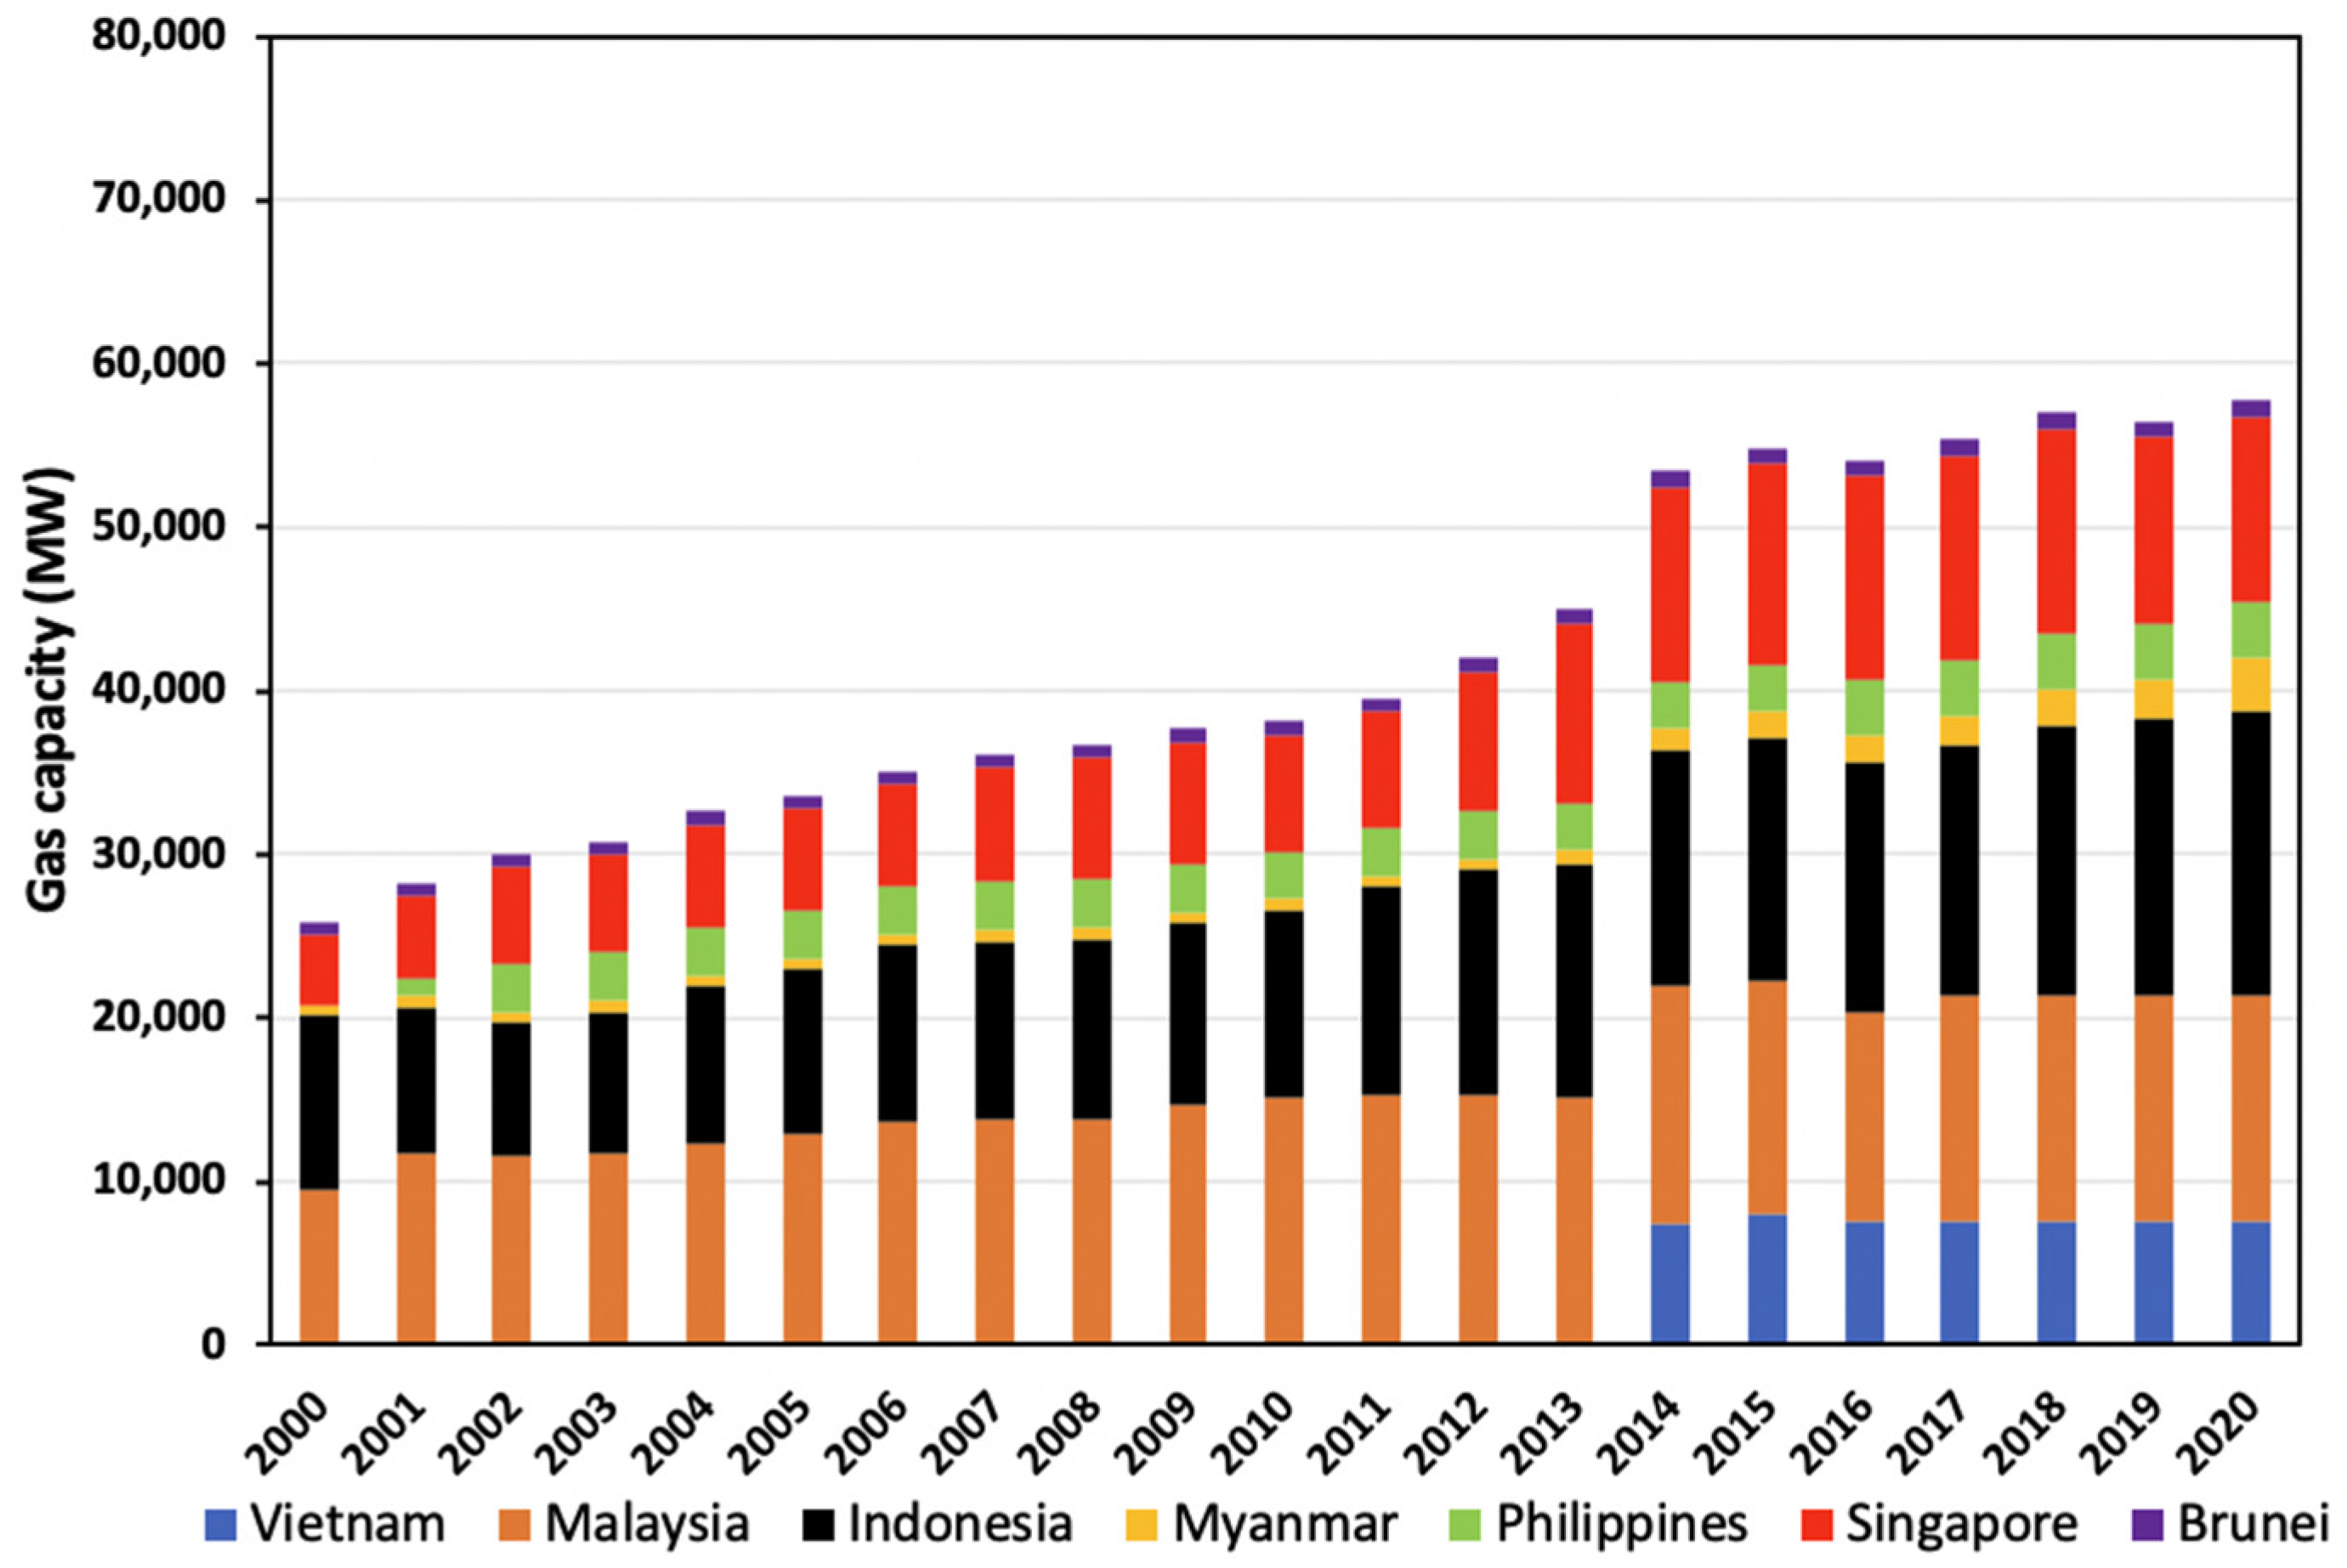
3.2.3. Natural Gas
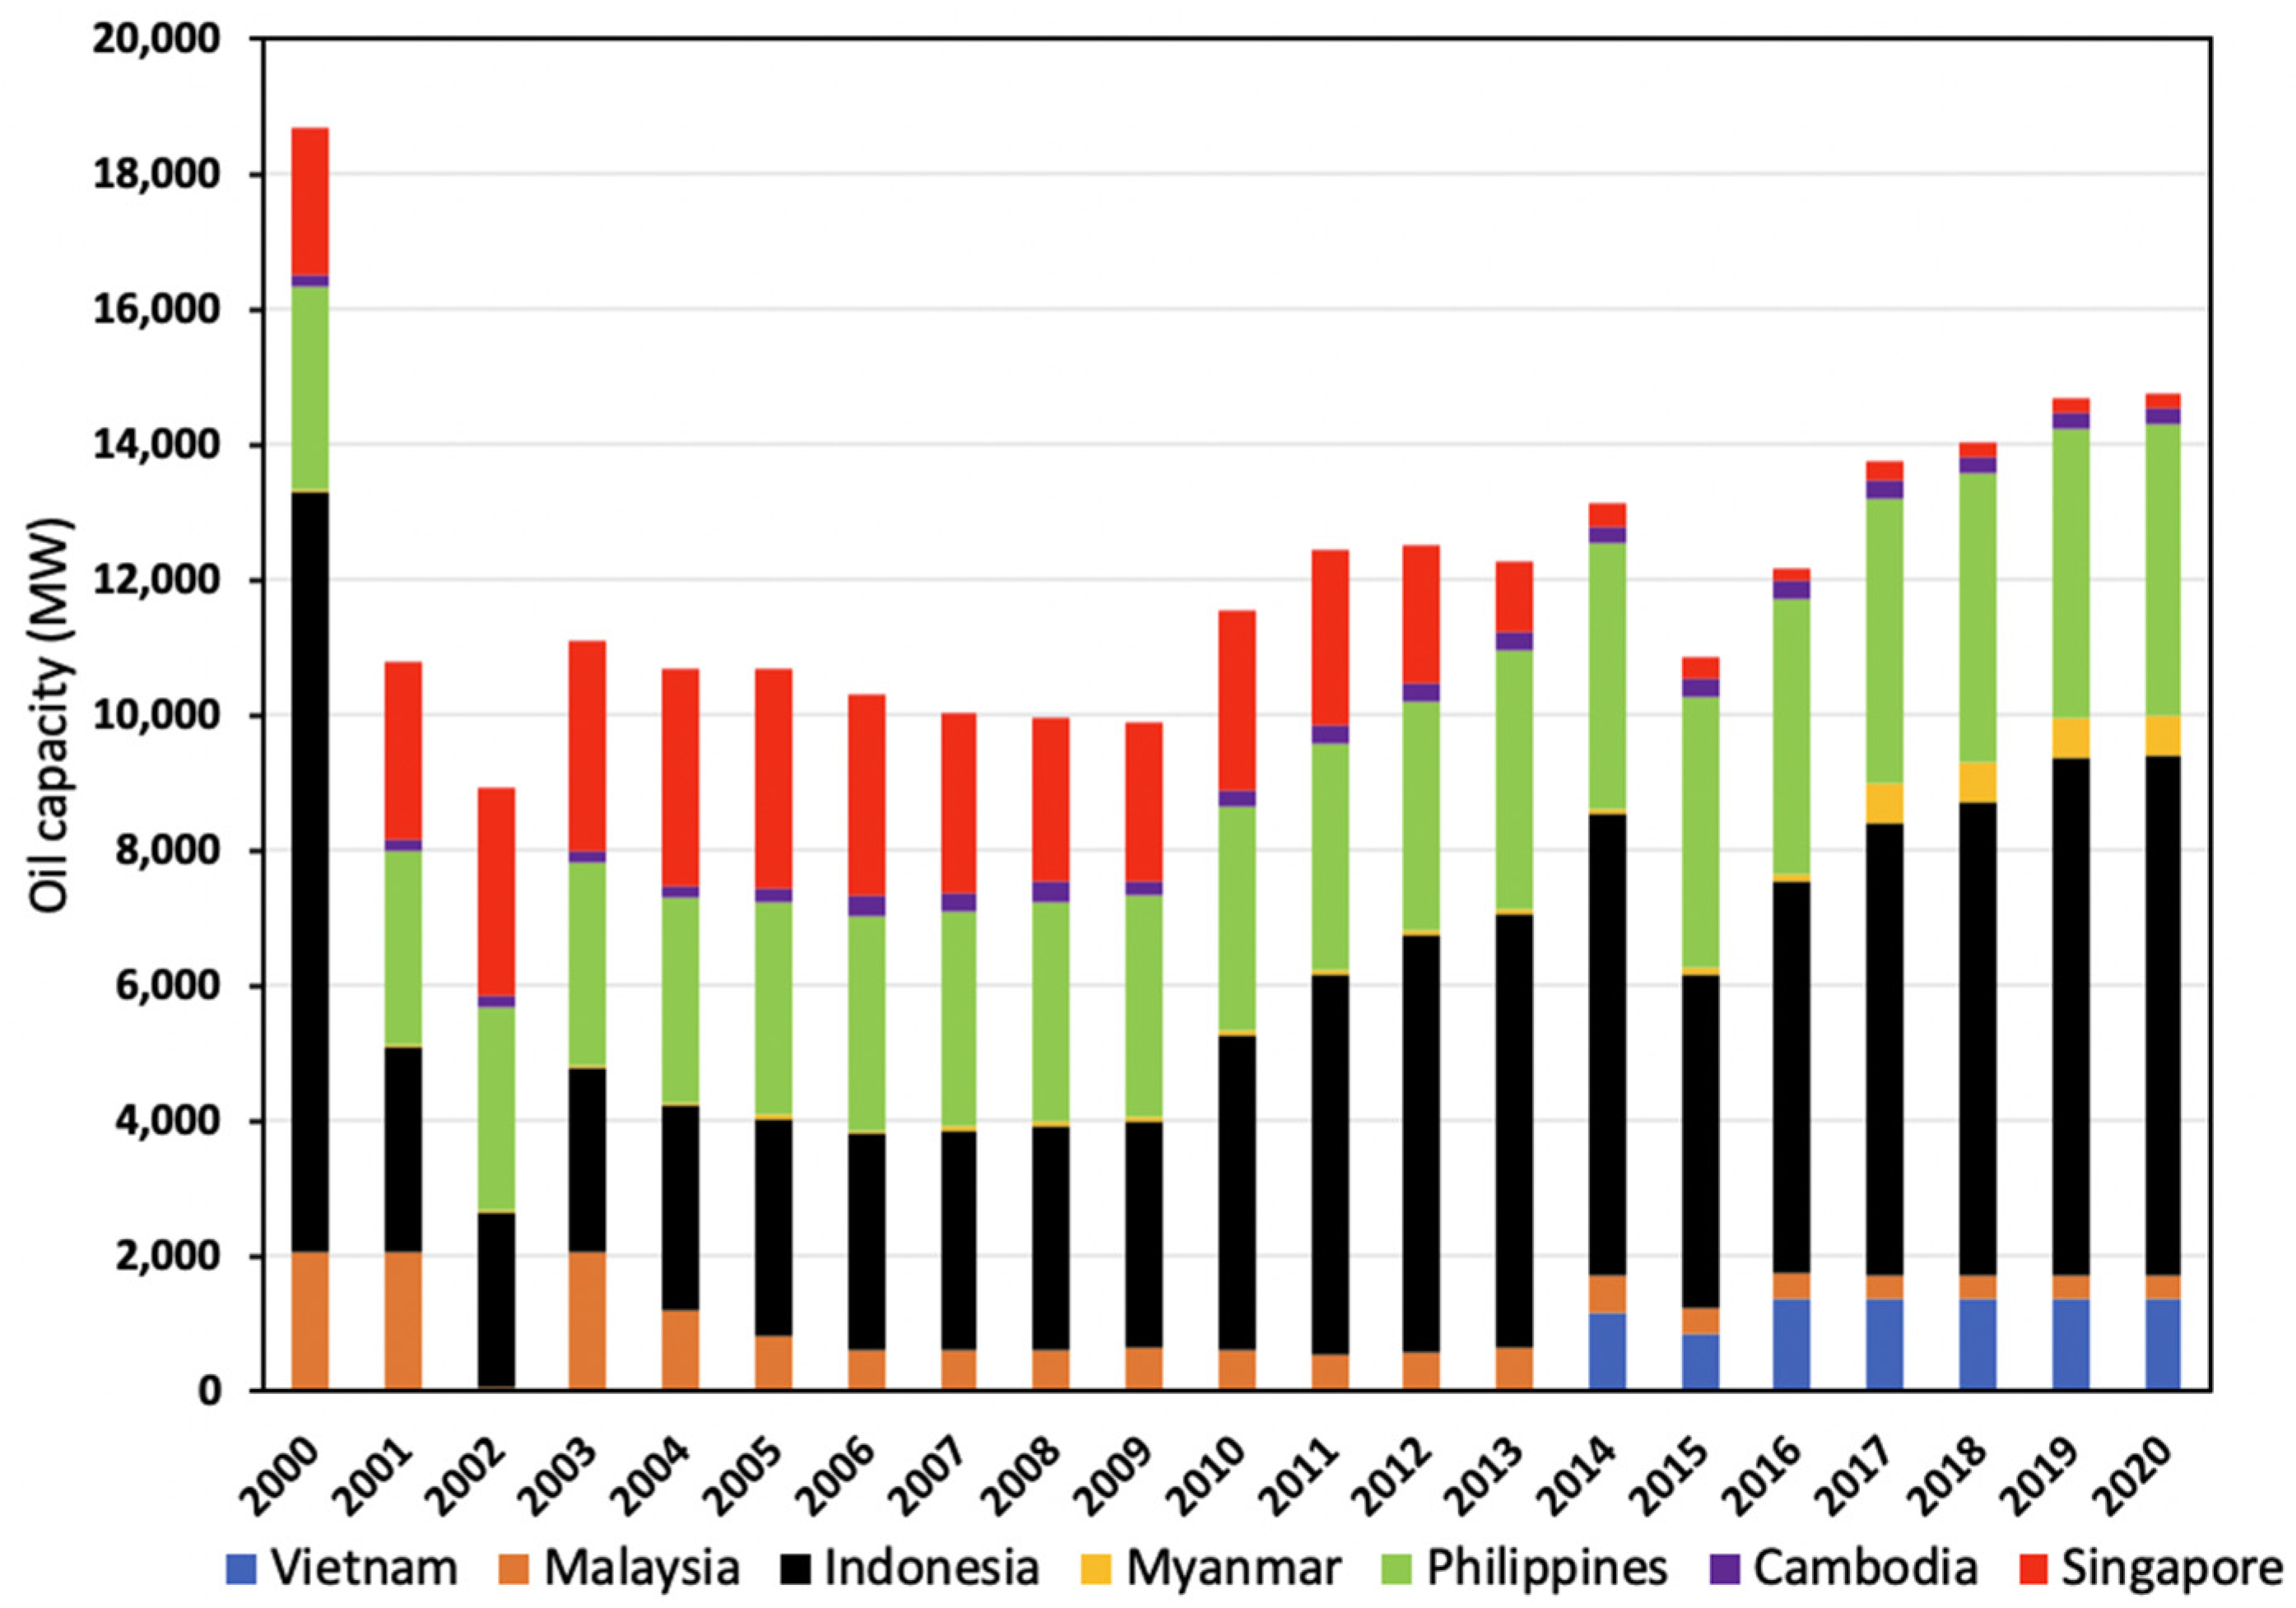
3.2.4. Oil
3.2.5. Nuclear Energy
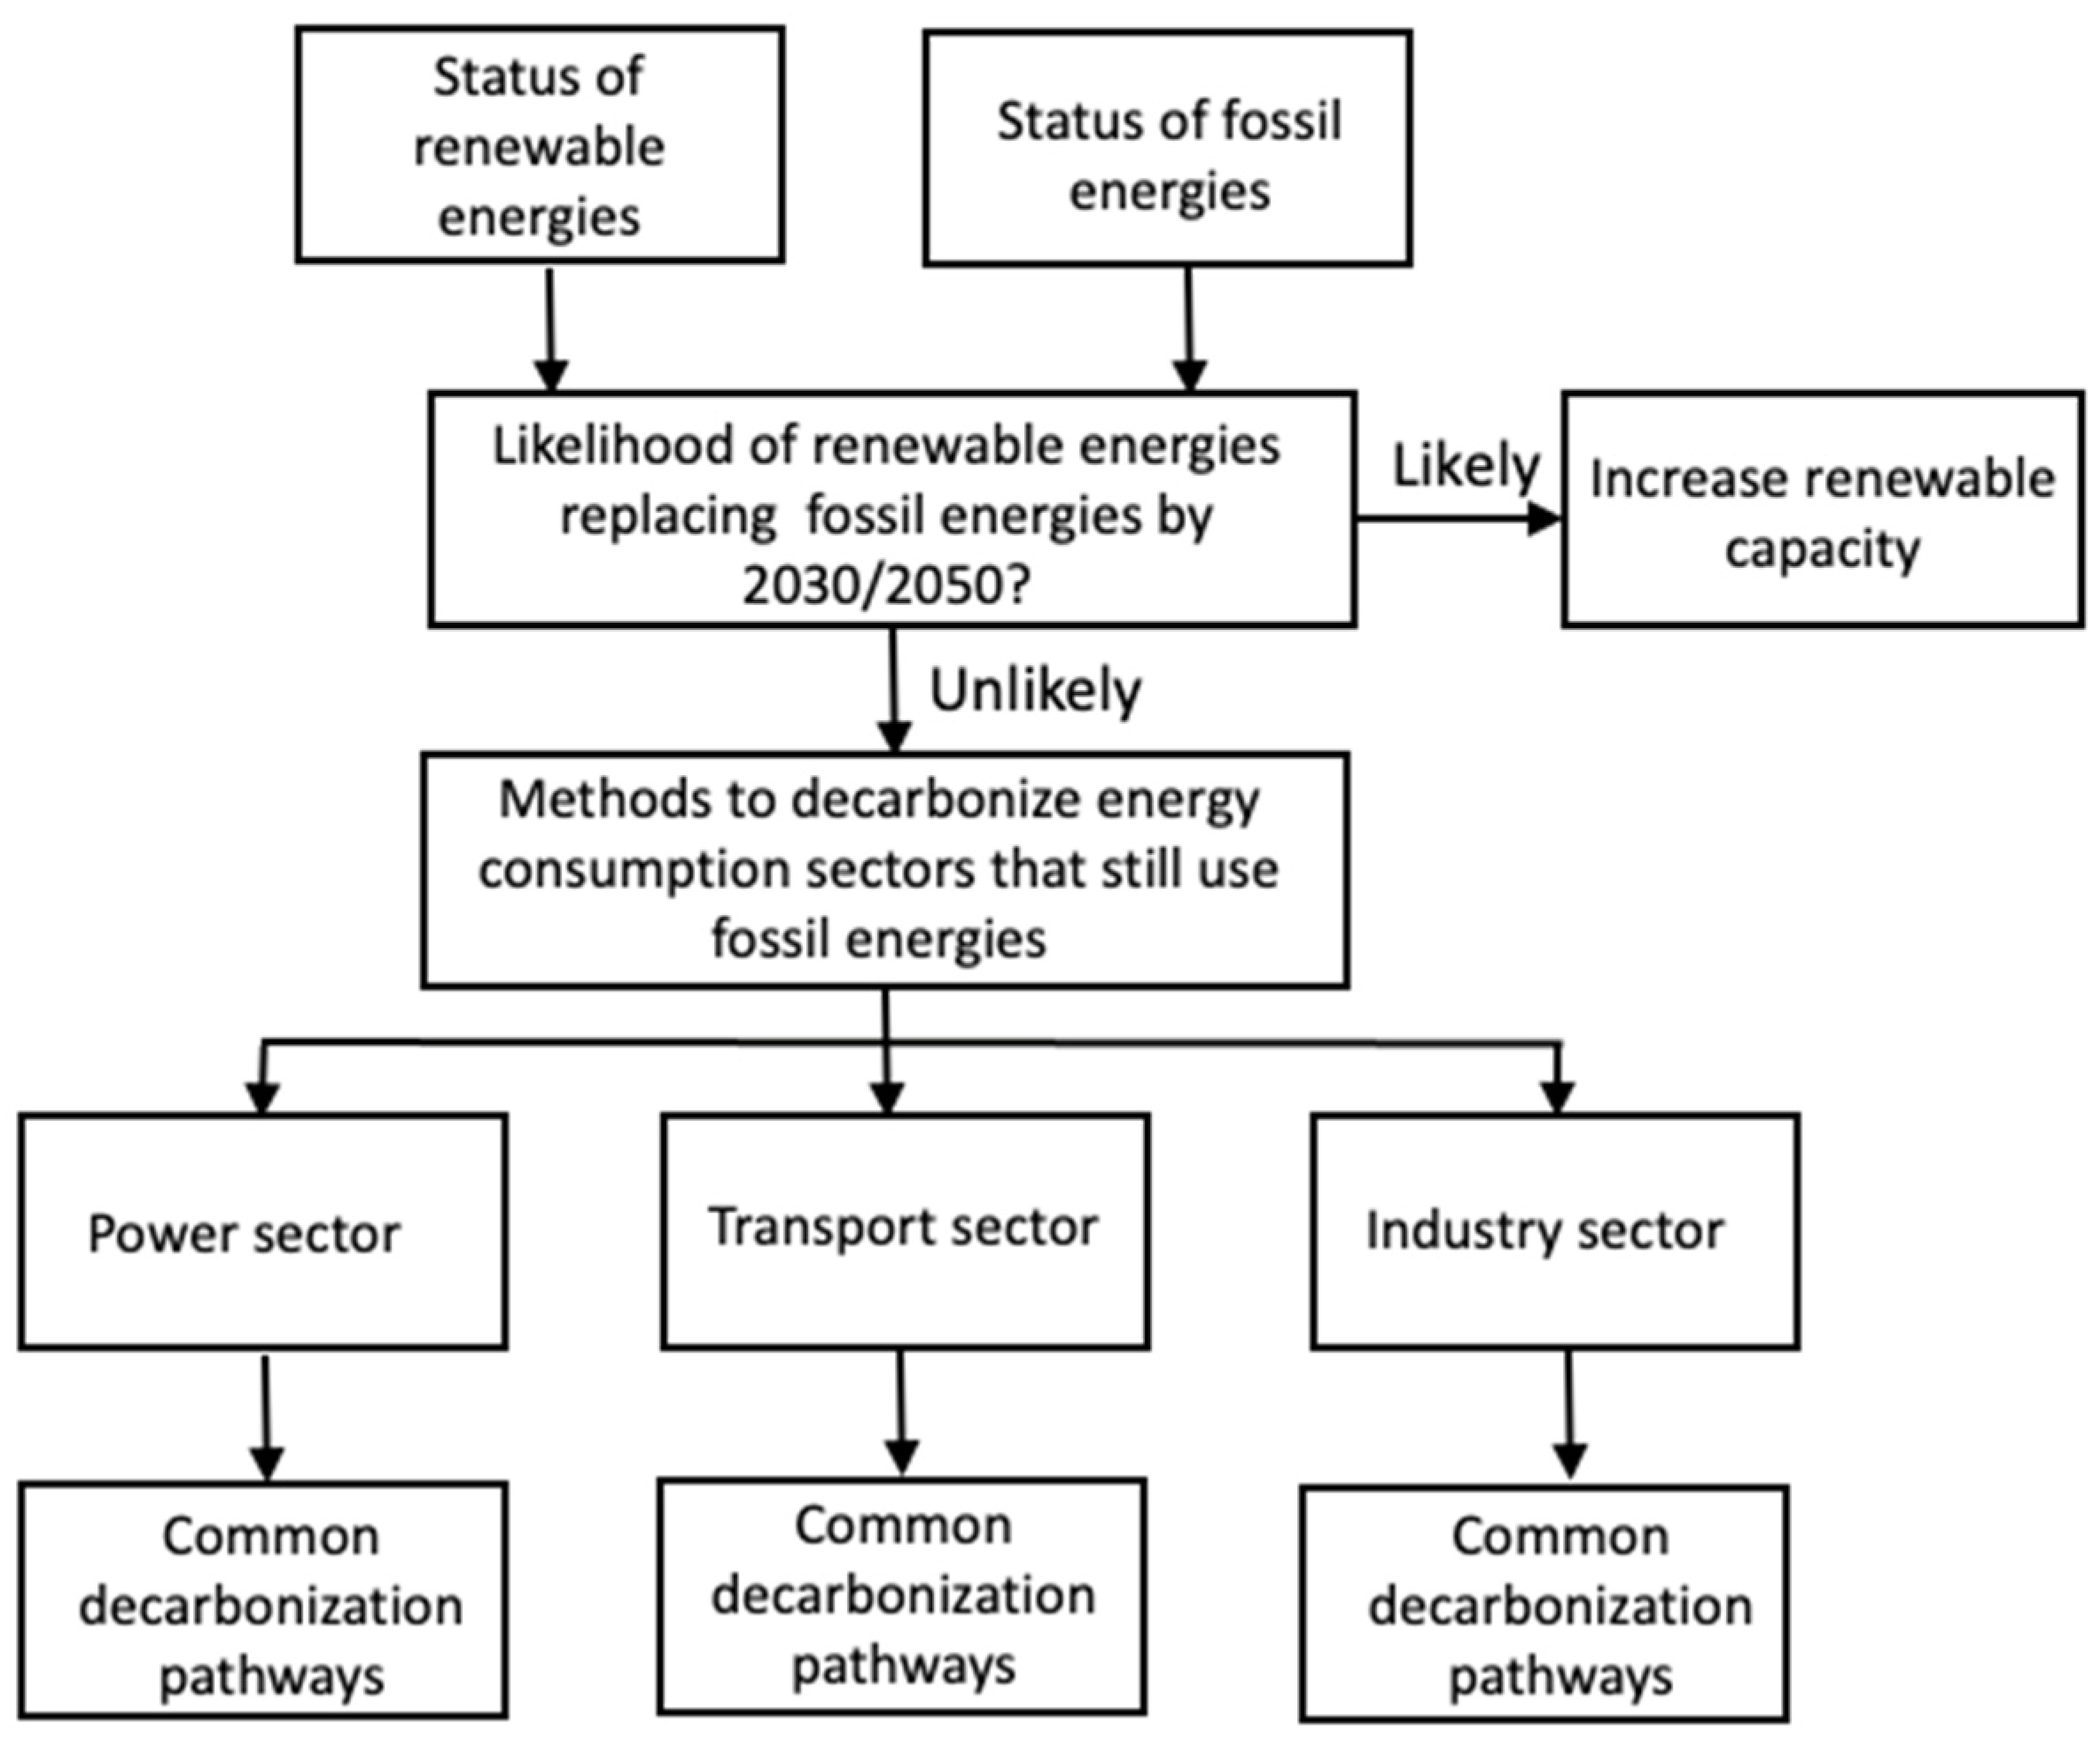
4. Can Renewable Energies Replace Fossil Energies in ASEAN?
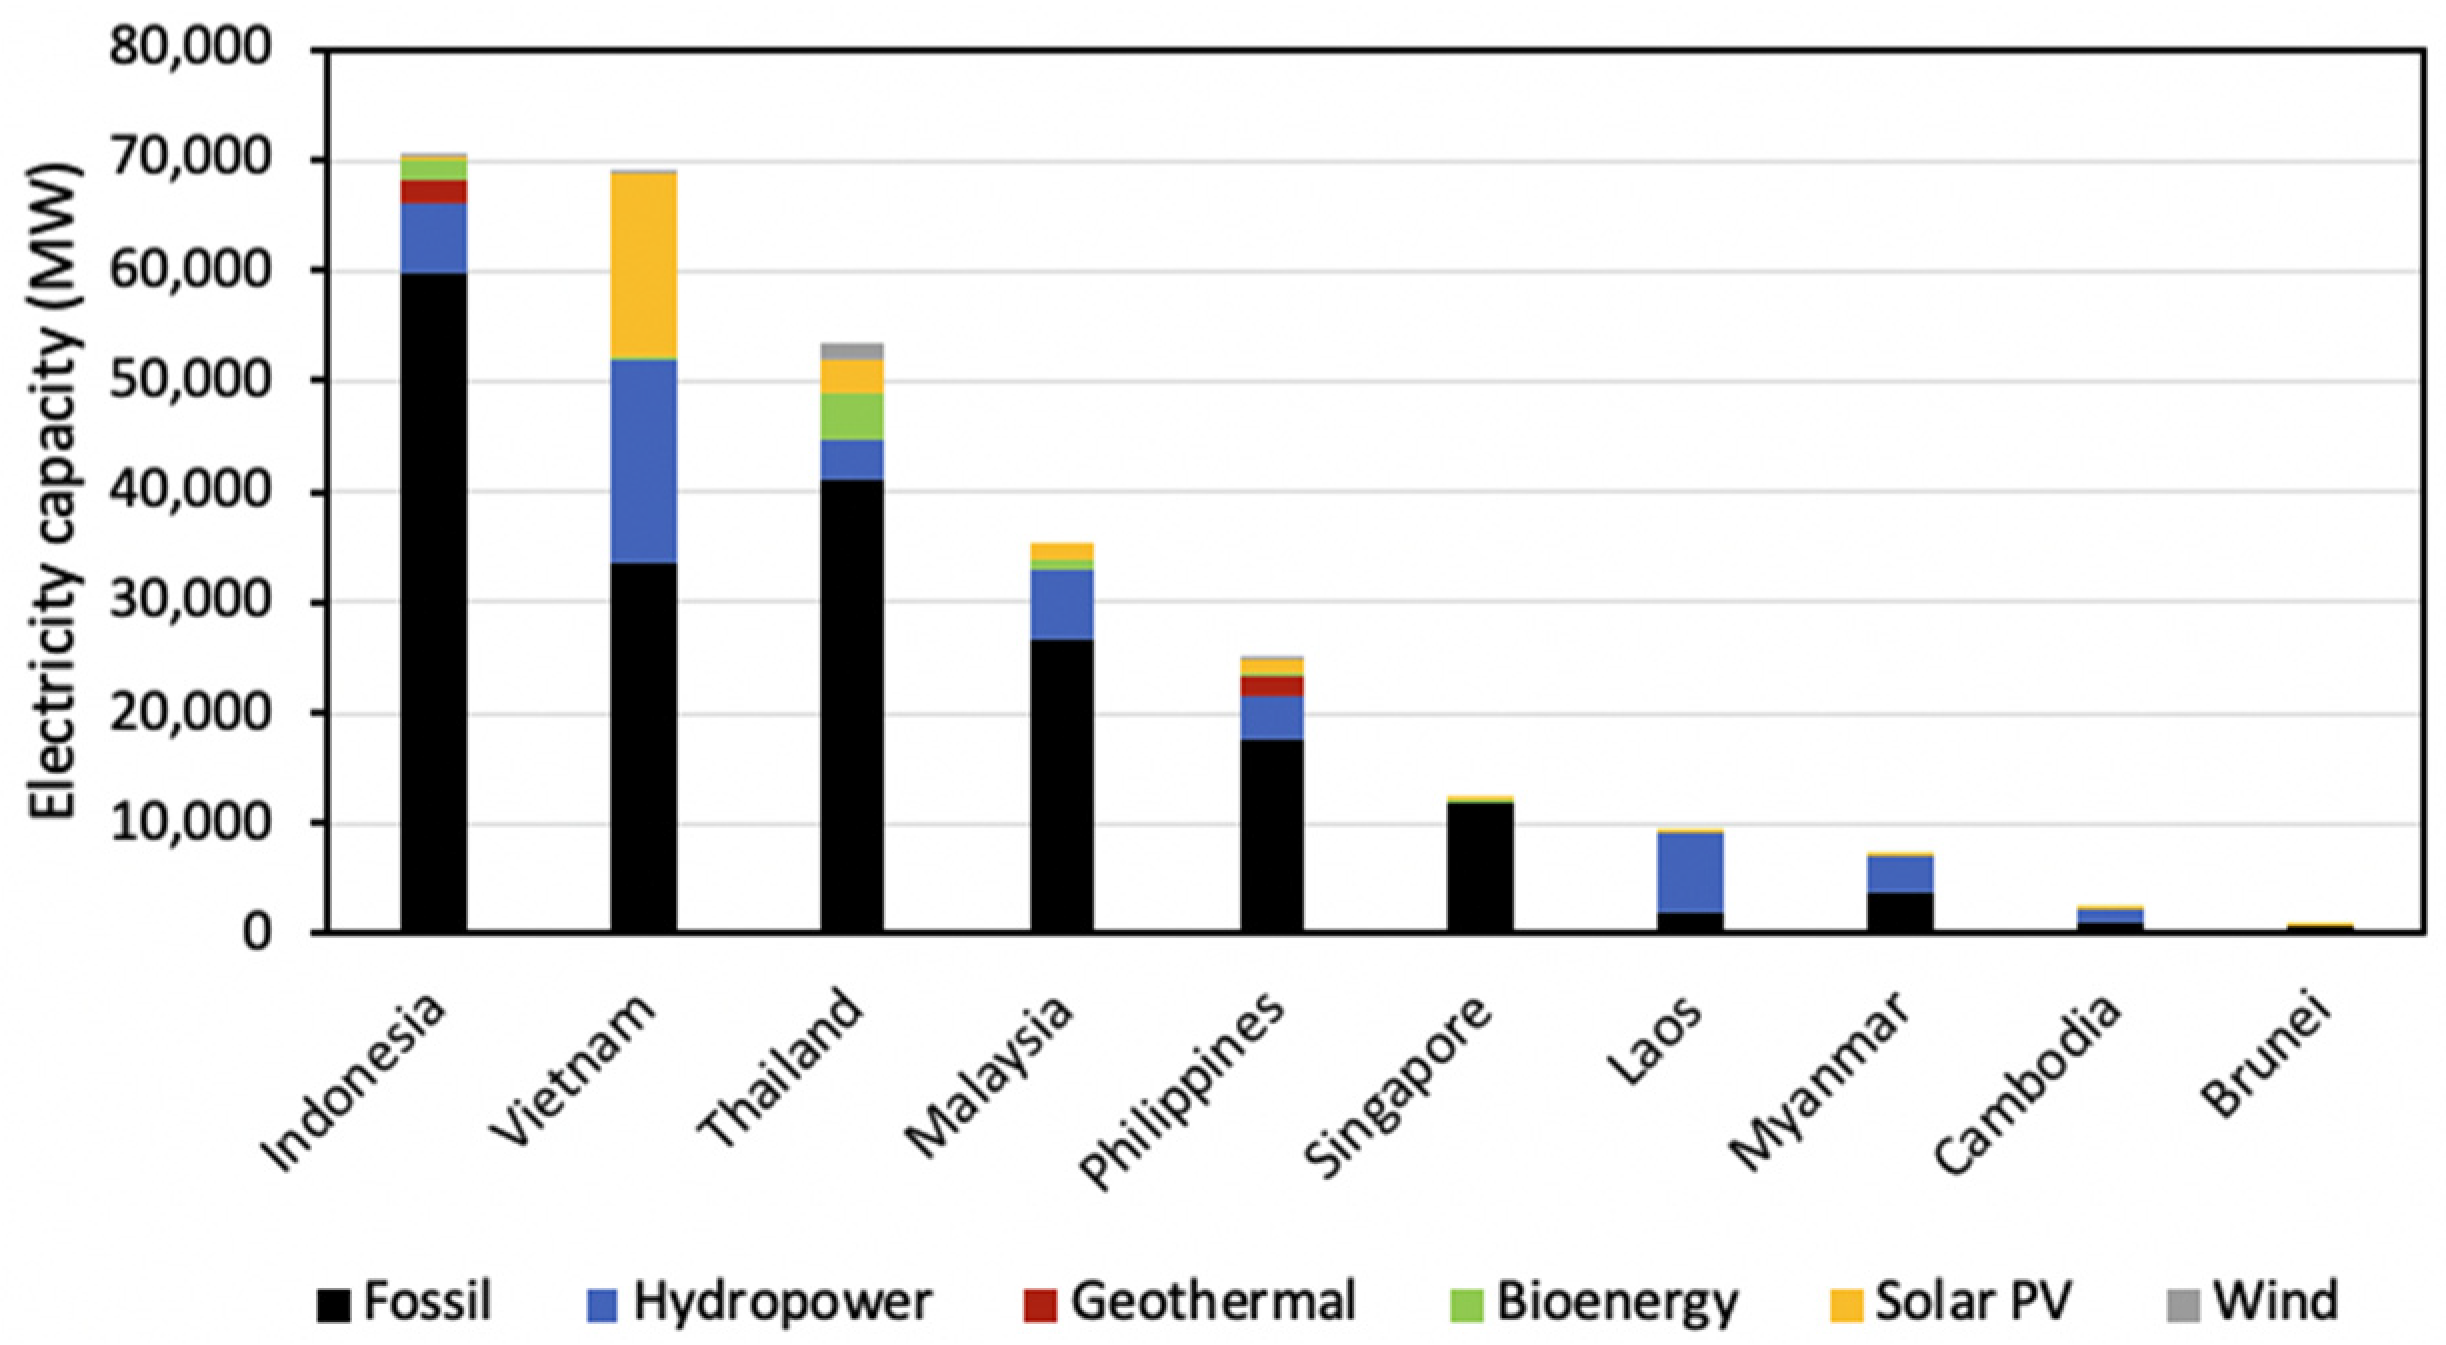
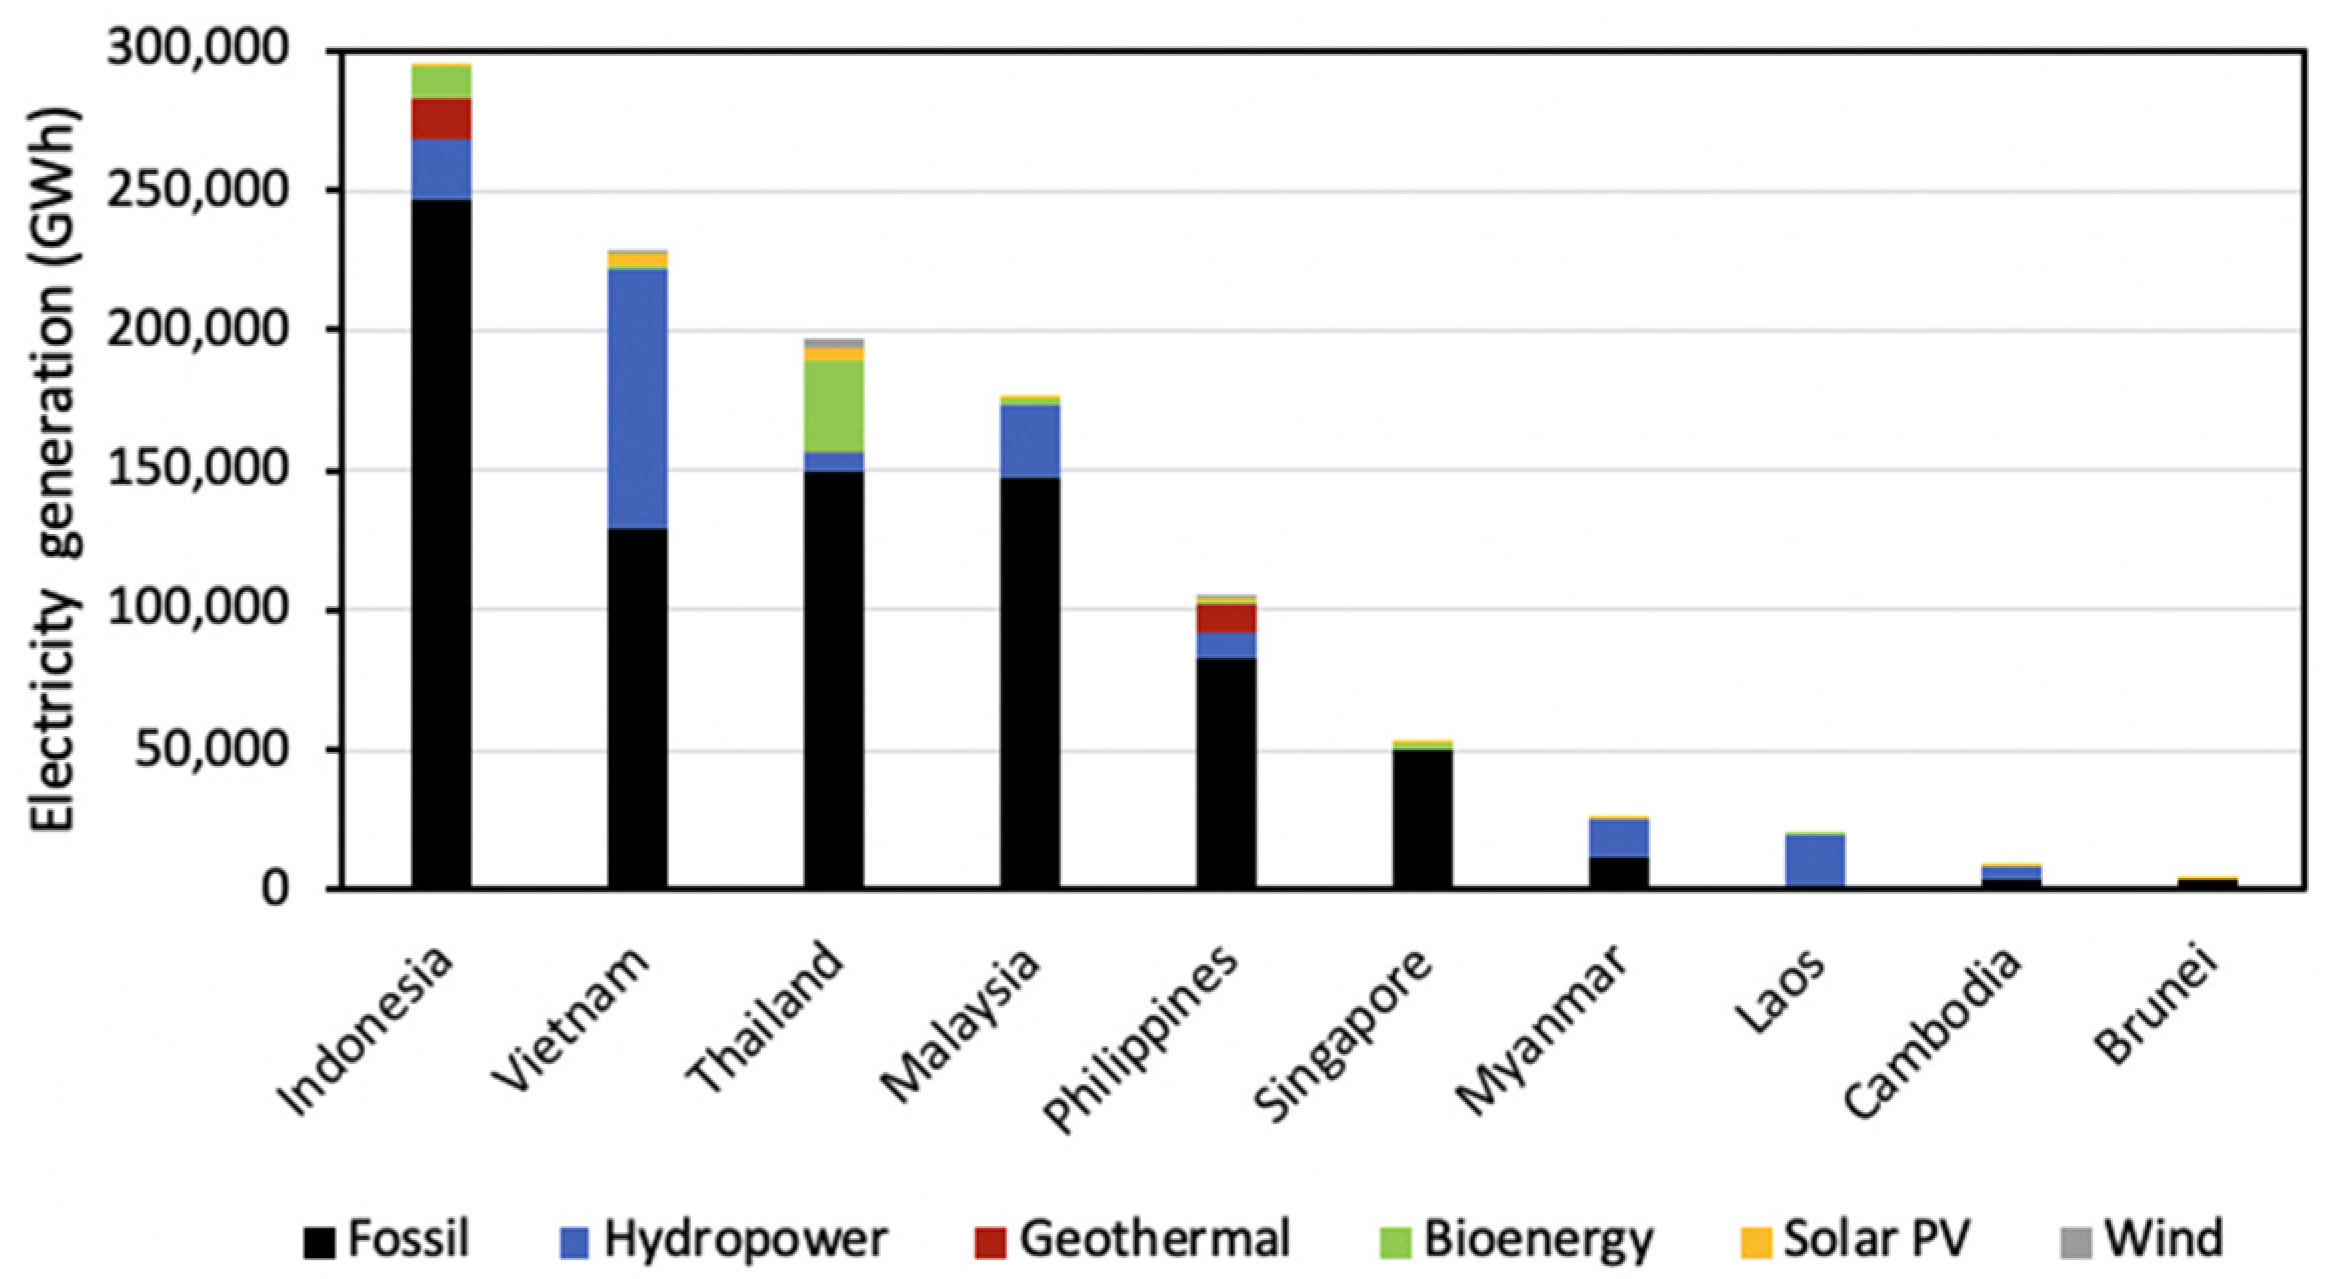
4.1. Status of Electricity Capacity and Generation in ASEAN
4.2. Status of Energy Consumption in ASEAN
5. Decarbonization of Major Energy-Consumption Sectors
5.1. Decarbonizing the Power Sector
5.2. Decarbonizing the Transport Sector
5.3. Decarbonizing the Industry Sector
5.4. Role of CCS in Decarbonization of ASEAN
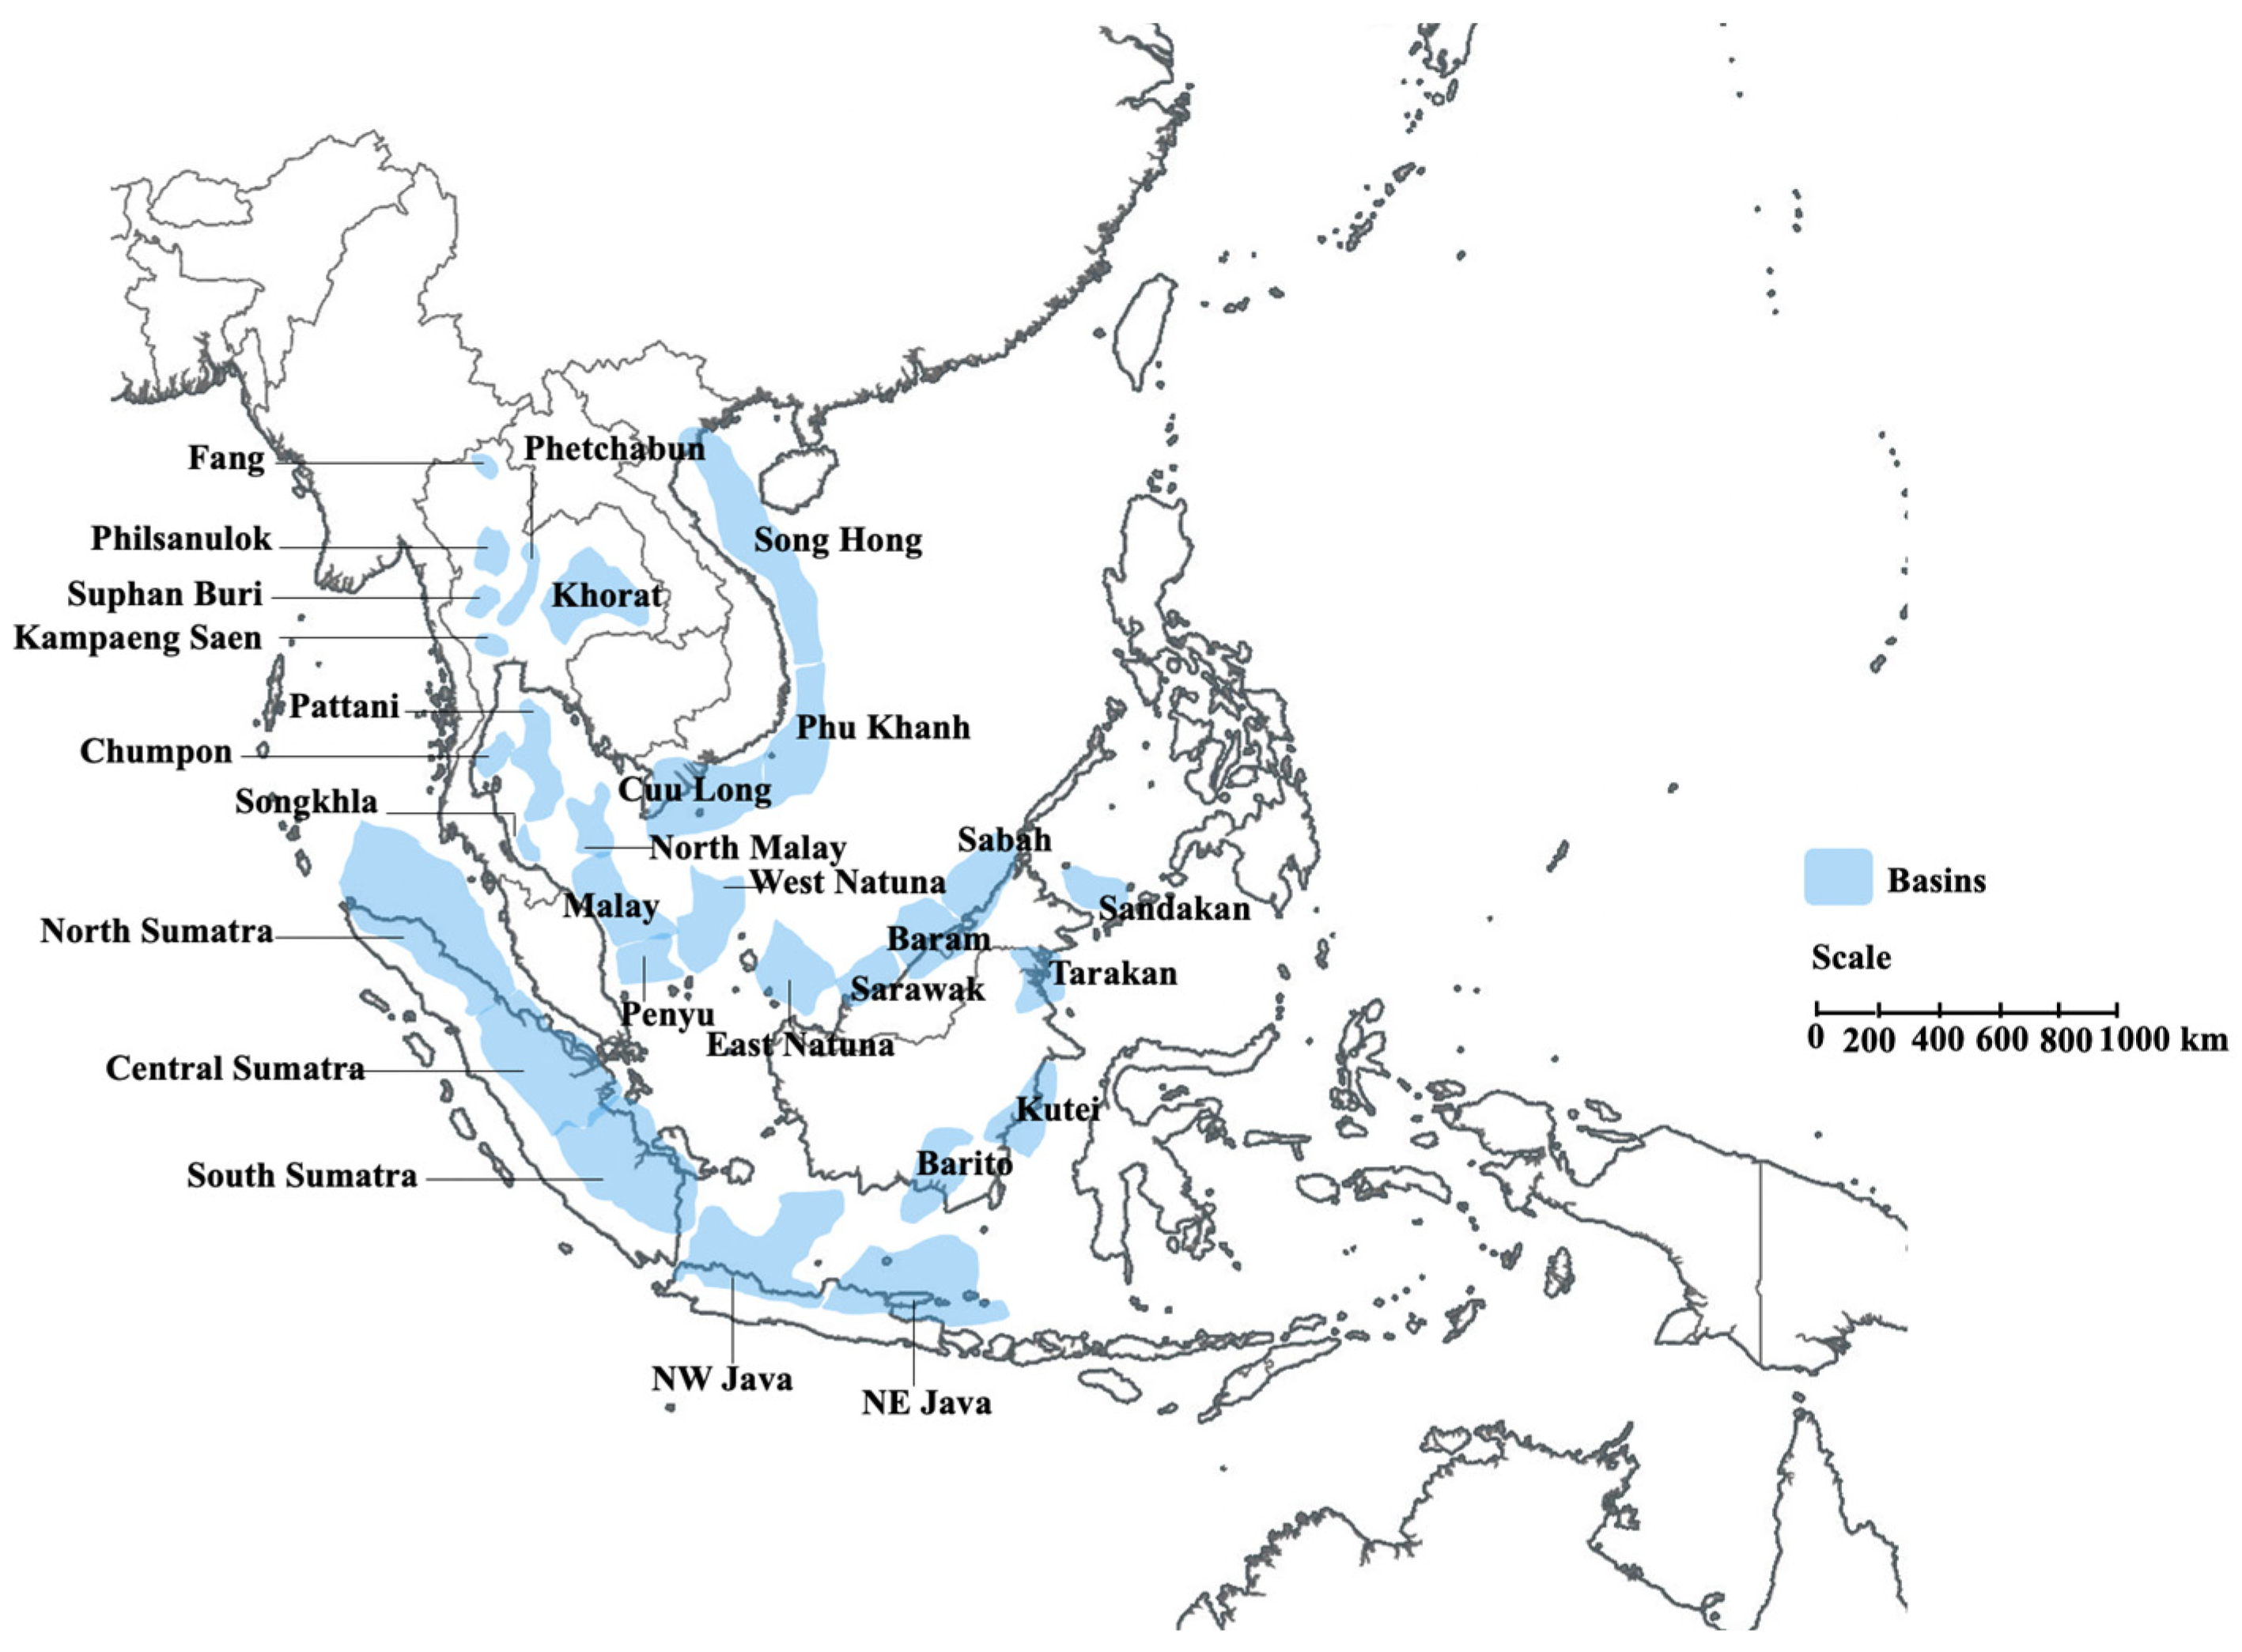
5.4.1. CO2 Storage Capacity in ASEAN’s Sedimentary Basins
5.4.2. First-Mover CCS Projects across ASEAN
5.5. Sustainability Rating of Decarbonizing Technologies
6. Decarbonization Pathways for ASEAN
6.1. Increasing the Share of Sustainable Renewable Energies in Power Generation
6.2. Switching from Coal to Gas in Power Generation
6.3. Electricification of Road Transport
6.4. Hydrogen Fuel for Marine Transport
6.5. Biofuels for Aviation
6.6. Blue Hydrogen for Industry
6.7. CCS Corridors
7. Policy Implications
7.1. Dealing with Sustainability Issues with Hydropower and Bioenergy
7.2. Establishing a Roadmap for Electric Vehicles
7.3. Introducing a Credible Carbon Tax
7.4. Holding Public Engagement on CCS
7.5. Establishing Cross-Border CCS Corridors
7.6. Setting a National Hydrogen Strategy
7.7. Public-Private Partnerships to Promote Energy Transition
8. Discussions
9. Conclusions
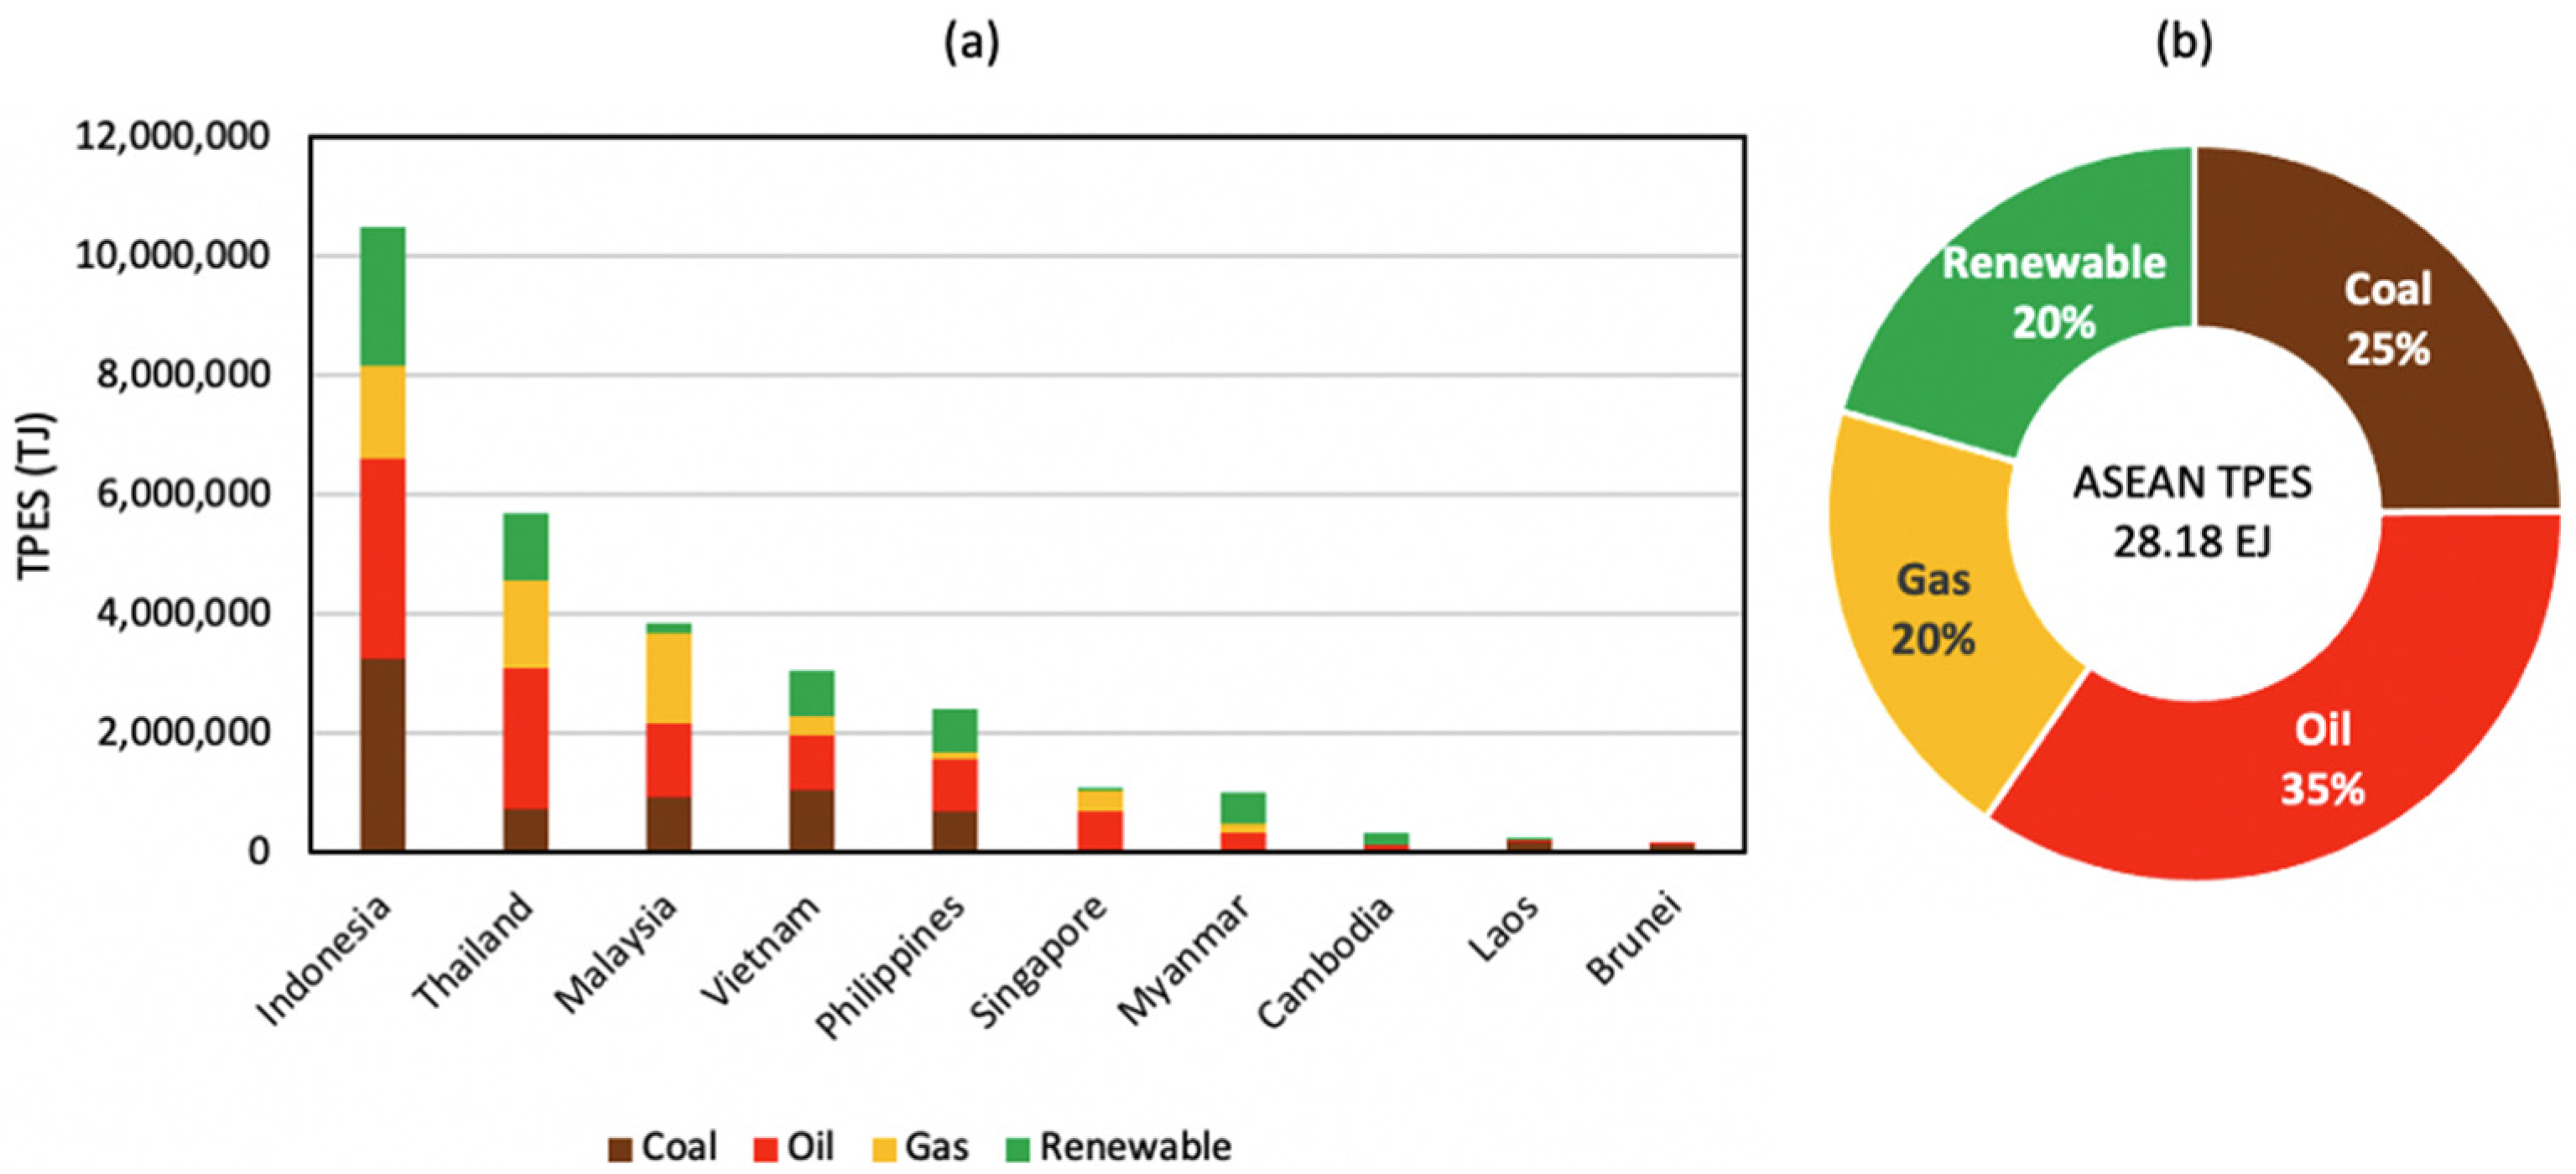
- As of 2018, ASEAN’s TPES consisted of 20% renewables, 25% coal, 35% oil and 20% gas.
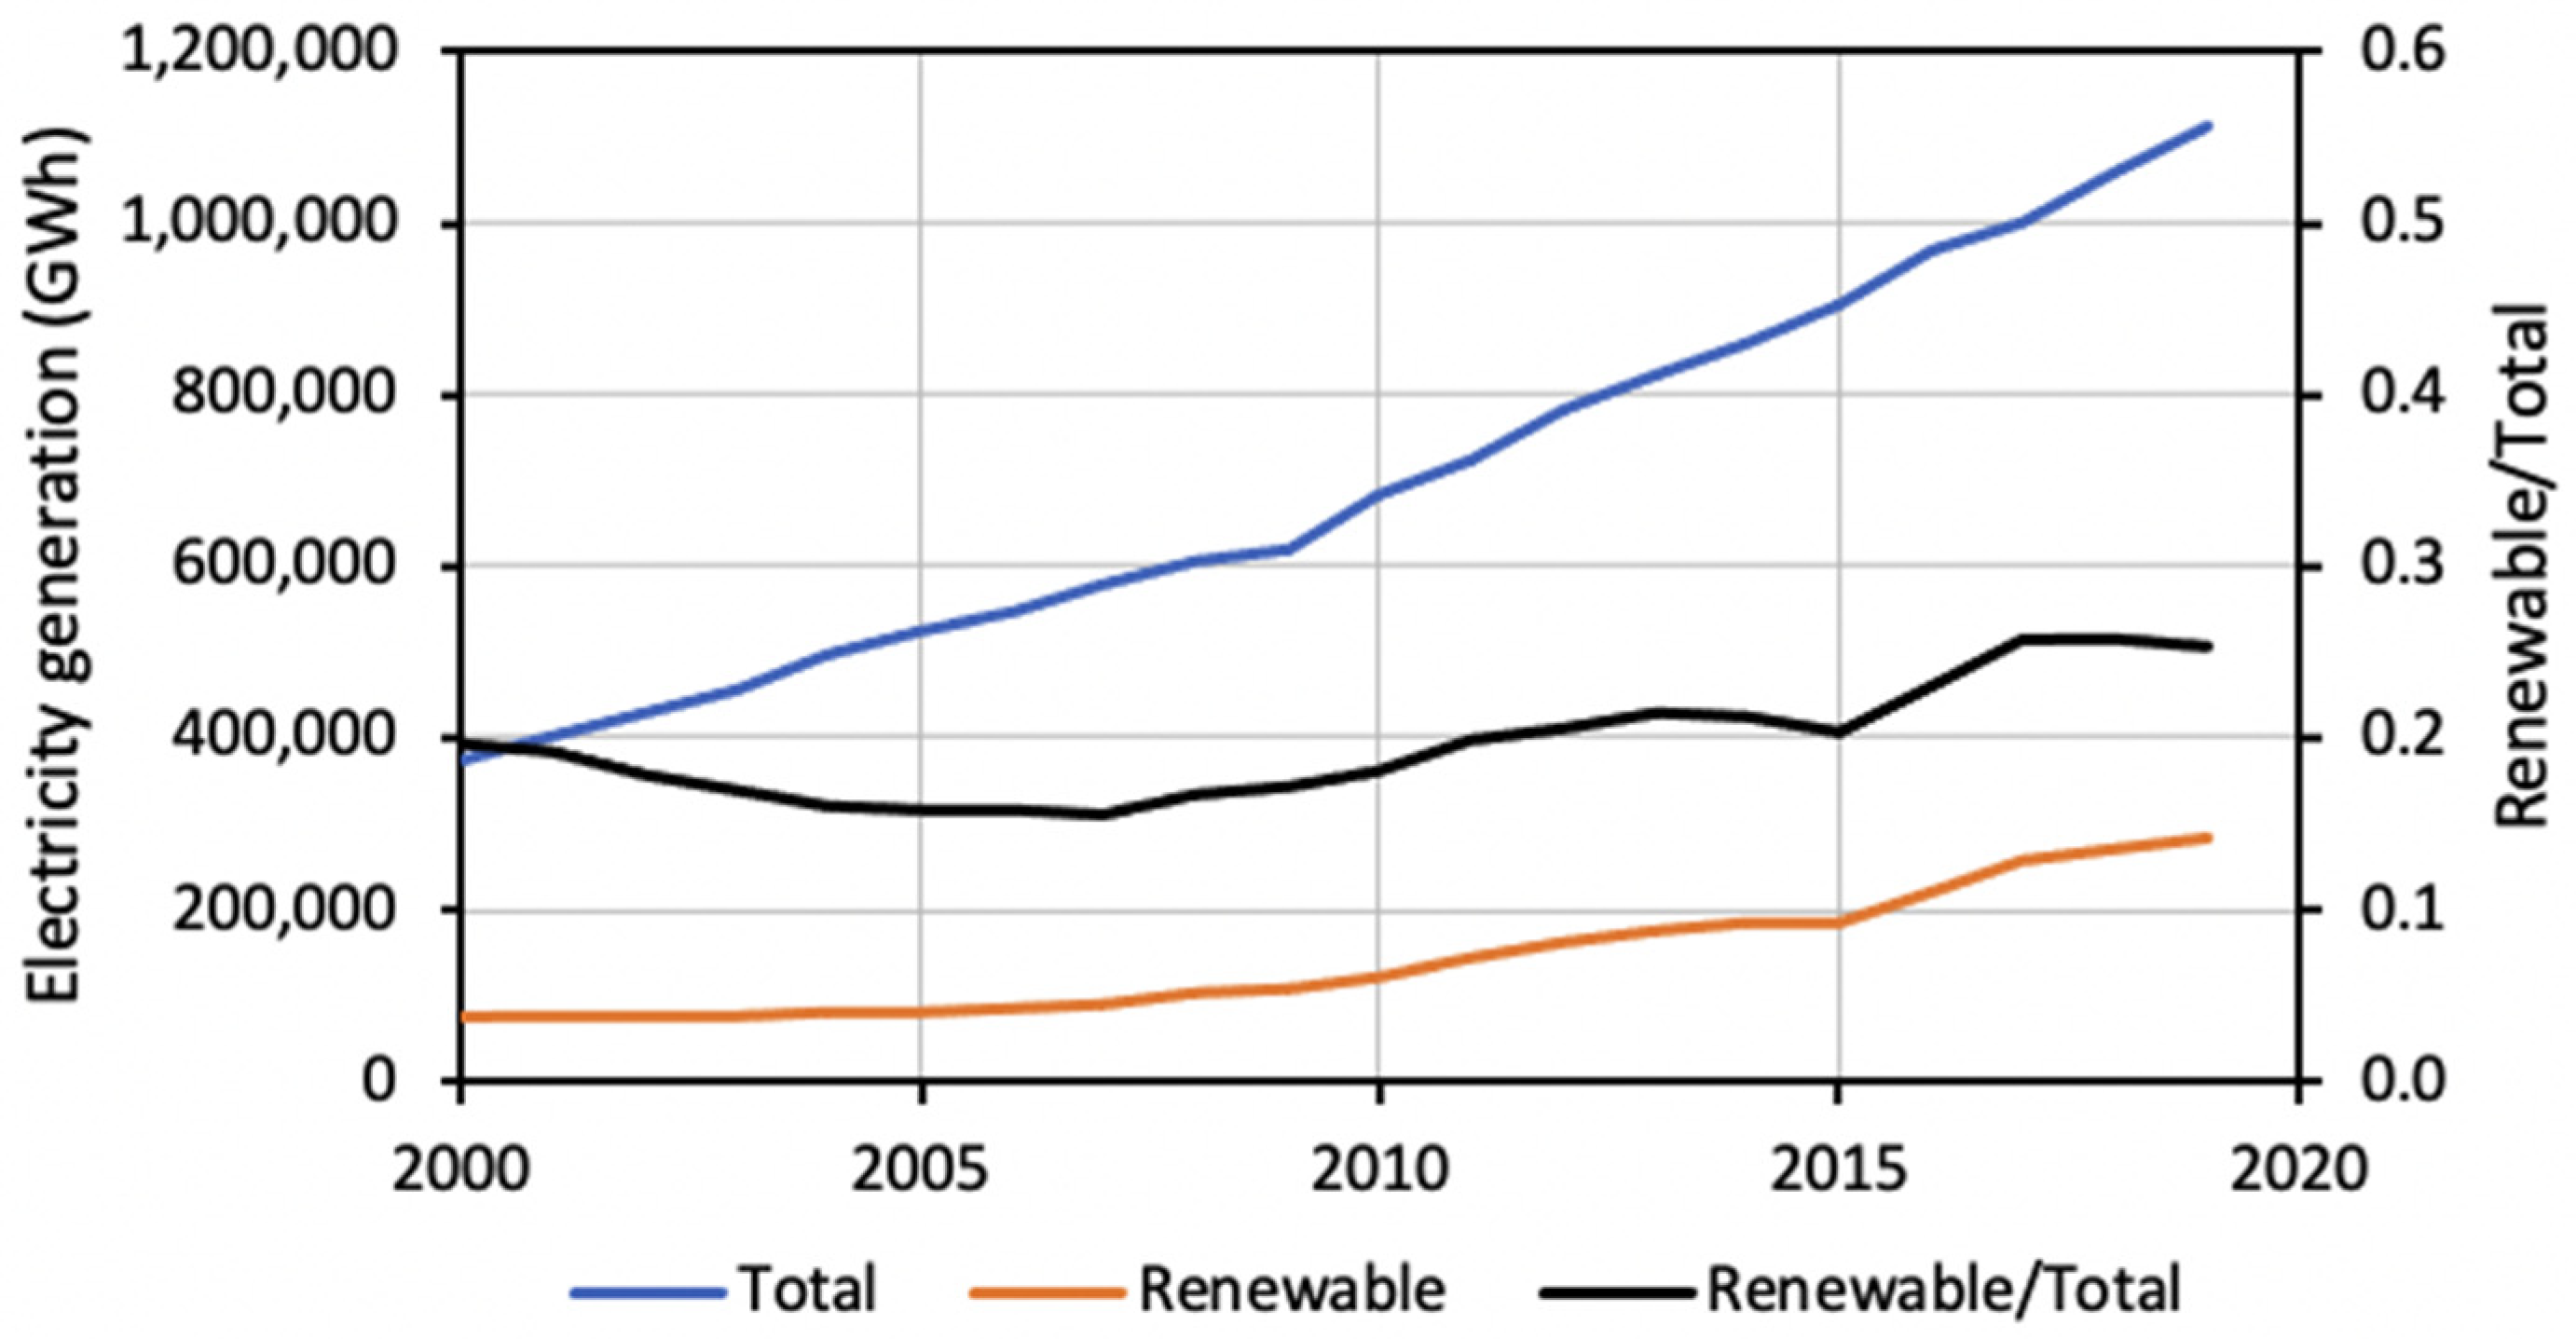
- As of 2019, renewable electricity contributed to only 20% of total electricity generation, while fossil electricity contributed to 80%.
- In the power sector, hydropower, solar PV and bioenergy are the three dominant forms of renewable energy in ASEAN. However, both hydropower and bioenergy suffer from substantial sustainability issues, such as over-damming of the Mekong River for hydropower, and deforestation caused by palm oil plantations for bioenergy.
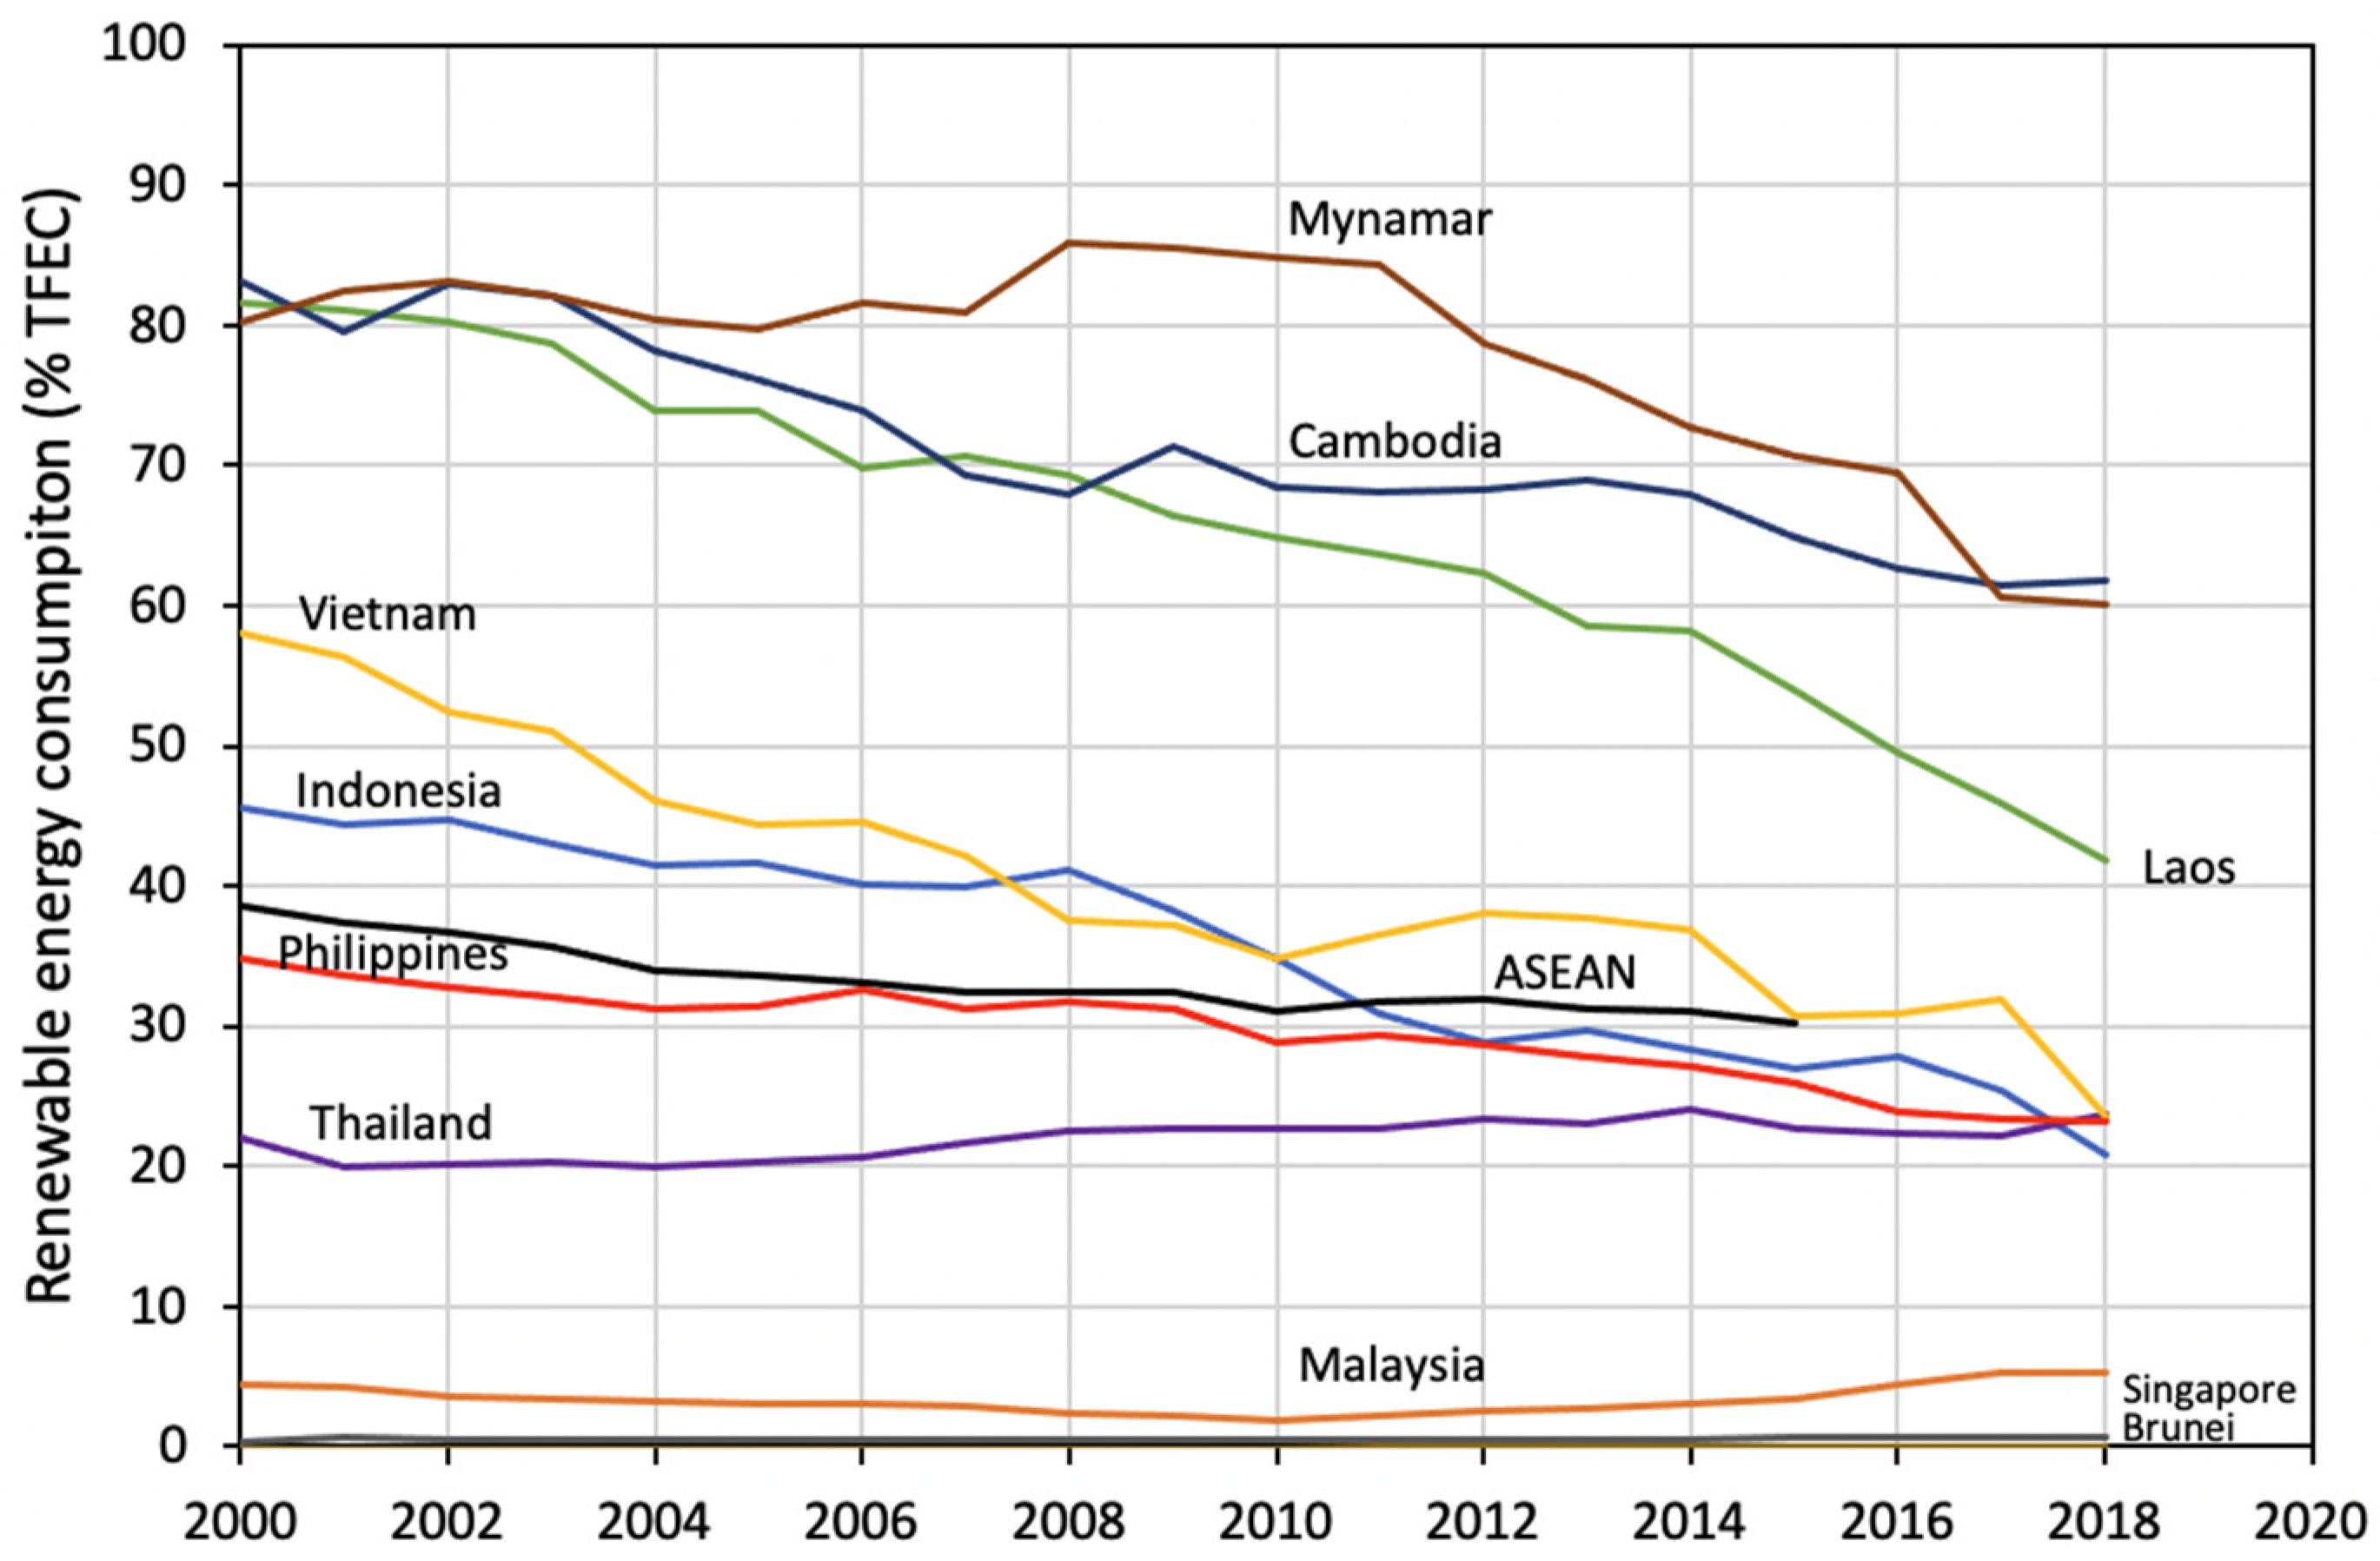
- Despite the increase in renewable electricity capacity in ASEAN in the last two decades, the ratio of renewable energy consumption as a percent of TFEC has dropped from 39% in 2000 to 30% in 2015, with a continuing trend. This reveals that, in the last two decades, the addition of renewable electricity in the power sector was more than offset by the increased use of fossil energies in the other sectors. As fossil energies will remain an important part of the energy mix in the period leading to 2050, it is crucial that ASEAN countries consider the use of CCS to decarbonize all fossil-fuel-consuming sectors.
- Research has shown that there is enough CO2 storage space in ASEAN’s sedimentary basins to store more than two centuries of anthropogenic CO2 emissions, with the majority residing in saline aquifers, and the remaining in oil and gas reservoirs.
- This and other recent studies propose six first-mover CCS projects, which could mitigate up to 300 Mtpa CO2 from Thailand, Indonesia, Malaysia, and Singapore.
- Decarbonization pathways for ASEAN countries follow the following common themes: (1) increasing share of sustainable renewable energies in power generation, (2) switching from coal to gas in power generation, (3) electrification of road transport, (4) hydrogen for marine transport, (5) biofuels for aviation, (6) blue hydrogen for industry, and (7) CCS corridors.
- A number of energy policy implications follow from this study. They include: (1) dealing with sustainability issues with hydropower and bioenergy, (2) establishing a roadmap for EVs, (3) introducing a credible carbon tax, (4) holding public engagements on CCS, (5) establishing cross-border CCS corridors, (6) setting a national hydrogen strategy, and (7) using public–private partnerships to promote energy transition.
- Future research should focus on three areas. The first is how ASEAN countries can increase hydropower without over-damming major rivers such as the Mekong. The second is how to increase bioenergy without further clearing ASEAN’s remaining rainforests for first-generation biocrop plantations. The third is a detailed characterization of ASEAN’s saline aquifers to identify the best ones for CO2 storage.
- ASEAN governments can work together to implement the seven common pathways for decarbonization, for example, by partially funding CCS projects, establishing CCS corridors, introducing a carbon-trading system, and funding research on sustainable hydropower and bioenergy.
Author Contributions
Funding
Conflicts of Interest
Nomenclature
| ASEAN | Association of Southeast Asian Nations |
| bbl | Barrel |
| Bio-aviation | Use biofuels for aviation |
| Blue H2 | Hydrogen produced from fossil fuels with CCS |
| BTU | British thermal unit |
| CCS | Carbon capture and storage |
| CCU | Carbon capture and utilization |
| CCUS | Carbon capture, utilization, and storage |
| Coalgas-power | Replace coal by gas for power generation |
| CoalH2-CCS | Hydrogen production by coal gasificatin with CCS |
| CO2 | Carbon dioxide |
| CO2-EGR | Carbon dioxide enhanced gas recovery |
| CO2-EOR | Carbon dioxide enhanced oil recovery |
| CP-CCS | Coal-fired power plant with carbon capture and storage |
| CSP | Concentrated solar power |
| EGR | Enhanced gas recovery |
| EOR | Enhanced oil recovery |
| EJ | 1018 Joule |
| EV | Electric vehicle |
| GasH2-CCS | Hydrogen production by methane steam reforming with CCS |
| GP-CCS | Gas-fired power plant with carbon capture and storage |
| GDP | Gross domestic product |
| GW | 109 W |
| GWh | 109 Wh |
| Green H2 | Hydrogen produced by electrolysis with renewable electricity |
| Grey H2 | Hydrogen produced from fossil fuels without CCS |
| ICE | Internal combustion engine |
| Ind-CCS | Use CCS in industrial plants |
| H2 | Hydrogen |
| H2-marine | Hydrogen fuel for ships |
| HFCV | Hydrogen fuel cell vehicle |
| Solar PV | Solar photovoltaic |
| Gt | 109 tonnes |
| Gtpa | 109 tonnes per annum |
| Mt | 106 tonnes |
| Mtpa | 106 tonnes per annum |
| OOIP | Original oil-in-place, bbl |
| Tcf | 1012 cubic ft |
| TFEC | Total final energy consumption |
| TPES | Total primary energy supply |
References
- Statista. Global Gross Domestic Product (GDP) at Current Prices from 1985 to 2026. 2022. Available online: https://0-www-statista-com.brum.beds.ac.uk/statistics/268750/global-gross-domestic-product-gdp/ (accessed on 11 February 2022).
- Our World in Data. CO2 and Greenhouse Gas Emissions. 2022. Available online: https://ourworldindata.org/co2-and-other-greenhouse-gas-emissions (accessed on 11 February 2022).
- Zhang, K.; Bokka, H.K.; Lau, H.C. Decarbonizing the Energy and Industry Sectors in Thailand by Carbon Capture and Storage. J. Pet. Sci. Technol. 2022, 209, 109979. [Google Scholar] [CrossRef]
- Oh, T.H. Carbon Capture and Storage Potential in Coal-fired Plant in Malaysia—A Review. Renew. Sustain. Energy Rev. 2010, 14, 2697–2709. [Google Scholar] [CrossRef]
- Lai, N.Y.G.; Yap, E.H.; Lee, C.W. Viability of CCS: A Broad-Based Assessment for Malaysia. Renew. Sustain. Energy Rev. 2011, 15, 3608–3616. [Google Scholar] [CrossRef]
- Adisaputro, D.; Saputra, B. Carbon Capture and Storage and Carbon Capture and Utilization: What Do They Offer to Indonesia? Front. Energy Res. 2017, 5, 6. [Google Scholar] [CrossRef] [Green Version]
- Lau, H.C.; Ramakrishna, S. A Roadmap for Decarbonization of Singapore and Its Implications for ASEAN: Opportunities for 4IR Technologies and Sustainable Development. Asia Pac. Tech. Monit. 2021, 38, 29–39. [Google Scholar]
- Lau, H.C.; Ramakrishna, S.Z.K.; Hameed, M.Z.S. A Decarbonization Roadmap for Singapore and Its Energy Policy Implications. Energies 2021, 14, 6455. [Google Scholar] [CrossRef]
- Zhang, K.; Lau, H.C. Regional Opportunities for CO2 Capture and Storage in Southeast Asia. Int. J. Greenh. Gas Control 2022, in press. [Google Scholar] [CrossRef]
- Ibrahim, M.Y.; Ghazali, A.; Rahman, H.U. The Feasibility of Carbon Capturing, Storage and Utilization Projects in Developing Countries: A Case of Malaysia. Int. J. Econ. Finan. Issues 2015, 6, 6–11. [Google Scholar]
- Sukor, N.R.; Shamsuddin, A.H.; Mahlia, T.M.I.; Isa, M.F.M. Techno-Economic Analysis of CO2 Capture Technologies in Offshore Natural Gas Field: Implications to Carbon Capture and Storage in Malaysia. Processes 2020, 8, 350. [Google Scholar] [CrossRef] [Green Version]
- Asian Development Bank (ADB). Prospects for Carbon Capture and Storage in Southeast Asia; Asian Development Bank: Manila, Philippines, 2013; pp. 1–167. [Google Scholar]
- United Nations. National Determined Contribution (NDC) Registry. 2022. Available online: https://www4.unfccc.int/sites/NDCStaging/Pages/All.aspx (accessed on 28 February 2022).
- United Nations Office for the Coordination of Humanitarian Affairs (OCHA). Asia-Pacific: Annual Precipitation; United Nations: New York, NY, USA, 2015.
- Eyler, B.; Stimson. 2020 Status of Lower Mekong Mainstream and Tributary Dams. 2020. Available online: https://www.stimson.org/2020/2020-status-of-lower-mekong-mainstream-and-tributary-dams/ (accessed on 4 January 2022).
- International Energy Agency (IEA). Hydropower Special Market Report: Analysis and Forecast to 2030. 2020. Available online: https://www.iea.org/reports/hydropower-special-market-report (accessed on 4 January 2022).
- Kijewski, L. Cambodia Halts Hydropower Construction in Mekong River. Voice of America. 2021. Available online: https://www.voanews.com/a/east-asia-pacific_cambodia-halts-hydropower-construction-mekong-river-until-203/6186756.html#:~:text=Experts%20in%20Cambodia%20have%20welcomed,to%20focus%20on%20renewable%20energies.&text=%22From%202020%20to%202030%2C%20there,mai (accessed on 4 February 2022).
- Soukhaphon, A.; Baird, I.G.; Hogan, Z.S. The Impacts of Hydropower Dams in the Mekong River Basin: A Review. Water 2021, 13, 265. [Google Scholar] [CrossRef]
- International Centre for Environmental Management (ICEM). Strategic Environment Assessment of Hydropower on the Mekong Mainstream; Final Report; Mekong River Commission: Vientiane, Laos, 2010; pp. 1–23.
- Citowicki, P. China’s Control of the Mekong. The Diplomat. 2020. Available online: https://thediplomat.com/2020/05/chinas-control-of-the-mekong/ (accessed on 11 February 2022).
- Boyle, G. Renewable Energy: Power for a Sustainable Future, 3rd ed.; Oxford University Press: Oxford, UK, 2012. [Google Scholar]
- International Renewable Energy Agency (IRENA). Statistical Profiles. 2022. Available online: https://www.irnea.org/Statiscics/Statistical-Profiles (accessed on 5 January 2022).
- World Bank Group. Photovoltaic Power Potential: East Asia and Pacific. 2019. Available online: https://worldbank-atlas.s3.amazonaws.com/download/East%20Asia%20and%20Pacific/East-Asia-and-Pacific_PVOUT_mid-size-map_156x188mm-300dpi_v20191016.png?AWSAccessKeyId=ASIAS2HACIWTDNVNNNNX&Expires=1643932711&Signature=D%2BlX6nt%2FTwuvHxmpO1uZnj60uf0%3D&x-amz (accessed on 3 February 2022).
- Global Wind Atlas. Global Wind Atlas 3.0. 2021. Available online: https://globalwindatlas.info/ (accessed on 3 February 2022).
- Limberger, J.; Boxem, T.; Pluymaekers, M.; Bruhn, D.; Manzella, A.C.P.; Beekman, F.; Cloetingh, S.; van Wees, J.D. Geothermal Energy in Deep Aquifers: A Global Assessment of the Resource Base for Direct Heat Utilization. Renew. Sustain. Energy Rev. 2018, 82, 961–975. [Google Scholar] [CrossRef]
- Geographic, N. Ring of Fire. Available online: https://www.nationalgeographic.org/encyclopedia/ring-fire/ (accessed on 4 February 2022).
- Mendu, V.; Shearin, T.; Cambell, E.; Stock, J.; Croker, M.; Huber, G.; DeBolt, S. Global Bioenergy Potential from High-Lignin Agricultural Residue. Proc. Natl. Acad. Sci. USA 2012, 109, 4014–4019. [Google Scholar] [CrossRef] [PubMed] [Green Version]
- Gasparatos, A.; Takeuchi, S.P.K. Sustainability Impacts of First-Generation Biofuels. Anim. Front. 2013, 3, 12–26. [Google Scholar] [CrossRef]
- Our World in Data. Palm Oil. 2022. Available online: https://ourworldindata.org/palm-oil (accessed on 2 March 2022).
- United States Department of Agriculture (USDA). Palm Oil Explorer. 2021. Available online: https://ipad.fas.usda.gov/cropexplorer/cropview/commodityView.aspx?cropid=4243000 (accessed on 4 January 2022).
- S&P Global Platts. EU Palm Oil Use for Biodiesel to Fall in 2021 on Cost Concerns: USDA. 2021. Available online: https://www.spglobal.com/platts/en/market-insights/latest-news/agriculture/062421-eu-palm-oil-use-for-biodiesel-to-fall-in-2021-on-cost-concerns-usda (accessed on 20 December 2021).
- Hogan, M. Germany to End Palm Oil Use in Biofuels from 2023—Ministry. 2021. Available online: https://www.nasdaq.com/articles/germany-to-end-palm-oil-use-in-biofuels-from-2023-ministry-2021-09-22 (accessed on 4 February 2022).
- Mukherjee, I.; Sovacool, B.K. Palm Oil-Based Biofuels and Sustainability in Southeast Asia: A Review of Indonesia, Malaysia, and Thailand. Renew. Sustain. Energy Rev. 2014, 37, 1–12. [Google Scholar] [CrossRef]
- Vel, J.A.C.; McCarthy, J.F.; Zhen, Z. The Conflicted Nature of Food Security Policy: Balancing Rice, Sugar and Palm Oil in Indonesia. Anthropol. Forum 2016, 26, 233–247. [Google Scholar] [CrossRef] [Green Version]
- Ayompe, L.M.S.M.; Egoh, B.N. Towards Sustainable Palm Oil Production: The Positive and Negative Impacts on Ecosystem Services and Human Wellbeing. J. Clean. Prod. 2021, 278, 123914. [Google Scholar] [CrossRef]
- Ivancic, H.; Koh, L.P. Evolution of Sustainable Palm Oil Policy in Southeast Asia. Cogent Environ. Sci. 2016, 2, 1–11. [Google Scholar] [CrossRef]
- Gatti, R.C.; Liang, J.V.A.; Zhou, M. Sustainable Palm Oil May Not Be So Sustainable. Sci. Total Environ. 2019, 652, 48–51. [Google Scholar] [CrossRef]
- Yasinta, T.; Karuniasa, M. Palm Oil-Based Biofuels and Sustainability in Indonesia: Assess Social, Environmental and Economic Aspects. 1st J. Environ. Sci. Sustain. Dev. Symp. 2021, 716, 012113. [Google Scholar] [CrossRef]
- Kumar, S.; Abdul Salam, P.; Shrestha, P.; Ackom, E.K. An Assessment of Thailand’s Biofuel Development. Sustainability 2013, 5, 1577–1597. [Google Scholar] [CrossRef] [Green Version]
- Mendoza, T.C.; Mendoza, B.C. A Review of Sustainability Challenges of Biomass for Energy: Focus in the Philippines. J. Agric. Technol. 2016, 12, 281–310. [Google Scholar]
- The Global Economy. Countries. 2022. Available online: https://www.theglobaleconomy.com/economies/ (accessed on 6 February 2022).
- American Geosciences Institute. How Much Carbon Dioxide is Produced When Different Fuels are Burned? 2022. Available online: https://www.americangeosciences.org/critical-issues/faq/how-much-carbon-dioxide-produced-when-different-fuels-are-burned (accessed on 5 February 2022).
- The Diplomat. Prospects for Nuclear Power in ASEAN. 2018. Available online: https://thediplomat.com/2018/06/prospects-for-nuclear-power-in-asean (accessed on 20 December 2021).
- The World Bank. Renewable Energy Consumption (% of Total Final Energy Consumption). 2022. Available online: https://data.worldbank.org/indicator/EG.FEC.RNEW.ZS?locations=CM-KH-BN-MY-MM-ID-TH-PH-LA-SG-VN (accessed on 3 February 2022).
- U.S. Energy Information Administration (EIA). Today in Energy. 2020. Available online: https://www.eia.gov/todayinenergy/detail.php?id=44636 (accessed on 11 February 2011).
- Lau, H.C.; Ramakrishna, S.; Zhang, K.; Radhamani, A.V. The Role of Carbon Capture and Storage in the Energy Transition. Energy Fuels 2021, 35, 7364–7386. [Google Scholar] [CrossRef]
- Blomberg. Thailand Lays Out Bold EV Plan, Wants All Electric Cars by 2035. 2021. Available online: https://www.bloomberg.com/news/articles/2021-04-22/thailand-lays-out-bold-ev-plan-wants-all-electric-cars-by-2035 (accessed on 11 February 2022).
- Land Transport Authority. Electric Vehicles. 2022. Available online: https://www.lta.gov.sg/content/ltagov/en/industry_innovations/technologies/electric_vehicles.html#:~:text=Singapore%20aims%20to%20phase%20out,to%20electric%20vehicles%20(EVs) (accessed on 11 February 2022).
- Reuters. Indonesia Aims to Sell Only Electric-Powered Cars, Motorbikes by 2050. 2021. Available online: https://www.reuters.com/business/sustainable-business/indonesia-aims-sell-only-electric-powered-cars-motorbikes-by-2050-2021-06-14/ (accessed on 11 February 2022).
- Ucok, M.D. Hydrogen Fuel Cell Vehicles. Sabanci University. 2020. Available online: https://iicec.sabanciuniv.edu/hydrogen-fuel-cell-vehicles (accessed on 11 February 2022).
- Insider. United Airlines Just Became the First Airline in History to Operate a Passenger Flight Using 100% Sustainable Aviation Fuel. 2021. Available online: https://www.businessinsider.com/united-operates-passenger-flight-with-100-sustainable-aviation-fuel-2021-12 (accessed on 11 February 2022).
- Lewis, M. Boeing Says It Will Deliver 100% Biofuel Planes by 2030. Electrek. 2021. Available online: https://electrek.co/2021/01/22/boeing-says-it-will-deliver-100-percent-commercial-biofuel-fleet-by-2030/ (accessed on 11 February 2022).
- Channel News Asia (CNA). Finland’s Neste Expands Singapore Refinery as It Taps Renewable Growth. 2019. Available online: https://www.channelnewsasia.com/business/finlands-neste-expands-singapore-refinery-it-taps-renewable-growth-1320321 (accessed on 11 February 2022).
- Jensen, J.; Energy Central. At Four Times the Cost of Heat Electrification Will Not Decarbonize Industrial Processes Anytime Soon. 2020. Available online: https://energycentral.com/c/ec/electrification-will-not-decarbonize-industrial-processes-anytime-soon (accessed on 11 February 2022).
- Schuwer, D.; Schnelder, C. Electrification of Industrial Process Heat: Long-term Application, Potentials and Impacts. Ind. Effic. 2018, 412–422. Available online: https://epub.wupperinst.org/frontdoor/deliver/index/docId/7037/file/7037_Schuewer.pdf (accessed on 11 February 2022).
- Lau, H.C. The Color of Energy: The Competition to be the Energy of the Future. In Proceedings of the International Petroleum Technology Conference, Virtual Event, 16 March 2021. [Google Scholar]
- Baylin-Stern, A.; Berghout, N. Is Carbon Capture Too Expensive? International Energy Agency (IEA). 2021. Available online: https://www.iea.org/commentaries/is-carbon-capture-too-expensive (accessed on 11 February 2022).
- International Energy Agency (IEA). Energy Technology Perspectives 2020, Special Report on Carbon Capture, Utilization and Storage. 2020. Available online: https://www.iea.org/reports/energy-technology-perspectives-2020 (accessed on 11 February 2022).
- Bui, M.; Adjiman, C.S.; Bardow, A.; Anthony, E.J.; Boston, A.; Brown, S.; Fennell, P.S.; Fuss, S.; Galindo, A.; Hackett, L.A.; et al. Carbon Capture and Storage: The Way Forward. Energy Environ. Sci. 2018, 11, 1062–1176. [Google Scholar] [CrossRef] [Green Version]
- Zhang, K.; Lau, H.C.; Liu, S.; Li, H. Carbon Capture and Storage in the Coastal Region of China between Shanghai and Hainan. Energy 2022, 247, 123470. [Google Scholar] [CrossRef]
- Zhang, K.; Lau, H.C. Utilization of a High-Temperature Depleted Gas Condensate Reservoir for CO2 Storage and Geothermal Heat Mining: A Case Study of the Arun Gas Reservoir in Indonesia. J. Clean. Prod. 2022, 343, 131006. [Google Scholar] [CrossRef]
- Pathak, P.; Fudra, Y.; Avida, H.; Kahar, Z.; Agnew, M.; Hidayat, D. The Arun Gas Field in Indonesia: Resource Management of a Mature Field. In Proceedings of the SPE Asia Pacific Conference on Integrated Modelling for Asset Management, Kuala Lumpur, Malaysia, 29 March 2004. [Google Scholar]
- Hendih, A.R.; Rinaldi, I.; Williams, L.L. Investigation for Mature Minas Waterflood Optimization. In Proceedings of the SPE Asia Pacific Oil and Gas Conference and Exhibition, Melbourne, Australia, 8 October 2002. [Google Scholar]
- Rachmawati, S.B.; Sustakoski, R.J.; Whitacre, T.P.; Goggin, D.J.; Levy, M.; Bernath, A.B.; Wu, G. Pattern Waterflood Development in a Giant Mature Oil Field: Minas NW Segment Reservoir Characterization, Scale-up, and Flow Modeling. In Proceedings of the SPE Annual Technical Conference and Exhibition, San Antonio, TX, USA, 5 October 1997. [Google Scholar]
- Thui, P.C.; Reuters. Cambodia Halts Mainstream Mekong River Dam Plans for 10 Years, Official Says. 2020. Available online: https://www.reuters.com/article/us-mekong-river-cambodia/cambodia-halts-mainstream-mekong-river-dam-plans-for-10-years-official-says-idUSKBN215187 (accessed on 11 February 2022).
- Mekong River Commission for Sustainable Development (MRC). Hydropower. 2020. Available online: https://www.mrcmekong.org (accessed on 20 January 2022).
- Lau, H.C. Offshore Wind Energy in Asia: Technical Challenges and Opportunities. In Proceedings of the Offshore Technology Conference, Virtual Event, 2–6 November 2020. [Google Scholar]
- United States Department of Energy (DOE). Levelized Cost of Electricity. 2015. Available online: https://www.energy.gov/sites/prod/files/2015/08/f25/LCOE.pdf (accessed on 11 February 2022).
- Global Fleet. EV Readiness South-East Asia. 2022. Available online: https://www.globalfleet.com/en/safety-environment/asia-pacific/features/ev-readiness-south-east-asia?a=YHE11&t%5B0%5D=Indonesia&t%5B1%5D=Thailand&t%5B2%5D=Singapore&t%5B3%5D=Malaysia&t%5B4%5D=Philippines&curl=1 (accessed on 24 January 2022).
- Kaur, D. Malaysia to Have 1000 EV Charging Stations by 2025. Techwire Asia. 2021. Available online: https://techwireasia.com/2021/08/malaysia-to-have-1000-ev-charging-stations-by-2025/ (accessed on 11 February 2022).
- Lau, H.C. The Role of Fossil Fuels in a Hydrogen Economy. In Proceedings of the International Petroleum Technology Conference, Virtual Event, 16 March 2021. [Google Scholar]
- S&P Global Platts. PetroVietnam, JX Agree on CO2-EOR Pilot Test in Rang Dong Oil Field. 2011. Available online: https://www.spglobal.com/platts/en/market-insights/latest-news/oil/021611-petrovietnam-jx-agree-on-co2-eor-pilot-test-in-rang-dong-oil-field (accessed on 11 February 2022).
- Asian Development Bank (ADB). Carbon Dioxide-Enhanced Oil Recovery in Indonesia: An Assessment of its Role in a Carbon Capture and Storage Pathway; Asian Development Bank: Mandaluyong City, Philippines, 2019; pp. 1–56. [Google Scholar]
- Eide, L.I.; Batum, M.; Dixon, T.; Elamin, Z.; Graue, A.; Hagen, S.; Hoverka, S.; Nazarian, B.; Nokleb, P.H.; Olsen, G.I.; et al. Enabling Large-Scale Carbon Capture, Utilization, and Storage (CCUS) Offshore Carbon Dioxide (CO2) Infrastructure Developments—A Review. Energies 2019, 12, 1945. [Google Scholar] [CrossRef] [Green Version]
- Lau, H.C.; Zhang, K.; Bokka, H.K.; Ramakrishna, S. Getting Serious with Net-Zero: Implementing Large-Scale Carbon Capture and Storage Projects in ASEAN. In Proceedings of the Offshore Technology Conference, Houston, TX, USA, 2 May 2022. [Google Scholar]
- Simatupang, R.; Pineda, J.; Murdjijanto, T. On Indonesia’s New Carbon Tax and Is Effectiveness at Reducing Greenhouse Gas Emissions. Devtech. 2021. Available online: https://devtechsys.com/insights/2021/11/24/on-indonesias-new-carbon-tax-and-its-effectiveness-at-reducing-greenhouse-gas-emissions/ (accessed on 11 February 2022).
- University College London (UCL). Challenges in Implementing Carbon Pricing Policy in Malaysia. 2021. Available online: https://www.ucl.ac.uk/bartlett/news/2021/nov/challenges-implementing-carbon-pricing-policy-malaysia#:~:text=In%20September%202021%2C%20the%20Malaysian,fuel%20providers%20to%20increase%20prices (accessed on 11 February 2022).
- McKinnsey & Company. Hydrogen Insights Report 2021: A Perspective on Hydrogen Investment, Market Development and Cost Competitiveness. 2021. Available online: https://hydrogencouncil.com/wp-content/uploads/2021/02/Hydrogen-Insights-2021-Report.pdf (accessed on 11 February 2022).
- Ministry of Economy, Trade and Industry of Japan. Basic Hydrogen Strategy. 2017. Available online: https://www.meti.go.jp/english/press/2017/1226_003.html (accessed on 11 February 2022).
- Hydrogen Council. Hydrogen Roadmap and Recommendations to Develop Korea’s Hydrogen Economy; Hydrogen Council: Brussels, Belgium, 2018. [Google Scholar]
- Mint. Independence Day: PM Modi Announces National Hydrogen Mission. 2021. Available online: https://www.livemint.com/news/india/independence-day-pm-modi-announces-national-hydrogen-mission-11629002077955.html (accessed on 11 February 2022).
- The Council of Australian Governments (COAG). Australia’s National Hydrogen Strategy. 2019. Available online: https://www.industry.gov.au/sites/default/files/2019-11/australias-national-hydrogen-strategy.pdf (accessed on 11 February 2022).
- Ministry of Business, Innovation & Employment. A Vision for Hydrogen in New Zealand: Green Paper; New Zealand Government: Wellington, New Zealand, 2019.
- Bloomberg. China Is Formulating a Hydrogen Plan but Its Timing Is Uncertain. 2021. Available online: https://www.bloomberg.com/news/articles/2021-04-23/china-is-formulating-a-hydrogen-plan-but-its-timing-is-uncertain (accessed on 11 February 2022).
- Lepic, B.; Offshore Energy. Norway to Launch $2.7 Billion Longship Carbon Capture and Storage Project. 2020. Available online: https://www.offshore-energy.biz/norway-to-launch-27-billion-longship-carbon-capture-and-storage-project/ (accessed on 11 February 2022).


| Previous Study | Country | Major Results | Research Gap |
|---|---|---|---|
| Zhang et al. 2022 [3] | Thailand | Major CO2 source and sinks in Thailand are identified. Six CCS clusters are proposed. | Study only covers in-country CCS. |
| Oh (2012) [4] | Malaysia | CCS is needed to decarbonize coal-fired power plants. Challenges include low public awareness, lack of regulatory oversight, high cost and lack of assessment of CO2 storage capacity | No quantitative assessment of CO2 emission and storage potential. |
| Lai et al. (2011) [5] | Malaysia | Power sector will benefit from CCS. However, lack of assessment of CO2 storage capacity in the subsurface is a key factor. | No quantitative assessment of CO2 storage capacity. |
| Ibrahim et al. (2015) [10] | Malaysia | CCUS is a must-have technology for decarbonization. However, lack of funds is a key factor. Government should raise public awareness and introduce carbon tax, and carbon trading. | No quantitative assessment of CO2 storage capacity. |
| Sukor et al. (2020) [11] | Malaysia | Techno-economic analysis of using CCS to reduce CO2 concentration in the produced gas from 37 to 8 mole% in the offshore Tangga Barat project shows positive net present value | No quantitative assessment of CO2 storage capacity. |
| Adisaputro and Saputra (2017) [6] | Indonesia | Both CCU and CCS are needed to reduce CO2 emission. In CCU, CO2 is used to produce urea and other chemicals. | CO2 source-sink mapping not conducted. No breakdown of CO2 abatement between CCS and CCU. |
| Lau and Ramakrishna (2021) [7] | Singapore | CO2 sources from Singapore are identified. Centralized post-combustion carbon capture and a regional CCS corridor are proposed. | CO2 source-sink mapping is not conducted. |
| Lau et al. (2021) [8] | Singapore | A roadmap for decarbonization is proposed consisting of post-combustion carbon capture, hydrogen production, biorefining, and use of electric cars and hydrogen fuel cell vehicles. | CO2 source-sink mapping is not conducted. |
| Zhang and Lau (2022) [9] | Singapore, Indonesia, Malaysia | Within 1000 km from Singapore, CO2 storage potential is 386 Gt. A CCS corridor is proposed. | Study covers part of Indonesia and Malaysia. |
| ADB (2013) [12] | Vietnam, Thailand, Philippines, South Sumatra | There is 57 Gt CO2 storage potential in these countries. | Study covers only part of Indonesia. Detailed CO2 source-sink mapping is not provided. |
| Country | Greenhouse Gas Emission Reduction from Business-as-Usual Case by 2030 |
|---|---|
| Indonesia | 29% unconditional, 41% conditional on international assistance |
| Malaysia | 45% unconditional reduction in emission intensity compared by 2030 compared to 2005 levels. |
| Thailand | 20% unconditional; 25% conditional |
| Vietnam | 8% unconditional; 25% conditional |
| Philippines | 2.71% unconditional; 72% conditional |
| Singapore | 36% unconditional reduction in emission intensity by 2030 based on 2005 levels. Peak CO2 emission at 65 Mtpa or less by 2030. Achieve net-zero by 2050. |
| Myanmar | 50% conditional |
| Laos | 60% unconditional |
| Cambodia | 42% unconditional |
| Brunei | 20% unconditional |
| Country | Export (103 Short Ton) | Import (103 Short Ton) | Production (103 Short Ton) | Consumption (103 Short Ton) | Net Import (103 Short Ton) |
|---|---|---|---|---|---|
| Indonesia | 506,111 | 7462 | 679,199 | 152,580 | −498,649 |
| Vietnam | 1260 | 45,718 | 50,361 | 74,810 | 44,458 |
| Malaysia | 101 | 37,959 | 3812 | 42,860 | 37,858 |
| Philippines | 12,164 | 29,306 | 12,356 | 35,772 | 17,142 |
| Thailand | 71 | 23,881 | 15,518 | 34,047 | 23,810 |
| Laos | 634 | 17 | 22,527 | 20,578 | −517 |
| Myanmar | 2 | 322 | 1572 | 1893 | 320 |
| Cambodia | 0 | 5612 | 0 | 1864 | 5612 |
| Singapore | 0 | 811 | 0 | 811 | 811 |
| Brunei | 0 | 0 | 0 | 0 | 0 |
| Country | Basin | Gas Fields (Mt) | Oil Fields (Mt) | Saline Aquifers (Mt) | Reference | ||||||
|---|---|---|---|---|---|---|---|---|---|---|---|
| Low | Mid | High | Low | Mid | High | Low | Mid | High | |||
| Indonesia | Central Sumatra | 68 | 73 | 77 | 146 | 156 | 167 | 2813 | 11,032 | 30,338 | [9] |
| South Sumatra | 599 | 639 | 678 | 44 | 47 | 51 | 6873 | 26,954 | 74,123 | [9] | |
| West Sumatra | 67 | 71 | 76 | 22 | 23 | 24 | 9755 | 38,255 | 105,202 | [9] | |
| North Sumatra | 1694 | 1780 | 1866 | 7 | 7 | 8 | 28,557 | 111,900 | 307,973 | [9,61] | |
| NW Java | 138 | 147 | 156 | 53 | 58 | 62 | 7100 | 27,842 | 76,564 | [9] | |
| East Natuna | 2171 | 2316 | 2461 | 0 | 0 | 0 | 15,286 | 59,944 | 164,846 | [9] | |
| Subtotal | 4737 | 5026 | 5314 | 271 | 291 | 313 | 70,384 | 275,927 | 759,046 | ||
| Malaysia | Malay | 1381 | 1448 | 1538 | 158 | 174 | 191 | 19,315 | 75,746 | 208,301 | [9] |
| Pengyu | 0 | 0 | 0 | 8 | 8 | 9 | 7058 | 27,678 | 76,114 | [9] | |
| Subtotal | 1381 | 1448 | 1538 | 165 | 182 | 200 | 26,373 | 103,424 | 284,415 | ||
| Thailand | Khorat | 93 | 104 | 115 | 0 | 0 | 0 | 16,008 | 62,775 | 172,631 | [3] |
| Pattani | 784 | 868 | 953 | 23 | 25 | 27 | 1285 | 5040 | 13,860 | [3] | |
| Malay | 691 | 743 | 796 | 0 | 0 | 0 | 874 | 3426 | 9420 | [3] | |
| Fang | 0 | 0 | 0 | 2 | 2 | 2 | 69 | 271 | 746 | [3] | |
| Kamphaeng Saen | 0 | 0 | 0 | 1 | 1 | 1 | 42 | 164 | 451 | [3] | |
| Phetchbun | 0 | 0 | 0 | 0 | 0 | 0 | 83 | 324 | 891 | [3] | |
| Philsanulok | 0 | 0 | 0 | 15 | 16 | 17 | 341 | 1337 | 3675 | [3] | |
| Suphan Buri | 0 | 0 | 0 | 0 | 0 | 0 | 100 | 393 | 1080 | [3] | |
| Chumpon | 0 | 0 | 0 | 2 | 2 | 3 | 751 | 2945 | 8099 | [3] | |
| Songkhla | 0 | 0 | 0 | 2 | 2 | 3 | 231 | 907 | 2495 | [3] | |
| Subtotal | 1567 | 1715 | 1864 | 45 | 49 | 53 | 19,784 | 77,582 | 213,348 | ||
| Total | 7685 | 8189 | 8716 | 481 | 522 | 565 | 116,541 | 456,933 | 1,256,809 | ||
| CO2 Sink | CO2 Source | CO2 Transport | Reference | ||||||
|---|---|---|---|---|---|---|---|---|---|
| Country | Field & Basin | CO2 Storage Capacity (Mt) | Type of CO2 Source | Location | Country | CO2 Emission (Mtpa) | CO2 Transport | Source-Sink Distance (km) | |
| Indonesia | Arun gas field, North Sumatra (onshore) | 1230 | Power chemical, refinery | Jurong Island | Singapore | 32 | Ship | 890 | [7,8,9,61] |
| Power, cement, refinery | North Sumatra | Indonesia | 10 | Pipeline | 250 | [7,8,9,61] | |||
| Indonesia | Minas oil field, Central Sumatra (onshore) | 113 | Power, chemical, refinery | Jurong Island | Singapore | 32 | Pipeline | 200 | [7,8,9] |
| Power, cement, refinery | Central Sumatra | Indonesia | 19 | Pipeline | 250 | [7,8,9] | |||
| Malaysia | Dulang, Tapis, Seligi oil fields, Malay Basin (offshore) | 106 | Power, cement, chemical, refinery | Jurong Island | Singapore | 32 | Ship or pipeline | 440 | [9] |
| Cement, iron & steel, power, refinery | Peninsular Malaysia | Malaysia | 137 | Pipeline | 250 | [9] | |||
| Thailand | Saline aquifers in Phitsanulok, Supan Buri, Phetchabun basins (onshore) | 2053 | Cement in Saraburi, power in Kamphaeng Phet | Saraburi | Thailand | 41 | Pipeline | 20 to 200 | [3] |
| Thailand | Saline aquifers in Khorat Basin (onshore) | 62,775 | Petrochemical, iron & steel, refinery, power | Bangkok & Rayong | Thailand | 77 | Pipeline | 100 to 200 | [3] |
| Thailand | Saline aquifers in Chumpon Basin (offshore) | 2945 | Gas processing, cement, power | Nakhon Si, Nakhon Sri Thammart, Surat Thai, Krabi, Phuket | Thailand | 10 | Pipeline | 50 to 200 | [3] |
| Sector | Technology | Description | Sustainability Rating | ||||
|---|---|---|---|---|---|---|---|
| CO2 Emission | Material Footprint | Impact on People | Impact on Animals | Impact on Environment * | |||
| All | Grey H2 | H2 from fossil fuels | High | Moderate | High | High | high |
| CCU | Convert CO2 to products | Low | Moderate | Low | Low | Low | |
| Green H2 | H2 from renewable electricity | Low | Moderate | Low | Low | Low | |
| Power & industry | CCS corridor | CCS with economies of scale | Low | Moderate | Low | Low | Low |
| Power | Nuclear | Nuclear power plant | Low | High | High | High | High |
| Hydropower | Hydroelectricity | Low | High | High | High | High | |
| Bioenergy | Bioenergy power plant | Low | Moderate | High | High | High | |
| Wind | Wind turbines | Low | Low | Low | Moderate | Low | |
| Geothermal | Geothermal power plant | Low | Moderate | Low | Low | Low | |
| Solar | Solar PV, CSP | Low | Moderate | Low | Low | Moderate | |
| Coal→gas | Replace coal by gas | Moderate | Low | Low | Low | Moderate | |
| CP-CCS | Coal-fired power plant with CCS | Low | Moderate | Low | Low | Low | |
| GP-CCS | Gas-fired power plant with CCS | Low | Moderate | Low | Low | Low | |
| Transport | Bio-aviation | Biofuel for aviation | Low | Moderate | High | High | High |
| HFCV | Hydrogen fuel cell vehicles | Low | Moderate | Low | Low | Low | |
| EV | Electric vehicles | Low | Moderate | Low | Low | Low | |
| H2-marine | H2 fuel for ship | Low | Moderate | Low | Low | Low | |
| Industry | Coal→H2-CCS | Blue H2 from coal with CCS | Moderate | Moderate | Low | Low | Low |
| Gas→H2-CCS | Blue H2 from gas with CCS | Moderate | Moderate | Low | Low | Low | |
| Ind-CCS | Use CCS for industry plants | Low | Moderate | Low | Low | Low | |
Publisher’s Note: MDPI stays neutral with regard to jurisdictional claims in published maps and institutional affiliations. |
© 2022 by the authors. Licensee MDPI, Basel, Switzerland. This article is an open access article distributed under the terms and conditions of the Creative Commons Attribution (CC BY) license (https://creativecommons.org/licenses/by/4.0/).
Share and Cite
Lau, H.C.; Zhang, K.; Bokka, H.K.; Ramakrishna, S. A Review of the Status of Fossil and Renewable Energies in Southeast Asia and Its Implications on the Decarbonization of ASEAN. Energies 2022, 15, 2152. https://0-doi-org.brum.beds.ac.uk/10.3390/en15062152
Lau HC, Zhang K, Bokka HK, Ramakrishna S. A Review of the Status of Fossil and Renewable Energies in Southeast Asia and Its Implications on the Decarbonization of ASEAN. Energies. 2022; 15(6):2152. https://0-doi-org.brum.beds.ac.uk/10.3390/en15062152
Chicago/Turabian StyleLau, Hon Chung, Kai Zhang, Harsha Kumar Bokka, and Seeram Ramakrishna. 2022. "A Review of the Status of Fossil and Renewable Energies in Southeast Asia and Its Implications on the Decarbonization of ASEAN" Energies 15, no. 6: 2152. https://0-doi-org.brum.beds.ac.uk/10.3390/en15062152