Article

A Permanent Magnet Assembling Approach to Mitigate the Cogging Torque for Permanent Magnet Machines Considering Manufacturing Uncertainties

1
School of Mechanical and Vehicle Engineering, Beijing Institute of Technology, Beijing 100081, China
2
Beijing Institute of Space Launch Technology, Beijing 100076, China
3
Department of Industrial Engineering, University of Padova, 35122 Padova, Italy
4
Department of Electrical Drives and Power Electronics, Johannes Kepler University Linz, 4040 Linz, Austria
5
Shenzhen Longood Intelligent Electric Co., Ltd., Shenzhen 518108, China
6
School of Electrical and Electronic Engineering, Harbin University of Science and Technology, Harbin 150080, China
*
Author to whom correspondence should be addressed.
Submission received: 9 February 2022 / Revised: 7 March 2022 / Accepted: 8 March 2022 / Published: 15 March 2022
(This article belongs to the Special Issue High Performance Permanent Magnet Synchronous Motor Drives)

Abstract

:
Conventionally, the small mean and variance of peak-to-peak cogging torque of permanent magnet (PM) machines considering manufacturing uncertainties can be achieved by a robust design or by reducing the uncertainties range. However, the consequent compromise of other design objectives or the increase in the manufacturing costs are frequently inevitable. In this paper, the combination sequence of the uncertainties is highlighted and implemented to achieve a stable performance even for a non-robust design without increasing the cost too much. A PM assembling approach is proposed to mitigate the influences of PM uncertainties on cogging torque by means of combining the uncertainties in a particular sequence, where the effects of uncertainties would counteract each other. Both the singular type of PM uncertainties and the combined ones are considered in the assembling approach. Furthermore, the proposed approach is verified by comparing the cogging torque performance with PM randomly assembled models, where several hundreds of models featuring different uncertainties are calculated through the finite element method. The proposed approach is discussed, particularly for the application of mass production and a small amount of prototypes. Two prototypes with different PM assembling sequences are fabricated and further verify the effectiveness of the proposed PM assembling approach.

1. Introduction

The permanent magnet (PM) synchronous electrical machine has been widely adopted in industrial drives and electric vehicles, and various measures [1,2,3] were proposed to reduce the cogging torque and torque ripple to obtain a quiet machine with smooth output. Due to the manufacturing uncertainties and material defects in the real fabricating process, additional orders of cogging torque harmonics might be introduced [4,5]. The uncertain parameter sensitivity analysis and their effects on the cogging torque have been discussed in many works [6,7,8,9]. Additional cogging torque harmonics would be caused by the uncertainties on the rotor and stator, such as the PM residual flux density ( B r ), PM width, PM thickness, slot-opening width, inner diameter roundness, magnetic degradation of iron core [10] and so on.
Sensitivity analysis starts with a proper description of uncertainties and their distribution characteristics during the manufacturing process. The uniform-uncertainty model (UUM) is widely adopted, where the uncertain values on each PM in a motor are regarded to be the same [9]. Thus, all the PMs are the same but with small deviations from the ideal reference value and one parameter is enough to describe this deviation. This assumption is widely adopted in the sensitivity analysis as the model is symmetrical and no extra efforts are required for building the simulation models. However, the uncertain values on each PM are usually different even in the same batch of product because of the stochastic errors or changes during fabrication. Another model to describe the uncertainties is the non-uniform-uncertainty model (NUUM) [11], where the uncertain value of each PM is independent with each other. The NUUM is frequently required, especially when the cogging torque analysis for the fractional-slot-concentrated-winding (FSCW) configuration, for example, 12-slot/10-pole (12S10P), is concerned. It is found that the additional cogging torque might be significantly underestimated for a 12S10P PM machine if the uncertainties on each PM are assumed to be equal [11]. The main problem for adopting the NUUM might be the consequent high number of uncertain parameters, for example, the PM thickness uncertainties can be described with one parameter in the UUM, but the number of parameters increases to 10 for the NUUM for a 12S10P PM machine.
To mitigate the parasitic effects of uncertainties on the cogging torque performance, the efforts are made from two aspects: the robust design [12,13,14,15] and control the range of uncertainties. Although reducing the ranges of manufacturing uncertainties and material inconsistency is the simplest way to improve the robustness of products, the high cost of upgrading the manufacturing techniques or equipment are frequently inevitable. It is not practical to eliminate uncertainties or material defects, and a better idea is searching for a design not significantly changed under the small deviations on the parameters.
The robust design and optimization, aiming to obtain a scheme that is not sensitive to the uncertainties, are becoming more and more popular [16,17,18]. In the robust optimization, the design performance considering the uncertainties are usually calculated and adopted as extra objectives or constraints [19]. Several approaches are frequently involved to evaluate the design performance under uncertainties and they are often referred to as the robustness evaluation approaches, such as the quantile index based approach [20], the six-sigma based approach [21] and the worst-case based approach [22]. The latter two approaches are adopted and compared with the deterministic optimization for a case scenario in [14], and the effects of robust approaches are then verified by the finite element method (FEM). The robust optimization approaches have been applied in the design process for different types of PM machines, such as the Surface Mounted PM machine [23], the interior PM (IPM) machine [24], the linear machine [25], the hybrid PM machines [26], and the PM claw pole machine [27]. The design optimization process frequently involves the compromise of several objectives and the non-dominated solutions in the Pareto Front set are not the best considering one single objective. Sometimes, the efficiency or output torque performance might be compromised when a robust design is selected.
The uncertainty range control and the robust design can be combined to make full use of the manufacturing ability and achieve a balance between the cost and design performances. In [28], the uncertainty ranges and the fabricating cost are involved in the robust optimization, and a balance between the design performance and cost can be achieved for an integral slot configuration machine. However, similar research on the FSCW scenarios have not been seen yet, especially for the scenario where the non-uniform uncertainties are concerned.
The manufacturing costs are highly related to the uncertainty ranges and the deviations in the PMs or the stator laminations are inevitable. Another way to reduce the effects of uncertainties might be possible by special operations in the assembling process. However, there is not much work from this perspective. In [7], the stator core is formed with the laminations being rotated some angles when laminated, and the uncertainties are consequently more uniformly distributed along the motor axial direction. The experimental results verified that this approach could reduce the additional cogging torque harmonics caused by the stator uncertainties. A similar idea might also be possible to reduce the effects of PM uncertainties unless the uncertainties on each PM are known.
The cogging torque harmonics considering different types of PM uncertainties were discussed in [7,8,9,29], and a vector diagram [30] was proposed to analyse the effects of uncertainties on the torque harmonics. Furthermore, the parameter ranges with the instinct robustness are discussed and the designer can be reminded of the sensitive scheme in the design stage [30]. The additional cogging torque harmonics are mainly introduced because the motor symmetry is violated by the uncertainties, and the possibly worst-cases frequently occur when the uncertainties on each PM superpose in the vector digram [11]. On the other side, if the effects of uncertainties counteract each other in the vector digram, the corresponding additional cogging torque could be consequently reduced as well. This gives the possibility to reduce the effects of uncertainties by measuring the PM variations and designing a particular assembling sequence to combine those PM variations.
In this paper, a PM assembling approach is proposed to reduce the additional cogging torque due to PM uncertainties by assembling the PMs featuring different magnetic flux variations in a special sequence, where the effects of several types of PM uncertainties would counteract with each other. A very simple operation of moving the PMs to one-side would help a lot to mitigate the effects of PM position uncertainties. The proposed assembling of the approach is then verified by calculating hundreds of models by the finite element method (FEM) and the experimental results of two prototypes. This approach provides the potential to maximally reduce the additional cogging torque for both the mass production and the small amount of PM machine fabricating scenarios.
Conventionally, the small variations of cogging torque considering uncertainties can be achieved by the robust design or reducing the uncertainties range, and the consequent compromise of other objectives or the increase in the manufacturing costs are frequently inevitable. The main contribution of this paper is to introduce a new view on the uncertainties; not only the conventional view on their range, but also the corresponding combination sequences. The special combination of the uncertainties might help to achieve a small variation of cogging torque even for a sensitive design scheme without increasing the cost too much. Thus, it might provide more flexibility and more choices to achieve the balance of design performance and manufacturing cost, where a “medium” robust design can be chosen for manufacturing, with the robust assembling approach implemented as a supplementary. The limitation of the proposed PM assembling approach might be the extra processes of PM categorization and selection in assembling, and the cost would be increased to some extent.
The upcoming sections of this paper are organized as follows: in Section 1, the influences of PM manufacturing uncertainties on the cogging torque harmonics are briefly introduced and a case study is involved to show the effectiveness of robust design. Then, a robust assembling approach considering the single type of uncertainties and combined uncertainties is proposed and discussed. The proposed approach is then verified by the comparison of the cogging torque performance of hundreds of FEM models. Two prototypes are then fabricated and measured to verify the effectiveness of the proposed assembling approach in Section 3. A conclusion is then given to summarise the whole work.

2. Cogging Torque Analysis Considering PM Uncertainties

2.1. Cogging Torque Analysis Based on the Vector Diagram

Based on the energy method [31], the cogging torque could be obtained by deriving the magnetic energy. The magnet-excited Magnetic Motive Force (MMF) and airgap permeance are represented by F p m ( θ r ) and Λ ( θ r , θ m ) . Based on the MMF-Permeance model, the air gap flux density distribution B ( θ r , θ m ) under open-circuit condition and the cogging torque could be obtained through (1).
B ( θ r , θ m ) = F p m ( θ r ) Λ ( θ r , θ m ) T c o g ( θ m ) = W θ m = θ m 1 2 μ V F p m 2 ( θ m ) Λ 2 ( θ r , θ m ) d V ,
where θ r is the angular coordinate in the rotor reference frame and θ m corresponds to the rotor position in the stator reference frame.
Then, the rotor MMF F p m ( θ r ) and the equivalent permeability function Λ ( θ r , θ m ) are rewritten into the Fourier series (2), where θ s is the angle in the stator frame.
F p m 2 ( θ r ) = F p m 0 2 + n = 1 G ( n ) cos n θ r Λ s 2 ( θ s ) = Λ 0 2 + k = 1 Γ ( k ) cos k ( θ r + θ m ) .
In (1), the integrations of the dot product of different orders in F p m 2 ( θ r ) and Λ s 2 ( θ s ) are zeros, and only those with the same orders would interact and result in the cogging torque. The cogging torque T c o g can be consequently rewritten in the following.
T c o g ( θ m ) = n = 1 Z n G ( n ) Γ ( n ) sin ( n θ m + ϕ n ) ,
where G ( n ) and Γ ( n ) are referred to the Fourier coefficients of F p m 2 ( θ r ) and Λ s 2 ( θ s ) , ϕ n corresponds to the phase position of the nth order of harmonic, and Z n is a coefficient, which is not critical in this work.
Normally, the main harmonic orders of F p m 2 ( θ r ) and Λ s 2 ( θ ) are determined by number of poles and slots, and they are the multiples of poles ( 2 p i ) and slots ( j Q s ) with i and j being integers, respectively. In the situation without the manufacturing uncertainties considered, the orders of the cogging torque harmonics are the multiple of the least common multiple of the number of poles and slots. If additional harmonics of G ( j Q s ) and Γ ( 2 p i ) are caused due to manufacturing uncertainties, the cogging torque with harmonic orders being multiple of the number of slots and poles is consequently introduced. If the larger additional Fourier coefficients of | G ( k Q s ) | and | Γ ( 2 p i ) | are introduced due to the uncertainties, the larger corresponding cogging torque will probably be produced [11]. The equivalent MMF F p m 2 ( θ r ) caused by the PM uncertainties for a 12S10P machine is taken as an example, as illustrated in Figure 1.
The effects of PM uncertainties on the cogging torque can be attributed to variations of F p m ( θ r ) on each PM. Three types of PM uncertainties are considered in this part, which are the uncertainties on the residual flux density ( Δ B r ), PM width ( Δ w p m ) and PM thickness ( Δ t m ). Thus, the magnitude of ith PM G p i can then be expressed as (4) by introducing several uncertainties related coefficients ( a i , b i and c i ).
a i Δ B r i B r , b i Δ t m i t m , c i Δ w p m i w p m G p i = ( 1 + a i ) ( 1 + b i ) ( 1 + c i ) G p , α p i = c i 1 α p α p ,
where α 0 represents the PM width (in radians) and the pole-pitch is α p = 2 π / 2 p . The values of a i , b i and c i are determined by the corresponding ratios of uncertain value and nominal value, but the specific figures of a i , b i and c i are not essential here.
With the PM uncertainties taken into consideration, the Fourier coefficient G ( n ) could then be expressed in the following [30].
G ( n ) = i = 1 2 p 2 G p i n sin n α p i 2 e j n θ p i = i = 1 2 p ( 1 + a i ) ( 1 + b i ) ( 1 + c i ) 2 G p n sin n α 0 2 P i ( n ) e j φ i ( n ) φ i ( n ) = n ( i 1 ) α p + Δ θ p i .
Based on the author’s previous work in [11,30], the value of G ( n ) can be regarded as the sum of several vectors, whose magnitude and phase position is determined by P i ( n ) and φ i ( n ) in (5), respectively. For a 12S10P configuration, the additional G ( 12 ) can be analysed by (5) and the corresponding vector diagram is presented in Figure 2a. For the ideal scenario without consideration of any uncertainties, the ten vectors counteract with each other and no 12th cogging torque would be measured or observed. The mainly additional cogging torque harmonics caused by the PM uncertainties are (12th, 24th, 36th, ...), and the low order of the 12th order is of more concern in this study.
However, if the uncertainties combination presented in Figure 2b is considered, where the outward-pointing and inward-pointing arrows represent the positive uncertainty ( Δ B r ) and negative value ( Δ B r ), respectively. The corresponding vectors distribute as in Figure 2c. With this combination, the effects of all the uncertainties vectorially superpose and the maximum value of additional 12th cogging torque might appear.
The worst-case uncertainties combination can be theoretically identified through the vector diagram and for detailed information the reader is referred to the author’s previous work in [11]. It is a general method and can be applied on different slot/pole configurations or different rotor geometry. The analysis process of a 18-slot/16-pole configuration is taken as an example to show how to use the vector diagram. The additional cogging torque caused by the PM uncertainties are the multiples of slot-number, such as 18th and 36th. The phase angle of each vector for G ( 18 ) and G ( 36 ) can be identified by (5), and it is shown in Figure 3a. As the uncertainties on each PM can be regarded as small variations or coefficients imposed on the magnitude of each vector, the worst-case would appear if the uncertainties combined in a special sequence to achieve the maximum G ( 18 ) and G ( 36 ) , just as presented in Figure 3b.
The vector diagram can theoretically identify the worst-case uncertainties combinations for a simple rotor geometry. If the multi-layer PMs or V-shape PM arrangement is considered, it is suggested to regard the uncertainties on the PMs within one-pole-pitch as one equivalent value, and then the vector diagram can be adopted.

2.2. The Robust Design

The vector diagram in Figure 2a can be a helpful tool. It can not only be used to search for the worst-case scenario considering uncertainties [11], but can also indicate how to achieve a relatively robust design [30].
If the magnitude of the reference vector P 0 in Figure 2c can be reduced to zero, the design would not significantly change even under a relatively large range of uncertainties. The sensitivity analysis of some parameters, such as the pole-arc coefficient, slot opening width, and pole/slot configurations are discussed in [30].
A real design process frequently involves the compromise of several objectives, and a robust design practice was carried in the author’ previous work [15]. The robust and non-robust designs are compared in the following part to illustrate the effectiveness of robust design to mitigate the cogging torque resulting from PM uncertainties.

2.2.1. Robust and Non-Robust Designs

A 12S10P interior PM (IPM) machine is taken as an example, and the motor geometry and initial parameters are illustrated in Figure 4 and Table 1.
Based on the authors’ previous work [15], several types of uncertainties on the rotor side are taken into consideration. The uncertainties involve the residual flux density B r , PM thickness t m , PM width w p m , and PM position θ p i . The tolerance ranges of the parameters are determined by the common adopted manufacturing techniques, and the corresponding ranges are illustrated in Table 2. This design is a promising scheme with good performance in the ideal-scenario, but its corresponding cogging torque might obviously vary when the PM uncertainties are considered. This design is a reference scheme in this paper.
A robust optimization on a 12S10P IPM machine was conducted in [15], where three performances were selected as the optimization objectives and they are the torque ripple, motor efficiency, and the worst-case torque ripple considering manufacturing uncertainties. One of the robust designs from the Pareto Front was selected and denoted as Design B. Several parameters of the robust and initial design are illustrated in Table 3, where w s o represents the slot-opening width, and α c is the pole-arc coefficient.

2.2.2. Comparisons of the Cogging Torque Performances Considering the PM Uncertainties

In the probability theory, Gaussian distribution G N ( μ , σ 2 ) is a common continuous probability distribution, which is widely used to represent the distribution of uncertainties.
The term σ refers to the standard deviation and the mean value is named as μ . Based on the property of Gaussian distribution, the probability of samples within the range of ± 3 σ is 99.73 % . Assuming that the manufacturing uncertainties obey the Gaussian distribution, the value of sigma [21] could be obtained through σ = U S L L S L / 6 , in which U S L and L S L represent the upper and lower boundaries of the tolerance as in Figure 5.
Consequently, the distribution of the several types of PM uncertainties are determined by Table 2, and they can be assumed to be Δ B r N ( 0 , 0.0167 2 ) , Δ t m N ( 0 , 0.0167 2 ) , Δ θ p i N ( 0 , 0.0167 2 ) and Δ w p m N ( 0 , 0.033 2 ) . The standard variance of Δ B r is obtained through σ Δ B r = | ( 0.05 0.05 ) / 6 | = 0.0167 .
To compare the cogging torque robustness of the initial design A and the robust B, 5000 PMs featuring different types of uncertainties are generated and randomly assigned to the design models. The models are then calculated by the FEM and the cogging torque performance is presented in Figure 6a.
The peak-to-peak cogging torque of the initial design A considering PM uncertainties are within the range of 0.42 Nm to 0.8 Nm, while the robust design B shows a much smaller range of (0.25, 0.37) Nm. The probability distribution function (PDF) of the two design batches are presented in Figure 6b. It can be seen that expectation μ A and standard deviation σ A of the initial design are 0.565 Nm and 0.064 Nm, respectively. In contrast, the robust design B is with a much smaller expectation and stand deviation, which indicate its robustness considering the uncertainties in the real manufacturing process.
Selecting a design scheme not sensitive to the manufacturing uncertainties is a promising approach to guarantee the design performance for mass production. However, the compromise between different objectives is frequently inevitable in the real design practice, and the robust design might not be the best scheme when considering the other performance. For example, the efficiency of design B is approximately 92 % , which is inferior compared with the 93 % of the initial design A. This possible compromise between performance and robustness drives us to turn to other dimensions to suppress the cogging torque related to manufacturing uncertainties.

3. The Robust PM Assembling Approach
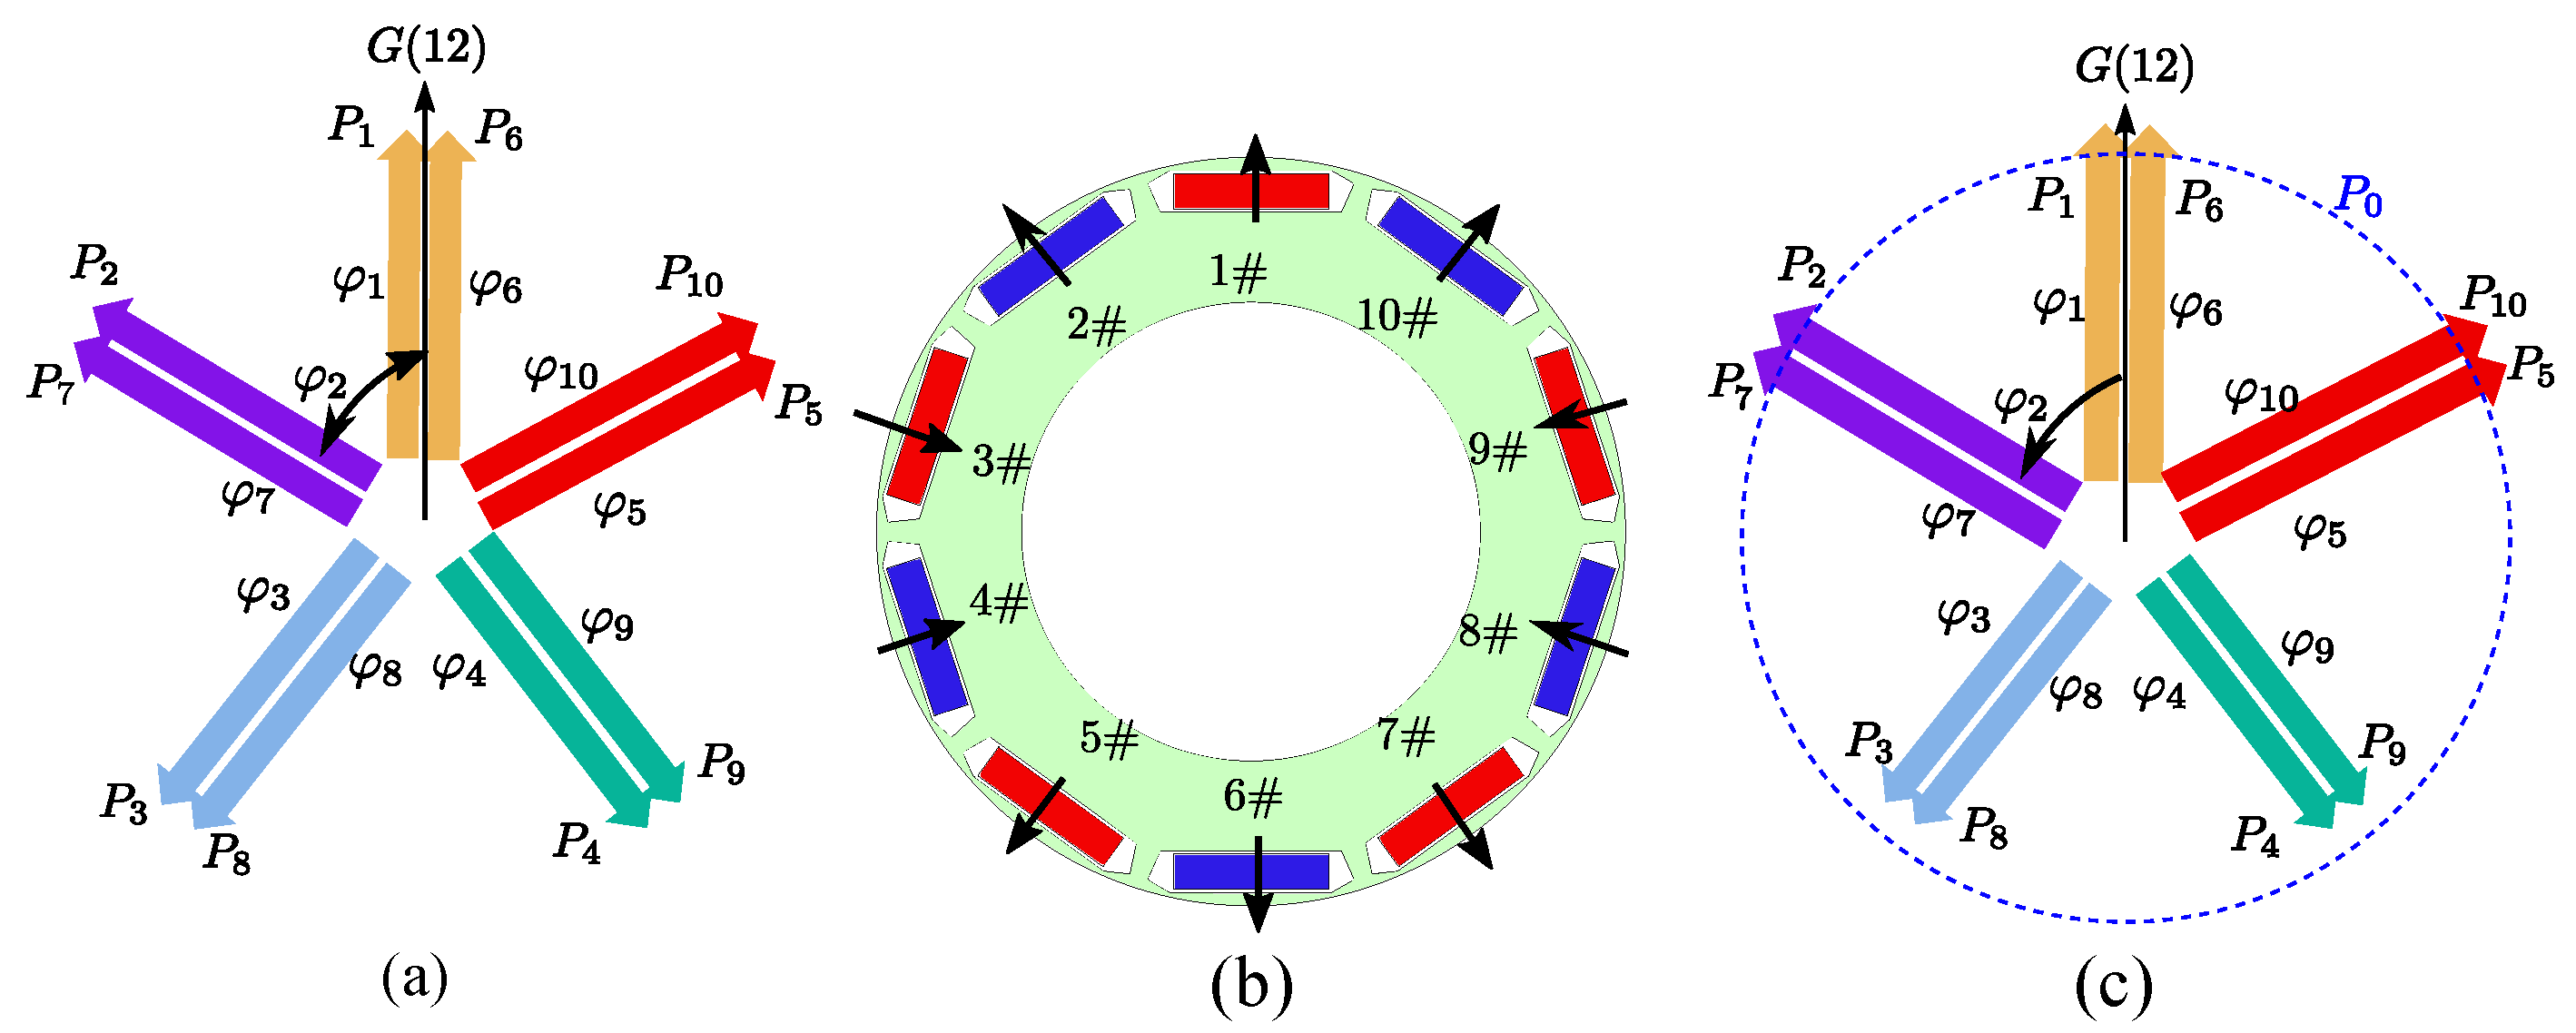
Based on Equation (5) and the vector diagram in Figure 2, the effects of uncertainties on the additional cogging torque harmonics can be analysed, and the worst-case scenario is identified as aforementioned. On the other hand, if the uncertainties on each PM can be known, a robust design might also be achieved by assembling the PMs with a special sequence where the effects of uncertainties counteract with each other. A robust PM assembling approach is proposed in this part, which can reduce the cogging torque variation under uncertainties when compared with the conventional randomly assembled one.

3.1. A Case Study Considering the PM Thickness Uncertainties

The cogging torque due to the PM uncertainties could be split into two aspects: the uncertainty value and the assembling sequence combinations. For the 10P/12S motor studied in this paper, the PM thickness tolerance is assumed to be ±0.1 mm. Ten PMs with different thickness uncertainties are listed in Table 4, and they could be assembled in any sequence.
As the rotor is round and rotates, so the magnet combination sequence is periodic and only the relative position of PMs makes it distinctive. In other words, the design schemes with PM assembling sequence of ( 1 # , 2 # , ..., 10 # ) and ( 9 # , 10 # , 1 # , ..., 8 # ) are equivalent.
Known from the vector diagram, the uncertainty on each PM plays different roles in the cogging torque variation and their effects are shown in Figure 2. Obviously, the influences of magnet position P 1 and P 6 contribute more to the additional cogging torque. If the PMs with positive and negative values of Δ t m are assembled in these positions, their effects would counteract with each other and result in small cogging torque variations. Based on this idea, three clusters of designs are built with different PM combination sequences, and they are then compared with the randomly assembled ones E 1 . The three assembling approaches are illustrated in Figure 7.
Firstly, all the PMs are randomly assembled and 50 models are set up, named PM assembling design method E 1 . The second assembling method E 2 is to put the PMs with larger negative uncertainty ( 1 # and 2 # ) in the PM pockets ( P 1 and P 6 ), while others position are randomly assembled. While in E 3 , the position P 1 and P 6 are filled in PMs with opposite values of Δ t m ( 1 # and 9 # ). As for the last method E 4 , the PMs 1 # and 2 # are assembled in P 1 and P 7 , while 9 # and 10 # are placed in P 2 and P 6 . In this case, the influence of PMs with larger uncertainties would counteract each other.
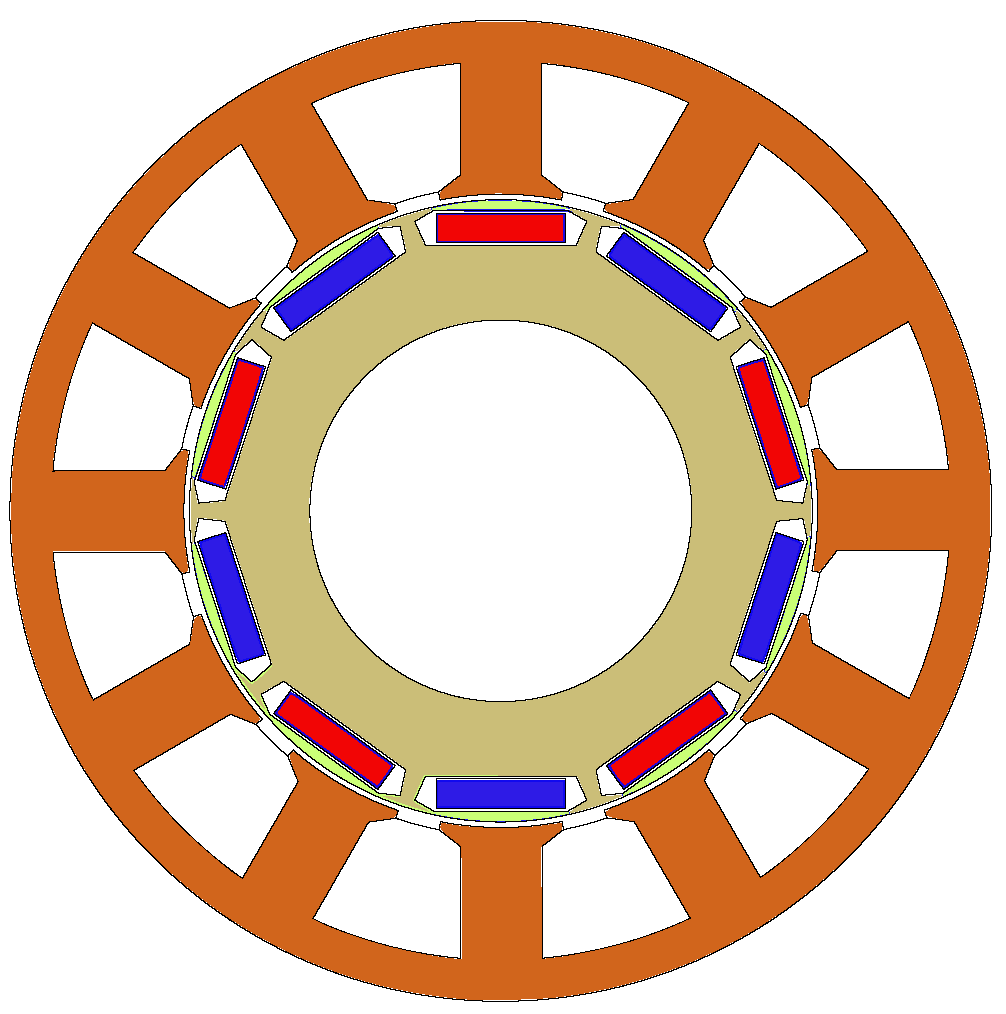
The motor geometry is as presented in Figure 4, and 50 models featuring different PM assembling sequences are built and calculated for each cluster. All the models are with the same parameters and PMs, and the differences are just the PM assembling sequences. All these models are calculated through the FEM, and the peak-to-peak cogging torque performance are shown in Figure 8.
As shown in Figure 8, the peak-to-peak cogging torque of randomly assembled method E 1 largely varied, from 0.45 Nm to 0.8 Nm, which means the cogging torque performance of these motors are not robust. While the designs of E 4 are more robust as the peak-to-peak cogging torque slightly vary as expected. Compared with E 3 , the uncertainty combinations on cluster E 4 is relatively more symmetrical. It also demonstrates that the influences of PM uncertainties on the cogging torque could be reduced with a properly assembling approach.

3.2. PM Assembling Approach Considering Single Type of Uncertainty

The uncertainties on PM residual flux density B r , PM width w p m , and PM thickness t m have similar effects on the magnetic energy in the PMs and, thus, impose similar influences on the additional cogging torque harmonics [30].
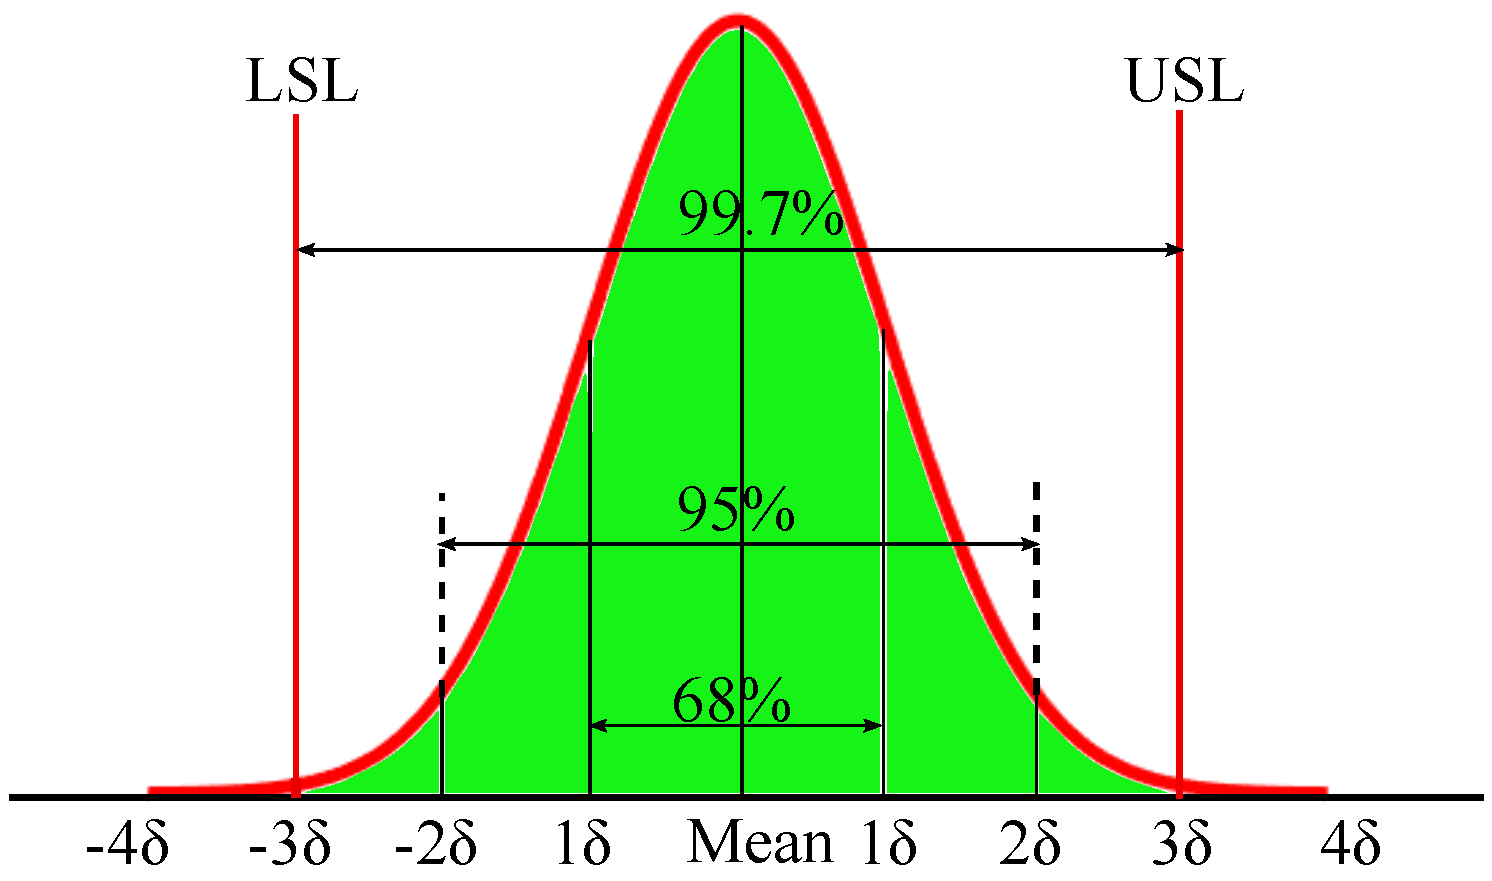
The PMs featuring different uncertainties can then be divided into several groups based on an uncertainty range, as illustrated in Figure 5. The four groups ( G 1 to G 4 ) correspond to the PMs featuring the maximum, the minimum, the negative and positive medium uncertainties.
If the PMs are selected from different groups and assembled as the sequence illustrated in Figure 9b, the corresponding 12th cogging torque harmonics related vectors are represented in Figure 9c.
The effects of the maximum and minimum uncertainties of G 1 and G 2 would counteract each other if they are assembled in the position of P1 and P6, respectively. The PMs of G 3 and G 4 are assembled in the corresponding positions to mitigate their effects of uncertainties on the additional 12th order of the cogging torque.
To verify this deduction, several models are built with PMs featuring different types of uncertainties and are calculated by the FEM. It is assumed that the uncertainties are Gaussian distribution, and the uncertain ranges are as presented in Table 2. The several types of uncertainties can be regarded as Δ B r N ( 0 , 0.0167 2 ) , Δ t m N ( 0 , 0.0167 2 ) and Δ w p m N ( 0 , 0.033 2 ) . To be noticed, only one type of uncertainty is considered in each PM in this analysis.
Ten thousand PMs featuring different uncertainties are generated in the simulation, and they are categorized into four groups and are assembled as previously described in Figure 9b. This assembling cluster is denoted as E 2 , and its counterpart of randomly assembled PMs approach is referred to as E 1 . Two hundred models are built with the two assembling approaches and the peak-to-peak cogging torque performance considering different types of uncertainties are presented in Figure 10.
It can be seen from Figure 10 that the cogging torque variation of E 2 is relatively smaller than that of the randomly assembled approach E 1 , especially when the uncertainties of Δ B r and Δ t m are considered. While the cogging torque is not significantly reduced for the PM width uncertainties ( Δ w p m ) in Figure 10c, the reason can be contributed to the low sensitivity of Δ w p m to the cogging torque [30].

3.3. PM Assembling Approach Considering PM Position Uncertainty

The influence of PM width uncertainties on the cogging torque is twofold. It not only influences the magnetic energy stored in the PMs, but also affects the maximum value of assembling positional uncertainty.
To make it convenient for the assembling process, the magnet pocket is usually a little larger than the magnet dimensions, named w d in Figure 11. This makes the magnet’s center deviate slightly from the ideal case, and the deviation relates to the width uncertainty.
The maximum value of positioning uncertainty is determined by Δ p = ( w r w p m Δ w p m ) / 2 = ( w d Δ w p m ) / 2 . Given the huge difficulty of controlling the magnet’s position in the magnet pockets, the positioning uncertainty should be regarded as an uncontrollable variable in the analysis. Then, the positioning uncertainty of each PM is expressed as Δ p i = r i Δ p , where r i is a random value within ( 1 , 1 ) . Then, the Δ θ i in (2) could be obtained with Δ θ i = r i Δ p / R m , where R m is the radius of the PM center.
For the ideal case, the vector diagram of G ( 12 ) in the ideal-case is illustrated in Figure 12a, and the superposition of each vector is zero if no uncertainties exist. When the PM positioning uncertainties are concerned, each vector might rotate a small angle under randomly assembling scenarios, and the superposition of these vectors might be large. However, if all the PMs are pushed to the left side during the assembling process, each vector would rotate in one direction. It is equivalent to all vectors rotating at a similar angle and the superposition is not much increased, just as presented in Figure 12c. Consequently, the effects of PM positioning uncertainties of cogging torque could be reduced to some extent. The PMs should be pushed to one-side in the same direction to mitigate the effects of positioning uncertainties, so it is also fine to push the PMs to the right-side.
Two hundred models with different PM assembling approaches, PM randomly assembled ( E 1 ) and all PMs pushed to the left side ( E 2 ), are built and calculated through the FEM. The peak-to-peak cogging torque performances are presented in Figure 13.
As shown in Figure 13, the cogging torque variation range of the randomly assembled PMs ( E 1 ) is larger than that of the cluster E 2 . This validates that the assembling approach of pushing the PMs to one-side can mitigate the effects of PM positioning uncertainties on the cogging torque variation.

3.4. PM Assembling Approach Considering the Uncertainties on the PM Width and Positioning

As the uncertainties on PM width and positioning uncertainty are related, the PM assembling approach considering the both uncertainties is required.
The width of the PM pocket ( w r ) is assumed to be 0.2 mm larger than the PM width ( w p m ). Initially, the PM width tolerance range is designed to be ( Δ w p m = ± 0.1 mm). It is then modified into a new range of (−0.05, 0.15) mm. Since the range between the uper and lower boundaries remains unchanged ( 0.2 mm for both cases), the manufacturing cost of PMs are slightly affected.
According to the vector analysis mentioned above, the PM positioning uncertainties affect the distribution position of each vector. It is assumed that all PMs are installed in the pocket and pushed to the left-side, then each vector in the corresponding vector diagram rotates at a certain angle, and the relative position change between each vector can be very small, which can effectively reduce the influence of PM positioning uncertainties on the cogging torque in theory.
Two batches of PMs with different tolerances in the range of Δ w p m , (−0.1 mm, +0.1 mm) and (−0.05 mm, +0.15 mm), are considered and denoted as PM-1 and PM-2. The corresponding distributions are Δ w p m 1 N ( 0 , 0.033 2 ) and Δ w p m 2 N ( 0.05 , 0.033 2 ) . Five thousand pieces of PM are randomly generated and selected for building FEM models. As for the positioning uncertainty of each PM, it can be a random value within the range of (− Δ θ p i , + Δ θ p i ), where Δ θ p i is related to the PM width uncertainty Δ w p m . Consequently, both the uncertainties on the PM width and PM positioning center are considered in the simulations.
Three design clusters are built with different assembling approaches. The first cluster E 1 is composed of designs of randomly selected PMs from group of PM-1 with an uncertain range of ( Δ w p m = ± 0.1 mm). The randomly selected PMs from a batch of PM-2 are denoted as E 2 . As for third cluster E 3 , the models are built with PMs selected from the batch of PM-2, and each PM is pushed to the left-side when assembling.
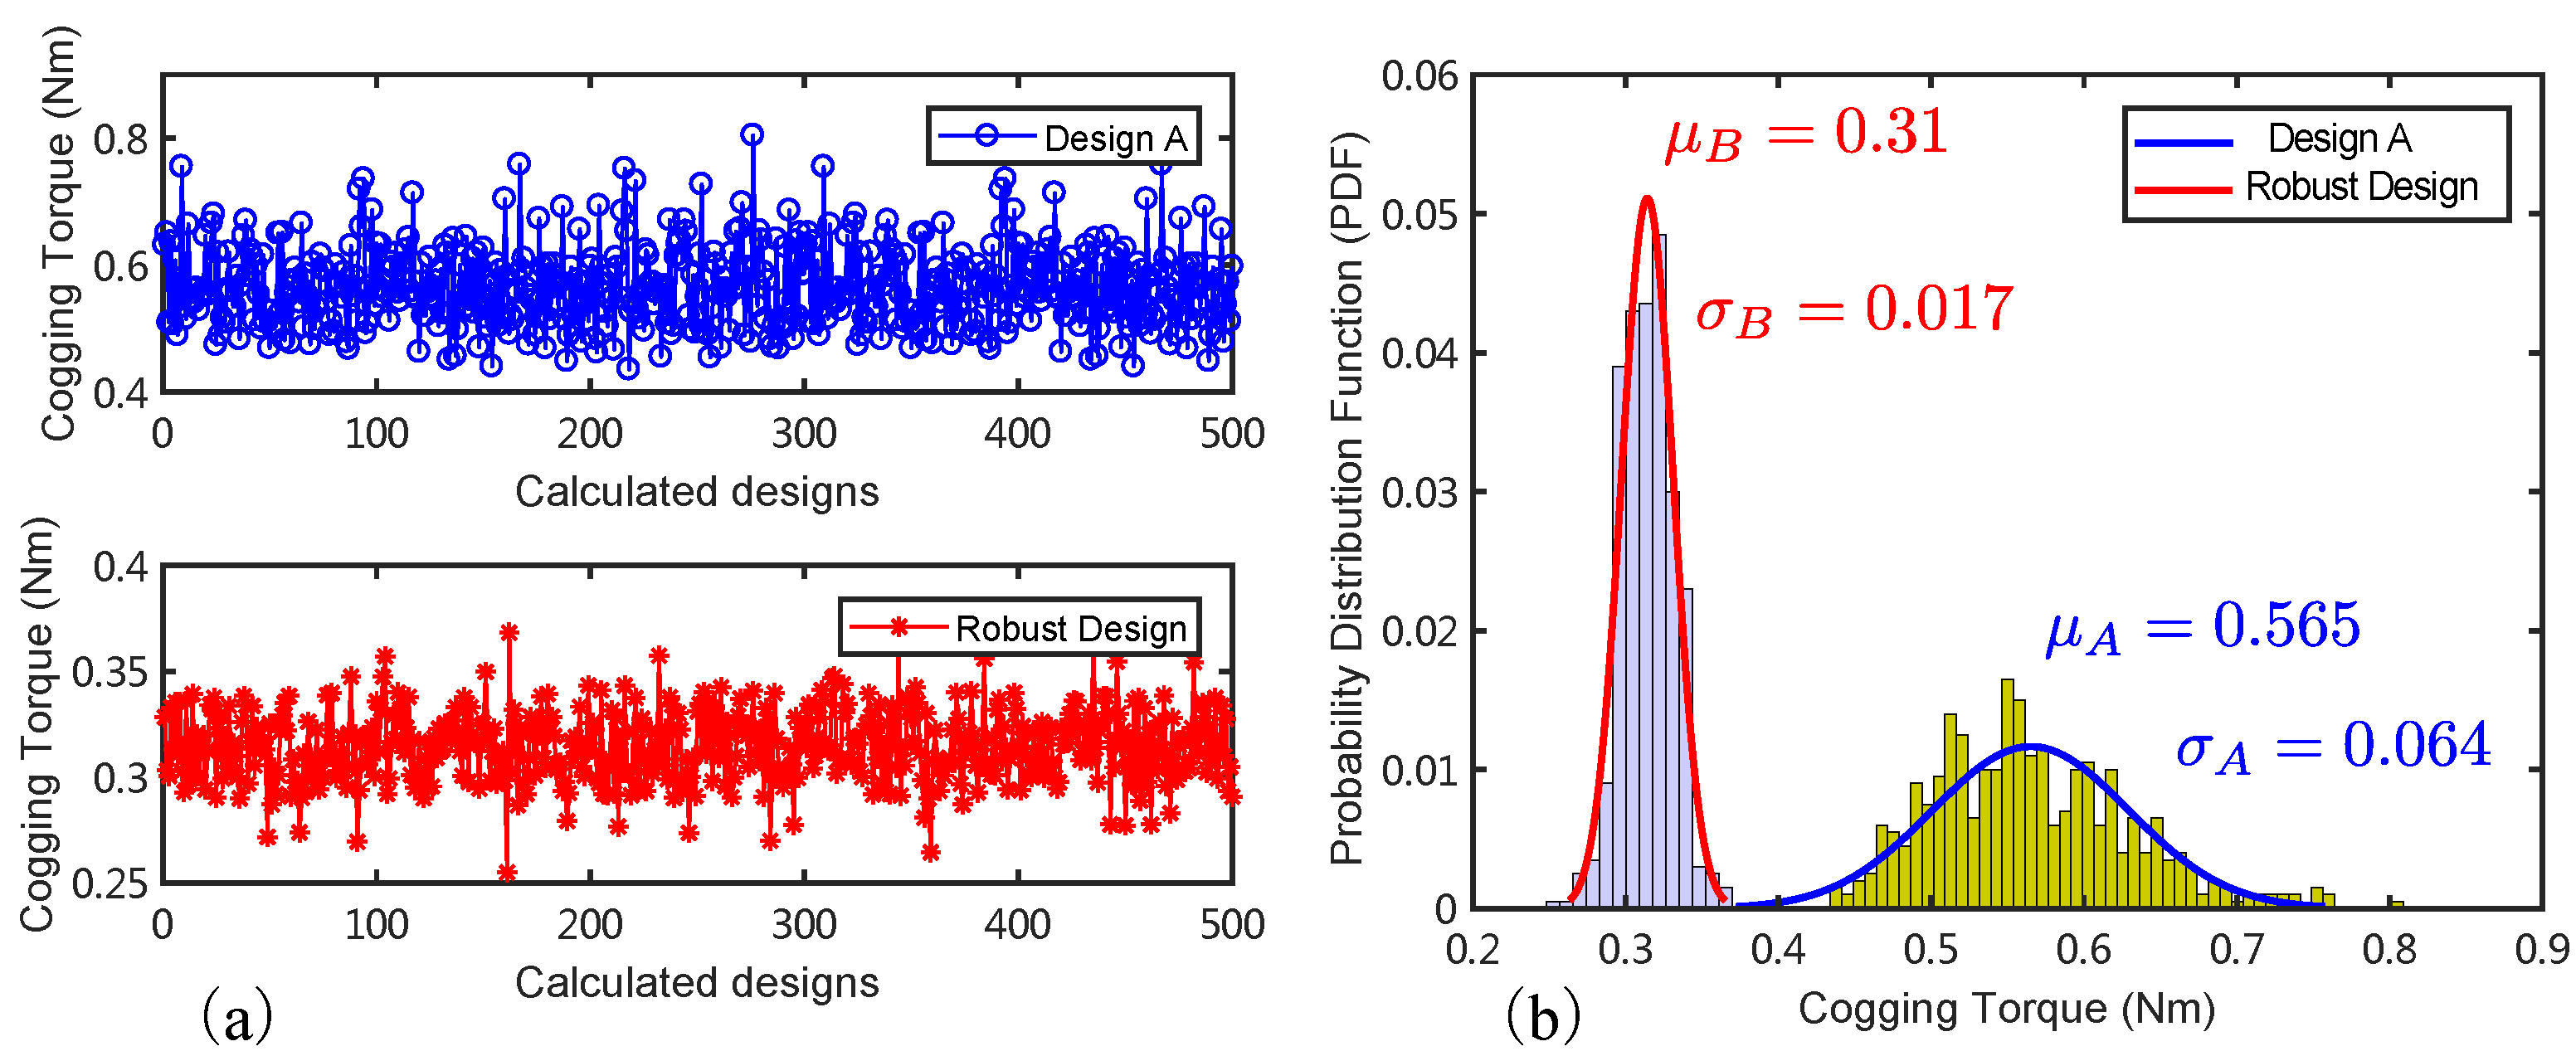
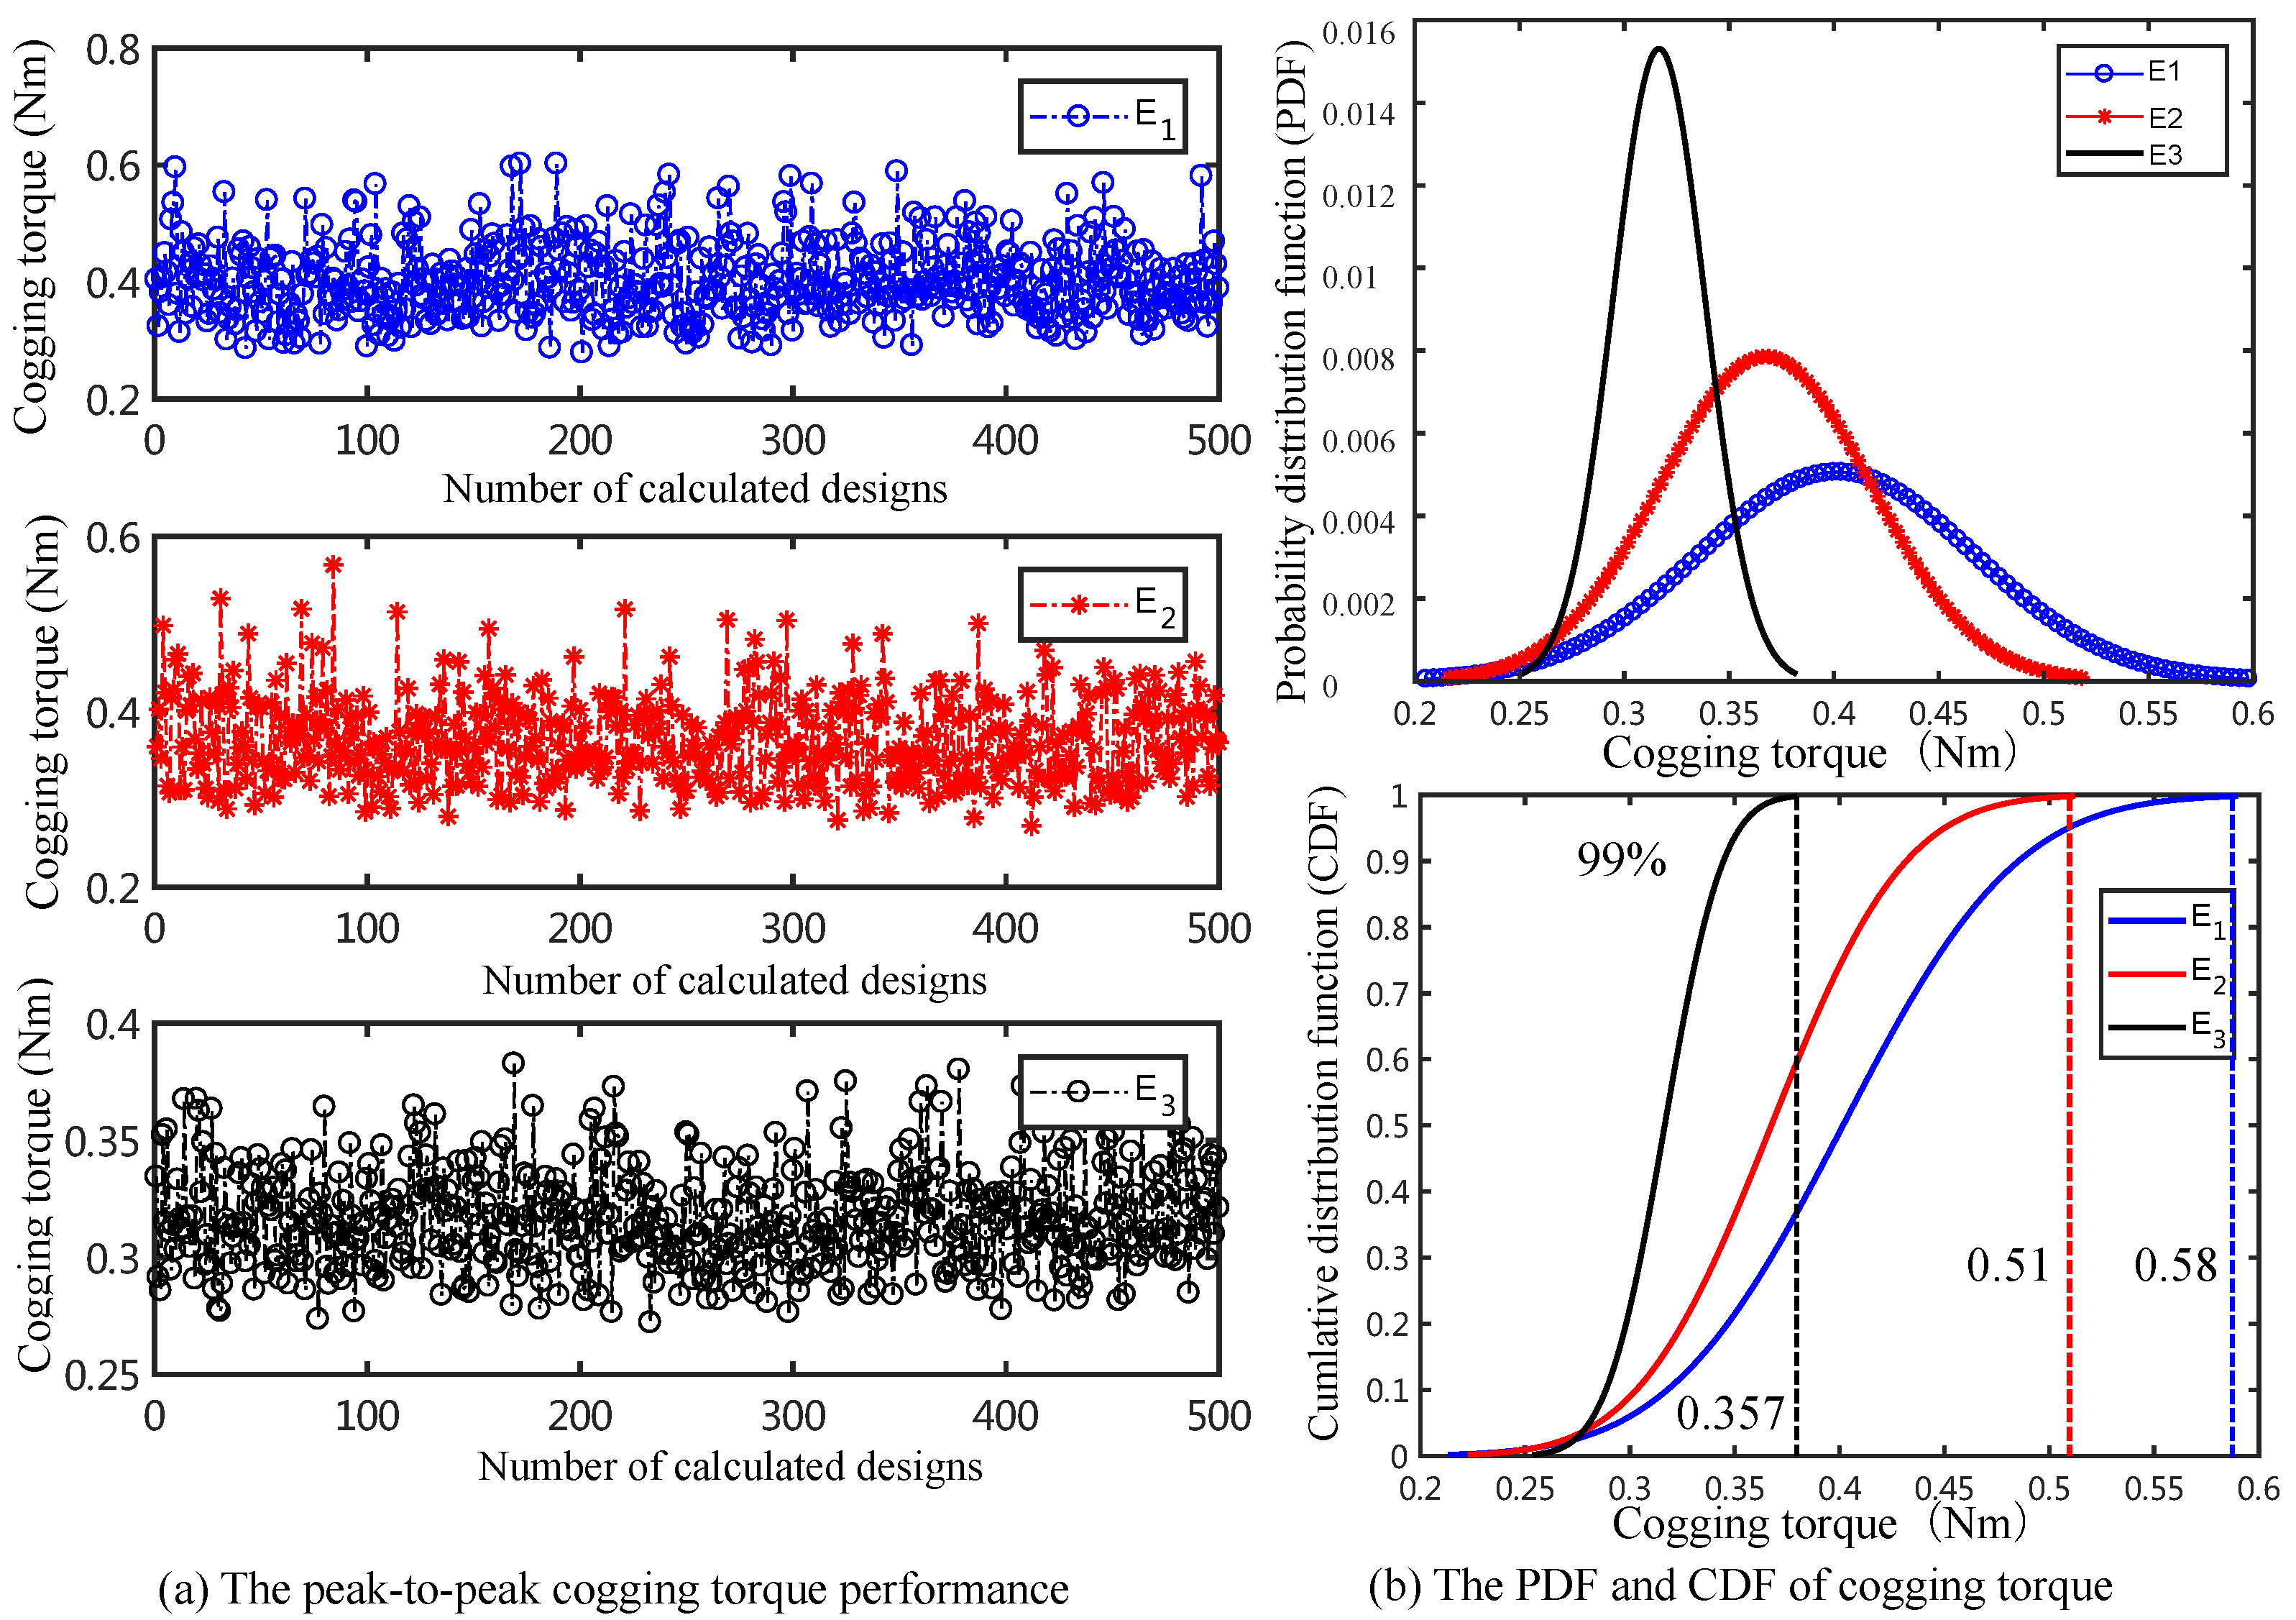
Five hundred models are built for each cluster ( E 1 to E 3 ) and they are then calculated by the FEM. The peak-to-peak cogging torque performances of the three design clusters are presented in Figure 14a. The corresponding PDF and cumulative distribution function (CDF) are also compared and illustrated in Figure 14b.
It can be seen from the PDF of the cogging torque in Figure 14b that the cogging torque distribution for the randomly assembled scenario is within ( 0.25 , 0.6 ) Nm, and the performance is slightly improved if the PM width is modified in E 2 , while the assembling approach E 3 is shown to be the most promising with the cogging torque distributed within the range of ( 0.26 , 0.36 ) Nm. Seen from the CDF in Figure 14b, 99 % of the designs with the E 1 approach show a cogging torque value smaller than 0.58 Nm, while the corresponding value is 0.357 Nm with the assembling approach of E 3 , which is approximately reduced by 38.4 % .
The reason for the E 3 approach to significantly reduce the effects of uncertainties can be attributed to two aspects. The first one is that the modification of the tolerance range on PM width slightly affects the cogging torque, but it can narrow the maximum range of PM positioning uncertainties Δ p previously mentioned. The second contribution comes from the operation of pushing the PMs to the left side, which is equivalent to narrowing the relative positioning uncertainty for the rotor, just as illustrated in Figure 12c.

3.5. PM Assembling Approach Considering the Combined PM Uncertainties

In the actual manufacturing process, the uncertainties occur on the PMs involve B r , w p m and t m , and the positioning uncertainty when assembled into the PM pocket in the rotor. An extensive PM assembling approach is required to simultaneously consider these different types of uncertainties.
The measured magnetic flux is a parameter related to the residual flux density and the volume of the PM, and it can be a comprehensive embodiment of different types of PM manufacturing uncertainties. By means of the magnetic flux measurement and categorization, the comprehensive control of the PM manufacturing uncertainties can be realized, and a further operation of pushing the PMs to one-side is also required to mitigate the effects of PM positioning uncertainties.
Thus, the robust PM assembling approach proposed involves three steps: (1) Categorize the PMs into several groups based on the PM magnetic flux variation; (2) select the PMs from a group and assemble it to the particular PM pocket based on the vector diagram; (3) push the PM to the left-side when assembling.

3.5.1. Approach for Mass Production

In the manufacturing process, the flux of a batch of PMs usually obey the Gaussian distribution, and the PMs can be divided into several groups based on the tolerance ranges considering flux variation. Four groups based on their corresponding PM flux are then obtained as shown in Table 5; the PMs are then selected from different groups and are assembled in a sequence as presented in Figure 9b. All the PMs should be pushed to one-side (left-side) when assembling. With this assembling approach E a , the effects of PM uncertainties on the additional cogging torque might be significantly mitigated.
To verify the effectiveness of the assembling approach E a , 500 models featuring different PM uncertainties with another two different assembling approaches are built and calculated by FEM. Based on the tolerance ranges presented in Table 2, the PM uncertainties are assumed to obey B r N ( 1.2 , 0.0167 2 ) , Δ t m N ( 0 , 0.0167 2 ) and Δ w p m N ( 0.05 , 0.033 2 ) . One hundred thousand PMs with uncertainties are generated through the mathematical toolbox, and they are then categorized into four groups ( G 1 to G 4 ) based on their corresponding PM flux.
The models based on the randomly selected and assembled PMs are denoted as E 1 . The proposed assembling approach as presented in Figure 9, where PMs are simultaneously selected from the four groups listed in Table 5, is referred to as E a . The models with randomly assembled PMs, which are selected within a single group of G1 (or the others), are denoted as E b . Thus, the main differences between designs in E b and E a lies whether the PMs are selected from one single group in Table 5 or not. To be noticed, all the PMs are pushed to the left-side in both E a and E b to reduce the effects of PM position uncertainties.
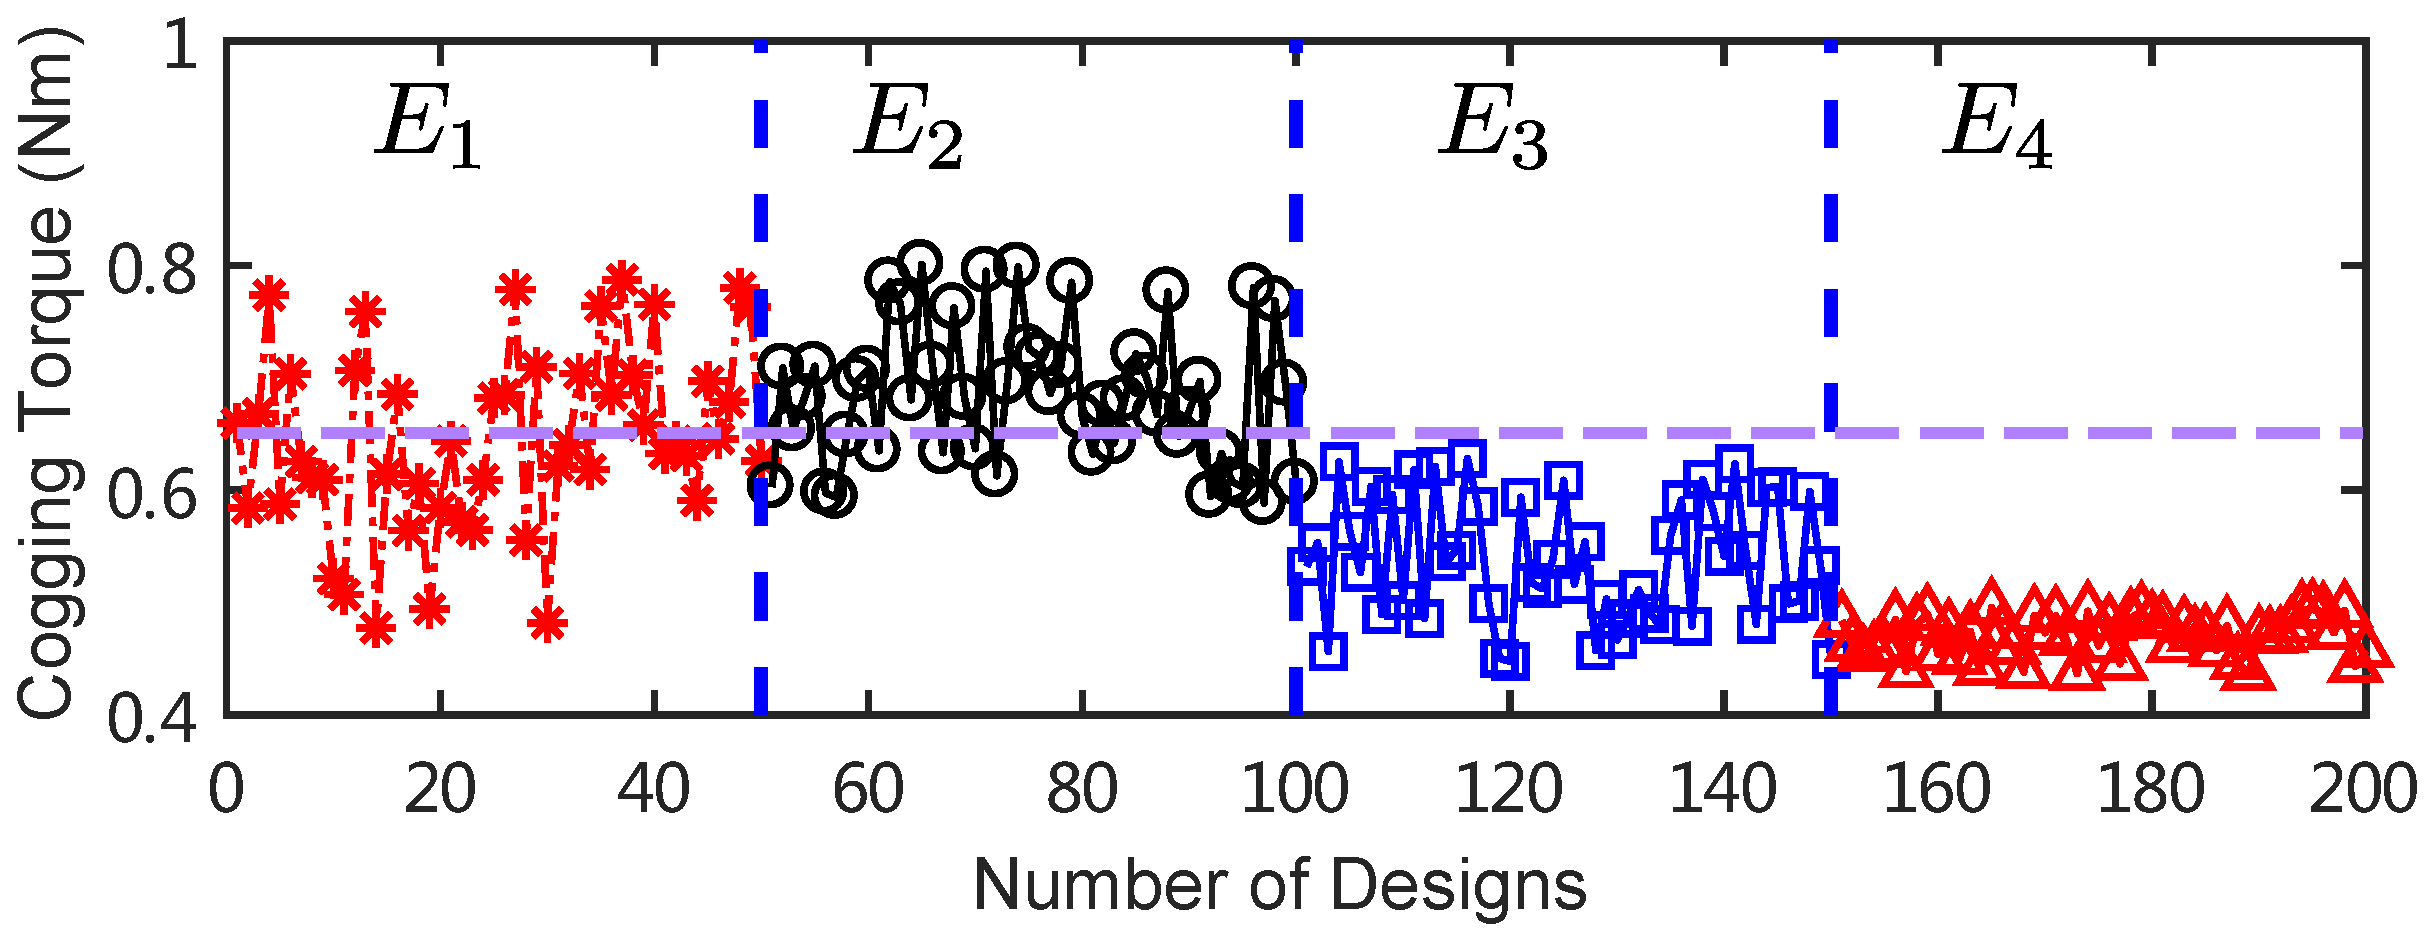
The batches of models are then calculated by the FEM, and the peak-to-peak cogging torque performance are illustrated in Figure 15a. The PDF and CDF of the models with different PM assembling approaches are calculated and compared as well in Figure 15b.
It can be seen from Figure 15b,c that the cogging torque performance can be significantly improved by the proposed assembling approach. For the randomly assembled approach E 1 , the peak-to-peak cogging torque of 99.5 % of the design schemes are smaller than 0.73 Nm. While, the corresponding value is 0.48 Nm and 0.51 Nm for the approaches E a and E b , respectively. The designs with the proposed PM assembling approach E a show a smaller cogging torque and standard deviation when compared with the conventional randomly assembled designs, and this indicates the robustness of the proposed assembling approach in this scenario.
Interestingly, the cogging torque distributions are quite similar for assembling approaches E a and E b . Besides, considering the inconvenience of selecting PMs between different groups during the assembly process, the assembling approach E b might be more practical.
As the PMs are categorized into several groups based on the flux variation, the uncertainties range within one group is reduced to a smaller level. Then, the PM positioning uncertainties are reduced by pushing all the PMs to the left-side. Consequently, this PM assembling approach is a simplified version of the proposed approach E a , and it is more convenient to be adopted and suggested for mass production.

3.5.2. PM Assembling Approach for the Small Amount of Prototypes Fabricating Process

For a scenario of fabricating only a few prototypes, where the uncertain values on each PM can be measured and analyzed, a better choice might be assembling all the PMs based on the vector diagram to compensate the effects of uncertainties.
Just as previously mentioned, the flux of each PM can be measured and assembled in a particular sequence to maximally mitigate the additional cogging torque harmonics based on the vector diagram. Besides that, the control on tolerance ranges is also suggested to mitigate the effects of uncertainties. The uncertainties on the PM thickness and residual flux density should be controlled to a small range, and the PM positioning uncertainties can be mitigated by a oneside-push assembling approach as aforementioned. An experimental verification will be given in the next part.
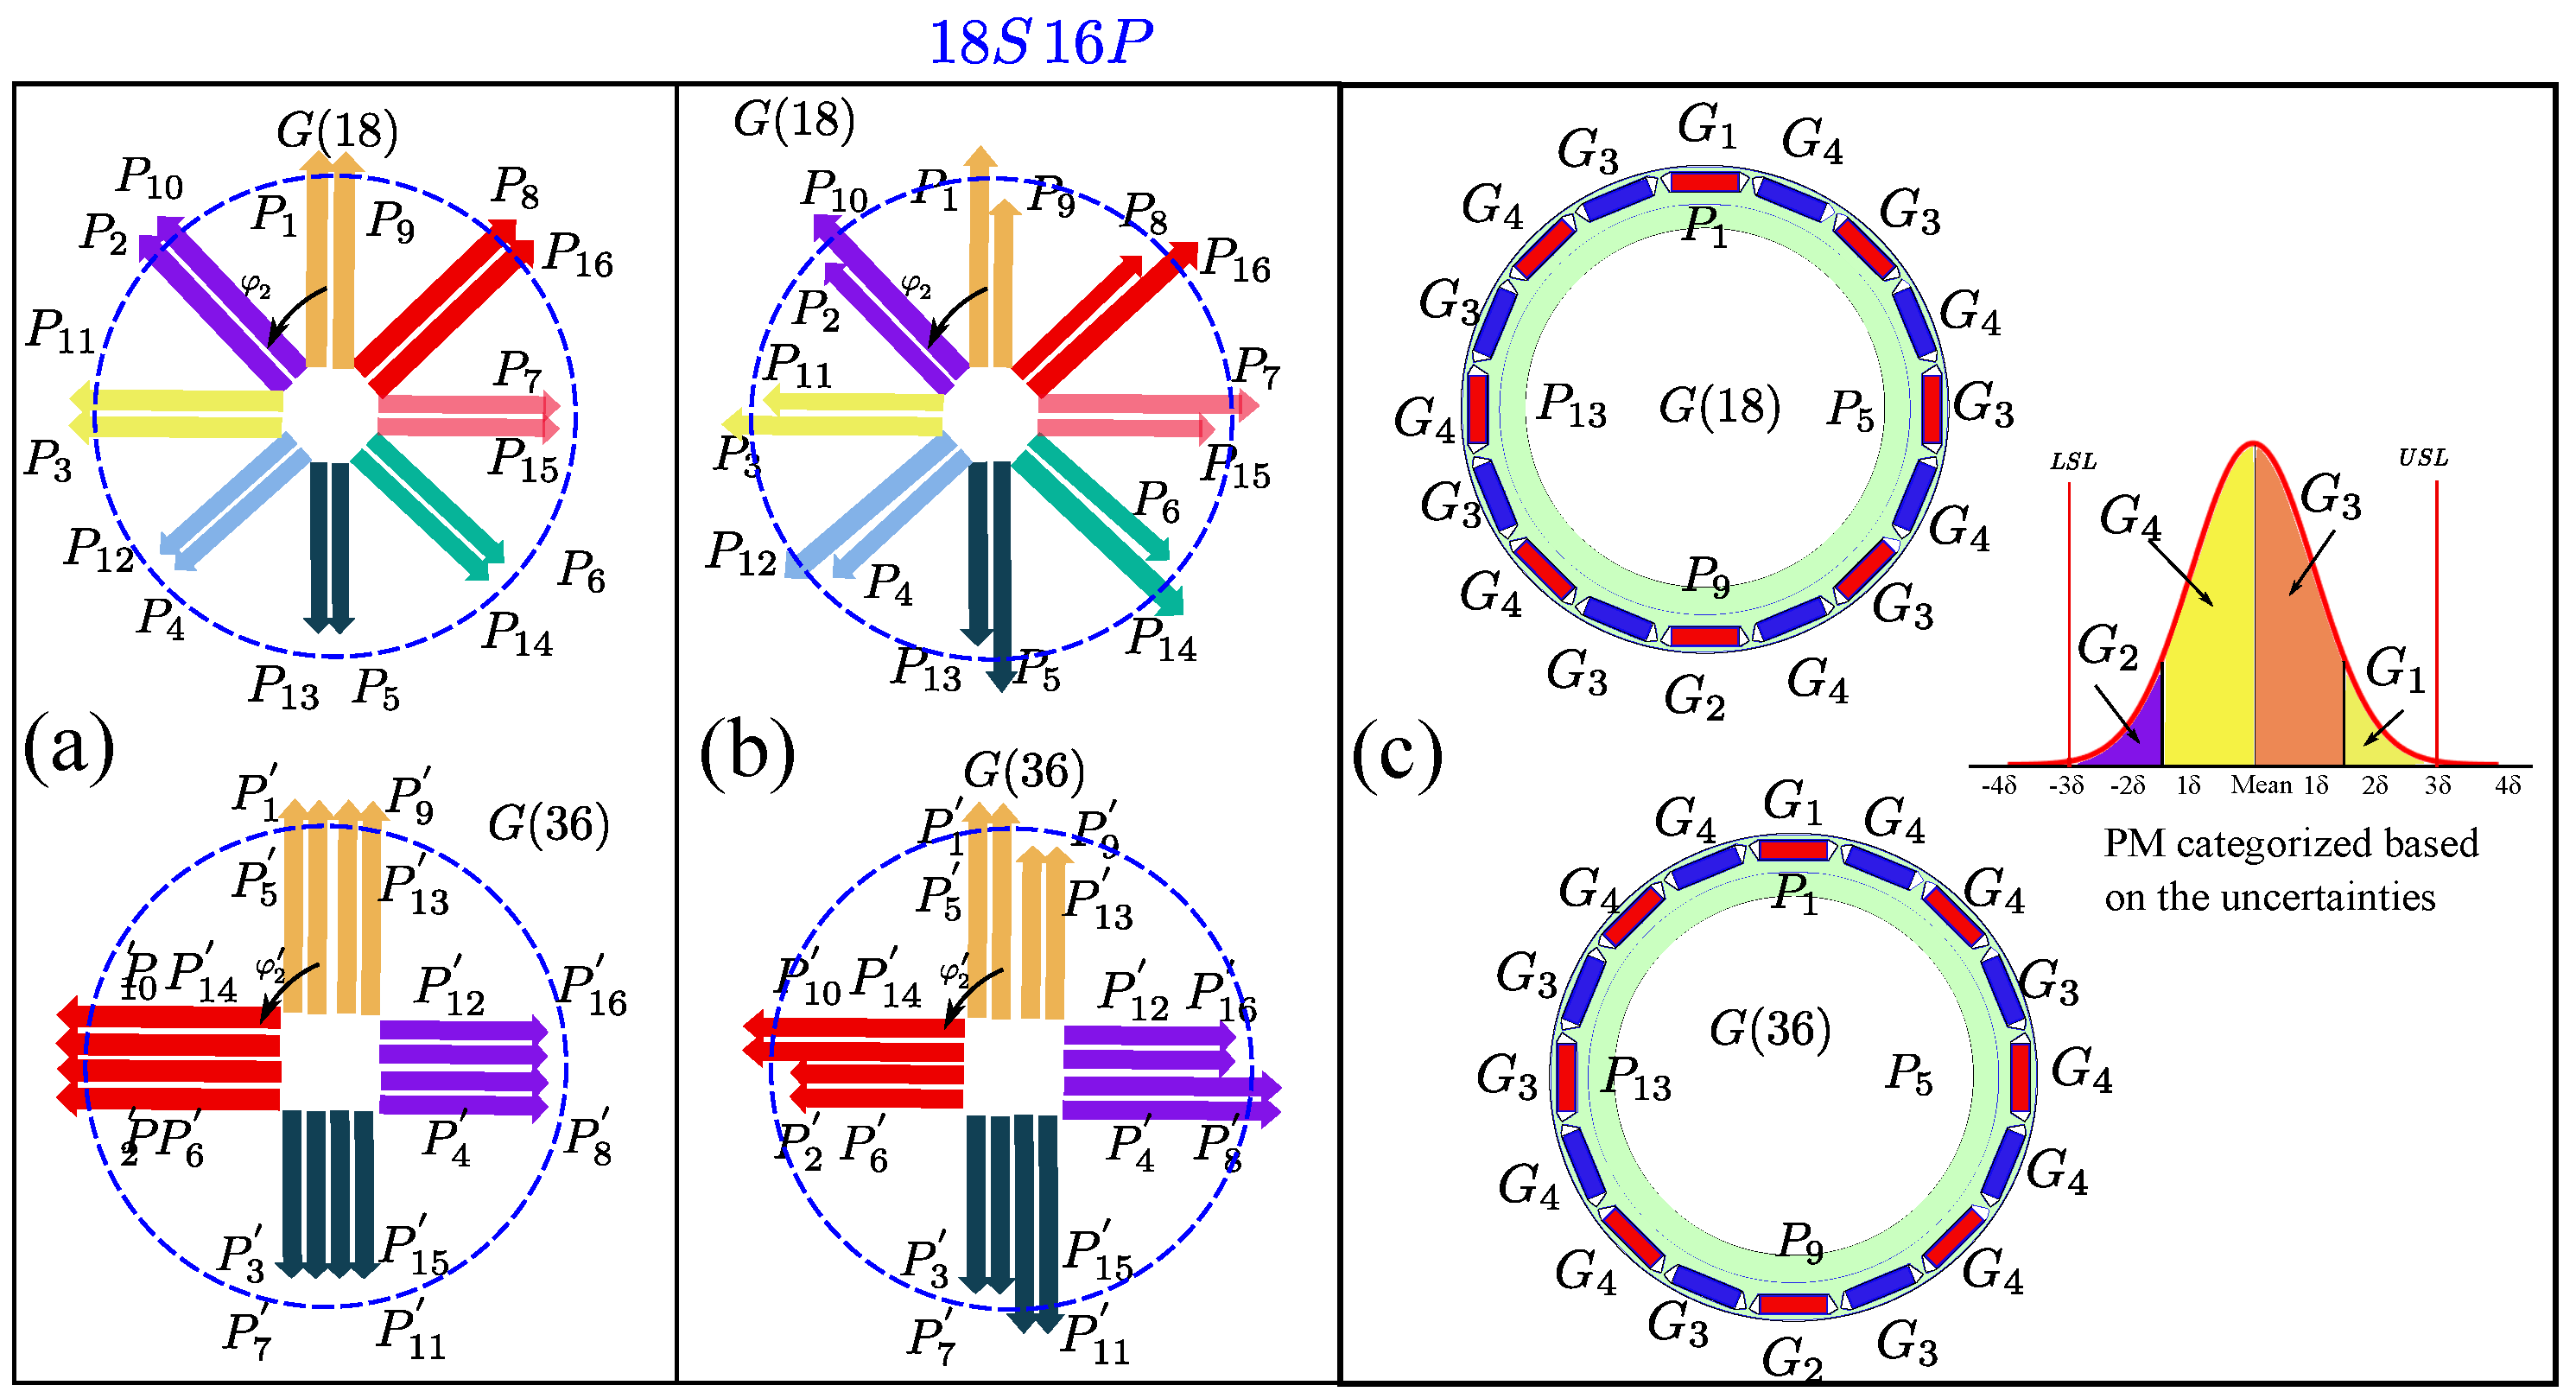
The PM assembling approach can be also adopted for other slot/pole configurations, and the 18S16P geometry is selected as an example. The proper sequence to mitigate the effects of PM uncertainties on the additional cogging torque is presented in Figure 16b, and the corresponding worst-case is listed in Figure 16a to highlight the differences between the two PM assembling sequence.
The categorized PM based on the uncertainties are labelled with G 1 to G 4 , and they are then assembled as the sequence presented in Figure 16c to make the effects of uncertainties on each PM counteract each other. There also might be other sequences to achieve a similar effect to the one shown in Figure 16c, unless the uncertainties could counteract each other in the vector diagram.

4. Experimental Verifying for the Proposed PM Assembling Approach

To conclude, the basic idea of the proposed PM assembling approach is to combine the uncertainties in a special sequence which would make their effects counteract each other by means of the vector diagram analysis. To verify the proposed PM assembling approach, two 1.2 kW 12S10P IPM machines are fabricated and tested. The basic parameters of the motor are presented in Table 6.
A batch of PMs with uncertainty ranges, listed in Table 2, are bought from the manufacturer. Each PM is measured by a Helmholtz coils based flux detection machine. The flux of the PM is derived from the value of the induced voltage in the testing coils, and the corresponding range of the batch of PM flux is equivalent to (12.59 mV, 13.01 mV). Several PMs with the boundary value are selected and further adopted to fabricate the prototypes, and the corresponding flux of the selected PM is presented in Table 7. The PMs numbered 1 # to 5 # are regarded as PMs with negative uncertainties (Neg), and the others correspond to the positive uncertainties (Pos).
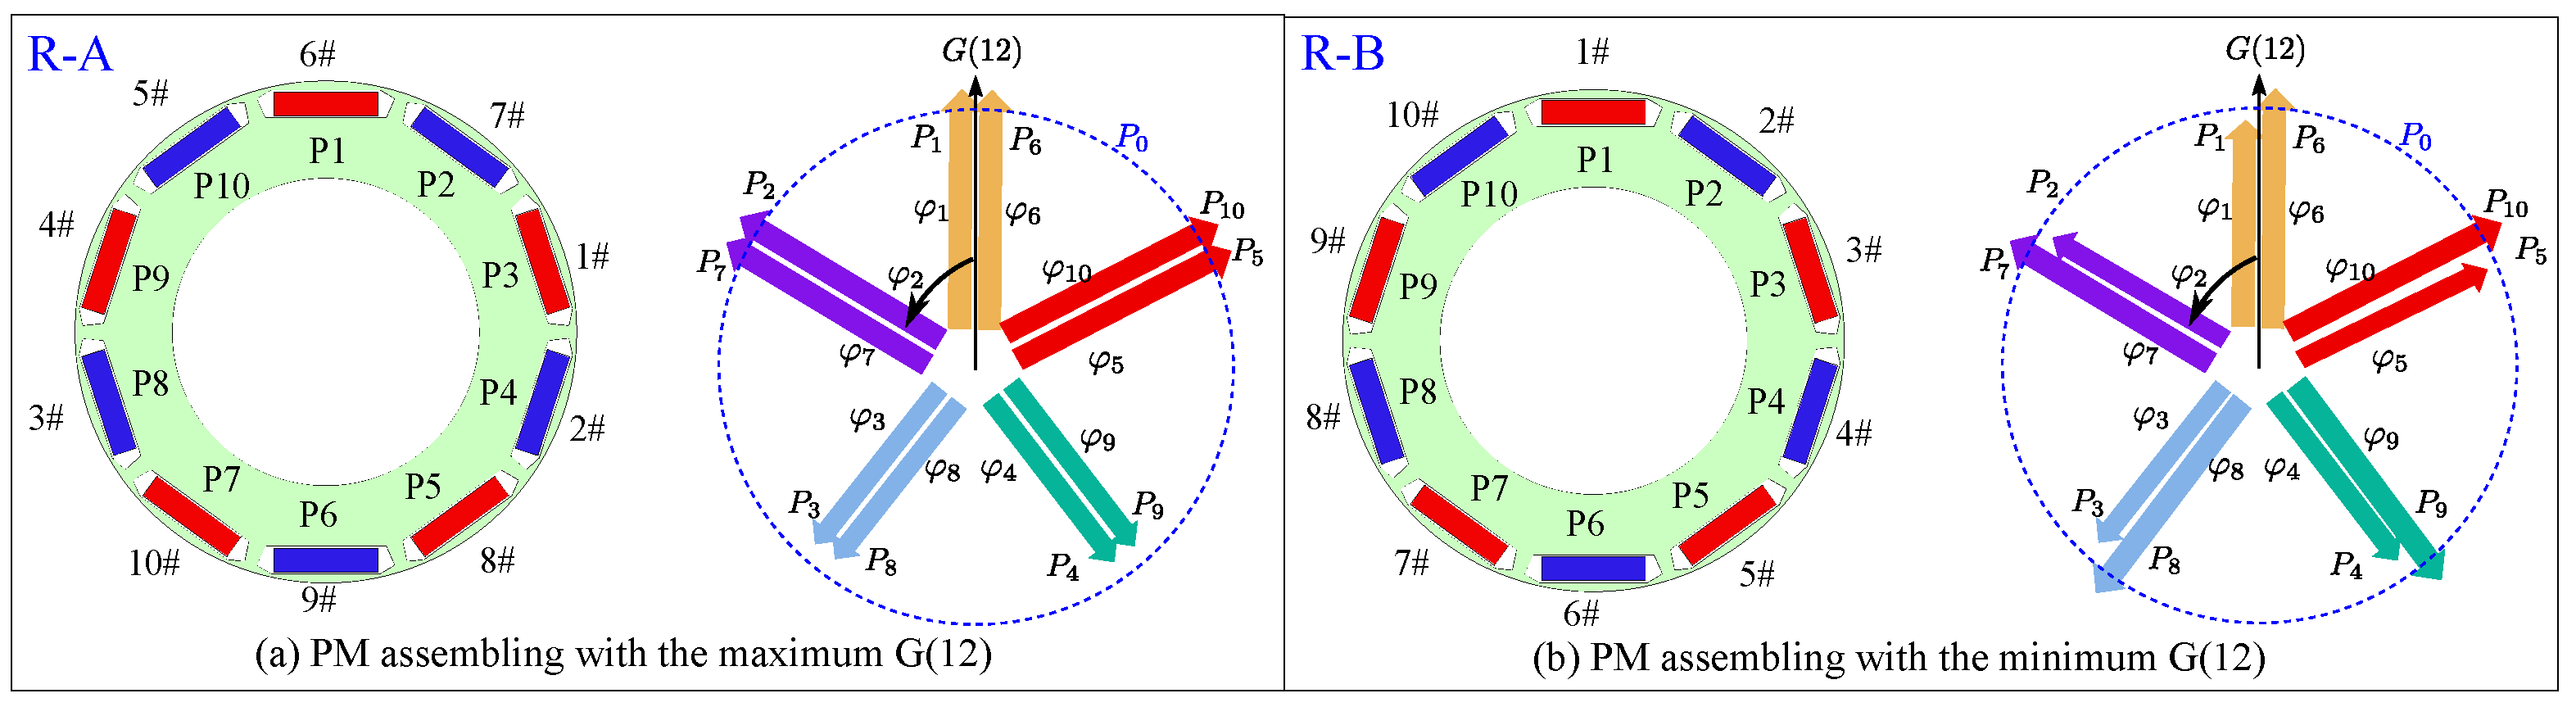
If the PMs are assembled in a sequence as in Figure 17a, the additional 12th harmonic orders of cogging torque harmonics would superpose and achieve the maximum value. A prototype is fabricated with this particular sequence and denoted by R-A. On the other side, if the PMs with positive and negative uncertainties are assembled in a special sequence as R-B in Figure 17b, their effects on the T c (12th) harmonics would counteract each other. Thus, T c (12th) of R-B should be much smaller than that of the R-A design scheme.
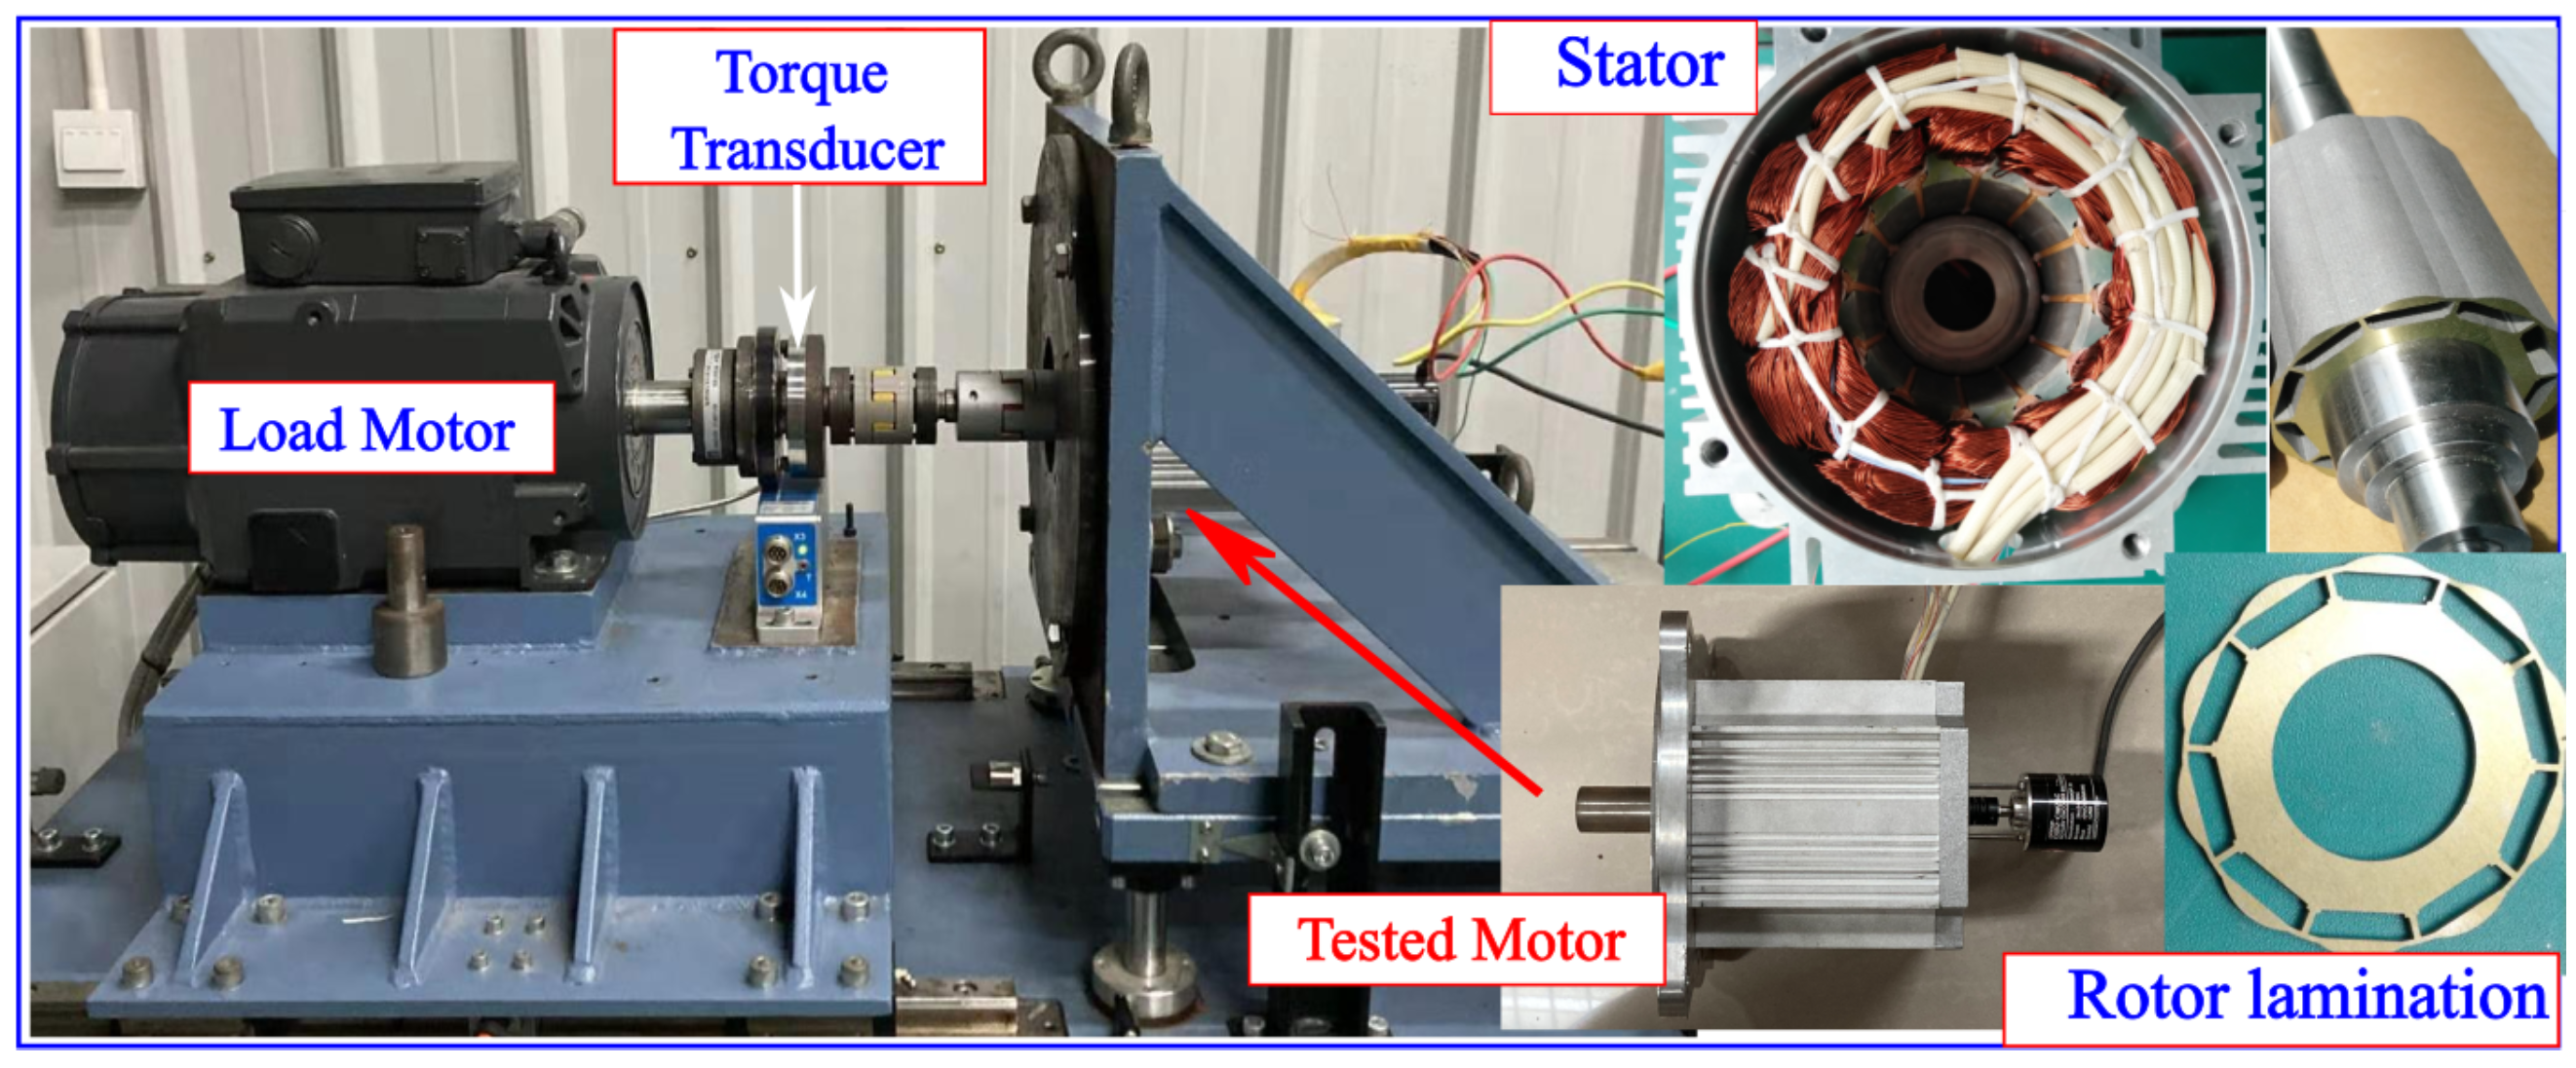
A prototype is fabricated with the 10 PMs assembled as the sequence of R-A, and it is denoted SR-A. The PMs are then withdrawn after the experimental test and are re-assembled with the sequence R-B, referred to as motor SR-B, for the next round experimental test. The prototype is then measured in the test bench, as presented in Figure 18. To exclude the effects of the control algorithm and additional current harmonics on the torque ripple performance, the back-EMF of prototypes is measured to estimate the torque harmonics under uncertainties.
The cogging torque and back-EMF of the two motors are presented in Figure 19. It can be seen from Figure 19a,b that the 12th order of cogging torque harmonic T c is significantly reduced in motor SR-B, indicating the counteraction of uncertainties as expected. The peak-to-peak cogging torque is reduced from 95 mNm to 53 mNm with the assembling approach R-B. Besides, the 7th order of the back-EMF harmonic is also reduced with the PMs assembling in the R-B sequence, which indicates the reduction of the 12th order of torque ripple harmonic.
The comparison of cogging torque harmonics and back-EMF harmonics for the two prototypes can verify the effectiveness of the vector diagram for uncertainties analysis, and the proposed PM assembling approach based on the vector diagram is validated as well.

5. Conclusions

In this paper, a robust PM assembling approach is proposed by combining the PM uncertainties in a special sequence where the effects of uncertainties on the particular cogging torque harmonics could counteract each other. The PMs are categorized into several groups based on the magnetic flux variation to simultaneously consider the several types of PM uncertainties. The proposed assembling approach is then verified by comparing with the randomly assembled PM models through FEM. The experimental results validate the assembling approach as well. This paper brings a new view on the uncertainties, where not only the uncertainty range but also the combination sequence of uncertainties matter. A stable cogging torque performance even for a non-robust scheme is possible to achieve with the robust assembling approach, and this gives more choices when the compromise of multi-objectives is unavoidable.

Author Contributions

Conceptualization, N.B., G.B. and Y.Y.; Funding acquisition, C.Z.; Methodology, Y.Y.; Project administration, P.H.; Supervision, N.B. and C.Z.; Writing—original draft, H.L. and Y.Y.; Writing—review & editing, X.J., N.B., G.B. and Y.Y. All authors will be informed about each step of manuscript processing including submission, revision, revision reminder, etc. via emails from our system or assigned Assistant Editor. All authors have read and agreed to the published version of the manuscript.

Funding

This work was supported by the National Key R&D Program China under Grant No. 2017YFB0102400.

Institutional Review Board Statement

Not applicable.

Informed Consent Statement

Not applicable.

Conflicts of Interest

The authors declare no conflict of interest.

References

  1. Jahns, T.M.; Soong, W.L. Pulsating torque minimization techniques for permanent magnet AC motor drives—A review. IEEE Trans. Ind. Electron. 1996, 43, 321–330. [Google Scholar] [CrossRef]
  2. Bianchi, N.; Bolognani, S. Design techniques for reducing the cogging torque in surface-mounted PM motors. IEEE Trans. Ind. Appl. 2002, 38, 1259–1265. [Google Scholar] [CrossRef]
  3. Zhu, Z.; Howe, D. Influence of design parameters on cogging torque in permanent magnet machines. IEEE Trans. Energy Convers. 2000, 15, 407–412. [Google Scholar] [CrossRef] [Green Version]
  4. Gasparin, L.; Cernigoj, A.; Markic, S.; Fiser, R. Additional cogging torque components in permanent-magnet motors due to manufacturing imperfections. IEEE Trans. Magn. 2009, 45, 1210–1213. [Google Scholar] [CrossRef]
  5. Zarate, S.; Almandoz, G.; Ugalde, G.; Poza, J.; Escalada, A.J. Effects of manufacturing tolerances of permanent magnets in fractional slot permanent magnet synchronous machines. J. Eng. 2019, 2019, 4060–4064. [Google Scholar] [CrossRef]
  6. Gašparin, L.; Fišer, R. Cogging torque sensitivity to permanent magnet tolerance combinations. Arch. Electr. Eng. 2013, 62, 449–461. [Google Scholar] [CrossRef]
  7. Ou, J.; Liu, Y.; Qu, R.; Doppelbauer, M. Experimental and theoretical research on cogging torque of permanent-magnet synchronous motors considering manufacturing tolerances. IEEE Trans. Ind. Electron. 2017, 65, 3772–3783. [Google Scholar] [CrossRef]
  8. Ge, X.; Zhu, Z. Sensitivity of manufacturing tolerances on cogging torque in interior permanent magnet machines with different slot/pole number combinations. IEEE Trans. Ind. Appl. 2017, 53, 3557–3567. [Google Scholar] [CrossRef]
  9. Bramerdorfer, G. Tolerance analysis for electric machine design optimization: Classification, modeling and evaluation, and example. IEEE Trans. Magn. 2019, 55, 1–9. [Google Scholar] [CrossRef]
  10. Bramerdorfer, G. Effect of the manufacturing impact on the optimal electric machine design and performance. IEEE Trans. Energy Convers. 2020, 35, 1935–1943. [Google Scholar] [CrossRef]
  11. Yang, Y.; Bianchi, N.; Zhang, C.; Zhu, X.; Liu, H.; Zhang, S. A Method for Evaluating the Worst-Case Cogging Torque Under Manufacturing Uncertainties. IEEE Trans. Energy Convers. 2020, 35, 1837–1848. [Google Scholar] [CrossRef]
  12. Lei, G.; Zhu, J.; Guo, Y.; Liu, C.; Ma, B. A review of design optimization methods for electrical machines. Energies 2017, 10, 1962. [Google Scholar] [CrossRef] [Green Version]
  13. Ma, B.; Lei, G.; Zhu, J.; Guo, Y.; Liu, C. Application-oriented robust design optimization method for batch production of permanent-magnet motors. IEEE Trans. Ind. Electron. 2017, 65, 1728–1739. [Google Scholar] [CrossRef]
  14. Lei, G.; Bramerdorfer, G.; Liu, C.; Guo, Y.; Zhu, J. Robust design optimization of electrical machines: A comparative study and space reduction strategy. IEEE Trans. Energy Convers. 2020, 36, 300–313. [Google Scholar] [CrossRef]
  15. Yang, Y.; Bianchi, N.; Bacco, G.; Zhang, S.; Zhang, C. Methods to Reduce the Computational Burden of Robust Optimization for Permanent Magnet Motors. IEEE Trans. Energy Convers. 2020, 35, 2116–2128. [Google Scholar] [CrossRef]
  16. Bramerdorfer, G.; Cavagnino, A.; Choi, S.; Lei, G.; Lowther, D.; Stipetic, S.; Sykulski, J.; Zhang, Y.; Zhu, J.G. Guest Editorial: Robust Design and Analysis of Electric Machines and Drives. IEEE Trans. Energy Convers. 2020, 35, 1995–1996. [Google Scholar] [CrossRef]
  17. Bramerdorfer, G.; Lei, G.; Cavagnino, A.; Zhang, Y.; Sykulski, J.; Lowther, D.A. More Robust and Reliable Optimized Energy Conversion Facilitated through Electric Machines, Power Electronics and Drives, and Their Control: State-of-the-Art and Trends. IEEE Trans. Energy Convers. 2020, 35, 1997–2012. [Google Scholar] [CrossRef]
  18. Pop, A.C.; Pinto, D.E.; Tüchsen, J.; Koch, M. Robustness to Large-Scale Mass Production Manufacturing Tolerances by Means of Sensitivity and Statistical Analysis for IPMSMs. IEEE Trans. Energy Convers. 2020, 35, 2201–2209. [Google Scholar] [CrossRef]
  19. Salimi, A.; Lowther, D.A. On the role of robustness in multi-objective robust optimization: Application to an IPM motor design problem. IEEE Trans. Magn. 2015, 52, 1–4. [Google Scholar] [CrossRef]
  20. Gerd, B. Robustness criteria for concurrent evaluation of the impact of tolerances in multiobjective electric machine design optimization. CES Trans. Electr. Mach. Syst. 2020, 4, 3–12. [Google Scholar]
  21. Koch, P.N.; Yang, R.J.; Gu, L. Design for six sigma through robust optimization. Struct. Multidiscip. Optim. 2004, 26, 235–248. [Google Scholar] [CrossRef]
  22. Ren, Z.; Pham, M.T.; Koh, C.S. Robust global optimization of electromagnetic devices with uncertain design parameters: Comparison of the worst case optimization methods and multiobjective optimization approach using gradient index. IEEE Trans. Magn. 2012, 49, 851–859. [Google Scholar] [CrossRef]
  23. Shi, Z.; Sun, X.; Cai, Y.; Yang, Z. Robust design optimization of a five-phase PM hub motor for fault-tolerant operation based on Taguchi method. IEEE Trans. Energy Convers. 2020, 35, 2036–2044. [Google Scholar] [CrossRef]
  24. Zhang, C.; Yang, Y.; Bramerdorfer, G.; Bianchi, N.; Zhao, J.; Qu, J.; Zhang, S. A computationally efficient surrogate model based robust optimization for permanent magnet synchronous machines. IEEE Trans. Energy Convers. 2022. [Google Scholar] [CrossRef]
  25. Shen, Y.; Shi, T.; Lu, Q.; Xia, C. Robust Design and Analysis of Asymmetric-Excited Flux Reversal PM Linear Machine for Long-Stroke Direct Drive Propulsion. IEEE Trans. Magn. 2021, 57, 1–4. [Google Scholar] [CrossRef]
  26. Wu, J.; Zhu, X.; Fan, D.; Xiang, Z.; Xu, L.; Quan, L. A Robust Optimization Design Approach for Hybrid PM Machine Considering Asymmetric Uncertainties of PMs. IEEE Trans. Magn. 2022. [Google Scholar] [CrossRef]
  27. Lei, G.; Bramerdorfer, G.; Ma, B.; Guo, Y.; Zhu, J. Robust design optimization of electrical machines: Multi-objective approach. IEEE Trans. Energy Convers. 2020, 36, 390–401. [Google Scholar] [CrossRef]
  28. Ma, B.; Lei, G.; Liu, C.; Zhu, J.; Guo, Y. Robust tolerance design optimization of a PM claw pole motor with soft magnetic composite cores. IEEE Trans. Magn. 2017, 54, 1–4. [Google Scholar] [CrossRef]
  29. Lee, S.G.; Kim, S.; Park, J.C.; Park, M.R.; Lee, T.H.; Lim, M.S. Robust Design Optimization of SPMSM for Robotic Actuator Considering Assembly Imperfection of Segmented Stator Core. IEEE Trans. Energy Convers. 2020, 35, 2076–2085. [Google Scholar] [CrossRef]
  30. Yang, Y.; Bianchi, N.; Bramerdorfer, G.; Zhang, C.; Zhang, S. Methods to Improve the Cogging Torque Robustness Under Manufacturing Tolerances for the Permanent Magnet Synchronous Machine. IEEE Trans. Energy Convers. 2021, 36, 2152–2162. [Google Scholar] [CrossRef]
  31. Hwang, S.M.; Eom, J.B.; Jung, Y.H.; Lee, D.W.; Kang, B.S. Various design techniques to reduce cogging torque by controlling energy variation in permanent magnet motors. IEEE Trans. Magn. 2001, 37, 2806–2809. [Google Scholar] [CrossRef]
Figure 1. The equivalent PM excited MMF distribution for an IPM machine. (a) The schematic diagram of the IPM rotor; (b) the equivalent F p m 2 excited by one PM within one pole-pitch; (c) The equivalent MMF along the rotor considering manufacturing uncertainties for a 12S10P machine, where G p i and α p i corresponds to the magnitude and width of the ith equivalent rectangle [11].
Energies 15 02154 g001
Figure 2. The PM uncertainties and the corresponding vector diagram for the additional 12th cogging torque. (a) The vector diagram of ideal-case; (b) the B r uncertainties on each PM, where the outward-pointing arrow indicates a positive uncertainty ( Δ B r ), and the inward-pointing arrow corresponds to the negative value ( Δ B r ); (c) the vector diagram considering the effects of uncertainties, where the blue dash line represents the reference magnitude of vectors without uncertainties.
Energies 15 02154 g002
Figure 3. The vector diagram for 18S16P configuration, (a) the ideal-case, (b) the worst-case uncertainties combinations of PM that would cause the maximum 18th and 36th additional cogging torque harmonics.
Energies 15 02154 g003
Figure 4. Geometry of the 12-slot/10-pole IPM machine considered in this paper.
Energies 15 02154 g004
Figure 5. Gaussian Distribution of Manufacturing Tolerance.
Energies 15 02154 g005
Figure 6. The cogging torque performance comparison of the initial Design A and the Robust design B, (a) the peak-to-peak cogging torque of 500 models featuring random uncertainties, (b) the probability distribution function (PDF).
Energies 15 02154 g006
Figure 7. Three different PM assembling methods from E 2 to E 4 , where the particular number of PMs and their assembling position highlighted, while the unlabelled positions would be filled in with randomly selected PMs. (a) The assembling approach E 1 , (b) the assembling approach E 2 , (c) the assembling approach E 3 .
Energies 15 02154 g007
Figure 8. Peak-to-peak Cogging torque performance under different assembling methods E 1 to E 4 .
Energies 15 02154 g008
Figure 9. The PM categorized and assembling approach. (a) PM categorised approach based on the uncertainty range, (b) the assembling method to reduce the effects of uncertainties, (c) the corresponding vector diagram for analyzing the additional 12th cogging torque.
Energies 15 02154 g009
Figure 10. The comparison of peak-to-peak cogging torque performance for different PM assembling approaches considering a single type of uncertainties. (a) Uncertainties on the PM thickness Δ t m , (b) uncertainties on the residual flux density Δ B r , (c) uncertainties on the PM width Δ w p m .
Energies 15 02154 g010
Figure 11. The uncertainties of PM assembling position.
Energies 15 02154 g011
Figure 12. The vector diagram for G ( 12 ) considering the PM position uncertainties.
Energies 15 02154 g012
Figure 13. The comparison of cogging torque performance for different assembling approach considering PM positioning uncertainties.
Energies 15 02154 g013
Figure 14. The peak-to-peak cogging torque performance with different PM assembling approaches ( E 1 to E 3 ).
Energies 15 02154 g014
Figure 15. Cogging torque performance of the three assembling approaches. (a) The peak-to-peak cogging torque, (b) the probability distribution function, (c) the cumulative distribution function.
Energies 15 02154 g015
Figure 16. Apply PM assembling approach for 18S16P configuration. (a) The vector diagram for the worst-case combinations of uncertainties, (b) the vector diagram for the proposed PM assembling approach combinations, (c) the PM categorized and assembling approach considering the 18th and 36th order of cogging torque harmonics.
Energies 15 02154 g016
Figure 17. The PM assembling approaches with the maximum and minimum 12th torque harmonics and their corresponding vector diagrams.
Energies 15 02154 g017
Figure 18. The prototype and the corresponding test bench.
Energies 15 02154 g018
Figure 19. The torque performance and back-EMF of the two prototypes.
Energies 15 02154 g019
Table 1. Performance and geometric parameters of data of a 12S10P IPM motor.
Rated torque (Nm)65Rated power (kW)30
Stator outer diameter (mm)180Stator inner diameter (mm)116.2
Airgap length (mm)1Slot opening width (mm)7
Tooth width (mm)14Slot depth (mm)28
Rotor outer diameter (mm)114.2Rotor inner diameter (mm)70
PM width (mm)24.5PM thickness (mm)4.5
Stack length (mm)150Shaft diameter (mm)70
Table 2. The considered manufacturing uncertainties and the corresponding ranges.
Δ B r Δ t m Δ w p m Δ θ p i
± 0.05 T ± 0.05 mm ± 0.1 mm ± 0.05
Table 3. Parameter comparison of the initial and optimized motor.
Variables w s o t m α c w p m
Initial Design A7.4 mm5 mm0.7124.5 mm
Robust Design B6.6 mm4.2 mm0.8529.5 mm
Table 4. The thickness error value of 10 PMs (Unit: mm).
PM1#2#3#4#5#6#7#8#9#10#
Δ t m −0.1−0.1−0.03−0.02−0.010.010.020.030.10.1
Table 5. The PMs category approach based on the uncertainties range.
PM Group G 1 G 2 G 3 G 4
PM uncertainties>1.5 σ <−1.5 σ (0, 1.5 σ ) ( 1.5 σ , 0 )
PM position P 1 P 6 P 3 , P 5 , P 7 , P 9 P 2 , P 4 , P 8 , P 10
Table 6. Motor data of the prototypes.
Rated torque (Nm)8Rated speed (rpm)1500
Stator outer diameter (mm)122Stator inner diameter (mm)60
Airgap length (mm)0.8Slot opening width (mm)4.2
Tooth width (mm)9.3Slot depth (mm)22
Rotor outer diameter (mm)58.4Rotor inner diameter (mm)30
Stack length (mm)60Shaft diameter (mm)30
PM width (mm)12.8PM thickness (mm)4
Table 7. The magnetic flux of the ten selected PMs.
PM Number1#2#3#4#5#6#7#8#9#10#
Flux value (mV) 12.59 12.62 12.65 12.66 12.6 13.01 12.97 12.96 12.97 12.99
Uncertainty typeNegNegNegNegNegPosPosPosPosPos
Publisher’s Note: MDPI stays neutral with regard to jurisdictional claims in published maps and institutional affiliations.

