
Exploring Greek Citizens’ Circular Thinking on Food Waste Recycling in a Circular Economy—A Survey-Based Investigation


Circular Bioeconomy and Sustainability Research Group, Department of Chemical Engineering, Engineering School, Aristotle University, Greece Un. Box 544, 54124 Thessaloniki, Greece
*
Author to whom correspondence should be addressed.
Energies 2022, 15(7), 2584; https://0-doi-org.brum.beds.ac.uk/10.3390/en15072584
Submission received: 5 March 2022
/
Revised: 26 March 2022
/
Accepted: 30 March 2022
/
Published: 1 April 2022
(This article belongs to the Special Issue The Role of Energy in the Circular Economy)
Abstract
:Food waste is one of the biggest global challenges. Thinking and acting for closed-loop cycles for energy and resources recovery is pivotal for meeting the Sustainable Development Goal 12.3 (SDG 12.3) by 2030. In this paper, the multifaceted problem of food waste and Greece’s national policy of circular economy is briefly given. Greece produces the highest annual per capita food waste output (142 kg) in Europe, indicating that the problem is rather large for the country. The solution to the problem inextricably linked to the implementation of the food waste hierarchy, was investigated through a survey integrating the possibility of energy recovery. The tailored questionnaire sent via e-mails and social media with the goal of identifying a snapshot of Greek citizens’ conceptions and practices regarding the management of their household food waste, and their familiarity with circular economy concepts. Results have shown that most respondents are aware of the problem’s existence, however, without considering it as important, according to 1565 responses gathered and analyzed using the IBM SPSS Statistics 27.0 program. Greek individuals are eager to recycle their food waste without expecting anything in return, but the majority seek recommendations on how to do it.
Keywords:
circular economy; food waste; Greece; energy recovery; questionnaire; resources recovery; survey1. Introduction
Food is defined as any item (processed, semi-processed, or raw) intended for human consumption, including drinks. Food waste is defined as elements of the food supply chain (production, retail, food service, and households) that are rejected as avoidable or unavoidable. Items that could have been consumed or food that has beyond its usage date are considered avoidable food waste, but materials that could not have been eaten under normal circumstances are considered unavoidable food waste [1].
Food waste is one of the biggest global challenges. SDG 12.3 is related to food waste and commits the global community to halve food waste generation at the consumer and retail level, while aiming to reduce food losses along the supply chain [2]. With an average household food waste per capita generation ~74 kg/year [1], 569 million tons are produced from households and in total 931 million tons of food are wasted each year [1]. A total of 33.3% of food production globally is wasted either throughout the supply chain (food loss) or after consumption [3]; at the same time, 720–811 million people in 2020 faced hunger [4]. China is the biggest food waste generator (10% of the worldwide generation), with approximately 91 million tons of annual food waste. India comes second with 69 million tons, while USA is in third place throwing out 19 million tons of food every year [1]. As far as Europe is concerned, Germany and France create 6 and 5 million tons of annual food waste, respectively [1]. The annual food waste generation in Greece reaches 1,483,996 with 142 kg food waste per capita, per year [1].
Food surpluses exacerbate societal disparities between industrialized, developing, and impoverished countries. Rich countries reject millions of tons of food that could be devoured by the rest of the globe to create social balance. Furthermore, social disparities exist between social groups in the same culture, with wealthier people consuming most of the food while weaker groups struggle to feed their family [5]. The European Parliament’s Committee on Agriculture and Rural Development indicates that 50% of edible food is rejected without reason from European households, supermarkets, restaurants, and along the length of supply chain [6]. At the same time, 79 million of people suffer from poverty and 16 million of civilians are fed from charities every day [5]. Although social differences are intensive across European countries, it is proven that feelings of life fulfillment and satisfaction are not the result of the quantity of commodities owned and consumption of goods, but the result of quality social relationships and interactions, satisfying work, and enough free time [5].
Food producers and consumers are both part of the same sophisticated economic system. The food sector is one of the most resource-intensive industries, emitting large amounts of toxic compounds and waste while requiring large amounts of water, energy, and land [5]. As the world’s population grows, consumption increases, putting more pressure on the food resources. As the amount of food waste increases, prices of products increase too [7]. The financial impact of food waste is considerably larger when you consider the environmental issues and costs it generates [5]. In 2013, Food and Agriculture Organization of the United Nations (FAO) conducted a survey on food waste footprint with the title, “Food wastage footprint: Impacts on natural resources”, where an economic analysis of various food waste types and their monetary costs was included [8].
By 2030, Sustainable Development Goal 12.3 (SDG 12.3) intends to eliminate food losses along production and supply chains, by halving per capita global food waste at the retail and consumer levels. As a result, food waste management and solutions for food waste reduction, reuse, and recycling appear to be required to address the problem of food waste, which has social, financial, and environmental consequences. Thinking on resource and energy conservation in food waste management is critical [2].
However, the most ideal solution integrates consumer choices and reduction in excessive food production that have a significant influence on producer behavior [5], for preventing food waste [6]. To avoid surplus food production and conserve natural resources and energy that are needed to produce food that will not be consumed, a better market study is required to achieve a balance between food production and consumption [9]. If food surplus is not appropriate for human consumption, the second most preferable option is the food reuse for animal feed, following European Union’s protocols [9,10,11]. If food reuse is not possible, further options are food waste recycling and recovery of nutrients and energy [6]. Examples of this management way are the revalorization of by-products from food processing and the conversion of food waste into added-value products by processes that keep the high value of the molecule bonds of the materials [6,9]. Apparently, the least preferable option is the disposal of food waste in landfills their incineration without energy recovery [6].
Food waste management requires public and private investments, as well as new technology breakthroughs [9]. It is also vital to improve communication among all stakeholders in the food supply chain and to maintain a balance between production, supply, and demand [9]. Farmers must share their ideas, gain a better understanding of market demand, and avoid wasting natural resources [8].
Consumers must stop the overconsumption [12]. The overconsumption habits are related to an intense consumers’ willingness to provide their families a food surplus [13,14]. Furthermore, food waste is increasing because of behaviors’ confusion about leftovers’ duration and food expiration date labels, as many consumers seem to be afraid of their health while consuming leftovers [15,16,17].
Food waste reduction may provide numerous benefits to the global society, including improved food safety, cost savings, aiding in the management of climate change, and lowering pressures on soil, water, biodiversity, and waste management systems because of excessive food production. Since significant resources are required for food production, transportation, storage, and distribution, food waste is a valuable resource with economic, environmental, and social implications in combating global hunger [1].
Food waste is a large issue globally. Greece is lacking behind in tackling food waste; although, many actions are now being taken in terms of raising awareness and legislation setting. A food waste debate has recently started in Greece, due to the development of the Circular Economy strategy. There are some fragmented efforts for the reduction in some types of food waste, but the problem remains unsolved. Households’ food waste is still thrown in landfills; although, studies on food prevention in Greece have already been reported for a decade. Greece wastes almost double the amount of food compared to the world’s average and comes first in Europe in terms of food waste according to the ‘Food Waste Index Report 2021′ of United Nations Environmental program (UNEP), which reported the levels of food waste in 2021 around the world, aiming at supporting the goals of SDG 12.3. According to the report, Greek citizens waste on average 142 kg of food every year, compared to 74 kg, which is the global average [1].
Due to dietary preferences of Greek people large quantities of food are wasted, especially vegetables and fruits, which are a type of food waste that is most difficult to manage. Furthermore, the consumption attitudes of Greek households are an important factor in food waste challenge. In 2012, attitudes and behavior of Greek households regarding food waste prevention had already been assessed and reported by Greek researchers [18]. In 2014, the same research team studied food waste prevention in Athens, focusing on the effect of family characteristics [18]. In 2016, implications of food waste generation on climate change were reported with an estimation of GHG burden from food losses in Greece. Food waste generated by Greek households measured at 98.9 kg/inh./y, with a total emissions of 5672.5 Gg of CO2 eq [19].
Toward food waste solutions, the first step is recognizing the issue, while the second step is how we respond to it. These responses can include better information and awareness, a change in consumer’s behavior and an increase in the involvement of various governmental and non-governmental organizations regarding the solutions to be integrated in the strategy of Circular Economy (CE). Recently reported results from a study on the determinants of Greek households’ food waste prevention behavior advocated that formal and informal environmental education can positively influence food waste prevention behavior through a combination of experiential actions and instruction [20].
To advance the applicability of Circular Economy concepts, the effective conservation of natural resources, strengthening of the social fabric, and the creation of new value chains are required. A report summarizing the findings of a technical assistance pilot project commissioned by the European Bank for Reconstruction and Development (EBRD), identified policies, regulatory actions, and voluntary market practices with a major positive impact on food loss and waste (FLW) prevention, and provided guidelines for Greece, focusing on the role of retailers and food manufacturers in tackling this issue [21].
Since 2011, a Greek sharing economy initiative was created under the name ‘BOROUME (we can)’ concept facilitating the donation of leftover food and the distribution to the needy. BOROUME concept is a response to food waste meeting the nutritional needs of many of citizens by new technologies and methods of linking donors with the organizations that serve the needy. In September 2020, a group of public authorities, well-known companies, food service businesses of the whole supply chain, social impact organizations, and academic and research institutions, signed the first “Alliance for the Reduction of Food Waste” under the auspices of the Hellenic Ministry of Environment and Energy, incorporating EU Directive 2018/851 to Greek legislation, aiming to develop synergies at all stages of the supply chain. It also aims at raising awareness, educating the public on food waste prevention, disseminating best practices, exchanging knowledge and ideas, promoting research and innovation, and donating any surplus food. In March 2021, a first report on food waste prevention and reduction best practices was submitted to the Alliance, which was the outcome of a national effort coordinated by the non-governmental organization (NGO) ‘Boroume’ operating under the auspices of the Hellenic Ministry of Environment and Energy [22]. In 2022, an implemented project (the A2UFood project) designed a holistic scheme for the management of food loss and waste in Greece, covering all aspects of the ‘reduce–reuse–recycle’ philosophy. A training kit was created including a short theoretical background and nine sets of participatory activities, based on the Education for Sustainable Development framework and the Sustainable Development Goals [23].
Although there are studies on attitudes toward food waste avoidance in Greece, no studies on food waste recycling by kind of food waste were found. As a result, the goal of this study was to conduct a survey (through a questionnaire) to examine Greek citizens with a university education’s attitudes toward using food waste as a resource in the CE approach, and to offer food waste valorization strategies based on waste type. The purpose was to learn more about Greek citizens’ attitudes about food as a resource and society’s preparation for the country’s CE transition.
1.1. Food Waste Management Hierarchy
European Union (EU) has classified food waste management approaches in the following order: prevention, re-use, recycling, energy recovery, and disposal [6].
1.1.1. Prevention
Prevention is the most effective way to reduce food waste [24]. FAO’s main purpose is to improve the efficiency of food growing, harvesting, storage, production, and transportation systems. Food losses and storage deterioration due to hot weather can be reduced by developing innovative procedures and purchasing contemporary equipment at every stage of the supply chain [9].
Measures to prevent and reduce food waste seem to be the most effective practice for reducing greenhouse gases and managing climate change, as the smaller food production entails saving large amounts of energy and water [25]. Some measures that could contribute to the reduction in food waste are [26]:
- Supply of fresh products from the retail sector to consumers, so that the consumers do not buy foods that have been produced many days ago.
- The creation of food sharing points (food banks), where consumers will be able to donate food that is close to its expiration date and buy it at preferential prices by people in need.
- Improvement of food packaging, as some types of packaging reduce food waste.
- Design of greater control during the production process of food.
- Education and information of consumers about the food they buy and the options they have for their storage.
Legislation should be adopted, ranging from broad policy frameworks to statements of intent, proposals, and guidance. Furthermore, packaging sector steps should be implemented to transition to more green and sustainable packaging to prevent the cost of the existing environmental footprint of food waste [9].
It is suggested that producers should extensively inform consumers about the exact duration of their products with more concrete labels and directions about the consumption after cooking according to [17,27].
Household food waste can be reduced by emphasizing promotion and marketing into food waste prevention and its positive repercussions for the entire society. Thus, actions that aim to inform people about food waste problem consequences for the economy, society, and environment are required to motivate people to reduce their food waste [17]. In addition, to the previous problems, consumers are afraid to eat products with this label when the product is close to expiration date [28].
1.1.2. Food Waste Reuse
Although many food retailers and manufacturers believe that the easiest and cheapest way to handle their waste is to dump it in landfills, thinking a linear economy, when food waste prevention is impossible, reuse and redistribution of surplus food is the greatest alternative. A better alternative for food experts is to sell or donate ready-to-expire food products at a low cost to help the poor, reduce food waste, and maintain social balance [9].
Social entrepreneurship is another important factor for the achievement of food waste reuse [9]. Charities and redistribution organizations are the food reuse leaders, and they are considered as legally food entrepreneurships, to ensure the quality safety of food surplus and the distribution of only safe and healthy products [10].
In 2017, EU created a guideline for member countries to manage their food surplus [10]. If food surplus is not appropriate for human consumption, it can be used for animal food as long as the animal health is protected [11]. The reuse of food waste for animal feed can solve many problems only if it is applicated correctly with priority to animal health, human health, and environmental policies because microorganisms can promote toxin production during waste decomposition [29].
In any case, pre-treatment of food waste is necessary before animal feed because many pollutants, such as mycotoxins, tannins, heavy metals, and glass or plastic traces have been found in food waste composition [30]. There are many pre-treatment methods, such as thermal sterilization, thermal sterilization combined with up to 90% drying, enzymatic hydrolysis, and ensiling treatment [31]. However, these processes are energy intensive. Thus, physicochemical and thermochemical processes with low energy demand are preferred in Europe [29]. Examples of these processes are treatment with protein hydrogels and with fibers with probiotic and antioxidant properties [29]. Reuse of food waste can drastically limit their environmental impact, by decreasing GHGs emissions [32].
1.1.3. Food Waste Recycling to Produce Energy
Food waste recycling to produce energy is the third proposed management option after prevention and reuse. Anaerobic digestion (AD) is mostly used because it produces a high-quality biogas that is more environmentally friendly than composting and, apparently, landfill disposal [9]. AD consists of four stages: (a) hydrolysis of food waste’s organic matter to produce fatty acids and amino acids; (b) acidogenesis to produce volatile fatty acids (VFAs); (c) VFAs’ acetogenesis to produce acidic salts, H2, and CO2; and (d) methanogenesis to produce biogas with 50–75% CH4, while there are also CO2, H2S, H2O, and other gas traces [33,34]. Microorganisms and bacteria are used to decompose food waste to biogas and into a solid product, called biochar, which is used as fertilizer [33].
1.1.4. Food Waste in the Circular Economy
The circular economy (CE) is a green development model that tries to produce items with fewer and more sustainable resources, with the goal of limiting waste both during the manufacturing process and beyond the product’s lifetime [35]. The linear economy model, which is still used by modern countries, is based on the “Supply–Production–Waste” pattern. This paradigm is no longer viable because it relies on fossil fuels and non-renewable energy [36]. The global community is moving to a more sustainable model due to environmental GHG emissions and the harm that linear economies give to biodiversity and water demand. The new circular economy model favors sustainable development by following the pattern, “Production–Consuming–Recycling” [35,36].
In 2015, EU created a single plan for the transition to CE with 54 actions, which were completed in 2019; although, some of them are continued until today [37]. In March 2020, the EU adopted, despite the outbreak of the COVID-19 pandemic, the new operational plan for the CE, which is one of the main pillars of the European Green Deal (EGD), [38]. The new business plan aims to consolidate the CE in fields with high resource demand and high circularity potential, such as electronics, batteries, vehicles, plastics, and food [38,39].
The EU’s initiatives on the circular economy thus far demonstrate the economic impact that this model of sustainable development can have in Europe. In Europe, recycled materials account for only 12% of the market, demonstrating that there is still a lot of room to expand the usage of recycled items [40].
Therefore, many countries try to transit to a circular economy because of its multiple benefits for society. Businesses may extend the lifespan of their products by moving toward a circular economy, which allows them to compete on the market with products and services that last much longer [41]. The transition to a CE, on the other hand, necessitates the participation of producers and consumers in the proper execution of the proposed circular economy initiatives [35]. Coordinated cooperation across the supply chain will lessen the financial burden on businesses and customers, as well as waste generation and environmental implications [38].
During the recycling process, a product that has been used is decomposed into raw materials, which are recovered and reused to produce new products [12]. In the CE, the design of a product is based on its subsequent reconstruction to be used as a new one, in order to stop the reckless use of the planet’s resources and the destruction of the biosphere due to environmental pollution and climate change [41].
1.2. Food Sector’s Environmental Challenges
Food waste is the third biggest source of GHGs emissions worldwide [1], with a total GHGs emissions estimated to 3.3 Gtn CO2-eq, which is more than two times higher than GHGs emissions of all USA transportation vehicles for 2010 (1.5 Gtn CO2-eq), [8]. CO2, CH4, and N2O are mainly responsible for global warming, and they are referred as CO2-eq [42]. Especially CH4 and N2O have a huge carbon footprint and they seem to be 25 and 298 times more harmful for global warming than CO2 [8].
Disposal of food waste in landfills is responsible for 7% of total GHGs emissions worldwide. Moreover, the transportation of waste to dumps requires big vehicles, which consume high amounts of fuel and as a result produce high emissions by exhaust gases [5].
Vegetables represent the 23% of total cost following by meat, fruits, and cereals with 21%, 19%, and 18%, respectively [8]. Meat contribution is that high due to the high production cost per kilo. Thus, meat waste is responsible only for 4% of total waste, but it represents almost 20% of total cost. As far as cereals are concerned, their contribution is due to the high amount of cereal waste [8]. As far as meat waste is concerned, there should be a distinction between monogastric animals and ruminants. More specifically, feed for monogastric animals is the main contributor to GHGs emissions due to methane production followed by manure management. Another important factor for GHGs emissions from meat waste is the high concentration of N2O in the soil. Regarding ruminants, enteric fermentation processes during feed digestion cause high amounts of CH4 emissions [8].
Cereals have the biggest carbon footprint with a percent of 34%, following by meat and vegetables, both with 21%. The use of nitrogen fertilizers during cereals production is the main cause of cereals’ impact on climate change. Furthermore, the use of diesel for agricultural operations, such as ploughing, harvesting, and drying causes even more GHGs emissions. The cultivation of many vegetables into greenhouses is responsible for vegetables’ impact on global warming; although, the size of vegetables’ footprint depends on the heat transfer method used in the greenhouse [8].
Agricultural activities for food product production are responsible for 92% of human water use [8]. The water footprint is defined as the total volume of fresh water that is required directly or indirectly for a food product. Fresh water is divided into blue, green, and grey water. Blue water is defined as the consumptive use of irrigation water taken from ground or surface water [8]. Green water is rainwater, which is used directly for agricultural activities. Grey water is defined as a theoretical volume of water that is required to dilute pollutants. Thus, the impact of green and grey water on the total water footprint is insignificant [8,43].
The blue water footprint for agricultural production was 250 km3 in 2007 [8]. Moreover, the water footprint per capita only for food production was 21 m3 in 2012 [44]. Consequently, food industry has a huge impact on water stock as the production of 1 kg of rice requires 1500 L of water, potato production requires 500 L water/kg potatoes, 1 L of milk requires 1000 L of water and the production of only one burger demands 16,000 L of water [45]. On average, the water footprint of animal products is larger than agricultural products’ footprint. More specifically, beef has larger water footprint than chicken and pork. However, cows consume food that is not appropriate for human consumption, while chickens’ and pigs’ feed is mainly high-quality food that can be eaten by humans, too [46]. As far as the agricultural products concern, crops with high yield of biomass (starchy roots, fruits, or vegetables) usually have smaller water footprint related to agricultural products with lower biomass yields (cereals, oil crops) [8].
Food waste has a significant impact on land use, too. Land use/occupation is defined as the surface of land, including cropland and grassland, necessary to produce foodstuffs. More specifically, it evaluates the surfaces occupied by food produced but uneaten because of wastage [8]. Land is considered as a limited natural resource, which is used for constructions and agricultural activities. FAO’s study showed that food wastage occupied 1.4 billion hectares of land in 2007. This number represents the 28% of the world’s agricultural land area [8]. Notably, meat and milk wastes are responsible for 10% of total land use, while 4–15% of land occupation is used for growing uneaten cereals. The contribution of each food waste to total land use is different from country by country. Moreover, although many starchy roots and vegetables are discarded as wastes, the respective land occupation is low mostly due to their efficient growing process [8].
Furthermore, food industry has an impact on biodiversity loss due to overproduction Agricultural activities are responsible for 66% of existed threats to species [8]. The daily average per capita GHGs emissions (gCO2-eq), Water footprint, Land use (m2), Nitrogen use (gN), and Phosphorus use (gP) and the results were estimated 124 (6.6%), 58 (7.1%), 0.36 (7.3%), 2.90 (11%), and 0.48 (7.5%), respectively [44].
2. Materials and Methods
Bibliographic research was conducted to reveal the appropriate research questions, which are included in the questionnaire (see Appendix A).
2.1. Sampling Research
One of the most widespread methods of research is sample research. Sampling is the technique of selecting a part of the population, while the sample is defined as the subset of the population, which is representative and sufficient to constitute a miniature of the actual population [47]. Sampling techniques are divided into two categories: probability sampling or representative sampling and non-probability sampling or crisis sampling [48]. The sampling with probability is done according to the laws of probability, its parameters are controlled and enables the generalization of the conclusions drawn from a sample, so it also gives the possibility to calculate the estimation error. Sampling without probability is done in cases where sampling with a probability is not feasible or when it is necessary to make a rapid application of the research, for example, in a pilot study. The results of a survey that has been done by sampling without probability are not generalizable and the estimation error cannot be calculated. Therefore, its use is limited, and it should be used carefully [47].
The main sampling methods with a known probability of selection are [48]:
- Random sampling;
- Systematic sampling;
- Group sampling;
- Stratified sampling.
2.2. Setting and Population
The research method used, was the simple random sampling. A questionnaire was sent by e-mail to members of the university community of the Aristotle University of Thessaloniki, while it was also published on social media such as Facebook (Facebook Inc. created by Mark Zuckerberg on 4 February 2004, member of Harvard University), LinkedIn (LinkedIn began by Reid Hoffman in 2002 and was officially launched on 5 May 2003), resulting in the collection of 1565 responses. The sample was random and considered as representative of the population. The questionnaire was open for answering from 3 June 2021 to 13 June 2021. The aim was to collect as many responses as possible because the problem of household food waste concerns all citizens regardless of their social profile.
Several educational questions were included in the questionnaire to determine the level of knowledge consumers have received on food waste management and whether the public is willing to be enlightened on this topic.
2.3. Sampling and Data Collection
People who volunteered to participate in the study have completed the questionnaire of the survey. The participants gave their consent to participate in the study by completing the survey. They were asked to provide some demographic data (gender, age, employment, residence, and living with others).
2.4. Variables and Measurement
The questionnaire includes 24 questions, 5 of which are demographic and concerned gender, age, employment, residence, and living or not with other people for each respondent (see Appendix A).
Questions 6–10 are educational aiming to aware and inform the participants about the CE thinking and recycling, as well as to define their knowledge and conceptions about the food waste problem. Questions 11–17 are related to the consumption habits of the participants and from them the most important information of the survey is obtained. Specifically, respondents are asked to answer where do they go for food shopping and whether the food market meets their consumer needs, how many kilos of food waste they produce on average per day, and what percentage of total household waste is occupied by food waste. Moreover, research was carried out on the method used by citizens for the disposal of their food waste.
The most important questions in the questionnaire are questions 16 and 17. These questions give information about the most often discarded household food waste in Greece, and conclusions are drawn about the raw materials available to create a biorefinery. Particularly, through question 16, the respondents are first asked to choose the category/type/commodity of food that is most often discarded from their household (e.g., Fruits/Vegetables, Bread, or Cereals), and then in question 17, they make their answer more specific, by writing which specific food belongs to the category of question 16; it being their most common food waste. More specifically, and for the sake of reliability of the results of the questionnaire, if a participant chooses, for example, “Dairy products” in question 16, it is expected in question 17 to add that the most common food waste that results from his home is, e.g., milk, yogurt, or cheese. It was found that all participants’ responses met this condition.
As far as the questions 18–24 of the questionnaire concern, they give information about the willingness of the participants to recycle their household food waste if specific incentives are given or not by their municipality, their thinking about the creation of a biorefinery in their area, and about their willingness to attend an informative seminar on the food waste management. Furthermore, the participants’ view on whether the collection of food waste by the long-term unemployed or former prisoners can favor the whole society is investigated. Finally, the investigation of the view of the participants on the reduction in food waste and its impact on sustainable development is important. as Additionally, questions 23 and 24 investigate the willingness of participants to be informed, and if they want information, and from where, about household food waste reduction.
2.5. Statistical Analysis
The responses of the participants were analyzed using the statistical software program IBM SPSS version 27.0. (Statistical Package for Social Sciences released on 16 June 2020, by the International Business Machines Corporation (IBM), Armonk, New York, NY, USA). The results obtained are presented in graphs, while the answers were correlated based on gender, age, employment, the residence of the respondents and their living with other people or not. Specifically, the data were evaluated based on the p-value, which is calculated with the SPSS program; if the p-value is less than 0.05 (p < 0.05), then the question is statistically significant [49]. When there is a normal distribution in statistical analysis, as is the case in this survey, the correlation Pearson with a materiality level of 0.05 shall be used. The p-value, then, is an indicator of the reliability of the survey and whether the question corresponds to reality. In this research, a correlation test was performed between dependent and independent variables in order to investigate the relationship that exists between them [50].
2.6. Limitations
The questions addressed to Greek citizens, as the questionnaire was shared both on social media and to the emails of the members of the university community of the Aristotle University of Thessaloniki.
The respondents were 1565. The sample was considered representative of the Greek population, as the participants came from both sexes (although women were significantly more), from various age groups, and from all spectrums of the social context. As far as the sample size is concerned, this meets the criterion required for the statistical analysis to be correct. According to this criterion, the number of respondents to the survey should be equal to ten times the variables present in the questionnaire [51]. In this survey, there are 24 variables, as many as the questions of the questionnaire. Therefore, the minimum participation should have been 24·10 = 240. Hence, the actual sample size is 6.5 times more than the minimum number of participants prescribed in literature. Thus, the validity and stability of the results is extremely satisfactory, so the final conclusions are extremely reliable.
3. Results
3.1. Correlation of the Questions with the Independent Variables
The variables present in this research are:
- Demographic (independent): gender, age, employment, residence, living with other people (1–5).
- Educational (dependent): questions about the participants’ knowledge and awareness of concepts such as circular economy and recycling, as well as about the household food waste management (6–10).
- Quantitative, qualitative, consumer (dependent): questions about the consumption habits of the participants to investigate the amount of food discarded by each household, the type of food that is most often discarded, and the origin of the food (11–17).
- Informative (dependent): questions on the willing of citizens to be informed about the problem of food waste management and to seek advice on how to reduce their waste and its environmental footprint (18–24).
For the above variables, a correlation is made based on the p-value. Specifically, for questions 6–24 (dependent variables), the p-value is calculated as a function of the independent variables 1–5. The p-values calculated based on the SPSS program are shown in Table 1. When performing a statistical test, the calculation of the p value helps determine the significance of the results in relation to the null hypothesis. The zero hypothesis shows that there is no relationship between the two variables studied, i.e., one variable does not affect the other. In cases where the correlation type is statistically significant (p < 0.05), there is a sign ** next to the values. In cases where p > 0.05, the question is classified as non-statistically significant [49]. Table 1 indicates the number and percentage of questions that are statistically significant for each variable separately.
p-value has been calculated to determine the statistically significant variables of the survey. The data comparison has been done through graph creation to conclude what Greek citizens think about the food waste problem. Only 42 of a total of 95 questions were statistically significant (44.2% of all questions). For demographic variables, no p-value is calculated, as they constitute the independent variables of statistical analysis. The 42 questions, therefore, which had p < 0.05 are the statistically significant questions of the survey, which will be used for commenting and drawing useful conclusions.
3.2. Demographic Variables
The demographic data of the participants are presented in Table 2, which shows that79.3% of the participants were women (1241 women), 20.3% were men (318 men), while 0.4% (6 people) mentioned that they are belonged to another sexual group. The gender of the participants did not influence their responses, as the topic of food rejection concerns everybody and applies to all individuals who make up a community.
As far as the age range of the participants concerns, it is worth noting that in the questionnaire there were answers from all age groups. Specifically, the percentages of responses from people aged 18 to 55 years were relatively equal, while only 2.2% of responses came from people older than 55 years of age.
The employment of the participants was requested, to outline the social profile of each respondent. Most of the responses came from 45.7% of university-educated officers, followed by 22.7% of undergraduate students.
Regarding the residence of the survey participants, their place of residence was investigated, to obtain an insight into the place where the largest volume of food waste accumulates. We can see that 75.6% of respondents live in a city or urban center, followed by residents of villages and islands with percentages of 11.2% and 13.2%, respectively.
Furthermore, most survey participants live with one or more person. This percentage amounts to 55.1%, followed by those who live alone, at a rate of 16.9%.
The data obtained from the participants’ responses to demographic variables are illustrated in Table 2.
3.3. Variables Related to Consumer Sensitivity and Information
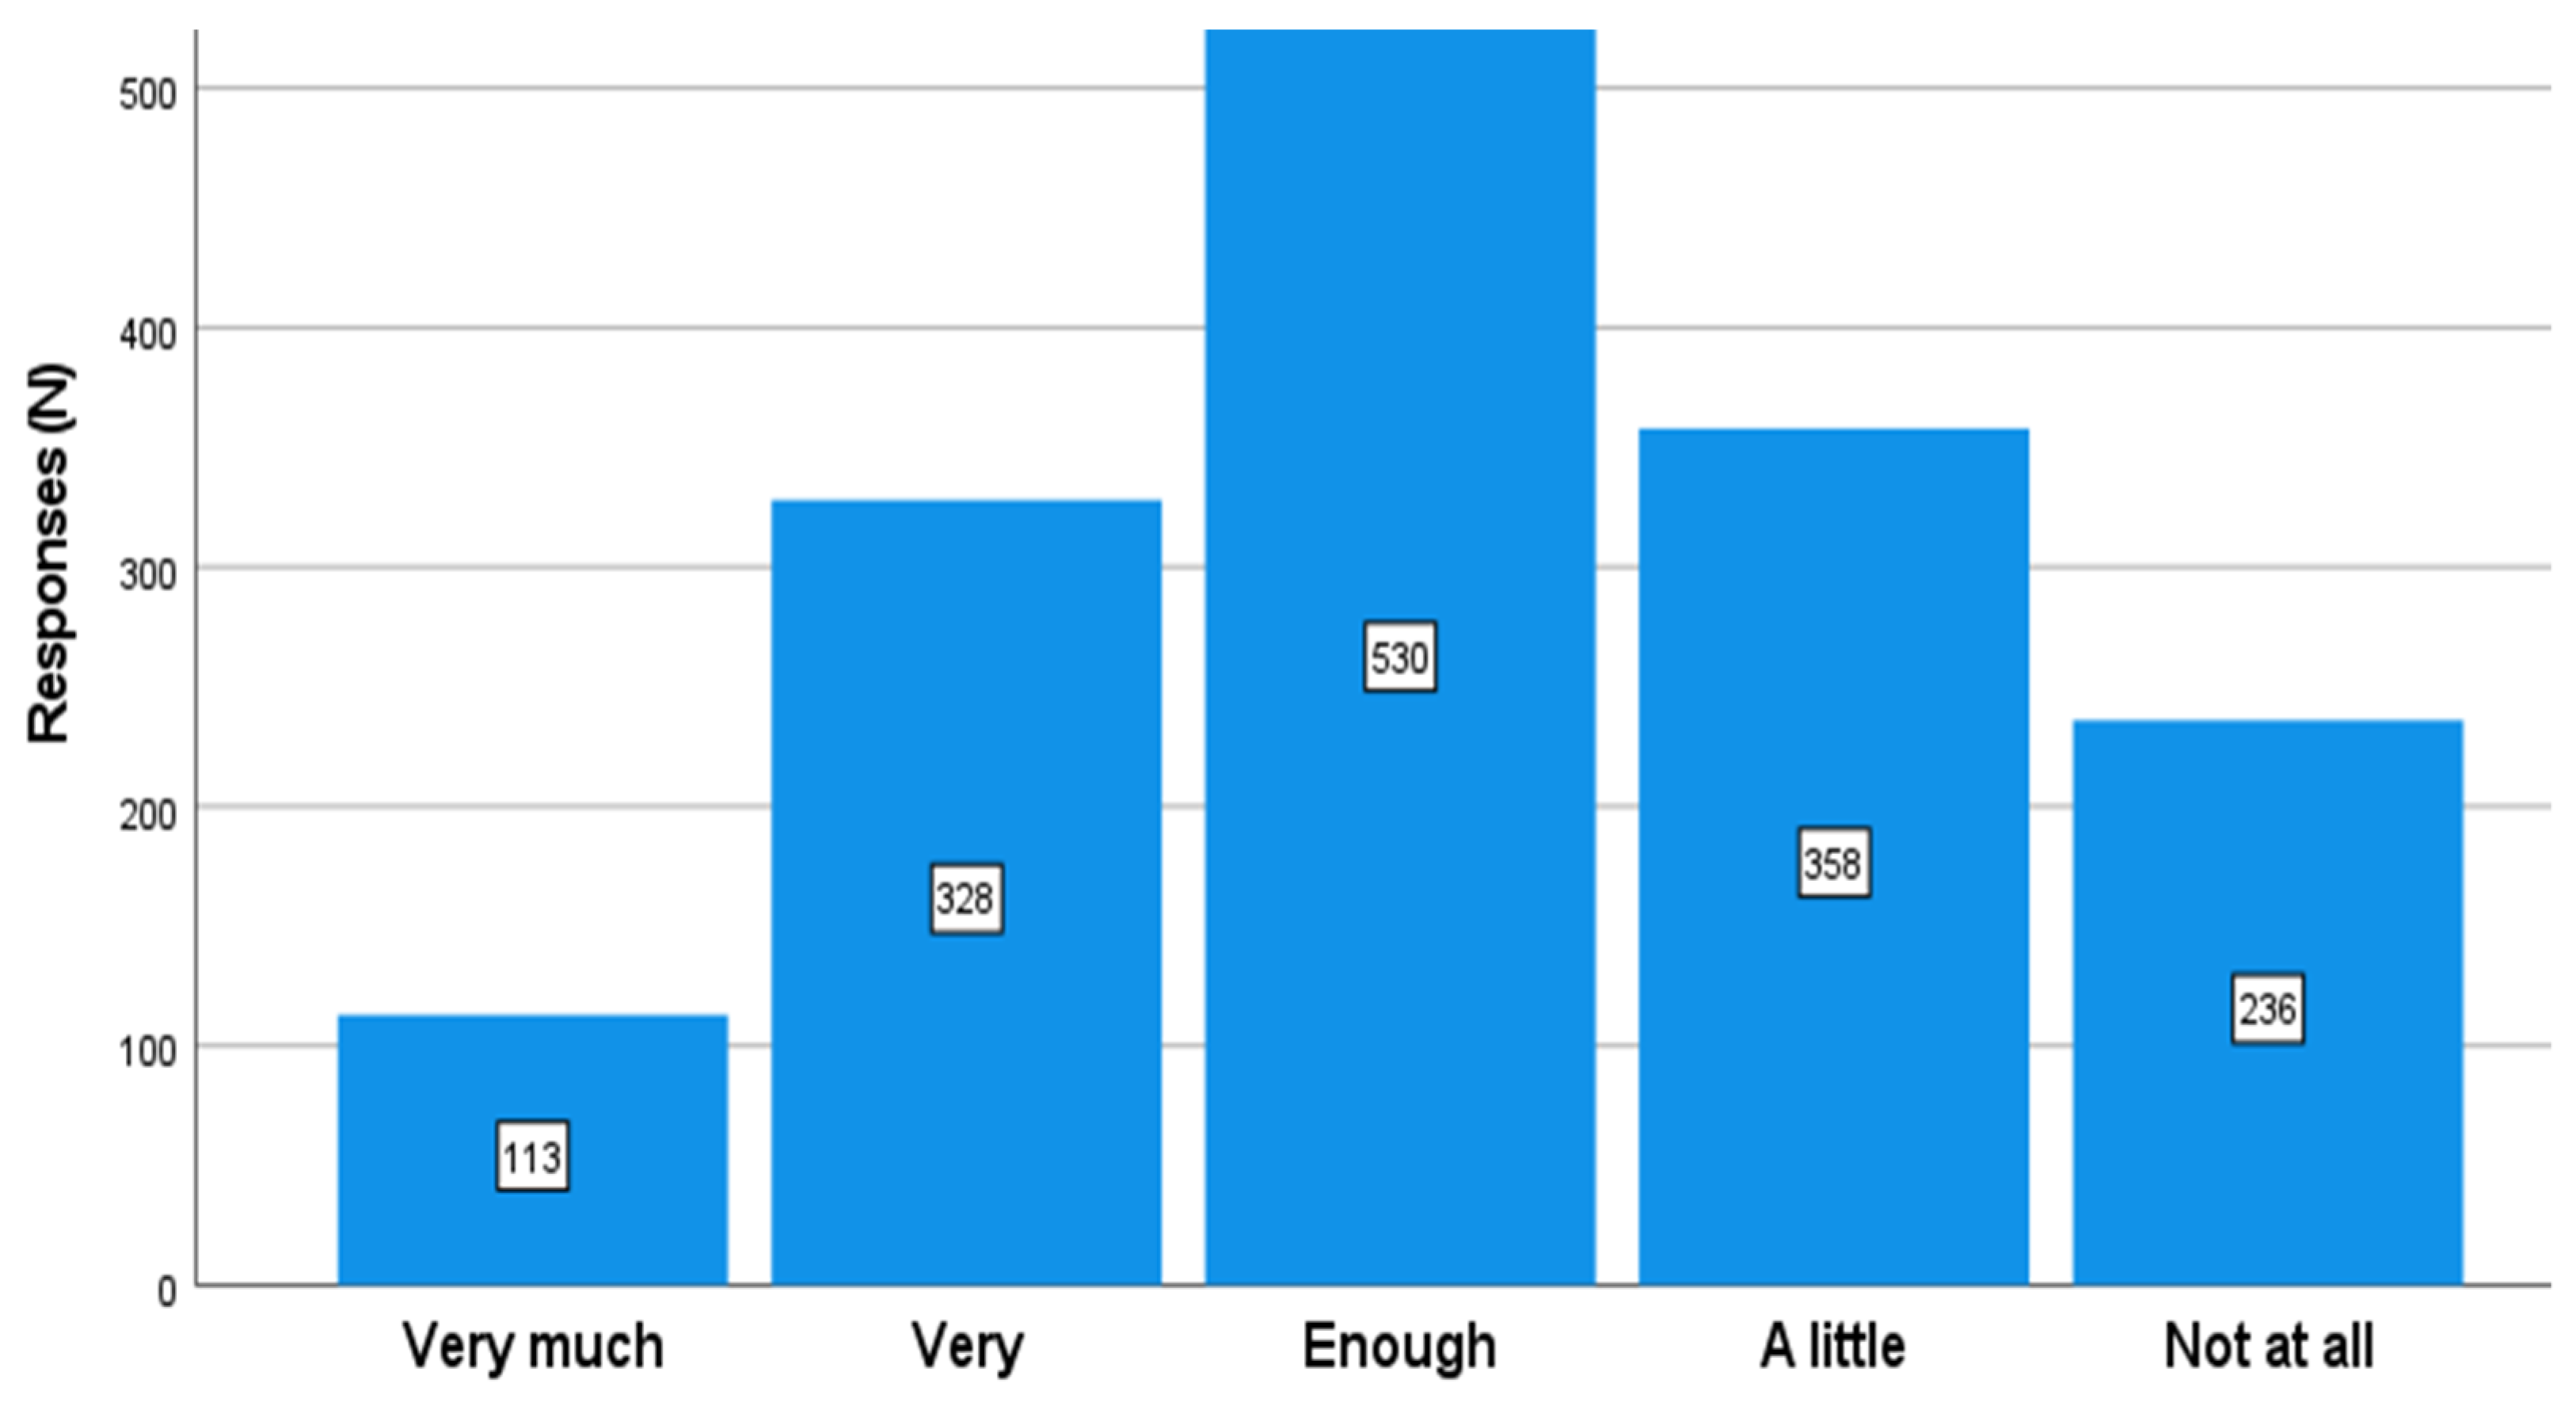
After demographic questions, participants are asked to answer some educational questions related to their sensitivity and information. The results obtained show an increased awareness of respondents to environmental protection and recycling, as 42.2% say they are well informed about these issues, as shown in the chart below (660 people). The horizontal axis of the diagram in Figure 1 quantitatively depicts consumer awareness of environmental protection and recycling. This variable takes the values, “Not at all”, “Little”, “Enough”, “Very Much”, and “Too Much”. The vertical axis shows the number of responses for each of the indications of the variable.
As far as informing the public knowledge about circular economy concerns, the educational information that participants have received seem limited in relation to the sensitivity for environmental protection, as 33.9% say that they are very informed, but 22.9% think they are little, and 15.1% are not at all informed. Although there is also 21.0% of respondents who say they are very much informed about the concept of circular economy, apparently, circular economy is a relatively new concept for the Greek public, which has not realized it in depth. On the other hand, environmental protection and recycling are concepts that seem to be more common and understood by Greek consumers. Figure 2 illustrates the public’s responses to question 7 on the circular economy.
Questions 8–10 investigated the public’s awareness for the main topic of the questionnaire, the household food waste management. Specifically, 75.08% of respondents replied “Yes, one of the most important” to question 8, “Do you think that food waste is a problem for the society?” Therefore, the Greek public’s awareness of this problem is significant, as reflected in the following Figure 3. Moreover, the statistical analysis of this question showed the big problem of the lack of solutions for the food waste management in Greek society, as citizens are aware of the problem, but there is no proper recycling infrastructure. In fact, 79.8% of the respondents consider that the food waste problem is environmental and financial, while they also consider it as a problem of resource sufficiency.
Moreover, to ascertain the awareness of the respondents about the true extent of the food waste problem, the questionnaire included question 10, “Do you know that one third of totally produced food is rejected?” The answers to this question are in line with the results of questions 8 and 9, where it was found that the public thinks that household food waste is an important and multidimensional problem for society. Particularly, 58.08% of participants are aware that 33.3% of the total food produced worldwide ends up as a waste, as shown in the chart below. However, it is noted that the percentage who said that they are not aware of this fact is 41.92%, so 656 people have not realized the real dimension of the problem. Therefore, reliable information to citizens on the true extent of the problem is imperative, so that all citizens know the impact of their food waste on the global community (Figure 4).
3.4. Quantitative, Qualitative, Consumer (Dependent) Variables
3.4.1. Consumer Variables
A total of 89.5% of the participants purchase food from supermarkets, so there is a variety to food waste composition produced from these households. In addition, 33.7% of respondents said that they buy as much food as they need to avoid throwing anything away; a fact that is also directly related to the financial crisis in Greece, which places certain restrictions on the purchases of Greek households. At the same time, 23.8% say that what is left over is put in the refrigerator for future consumption, while 21.2% cooks something else with leftovers. It is worth noting that respondents to this question refer to edible foods and not to the parts of foods that are not intended for consumption and are inevitably discarded, such as bones, seeds, and peels. Finally, 16.4% believe that they buy more food than they need, which means that they create a larger amount of food waste.
Furthermore, question 15 investigates the disposal method that Greek consumers use for their food waste. As expected, 83.7% of the participants dispose food waste in common waste bins along with the rest of the waste. The remaining 16.3% use food waste is used as fertilizer for their garden, recycled it in the few brown organic waste bins that exist only in certain municipalities of Athens, or use it as animal food. Therefore, there is a large amount of food that is rejected in landfills instead of being recycled to produce useful products and energy or reused to feed people in need (Figure 5).
3.4.2. Quantitative Variables
The questionnaire then investigates the amount of food in kg that each respondent discards per day. Question 13 is necessary to approximate the amount of raw material available for the construction of a food waste biorefinery. Specifically, 61.41% of the participants stated that every day they reject about 0.5 kg of food, 1 kg discards 25.69%, while more food waste than 1 kg is produced by 12.9% of respondents. The results of question 13 are shown in Figure 6.
Furthermore, participants were asked to estimate the percentage of food waste in the total waste produced from their household. The results showed that 82.4% of respondents consider that food waste constitutes between 0 and 40% of their total waste, as understood by the chart below in Figure 7.
3.4.3. Qualitative Variables
Questions 16 and 17 are important for the study because through them the commodity of food waste that dominates in Greek food waste composition is evaluated. The results of these questions show that there is a wide variety of foods discarded by Greek households.
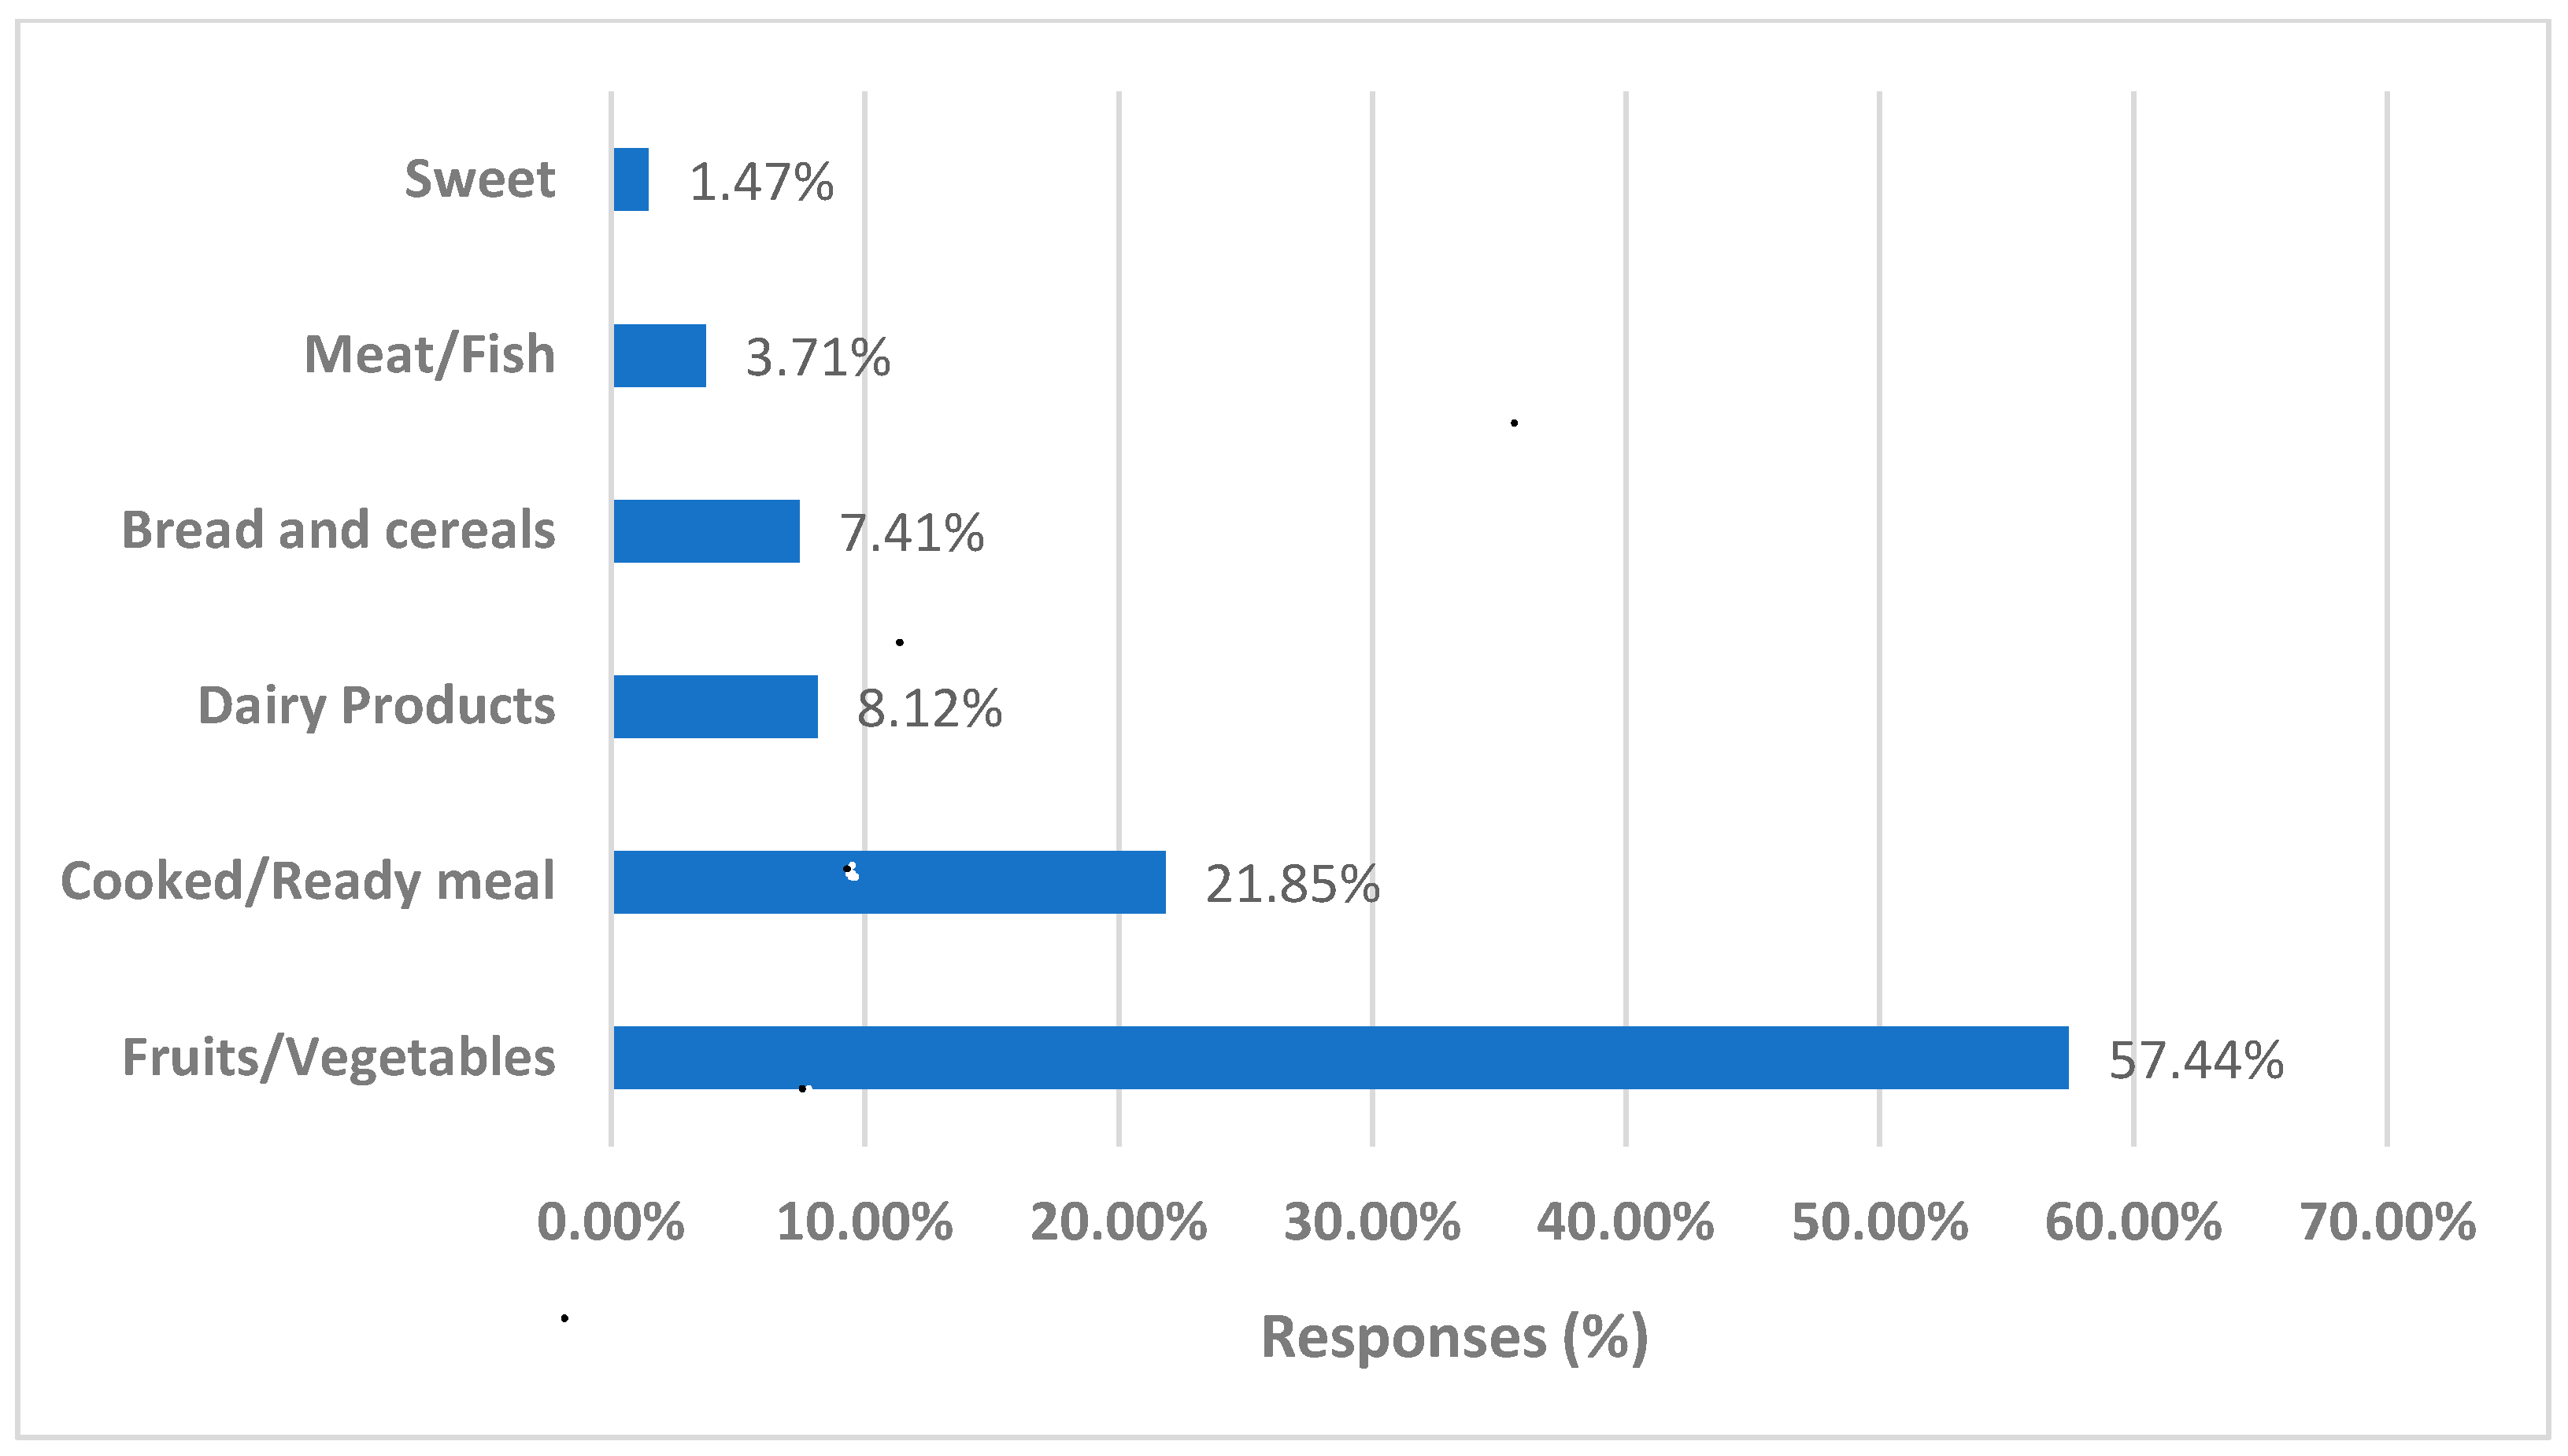
As far as the question 16 concerns, the most usual food waste commodity is “Fruits/Vegetables”, as there are 899 people who chose this option, a number that corresponds to 57.4% of the respondents. They are followed by “Cooked/Ready Meal” with 21.9%, “Dairy Products” with 8.1%, “Bread and Cereals” with 8.1%, “Meat/Fish” with 3.7%, and “Sweets” with 1.5%. Most respondents who answered “Fruits/Vegetables” maybe thinking about the peels and seeds of fruits and vegetables, as well as their short shelf life.
The results obtained from the question 16 of the respondents are considered in order to assess the overall reliability of the questionnaire, as they are compared with the answers to question 17. It was found, as mentioned above, that all participants who chose a particular food category of question 16, filled in a food from this category in question 17, so the results of the two questions converge and the questionnaire is considered reliable. Figure 8 shows the answers to question 16.
In question 17, the participants specified their answer to question 16, as they wrote which food exactly is most often discarded from their household. Table 3 summarizes the results from question 17. The first column lists the food declared by the survey participants, while the second and third columns show the number of responses and the percentage they occupy in the total of 1565 responses. The results are shown in Table 3. The most popular food waste is “Bread” with 115 answers followed by “Lettuce” and “Potatoes” with 109 and 105 answers, respectively.
The survey has shown that the most common food waste in Greece is bread. Methods for its valorization are recommended in Table 4.
Since bread is rich in starch, it is recommended that bread waste is the ideal raw material for ethanol production [52], because 354.4 g of ethanol per kg of bread waste can be produced via starch’s enzymatic hydrolysis followed by sugar fermentation (SHF process). Anaerobic Digestion (AD) of bread waste can produce 0.42 m3 biogas/kg [53] that consists of 48% methane and 52% CO2. Hydrolysis of bread waste (starch hydrolysis) can produce a high number of sugars, which can be treated via solid fermentation to produce 250 mg of lactic acid per kg of bread waste [54]. Photo-fermentation of bread waste can produce 3.1 mol H2/mol of glucose from sugars contained in bread waste. The addition of the bacterium R. palustris to the process can maximize H2 production [55].
Lettuce is the second most usual Greek food waste according to participants’ answers. Lettuce via ultrasound extraction (400 W, 24 kHz) for 120 s can produce 81 μg polyphenols/mL of lettuce waste with significant antioxidant activity [56].
Potatoes are in the third place at the list of most usual Greek food waste. Potatoes pulp and peels are significant raw materials for bioethanol and biogas production. Potatoes waste has a high starch content, so they are a useful raw material to produce bioethanol by enzymatic hydrolysis following by fermentation of produced sugars. It has been shown that 90 mL of ethanol from 800 g of potato waste was produced at pH = 6 and temperature = 30 °C [57]. Co-digestion of potato pulp waste can produce 476 mL biogas/g of total solids. Co-digestion of potato pulp waste with dairy manure can produce biochar and biogas with a 2.8 times higher yield compared to its simple digestion [58].
Cooked rice waste and cooked pasta waste are the fourth and tenth most famous answers, respectively. Both wastes can be used as compost as there are not any studies for their thermochemical process in literature. Composting is a physical process converting organic matter into a dark product and can be used for both wastes, and the product called compost can be used as soil fertilizer to increase the organic matter of the soil, closing loops [59].
Banana waste is the fifth most usual answer of the participants. Banana peels are an unavoidable food waste and the same time a perfect raw material for butanol, activated carbon, organic acids, and hydrogen production. More specifically, pre-treatment of banana peels with H2SO4 and NaOH can produce 585.2 mg/g of biomass [60], which by enzymatic hydrolysis can produce 20 g/L of sugars and the combination with the fermentation by Saccharomyces cerevisiae and Pichia sp. can produce 7.4 g/L butanol [60]. Banana peels’ high content of fructose and glucose is conducive to organic acids and hydrogen production. Banana peels’ fermentation by autochthonous bacteria (Lactobacillus και Clostridium) at neutral pH and temperature ~37 °C, produced 70.19 mL of hydrogen and significant quantities of lactic, butyric, and acetic acid [61]. Moreover, banana peels waste can also be used for activated carbon production by pyrolysis [62].
Apple waste seem to be the sixth most usual food waste in Greece. The ultrasound extraction of apple waste can lead to significant catechin production [63]. Apple waste gasification can also produce syngas [64].
Table 4 summarizes/suggests appropriate treatment methods for each food waste that was found to be the most important in Greece.

Table 4.
Recommendations for household food waste valorization.
| Food Waste | Suggested Processes | Potential Product | Reference |
|---|---|---|---|
| 1. Bread | -SHF, enzymatic hydrolysis following by fermentation (SHF) | -Ethanol | [52] |
| -Anaerobic digestion | -Biogas | [53] | |
| -SSF, solid state fermentation | -Lactic acid | [54] | |
| -Photo-fermentation | -H2 | [55] | |
| 2. Lettuce | -Ultrasound extraction | -Polyphenols with antioxidant activity | [56] |
| -Anaerobic digestion | -Biogas | [65] | |
| 3. Potatoes | -Enzymatic hydrolysis and fermentation | -Bioethanol | [57] |
| -Co-digestion with dairy manure amended with biochar | -Biogas | [58] | |
| 4. Cooked rice | -Composting | -Compost | [59] |
| 5. Banana | -Enzymatic hydrolysis combined with fermentation | -Biobutanol | [60] |
| -Fermentation with autochthonous bacteria | -Organic acids and H2 | [61] | |
| -Drying, heating, and mixing with H2SO4 | -Activated carbon | [62] | |
| 6. Apples | -Liquid ultrasound extraction | -Catechins | [63] |
| -Gasification | -Syngas | [64] | |
| 7. Lemons | -Saccharification | -Bioethanol | [66] |
| -Extraction | -Lemon peel oil | [67] | |
| 8. Oranges | -Enzymatic saccharification and fermentation | -Ethanol | [68] |
| -Two stage anaerobic digestion | -Biogas | [69] | |
| 9. Tomatoes | -Ultrasound extraction | -Pectin and polyphenols | [70] |
| -Anaerobic digestion | -Biogas | [71] |
3.4.4. Informative Variables
In the last stage of the questionnaire, there were some informative questions through which the public’s intentions regarding recycling and the reduction in household food waste were investigated.
In Question 18, “Would you recycle your food waste in organic material recycle bins?”, most participants (85.88%) answered that they would be willing to recycle their food waste and without any reward. This result is extremely positive, as it shows that if there was an efficient way by the government to recycle food waste, citizens would respond to the demands of the process. Thus, there could be a satisfactory reduction in the amount of food waste produced in Greece, and the country could retreat from the negative first in in Europe for the annual per capita production of food waste. The aggregated results from question 18 are illustrated in Figure 9.
Regarding question 19, “Would you participate in a workshop to be informed about food waste management?”, only 8.7% of the participants stated that they would not attend an informative seminar/workshop. A total of 44.0% of respondents said they would attend a seminar, while 47.3% said “Maybe”. The results from question 19 are particularly encouraging, as they demonstrate the sensitivity of the public to the food waste problem, and this show the willingness of consumers for food waste reduction. Thus, it is hoped that with a concerted effort by the state and the citizens, Greece will be able to contribute to the implementation of the European Union’s SDG 12.3 target to halve food waste by 2030.
Question 20, “Do you think that the construction of a food waste biorefinery near your household is necessary?”, investigates the intention of the consumer public regarding the creation of a food waste biorefinery to produce energy and useful value-added products. A total of 70.9% are positive to such a proposition, as they answered “Yes, of course”, 26.8% said “Maybe, but with some conditions”, while only 2.3% were negative about the creation of such a factory. In addition, any biorefinery that operates with household food waste as the raw material favors a two-way relationship between consumers, as citizens supply the plant with raw material and in return the factory provides them with energy and other useful chemicals. From the answers, it seems that the public is aware of the positive impact that such a plant can have on a community.
In the last section of the informative variables, there was an attempt to investigate the social aspect of food waste management. Particularly, the collection of food waste by socially marginalized people, such as formerly imprisoned or longtime unemployed, may favor their reintegration into society, since in this way, they will feel that they are contributing with their work to society. Thus, the questionnaire included question 21, “Do you think that food waste is a social tool to create a social entrepreneurship (i.e., many years unemployed or marginalized people collect food waste to reintegrate into society)?” The results showed that 90.0% of respondents believe that the management of food waste will benefit the whole society, so most citizens see positive social consequences in solving the problem of food waste.
Moreover, the results of question 22, “Do you think that reduction of your household food waste favors sustainable development goals and preservation of our planet?”, showed that 92.3% of the participants answered “Yes, it is one of the main pillars of sustainable development”. Therefore, question 22 also shows the sensitivity of citizens to the food waste problem and how crucial it is for the future of society and resource sufficiency.
Finally, questions 23 and 24 concern the citizens’ willingness to receive any information to reduce the amount of food waste they produce. In question 23, “Do you want advice to reduce your household food waste?”, 65.3% said they would like to, while 30.0% said “Maybe”. This sum represents 95.3% of the total responders, who were asked which entity they prefer to inform them. The 30.1% of this 95.3% answered that the most preferable information source is social entities and environmental, 22.1% mentioned government, and 20.1% would like information from social media. Therefore, it seems that the public wants information about the very important problem of food waste and suggestions to reduce it.
The reduction in food waste and the coordinated effort for its rational recycling are very important factors on the way to sustainable development and the achievement of a circular economy. Also, there is a desire of the public for multifaceted information from official and unofficial entities so that they can manage in the best possible way their household food waste. This is also reflected in the Figure 10.
4. Discussion
We employed survey action research in this work based on sampling, which is the statistical practice of randomly picking several observations from a statistical population. The goal of this form of research was to gather data to explore and understand a variety of situations. Sampling surveys have the advantage of utilizing closed-ended questions that are relatively simple for CE and Sustainability, but they have the disadvantage of not being able to fix errors in the initial design or wording of the questionnaire.
We employed random sampling in this study. This was deemed adequate because the sample size was small enough to ensure a good representation of the population in Greece because the participants were coming from various places in Greece and from every aspect of the social spectrum.
National Context
The Greek Ministry of Environment and Energy published in December 2018 the National Strategy for the CE, which is in line with the principles proposed by the EU [39]. Pillars of the National Circular Economy Strategy are:
- Sustainable Resource Management
- Enhancement of Circular Entrepreneurship.
- Circular Consumption.
By implementing the National Strategy for the Circular Economy, Greece aims by 2030 at the [39]:
- Integration of eco-design criteria and life-cycle analysis of products.
- Effective implementation of the waste management hierarchy, promoting the prevention of waste creation, and encouraging reuse and recycling.
- Creation and promotion of energy efficiency in production processes.
- Facilitate and establish appropriate channels for the exchange of information and coordination between administrations, the scientific community, and economic and social entities.
- Transition from a linear to a circular economy, promoting transparency in processes.
- Elaboration of transparent and feasible indicators for monitoring the implementation of the transition.
Following the publication of the National Strategy for the Circular Economy in 2018, the new Action Plan of Greece for the CE was published in March 2021, which is in line with the European Union’s Action Plan, adopted in March 2020 [38,72]. The five most important principles of the action plan are [72]:
- Sustainable production and industrial policy.
- Sustainable consumption.
- Less waste and more value.
- Horizontal actions for governance with legislative/regulatory nature, to implement the action plan.
- Specific actions for key products to be addressed as a matter of priority, such as electronics, vehicles, packaging, and plastics.
By 2023, a national food waste reduction objective at the retail and consumer level, as well as food losses along the manufacturing and supply chain, must be established. By 2025, Greece wants to meet the European Union’s circular economy goals [38]. However, carrying out these measures and achieving the objectives necessitates proper scientific and technological expertise, as well as the harmonic cooperation of all parties. Coordinated cooperation across the supply chain will lessen the financial burden on businesses and customers, as well as waste generation and environmental implications [72].
5. Conclusions
The goal of this study was to learn more about Greek citizens’ food waste management behaviors and how they affect the transition to the country’s CE. At the same time, the Greeks’ attitudes toward the concept of CE were assessed in general, in order to explore if Greek society is prepared to transit from a linear to a CE model that includes food waste recycling.
Because responses collected were random from people of all ages and social categories, the sample of 1565 replies are considered representative of the broader Greek population. Only 9.5% of Greeks said they are “not at all” or “very little” aware about CE and food waste recycling. Given that CE is a relatively new concept, with the European Union’s first official action plan being released in 2015, citizens must be better informed about the new economy green model that will lead to sustainable development.
In terms of food waste, 75.1% of respondents stated that this is one of the most pressing issues societies is facing, and 79.8% was aware that this is a multifaceted issue having implications to the environment and the financial sector, as well as being critical for the sustainability of the planet’s resources. However, 41.9% of those polled were unaware that one-third of all food produced worldwide is wasted, so it’s worth mentioning that people are undoubtedly aware of this. Besides the United Nations and FAO, the Greek Ministry, local governments, and universities need to communicate official figures to citizens on the actual quantity of food waste computed worldwide, motivating even more consumers to pay closer attention to the disposal of their food waste.
Most of the respondents stated that they generate an average of 0.5 kg of food waste per day, or 182.5 kg per year, with food waste accounting for up to 40% of total waste produced in Greece. These quantities could be considered as raw materials to feed a waste-to-energy unit, which will greatly benefit society and contribute to the realization of the circular economy model, after performing a sustainability assessment and a Life Cycle Assessment (LCA) study.
Greece’s position as the producer of Europe’s highest annual per capita food waste output is a matter that should concern both the state and the society. The national strategy for the circular economy, as well as the Ministry of Environment and Energy’s new action plan for the transition to a new sustainable model, needs to address the social, financial, and environmental consequences of the food waste problem more seriously and urgently. The hierarchy of food waste must be implemented, with the first goal of prevention to be reinforced, followed by re-use, and finally recycling for energy recovery.
From the side of Greek state, reliable data and information are essential for reaching food waste targets soon. Establishing an annual reporting on food waste generation to monitor and assess the implementation of the food waste prevention measures in Greece, based on a common methodology according to the Waste Framework Directive (2008/98/EC), for measuring the levels of food waste at the different stages of the food supply chain, is pivotal. This reporting could provide data and insights for food waste valorization pathways. For example, bread, fruits, and vegetables, which citizens have identified as the most frequently discarded foods, can be used as raw materials in a variety of processes to generate usable materials and energy. They contain a high organic content, so they can be seen as feedstock, for example, feeding a modern food waste biorefinery.
It is optimistic that Greek citizens are willing to respond to a well-organized scheme for the recovery of food waste, while 85.9% stated they are willing to recycle without any financial reward. Citizens are also eager for reliable information on how to reduce their food waste and for environmentally responsible methods that do not harm quality of life. Therefore, information and education are pivotal for ensuring that consumers are fully aware of the benefits that proper food waste management, in the context of the circular economy, can bring. Greeks appear to be up to the task of adapting to the circular economy model and proper food waste management. Consumers can distribute the raw material for the cycle’s closure with the help of the government, business world, and scientific community, so that food waste in Greece can be cut in half by 2030.
The findings of this study could be used for encouraging and establishing food waste reduction and recycling behavior at the citizen and household level based on environmental and social awareness because food recycling is a global policy goal and technical outcome. Although certain survey results are Greece-specific, the major issues associated with shifting from “waste as a problem” to “waste as a resource” can be generalized on a global scale. Furthermore, any global/national/regional context can benefit from the recommendations offered for recycling methods and prospective products from diverse food waste.
Author Contributions
Methodology, A.Z.; writing—original draft, K.P.; writing—review and editing, A.Z. All authors have read and agreed to the published version of the manuscript.
Funding
This research received no external funding.
Institutional Review Board Statement
Not applicable.
Informed Consent Statement
Informed consent was obtained from all subjects involved in the study.
Data Availability Statement
The authors confirm that the data supporting the findings of this study are available within the article and the Appendix A. All data related to respondents remain confidential according to the Regulation (EU) 2016/679 of the European Parliament and the Council, the European Union’s (‘EU’) new General Data Protection Regulation (‘GDPR’), regulating the processing by an individual, a company, or an organization of personal data.
Acknowledgments
The authors would like to thank all the people who replied to the questionnaire.
Conflicts of Interest
On behalf of all authors, the corresponding author declares no competing interest.
Appendix A
Table A1.
The Questionnaire.
| Questions | Possible Answers |
|---|---|
| 1. Gender |
|
| 2. Age |
|
| 3. Employment |
|
| 4. Residence |
|
| 5. Living with other people |
|
| 6. How informed do you think you are about environment protection and recycling? |
|
| 7. How informed do you think you are about circular economy? |
|
| 8. Do you think that food waste is a problem for the society? |
|
| 9. You think that food waste problem is mainly: |
|
| 10. Do you know that one third of totally produced food is rejected? |
|
| 11. Where are you going for food shopping? |
|
| 12. Which of the following represents your consumption habits? |
|
| 13. How many kilos of food waste do you think that your household produces? |
|
| 14. Which is the percent of food waste in the total amount of household waste? |
|
| 15. Which is your method to reject your food waste? |
|
| 16. Which food commodity is wasted the most from your household? |
|
| 17. Which is the most usual food waste of your household? | |
| 18. Would you recycle your food waste in organic material recycle bins? |
|
| 19. Would you participate in a workshop to be informed about food waste management? |
|
| 20. Do you think that the construction of a food waste biorefinery near your household is necessary? |
|
| 21. Do you think that food waste is a social tool to create a social entrepreneurship (i.e., many years unemployed or marginalised people collect food waste to reintegrate into society)? |
|
| 22. Do you think that reduction of your household food waste favours sustainable development goals and preservation of our planet? |
|
| 23. Do you want advice to reduce your household food waste? |
|
| 24. If yes, which information seems preferable for you? |
|
References
- United Nations Environment Programme. Food Waste Index Report 2021; United Nations Environment Programme: Nairobi, Kenya, 2021. [Google Scholar]
- Beretta, C.; Hellweg, S. Potential Environmental Benefits from Food Waste Prevention in the Food Service Sector. Resour. Conserv. Recycl. 2019, 147, 169–178. [Google Scholar] [CrossRef]
- Corrado, S.; Caldeira, C.; Eriksson, M.; Hanssen, O.J.; Hauser, H.-E.; van Holsteijn, F.; Liu, G.; Östergren, K.; Parry, A.; Secondi, L.; et al. Food Waste Accounting Methodologies: Challenges, Opportunities, and Further Advancements. Glob. Food Secur. 2019, 20, 93–100. [Google Scholar] [CrossRef] [PubMed]
- FAO. The State of Food Security and Nutrition in the World 2021. Available online: https://www.fao.org/state-of-food-security-nutrition (accessed on 15 October 2021).
- Seberini, A. Economic, Social and Environmental World Impacts of Food Waste on Society and Zero Waste as a Global Approach to Their Elimination. SHS Web Conf. 2020, 74, 03010. [Google Scholar] [CrossRef]
- European Commission Food Waste Measurement. Available online: https://ec.europa.eu/food/safety/food-waste/eu-actions-against-food-waste/food-waste-measurement_en (accessed on 16 October 2021).
- Food and Agriculture Organization of the United Nations. Moving Forward on Food Loss and Waste Reduction, 1st ed.; Food and Agriculture Organization of the United Nations: Rome, Italy, 2019; ISBN 978-92-5-131789-1. [Google Scholar]
- Food and Agriculture Organization of the United Nations. Food Wastage Footprint: Impacts on Natural Resources: Summary Report, 1st ed.; Food and Agriculture Organization of the United Nations: Rome, Italy, 2013; ISBN 978-92-5-107752-8. [Google Scholar]
- United Nations environment programme Food Waste Harms Climate, Water, Land and Biodiversity—New FAO Report. Available online: http://www.unep.org/news-and-stories/press-release/food-waste-harms-climate-water-land-and-biodiversity-new-fao-report (accessed on 25 October 2021).
- European Commission Notice—EU Guidelines on Food Donation. Available online: https://eur-lex.europa.eu/legal-content/EN/TXT/PDF/?uri=CELEX:52017XC1025(01) (accessed on 19 August 2021).
- European Commission Notice—Guidelines for the Feed Use of Food No Longer Intended for Human Consumption. Available online: https://eur-lex.europa.eu/legal-content/EN/TXT/PDF/?uri=CELEX:52018XC0416(01) (accessed on 30 August 2021).
- US Environmental Protection Agency. US EPA Reducing and Reusing Basics. Available online: https://www.epa.gov/recycle/reducing-and-reusing-basics (accessed on 8 September 2021).
- Porpino, G.; Wansink, B.; Parente, J. Wasted Positive Intentions: The Role of Affection and Abundance on Household Food Waste. J. Food Prod. Mark. 2016, 22, 733–751. [Google Scholar] [CrossRef] [Green Version]
- Visschers, V.H.M.; Wickli, N.; Siegrist, M. Sorting out Food Waste Behaviour: A Survey on the Motivators and Barriers of Self-Reported Amounts of Food Waste in Households. J. Environ. Psychol. 2016, 45, 66–78. [Google Scholar] [CrossRef]
- Farr-Wharton, G.; Foth, M.; Choi, J.H.-J. Identifying Factors That Promote Consumer Behaviours Causing Expired Domestic Food Waste: Factors Promoting Behaviours Causing Food Waste. J. Consum. Behav. 2014, 13, 393–402. [Google Scholar] [CrossRef] [Green Version]
- Waitt, G.; Phillips, C. Food Waste and Domestic Refrigeration: A Visceral and Material Approach. Soc. Cult. Geogr. 2016, 17, 359–379. [Google Scholar] [CrossRef]
- Schmidt, K.; Matthies, E. Where to Start Fighting the Food Waste Problem? Identifying Most Promising Entry Points for Intervention Programs to Reduce Household Food Waste and Overconsumption of Food. Resour. Conserv. Recycl. 2018, 139, 1–14. [Google Scholar] [CrossRef]
- Abeliotis, K.; Lasaridi, K.; Chroni, C. Attitudes and Behaviour of Greek Households Regarding Food Waste Prevention. Waste Manag. Res. J. Sustain. Circ. Econ. 2014, 32, 237–240. [Google Scholar] [CrossRef]
- Abeliotis, K.; Lasaridi, K.; Costarelli, V.; Chroni, C. The Implications of Food Waste Generation on Climate Change: The Case of Greece. Sustain. Prod. Consum. 2015, 3, 8–14. [Google Scholar] [CrossRef]
- Kritikou, T.; Panagiotakos, D.; Abeliotis, K.; Lasaridi, K. Investigating the Determinants of Greek Households Food Waste Prevention Behaviour. Sustainability 2021, 13, 11451. [Google Scholar] [CrossRef]
- Sustainable Food Retail. Available online: https://www.ebrd.com/what-we-do/sectors/legal-reform/sustainable-food-retail.html (accessed on 10 December 2021).
- Food Waste in Greece. Available online: https://www.boroume.gr/en/food-waste-in-greece (accessed on 10 December 2021).
- Ioannou, T.; Bazigou, K.; Katsigianni, A.; Fotiadis, M.; Chroni, C.; Manios, T.; Daliakopoulos, I.; Tsompanidis, C.; Michalodimitraki, E.; Lasaridi, K. The “A2UFood Training Kit”: Participatory Workshops to Minimize Food Loss and Waste. Sustainability 2022, 14, 2446. [Google Scholar] [CrossRef]
- Teigiserova, D.A.; Hamelin, L.; Thomsen, M. Towards Transparent Valorization of Food Surplus, Waste and Loss: Clarifying Definitions, Food Waste Hierarchy, and Role in the Circular Economy. Sci. Total Environ. 2020, 706, 136033. [Google Scholar] [CrossRef] [PubMed]
- de Sadeleer, I.; Brattebø, H.; Callewaert, P. Waste Prevention, Energy Recovery or Recycling—Directions for Household Food Waste Management in Light of Circular Economy Policy. Resour. Conserv. Recycl. 2020, 160, 104908. [Google Scholar] [CrossRef]
- Sehnem, S.; Pereira, S.C.F.; Godoi, D.; Pereira, L.H.; Junior, S.S. Food Waste Management: An Analysis from the Circular Economy Perspective. Environ. Qual. Manag. 2021, 31, 59–72. [Google Scholar] [CrossRef]
- Aschemann-Witzel, J.; Giménez, A.; Ares, G. Consumer In-Store Choice of Suboptimal Food to Avoid Food Waste: The Role of Food Category, Communication and Perception of Quality Dimensions. Food Qual. Prefer. 2018, 68, 29–39. [Google Scholar] [CrossRef]
- Hall-Phillips, A.; Shah, P. Unclarity Confusion and Expiration Date Labels in the United States: A Consumer Perspective. J. Retail. Consum. Serv. 2017, 35, 118–126. [Google Scholar] [CrossRef]
- Ominski, K.; McAllister, T.; Stanford, K.; Mengistu, G.; Kebebe, E.G.; Omonijo, F.; Cordeiro, M.; Legesse, G.; Wittenberg, K. Utilization of By-Products and Food Waste in Livestock Production Systems: A Canadian Perspective. Anim. Front. 2021, 11, 55–63. [Google Scholar] [CrossRef]
- Georganas, A.; Giamouri, E.; Pappas, A.C.; Papadomichelakis, G.; Galliou, F.; Manios, T.; Tsiplakou, E.; Fegeros, K.; Zervas, G. Bioactive Compounds in Food Waste: A Review on the Transformation of Food Waste to Animal Feed. Foods 2020, 9, 291. [Google Scholar] [CrossRef] [Green Version]
- Dou, Z.; Toth, J.D.; Westendorf, M.L. Food Waste for Livestock Feeding: Feasibility, Safety, and Sustainability Implications. Glob. Food Secur. 2018, 17, 154–161. [Google Scholar] [CrossRef]
- Salemdeeb, R.; zu Ermgassen, E.K.H.J.; Kim, M.H.; Balmford, A.; Al-Tabbaa, A. Environmental and Health Impacts of Using Food Waste as Animal Feed: A Comparative Analysis of Food Waste Management Options. J. Clean. Prod. 2017, 140, 871–880. [Google Scholar] [CrossRef] [PubMed] [Green Version]
- US Environmental Protection Agency, US EPA How Does Anaerobic Digestion Work? Available online: https://www.epa.gov/agstar/how-does-anaerobic-digestion-work (accessed on 3 November 2021).
- Zhang, C.; Su, H.; Baeyens, J.; Tan, T. Reviewing the Anaerobic Digestion of Food Waste for Biogas Production. Renew. Sustain. Energy Rev. 2014, 38, 383–392. [Google Scholar] [CrossRef]
- Kirchherr, J.; Reike, D.; Hekkert, M. Conceptualizing the Circular Economy: An Analysis of 114 Definitions. Resour. Conserv. Recycl. 2017, 127, 221–232. [Google Scholar] [CrossRef]
- Geissdoerfer, M.; Savaget, P.; Bocken, N.M.P.; Hultink, E.J. The Circular Economy—A New Sustainability Paradigm? J. Clean. Prod. 2017, 143, 757–768. [Google Scholar] [CrossRef] [Green Version]
- European Commission First Circular Economy Action Plan. Available online: https://ec.europa.eu/environment/topics/circular-economy/first-circular-economy-action-plan_en (accessed on 26 October 2021).
- European Union. A New Circular Economy Action Plan. Available online: https://eur-lex.europa.eu/resource.html?uri=cellar:9903b325-6388-11ea-b735-01aa75ed71a1.0017.02/DOC_1&format=PDF (accessed on 17 October 2021).
- Greek Ministry of Environment and Energy. National Greek Circular Economy Strategy. Available online: https://circulareconomy.europa.eu/platform/sites/default/files/national_circular_economy_strategy.pdf (accessed on 30 September 2021).
- European Commission Eurostat. EU Circular Material Use Rate. Available online: https://ec.europa.eu/eurostat/web/products-eurostat-news/-/ddn-20200312-1 (accessed on 21 October 2021).
- Michelini, G.; Moraes, R.N.; Cunha, R.N.; Costa, J.M.H.; Ometto, A.R. From Linear to Circular Economy: PSS Conducting the Transition. Procedia CIRP 2017, 64, 2–6. [Google Scholar] [CrossRef]
- To, S.; Coughenour, C.; Pharr, J. The Environmental Impact and Formation of Meals from the Pilot Year of a Las Vegas Convention Food Rescue Program. Int. J. Environ. Res. Public. Health 2019, 16, 1718. [Google Scholar] [CrossRef] [Green Version]
- Hoekstra, A.Y.; Mekonnen, M.M. The Water Footprint of Humanity. Proc. Natl. Acad. Sci. USA 2012, 109, 3232–3237. [Google Scholar] [CrossRef] [Green Version]
- Chen, C.; Chaudhary, A.; Mathys, A. Nutritional and Environmental Losses Embedded in Global Food Waste. Resour. Conserv. Recycl. 2020, 160, 104912. [Google Scholar] [CrossRef]
- Kibria, G. Food Waste Impacts on Climate Change and Water Resources. 2017. Available online: https://www.researchgate.net/publication/316547640_Food_Waste_Impacts_on_Climate_Change_Water_Resources (accessed on 10 December 2021).
- Mekonnen, M.M.; Gerbens-Leenes, W. The Water Footprint of Global Food Production. Water 2020, 12, 2696. [Google Scholar] [CrossRef]
- Hughes, J. SAGE Internet Research Methods; SAGE: Los Angeles, Calif, 2012; ISBN 978-1-4462-6332-7. [Google Scholar]
- Acharya, A.S.; Prakash, A.; Saxena, P.; Nigam, A. Sampling: Why and How of It? Indian J. Med. Spec. 2013, 4, 330–333. [Google Scholar] [CrossRef]
- Abu-Bader, S.H. Using Statistical Methods in Social Science Research: With a Complete Spss Guide, 3rd ed.; Oxford University Press: Oxford, UK, 2021; ISBN 978-0-19-752243-1. [Google Scholar]
- George, D.; Mallery, P. IBM SPSS Statistics 26 Step by Step: A Simple Guide and Reference, 16th ed.; Routledge: Oxfordshire, UK, 2019; ISBN 978-0-367-17435-4. [Google Scholar]
- Yuan, X.; Zuo, J.; Huisingh, D. Social Acceptance of Wind Power: A Case Study of Shandong Province, China. J. Clean. Prod. 2015, 92, 168–178. [Google Scholar] [CrossRef]
- Pietrzak, W.; Kawa-Rygielska, J. Ethanol Fermentation of Waste Bread Using Granular Starch Hydrolyzing Enzyme: Effect of Raw Material Pretreatment. Fuel 2014, 134, 250–256. [Google Scholar] [CrossRef]
- Dubrovskis, V.; Plume, I. Biogas Potential from Damaged Bread. In Proceedings of the 16th International Scientific Conference “Engineering for Rural Development”, Jelgava, Latvia, 24–26 May 2017; pp. 437–442. [Google Scholar]
- Sadaf, A.; Kumar, S.; Nain, L.; Khare, S.K. Bread Waste to Lactic Acid: Applicability of Simultaneous Saccharification and Solid-State Fermentation. Biocatal. Agric. Biotechnol. 2021, 32, 101934. [Google Scholar] [CrossRef]
- Adessi, A.; Venturi, M.; Candeliere, F.; Galli, V.; Granchi, L.; De Philippis, R. Bread Wastes to Energy: Sequential Lactic and Photo-Fermentation for Hydrogen Production. Int. J. Hydrog. Energy 2018, 43, 9569–9576. [Google Scholar] [CrossRef]
- Plazzotta, S.; Manzocco, L. Effect of Ultrasounds and High-Pressure Homogenization on the Extraction of Antioxidant Polyphenols from Lettuce Waste. Innov. Food Sci. Emerg. Technol. 2018, 50, 11–19. [Google Scholar] [CrossRef]
- Memon, A.A.; Shah, F.A.; Kumar, N. Bioethanol Production from Waste Potatoes as a Sustainable Waste-to-Energy Resource via Enzymatic Hydrolysis. IOP Conf. Ser. Earth Environ. Sci. 2017, 73, 12003. [Google Scholar] [CrossRef] [Green Version]
- Chen, M.; Liu, S.; Yuan, X.; Li, Q.X.; Wang, F.; Xin, F.; Wen, B. Methane Production and Characteristics of the Microbial Community in the Co-Digestion of Potato Pulp Waste and Dairy Manure Amended with Biochar. Renew. Energy 2021, 163, 357–367. [Google Scholar] [CrossRef]
- Waitt, G.; Rankin, K. Towards Household Sustainability? Experimenting with Composting Food Waste. Geoforum 2022, 129, 98–106. [Google Scholar] [CrossRef]
- Mishra, R.R.; Samantaray, B.; Chandra Behera, B.; Pradhan, B.R.; Mohapatra, S. Process Optimization for Conversion of Waste Banana Peels to Biobutanol by A Yeast Co-Culture Fermentation System. Renew. Energy 2020, 162, 478–488. [Google Scholar] [CrossRef]
- da Silva Mazareli, R.C.; Villa Montoya, A.C.; Delforno, T.P.; Centurion, V.B.; de Oliveira, V.M.; Silva, E.L.; Varesche, M.B.A. Enzymatic Routes to Hydrogen and Organic Acids Production from Banana Waste Fermentation by Autochthonous Bacteria: Optimization of PH and Temperature. Int. J. Hydrog. Energy 2021, 46, 8454–8468. [Google Scholar] [CrossRef]
- Sari, S.N.; Melati, A. Facile Preparation of Carbon Nanofiber from Banana Peel Waste. Mater. Today Proc. 2019, 13, 165–168. [Google Scholar] [CrossRef]
- Wang, L.; Boussetta, N.; Lebovka, N.; Vorobiev, E. Selectivity of Ultrasound-Assisted Aqueous Extraction of Valuable Compounds from Flesh and Peel of Apple Tissues. LWT 2018, 93, 511–516. [Google Scholar] [CrossRef]
- Qin, S.; Shekher Giri, B.; Kumar Patel, A.; Sar, T.; Liu, H.; Chen, H.; Juneja, A.; Kumar, D.; Zhang, Z.; Kumar Awasthi, M.; et al. Resource Recovery and Biorefinery Potential of Apple Orchard Waste in the Circular Bioeconomy. Bioresour. Technol. 2021, 321, 124496. [Google Scholar] [CrossRef]
- Plazzotta, S.; Cottes, M.; Simeoni, P.; Manzocco, L. Evaluating the Environmental and Economic Impact of Fruit and Vegetable Waste Valorisation: The Lettuce Waste Study-Case. J. Clean. Prod. 2020, 262, 121435. [Google Scholar] [CrossRef]
- Kundu, D.; Banerjee, S.; Karmakar, S.; Banerjee, R. Valorization of Citrus Lemon Wastes through Biorefinery Approach: An Industrial Symbiosis. Bioresour. Technol. Rep. 2021, 15, 100717. [Google Scholar] [CrossRef]
- Ashok, B.; Thundil Karuppa Raj, R.; Nanthagopal, K.; Krishnan, R.; Subbarao, R. Lemon Peel Oil—A Novel Renewable Alternative Energy Source for Diesel Engine. Energy Convers. Manag. 2017, 139, 110–121. [Google Scholar] [CrossRef]
- Santi, G.; Crognale, S.; D’Annibale, A.; Petruccioli, M.; Ruzzi, M.; Valentini, R.; Moresi, M. Orange Peel Pretreatment in a Novel Lab-Scale Direct Steam-Injection Apparatus for Ethanol Production. Biomass Bioenergy 2014, 61, 146–156. [Google Scholar] [CrossRef]
- Jiménez-Castro, M.P.; Buller, L.S.; Zoffreo, A.; Timko, M.T.; Forster-Carneiro, T. Two-Stage Anaerobic Digestion of Orange Peel without Pre-Treatment: Experimental Evaluation and Application to São Paulo State. J. Environ. Chem. Eng. 2020, 8, 104035. [Google Scholar] [CrossRef]
- Ninčević Grassino, A.; Ostojić, J.; Miletić, V.; Djaković, S.; Bosiljkov, T.; Zorić, Z.; Ježek, D.; Rimac Brnčić, S.; Brnčić, M. Application of High Hydrostatic Pressure and Ultrasound-Assisted Extractions as a Novel Approach for Pectin and Polyphenols Recovery from Tomato Peel Waste. Innov. Food Sci. Emerg. Technol. 2020, 64, 102424. [Google Scholar] [CrossRef]
- Boccia, F.; Di Donato, P.; Covino, D.; Poli, A. Food Waste and Bio-Economy: A Scenario for the Italian Tomato Market. J. Clean. Prod. 2019, 227, 424–433. [Google Scholar] [CrossRef]
- Circular Greece. Greek Circular Economy Action Plan. Available online: https://circulargreece.gr/ (accessed on 5 November 2021).
Figure 1.
Responses to the question, “How informed do you think you are about environment protection and recycling?”
Figure 1.
Responses to the question, “How informed do you think you are about environment protection and recycling?”

Figure 2.
Responses to the question, “How informed do you think you are about circular economy?”

Figure 3.
Responses to the question, “Do you think that food waste is a problem for the society?”

Figure 4.
Responses to the question, “Do you know that one third of totally produced food is rejected?”
Figure 4.
Responses to the question, “Do you know that one third of totally produced food is rejected?”

Figure 5.
Responses to the question, “Which is your method to reject your food waste?”

Figure 6.
Responses to the question, “How many kilos of food waste do you think that your household produces?”
Figure 6.
Responses to the question, “How many kilos of food waste do you think that your household produces?”

Figure 7.
Responses to “Which is the percent of food waste in the total amount of household waste?”

Figure 8.
Responses to “Which food commodity is wasted the most from your household?”

Figure 9.
Responses to the question, “Would you recycle your food waste in organic material recycle bins?”
Figure 9.
Responses to the question, “Would you recycle your food waste in organic material recycle bins?”

Figure 10.
Responses to the question, “If you want information about food waste reduction, which entity seems more preferable for you?”
Figure 10.
Responses to the question, “If you want information about food waste reduction, which entity seems more preferable for you?”

Table 1.
Correlation of the questionnaire questions with the independent variables, based on the p value.
Table 1.
Correlation of the questionnaire questions with the independent variables, based on the p value.
| Question | Gender | Age | Employment | Residence | Living with Others | % Statistically Significant |
|---|---|---|---|---|---|---|
| 6 | 0.094 | <0.001 ** | 0.058 | 0.159 | 0.078 | 20% (1 **/5) |
| 7 | 0.064 | <0.001 ** | 0.113 | 0.252 | 0.098 | 20% (1 **/5) |
| 8 | <0.001 ** | 0.101 | 0.201 | 0.265 | 0.094 | 20% (1 **/5) |
| 9 | <0.001 ** | 0.217 | 0.163 | 0.248 | 0.378 | 20% (1 **/5) |
| 10 | 0.037 ** | <0.001 ** | <0.001 ** | 0.268 | 0.013 ** | 80% (4 **/5) |
| 11 | 0.171 | 0.323 | 0.433 | 0.064 | 0.372 | 0% (0 **/5) |
| 12 | <0.001 ** | 0.002 ** | 0.230 | 0.484 | 0.097 | 40% (2 **/5) |
| 13 | 0.043 ** | 0.048 ** | 0.360 | 0.016 ** | <0.001 ** | 80% (4 **/5) |
| 14 | 0.115 | <0.001 ** | <0.001 ** | 0.006 ** | 0.360 | 60% (3 **/5) |
| 15 | 0.026 ** | <0.001 ** | <0.001 ** | <0.001 ** | <0.001 ** | 80% (4 **/5) |
| 16 | 0.305 | 0.351 | 0.483 | 0.346 | 0.140 | 0% (0 **/5) |
| 17 | 0.123 | <0.001 ** | 0.010 ** | 0.318 | 0.039 ** | 60% (3 **/5) |
| 18 | 0.040 ** | 0.002 ** | 0.024 ** | 0.081 | 0.001 ** | 80% (4 **/5) |
| 19 | 0.027 ** | 0.332 | 0.012 ** | 0.356 | 0.052 | 40% (2 **/5) |
| 20 | 0.006 ** | 0.064 | 0.422 | 0.268 | 0.038 ** | 40% (2 **/5) |
| 21 | 0.002 ** | 0.256 | 0.306 | 0.014 ** | 0.291 | 40% (2 **/5) |
| 22 | <0.001 ** | <0.001 ** | 0.001 ** | 0.471 | 0.024 ** | 80% (4 **/5) |
| 23 | <0.001 ** | 0.338 | 0.425 | 0.040 ** | 0.072 | 40% (2 **/5) |
| 24 | 0.005 ** | 0.044 ** | 0.096 | 0.261 | 0.406 | 40% (2 **/5) |
** p < 0.05.
Table 2.
Demographic Results.
| Gender | Age | ||||
|---|---|---|---|---|---|
| Men (%) | 20.3 | 18–22 (%) | 13.1 | 31–40 (%) | 27.9 |
| Women (%) | 79.3 | 23–26 (%) | 23.2 | 41–55 (%) | 19.0 |
| Other (%) | 0.4 | 27–30 (%) | 14.6 | 55+ (%) | 2.2 |
| Employment | |||||
| Bachelor student (%) | 22.7 | ||||
| Master student (%) | 4.8 | ||||
| Employee with academic studies (%) | 45.7 | ||||
| Employee without academic studies (%) | 15.6 | ||||
| Restaurant owner (%) | 1.5 | ||||
| Unemployed (%) | 9.8 | ||||
| Residence | |||||
| In a city (%) | 75.6 | ||||
| In a village (%) | 11.2 | ||||
| In an island (%) | 13.2 | ||||
| Living with Other People | |||||
| I live alone (%) | 16.9 | ||||
| I live with one or more people (%) | 55.1 | ||||
| I live with my girl/boyfriend and one child (%) | 13.2 | ||||
| I live with my girl/boyfriend and more children (%) | 14.7 | ||||
Table 3.
Most usual household food waste in Greece based on consumers’ responses.
| Food Waste | Responses | Percent of Total Responses (%) |
|---|---|---|
| 1. Bread | 115 | 7.3 |
| 2. Lettuce | 109 | 7 |
| 3. Potatoes | 105 | 6.7 |
| 4. Cooked rice | 99 | 6.3 |
| 5. Banana | 95 | 6.1 |
| 6. Apples | 81 | 5.2 |
| 7. Lemons | 78 | 5 |
| 8. Oranges | 77 | 4.9 |
| 9. Tomatoes | 72 | 4.6 |
| 10. Cooked pasta | 66 | 4.2 |
| 11. Milk | 62 | 4 |
| 12. Cherries | 53 | 3.4 |
| 13. Chicken | 43 | 2.7 |
| 14. Coffee | 42 | 2.7 |
| 15. Meat | 41 | 2.6 |
| 16. Peaches | 41 | 2.6 |
| 17. Carrots | 40 | 2.6 |
| 18. Onions | 35 | 2.2 |
| 19. Eggs | 34 | 2.2 |
| 20. Cheese | 33 | 2.1 |
| 21. Yoghurt | 32 | 2 |
| 22. Cucumbers | 32 | 2 |
| 23. Pears | 30 | 1.9 |
| 24. Broccoli | 24 | 1.5 |
| 25. Chocolate | 23 | 1.5 |
| 26. Tangerines | 23 | 1.5 |
| 27. Peas | 19 | 1.2 |
| 28. Lentils | 19 | 1.2 |
| 29. Fish | 18 | 1.2 |
| 30. Beans | 7 | 0.4 |
| 31. Gumbo | 6 | 0.4 |
| 32. Chickpeas | 4 | 0.3 |
| 33. Beets | 3 | 0.2 |
| 34. Oat | 1 | 0.1 |
Publisher’s Note: MDPI stays neutral with regard to jurisdictional claims in published maps and institutional affiliations. |
© 2022 by the authors. Licensee MDPI, Basel, Switzerland. This article is an open access article distributed under the terms and conditions of the Creative Commons Attribution (CC BY) license (https://creativecommons.org/licenses/by/4.0/).
Share and Cite
MDPI and ACS Style
Papamonioudis, K.; Zabaniotou, A. Exploring Greek Citizens’ Circular Thinking on Food Waste Recycling in a Circular Economy—A Survey-Based Investigation. Energies 2022, 15, 2584. https://0-doi-org.brum.beds.ac.uk/10.3390/en15072584
AMA Style
Papamonioudis K, Zabaniotou A. Exploring Greek Citizens’ Circular Thinking on Food Waste Recycling in a Circular Economy—A Survey-Based Investigation. Energies. 2022; 15(7):2584. https://0-doi-org.brum.beds.ac.uk/10.3390/en15072584
Chicago/Turabian StylePapamonioudis, Konstantinos, and Anastasia Zabaniotou. 2022. "Exploring Greek Citizens’ Circular Thinking on Food Waste Recycling in a Circular Economy—A Survey-Based Investigation" Energies 15, no. 7: 2584. https://0-doi-org.brum.beds.ac.uk/10.3390/en15072584
Note that from the first issue of 2016, this journal uses article numbers instead of page numbers. See further details here.