Article

Coupling Hydrodynamic and Energy Production Models for Salinity Gradient Energy Assessment in a Salt-Wedge Estuary (Strymon River, Northern Greece)

by
Konstantinos Zachopoulos
1,
Nikolaos Kokkos
1,
Costas Elmasides
2 and
Georgios Sylaios
1,*
1
Laboratory of Ecological Engineering and Technology, Department of Environmental Engineering, Democritus University of Thrace, Vas. Sofias 12, 67100 Xanthi, Greece
2
Laboratory of Non-Conventional Energy Resources, Department of Environmental Engineering, Democritus University of Thrace, Vas. Sofias 12, 67100 Xanthi, Greece
*
Author to whom correspondence should be addressed.
Submission received: 15 March 2022 / Revised: 11 April 2022 / Accepted: 16 April 2022 / Published: 19 April 2022
(This article belongs to the Special Issue A New Water-Energy Nexus: The Transition to Sustainable Energy Ⅱ)

Abstract

:
Salinity gradient energy (SGE) plants generate power from the mixing of salt water and fresh water using advanced membrane systems. In the Strymon River, under low-flow conditions, a salt wedge is formed, developing a two-layer stratified system, which could be used to extract SGE. In this paper, a novel study was implemented by coupling a 3D hydrodynamic model simulating the salt wedge flow, with the SGE model which assesses the net energy produced by a 1 MW SGE plant. Two scenarios were followed: (a) the optimal scenario, operating throughout the year by mixing salt water from the sea (38.1 g/L) and fresh water (0.1 g/L) from the river to produce 4.15 GWh/yr, and (b) the seasonal scenario, utilizing the salinity difference of the salt wedge. Results show that the daily net SGE production varies between 0.30 and 10.90 MWh/day, in accordance with the salinity difference (ΔSsw ~15–30 g/L). Additionally, a retrospective assessment (from 1981 to 2010) of the annual and seasonal net energy production was conducted. This analysis illustrates that the salt-wedge formation (spring to late summer) coincides with the period of increased regional electricity demand. In the future, the emerging SGE could serve as a decentralized renewable energy source, enhancing energy security in the region.

1. Introduction

The exponential growth of the Earth’s population and rapid technological development lead to the continuous increase in energy needs and subsequently to intensive electricity production to cover the modern societal needs [1,2]. Since the Industrial Revolution in the 1850s, global energy production has been entirely based on fossil fuels, inducing issues related to stock sustainability and the vast share of responsibility for climate change and other negative environmental impacts [1]. Concerted efforts have been undertaken towards CO2 emissions reduction, global energy transformation and decarbonization by mid-century in response to rising concerns over climate change and global warming. For example, the European Union (EU) has recently put in place a coherent action plan to make Europe the first climate-neutral continent by 2050. The plan, called the European Green Deal [3], emphasizes building a low-carbon, climate resilient future. The EU policy of the last decade aims to reduce European energy dependence on third countries and rely on decentralized renewable energy systems, optimizing energy use, enhancing energy security and increasing eco-efficiency. However, implementation of investments in such systems demands lifting of a series of barriers, such as technical (resource availability, technology design and performance), economic (investment, operation and maintenance costs and energy pricing), institutional (administrative, policy and regulatory), sociocultural (norms and value systems) and environmental (environmental impacts and aesthetics) obstacles [4,5]. The emerging marine renewable energy sector (MRE) targets the harvesting of the immense ocean energy resources of the planet by introducing technologies that convert the kinetic and chemical potentials or the thermal properties of seawater into energy [6]. MREs exhibit the potential to overcome some of the above barriers due to (a) the vast energy potential of the ocean; (b) the capacity to serve, through decentralized energy grids, the energy-hungry coastal regions, where intense urban, industrial and commercial activities concentrate; and (c) conservation of land resources valuable for agriculture [7].
An innovative technology of electrical power generation that fits the above storyline, with having almost zero CO2 emissions and negligible environmental impact, is osmotic energy or salinity gradient energy (SGE) [8]. SGE technology follows the reverse method used in desalination plants, where the salt water turns into fresh water. The SGE operation principle is based on the phenomenon of osmosis and, more precisely, on the energy released by the controlled mixing of two solutions of different concentrations (seawater and river water), using semipermeable membranes [9,10]. As membrane technology advances towards cost reduction (investment, operation and maintenance) and the introduction of more energy-efficient membranes, SGE is gaining attention, serving a sustainable and eco-friendly solution.
The most efficient SGE technologies implemented on a pilot scale for harvesting osmotic energy from estuaries are pressure retarded osmosis (PRO) and the reverse electrodialysis (RED). In pressure retarded osmosis (PRO), electrical power is mechanically generated by turbine rotation [11]. More precisely, in PRO, two solutions with different salinity concentrations flow in parallel, separated by a semipermeable membrane that allows water transfer only from the lighter to the denser water flow side. The denser salt water flows under higher pressure, whereas the fresh water flows towards the denser water side due to the osmosis phenomenon, thus increasing the saltwater flow volume. A turbine is coupled to the pipe containing the increased pressure flow to generate power [9,12,13]. The reverse electrodialysis (RED) method focuses on electrolysis theory, where salt ions are transferred from one solution to the other solution via membrane exchange ions under the influence of an electric field. Ion exchange membranes are of two types: cation exchange membrane (CEM) and anion exchange membrane (AEM). The compartments between the two membranes are alternatively filled with sea water and fresh water. The higher the salinity difference, the higher the potential difference created at each membrane. The sum of the potential differences determines the total production of electricity exerted over the membranes’ total surface area [14,15,16].
Suitable sites for application of this technology include estuaries, where river water (low-density water) is mixed with sea water (high-density water), releasing significant amounts of Gibbs energy [17]. The theoretical amount of energy released by mixing 1 m3 of sea water with the corresponding volume of river water is 1.4 MJ [18]. Globally, the total technically available SGE is estimated at around 647 GWel and is equivalent to 5177 TWhel/year, which accounts for approximately 20% of global electricity consumption [18]. Focusing in the Mediterranean river–sea systems, the available SGE that can be exploited without environmental cost (ecological potential) is estimated at 0.8 GWel or 7 TWhel/year [17]. Alternative SGE studies were also conducted for energy production in coastal hypersaline lagoons [19] or as supporting solutions in integrated systems, such as hydro plants [20] or supporting energy systems in desalination plants [21]. Other studies focused in the legal framework for regional projects, e.g., in the Mekong Basin [22].
In the Mediterranean microtidal estuaries, during the summer months, sea water intrudes upstream into the river mouth due to the reduced river discharge, and under limited tidal action, a well-stratified salt wedge propagates along the river. The high salinity difference in such a small area could be used for electricity production using SGE technologies. The salt wedge propagating along the lower reaches of the Strymon River is suitable for such an application. This highly stratified salt wedge is formed from summer to autumn months (June to October), with salinity difference varying from 10 to 37 g/L due to low river discharge (lower than 15 m3/s) [23]. A series of adverse environmental effects are triggered in association with the increase in estuarine flushing time, the biogeochemical transformation of pollutants, the occurrence of benthic anoxic conditions and the gradual rise in turbidity levels up to a turbidity maximum point observed at the tip of the wedge [24]. In parallel, as the saline wedge intrudes longitudinally along the river mouth, it salinizes the coastal groundwater and degrades nearby aquifers [25].
In this study, we aimed to assess the potential energy production of a 1 MW osmotic PRO-type power plant installed at the Strymon River mouth, utilizing the salt-wedge formation. This is an innovative approach, as no previous studies have focused on SGE extraction using the salinity difference between a salt wedge and fresh river water. For this purpose, a PRO energy model was coupled with a 3D hydrodynamic model, simulating the seasonal wedge dynamics, to assess the net electrical power produced. The salt-wedge energy models’ coupling simulated, with high resolution and accuracy, the water column salinity difference along the river channel for two typical years during which the hydrodynamic model was calibrated (2003) and validated (2004) against in situ data [23]. Then, the SGE energy model assessed the potential energy produced by the PRO method, utilizing pumped fresh water from the surface and salt water from the bottom at the along-channel location of maximum salinity difference. Based on the coupled model results, a series of inter-relations between Strymon River discharge, maximum salinity difference and net SGE PRO energy potential were established. Utilizing the mean daily river discharge for the period of 1981–2010 resulting from the hydrologic model HYPEweb (Swedish Meteorological and Hydrological Institute, SMHI), the retrospective annual SGE PRO potential energy of the Strymon River was evaluated, providing an assessment of the renewable resources of the area during wet and dry periods.

2. Method

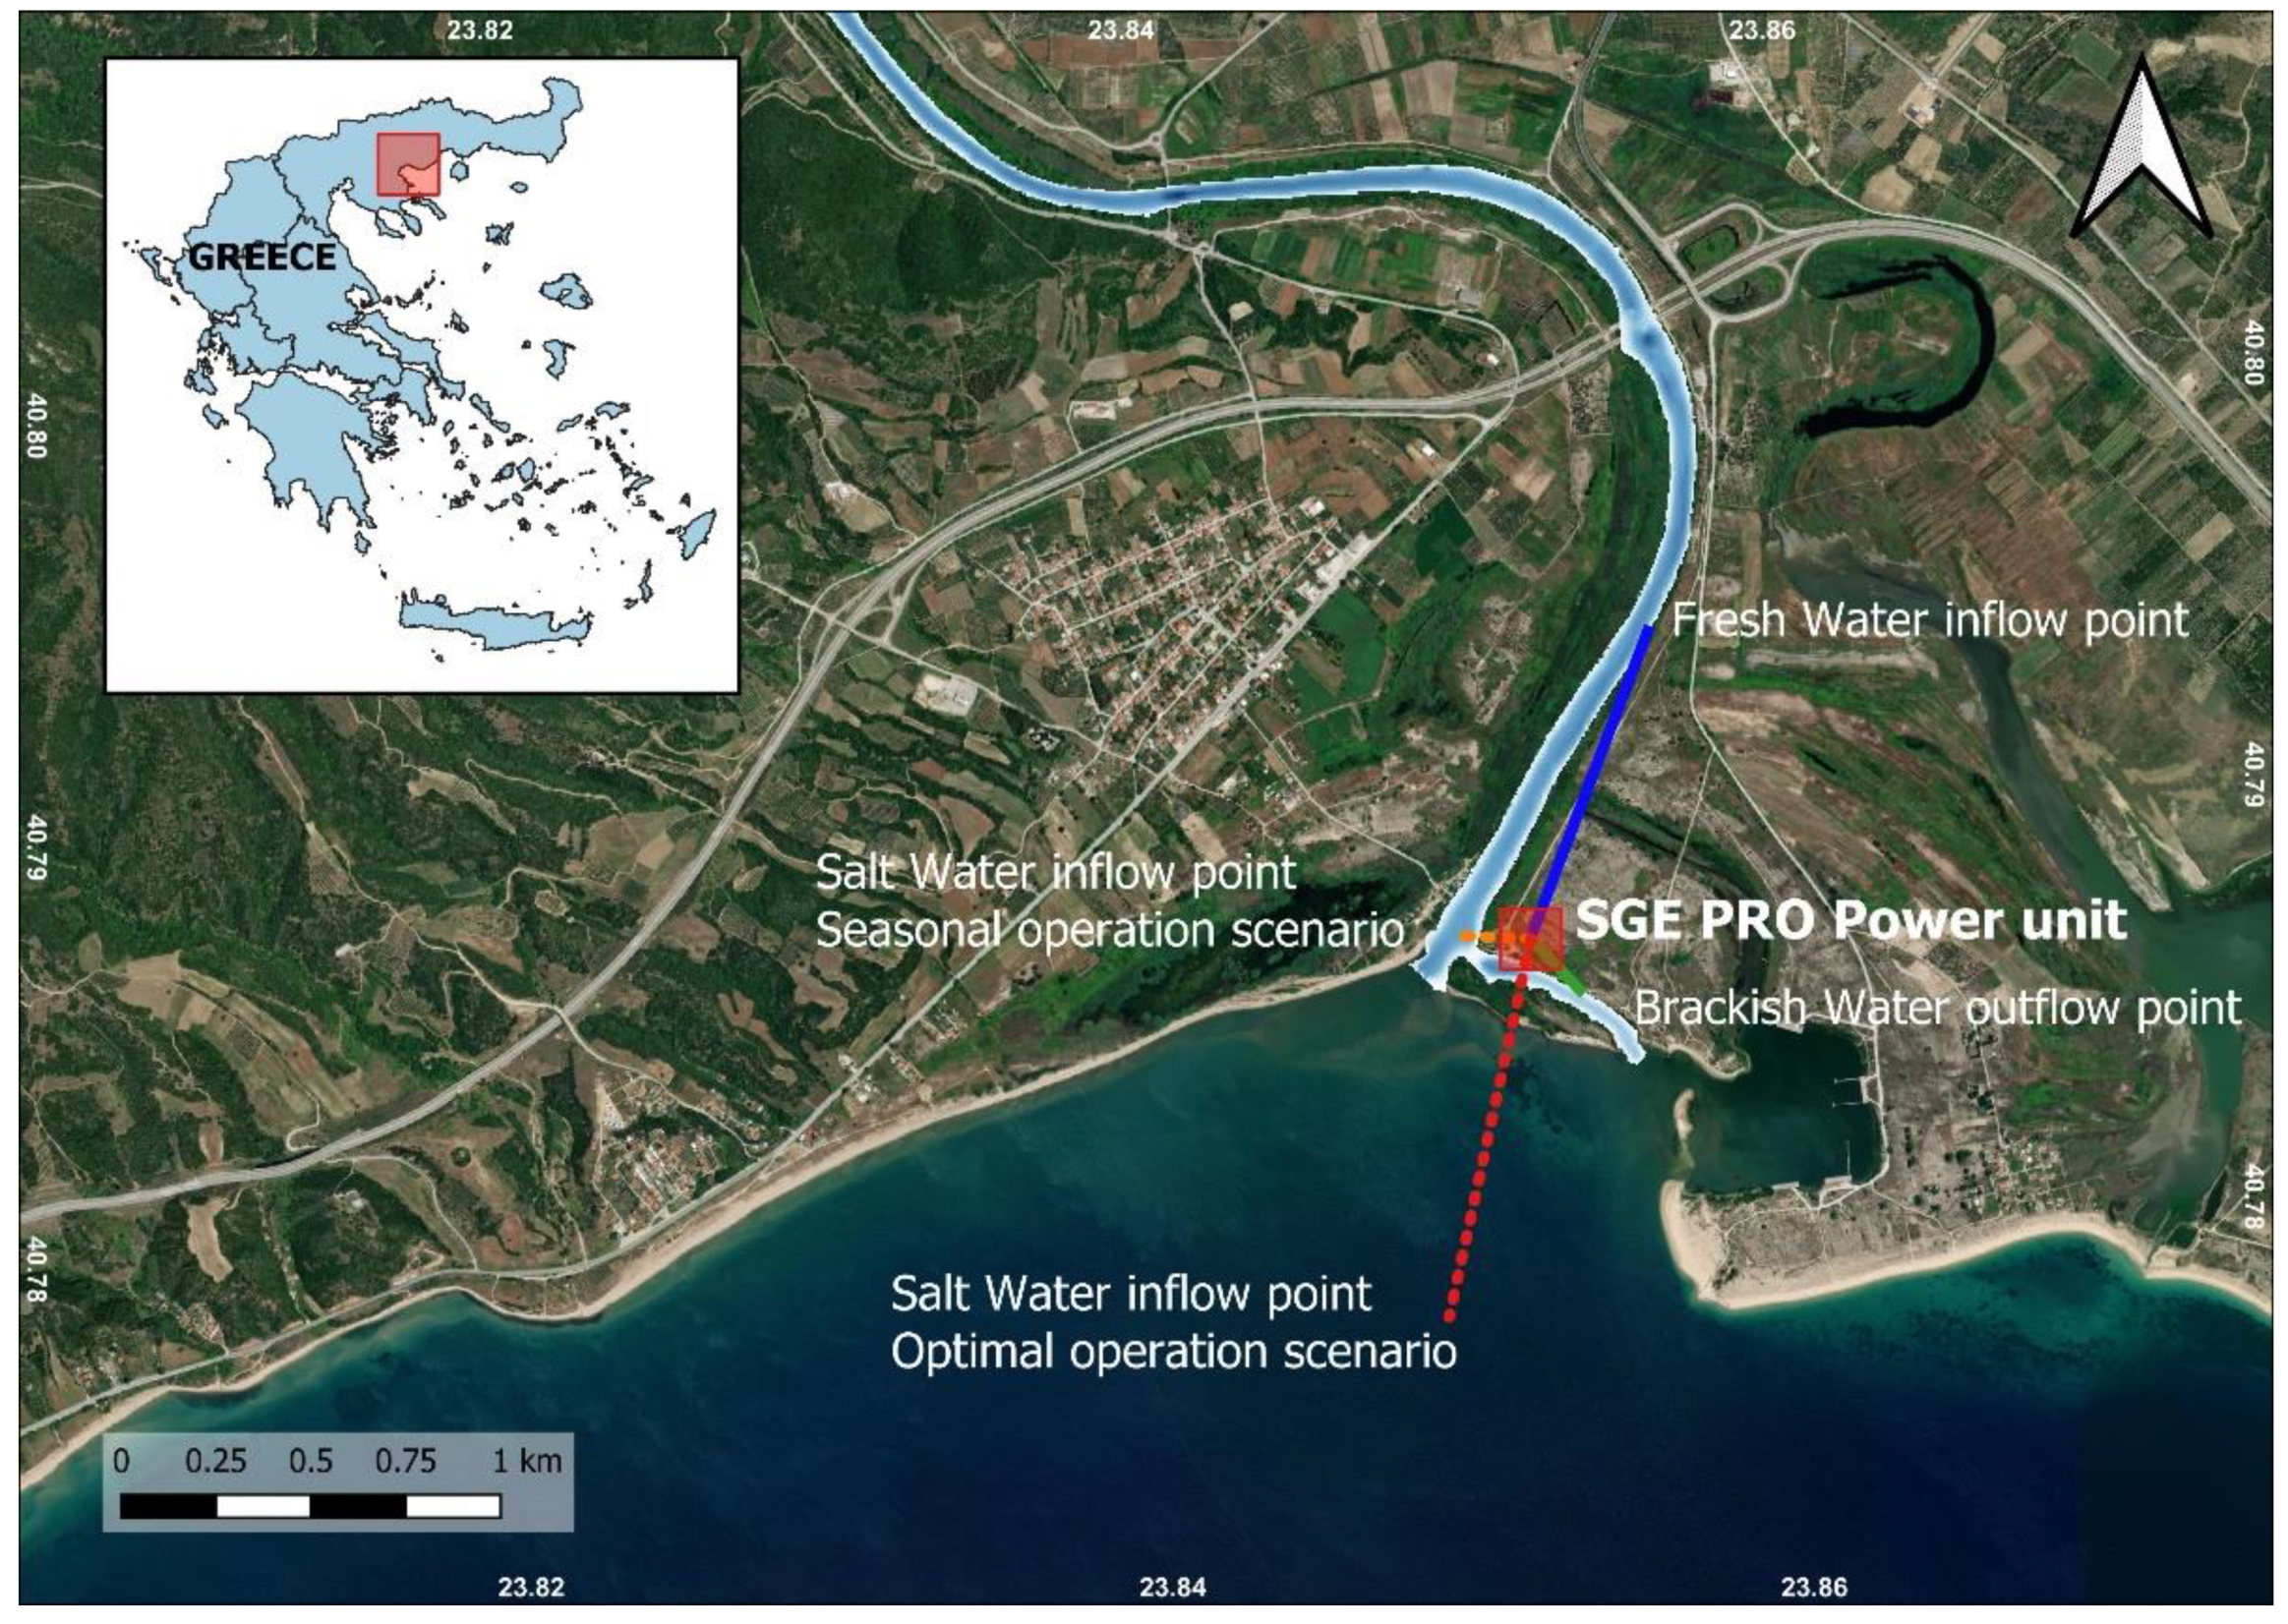
2.1. Study Site Description

Strymon River is 392 km long, draining a catchment of 17,330 km2. The river enters Greece through the Serres plain and then flows for approximately 118 km before it outflows into the Strymonikos Gulf in the Northern Aegean Sea. At the river mouth, the main controller of river discharge is the manmade biotope of Kerkini Lake, a human-controlled reservoir storing river water for irrigation. Strymon has a mean annual discharge of 59.5 m3/s; however, during increased irrigation demand (May to September), river discharge at the lowland river almost zeros [26]. According to Sylaios et al. [26], in recent decades, the total freshwater input to the Strymonikos Gulf decreased by about 30% due to the extended use of river water for irrigation and lower precipitation. This freshwater flow reduction led to salt-wedge intrusion up to 8 km upstream from the river mouth. The salinity difference induced by the river fresh water and the water from the salt wedge or the open sea could be utilized for energy production by applying SGE techniques (Figure 1).

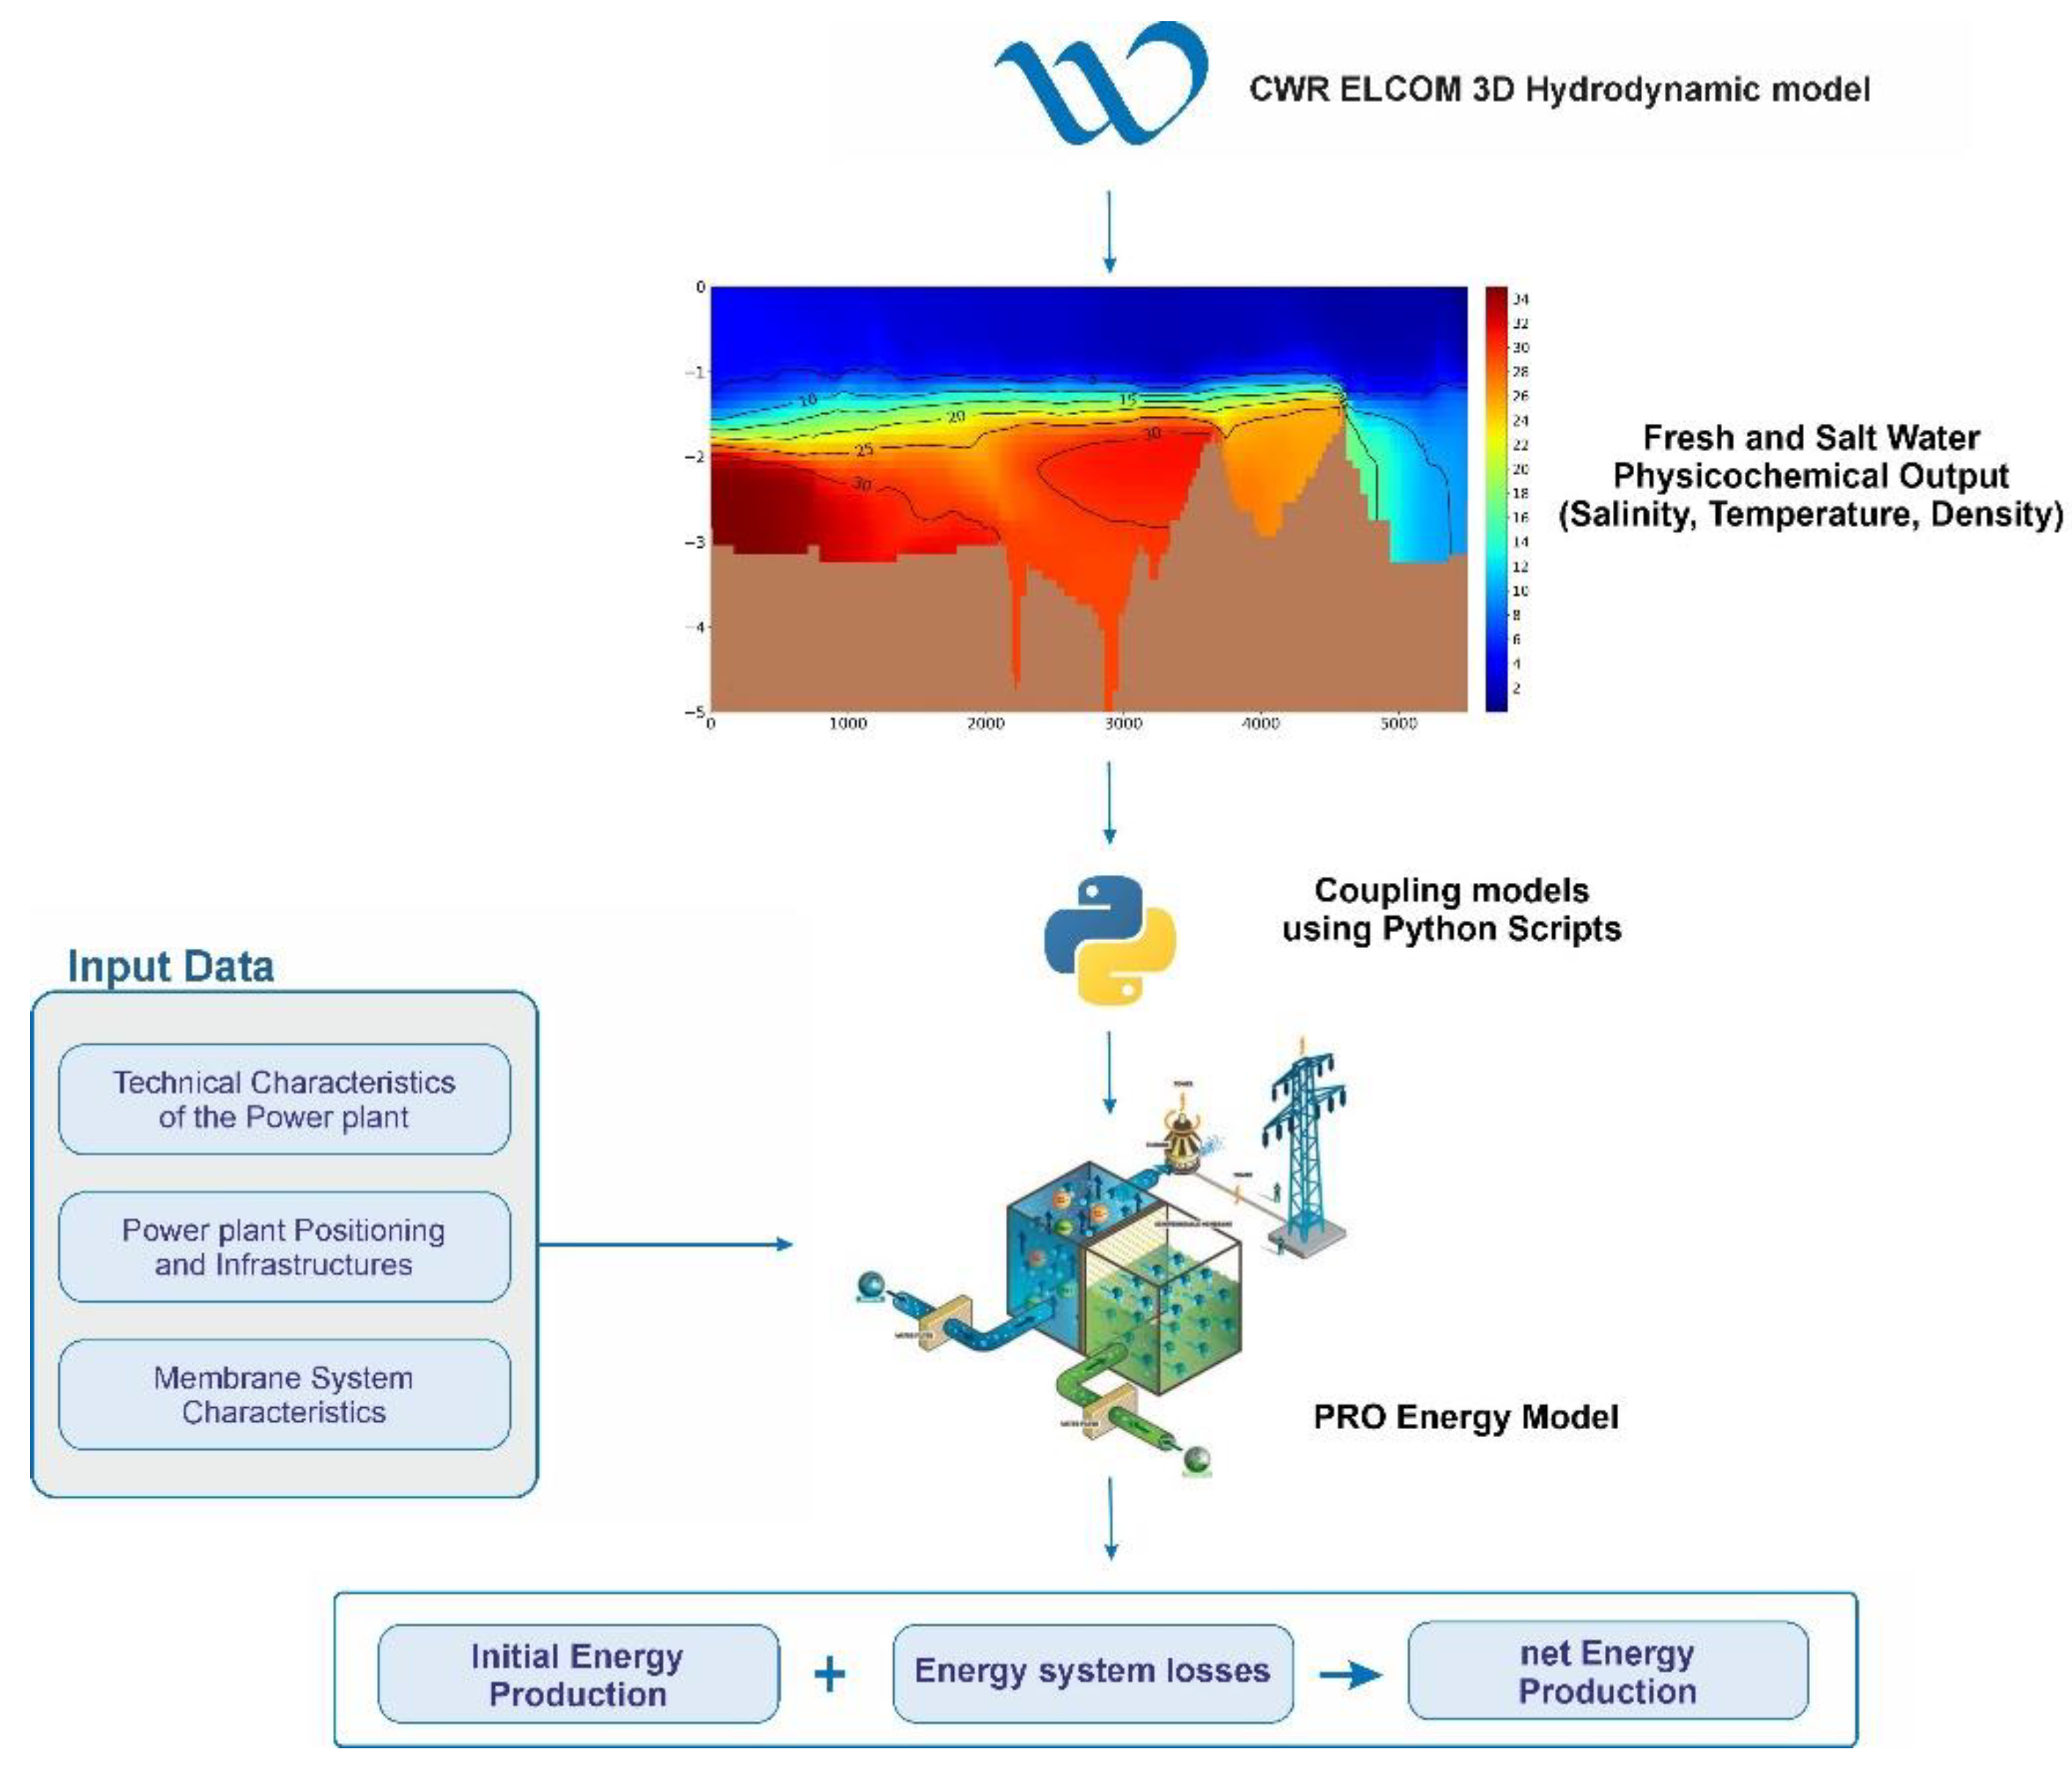
2.2. Model Coupling and SGE Assessment

The conceptual framework of the present study involves the coupling of a three-dimensional hydrodynamic model accurately describing the intrusion of the salt wedge and the distribution of salinity along the Strymon River channel, as well as an energy model capable of estimating the SGE PRO energy produced by the power plant. The coupled system is graphically presented in Figure 2. The hydrodynamic numerical model covers the Strymon River Estuary using a high-resolution computational grid with 20 m horizontal and 0.15 m vertical resolution. Model results reproduce the spatial distribution of salinity, water temperature, density and velocity with a temporal resolution of 20 min. Salinity results were resampled in hourly timestep and used as inputs to the PRO energy model, estimating the SGE net energy production on a daily basis. The daily net power production was assessed as the result of the surplus of the potential energy produced by the PRO power unit of 1 MW and the energy losses from plant’s operation. A series of Python v3.8 language scripts were developed to interconnect and execute the hydrodynamic and energy-coupled models.
For SGE net energy production, two scenarios were considered in this study (as seen in Figure 1): (a) the power plant operates non-stop within a typical year, pumping sea water (salinity ~38 g/L) from an offshore point in Strymonikos Gulf (red pipeline) and fresh water from a surface point in the river (approximately 1000 m upstream from the river mouth (blue pipeline)); (b) the power plant exploits the salinity difference in the water column due to salt-wedge formation upstream of the river mouth (seasonal operation limited to 4–5 months, depending on salt-wedge intrusion).The freshwater intake point is the same (approximately 1000 m upstream from the river mouth (blue pipeline)), and the saltwater intake (orange pipeline) is located at the entrance of the river mouth. The power plant discharges brackish water into the channel eastwards of the river mouth (green pipeline). Both energy generation scenarios utilize the salinity and temperature results produced by the hydrodynamic simulation covering the Strymon River estuary and the broader mouth area.
Additionally, a long-term retrospective energy assessment was conducted using historical river discharge data. This assessment was based on the empirical correlations produced by the scenario analysis. The simulated energy was linked to river hydrology and the fresh–saltwater difference, allowing for the long-term assessment of energy that the river mouth could produce.

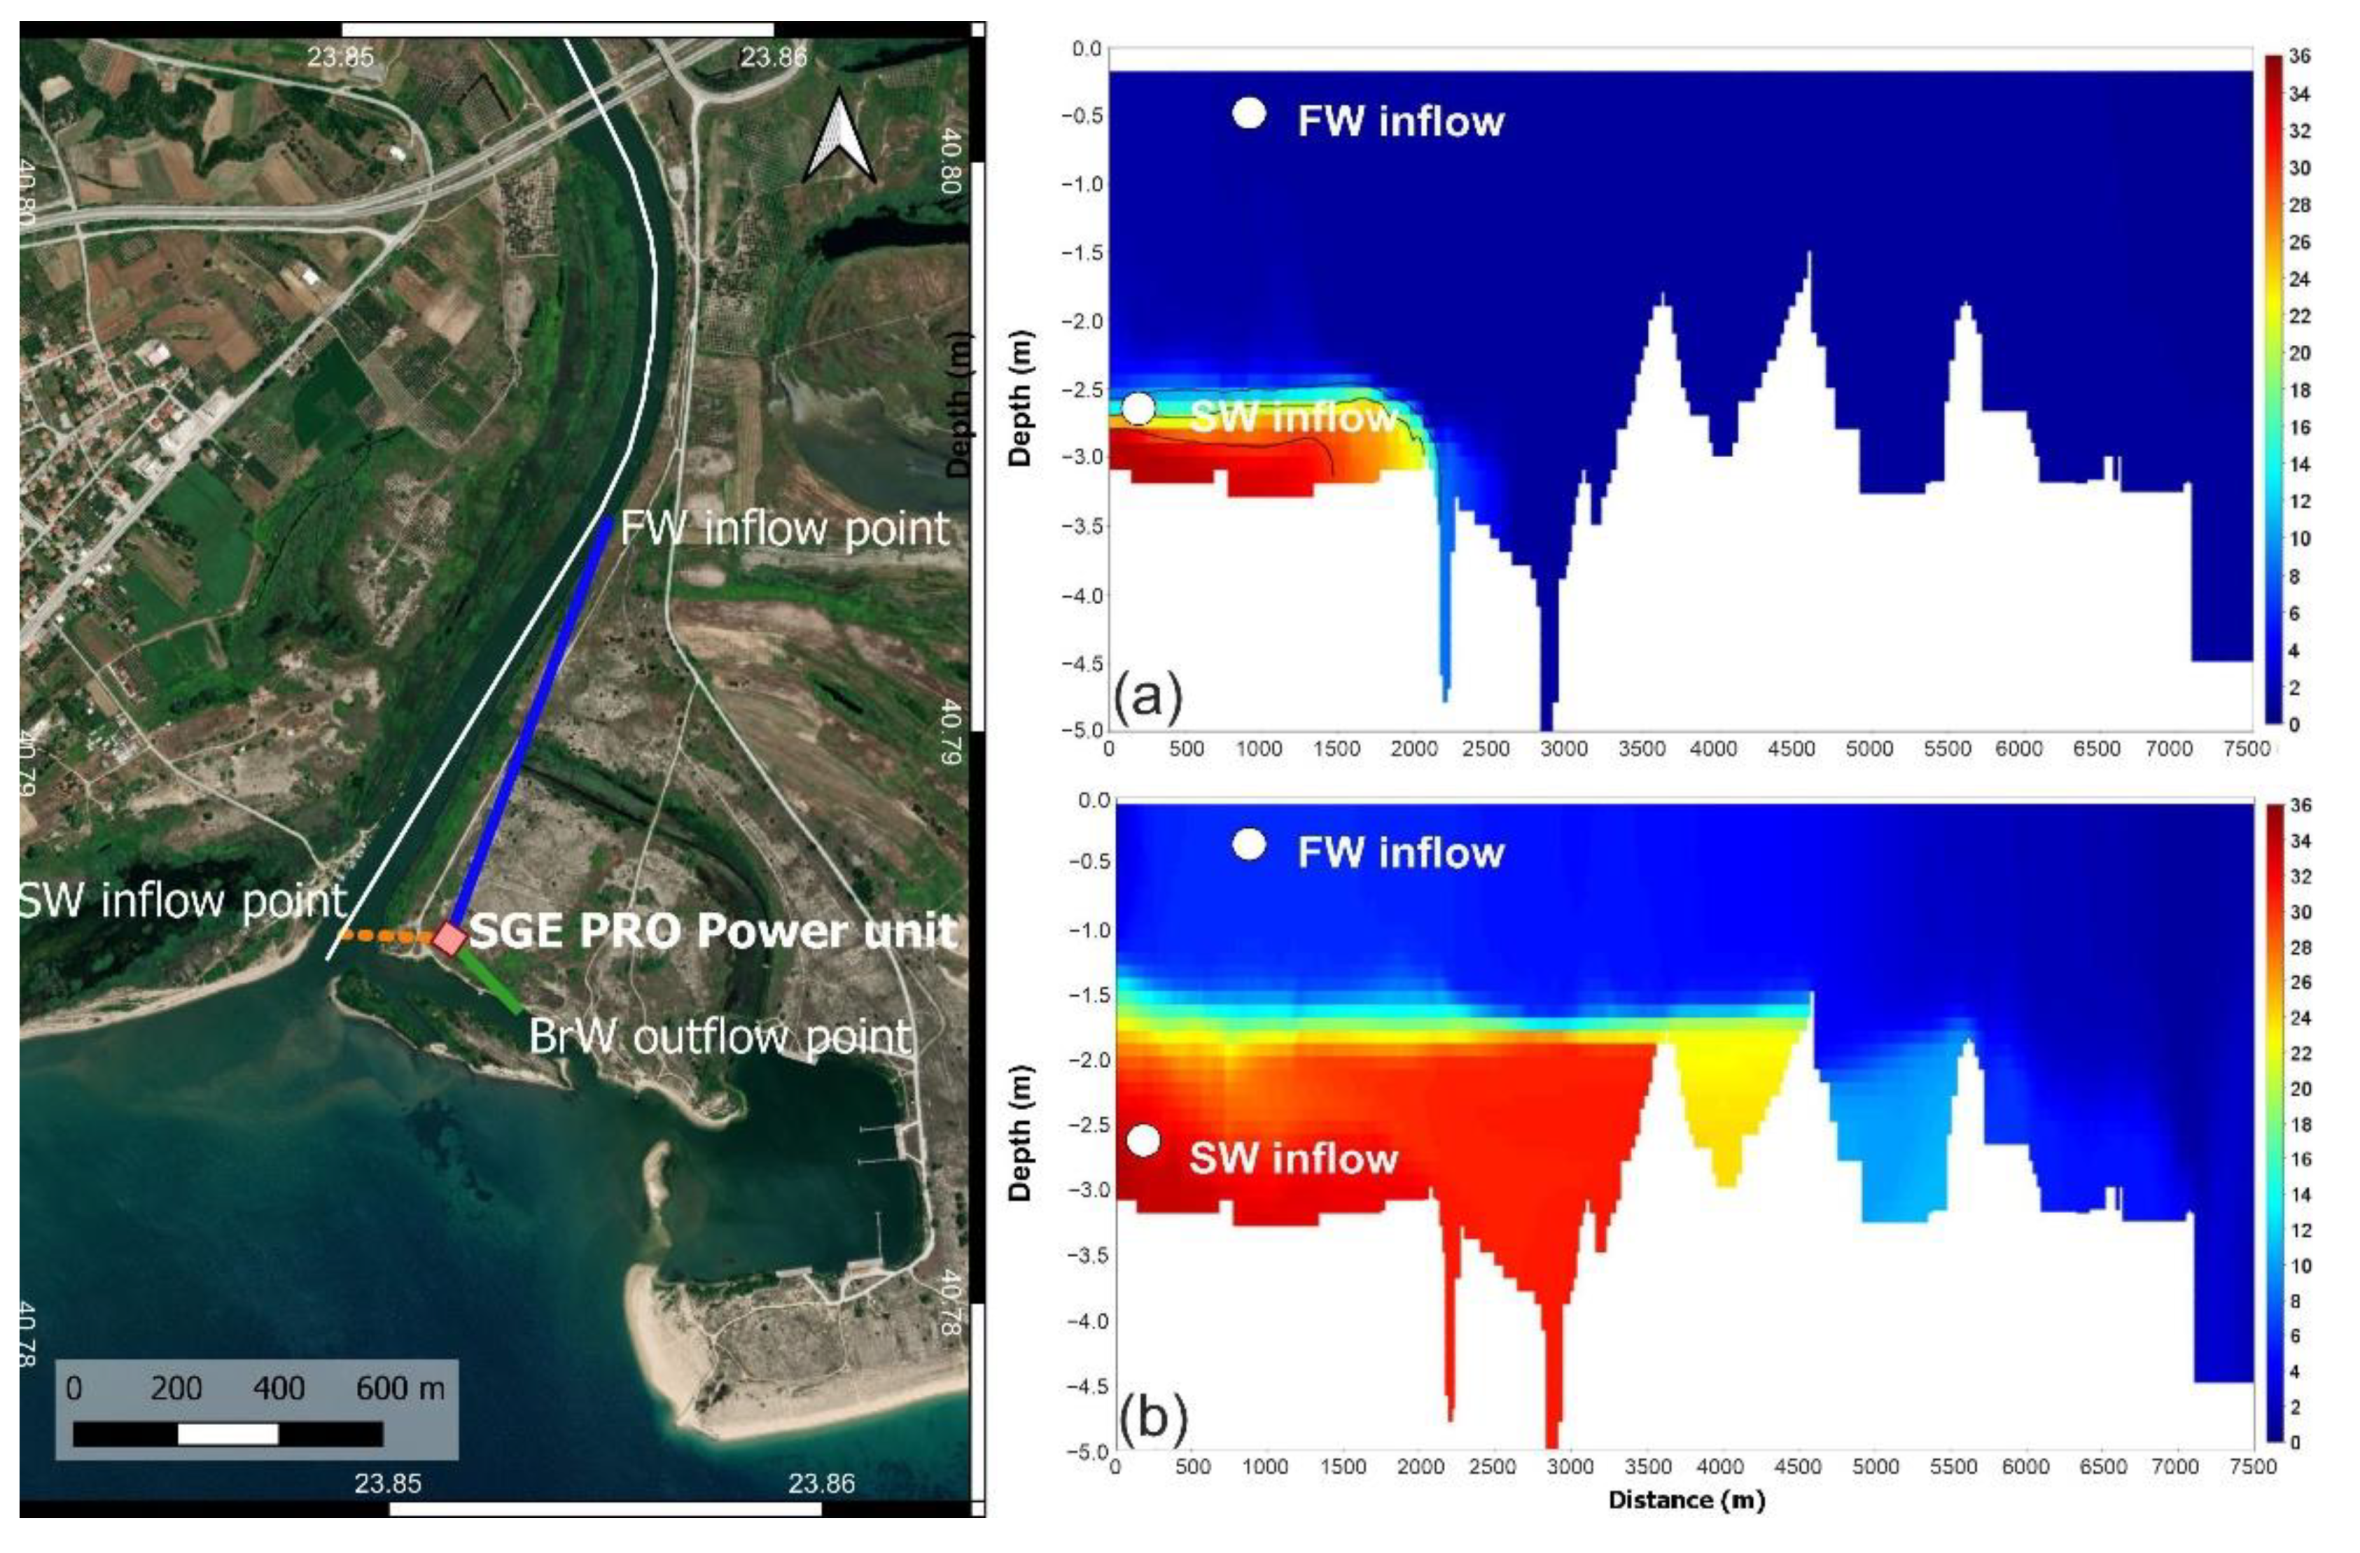
2.3. Hydrodynamic Model of Strymon River Estuary

The salt-wedge formation, the two-layers flow, and the interfacial mixing were simulated using a 3D hydrodynamic model [23]. The three-dimensional hydrodynamic model ELCOM v4.1.1 (Estuary Lake and Coastal Ocean Model) was appropriate for the salt-wedge dynamics simulation along the Strymon River Estuary. The model reproduces the dynamics in stratified water bodies under variable external environmental forcing from tides, winds, surface heat fluxes and river flows [27]. The ELCOM model has been used in several studies simulating stratified fluxes in estuary systems [28,29,30].
The governing equations and fundamental models used for three-dimensional transport and surface thermodynamics in ELCOM are summarized below. The transport equations are the unsteady Reynolds-averaged Navier–Stokes (RANS) equations, and the scalar transport equations use Boussinesq approximation and neglect the non-hydrostatic pressure terms. In ELCOM, eddy viscosity is used to represent the horizontal turbulence closure. In the vertical direction, ELCOM can apply either a vertical eddy viscosity or a mixed-layer model [31].
Continuity Equation:
U j x j = 0
Vertically-integrated Continuity Equation:
η t = U 3 U a η x a x a ( u α h ¯ )
Transport of Momentum:
U a t + U j U a x j = g { η x a + 1 ρ o x a z η ρ d z } + x 1 { v 1 U a x 1 } + x 2 { v 2 U a x 2 } + x 3 { v 3 U a x 3 } α β f U β
Transport of Scalars:
S t + x j ( S U j ) = x 1 ( k 1 S x 1 ) + x 2 ( k 2 S x 2 ) + x 3 ( k 3 S x 3 )
where j is the index representing the three-component space (j = 1, 2, 3); α is the horizontal two-component space (α = 1, 2); U is the Reynolds-averaged velocity; ρο is the reference water density; ρ’ is the water density anomaly, i.e., the difference between in situ density and the reference density; η is the sea surface level; S is the water salinity; h is the water depth; g is the gravitational acceleration; v1, v2 and v3 are the eddy viscosity coefficients; and k1, k2 and k3 are the salt eddy diffusivity coefficients.
In the present study, the 3D hydrodynamic model was forced from its upstream boundary with the daily mean river discharge and water temperature data retrieved from the SMHI HYPEweb model database [32,33,34,35]. More precisely, the mean daily river flow time series (2003 and 2004) at Strymon lower sub-basin (id:9789242) was selected (https://hypeweb.smhi.se/, accessed on 13 March 2022). Tidal data imposed at the ocean model boundary were retrieved from the TPXO v9 model database (https://www.tpxo.net/global, accessed on 13 March 2022). Temperature and salinity profiles were collected from the Copernicus Marine Environmental Service (CMEMS—MEDSEA_MULTIYEAR_PHY_006_004, http://marine.copernicus.eu/, accessed on 13 March 2022) [36,37,38], acting at the open oceanic boundary of the river mouth. Meteorological data (wind speed and direction) were retrieved from the NOAA Global Data Assimilation System database (GDAS, https://www.ncdc.noaa.gov/data-access/model-data/model-datasets/global-data-assimilation-system-gdas, accessed on 13 March 2022) and were imposed on the sea surface.
The three-dimensional hydrodynamic model (ELCOM) was configured to describe the hydrodynamic characteristics of the lower 8 km of the Strymon River channel. The horizontal computational domain of the applied three-dimensional model was based on an Arakawa-C discretized rectangular grid of 254 × 149 horizontal cells with a resolution of 20 m × 20 m and a vertical grid of 55 layers encompassing the total water column, with a thickness of 0.10 m. This high-resolution computational grid was able to capture, in detail, the vertical stratification patterns along the river channel and minimize the errors produced by grid schematization on the complex bathymetry and topography of the area.
The model was calibrated and validated using data from field surveys (June to August 2003 and 2004) [24]. Evaluation criteria illustrated relatively satisfactory model performance at five different points along the river, showing that the simulated vertical salinity profiles were well correlated to the profiles of in situ salinity measurements. Salinity, r2, reached 0.95 when all records were considered [23].
The model was applied with a timestep of 20 s to simulate the river hydrodynamics (salinity, temperature, velocity and water density) in hindcast mode. Model findings suggest that salt-wedge dynamics along the river channel are principally driven by Strymon River discharge. The salt wedge (water salinity > 30 g/L) is observed from June to October, intruding up to 4.6 km when the river discharge in the river mouth area is lower than 12 m3/s [24]. Finally, salinity and temperature time series in salt-wedge and freshwater layers were extracted from the hydrodynamic model and were imported to the SGE PRO model (Figure 2).

2.4. SGE PRO Model of Strymon River Estuary

In this work, we developed an SGE model for a PRO power plant of 1 MW capacity coupled to the 3D hydrodynamic model of the Strymon River, simulating the net energy production in a salt-wedge estuary system. Net energy production is estimated as the surplus of potential energy and the energy losses of the power plant. The model approach focuses on keeping the potential energy production stable, adjusting the volumes of fresh and saltwater intake according to the available salinity difference. In this paper, we assume that no limitations on the water intake volume are considered. A Python code was written to couple the models using the salinity and temperature characteristics of salt (Ts and SNaCl,s) and freshwater (Tf and SNaCl,f) pumping points as input to the energy model. The energy model follows the technical specifications applied in Iran’s Bahmanshir and Zohreh rivers [39,40,41].
The osmotic pressure difference (bar/m3) between salt and fresh water is estimated by the van’t Hoff equation (Equation (5)) [42].
Δ π o s m = 2 R M N a C l ( T s S N a C l , s T f S N a C l , f ) 10 2
where R = 8.314 J/mol.k is the universal gas constant; MNaCl = 58.44 g/mol is the molar mass of NaCl; Ts and Tf are the temperature of the sea and fresh water, respectively, (in K); and SNaCl,s and SNaCl,f are the salinity (in g/L) of the sea and fresh water, respectively, as estimated from the hydrodynamic model.
The practical osmotic pressure difference (ΔP) is estimated as half of the available osmotic pressure difference, in bar/m3 [43]:
Δ P = 1 2 Δ π o s m
Considering the produced practical osmotic pressure difference (ΔP), the practical osmotic energy (Eosm) obtained per 1 m3 water is calculated by Equation (7) (in MJ/m3) [44]:
E o s m = Δ P 10 1
The potential energy (Ep) produced by the pilot plant, based on its capacity (P = 1 MW) and water availability, is given in Equation (8) (in GWh/yr):
E p = P t h r s / y r 10 3
where thrs/yr = 365 × 24 is the power plant operating hours per year.
According to Naghiloo et al. [39], freshwater intake need (m3/s) is estimated, considering the power plant capacity and the practical osmotic energy, as:
Q f r e s h = P E o s m
Assuming that 90% of the fresh water penetrates through the membrane and the remaining 10% returns to its initial stage for reuse, the water flux moving through the membrane (in m3/s) is:
Q f r = 0.9 Q f r e s h
The required saltwater flux is twice as high as the freshwater flux and is estimated in Equation (11) (in m3/s):
Q s a = 2 Q f r e s h
Finally, the brackish water outflow to the Strymon River estuary is the sum of the fresh and saltwater intake:
Q b r a = 2.9 Q f r e s h
Moreover, the PRO power plant design is separated into four main sections: (a) the intake and outfall system, (b) the pretreatment system, (c) the membrane system and (d) the transmission and generation system. During the water transmission in and out of the PRO plant, energy losses are assessed by the difference between the energy required for the intake and the energy produced by the outfall system. Fresh and salt water enter the PRO unit, and brackish water outfalls. Generally, water transmission is carried out using pipelines or concrete channels. The size of the pipeline or channel is in direct analogy to the size of the PRO plant and the system’s water needs.
In the Strymon River estuary, pipelines with a diameter of 2 m were selected to reduce the investment cost and avoid environmental constraints. The freshwater pipeline’s length is estimated at 1000 m, whereas the saltwater pipeline is 150 m, and the outfall pipeline of brackish water is 120 m. The water is transported to the membrane stacks using pumps. The pipelines end at the membrane stack, where osmotic pressure is built up. The osmotic pressure is released by allowing the pressurized water to flow through turbines. The turbines convert the osmotic pressure into electricity. The inefficiencies of all mechanical components of the turbine and the energy losses due to water transportation through the piping system are estimated by the equations described below.
More precisely, the total required annual energy for pumping the salt water (Eloss) in the tubes can be obtained (in GWh/yr), as:
E l o s s = ρ g ( Q s a + Q f r ) H t t h r s / y r 10 9
where water density is ρ = 1000 (kg/m3); acceleration of gravity is g = 9.81 m/s; Qsa and Qfr (in m3/s) refer to the salt and freshwater flow rate, respectively, through the intake; tunnel head loss (Ht) is 2 m; and thrs/yr is the time that the plant operates (1 year = 24 × 365 hrs/yr).
The energy loss due to water transportation and turbine efficiency losses (in GWh/yr) can be described as:
E l w t = ρ g Δ H w ( Q f r + Q s a ) t h r s / y r η p u m p 10 9
where ΔHw = 10 m is the total head loss of water transportation, and ηpump = 0.65 is the pump efficiency (value used according to Naghiloo et al. [39]). The energy losses related to turbine efficiency are estimated in Equation (15) (in GWh/yr):
E l t = E p ( 1 η t u r b i n e )
where ηturbine = 0.85 is the turbine efficiency (value used according to Naghiloo et al. [39]).
Finally, the transmission and generation system’s total energy loss is estimated as the sum of energy losses due to water transportation and turbine efficiency estimated in Equation (16) (in GWh/yr), [44]:
E t l t g = E l w t + E l t
Before the entry of fresh and salt water into the membrane system, pretreatment of the inflowing solutions is required. Algae or other micro-organisms, suspended solids, colloidal particles, dissolved solids and any kind of suspended matter should be removed from the intake fluids, protecting the semipermeable membranes from contamination. Contamination of the semipermeable membranes results in a decrease in energy production. Microfiltration is the most efficient and effective way to remove microparticles from the water body [45]. The total energy required for fresh and saltwater pretreatment before entering the membrane system (in GWh/yr) is estimated by:
E c p t = Δ P m f ( Q f r + Q s a ) t h r s / y r 10 9
The pretreatment system losses are related to the fresh and saltwater flow rates through the membrane and the minimum pressure of microfiltration (ΔPmf = 3000 pa), according to Naghiloo et al. [39].
The membrane system is the most critical system of the PRO unit. The spiral-wounded membrane is the most suitable for producing osmotic power [46]. The energy losses (in GWh/yr) due to water bleed are determined by [47]:
E l b = ( 1 1 3 ( ( ( 1 % b l e e d ) Q f r ) + Q s a ) Q f r ) E p
where %bleed = 0.1 is the percentage of bleeding, according to Naghiloo et al. [39]. The total energy losses are estimated as the sum of all of the system’s energy losses (in GWh/yr):
E t l = E l o s s + E c p t + E l b + E t l t g
The net energy production of the PRO power plant is estimated by the surplus of the potential energy production and the total energy losses (in GWh/yr):
E n e t = E p E t l

3. Results

3.1. Energy Production Scenarios

3.1.1. Optimal Energy Production Scenario

The optimal net electricity production was assessed for the Strymon River estuary under a scenario with the power plant operating at its maximum theoretical capacity with continuous inflow (365 days per year) of salt water (annual average about 38.1 g/L) and fresh riverine water (annual average 0.1 g/L). A salinity difference of about 38 g/L is the maximum potential value observed in the Strymon River lower channel (ΔSmax). The plant’s intake water needs were estimated at 0.6 m3/s and 1.3 m3/s in fresh and salt water, respectively. During the operation of the 1 MW PRO unit, higher energy losses are observed in the fresh and saltwater transmission and the electricity generation system (around 42.4%). The second, most energy-consuming component is the pretreatment process for both fresh and sea water (approximately 5.7%). The membrane system consumes almost 3.3% of the system energy, and the losses from the intake and outfall systems are estimated at 1.2%. Based on the above, the system’s total efficiency is almost 47.3% (Table 1). The optimal annual net energy production is estimated at approximately 4.15 GWh/year. This amount of energy could potentially cover the annual electricity needs of around 1107 households (3.75 MWh/year per household needs; based on data from the Hellenic Statistical Authority, www.statistics.gr, accessed on 13 March 2022).

3.1.2. Seasonal Energy Production Scenario

In the scenario of harvesting energy from the salinity difference between the salt wedge and river water (ΔSSW), the SGE PRO unit pumps salt water from a point at the bottom close to the river mouth and freshwater from a point around 1000 m upstream of the river mouth. The brackish water produced by the mixing of fresh and salt water flows out in an outer channel of the main river. In this case, the salinity difference (ΔSSW) between the two inflow solutions varies according to the salt-wedge intrusion characteristics, depending on the tide, river discharge, wind and interfacial mixing, resulting in anomalies in the daily electricity production. The hourly results from the hydrodynamic simulation (water salinity and temperature at each intake point) were used as input data in the PRO energy model. Figure 3 shows a typical seasonal variation in salt-wedge formation along the Strymon River channel, as represented by the 3D hydrodynamic model. Figure 3a illustrates the typical along-channel and vertical salinity distribution at the beginning of salt-wedge formation in early summer 2004, whereas Figure 3b illustrates a typical salinity distribution, as the wedge is established in late summer 2004. In summer months, when the salt wedge intrudes the river channel, the salinity of the water column increases, as does the salinity difference between the fresh and salt water at the top and bottom of the water column, respectively. The rise in the salinity difference results in higher SGE net energy production.
Figure 4 presents the relationship between the salinity difference (ΔSSW) and the net energy production for the three months (June to September) of SGE PRO plant operation. Anomalies in hourly energy production appear due to the salinity difference between the salt and freshwater intake. In low river discharge conditions, the salinity of the salt wedge increases in the flood tidal phase, as the when salt water enters the river mouth. On the contrary, the salt wedge partially retreats in ebb tides, and the salt-wedge salinity decreases [23].
Table 2 presents the daily electricity production in correlation with the various ΔSSW ranges, as produced by the coupled 3D hydrodynamic and SGE PRO Strymon River model for the year 2004. Our simulation reveals that the salt water enters the river in the first days of June, and the ΔSSW is approximately 26 g/L; as river discharge declines due to freshwater use in agriculture, the salt wedge intrudes further upstream, and the ΔSSW increases rapidly. According to the hydrodynamic simulation, the salt wedge remains in the lower river mouth for approximately 95 days (June to August 2004). High salinity difference (ΔSSW > 30 g/L) is observed for almost 78 days, with lower salinity difference for 17 days. Under the low salinity difference (ΔSSW = 15–20 g/L), the power plant’s efficiency diminishes to less than 19.4%. The unit requires higher volumes of fresh and salt water to counterbalance the reduction in salinity difference and maintain the energy production of the power plant. This leads to an increase in transmission and generation system losses by up to 45.4%.
Typically, when the salt wedge is formed in the river mouth, the ΔSSW ranges from 26 to 35 g/L, producing 7.55 to 10.90 MWh/day of electricity, which appears adequate to cover the daily needs of 576 to 837 households. During the most frequent salinity difference (ΔSSW~30 g/L), the PRO unit produces 9.50 MWh/day, and the plant requires 1.6 m3/s of saltwater and 0.8 m3/s of freshwater. This amount of electrical energy could cover the daily needs of 729 households (~0.013 MWh/day per household).

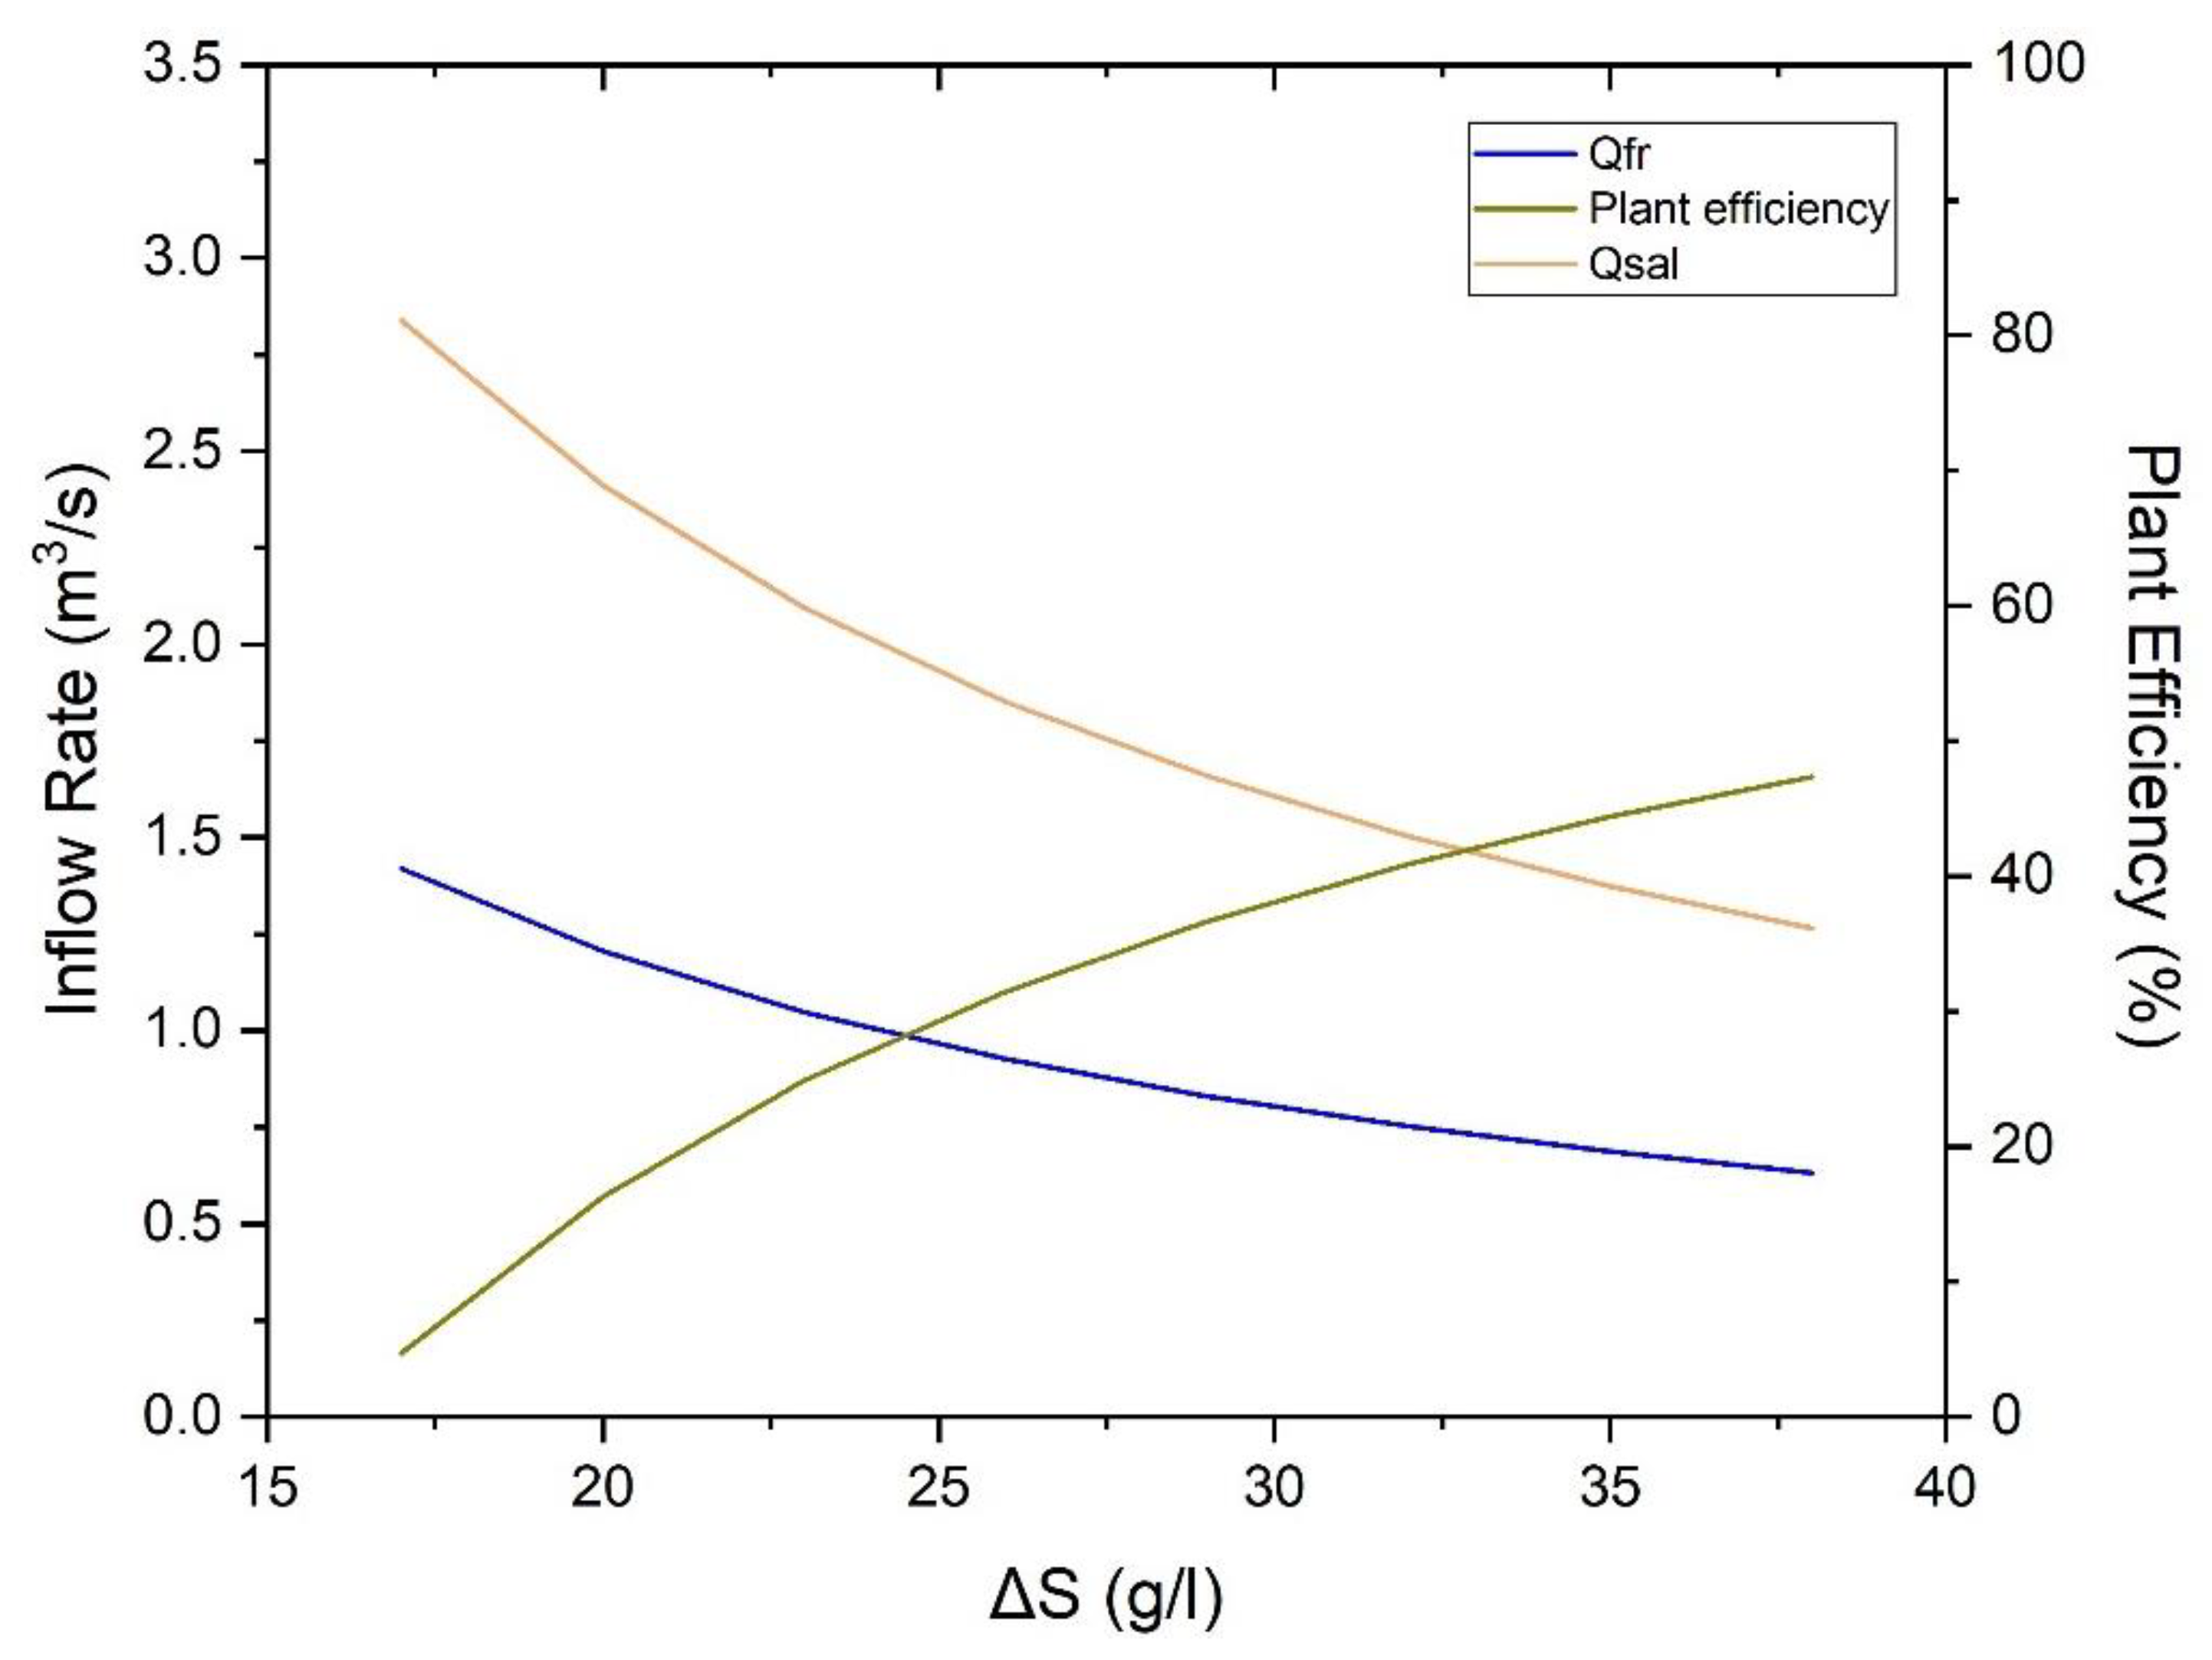
3.2. Inter-Relations between River Discharge, Salinity Difference (ΔSSW) and PRO Energy

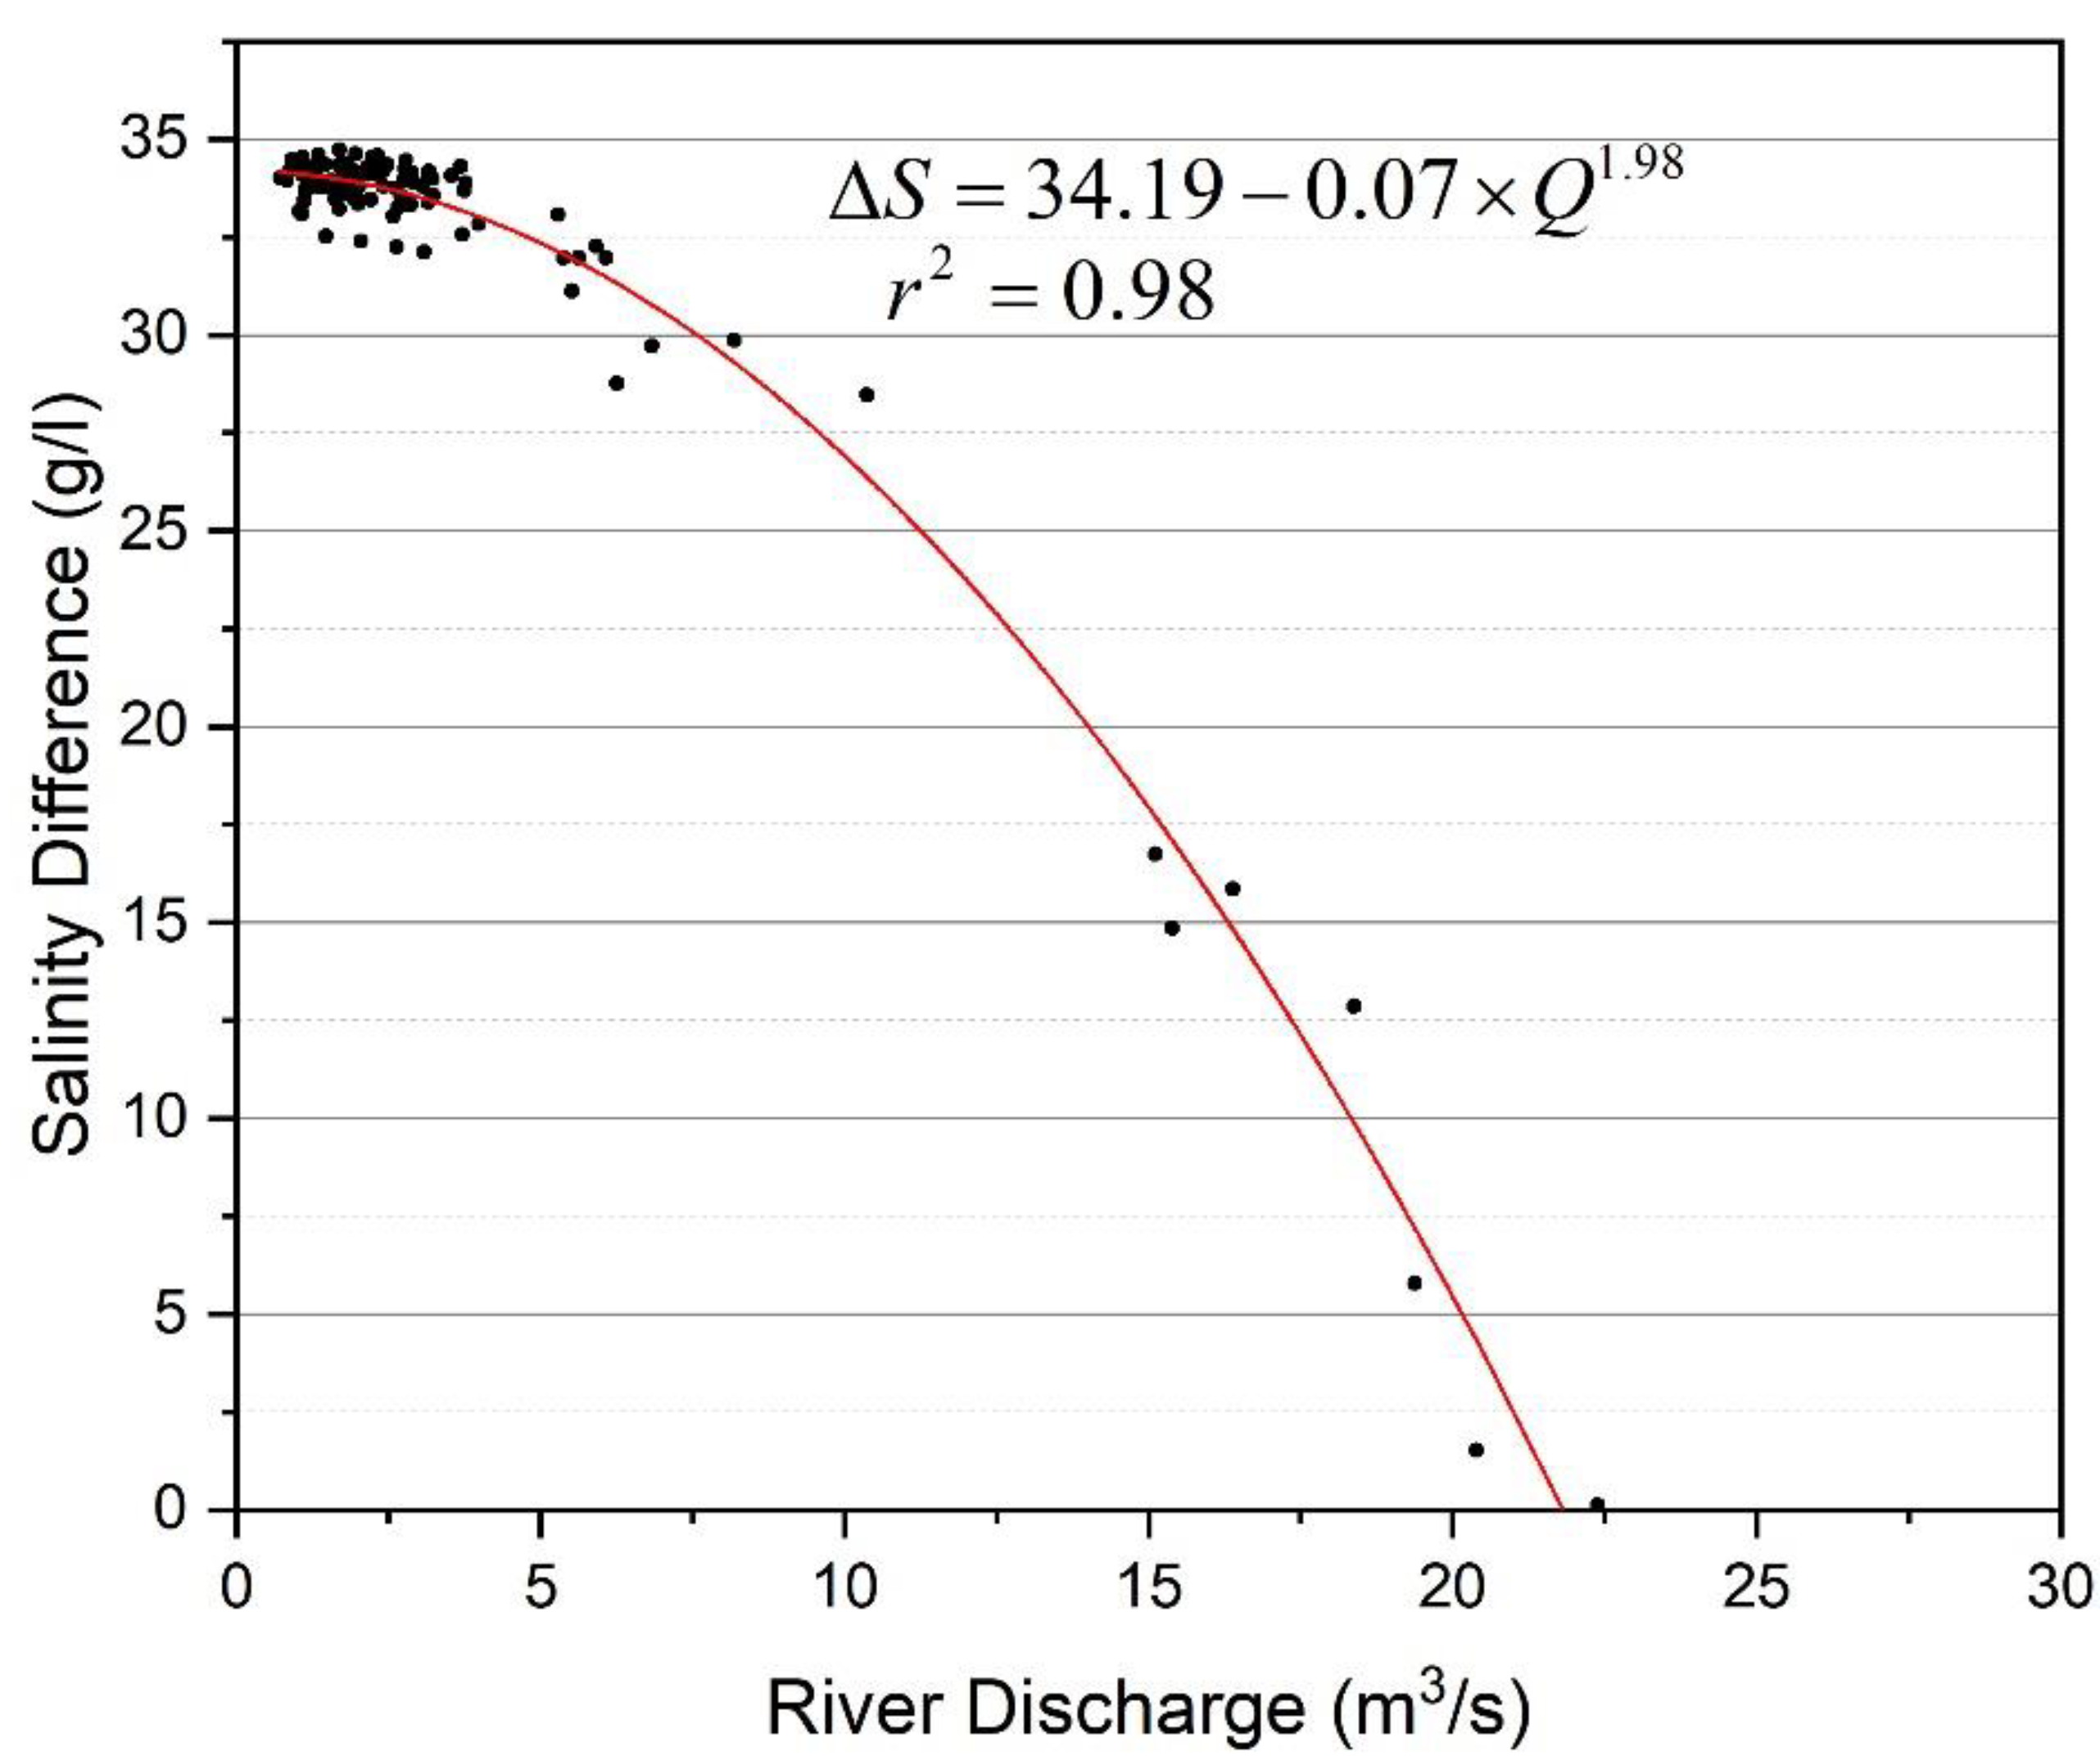
3.2.1. River Discharge vs. ΔSSW

Utilizing the 2004 hydrodynamic model results and SGE PRO Strymon River model, a series of correlations were produced between key system parameters computed on a daily basis. Firstly, the correlation between the daily average salinity difference (ΔSSW) at a certain point along the lower river channel and the daily mean river discharge (Q) was estimated (Figure 5).
Figure 5 illustrates that in the Strymon River estuary, the salinity difference between the salt wedge and fresh river water increases in a non-linear manner to relative to river discharge reduction, exhibiting significant correlation with the exponential model fitting (r2 = 0.98, n = 118). Under low river discharge (lower than 15 m3/s), sea water intrudes into the river mouth, increasing the salt-wedge salinity; thus, the salinity difference between the saline bottom layer and the freshwater surface layer increases. The maximum ΔSSW (around 35 g/L) is reached under very low river discharge rates (near zero to 4.5 m3/s). On the other hand, the salt wedge is flushed out of the lower river channel in cases where river discharge exceeds 15 m3/s. Under flows higher than 20 m3/s, only fresh water remains in the river channel. Equation (21) describes the exponential relationship between salinity difference and river discharge when Q < 23 m3/s:
Δ S S W = 34 . 19     0 . 07 × Q 1.98
Following the above analysis, a sensitivity analysis method was applied to correlate the assessed net energy production (Enet) with the Strymon River salinity difference during salt-wedge intrusion (ΔSSW). The energy model estimates the net energy production in relation to various salinity difference ranges, from 0 to 34.19 g/L.

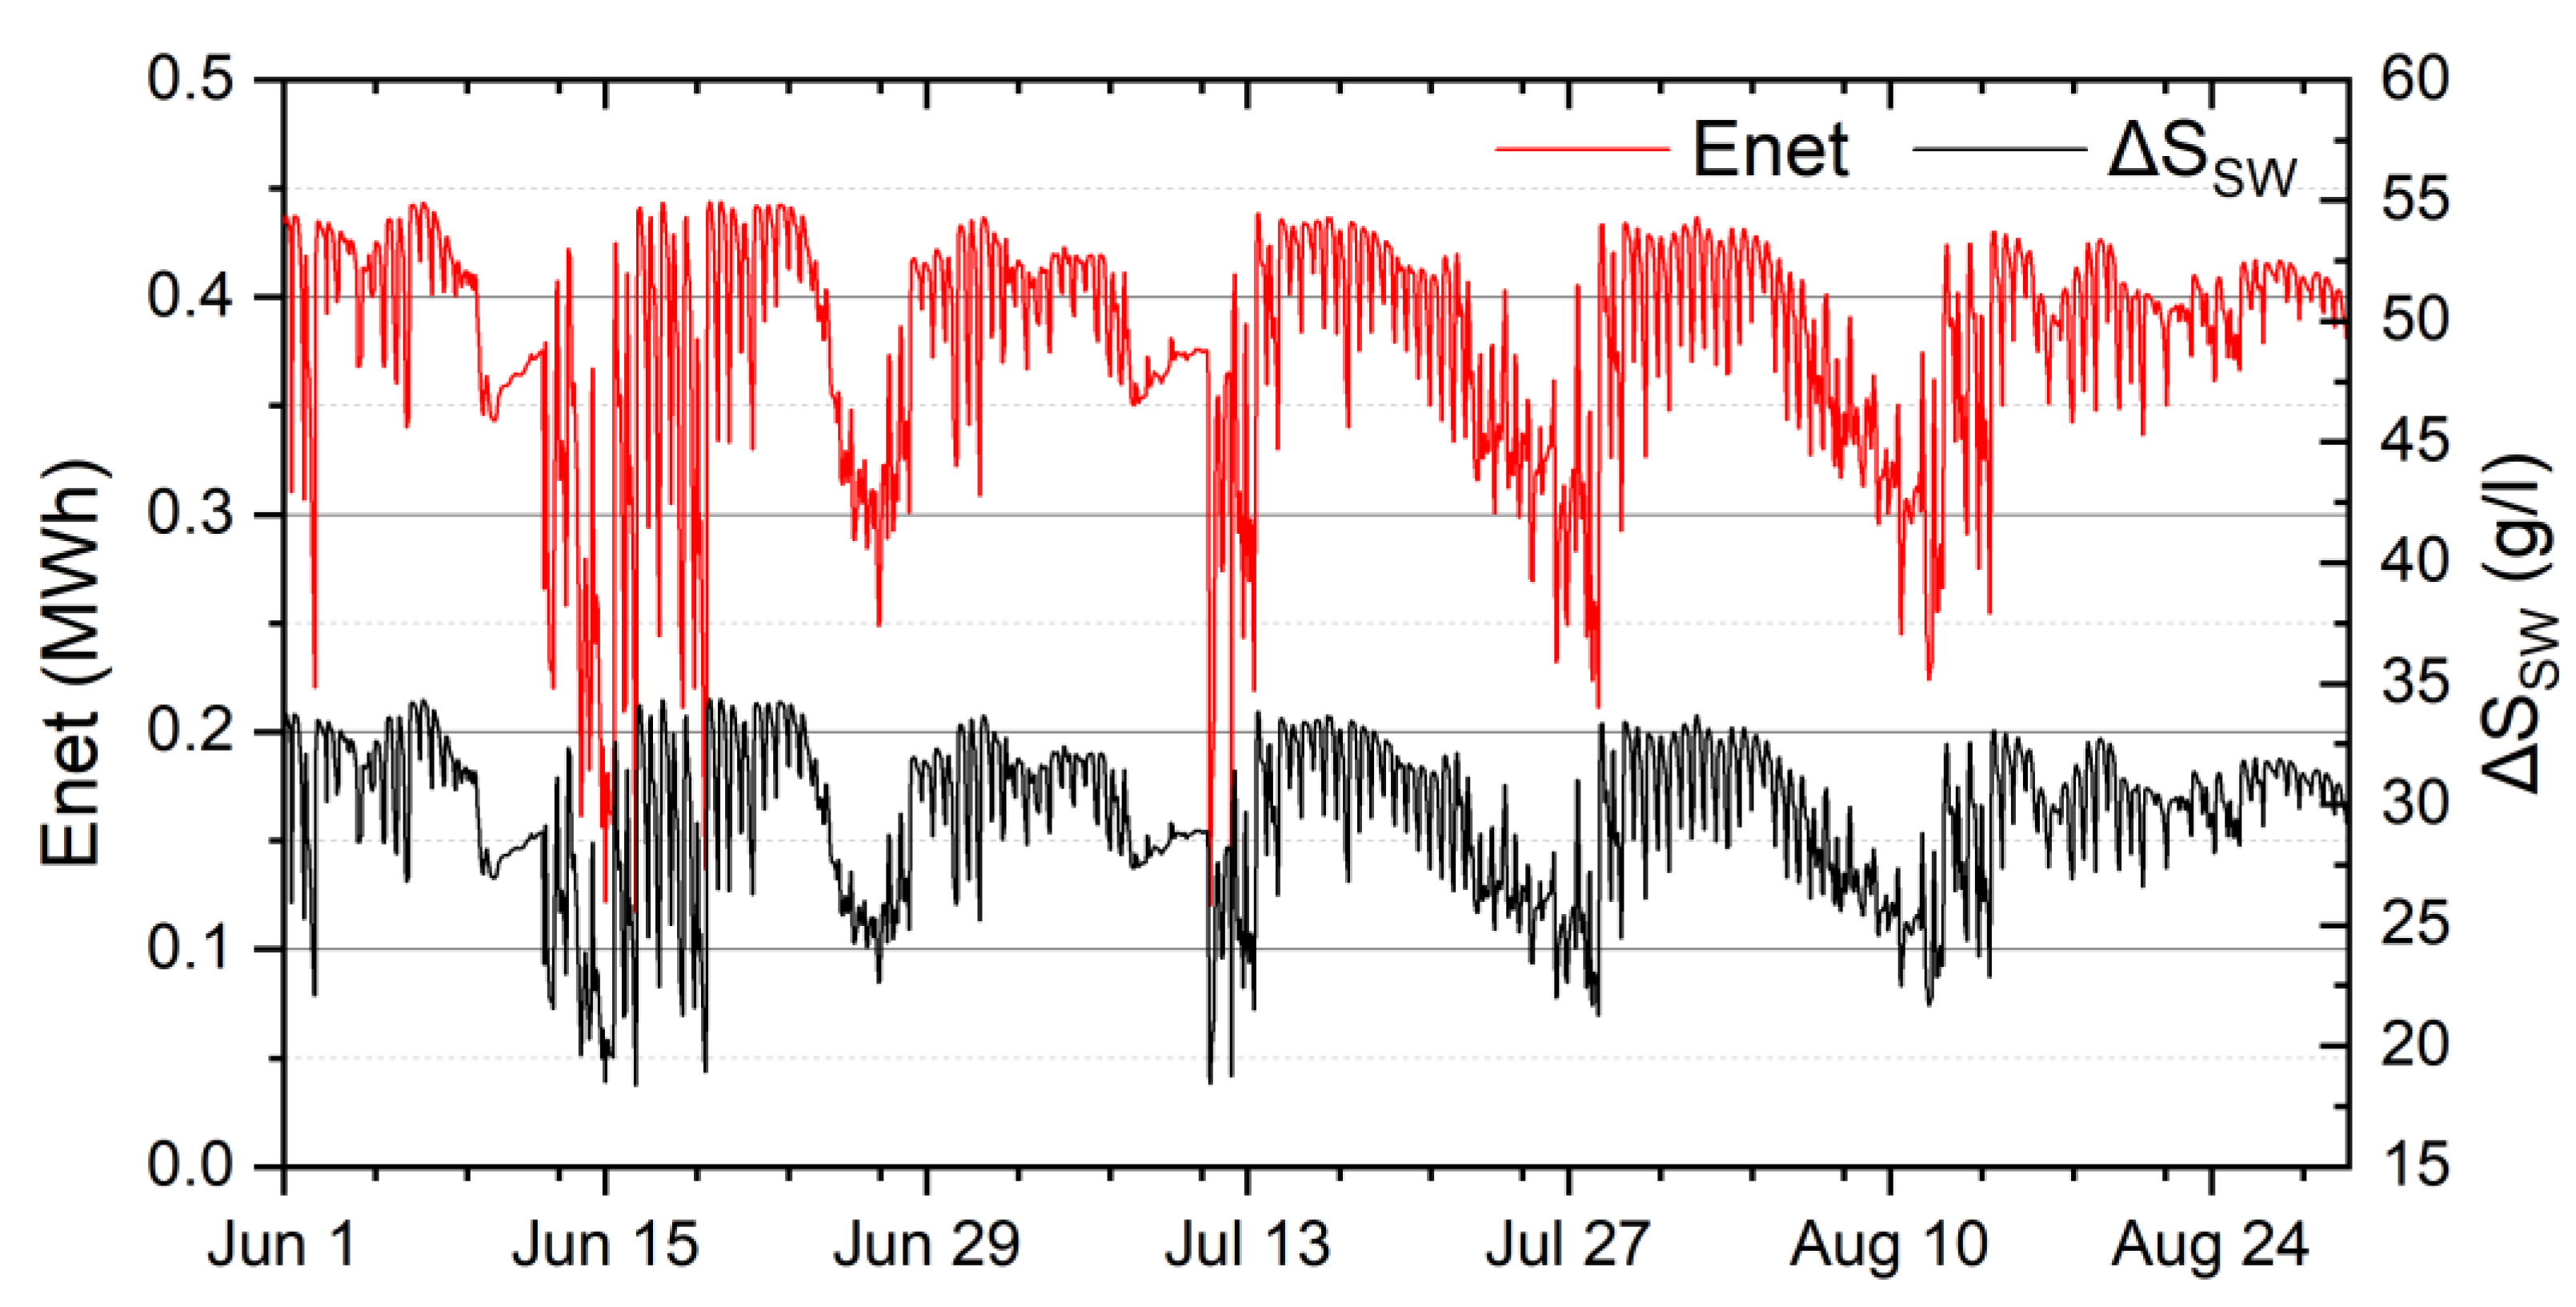
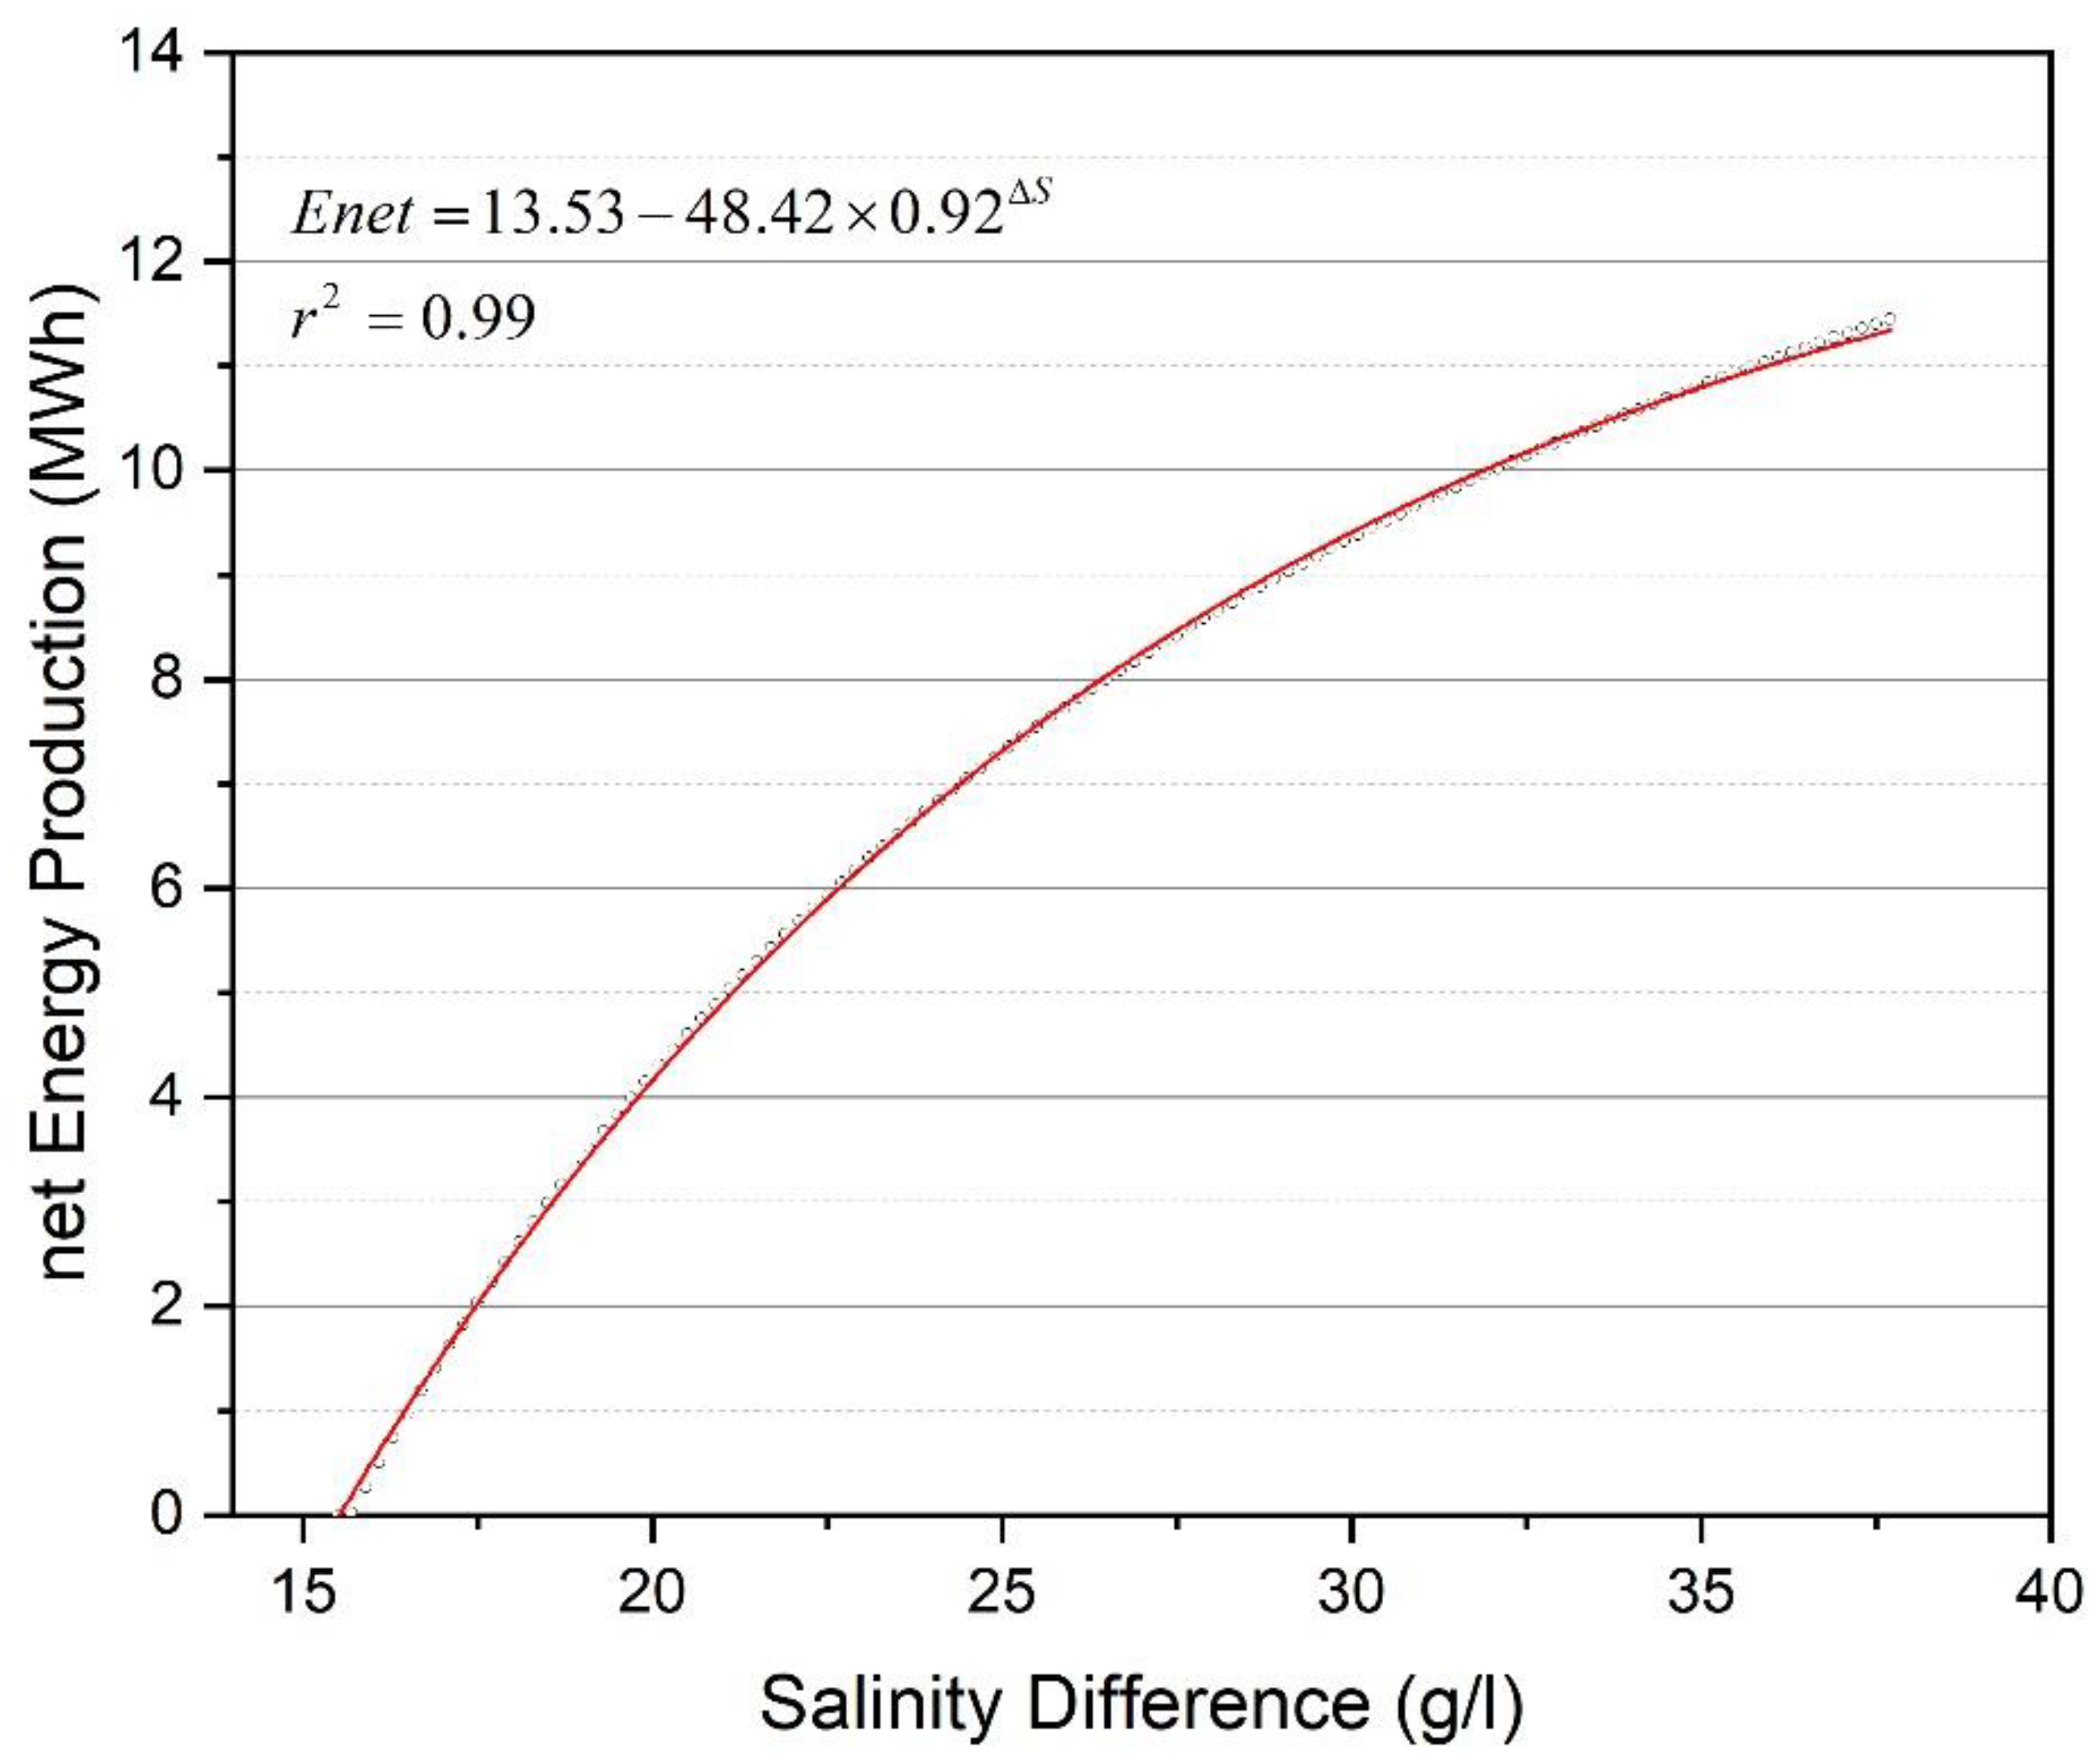
3.2.2. ΔSSW vs. Net Energy Production

Figure 6 illustrates that the net energy production is significantly related, in a non-linear manner, to the salinity difference (r2 = 0.99). Based on this analysis, it is evident that the power plant produces electricity only when the salinity difference (ΔSSW) is higher than 15.4 g/L. As the maximum salinity difference in the Strymon River is around 35 g/L, the maximum net energy production is about 10.80 MWh/day.
The correlation between net energy production and salinity difference is given in Equation (22) for ΔSSW > 15.4 g/L.
E n e t = 13.53 48.42 × 0.92 ( Δ S S W )
According to the correlations described above (Q vs. ΔSSW and ΔSSW vs. Enet), a new, direct relationship is formed between river discharge (Q) and the net energy production (Enet), valid for Q values ranging from 0 to 16 m3/s.
Figure 7 presents this direct correlation between the PRO power plant’s net energy production and the Strymon River discharge (r2 = 0.99). High energy production (more than 10 MWh/day) occurs under low river discharge (<5.6 m3/s). The energy production diminishes when river discharge is higher than 15 m3/s because the salt wedge is flushed out of the estuary. Equation (23) gives the net energy production in relation to Strymon River discharge for Q < 16 m3/s.
E n e t = 10 . 97 0 . 27 × exp ( 0.23 × Q )

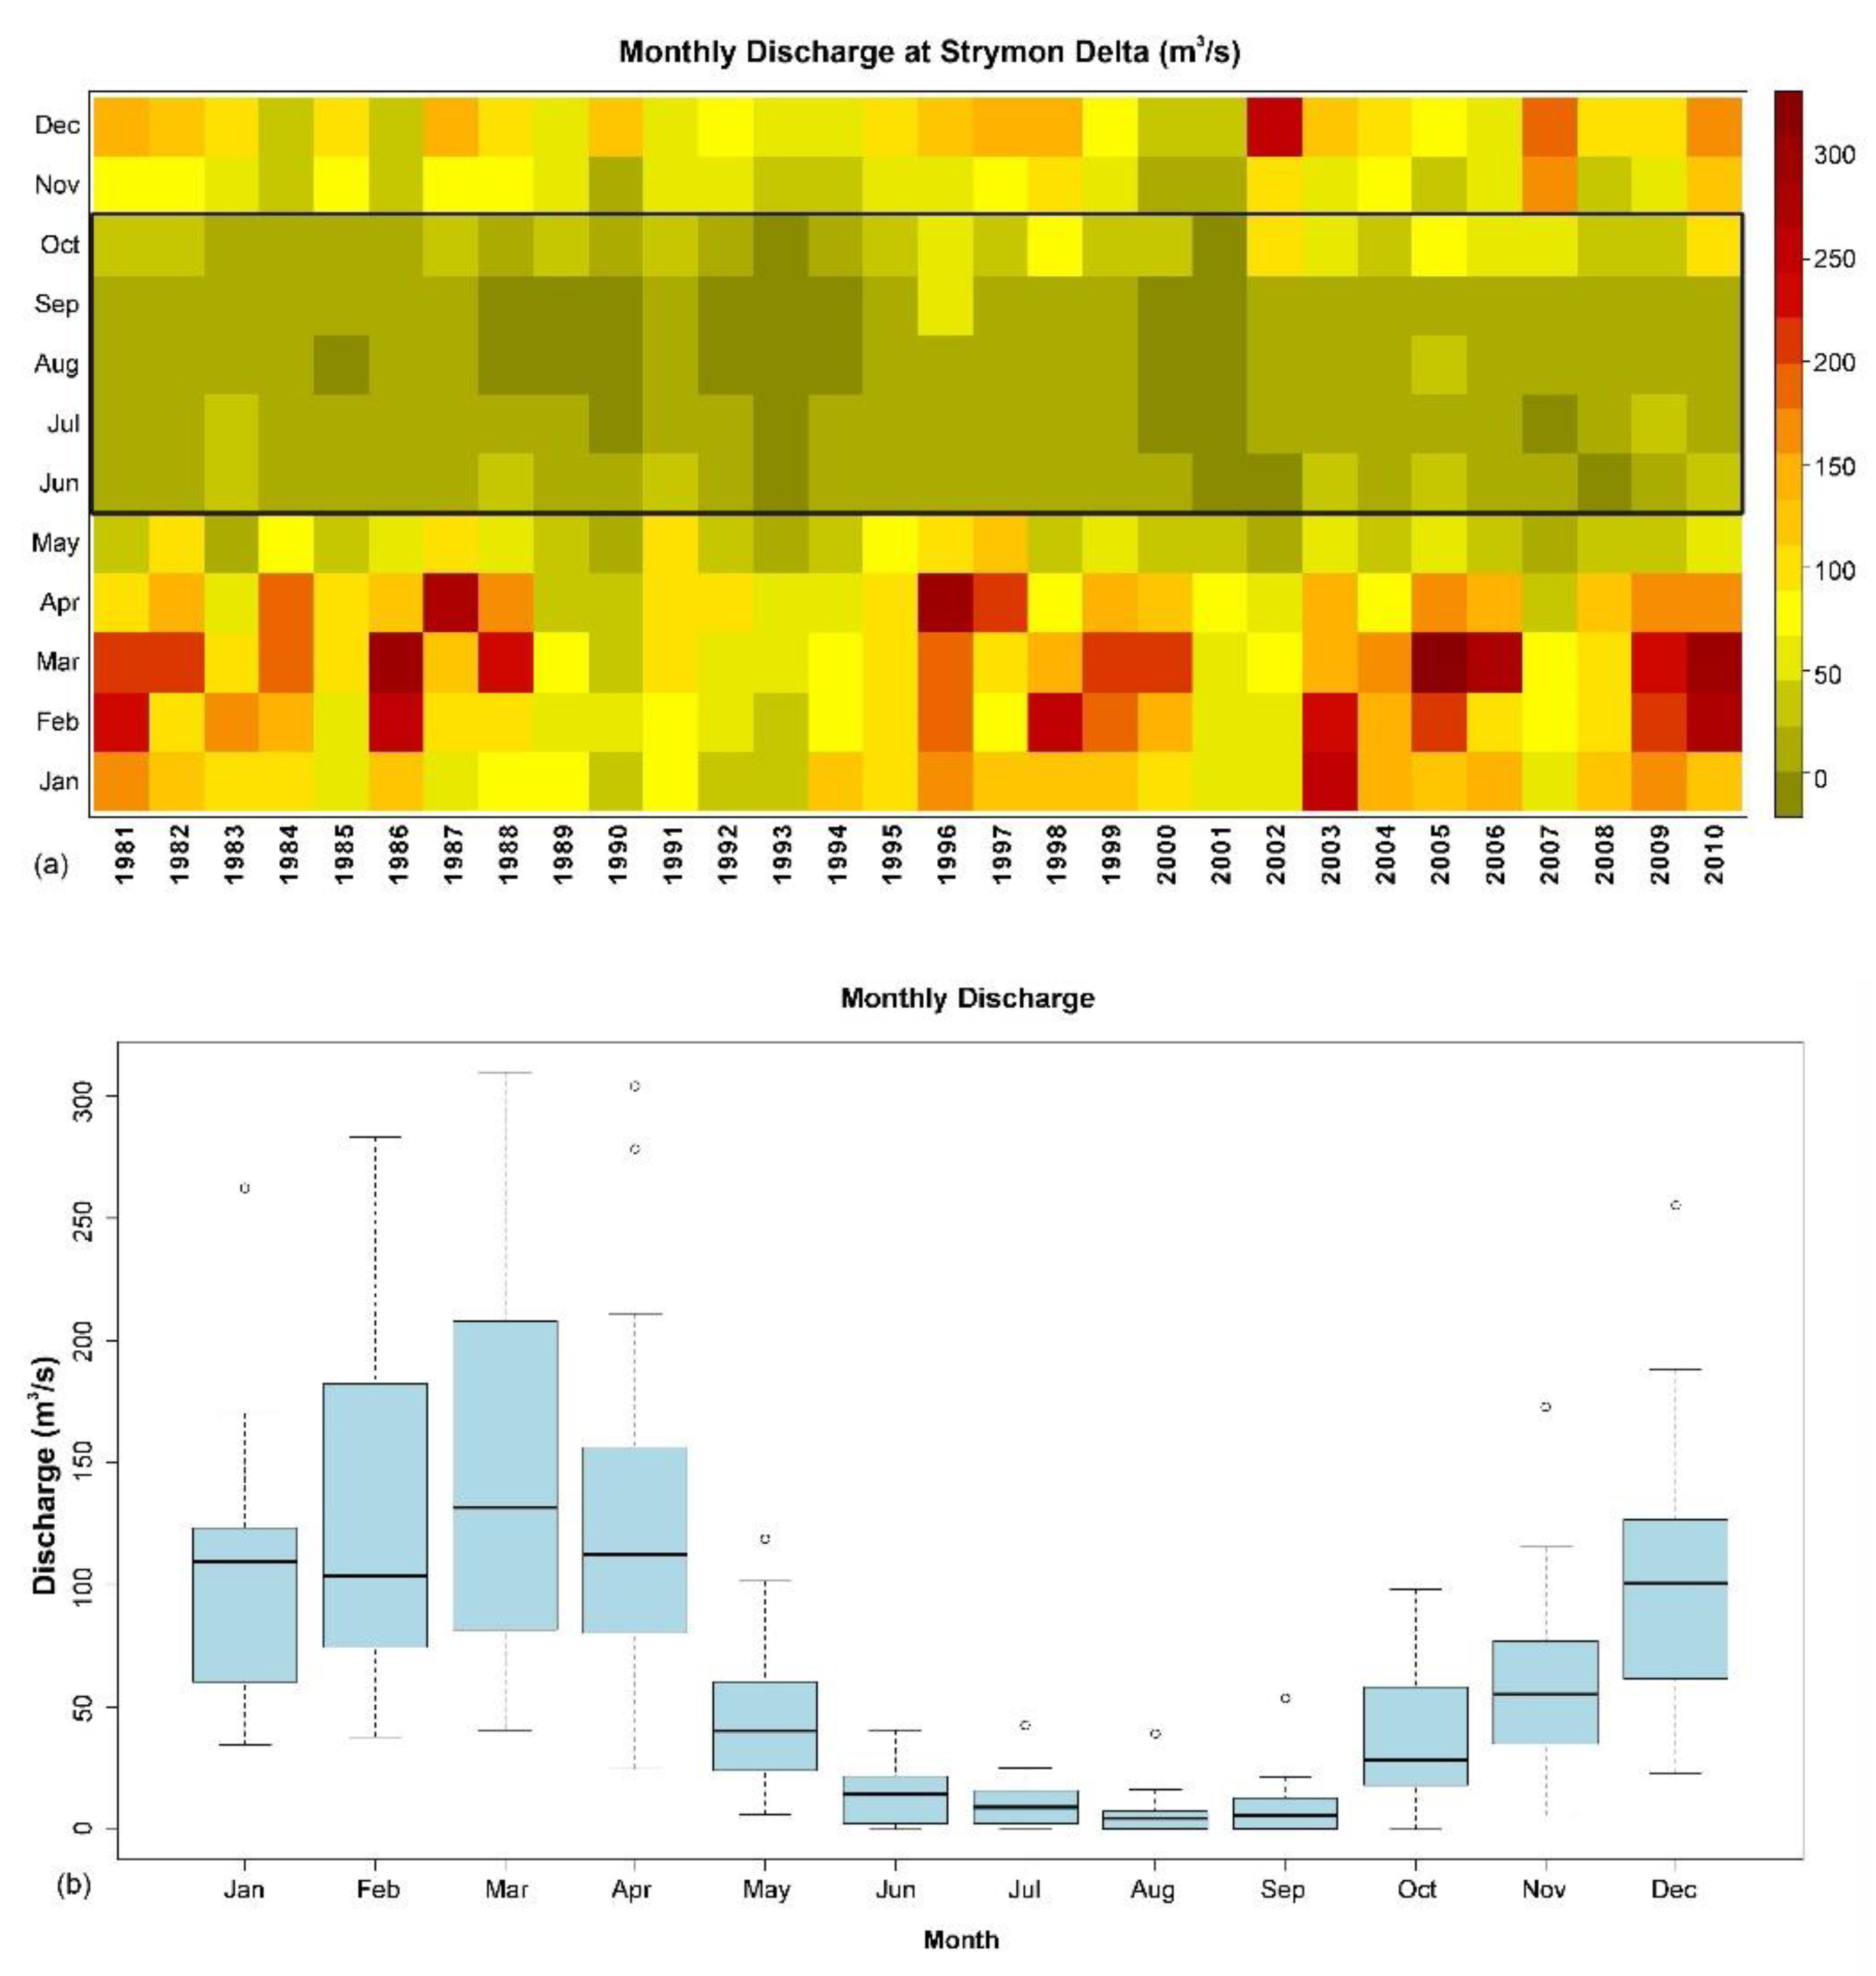
3.3. Historical Flow Rate Analysis

The results of a retrospective statistical analysis of the daily-mean Strymon River discharge data are presented in this section. The historical analysis covers a period of 30 years (from 1981 to 2010), and the data were retrieved from the Swedish hydrologic model (HYPEweb, SMHI). According to this model, the Strymon River flow in the lower watershed ranges from 200 m3/s to almost 0. High river discharge appears in winter (November to February), with higher values occurring in March and April. In March, the river discharge ranges from 80 to 160 m3/s, with the most frequent value being 140 m3/s. The river flow decreases significantly from May to September, reaching values lower than 20 m3/s. As explained in previous sections, at river flow levels lower than 15 m3/s, seawater intrusion upstream in the river channel is favored, resulting in salt-wedge formation (Figure 8).
Figure 9 exhibits the average number of days per month during which low river discharge (below 15 m3/s) was reported within the 1981 to 2010 period. On average, low river flow rates are mainly observed in August (on average, 28 days), September (26 days), July (25 days) and June (19 days). Moreover, in July, August and September, river flow diminishes below 10 m3/s, representing the establishment of the stationary salt wedge along the river for more than a month.

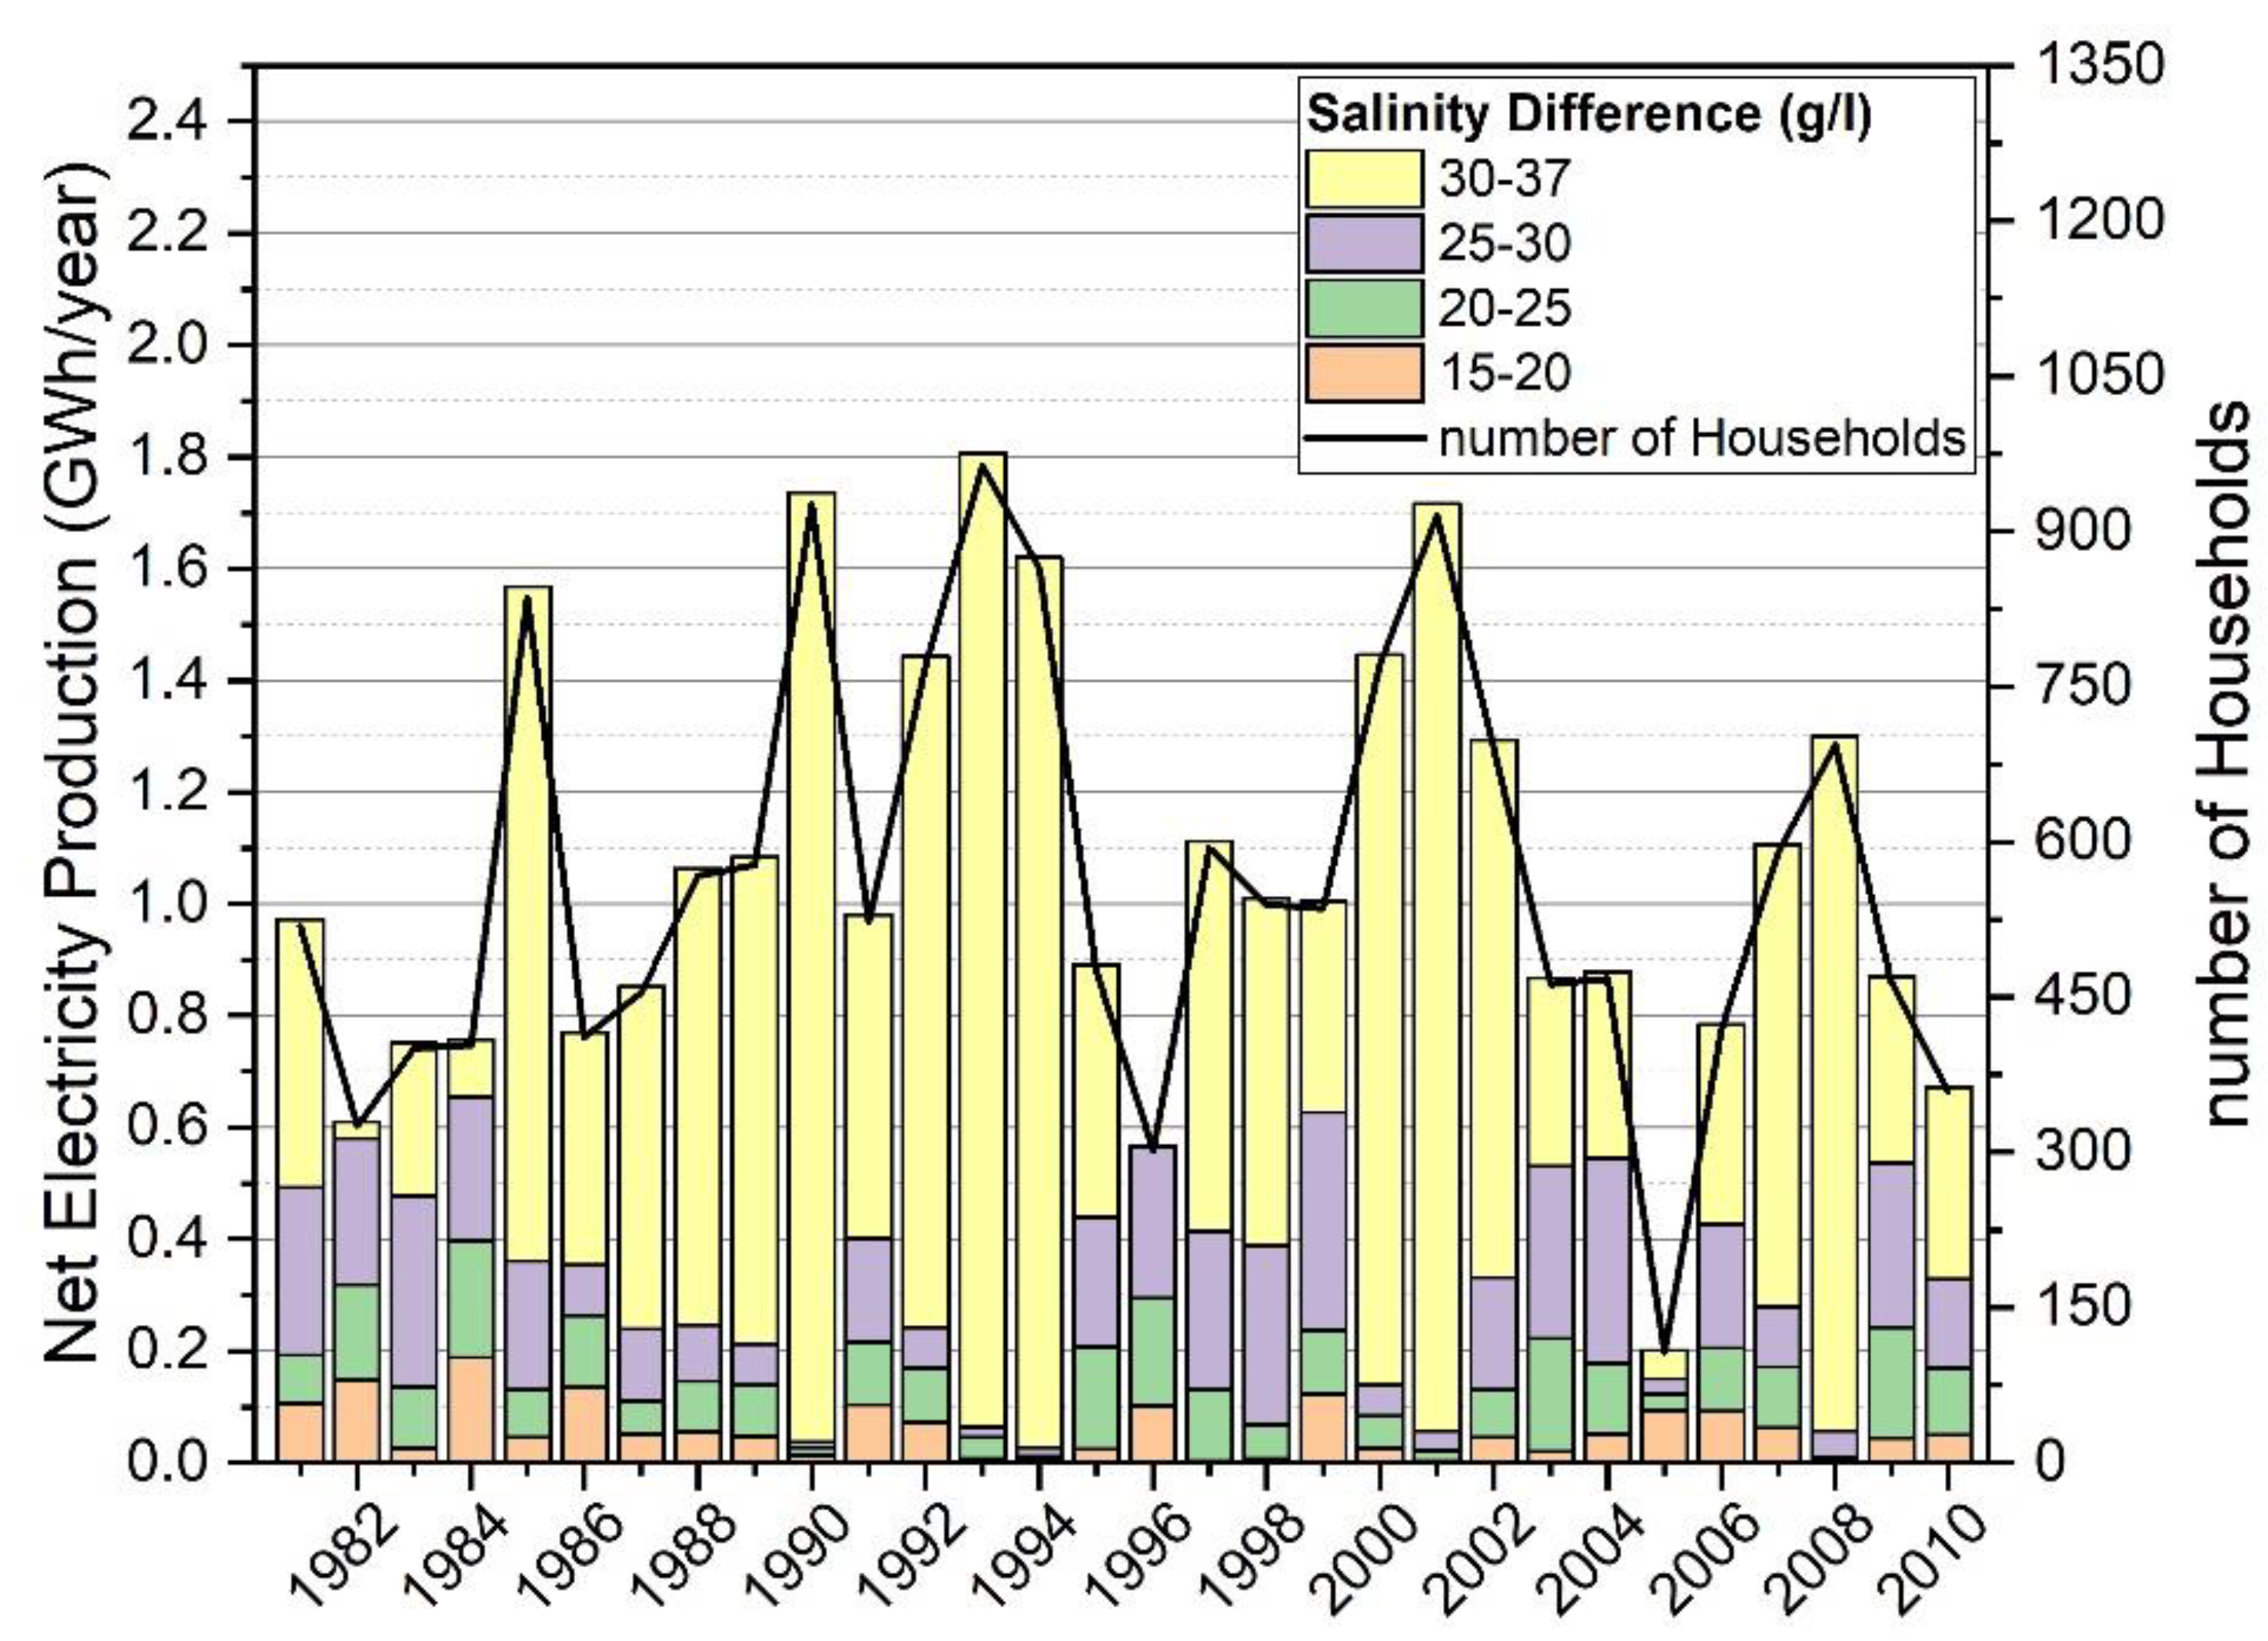
3.4. Annual PRO Energy Power Assessment Using Historical River Discharge

The daily PRO energy production was estimated utilizing the daily-mean historic river discharge data by applying Equation (23). The daily Enet was calculated for the low discharge days, when a salt wedge occurs. The annual estimation of PRO power production was limited to the period from May to October (~6 months). Results illustrate that the energy production varies from year to year, depending on river hydrology. The 30-year average electricity production harvested from the salt wedge during its upstream intrusion is estimated at around 1.06 GWh/year. Fifteen out of thirty years show higher than average annual energy production, with the highest energy production being assessed in 1993 (1.80 GWh/year). In 1985, 1990, 1992, 1993, 1994, 2000, 2001, 2002 and 2008, more than 120 days with low discharge (less than 5 m3/s) occur, and the system operates with very high efficiency, producing a significant amount of energy (exceeding 1.20 GWh/year). On the other hand, in 2005, high river discharge prohibits salt-wedge entry, resulting in very low salinity difference (ΔSsw) and low PRO energy production (0.20 GWh/year). Furthermore, in 1996, there is an absence of very low discharge days, so the PRO plant does not harvest energy with the maximum feasible salinity difference (30–37 g/L) and produces energy with lower ΔSsw levels.
Considering that the annual electricity needs of an average Greek household are approximately 3.75 MWh/year, we assume that the May to October electricity consumption is about 1875 kWh. The SGE PRO power plant can provide electricity, on average, for more than 564 households, and in the most productive years, such as 1985, 1992, 1993, 1994, 2000, 2001, 2007 and 2008, to more than 500 houses (Figure 10).

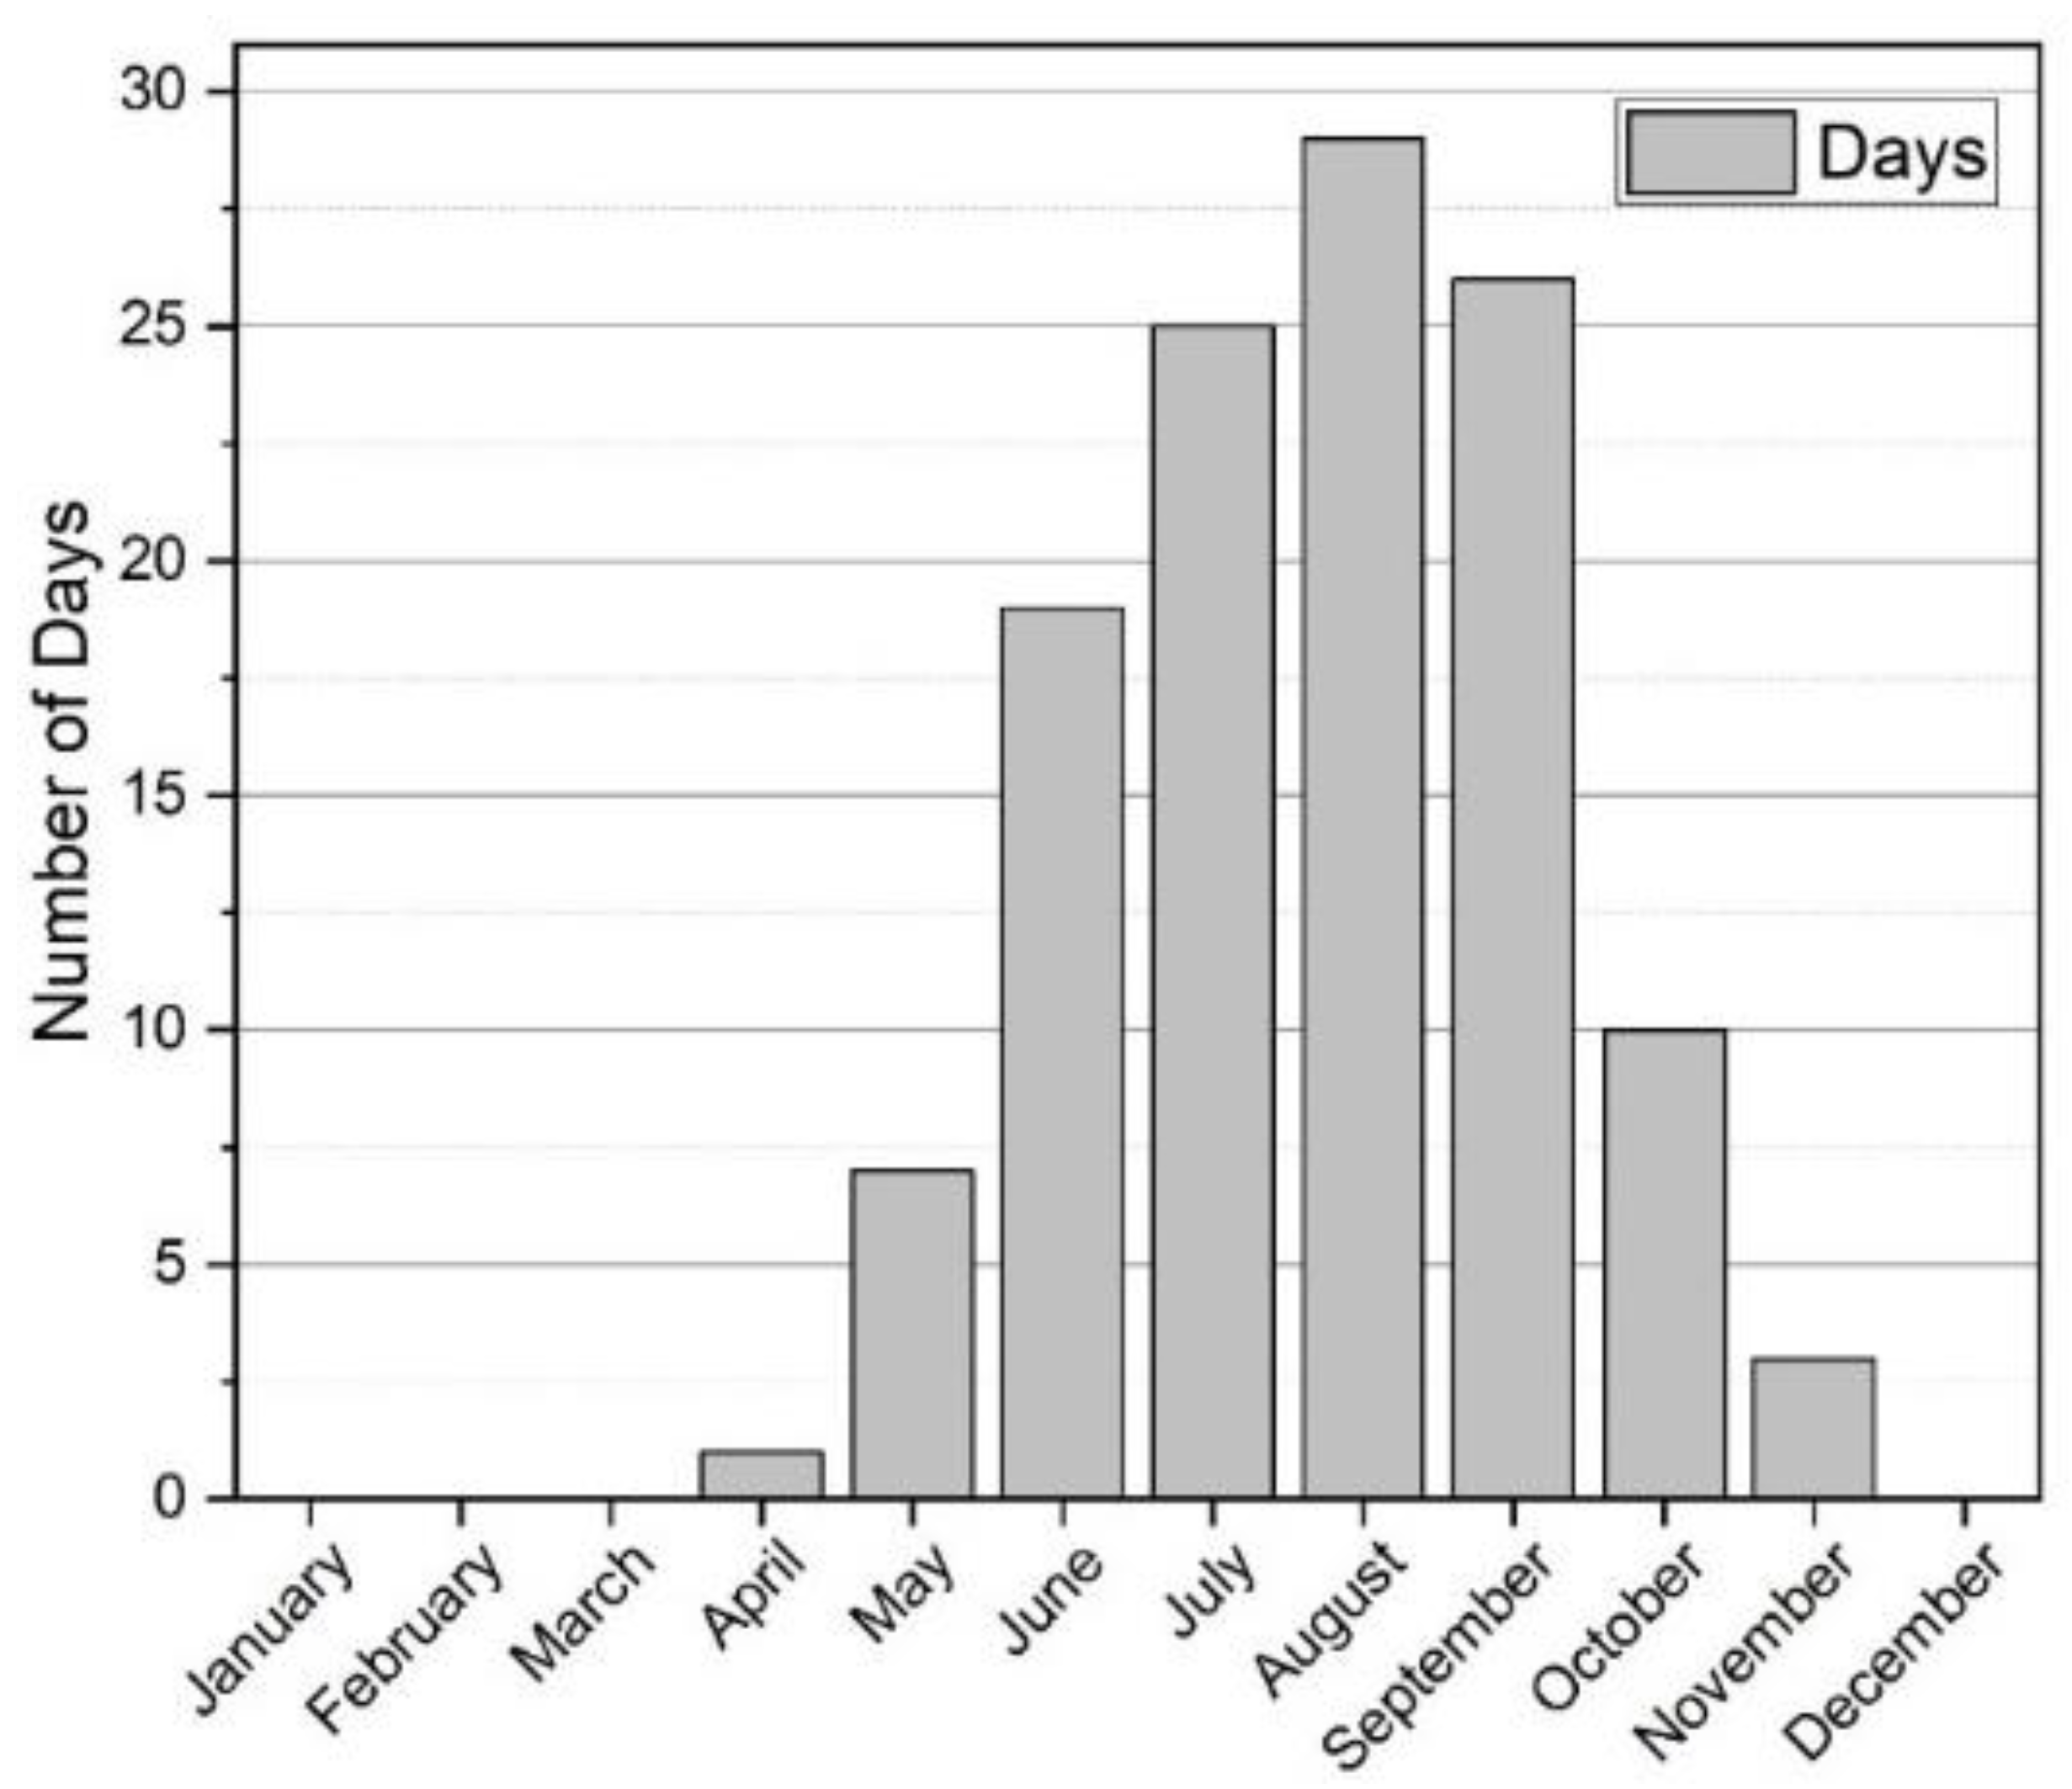
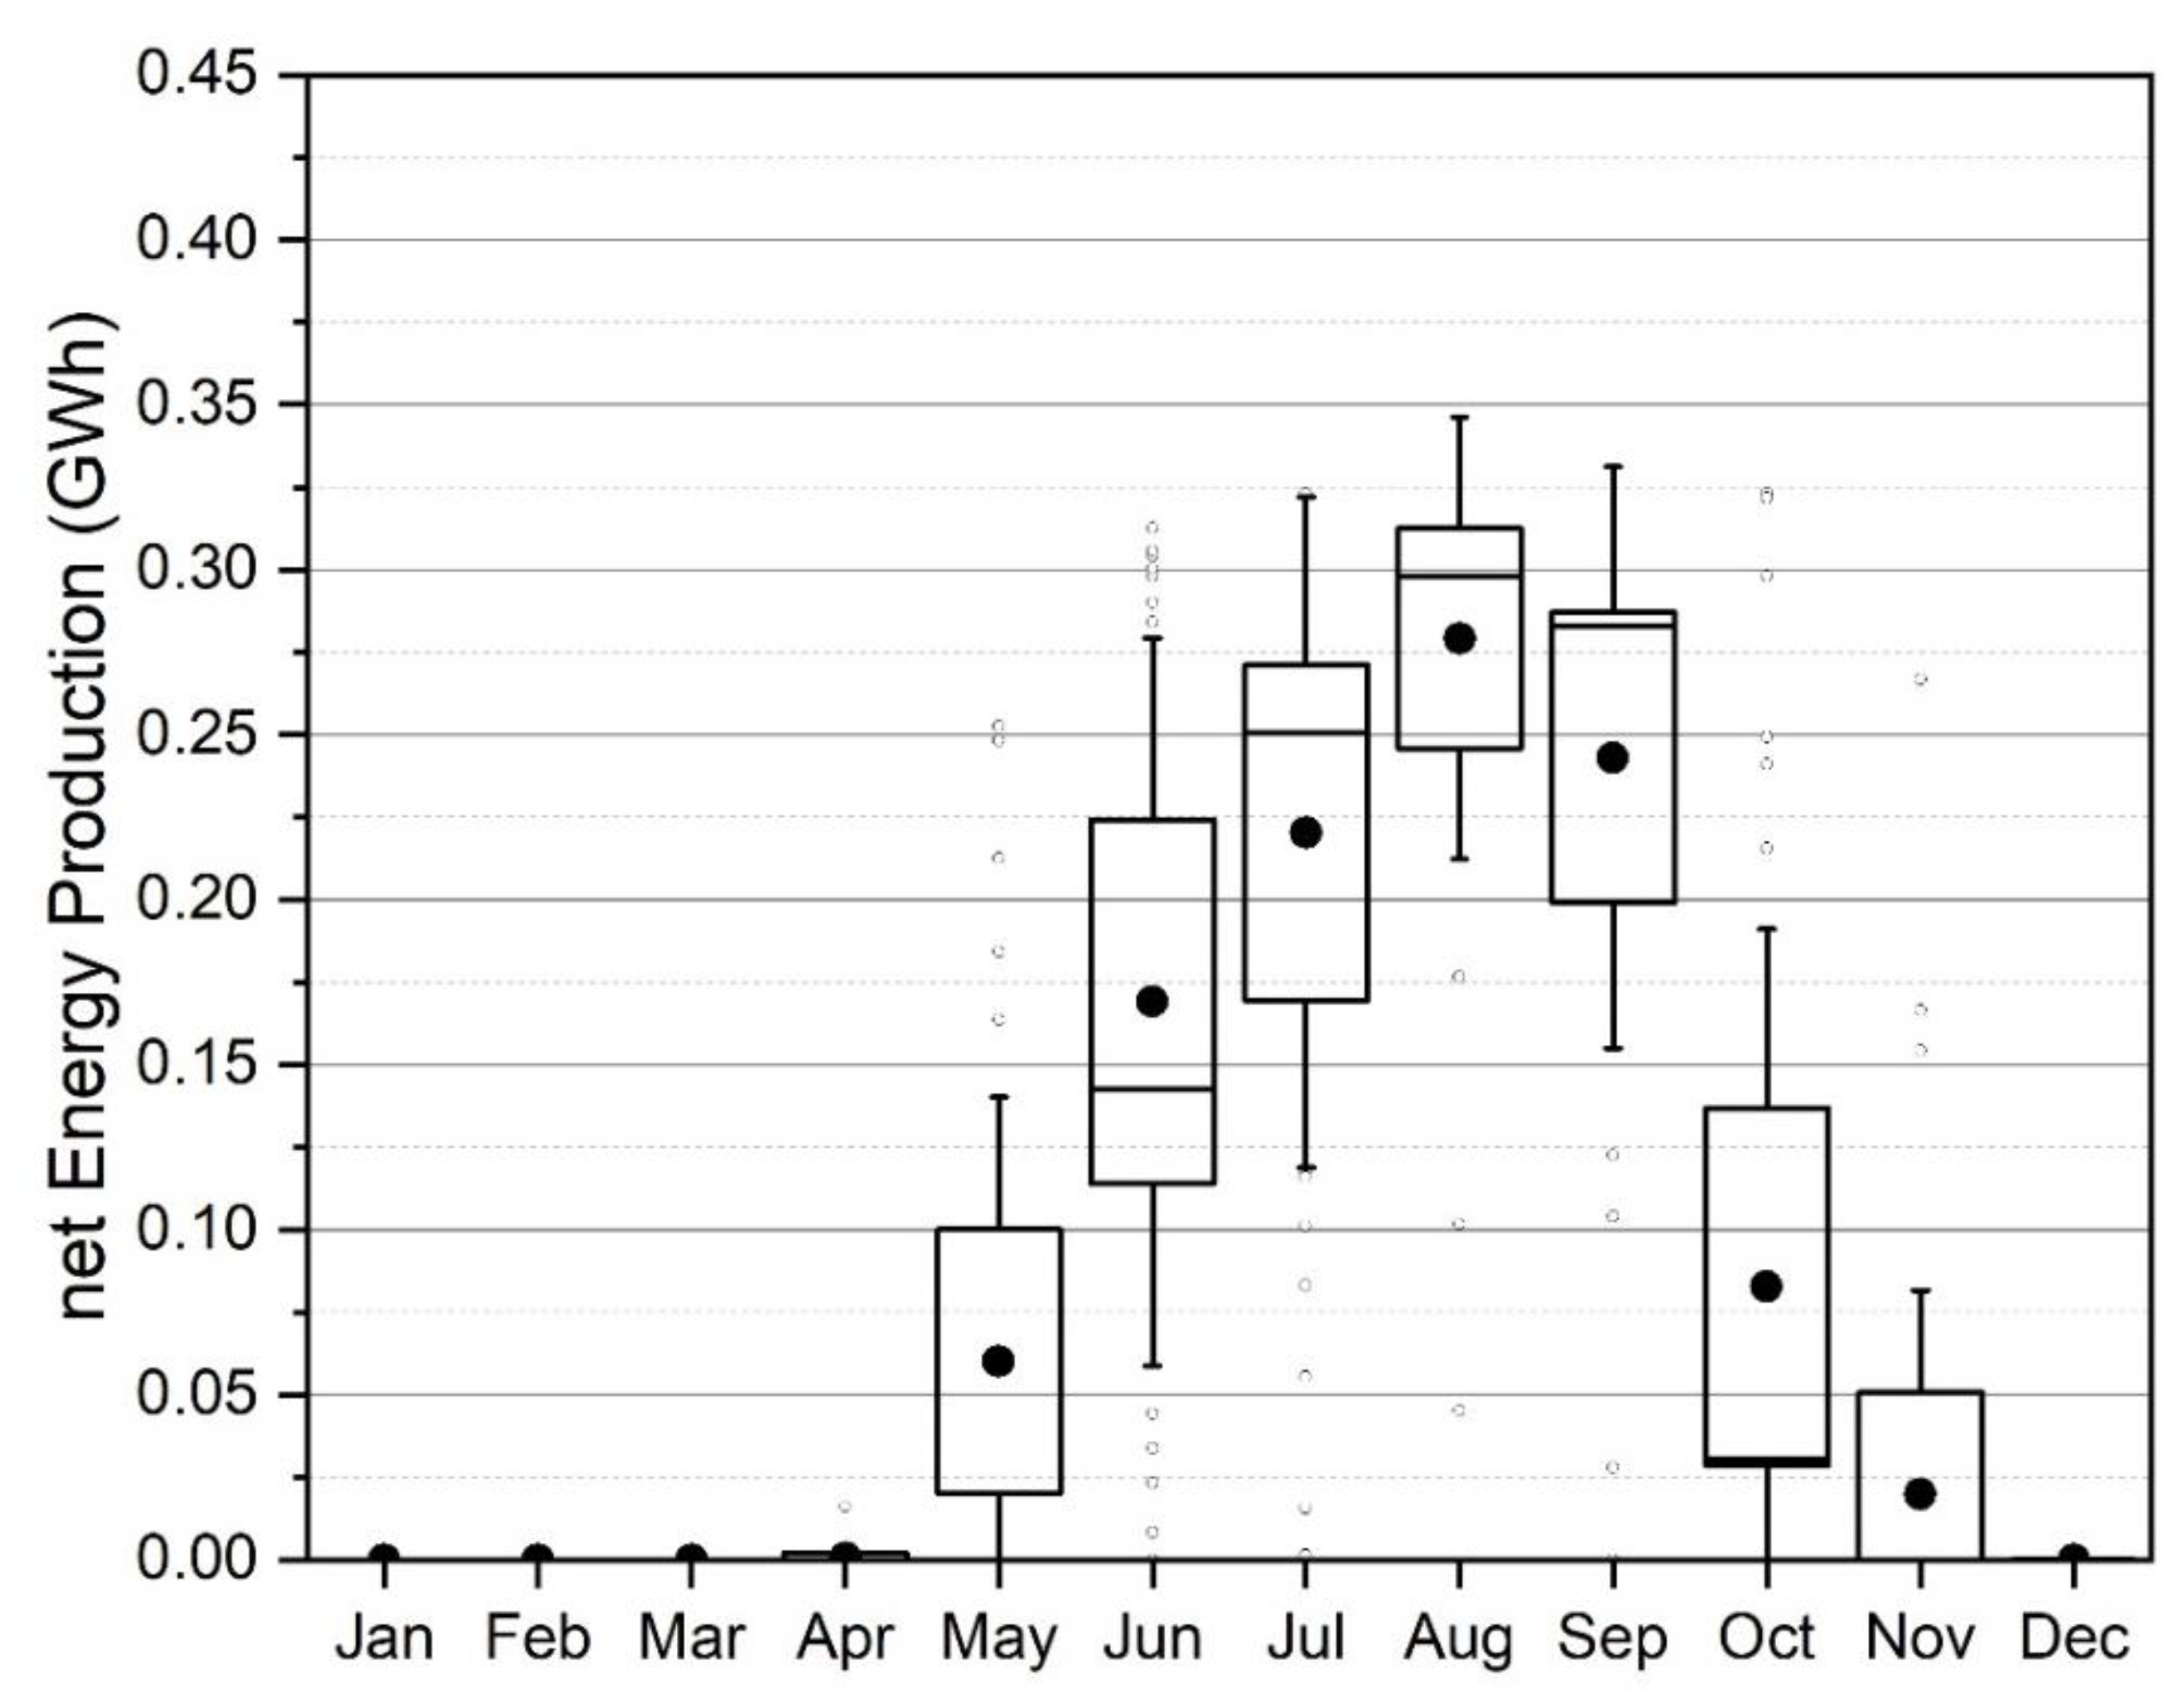
3.5. Assessment of Intra-Annual PRO Energy Power of Strymon River

The monthly variation in energy production (Enet) for the years 1981 to 2010 is presented in Figure 11. The PRO power unit can produce energy for 7 consecutive months (May to November), depending on the annual river hydrology (wet vs. dry years). The most productive days are in summer (June to August). In June, the daily-mean Enet ranged from almost 0 (in 2004 and 2005) to 0.33 GWh (in 1981, 1985, 1992, 1993, 1994, 2000, 2001, 2002 and 2008), and the monthly-averaged Enet production was 0.17 GWh. In July, the mean-monthly Enet increased to 0.22 GWh, whereas the median value was 0.25 GWh. High energy production (over 0.25 GWh) was reported in 16 out of 30 years (1990, 1993, 1994, 2000, 2001, 2007 and 2008), with maximum annual production of 0.32 GWh. August was the most productive month, with mean-monthly Enet of 0.28 GWh and 90% of the records over 0.20 GWh. The maximum Enet (0.35 GWh) was produced in 50% of the total records (1985, 1988, 1989, 1990, 1992, 1993, 1994, 1995, 1998, 1999, 2000, 2001, 2003 and 2008). September was the second most productive PRO energy month, with an average Enet of 0.24 GWh and a median value of 0.28 GWh. The energy production varied through the years, but Enet over 0.20 GWh was noted in 76.6% of the records. Only in 1984, 1996, and 2005 was the Enet estimated to be lower than 0.10 GWh. Finally, in May, October and November, high Enet variation was recorded through the 30 years analysis. The average Enet was estimated around 0.06 GWh in May, 0.08 GWh in October and 0.25 GWh in November.

4. Discussion

4.1. Assessment of Mediterranean Rivers SGE

Several theoretical studies have been conducted in recent decades to assess the SGE potential of river estuaries, exploiting the salinity difference between sea water and river water. Alvarez-Silva et al. [48] estimated that the highest technically available energy potential occurs in the estuaries of the Congo, La Plata, Nile and Ebro rivers. Additionally, moderate to low technically available energy potential was also assessed for the Mediterranean rivers, such as the Po and Strymon rivers. Based on annual mean discharge, a worldwide assessment of the theoretical and technical SGE in more than 30 river mouths is presented by Alvarez-Silva et al. in [49] and Alvarez-Silva in [50]. Furthermore, Saki et al. [51] estimated the potential of PRO power for different Turkish river estuaries, considering the variability in annual river discharge. Moreover, Sharma et al. [52] investigated theoretical and technical potential for power production in the Hooghly estuary, highlighting the SGE efficiency in the river–estuarine system and the coastal–estuarine system. The salinity stratification in river estuary systems and salt-wedge formation upstream in rivers must be considered in order to achieve the maximum possible salinity difference [48,53]. The above assessments focused on mixing river fresh water with saline sea water pumped from a nearshore intake point, thus operating over the entire year. On the other hand, in the present study, we examined SGE for two following scenarios: (a) the optimal energy production scenario, operating throughout the year by mixing salt water from the sea (38.1 g/L) and fresh water (0.1 g/L) from a point upstream in the river and (b) seasonal operation of the osmotic power plant, utilizing the salinity difference of the salt wedge.
Table 3 was developed to summarize the theoretical potential and technical SGE, together with the net energy produced by a 1 MW power plant in the Mediterranean river estuaries with the highest potential. Energy data are given along with their tidal range, river flow and salinity difference. The salinity difference was estimated using data from the bottom layer of the estuary cell retrieved from the Copernicus Marine Environmental System (CMEMS) and fresh water of ~0.1 g/L. The Enet assessment for a 1 MW PRO unit was derived using Equation (22). Based on this analysis, the Strymon River Estuary may produce a net SGE of 4.15 GWh/yr through a 1 MW PRO plant.

4.2. Strymon River Estuary SGE Assessment

An innovative method of harvesting energy from the salinity difference induced by salt-wedge formation in the Strymon River lower channel was examined in this study. The presented approach has several novel elements in terms of the coupling of the hydrodynamic with the PRO energy model; the inter-relation between river flow, salinity difference and PRO energy production; and the use of historic river flow for a 30-year retrospective power assessment. In addition, no comprehensive study has been carried out in Greece assessing the SGE potential of a river and analyzing a PRO pilot plant’s theoretical performance adapted to the estuarine hydrologic and hydrodynamic characteristics. The implementation of such a system in the Strymon River Estuary could benefit the local community, either by reinforcing the local electricity network during the summer months, when energy consumption increases due to the rise in touristic activity, or by controlling the salt-wedge intrusion upstream of the river mouth, protecting against salinization of adjacent groundwater resources.
A 1 MW Osmotic PRO-type power plant in the Strymon River Estuary was designed and modeled for the lower Strymon River. Our research focused on the feasibility of electricity production harvesting from the salinity difference between the river water and the salt wedge. The lower the river discharge, the longer the salt-wedge intrusion and the higher the water column stratification along the lower channel [23,24]. In parallel, as the salinity difference increases, so does the net energy produced by the PRO power plant. In sizing a power plant, the decrease in salinity difference is directly related to increased required volume of sea and river water inflow in the unit. The fresh and saltwater requirements range from 0.7–2.8 m3/s, depending on the in-taken salinity difference. The fresh and saltwater requirements of the system in the Strymon River present similarities to those of the 1 MW osmotic power plant designed in the Bahmanshir River (Qfr: 0.62 m3/s; Qs: 1.2 m3/s) and Zohreh River (Qfr: 0.59 m3/s; Qs: 1.18 m3/s) in Iran, pumping fresh water from the rivers and salt water from the Persian Gulf [41].
The Strymon osmotic power plant, under optimal functionality and annual non-stop operation, produces a similar amount of energy to that estimated for the Zohreh River osmotic power plant (around 8.76 GWh/year) and the pretreatment facility of STP Houtrust (approximately 8.9 GWh/year) [44]. The efficiency of the Strymon system (47.3%) is close to that of the Zohreh River (46.8%) and STP Houtrust (40.0%) systems and slightly lower than that of the Bahmanshir River system (54.4%). Still, the efficiency of the PRO power unit’s seasonal operation is reduced significantly due to the variation in salinity difference. Higher efficiency is recorded in July, August and September, but there are days with low electricity production even in those months. Ideally, the power plant should operate continuously, either pumping salt water from the river mouth or pumping salt water from an offshore point in the Strymonikos Gulf. Offshore pumping will safeguard the system’s salinity difference, maintaining levels in excess of 30 g/L, thus ensuring high rates of productivity, making the power plant competitive compared to other renewable energy resources.
Understanding salt-wedge hydrodynamics is crucial for the net energy estimation and the efficiency assessment of the plant. In Figure 12, a sensitivity analysis of the intake water needs and the system efficiency, according to salinity difference, is presented. This analysis was accomplished considering the power plant capacity as constant. The efficiency of the power plant is relevant to the salinity difference. When the salinity difference is reduced, the electricity production and the power plant’s efficiency are also reduced. Electricity production is stabilized when the volumes of fresh and salt water inflowing to the power plant are increased. In that case, the plant efficiency is decreased dramatically due to the increase in energy losses in the transmission and generation system (up to 34%), the pretreatment system (up to 7%), and the intake and outfall system (up to 2%).
According to Ansari and Abbaspour [41], most of the PRO osmotic power plant’s total capital costs are related to intake and outfall systems, as well as the pretreatment system. Short intake and outfall systems decrease the power plant’s total capital costs. The Strymon River PRO power plant is positioned close to the lower channel reaches, thus reducing sea and freshwater pumping and intake costs, reducing the capital costs of the intake and outfall systems by approximately 7% compared to the Zohreh power plant. The estimated total capital cost was assessed as approximately EUR 15 million.

4.3. Social–Environmental Impact of SGE Use

The seasonal electricity demand in EU countries follows a specific pattern. Northern EU countries exhibit daily energy demand with a clear winter peak, but in southern EU countries (Greece, Spain, Italy and Portugal), this pattern changes due to additional energy demand during the summer months [54]. This summer peak in energy demand mainly results from extended air-conditioning use (due to the higher air temperature), combined with increased tourism activity, especially in the coastal regions [55]. According to the Greek Independent Power Transmitting Operator, the national-level electrical energy demand from 2002 to 2015 presents a significant peak from June to September (data source: https://www.admie.gr/en/market/reports, accessed on 11 May 2021). Historical data at the local level are not easily accessible, but the available regional data typically present an energy demand pattern similar to that of national-level data. The installation and operation of a PRO power plant harvesting energy from the salt wedge could counterbalance the increased summer energy demand of local touristic settlements (Figure 13). With the PRO plant operating throughout the year, the annual electricity demand of approximately 1106 households could be covered. Under seasonal operation, harvesting SGE from the salt wedge, approximately 560 households could be served.
The installation of a 1 MW PRO power plant in the lower Strymon River could benefit the local community in several ways: (a) environmentally-friendly, decentralized electricity production with low CO2 emissions, reinforcing the local electricity grid, especially during summer months when demand is higher; and (b) exerting control on salt-wedge intrusion upstream of the river mouth, thus protecting against salinization of adjacent groundwater resources.

5. Conclusions

In this study, we focused on regional electrical network reinforcement, especially during summer months, when electricity demand increases due to the hot Mediterranean climate and increased tourism activity in the Strymonikos Gulf coastal zone.
The installation of a 1 MW PRO power plant is a breakthrough project, as limited studies have assessed energy harvesting from the main bulk of a salt wedge. Two scenarios were investigated to define the ideal power plant location along the lower Strymon River Estuary. In the first scenario, the power plant operates continuously, producing 4.15 GW/year, covering the annual electricity needs of approximately 1106 households. In this case, 0.6 m3/s of fresh water (0.1 g/L) from the upper river layer and 1.3 m3/s of salt water (38.1 g/L) from a deep point in the Strymonikos Gulf are pumped to the plant. In the second scenario, the PRO power plant operates only during the summer months, extracting energy from the seasonally formed, well-stratified salt wedge. In dry years, the seasonal energy production is estimated to be more than 1.5 GWh/year, covering the needs of approximately 800 households for the operation season. This innovative approach of harvesting SGE from the salt wedge is expected to benefit the local community in multiple ways. Firstly, the regional grid’s reinforcement and stabilization in summer is essential; furthermore, limitation of salt-wedge intrusion could resolve the chronic problem of groundwater salinization.
Comparing the two scenarios, higher efficiency (up to 47.3%) of the power plant is achieved when the system operates in non-stop mode, pumping sea water (around 38 g/L) from the open sea of the Strymonikos Gulf and fresh water (0.1 g/L) from the river’s surface. In the second scenario, the efficiency of the power plant is significantly lower and varies in according to salt-wedge formation. During low river discharge and in spring tidal phases, a high volume of sea water enters the river, increasing the salt wedge’s salinity (up to 36 g/L), and the efficiency of the plant is estimated at 44.5%. On the other hand, the salt wedge retreats because the river discharge increases, and the salinity difference reduces, leading to lower system efficiency.
Compared to other renewable energy sources (RES), the advantage of SGE include the availability as a source and the reliable forecast of the annual energy production, especially when the energy model is coupled with an operational hydrodynamic model. In full operation mode, the efficiency of the SGE plant is about 47.3%, whereas the efficiency of wind turbines ranges between 24 and 54%, that of hydro power plants is over 90% and that of solar panels is around 4–22%. Although high efficiency is based mainly on the source availability, the high price of electricity due to the cost of membranes and the low energy density per membrane surface makes it, so far, non-competitive compared to other non-conventional forms of energy (SGE: 0.85 EUR/kWh, solar panel: 0.20 EUR/kWh, wind turbine: 0.06 EUR/kWh, hydropower plant: 0.05 EUR/kWh). According to IRENA estimates, within the next five years, the efficiency of the membranes will increase, and SGE technologies will be even more competitive compared to other RES [18].
The methodology applied in this study is also applicable to other estuaries where salt water and fresh water are in abundance; by generating a hydrodynamic model of the estuary system, the user can select the fresh and saltwater inflow points, and the net energy production can be estimated automatically. Salt-wedge estuaries are characterized by high salinity differences in a small area, minimizing the cost of the fresh and saltwater inflow system. Moreover, estuaries without a salt wedge could support an SGE pilot plant by receiving salt water from the open sea and fresh water from the river surface. In the future, this energy model should be validated and calibrated in real-time conditions using a small-scale power plant.
This promising technology of energy production is still under improvement. In the near future, higher power density in membrane systems and optimizations of intake and pretreatment systems will be achieved, reducing energy costs and making SGE more competitive compared to other RE technologies. Higher efficiency of power plants would also lead to higher electricity production. In a future study, a hybrid system using solar power could be designed. The use of the Sun as an additional power source may improve the PRO power plant efficiency by more than 20%, reducing energy losses from the water transmission.

Author Contributions

Conceptualization, G.S. and C.E.; methodology, G.S., K.Z., C.E. and N.K.; software, K.Z. and N.K.; validation, K.Z. and N.K.; formal analysis, K.Z. and N.K.; resources, K.Z.; data curation, N.K.; writing—original draft preparation, K.Z.; writing—review and editing, G.S. and C.E.; visualization, K.Z. and N.K.; supervision, G.S.; project administration, G.S.; funding acquisition, G.S. All authors have read and agreed to the published version of the manuscript.

Funding

This research received funding from the European Commission’s Horizon 2020 Research and Innovation Program under Grant Agreement no. 101037643—ILIAD (“Integrated Digital Framework for Comprehensive Maritime Data and Information Services”). The article reflects only the authors’ views. The Commission is not responsible for any use that may be made of the information it contains.

Institutional Review Board Statement

Not Applicable.

Informed Consent Statement

Not Applicable.

Conflicts of Interest

The authors declare no conflict of interest. The authors declare that they have no known competing financial interests or personal relationships that could have appeared to influence the work reported in this paper.

References

  1. Lindley, D. The energy should always work twice. Nature 2009, 458, 138–142. [Google Scholar] [CrossRef]
  2. Zhou, Z.; Benbouzid, M.; Charpentier, J.F.; Scuiller, F.; Tang, T. A review of energy storage technologies for marine current energy systems. Renew. Sustain. Energy Rev. 2013, 18, 390–400. [Google Scholar] [CrossRef] [Green Version]
  3. European Commission. The European Green Deal 2019/640. 2019. Available online: https://eur-lex.europa.eu/legal-content/EN/TXT/?uri=COM:2019:640:FIN (accessed on 12 February 2020).
  4. Yaqoot, M.; Diwan, P.; Kandpal, T.C. Review of barriers to the dissemination of decentralized renewable energy systems. Renew. Sustain. Energy Rev. 2016, 58, 477–490. [Google Scholar] [CrossRef]
  5. Arnold, U.; Yildiz, Ö. Economic risk analysis of decentralized renewable energy infrastructures—A Monte Carlo Simulation approach. Renew. Energy 2015, 77, 227–239. [Google Scholar] [CrossRef]
  6. Goffetti, G.; Montini, M.; Volpe, F.; Gigliotti, M.; Pulselli, F.M.; Sannino, G.; Marchettini, N. Disaggregating the SWOT analysis of marine renewable energies. Front. Energy Res. 2018, 6, 138. [Google Scholar] [CrossRef] [Green Version]
  7. Wang, Z.; Carriveau, R.; Ting, D.S.K.; Xiong, W.; Wang, Z. A review of marine renewable energy storage. Int. J. Energy Res. 2019, 43, 6108–6150. [Google Scholar] [CrossRef]
  8. Jia, Z.; Wang, B.; Song, S.; Fan, Y. Blue energy: Current technologies for sustainable power generation from water salinity gradient. Renew. Sustain. Energy Rev. 2014, 31, 91–100. [Google Scholar] [CrossRef]
  9. Loeb, S. Large-scale power production by pressure-retarded osmosis, using river water and sea water passing through spiral modules. Desalination 2002, 143, 115–122. [Google Scholar] [CrossRef]
  10. Kim, J.; Jeong, K.; Park, M.J.; Shon, H.K.; Kim, J.H. Recent Advances in Osmotic Energy Generation via Pressure-Retarded Osmosis (PRO): A Review. Energies 2015, 8, 11821–11845. [Google Scholar] [CrossRef] [Green Version]
  11. Loeb, S. Method and Apparatus for Generating Power Utilizing Pressure-Retarded-Osmosis. U.S. Patent US 3906250, 16 September 1975. [Google Scholar]
  12. Loeb, S. Production of energy from concentrated brines by pressure-retarded osmosis: I. Preliminary technical and economic correlations. J. Membr. Sci. 1976, 1, 49–63. [Google Scholar] [CrossRef]
  13. Yip, N.Y.; Elimelech, M. Comparison of energy efficiency and power density in pressure retarded osmosis and reverse electrodialysis. Environ. Sci. Technol. 2014, 48, 11002–11012. [Google Scholar] [CrossRef]
  14. Post, J.W.; Veerman, J.; Hamelers, H.V.M.; Euverink, G.J.W.; Metz, S.J.; Nymeijer, K.; Buisman, C.J.N. Salinity-gradient power: Evaluation of pressure-retarded osmosis and reverse electrodialysis. J. Membr. Sci. 2007, 288, 218–230. [Google Scholar] [CrossRef] [Green Version]
  15. Vermaas, D.A.; Guler, E.; Saakes, M.; Nijmeijer, K. Theoretical power density from salinity gradients using reverse electrodialysis. Energy Procedia 2012, 20, 170–184. [Google Scholar] [CrossRef] [Green Version]
  16. Daniilidis, A.; Vermaas, D.A.; Herber, R.; Nijmeijer, K. Experimentally obtainable energy from mixing river water, seawater or brines with reverse electrodialysis. Renew. Energy 2014, 64, 123–131. [Google Scholar] [CrossRef]
  17. Stenzel, P.; Wagner, H.J. Osmotic power plants: Potential analysis and site criteria. In Proceedings of the 3rd International Conference on Ocean Energy, Bilbao, Spain, 6–8 October 2010. [Google Scholar]
  18. Kempener, R.; Neumann, F. Salinity Gradient Energy; International Renewable Energy Agency: Bonn, Germany, 2014; Available online: https://www.irena.org/publications/2014/Jun/Salinity-gradient (accessed on 29 March 2020).
  19. Reyes-Mendoza, O.; Alvarez-Silva, O.; Chiappa-Carrara, X.; Enriquez, C. Variability of the thermohaline structure of a coastal hypersaline lagoon and the implications for salinity gradient energy harvesting. Sustain. Energy Technol. Assess. 2020, 38, 100645. [Google Scholar] [CrossRef]
  20. Slocum, A.H.; Haji, M.N.; Trimble, A.Z.; Ferrara, M.; Ghaemsaidi, S.J. Integrated pumped hydro reverse osmosis systems. Sustain. Energy Technol. Assess. 2016, 18, 80–99. [Google Scholar] [CrossRef] [Green Version]
  21. Tawalbeh, M.; Al-Othman, A.; Abdelwahab, N.; Alami, A.H.; Olabi, A.G. Recent developments in pressure retarded osmosis for desalination and power generation. Renew. Sustain. Energy Rev. 2021, 138, 110492. [Google Scholar] [CrossRef]
  22. Plaza, R.M. A blue energy option for the Mekong River Basin. An international law analysis on Asian regional cooperation in pioneer osmotic power projects. Sustain. Energy Technol. Assess. 2018, 25, 75–98. [Google Scholar] [CrossRef]
  23. Zachopoulos, K.; Kokkos, N.; Sylaios, G. Salt wedge intrusion modeling along the lower reaches of a Mediterranean river. Reg. Stud. Mar. Sci. 2020, 39, 101467. [Google Scholar] [CrossRef]
  24. Haralambidou, K.; Sylaios, G.; Tsihrintzis, V.A. Salt-wedge propagation in a Mediterranean micro-tidal river mouth. Estuar. Coast. Shelf Sci. 2010, 90, 174–184. [Google Scholar] [CrossRef]
  25. Barlow, P. Saltwater intrusion from the Delaware River during drought-implications for the effect of sea-level rise on coastal aquifers. In Ground Water in Freshwater–Saltwater Environments of the Atlantic coast; Barlow, P., Ed.; US Geological Survey: Reston, VA, USA, 2003; pp. 46–48. [Google Scholar]
  26. Sylaios, G.; Koutrakis, E.; Kallianiotis, A. Hydrographic variability, nutrient distribution and water mass dynamics in Strymonikos Gulf (Northern Greece). Cont. Shelf Res. 2006, 26, 217–235. [Google Scholar] [CrossRef]
  27. Hodges, B.; Dallimore, C. Estuary, Lake and Coastal Ocean Model: ELCOM v2.2 Science Manual; Centre for Water Research, University of Western Australia: Perth, Australia, 2006. [Google Scholar]
  28. Dallimore, C.; Hodges, B.R.; Imberger, J. Coupling an underflow model to a 3D hydrodynamic model. J. Hydraul. Eng. 2003, 129, 748–757. [Google Scholar] [CrossRef]
  29. Hodges, B.R.; Imberger, J. Simple curvilinear method for numerical methods of open channels. J. Hydraul. Eng. 2001, 127, 949–958. [Google Scholar] [CrossRef]
  30. Kokkos, N.; Sylaios, G. Modeling the buoyancy-driven Black Sea water outflow into the North Aegean Sea. Oceanologia 2016, 58, 103–116. [Google Scholar] [CrossRef] [Green Version]
  31. Imberger, J.; Patterson, J. A Dynamic Reservoir Simulation Model-DYRESM: 5. In Transport Models for Inland and Coastal Waters; Fischer, H., Ed.; Academic Press: New York, NY, USA, 1981; pp. 310–361. [Google Scholar]
  32. Lindström, G.; Pers, C.; Rosberg, J.; Strömqvist, J.; Arheimer, B. Development and testing of the HYPE (Hydrological Predictions for the Environment) water quality model for different spatial scales. Hydrol. Res. 2010, 41, 295–319. [Google Scholar] [CrossRef]
  33. Donnelly, C.; Andersson, J.C.M.; Arheimer, B. Using flow signatures and catchment similarities to evaluate the E-HYPE multi-basin model across Europe. Hydrol. Sci. J. 2016, 61, 255–273. [Google Scholar] [CrossRef]
  34. Iliopoulou, T.; Aguilar, C.; Arheimer, B.; Bermúdez, M.; Bezak, N.; Ficchì, A.; Koutsoyiannis, D.; Parajka, J.; Polo, M.J.; Thirel, G.; et al. A large sample analysis of European rivers on seasonal river flow correlation and its physical drivers. Hydrol. Earth Syst. Sci. 2019, 23, 73–91. [Google Scholar] [CrossRef] [Green Version]
  35. Massazza, G.; Tarchiani, V.; Andersson, J.C.M.; Ali, A.; Ibrahim, M.H.; Pezzoli, A.; De Filippis, T.; Rocchi, L.; Minoungou, B.; Gustafsson, D.; et al. Downscaling regional hydrological forecast for operational use in local early warning: HYPE models in the Sirba river. Water 2020, 12, 3504. [Google Scholar] [CrossRef]
  36. Tonani, M.; Pinardi, N.; Dobricic, S.; Pujol, I.; Fratianni, C. A high-resolution free-surface model of the Mediterranean Sea. Ocean Sci. 2008, 4, 1–14. [Google Scholar] [CrossRef] [Green Version]
  37. Oddo, P.; Adani, M.; Pinardi, N.; Fratianni, C.; Tonani, M.; Pettenuzzo, D. A nested Atlantic-Mediterranean Sea general circulation model for operational forecasting. Ocean Sci. 2009, 5, 461–473. [Google Scholar] [CrossRef] [Green Version]
  38. Oddo, P.; Bonaduce, A.; Pinardi, N.; Guarnieri, A. Sensitivity of the Mediterranean sea level to atmospheric pressure and free surface elevation numerical formulation in NEMO. Geosci. Model Dev. 2014, 7, 3001–3015. [Google Scholar] [CrossRef] [Green Version]
  39. Naghiloo, A.; Abbaspour, M.; Mohammadi-Ivatloo, B.; Bakhtari, K. Modeling and design of a 25MW osmotic power plant (PRO) on Bahmanshir River of Iran. Renew. Energy 2015, 78, 51–59. [Google Scholar] [CrossRef]
  40. Naghiloo, A.; Abbaspour, M.; Mohammadi-Ivatloo, B.; Bakhtari, K. GAMS based approach for optimal design and sizing of a pressure retarded osmosis power plant in Bahmanshir river of Iran. Renew. Sustain. Energy Rev. 2015, 52, 1559–1565. [Google Scholar] [CrossRef]
  41. Ansari, A.; Abbaspour, M. Modelling and economic evaluation of pressure-retarded osmosis power plant case study: Iran. Int. J. Ambient Energy 2019, 40, 69–81. [Google Scholar] [CrossRef]
  42. Gerstandt, K.; Peinemann, K.V.; Skilhagen, S.E.; Thorsen, T.; Holt, T. Membrane processes in energy supply for an osmotic power plant. Desalination 2008, 224, 64–70. [Google Scholar] [CrossRef]
  43. Zhang, S.; Chung, T.S. Minimizing the instant and accumulative effects of salt permeability to sustain ultrahigh osmotic power density. Environ. Sci. Technol. 2013, 47, 10085–10092. [Google Scholar] [CrossRef]
  44. Kleiterp, R. The Feasibility of a Commercial OSMOTIC power Plant. Master’s Thesis, Civil Engineering and Geosciences, Delft University of Technology Hydraulic Engineering, Delft, The Netherlands, 19 January 2012. [Google Scholar]
  45. Kim, Y.C.; Elimelech, M. Potential of osmotic power generation by pressure retarded osmosis using seawater as feed solution: Analysis and experiments. J. Membr. Sci. 2013, 429, 330–337. [Google Scholar] [CrossRef]
  46. Aggidis, G.A.; Luchinskaya, E.; Rothschild, R.; Howard, D.C. The costs of small-scale hydro power production: Impact on the development of existing potential. Renew. Energy 2010, 35, 2632–2638. [Google Scholar] [CrossRef]
  47. Skilhagen, S.E.; Dugstad, J.E.; Aaberg, R.J. Osmotic power—Power production based on the osmotic pressure difference between waters with varying salt gradients. Desalination 2008, 220, 476–482. [Google Scholar] [CrossRef]
  48. Alvarez-Silva, O.; Winter, C.; Osorio, A.F. Salinity gradient energy at river mouths. Environ. Sci. Technol. Lett. 2014, 1, 410–415. [Google Scholar] [CrossRef]
  49. Alvarez-Silva, O.A.; Osorio, A.F.; Winter, C. Practical global salinity gradient energy potential. Renew. Sustain. Energy Rev. 2016, 60, 1387–1395. [Google Scholar] [CrossRef]
  50. Alvarez-Silva, O.A. Implementing salinity gradient energy at river mouths. In Pressure Retarded Osmosis: Renewable Energy Generation and Recovery; Touati, K., Tadeo, F., Kim, J.H., Silva, O.A.A., Chae, S.H., Eds.; Academic Press: London, UK, 2017; pp. 153–171. [Google Scholar]
  51. Saki, S.; Uzal, N.; Gökçek, M.; Ates, N. Predicting potential of pressure retarded osmosis power for different estuaries in Turkey. Environ. Prog. Sustain. Energy 2019, 38, 13085. [Google Scholar] [CrossRef]
  52. Sharma, M.; Chakraborty, A.; Kuttippurath, J.; Yadav, A.K. Potential power production from salinity gradient at the Hooghly estuary system. Innov. Energy Res. 2018, 7, 1463–2576. [Google Scholar] [CrossRef]
  53. Ortega, S.; Stenzel, P.; Alvarez-Silva, O.; Osorio, A.F. Site-specific potential analysis for pressure retarded osmosis (PRO) power plants—The León River example. Renew. Energy 2014, 68, 466–474. [Google Scholar] [CrossRef]
  54. Psiloglou, B.E.; Giannakopoulos, C.; Majithia, S.; Petrakis, M. Factors affecting electricity demand in Athens, Greece and London, UK: A comparative assessment. Energy 2009, 34, 1855–1863. [Google Scholar] [CrossRef]
  55. Tyralis, H.; Karakatsanis, G.; Tzouka, K.; Mamassis, N. Exploratory data analysis of the electrical energy demand in the time domain in Greece. Energy 2017, 134, 902–918. [Google Scholar] [CrossRef]
Figure 1. The Strymon River study site, the positioning of the SGE PRO unit, and the inflow and outflow systems. The blue line indicates the freshwater intake pipeline, the red line indicates the saltwater intake pipeline according to the optimal continuous operation scenario and the orange line indicates the saltwater pipeline according to the seasonal scenario. Brackish water outflow pipeline is shown in green (map source: Google satellite and terrain base maps).
Energies 15 02970 g001
Figure 2. Flowchart of the developed conceptual framework. The 3D hydrodynamic model ELCOM simulates the salinity distribution in the study area, and a set of Python scripts transfer model results to the PRO energy model from which, under a set of technical considerations, the daily net energy production is assessed.
Energies 15 02970 g002
Figure 3. Salinity distribution along the longitudinal–vertical section in the Strymon River under different hydrologic regimes. (a) Commencement of salt-wedge formation in early summer. (b) Establishment of salt-wedge formation in late summer 2004. White dots indicate the locations of salt and freshwater intakes to the PRO power plant. The white line on the map indicates the cross-sectional profile along the Strymon River channel (map source: Google satellite base map).
Energies 15 02970 g003
Figure 4. PRO net energy production (Enet) in Strymon River estuary, exploiting the simulated salinity difference (ΔSSW) from the salt wedge (resampled in hourly time step) from June to August 2004.
Energies 15 02970 g004
Figure 5. Correlation between the salt-wedge freshwater salinity difference (ΔSSW) and the Strymon River discharge (Q), as extracted from the 2004 hydrodynamic simulation.
Energies 15 02970 g005
Figure 6. Sensitivity analysis in daily net energy production (Enet) at various salinity difference (ΔSSW) levels.
Energies 15 02970 g006
Figure 7. Correlation between the PRO power plant’s daily net energy production (Enet) and Strymon River discharge (Q).
Energies 15 02970 g007
Figure 8. Historical data for Strymon River discharge from 1981 to 2010 (HYPE model).
Energies 15 02970 g008
Figure 9. The average number of days with daily river discharge below 15 m3/s in the Strymon River from 1981 to 2010.
Energies 15 02970 g009
Figure 10. Estimation of the annual net electricity production related to the salinity difference.
Energies 15 02970 g010
Figure 11. Box-whisker plot of the monthly average net energy production for the years from 1981 to 2010. Black dot: average value; black line in box: median value; whiskers: 1.5 × IQR (interquartile range); white dot: outliers.
Energies 15 02970 g011
Figure 12. Variation in PRO plant efficiency according to salt and freshwater intake.
Energies 15 02970 g012
Figure 13. Seasonal variation in the national maximum electricity demand in 2018 and 2019 (data from Greek Independent Power Transmitting Operator) and monthly-mean net electricity production (Enet) by the SGE PRO power unit.
Energies 15 02970 g013
Table 1. The net energy production of a 1 MW power plant in Strymon River, in continued inflow of salt (38.1 g/L) and fresh (0.1 g/L) water.
SymbolDescription%ValueUnit
EpPotential energy production100%8.76(GWh/yr)
ElossIntake and outfall losses−1.2%−0.11(GWh/yr)
EcptPretreatment energy losses−5.7%−0.50(GWh/yr)
ElbMembrane losses−3.3%−0.29(GWh/yr)
EtltgTransmission and generation losses−42.4%−3.71(GWh/yr)
EnetNet energy production47.3%4.15(GWh/yr)
Table 2. Results of the coupled 3D hydrodynamic and SGE PRO Strymon River model under the seasonal scenario for 2004.
ΔSSW
(g/L)
Number of Obs.Number of Days%Mean
Salinity (g/L)
Qsal
(m3/s)
Qfr
(m3/s)
Qbr
(m3/s)
Efficiency (%)Enet
(MWh/day)
15.0–20.92463.41.619.72.8–2.31.4–1.24.1–3.31.9–19.4%0.30–4.66
21.0–25.998813.714.124.42.3–1.91.2–0.93.3–2.719.4–31.5%4.66–7.55
26.0–30.9298941.545.028.91.9–1.60.9–0.82.7–2.331.5–39.6%7.55–9.50
31.0–36.0261736.339.332.41.6–1.30.8–0.72.3–1.939.6–45.4%9.50–10.90
Table 3. Summary table for SGE assessment of the Mediterranean rivers in relation to tidal range, mean river discharge (Qmean), theoretical energy potential and technical SGE (data source: [48,51]. Enet assessment was based on Equation (22).
RiverCountryTidal Range (m)Qmean
(m3/s)
ΔS
(g/L)
Theoretical Potential
(MW)
Technical Energy
(GWh/year)
Enet
1 MW PRO
(GWh/year)
Ebro *SP0.242437.78994024.15
Rhone *FR0.1169338.1430056004.17
NileEG0.2125438.7260845794.21
Po*IT0.5151137.865049004.15
Strymon *GR0.26037.911584.15
CeyhanTR0.215039.1991674.24
SakaryaTR0.214639.01031644.22
MericTR0.218839.14212084.23
Büyük MenderesTR0.198.538.96402904.22
VjosaAL0.1145.838.113713944.17
Evros *GR0.2109.936.97803524.09
Acheloos *GR0.151.839.0171564.22
AliakmonGR0.250.137.01601194.10
NestosGR0.24036.5811144.06
* Estuaries with seasonal salt-wedge formation.
Publisher’s Note: MDPI stays neutral with regard to jurisdictional claims in published maps and institutional affiliations.

