
Energy Prices Impact on Inflationary Spiral

Faculty of Economics, Prague University of Economics and Business, nám. W. Churchilla 1938/4, 130 67 Prague, Czech Republic
*
Authors to whom correspondence should be addressed.
Energies 2022, 15(9), 3443; https://0-doi-org.brum.beds.ac.uk/10.3390/en15093443
Submission received: 23 March 2022
/
Revised: 22 April 2022
/
Accepted: 27 April 2022
/
Published: 9 May 2022
(This article belongs to the Special Issue Advances in Scientific, Economic and Policy Analysis for Sustainable Development)
Abstract
:Energy constitutes an essential share of costs across any economy. The percentage of electricity in the overall energy consumption is steadily increasing. This increase, however, is not reflected correctly in the consumption basket relevant for measuring inflation and, therefore, for monetary policy formulation. We argue that the energy mix reflected in inflation should be revised in favour of electricity. We present an analysis of inflationary pressures across Europe and decompose the impact of energy categories on headline inflation. Building on the inflation expectations framework, this study examines the characteristics and magnitude of the current energy price dynamics and quantifies its share in the countries’ effective inflation. Our research also confirms a compelling insight into the country’s energy structure and inflationary pressures when a larger share of renewable electricity sources proves to be associated with lower inflation. Finally, we argue that the energy price shock cannot be viewed as a one-shot event as in the case of oil price shocks in the past. We draw recommendations for monetary policy formulation. The implication of renewable sources on inflation should be of interest to policymakers, especially in times of high, almost galloping inflation rates in some European countries, unstable fossil energy sources supply due to geopolitical instability, and climate crisis.
1. Introduction
In recent years, the traditional energy paradigm has started to shift towards climate change and security of supply. So far, energy has mainly come from conventional sources. Uncertainties due to global warming, the spread of COVID-19 and the Russian-Ukrainian war show the more important role of renewable energy sources (RES); for example, electricity, compared to other traditional sources such as coal, natural gas and oil.
The literature review is focused on a change of energy mix and transition to green production, rising energy prices and their correlation with inflation in connection with a concept of an inflationary spiral. Insufficient attention is paid in the literature to the rising electricity item. A vast majority of the literature focuses on fossil fuel prices such as coal, gas and oil prices.
With rising energy prices and the energy transition to RES, there is increasing pressure on the current behaviour of central banks and maintaining inflation expectations. The percentage of electricity in overall energy consumption is steadily increasing. However, this increase is not reflected in the consumption basket relevant for measuring inflation and, therefore, for monetary policy formulation. Electricity is currently deviating from the monetary policy paradigm and may lead to a change in inflation expectations. Therefore, the hypothesis is to verify whether electricity begins to play a more important role in terms of the impact on inflation than other items in the energy mix.
The development of the world economy depends on the availability of cheap energy, which is one of the fundamental factors that majorly impact civilisation. Energy is one of the most critical resources that determine the economic, social and political development of countries and regions [1,2,3,4,5,6,7]. Although economic growth is impossible without energy consumption, the dynamic development of the world economy has led to a steep increase in the demand for energy in recent decades.
In recent years, the traditional energy paradigm has rapidly lost ground compared to the concept of sustainable development [8]. The conventional paradigm only regards the level of per capita energy consumption as an indicator of national “progress” without considering the impact of energy consumption on society, the environment and security [9]. In this paradigm, based on the intensive and increased consumption of fossil fuels [10], the resulting environmental, social and economic costs are enormous. Therefore, a paradigm shift in the energy sector is necessary [11].
There was also a paradigm shift in the goals of energy policy toward the security of supply and climate change. Global warming and climate change, ozone depletion, soil erosion, biodiversity loss and water and air pollution are global issues that have profound impacts on humans [12]. The protection of the planet is not for free. It has a massive impact on economic costs and, therefore, on inflation. As we are trying to build a more sustainable economy, we are facing a new era of energy inflation, with distinct but interconnected shocks expected to lead to continuous upward pressure on inflation [13,14]. In addition to environmental concerns, the large-scale use of nuclear and fossil fuels presents serious safety concerns. Tensions stem from the depletion of global fossil fuel resources [12], uncertainty in energy prices and energy supply [15], geopolitical tensions caused by the concentration of gas and oil resources in several regions of the world and the threat of nuclear proliferation [16]. Political pressures related to fossil fuels can lead to civil unrest, regime change or even war.
The traditional energy paradigm seems unable to address these major social and political issues. These challenges require a paradigm shift in energy policy. Qazi et al. [17] showed that the global energy crisis could be overcome by integrating renewable energy into power generation. The transition to sustainable energy systems is one of the main challenges facing humanity in the new millennium. The paradigm shift occurs mainly in industrialised countries, but it also extends to developing countries. Renewable energy policies in most countries are evolving rapidly due to the ongoing paradigm shift. Global investment in renewable energy is growing rapidly in several developed and developing countries [11].
So far, energy has mainly come from conventional sources such as coal, natural gas and oil. Paradigm shifts in the energy sector, international activities and social pressures are forcing a structural change in the sources from which energy is produced. Renewable energy has become a top priority in global energy policy strategies [18]. Many countries are deregulating and restructuring their electric power industries [19]. The fundamental change in world energy markets has already begun [19]. The growing global demand for electricity means that the use of solar and wind energy, which can also reduce the negative impact on the environment, is becoming growingly important. These variable energy sources play a more and more critical role in the global energy mix [20].
This also applies to EU countries. For many years, the EU energy policy was based on an integrated approach to national energy security, economic competitiveness and environmental and climate protection issues [21,22]. The EU countries report an increasing role of RES in the energy production structure. The result is a growing share of RES in the energy mix of the EU countries compared to conventional fossil sources.
From a political point of view, an increasing number of countries are inclined to accept the proposed strategy. EU countries are broadly aware that the implementation of the European Green Deal strategy is a must.
The transition to renewable, energy-efficient and low-carbon technologies is progressing, driven by concerns about energy security and climate change [13]. The transition from a fossil-based economy to a non-carbon one is more likely to occur in the long term [11].
Energy prices (especially electricity) have risen dramatically during last year [23], from a large share as consequence of the COVID-19 pandemic [24]. This is a recent phenomenon from the point of view of the whole economy, including production, services and housing [25]. The increase is also happening in connection with the transition to an emission-free economy. The importance of electricity is therefore continuing to grow. It is moving away from coal, and natural gas provides a rather temporary solution to switch to green production in the coming years. These trends have been observed gradually since 2008, when the EU approved emission allowances and reduced emissions from coal-fired power generation. As observed in recent years, natural gas is largely the driving force behind that electric price shock. Its share compared to coal is growing, and in 2020 it accounted for a quarter of electricity generation in the EU [26].
The macroeconomic effects of an increase in energy prices continue to generate much interest, especially in light of increasing inflation. The rising energy prices (of fuels, electricity and gas) are at the center of an ongoing policy debate that gained prominence in the mid-70s [27,28], or later in 2003 at the beginning of the Iraq War, in 2008 during the global financial crisis [29] and in 2022 with regard to the war in Ukraine [13].
Rising oil prices tend to directly affect the overall consumer price index (CPI) by increasing its energy cost component, which incorporates the prices of energy-related items such as motor fuels, household fuels, natural gas and electricity [30]. The extent to which higher oil prices lead to higher headline inflation through higher energy costs depends on their persistence. If they continue to rise, they can lead to a sustained rise in the overall price level, thus in headline inflation [28].
As the paper by Mork and Hall [27] stated, the energy price shock of 1973–1974 played a leading role in causing the deep recession and high inflation of the mid-1970s. This energy price shock had a significant impact on the overall price level. In fact, the abnormal inflation of 1974 can be fully explained by this event and the removal of general price controls.
When the Iraq War began in 2003, there was an apparent trend reversal in energy prices, especially oil. It revealed the solid relationship between oil prices on the one hand and the relationship between its global supply and demand on the other. As of 2008 [31], the strong growth rates in emerging countries led to a sharp rise in oil prices. In turn, the temporary recession of 2008–2009 caused oil prices to fall sharply to twice their levels in early 2003 [29].
As measured by non-core inflation, these rises in oil prices have significantly impacted core inflation in the euro area. A possible explanation is the lower level of competition in the European labour and consumer goods market [32]. For example, unions represent a more significant proportion of the euro area workforce [33], influencing wage negotiations with employers [34]. Consequently, workers are more likely to receive greater wage increases due to rising energy prices, resulting in higher costs for companies [35]. Furthermore, when it comes to consumer goods markets, companies in the euro area face a lower level of competition, giving them greater price-setting power. As such, they may be less reluctant to pass on increases in production costs to consumer prices, thereby having a more considerable impact on core inflation [28].
With the development of electricity prices and the energy transition to RES, there is increasing pressure on the current behaviour of central banks and maintaining inflation expectations. Electricity is currently deviating from the monetary policy paradigm and may lead to a change in inflation expectations.
Well-known authorities such as ECB, FED, BoC, SNB, IMF and BIS also dealt with the topic, focusing mainly on rising fossil fuel prices (coal, gas, oil) and their impact on inflation and on the need for transition to renewables [36,37,38,39,40,41,42,43,44]. Electricity itself has not received adequate attention so far, especially with its rising prices and the impact on inflation. In connection with recent developments, rising prices and the transition to green energy, electricity is becoming increasingly important. It may be a key energy component for a significant part of the world in the coming years.
Against the backdrop of sharp rises in primary energy prices, authors Martinsen et al. [45] studied how the trend toward high energy prices affects the development of the German energy system, the corresponding CO2 emissions and costs. The results show that high prices in Germany lead to a significant reduction in overall primary energy supply, structural changes in primary energy supply (reduction of oil and gas) and a significant increase in renewable energy. Electricity from RES is already much cheaper than from conventional power plants [46]. Thanks to further advances in technology, even smaller photovoltaic systems could be cheaper than all fossil energy sources by 2040 [13].
Suppose we observe a similar trend in connection with the currently rising energy prices in most countries. In that case, the energy mix will change, and electricity will become a key item in energy prices, which will significantly impact inflation and inflation expectations. Currently, the world and Europe are at a turning point. As the war in Ukraine unfolds, rising commodity prices are pushing inflation in many countries to the highest level in more than 40 years and necessitating a fundamental shift in energy policy. Our reliance on fossil fuels is now seen not only as a threat to our planet but increasingly as a threat to national security and our values of democracy and freedom [13].
This paper aims to verify the hypothesis of whether electricity begins to play a more important role over time in terms of the impact on inflation than other items in the energy mix, especially coal, natural gas and oil. Coal and oil production has already decreased significantly, but in the future, the transition to zero-emission production is also expected to reduce natural gas production significantly. As the study of Isaac Appiah-Otto indicates, the economic policy uncertainty (EPU) on renewable energy growth has an insignificant effect; thus, it can be expected that the rise in EPU due to the pandemic and war in Ukraine does not interrupt renewable energy production [47].
2. Literature Review
2.1. Change of Energy Mix and Transition to Green Production
To do justice to the ‘world’s dynamic economic development, especially in developing countries, conventionally generated energy is essential. However, such production produces many pollutants released into the environment [48,49]. Pollution created by energy production from these sources contaminates air, soil and water. Moreover, various types of gases are hazardous, including greenhouse gases and dust [50,51,52,53]. Combined with emissions from other sectors of the ‘world’s economy, these emissions pose a real threat to life on Earth.
To have a significant impact on the surrounding ecosystem, global measures are considered. The United Nations (UN) has been the initiator of such activities for many years. Their climate summit called for faster and more decisive action to protect the environment and the EU is becoming increasingly active in this process.
At the UN Conference of the Parties [54] climate summit in December 2019, the European Commission proposed a new European climate strategy called the European Green Deal [54]. The approach assumes that the EU economy will be zero-emission by 2050, meaning climate-neutral [55,56]. Related to this, among other things, the share of RES in the energy mix of EU member states has increased significantly.
This strategy is the most far-reaching in mitigating climate change since the commitments made under the Kyoto Protocol [57]. It thus can be seen as a critical factor in promoting the development of renewable energy globally.
One of the crucial areas of economic activity in the EU is meeting the energy needs of its inhabitants [22,58]. It is predicted that the energy demand of EU countries will rise systematically over the next 25–30 years [59].
To reconcile these seemingly contradictory goals, aimed at increasing energy production while limiting the negative environmental impact of the process, an energy transition seems imperative. Traditional energy sources are likely to be replaced and supplemented by RES. Simultaneously, growth in energy production from RES should be large enough to meet increasing demand and reduce conventional energy production [3].
At least 145 countries around the world have implemented renewable energy policy targets. These countries also include all countries in the EU. Most targets are related to the share of electricity generation, primary energy and/or final energy [60].
The EU is currently a world leader in accelerating the transition to renewable energy and a low-carbon economy. According to European Energy Commissioner Andris Piebalgs [61], “we are at the beginning of third industrial revolution—the rapid development of an entirely new energy system. We can expect a massive shift towards a carbon-free electricity system, huge pressure to reduce energy consumption and transport based on renewable electricity”.
The EU is moving towards a third industrial revolution by binding commitments. In March 2007, European leaders signed a binding EU-wide target to source 20% of its energy needs from RES such as biomass, solar, wind and hydropower by 2020. On 23 January 2008, the European Commission proposed different targets based on the GDP per capita of each EU member state. As part of the overall target, a mandatory minimum goal for each member state is to achieve at least 10% of transport fuel consumption from biofuels. Under President Obama, the US also started increasingly turning to green energy. By 2025, 25% of its electricity will come from renewable sources. As a result of these new policies, global investment in renewable energy and the world’s installed renewable energy capacity has gradually increased in recent decades. Between 2009 and 2019, the share of renewable energy grew by nearly 5% annually, outpacing the growth of fossil fuels (1.7%) [19,60].
As nations move along their growth path, the energy demand increases. According to the US Energy Information Administration’s International Energy Outlooks [62,63], from 2012 to 2040, energy demand will increase by 48%, and by 2050, global energy consumption will increase by nearly 50% compared to 2020. Electricity consumption in all end-use sectors is growing faster than total energy consumption. Countries are beginning to recognise the potential and importance of renewable energy [64].
Household electricity consumption is growing more rapidly than all other energy sources and will account for half of all household energy consumption by 2050. Electricity use in commercial buildings is also increasing. Projections show that by 2050, more than 60% of commercial energy needs will be met by electricity [63].
Projected growth in electricity generation is primarily from RES, as shown by the US Energy Information Administration’s International Energy Outlook [63]. Electricity generation increases within the forecast horizon; while generation in OECD regions grows slowly, it almost doubles by 2020 in the non-OECD areas. Globally, starting in 2025, incremental power generation will mainly come from RES. As renewables, especially solar and wind energy, become cost-competitive, the IEO2021 Reference Case predicts that all electricity generation growth in OECD regions after 2020 will come from these and such sources. They will account for an increasing share of existing non-renewable energy sources and replace sources based primarily on fossil fuels. In non-OECD regions, forecasts show that from 2020 to 2050, electricity generation from RES will account for around 90% of the growth in electricity generation. In the reference case, non-OECD regions generated more than twice as much renewable energy generation as OECD regions because electricity generation in the non-OECD areas grew almost twice as fast as in OECD regions. Today, the integration of variable RES into electricity production is a critical problem that needs to be solved at the international level [20].
In 2020, the EU had its greenest electricity year on record. For the first time, electricity generated from RES exceeded the one from fossil fuels. Renewables accounted for 38% of the European electricity mix in 2020, compared to only 37% for fossil fuels, according to a joint analysis by Agora Energiewende and the British think tank Ember [65]. This change was driven by the rapid growth of solar and wind energy, which have nearly doubled since 2015. In 2020, 20% of the EU’s electricity came from solar and wind power plants [65].
2.2. Rising Energy Prices
Choi et al. [68] show fluctuations in global real oil prices from January 1970 to June 2017. Two oil crises scarred the 1970s, leading to high global inflation. Later, oil prices trended downward in the 1980s, coinciding with the beginning of great moderation. The temporary rise in oil prices in the 1990s was due to the crisis in the Persian Gulf. However, in the 2000s, oil prices rose steadily, with a sharp spike in 2008, a steeper drop in 2009 and a subsequent recovery. The heightened volatility in these developments has raised concerns that oil prices could once again lead to higher headline inflation. At the end of 2014, global oil prices dropped sharply again to the level of $43 per barrel and remained low until 2020, raising deflationary pressures on headline inflation in most economies. In 2020 they fell even more sharply to $16 per barrel [23]. Since then, oil prices have steadily risen to the current level (02/2022) of $88 per barrel [23]. The soaring inflation rates in 2021 reflected rising demand as the economy adapted to the COVID-19 pandemic, tight labour markets, supply chain disruptions and the recovery of energy prices from their pandemic lows. During the last couple of months of 2021, a sharp increase in gas and electricity prices is observable.
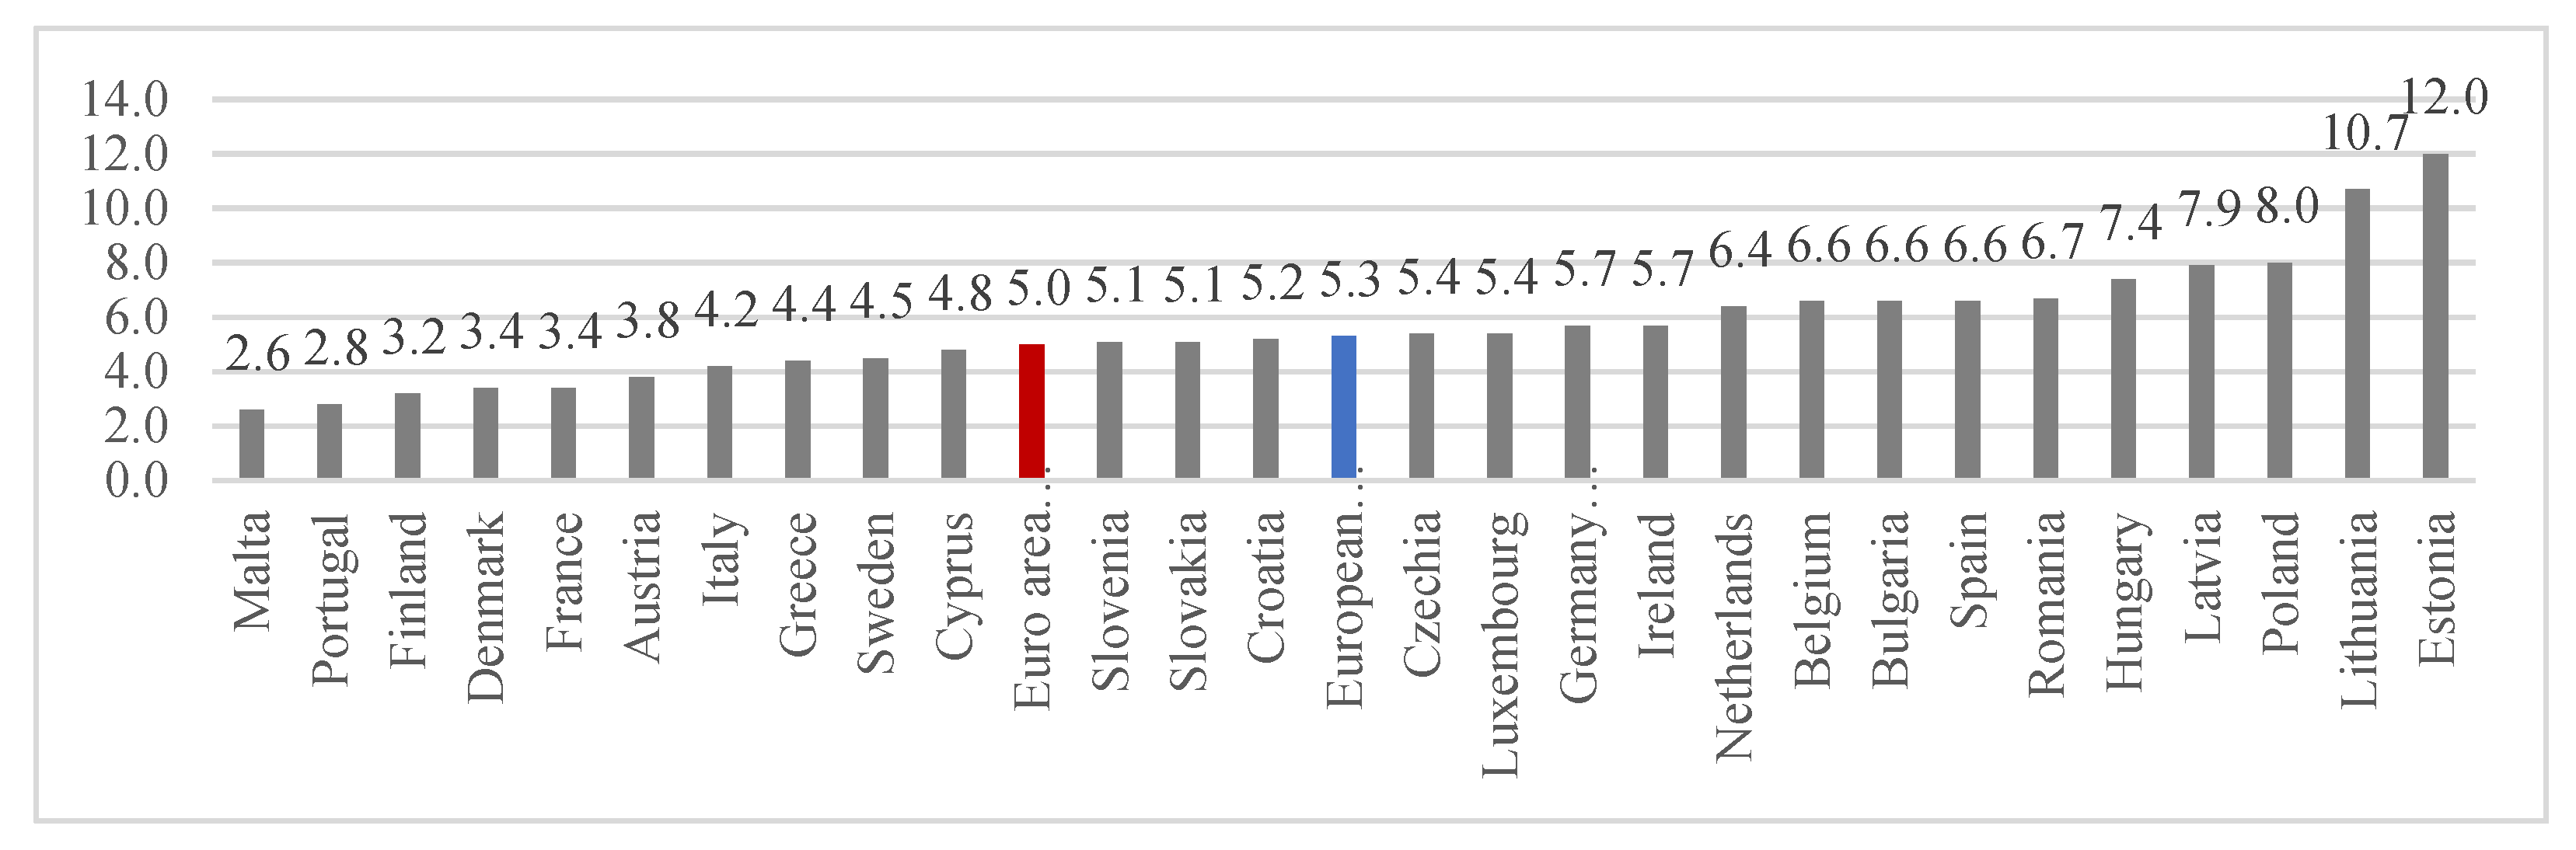
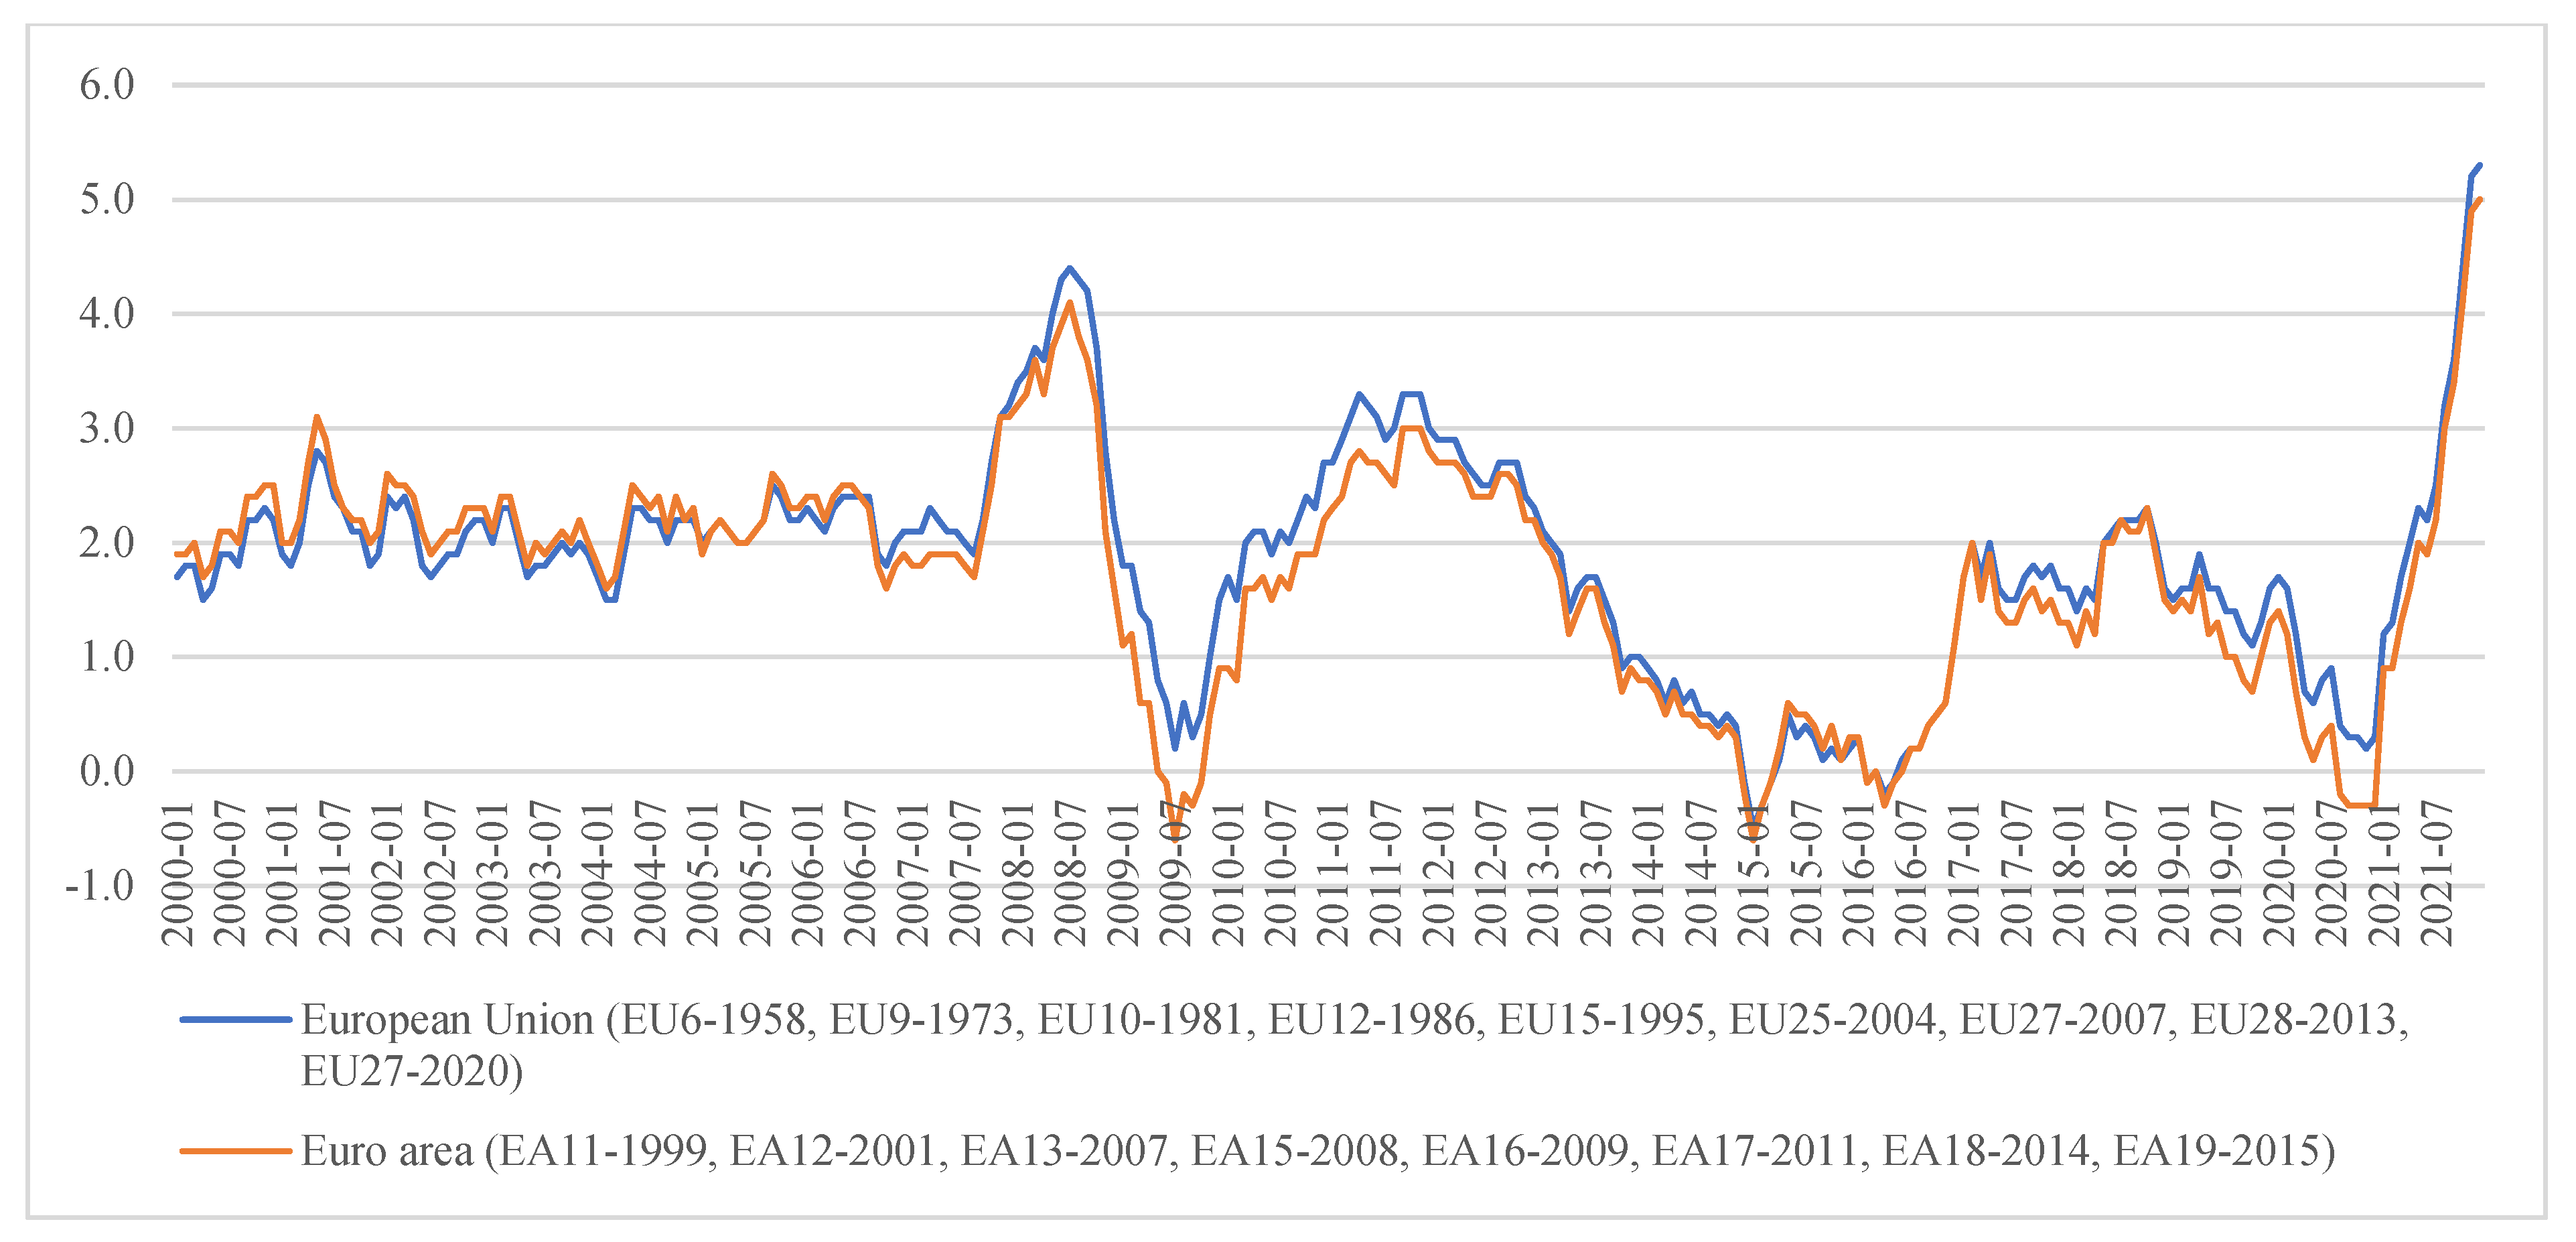
Decoupling annual consumer inflation from the 2% inflation target and its rapid growth across the Euro area during the second half of 2021 to 5% in December (5.3% EU average) raises several questions (see Figure 1 and Figure 2). Most Central and Eastern European countries, including the Benelux, are above this limit, reaching 12% (Estonia). Therefore, it is not just a question of where and why inflation may rise even further in the coming months but also when and for what reasons it will subside.
Inflationary pressures were dramatically increased by a sharp rise in the price of natural gas and electricity, which was very quickly reflected in the production prices of foreign trading partners. As a result, the contribution of energy to the Euro area’s total inflation as of 12/2021 was 2.46 pp, of which the fuel item with an impact on headline inflation of 0.96 pp had the largest share, followed by electricity with an effect of 0.65 pp and natural gas with an effect of 0.54 pp (see Table 1).
As Apergis [69] concludes, the leading price movements in Greece are transmitted by the energy price indices, namely the electricity price index, the energy price index and the gas and fuels price index. The secondary effects also come from the food and vegetable price index and the service price index. In terms of causality, there is evidence that energy price perturbations are unidirectionally transmitted to the remaining CPI components. In contrast, innovations (shocks) to the remaining CPI components have no significant effect on all indices. To rephrase it, any increase in fuel prices passes on to the rest of the economy. From the consumer perspective (industry and households), energy bills rise, while from the production perspective, companies must settle for an increase in unit costs, thus in their charging prices. Therefore, these spikes in fuel prices lead to inflationary shocks with a second-round effect. Thereby, the production cost increases.
The growth of energy prices is reflected in the domestic prices of European economies at different rates. The fiscal authorities have a significant role in dampening these pro-inflationary pressures through several short-term regulations (see Table 2). The question is whether this position is sustainable in the long run, both in terms of future energy prices and public budgets. In some countries, the rise in prices of imported goods (clothing, furniture or cars) was reflected in domestic inflation in recent months. Still, expensive energy was not fully reflected until this year, both for consumers and producers. With the fading of short-term measures and a significant adjustment of price lists at the most critical suppliers in connection with the high increase in electricity and gas prices on world stock exchanges, a significant impact on inflation can be expected [70]. What is more, imposed embargos on Russian oil imports intensify this impact. The European Commission’s plan to cut Russian gas imports by two-thirds by the end of the year leads to fossil fuel inflation. Its wider impact on other input and output prices is likely to continue to be a major factor in headline and underlying inflation in the near future. [13] Energy prices are expected to remain high for a longer period of time, with prices of natural gas up by 73% since the beginning of the year and prices of oil up by 44% [71].
2.3. Correlation between Energy Prices and Inflation
Insufficient attention is paid in the literature to the rising electricity item that could potentially be produced from renewable and nuclear sources of energy, replacing the vast majority of coal, gas and oil, and could become the energy item number one from a non-emission perspective.
When studying the impact of energy price shocks on macroeconomic variables, the vast majority of the literature focuses on crude oil prices as a variable of interest [38,40,69,72,73,74,75].
Specifically, De Gregorio et al. [72] provide evidence of a reduced pass-through of oil prices to domestic inflation by estimation of augmented Phillips curves using data from developing as well as advanced economies. They discovered a more pronounced decline in the pass-through effect in advanced economies and assigned the fall to a reduction in oil intensity and the magnitude of the exchange rate pass-through. Habermeier et al. [38] estimated panel data from 50 countries for the period of 2007–2008 and concluded that monetary policy plays a vital role in determining the magnitude of the transmission of oil and food price shocks. They found that countries with inflation targeting and higher central bank independence are inclined to have lower transmission rates. Furthermore, Álvarez et al. [76] pointed out that the direct impact of higher oil prices on inflation in the euro area increased over time because of the rising expenditure share of households on refined oil products, while its second-round and indirect effect decreased.
Zoli [39] and Caceres et al. [40] used vector autoregression to study the impact of commodity price shocks on inflation in emerging markets in Europe and Central Africa. While relative prices to the EU-15 are the key factor in explaining the inflation response to commodity price shocks in emerging Europe, price controls have a prime role in Central Africa. These results suggest that region-specific factors may influence domestic inflation responses in developing countries to global oil price shocks.
Choi et al. [68] studied the impact of global oil price volatility on domestic inflation by an unbalanced panel of 72 developing and developed countries throughout 1970–2015. They conclude that a 10% rise in global oil inflation on average would lead to an increase in domestic headline inflation of about 0.4 percentage points at the time of impact, with the effect disappearing two years later, with similar results in developing and developed economies. Moreover, the effect is asymmetric, with a positive oil price shock having a larger impact than a negative one. Finally, their findings show that the share of transport in the CPI basket and energy subsidies are the most potent factors explaining cross-country differences in the impact of oil price shocks over the reporting period.
Gelos and Ustyugova [75] estimated country-by-country augmented Phillips curves using data from developed and developing countries from 2000 to 2010. In contrast to other studies, their analysis presents that high fuel intensity and pre-existing inflation levels are the only essential factors explaining cross-country variations in the impact of oil and food price shocks. The monetary policy conduct, including the inflation targeting regime, does not appear to be a vital determinant of the transmission magnitude.
Another set of related literature examines the time-varying effects of oil price shocks on the economy, including inflation dynamics. The literature highlights that the underlying sources of changes in oil prices are significant determinants of their macroeconomic impacts. For example, Kilian [77], Peersman and Van Robays [78], and Baumeister and Peersman [79] pointed out that, whether driven by a positive demand shock or by a negative supply shock, rising oil prices have different effects on real GDP and inflation. Based on their decomposition, the oil price shocks in the 1970s were mainly attributable to exogenous shortfalls in oil production (negative supply shock). In contrast, the sustained rise in oil prices after 1999 was caused primarily by changes in crude oil demand (positive demand shock).
International crude oil price shocks do not have to provide very informative answers to recent questions, mainly because crude oil is not consumed directly by consumers, nor is it, at least not directly, used as a production input by companies outside the refining industry. Nevertheless, the paper by Abdallah and Kpodar [42] presents the effect of changes in fuel prices on domestic inflation and concludes that the impact of changes in fuel prices is modest on average and does not have a lasting effect on inflation. However, the short to medium-term impact varies by income group. The size and duration of the impact of changes in fuel prices on domestic inflation depend on key economic fundamentals such as energy intensity, wage flexibility and central bank credibility. The last two factors are likely to be critical in amplifying the impact of fuel price shocks.
The paper by Devore and Olson [80] states that the striking stability between natural gas prices and expected inflation did not change over time (period from the mid-1980s to 2020). The correlation between nominal natural gas prices and consumer inflation expectations is time-invariant and stable at around 0.30. It rose around the crisis date but appeared to be very stable. Nonetheless, the article by Sussman and Osnat [81] concludes that the correlation between oil prices and medium-term inflation expectations (which is a different measure of inflation from the study by Devore and Olson [80]) is time-varying and has increased since the financial crisis in 2008. They argue that the public’s high level of distrust in the ability of monetary authorities to control inflation is the main reason for this observation.
2.4. Inflationary Spiral?
In general, demand pressures cannot be expected to disappear from inflation as easily and quickly without an adequate monetary authority response or hypothetical significant fiscal policy restraint, as has been the case for many years with rising energy prices (supply shocks). However, the question is whether the increases in energy prices can still be considered a one-off cost shock, which so far, the monetary authorities (in the case of oil prices) have excluded. Electricity can be a phenomenon leading to the adjustment of this approach. The challenges facing monetary policy are changing. It is unlikely that we will return to the same inflationary dynamics we experienced before the pandemic [71].
Jacques and Moritz [29] concluded that energy prices are likely to continue to rise after the economy recovers from the 2007–2008 recession, and Europe will face high energy prices in the coming decades. Their “Europe after oil production peaking” scenario assumed that oil production would peak around the mid-2010s (and peak in natural gas production around 2025), despite significant investments aiming to increase production. Against the steadily growing demand for oil and natural gas, Europe will face severe economic difficulties. Big cities will lose their appeal as rural areas face greater pressure and rising unemployment and social tensions. Central and Eastern European countries will be more affected by the new energy paradigm.
As Hájková and Šnobl [82] state, a significant risk in inflation, which reaches unprecedented values, is an overflow into a substantial reassessment of inflation expectations of companies and households. The monetary authorities are trying to keep inflation expectations in line with the inflation target in the long run. However, if they were significantly detached from the inflation target as a result of persistently high inflation, it would be very likely that high inflation values would remain there for a longer period of time. Households’ efforts to hedge against inflation, in addition to the tendency to accelerate consumption and purchase durable goods at an even lower price as quickly as possible, would be projected in wage demands that employers in a shortage of labour would, in many cases, have to meet. They would try to reflect the increase in labour costs in prices. In an environment of high inflation and unanchored inflation expectations, any previously one-off price increase would further affect inflation expectations and contribute to sustained inflation. Therefore, trying to tame the wage-inflationary spiral would be very costly macroeconomically.
Some argue that if the green transition increases energy cost and given the future composition of the energy mix, this could be a long-term effect that could eventually trigger an inflationary spiral [83,84]. As Isabel Schnabel said, “Monetary policy cannot ignore the green transition” [13]. However, there is no clear agreement on the green transition increasing energy prices. Gelabert, Labandeira and Linares empirically show that a surge in RES is linked to lower energy prices in Spain [66]. This contradictory evidence is one of the motivations for the paper.
These empirical results are also supported by the Real Business Cycle (RBC) theory [85], according to which energy price shocks are viewed as supply or technology regressions. In addition, households may demand higher wages to restore purchasing power after energy prices rise, leading to a price-wage loop. Furthermore, companies can pass on this energy and wage-price increase to sales prices, resulting in higher price expectations, which are common across all components of economic activity, especially in all sectors of manufacturing [86], service and housing [87] sectors and in commodity and stock prices [88,89,90].
The paper by Abdallah and Kpodar [42] provides evidence that domestic inflation responds to fuel price shocks asymmetrically, with price increases leading to more pronounced and persistent inflationary effects than price decreases, especially in low-income and high-income countries. While this asymmetry is present in standard shocks, it disappears in small shocks and amplifies in sufficiently large shocks. This may have a direct impact on the formulation of fiscal policy. Fiscal coordination with the central bank is key to avoiding possible negative macroeconomic consequences, particularly in terms of the “scale” and “timing” of spikes and the consideration of wage bargaining cycles with unions [91] to avoid transforming a temporary supply side shock into a demand-side shock with wage spiral impacts and direct implications on monetary policy.
The events that followed the global spread of COVID-19 are real examples of how uncertainty can severely impact the global economy [92]. We expected several disruptions to subside as post-pandemic economic conditions returned to normal. However, the Russian-Ukrainian war now creates a great deal of uncertainty about the economic outlook again. [93] The impact of political and regulatory uncertainty also extends to commodity markets, such as the negative impact on oil (fuels), gas and electricity markets [92].
Both short-term and long-term inflation expectations are sensitive to monetary policy uncertainty shocks. Specifically, the long-term inflation expectations rise as a result of such shocks as economic activity contracts [94], which can be the case in the upcoming months, maybe years.
As the authors Ghosh et al. [95] noted, a significant impact on inflation expectations is due to oil price shocks. They have a greater impact on inflation expectations mainly in the post-crisis period than before the crisis [96]. With regard to current rising oil prices, it can lead to a major effect on inflation even after the end of the war conflict. The authors Istiak and Alam [96] also conclude that, since the financial crisis, the CBs’ increased focus on output stability has made inflation expectations less anchored, and a sudden rise in oil prices can quickly trigger inflation through inflation expectations.
3. Method
3.1. Argument
Most papers discussing the impact of oil prices on inflation employ variations of the VAR model for the analyses. However, we opted for a different econometric framework than the VAR. Eurostat reports electricity prices biannually. Therefore, there is no sufficiently long time series to employ such an approach. On the other hand, the data provide a cross-sectional basis. That is, they are reported for most European countries. Therefore, to assess the impact of electricity on the European countries’ inflation and control for the differences among the economies, we think the best way is to use a panel data approach. Papers studying oil prices pass-through into inflation exploit the fact that these are higher frequency data with one oil price while electricity prices differ across countries. The paper’s main aim is to examine the relationship between electricity prices and inflation (excluding the direct electricity contribution).
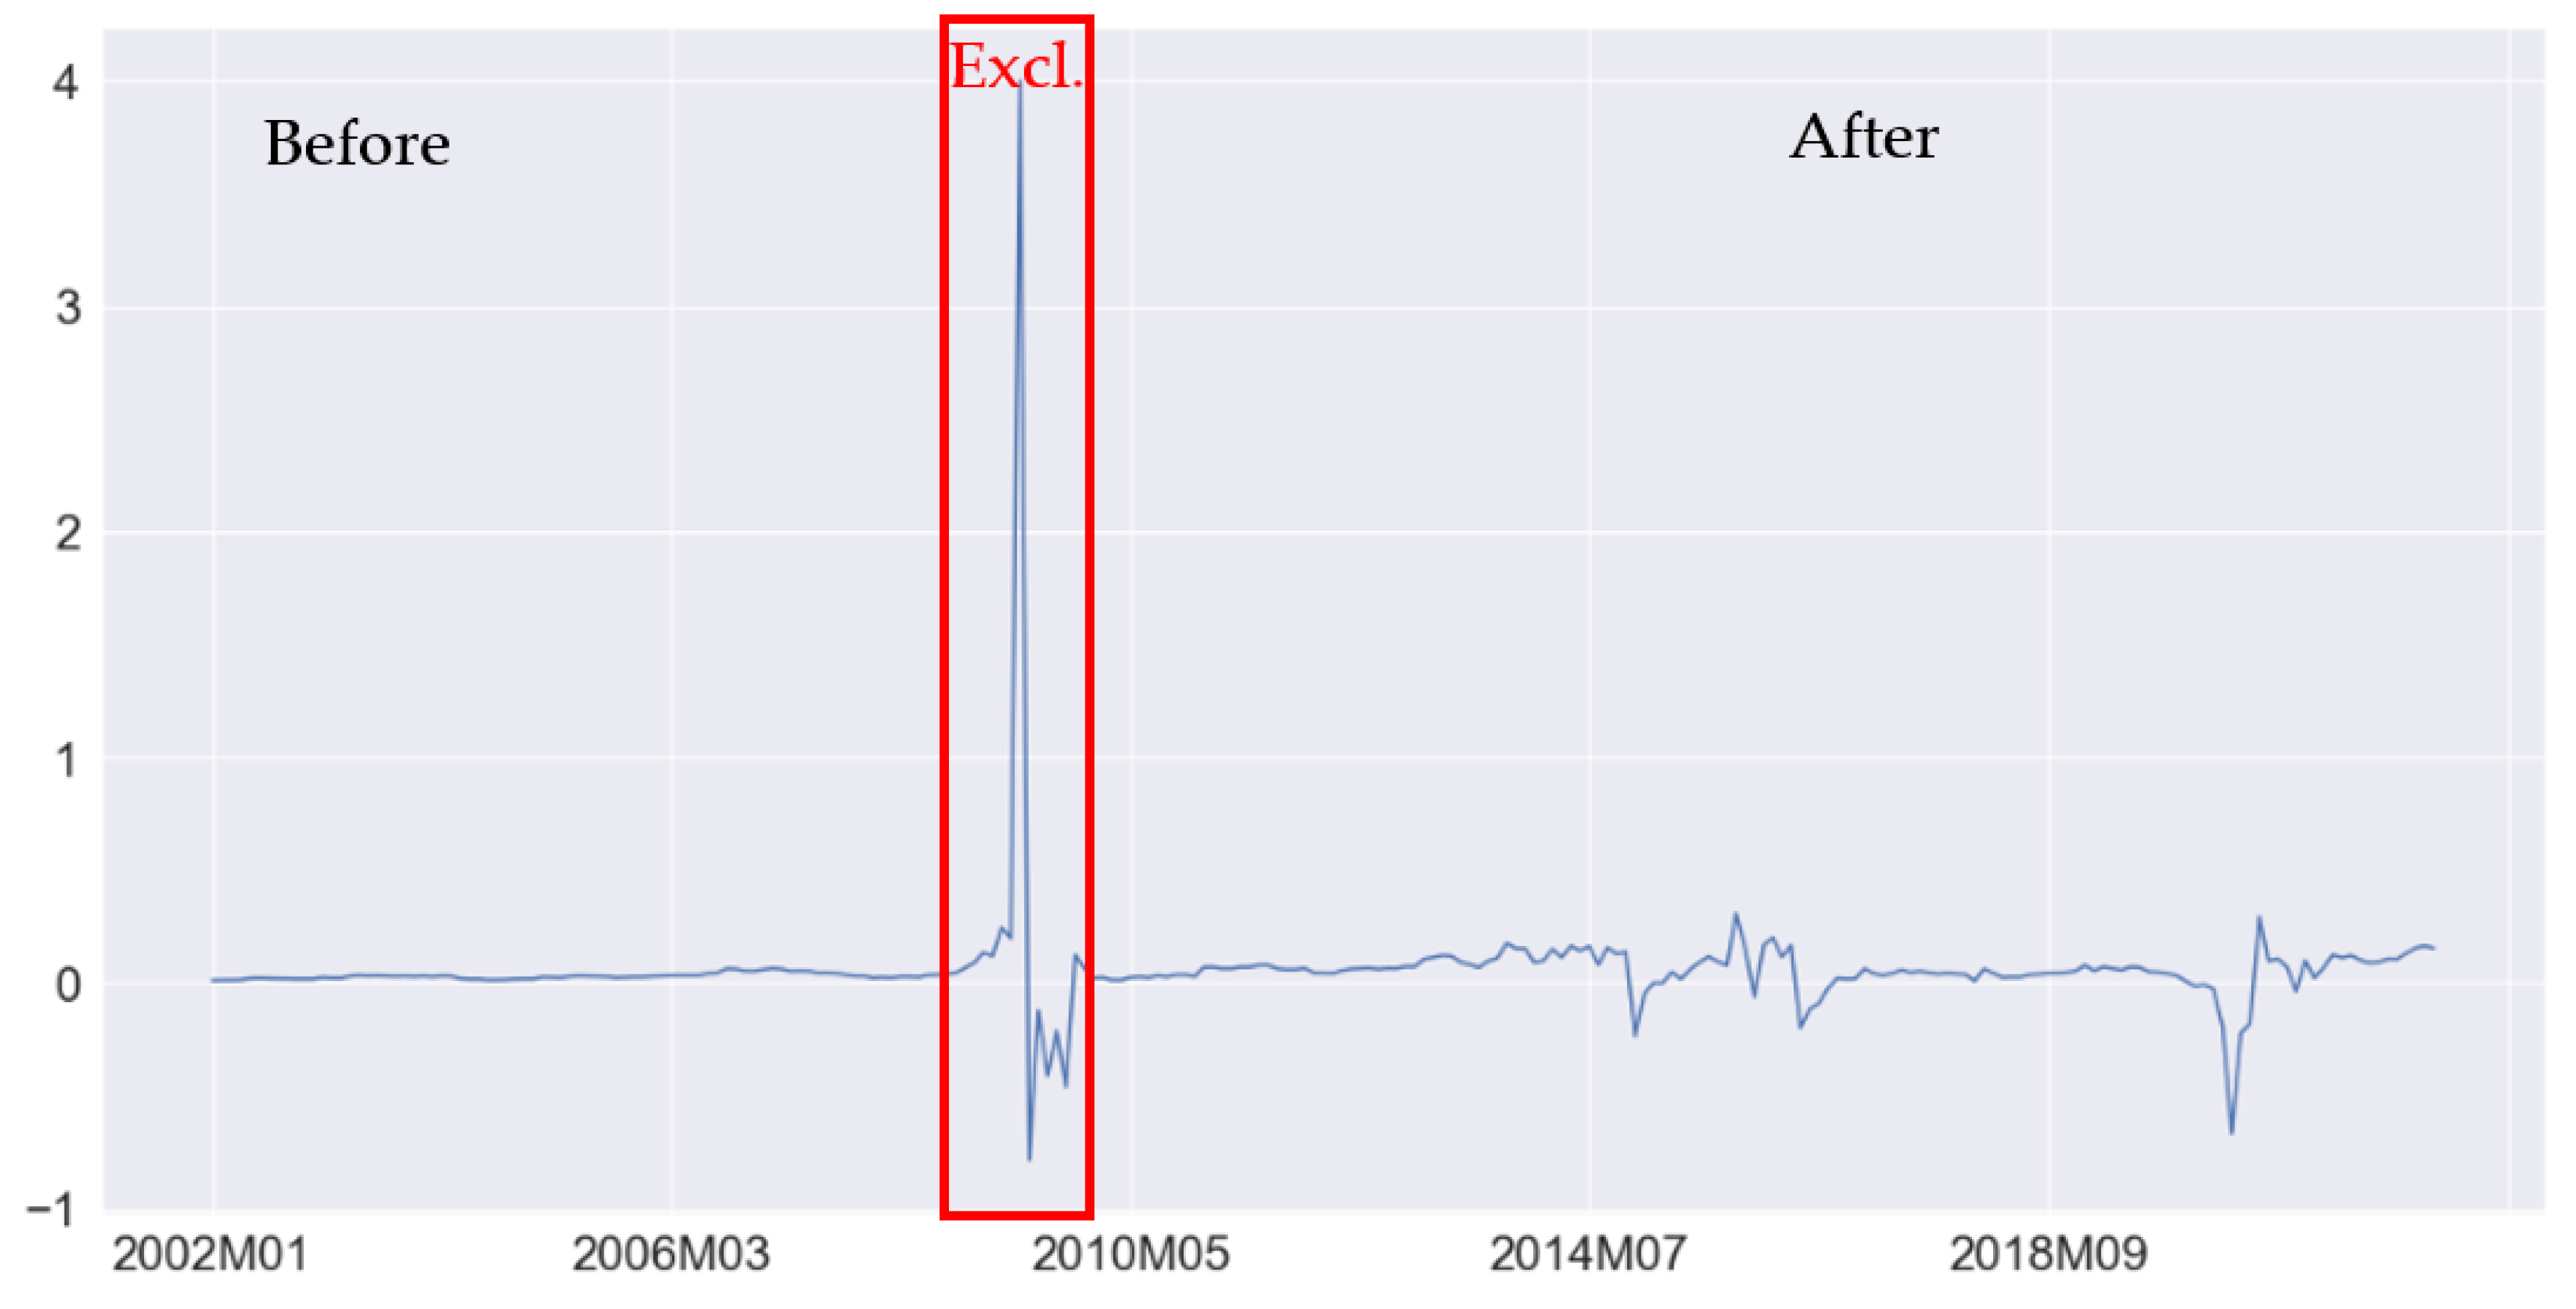
Looking at the share of electricity prices in inflation in the Eurozone area over time suggests that since 2009, something has happened. Costs of electricity before 2009 had a much more steady relationship with headline inflation. Therefore, we decided to explore if the electricity pass-through to consumer inflation turns out to be significant.
Figure 3 shows the share of electricity contribution on overall HICP (electricity contribution/HICP).
The variance of the share has increased rapidly. To prove the point not only graphically, Levene’s test for the data obtained before 2009 and after 2009 rejected the null hypothesis of α < 0.01. Additionally, the mean of the share has changed significantly. Based on Welch’s t-test α < 0.05, we reject the null hypothesis that the means are equal.
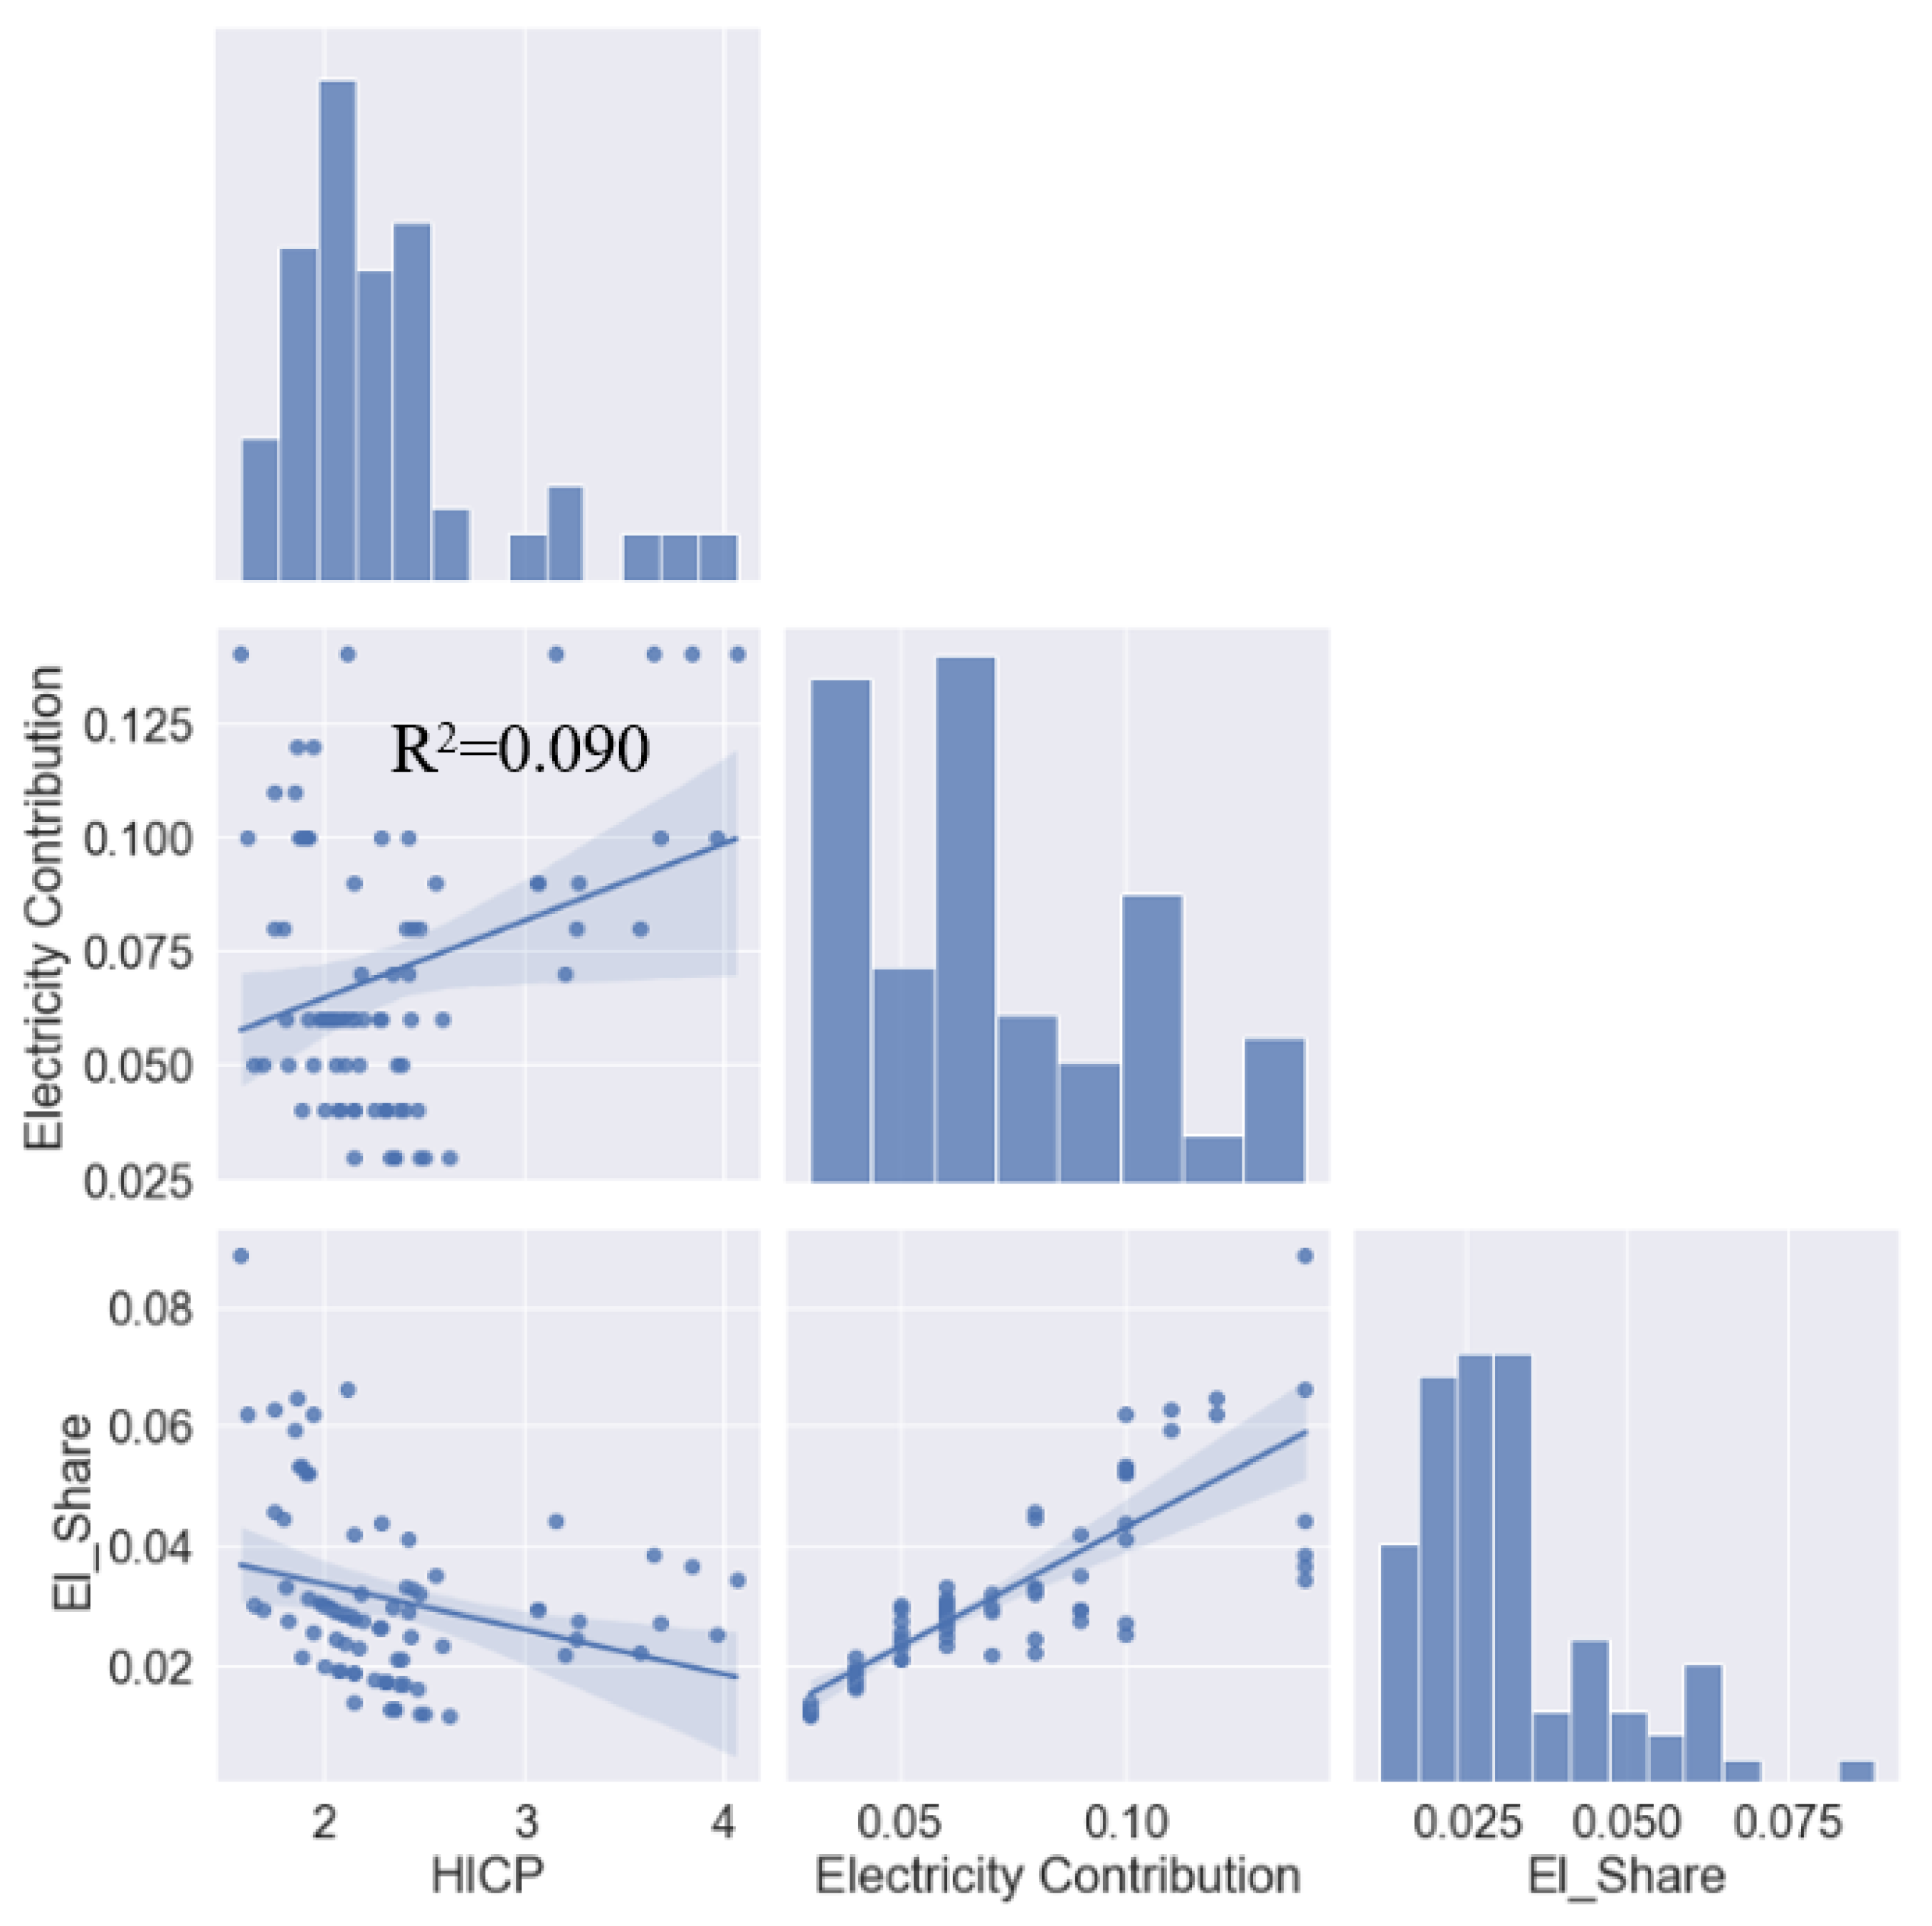
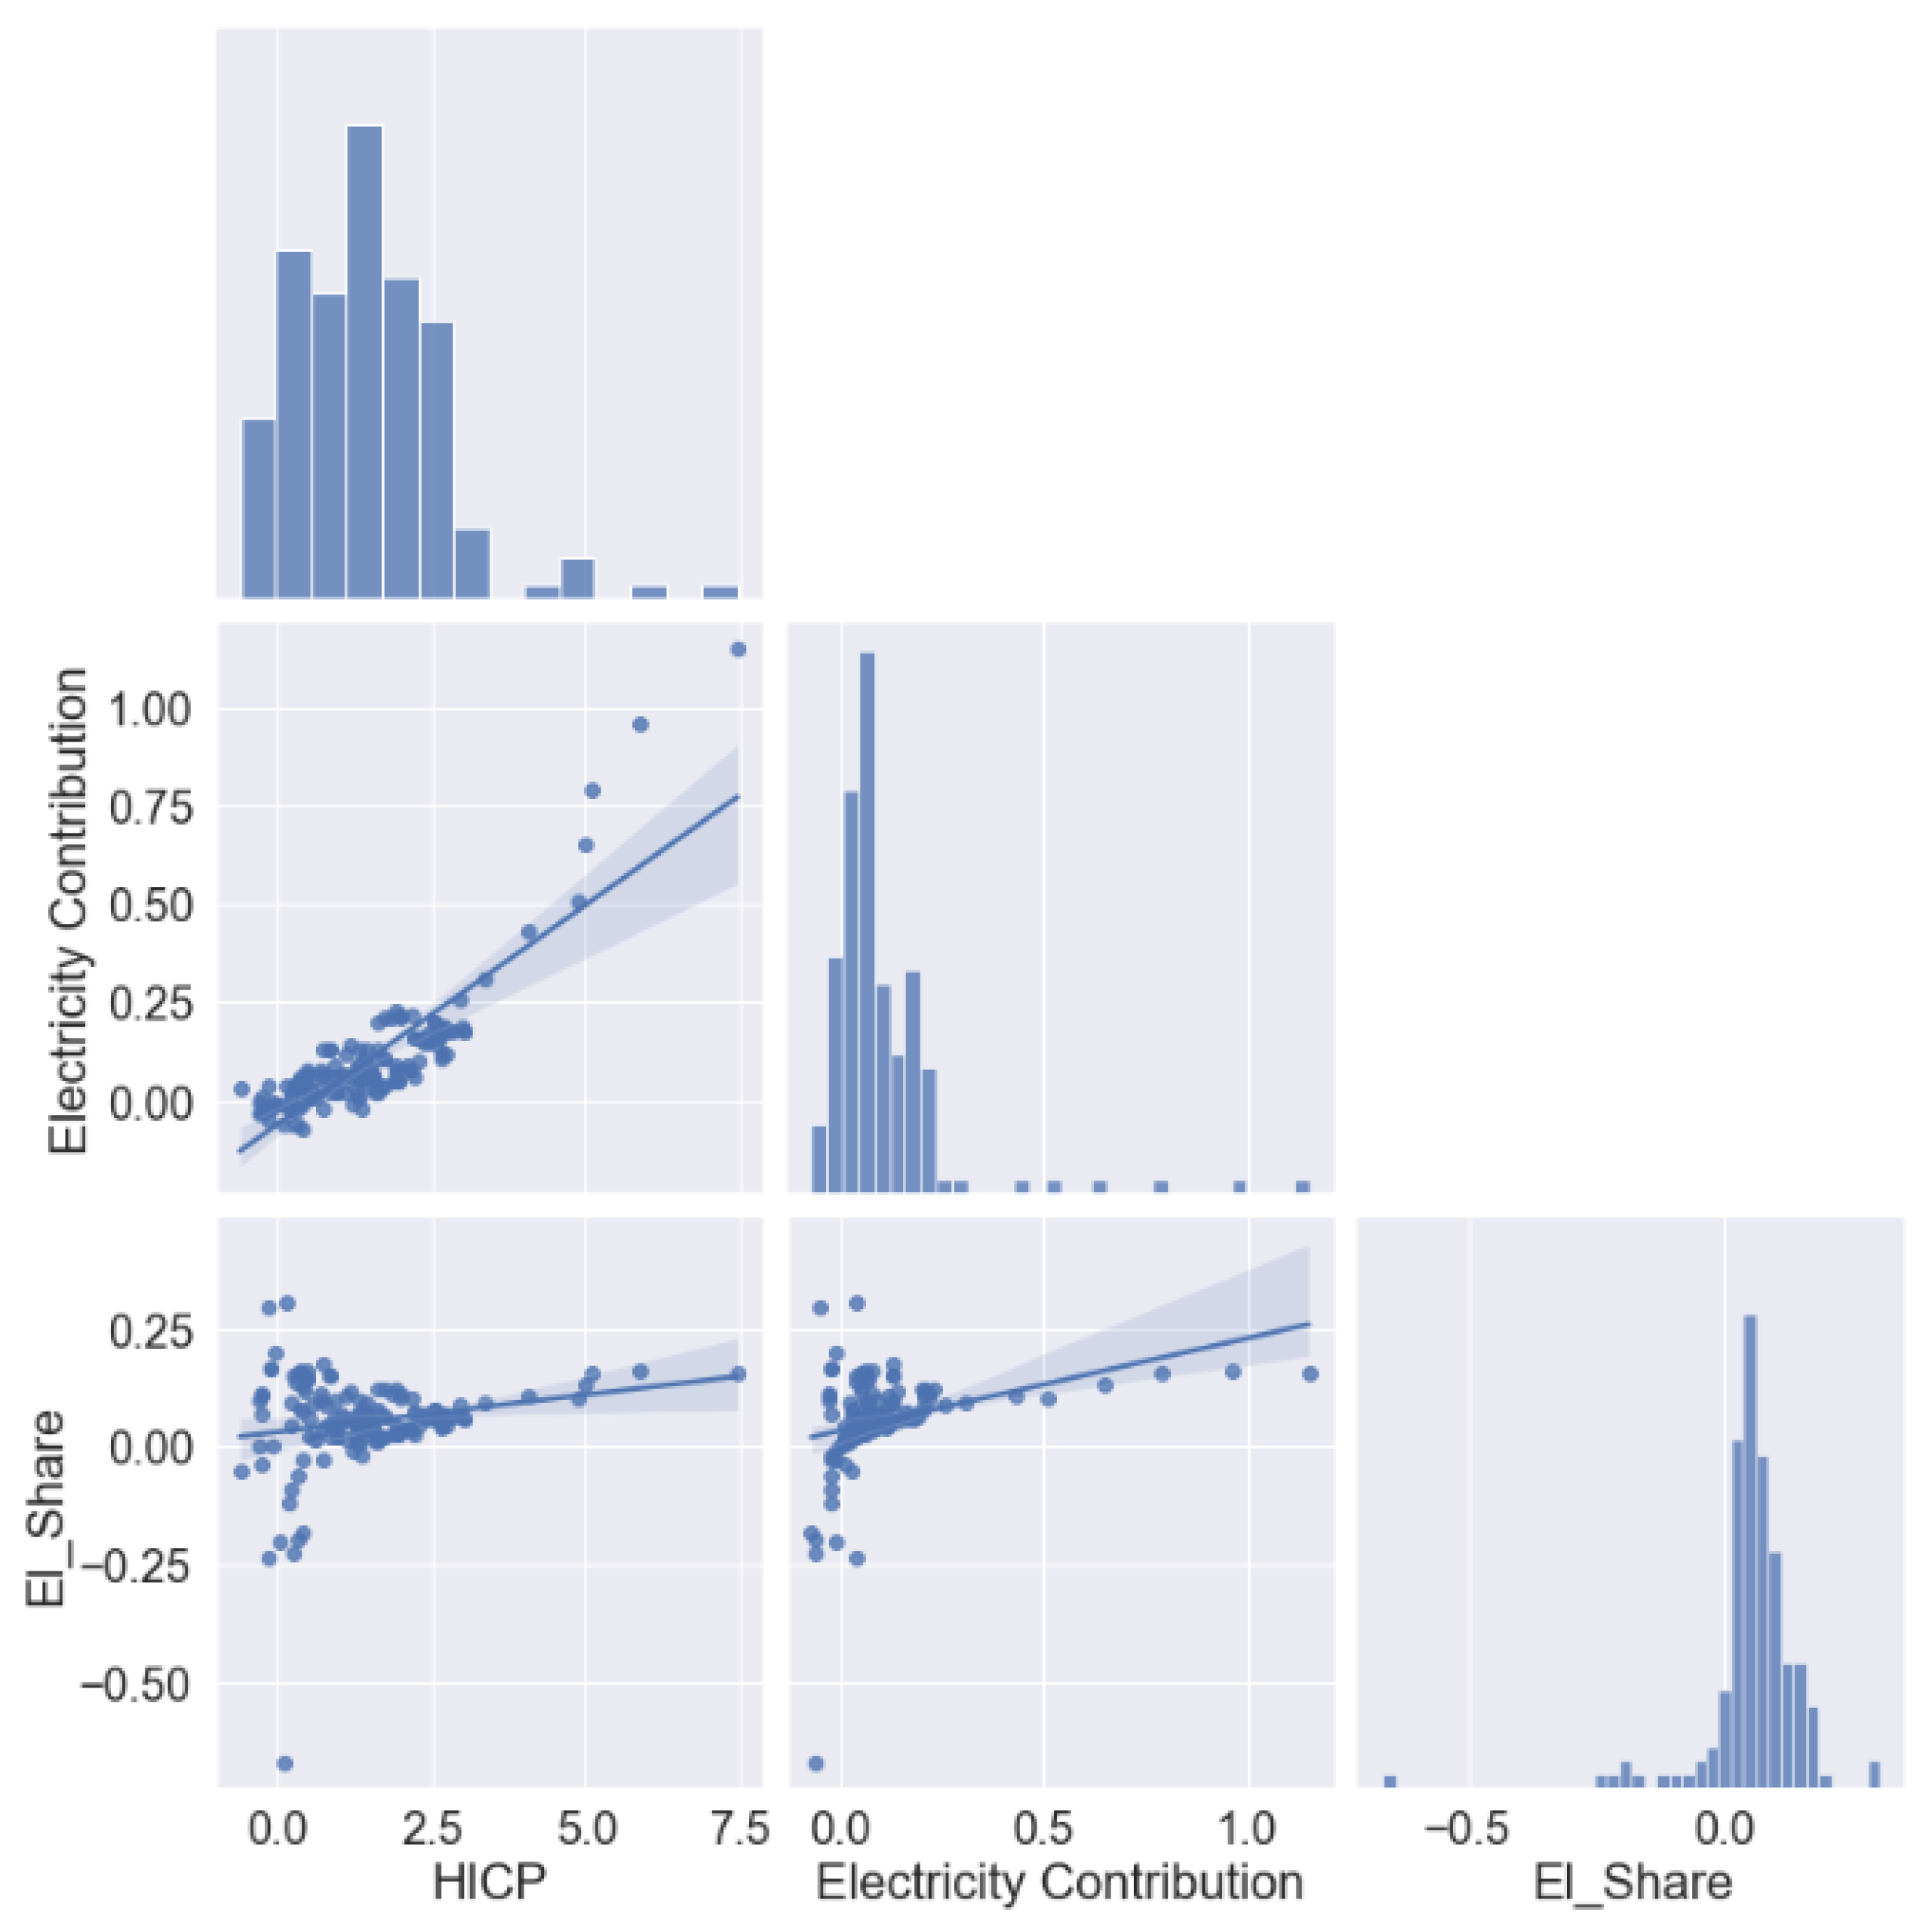
HICP and its electricity contribution seem to have ambiguous associations before 2009. Then, they display a rather pronounced positive relationship between electricity contribution and HICP. This results in a positive link between electricity contribution and its share in HICP before 2009 and an ambiguous relationship afterwards.
Simple linear regression of electricity contribution on HICP shows a much stronger linear relationship after 2009 (results are presented in Table 3). It appears that before 2009, electricity prices had little impact on overall HICP, but since 2009, if the electricity prices soar, so does inflation. These observations lead us to a conjecture that electricity might be a new propeller of the inflation in the Eurozone and possibly other countries. Based on differences in electricity inflation share in HICP, we suspect that electricity plays a starker role in inflation.
Figure 4 plots electricity contribution, HICP, the share of electricity contribution on HICP and histograms for each time series in the period from 2002 to the end of 2008. The variation of electricity contribution explains only 9% of the variation in HICP.
Figure 5 plot electricity contribution, HICP, the share of electricity contribution on HICP and histograms for each time series from 2010 to the end of 2021. After 2009, the variation of electricity contribution explains 69% of the HICP variation.
3.2. Model Specification
Most papers on commodity prices’ impact on inflation employ variations of the VAR model for the analyses. However, we opted for a different econometric framework than the VAR. Eurostat reports electricity prices biannually. Therefore, there is no sufficiently long time series to employ such an approach. On the other hand, the data provide a cross-sectional basis. That is, they are reported for most European countries. Therefore, to assess the impact of electricity on the European countries’ inflation and control for the differences among the countries, we think the best way is to use a panel data approach. Papers studying oil prices pass-through into inflation exploit the fact that these are higher frequency data with one oil price while electricity prices differ across countries. Our analysis considers that there is no single price of electricity in Europe but many of them with country-related specifics [42].
We utilise a panel data approach to control for the country-specific and time-specific unobserved heterogeneity that could bias the results. Thus, we hope that using a fixed-effects panel data approach will enable us to capture the electricity impact on headline inflation with better success than a time series approach.
We employ a two-way fixed effects model with lagged variables,
where:
Yit = β1Xit +…+ βkXkt + γ1Xit−1 +…+ γ kXkt−1 + αi +λt+ μit
Y is the dependent variable,
X is the independent variable,
β is a coefficient for independent variables,
γ is a coefficient for lagged independent variables,
αi is an unobserved entity-specific effect,
λt is an unobserved time-specific effect,
μit is an error term.
The coefficients of interest are β and γ. These are the effects of independent variables and lagged independent variables. All the standard errors are reported as heteroskedasticity robust.
3.3. Data
The equations are established using biannual and annual data across all available countries reported by Eurostat. The data thus covers the European Union and other European countries spanning from 2009 to the most actual one, which is mostly the first half of 2021. The code with the source data is included in the Appendix.
3.3.1. Dependent Variable
The dependent variable is inflation, excluding energy. In the case of the biannual date that suffers from seasonality, we use the first difference from the same period of the previous year.
3.3.2. Independent Variables
The key independent variable is the electricity price of the non-household consumer in Euros. Eurostat reports the data biannually and across several consumption bands. We provide the results of the lowest consumption band, but we ran trials with higher consumption bands, and the effect of swapping between consumption bands on the results was negligible. The electricity prices include taxes and levies.
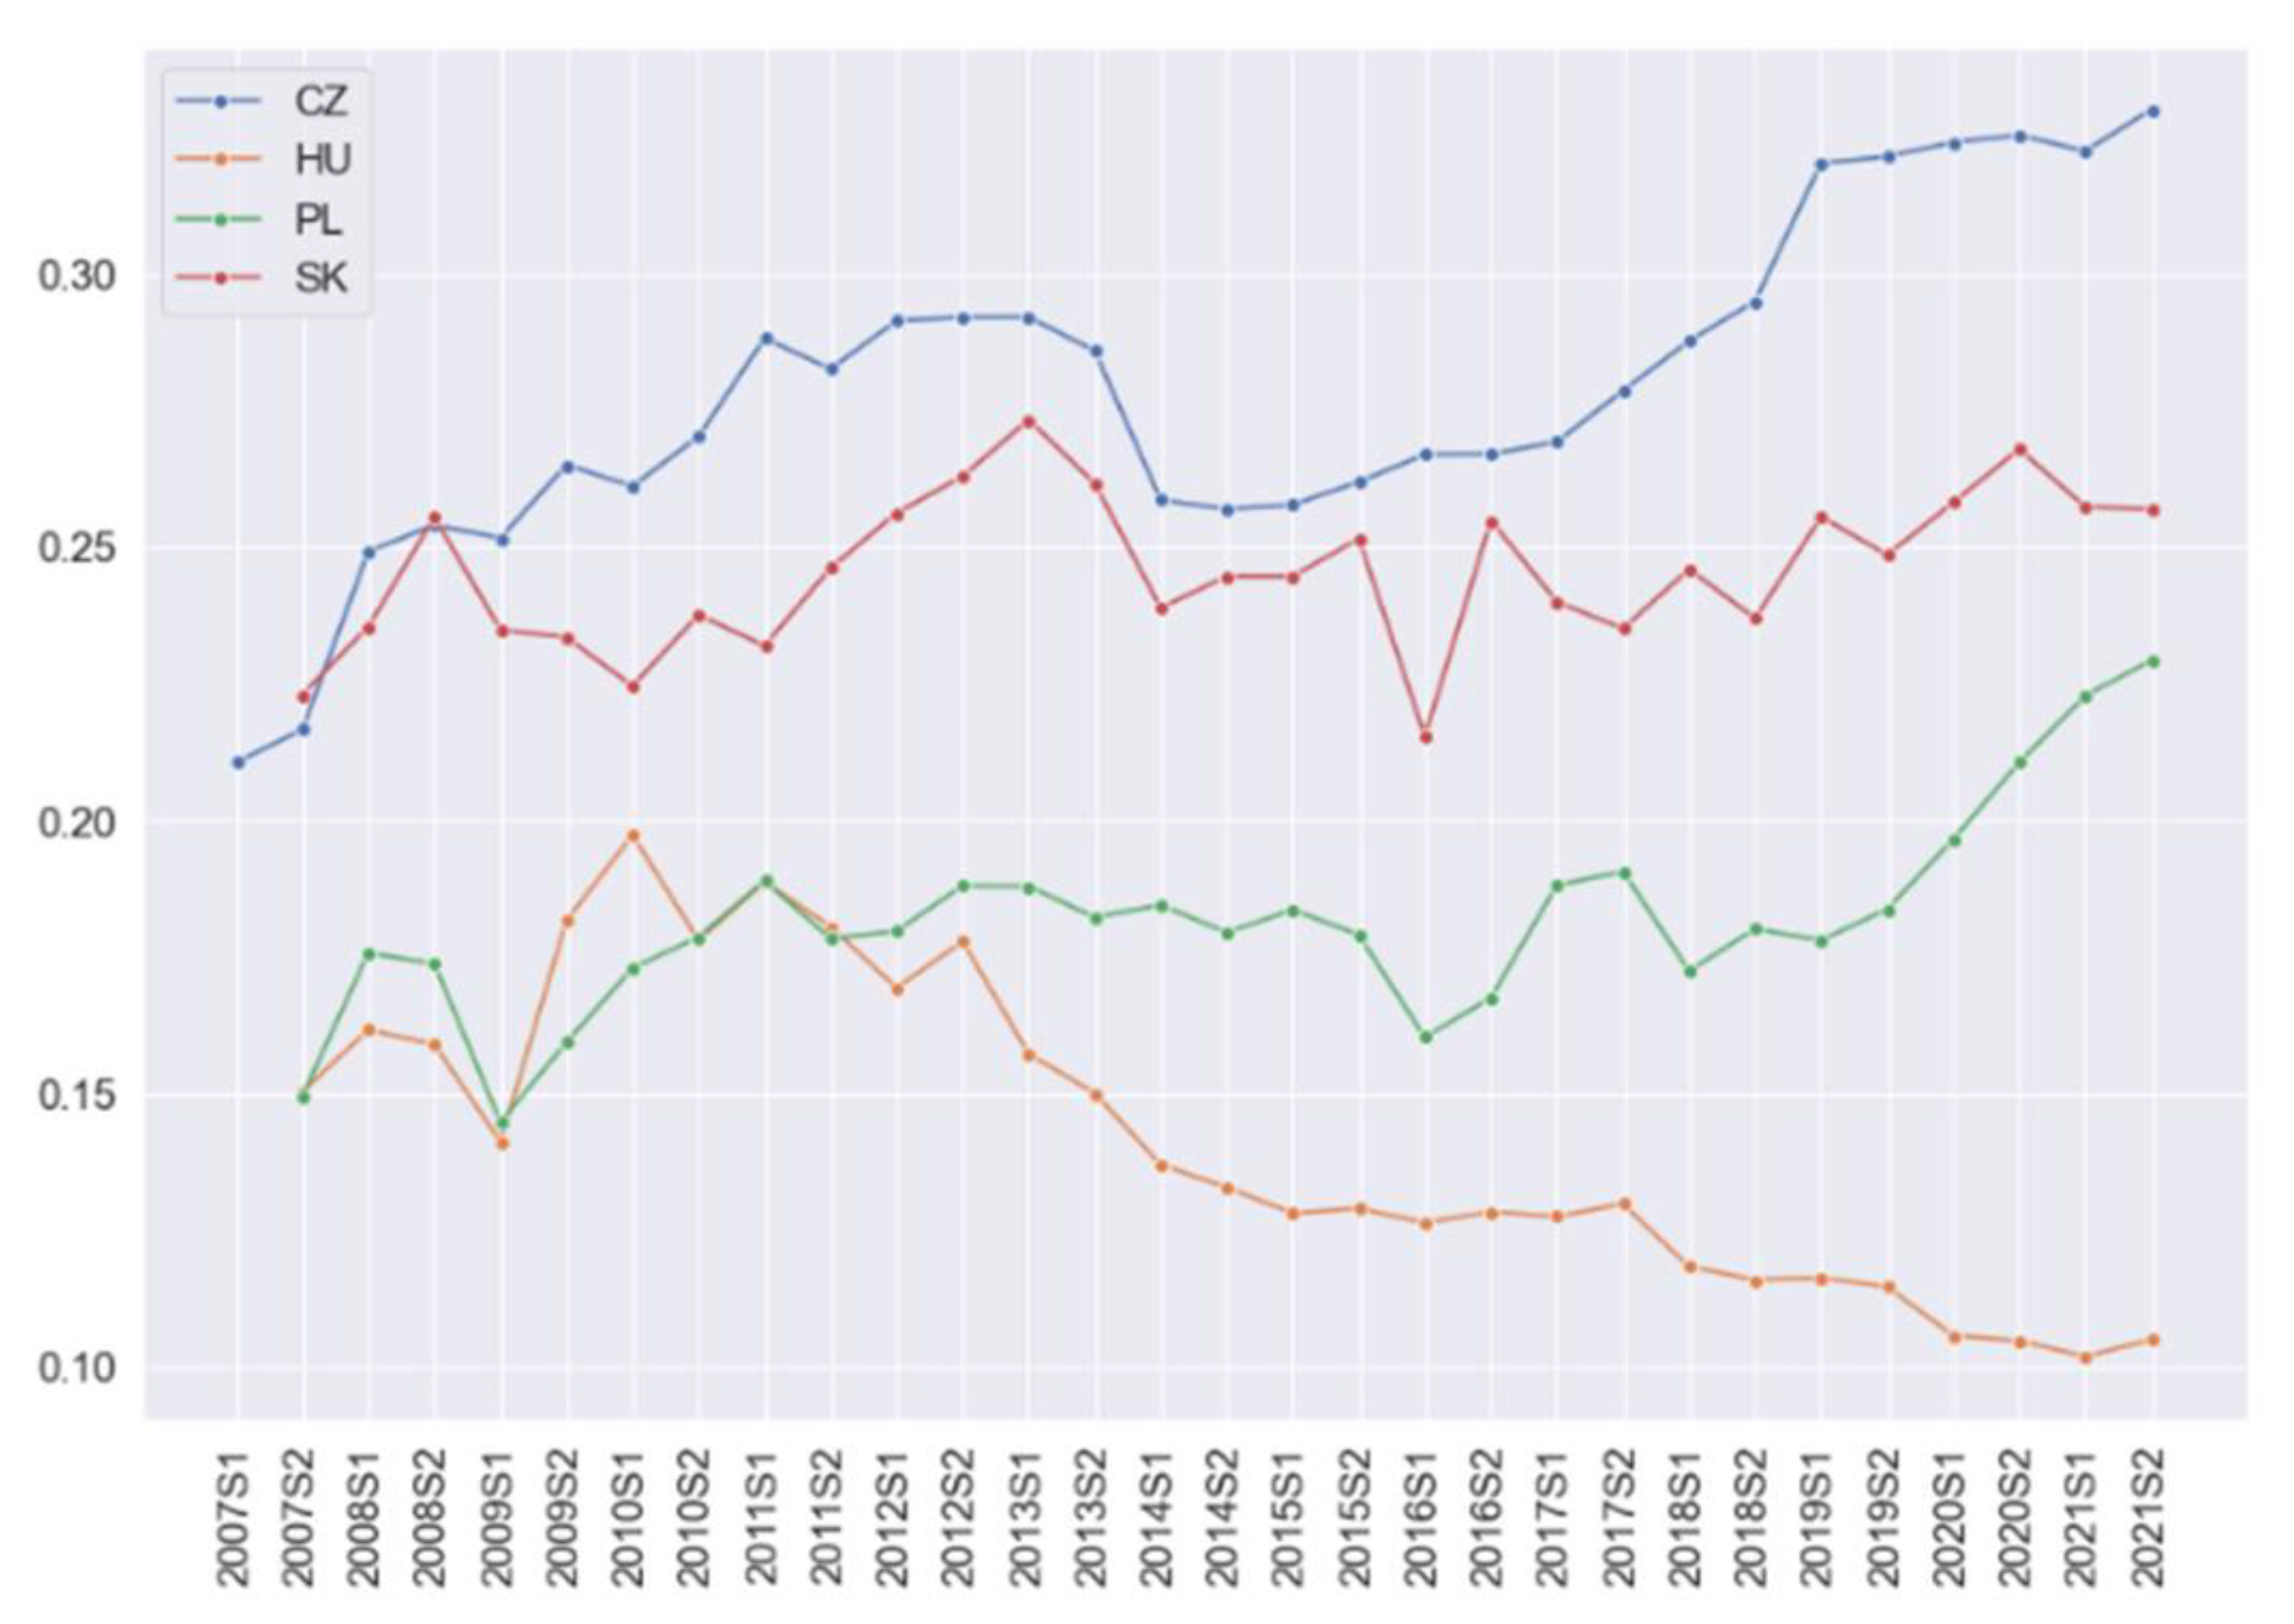
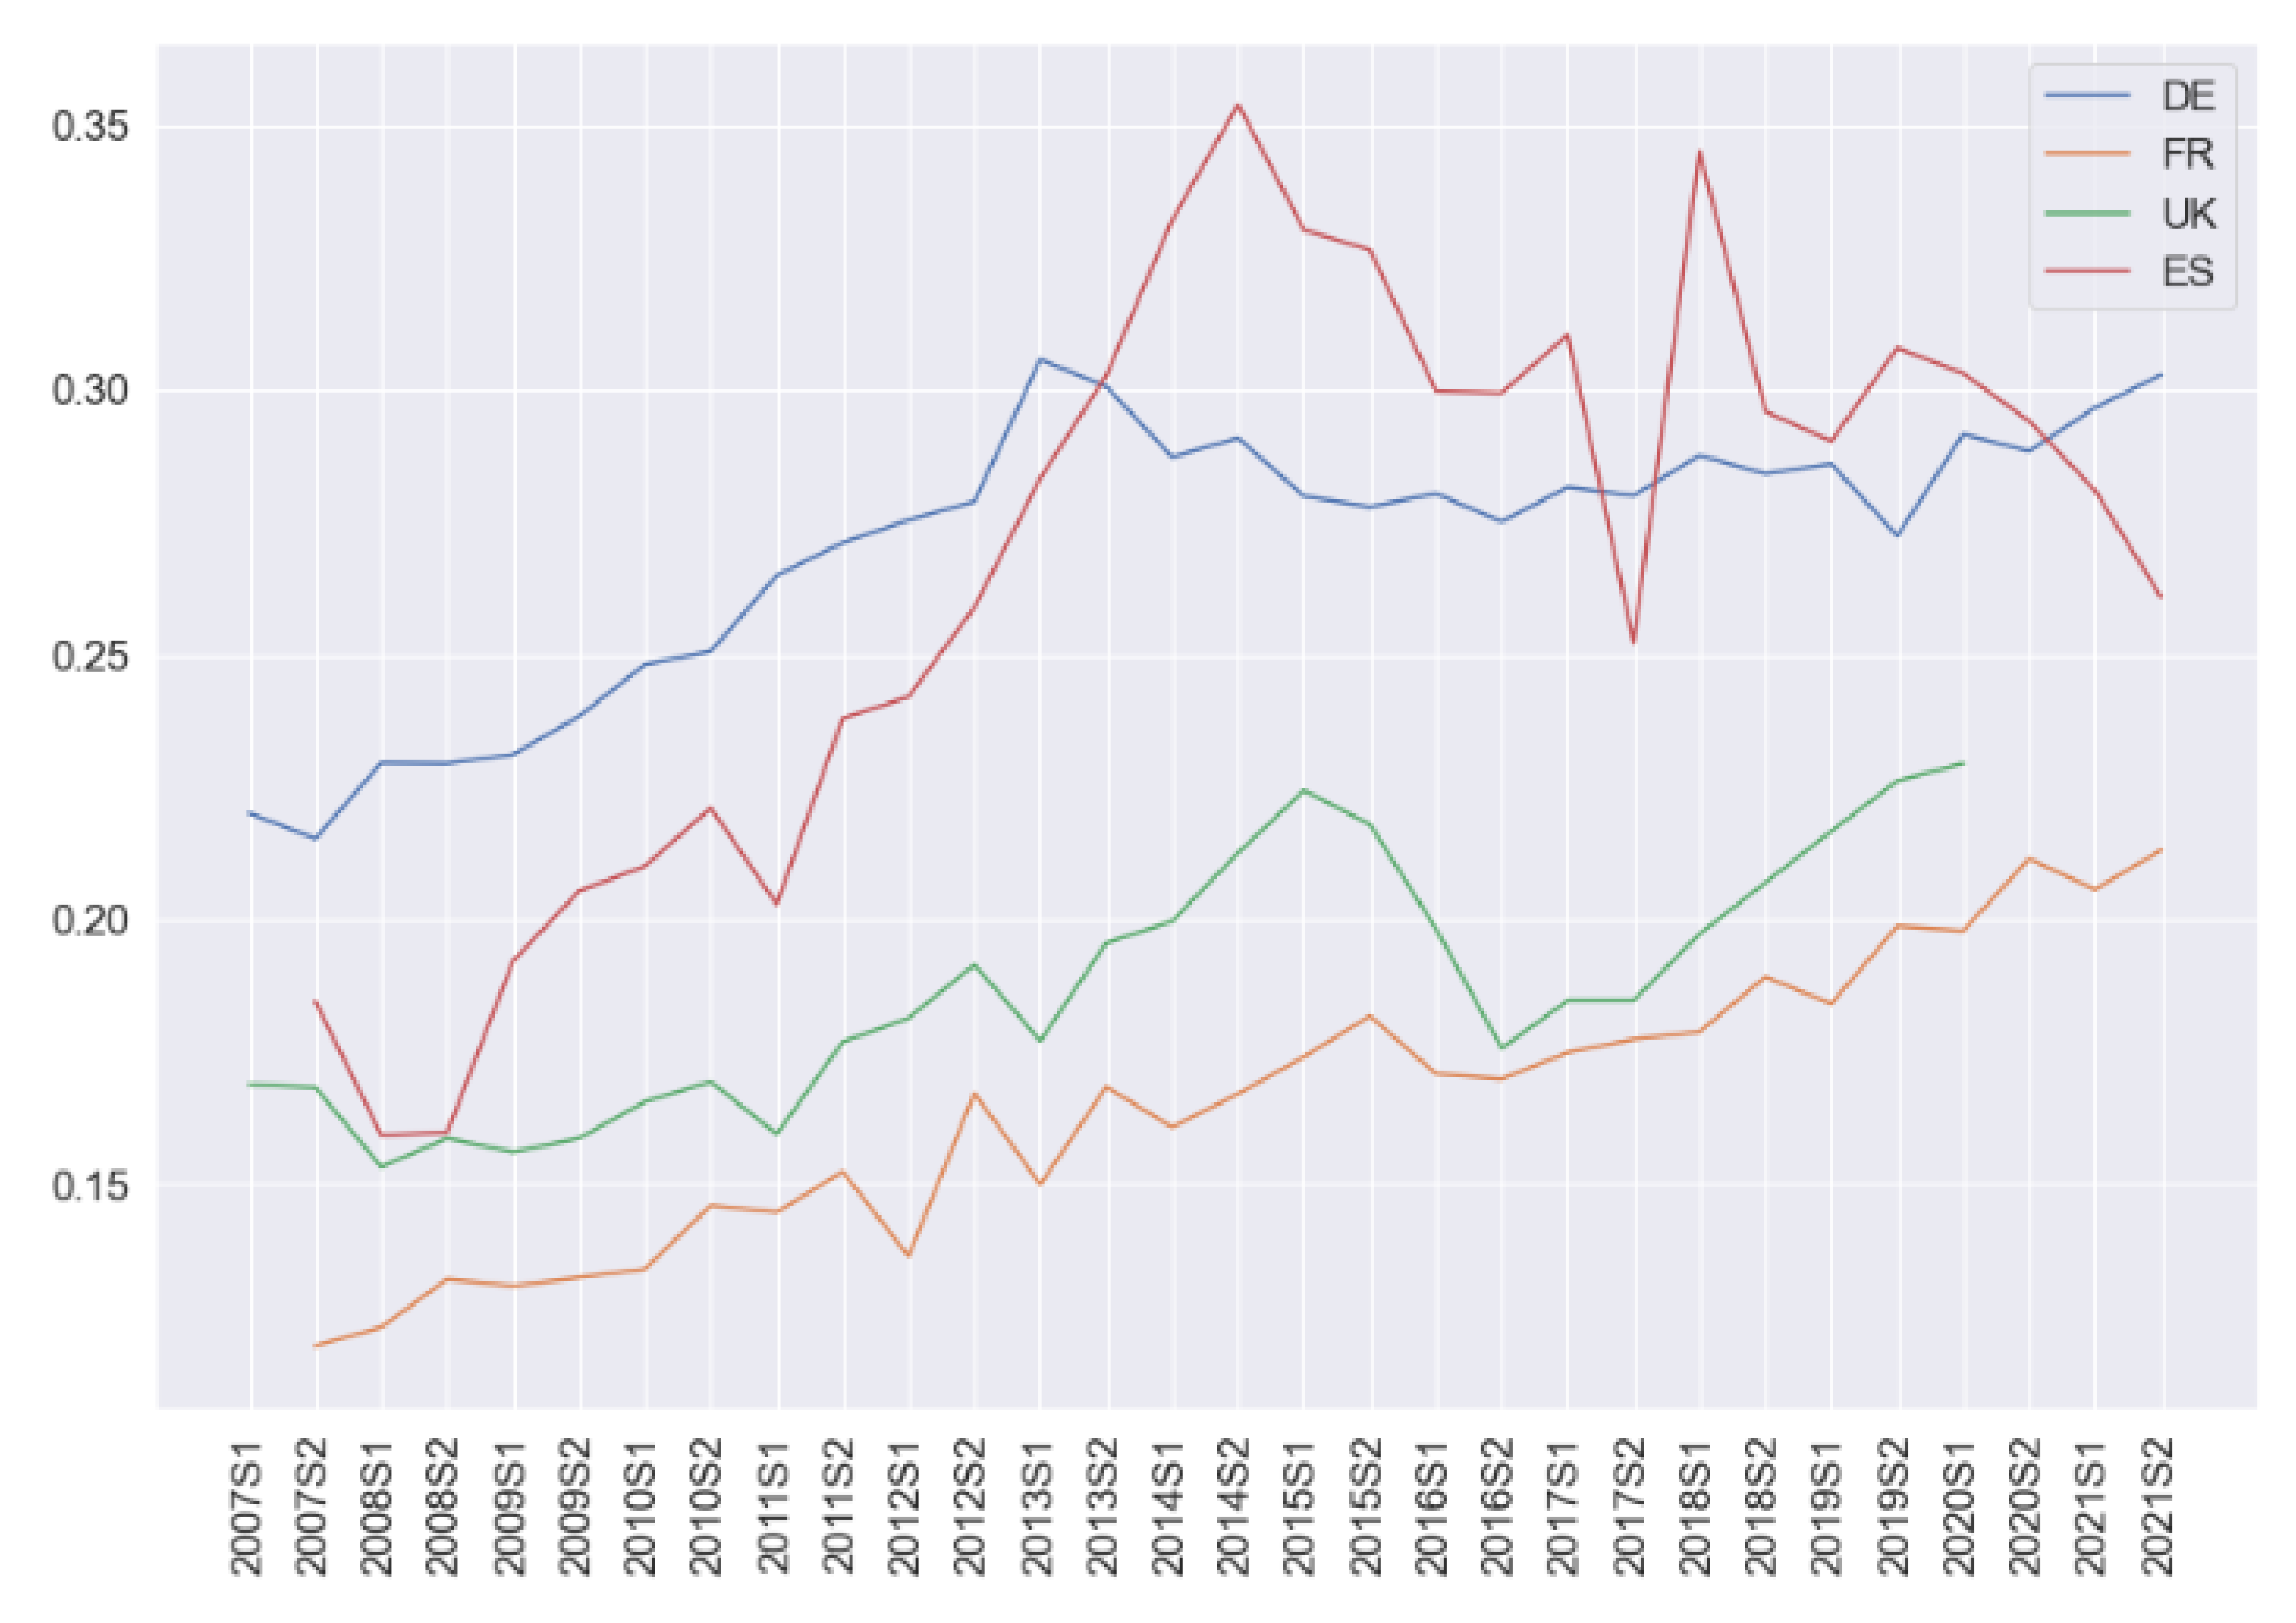
Figure 6 and Figure 7 plot the time series of electricity prices in selected countries. The upper figure show V4 countries, and the bottom one show large European economies.
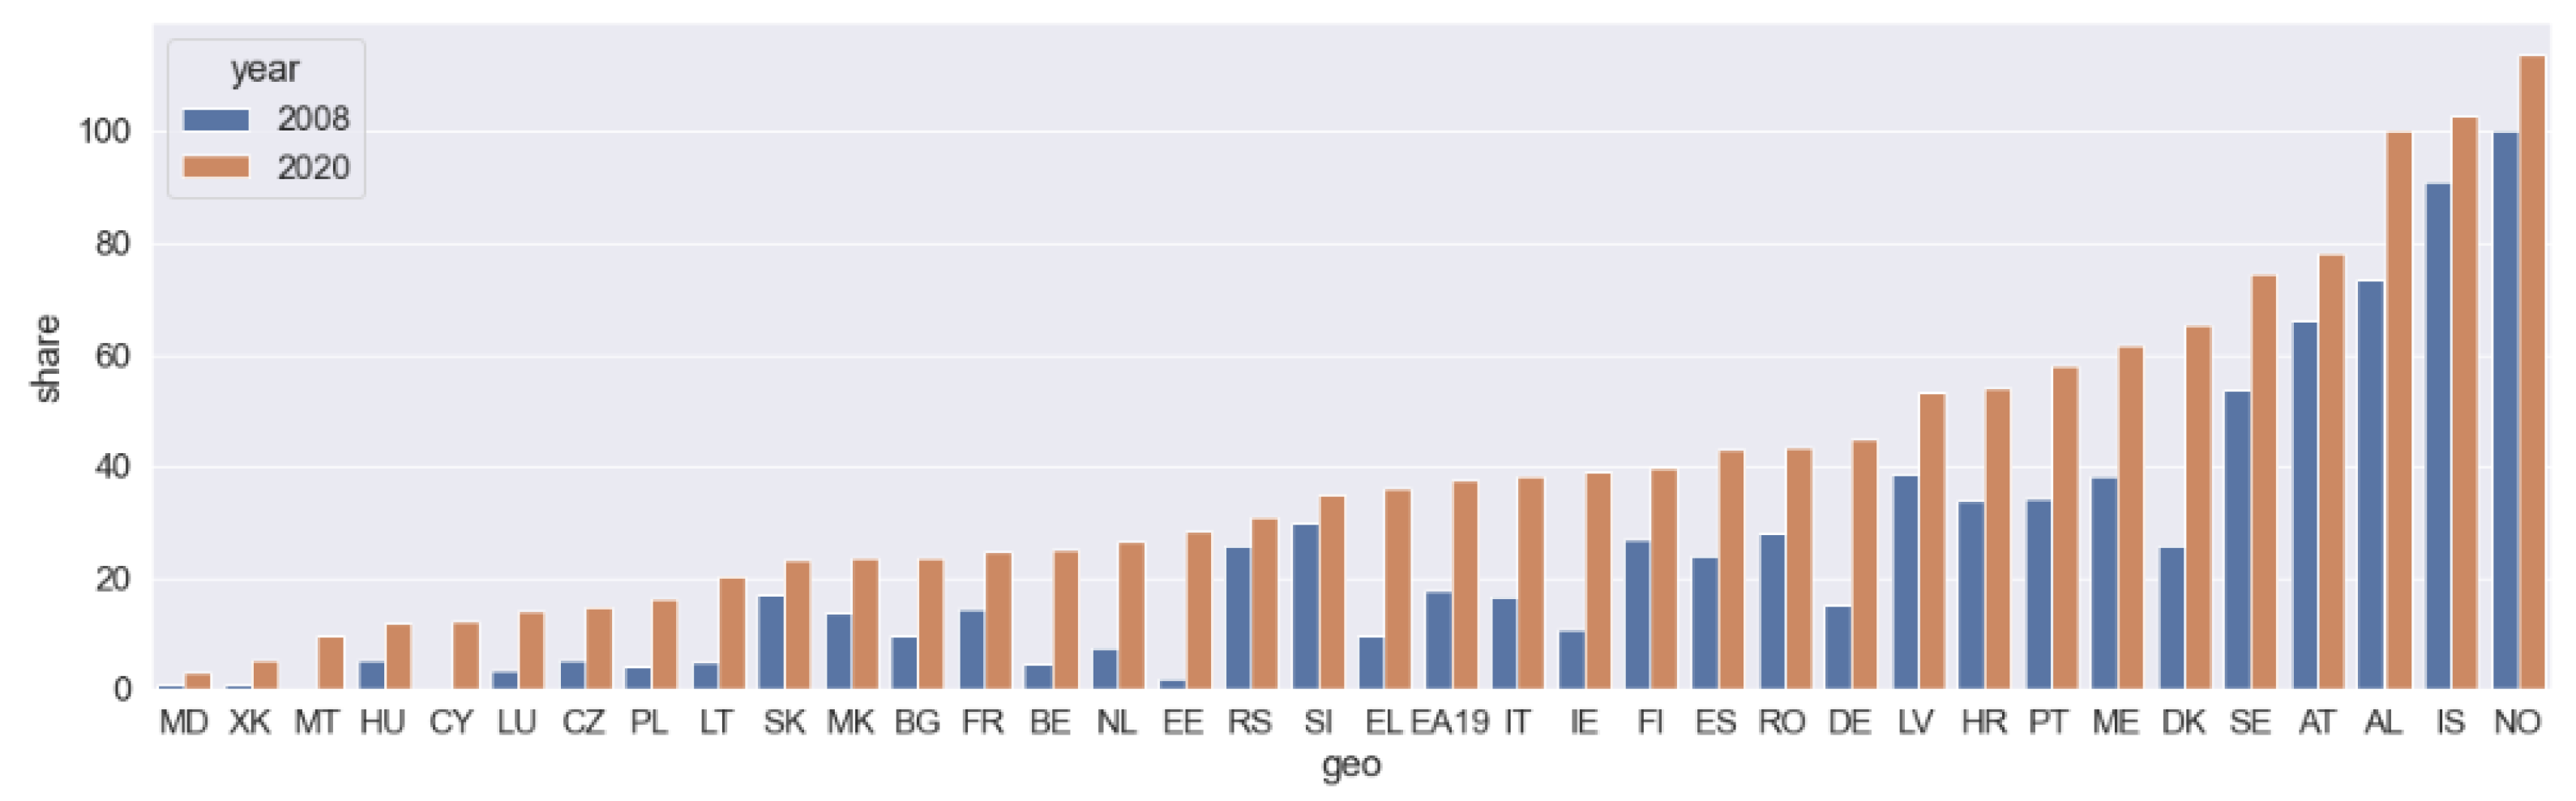
Eurostat reports the share of RES on electricity consumption annually and as a percentage. It is defined as gross electricity production from RES/gross final electricity consumption. Therefore, if a country produces more electricity than it consumes, the index may surpass 100% as in Norway’s case in 2020.
Real GDP growth is used to control for macroeconomic development in the examined countries.
To control the exchange rate impact on inflation, we include the nominal effective exchange rate in the regression.
As the Quantity Theory of Money (QTM) states, a rate of change in a money supply induces a proportional change of inflation. We use broad money year-on-year change compiled and published by FRED from the Federal Reserve Bank of St. Luis to account for changes in the money supply. New Keynesian Philips Curve (NKPC) literature suggests that the best explanatory variables are past inflation rate, the output gap, inflation expectations, exchange rate and food and energy prices [97].
Out of the mentioned predictors, we only omit the expected inflation, as we assume an adaptive expectation framework. This, we believe, is expressed by the inflation lag. We also differ in the use of product growth instead of the output gap.
Figure 8 shows the share of RES on electricity consumption in 2008 and 2020 in European countries and EA19.
4. Results and Discussion
This section presents the results of several specifications of the above model to assess the effect of electricity prices and the share of renewables in electricity consumption on inflation.
First, the simplest model that exploits the highest frequency of reported electricity prices is biannual. There is no association between biannual electricity prices and biannual inflation. Very low adjusted R2 shows that electricity prices have little power to explain the inflation variance. In Table 4, results are tabulated for biannual inflation and biannual inflation deseasonalised fixed effects. Analogical random effects with Hausman tests are provided in the appendix. Nevertheless, we only found out that the specification is not sufficient to (dis)prove anything.
Therefore, we added more independent variables. These additional explanatory variables are reported annually. Thus, the frequency of the data lessens. W also included lagged values of the independent variables, as we suspect that their changes have a transmission period that postpones the effect by one year. Once we control for lags, the explained variance presented by adjusted R2 increases to around 36%. This means that although there are still some other influences that we did not or could not capture by the model, we are getting closer. The statistically significant nominal effective exchange rate coefficients and its lag and real GDP growth lag are coherent with economic theory. Additionally, the lag of inflation is firmly statistically significant. We still cannot confirm our conjecture that the electricity prices are (secondarily) impacting inflation. However, the regression presented in Table 5 confirms that the share of renewable electricity consumption is negatively associated with inflation across all specifications of the regressions.
In the last regression specification, we added the broad money change as the money supply indicator. We could afford to use the random effects specification and exploit its better efficiency. As a result, the model’s adjusted R2 rises to 65%. Broad money lag has a significant positive impact on inflation, as anticipated by QTM or NKPC.
Here, we obtain convincing proof that electricity has a strong secondary impact on inflation across European countries. Results are presented in Table 6. The share of RES’s negative association with inflation is also confirmed. Other independent variables, such as GDP lag, nominal effective exchange rate and broad money change lag, have their values aligned with economic theory.
4.1. Overall Results
The paper focused on the relationship between electricity prices and inflation excluding it; that is, the secondary effect of electricity prices on inflation. In other words, the electricity–inflation pass-through. The secondary goal was to assess the effect of renewable electricity consumption on inflation. When we accounted for all the standard macroeconomic culprits of inflation, the secondary electricity impact on inflation turned out to be large and positive. Additionally, we found a significant negative association between renewable electricity consumption and inflation.
4.1.1. Electricity Prices
Eurostat reports contribution to HICP for EA19 monthly. We ran simple linear regressions of electricity contribution to HICP on HICP excluding electricity in the period prior to 2009 (before) and post-2009 (after). From 2002 to 2009, there was no significant association between electricity contribution to HICP with HICP excl. electricity.
Despite this, the effect of electricity has been substantial since 2009. If the electricity contribution after 2009 increased by one percentage point, then the HICP increased on average; other contributions were held constant by six percentage points. Thus, monthly data for the whole Eurozone display a strong impact of electricity prices on the Eurozone inflation.
In the further analysis, we focused on electricity prices across Europe. We decided to use panel data-based models as most European countries report their electricity prices biannually.
In this approach, we controlled for entity and time effects. To control for internal macroeconomic effects, we employed real GDP growth. In addition, a nominal effective exchange rate was used to capture the external impact on countries’ inflations and money supply. Finally, in some model specifications, we used lagged independent variables.
If we included all the regressors mentioned earlier, even with their lags, the electricity prices across all the countries had a strong positive pass-through effect on inflation, excluding energy prices. The panel data results confirmed the strong link between inflation and monthly electricity prices reported for EA19.
The results prove that electricity is strengthening its position among energies, and monetary authorities should be aware of its increasing spillover effect into inflation. The effect is confirmed in the panel data analysis across 27 European countries, so for the Eurozone as a single entity.
4.1.2. Renewable Electricity Sources
The strong link between lower inflation and higher renewable electricity generation (consumption) is evident across all possible regression specifications. The result is in line with Gelabert, Labandeira and Linares [66]. They explain the negative link because there are virtually no variable costs for a large share of the renewable electricity power plants. Therefore, the fixed cost (entry to the market) is significant. As renewable electricity powerplants become more widespread, the economies of scale decrease the price of electricity.
The paper mentioned above only proves it empirically on the Spanish data. Confirming the result for Europe is one of the main contributions of this paper. The larger the share of renewable electricity, the cheaper it may become. The effect then trickles into real inflation.
Eurozone data for HICP and electricity contribution to HICP started to behave differently after 2009. Specifically, electricity contribution appears to have a positive linear relationship to HICP. In the period before 2009, it was not the case. Therefore, we suspected that the electricity prices might have strengthened their role in impacting inflation. We ran several specifications of fixed effects regressions across European countries to assess the conjecture. We cannot confirm that electricity prices significantly impact inflation, excluding energy. However, we also included the share of RES on the electricity consumption, which has solid statistical significance across all the models and is negatively associated with inflation. This finding might need further exploration.
Subsequent research could capture the correlation between energy prices and mid-term inflation expectations concerning the recent sharp increase in energy prices. The question is whether the energy price increase can be regarded as a one-time negative cost shock that was since disregarded by monetary authorities (in the case of oil shocks, for example). Recent energy price development may initiate a revision of such an approach of monetary policymakers. From a monetary policy perspective, this raises the issue of controlling the core inflation is still helpful to anchor the medium-run inflation expectations.
For energy sources such as gas and oil, we have a long period of time in terms of monitoring supply and demand shocks [98,99]. Electricity has not yet been directly correlated with these energy sources. The price has evolved naturally, which has changed significantly over the last decade with a view to increasing the emphasis on sustaining life on the planet. Electricity generation is increasingly produced from RES. Traditional coal production is being replaced by a less environmentally harmful commodity gas. Over time, there has been a greater dependence on gas and oil producers. We are currently seeing the materialisation of the significant risks in the production territories on which Europe depends.
Given the transformation of European economies in particular into electricity (moving away from fossil fuels), an increase in electricity demand can justifiably be expected in the future. Together with changes in the way electricity is produced, we can enter a state of dangerous supply and demand shocks at the same time, which significantly increases the risk of an inflationary spiral.
5. Conclusions
The paper aimed to examine the relationship between electricity prices and their pass-through to inflation. To our knowledge, there is no such paper with the same focus. Although the importance of electricity has increased, similar articles research the impact of energy commodities on inflation. Electricity prices pass-through to inflation across most European countries based on annual panel data is significant. Additionally, electricity prices pass-through to inflation for the whole Eurozone have become strong and significant monthly since 2009. The results highlight the increasing role of electricity in European economies.
This review highlighted the changing weight of electricity prices in impacting inflation. It proves that the contribution of electricity to energy consumption is rising, increasing its impact on effective inflation and inflation expectations. However, this trend is not reflected, in inflation calculations. Energies in the consumption basket relevant to inflation predictions are electricity, gas, heat energy and liquid and solid fuels. Their weight in HICP amounted to 9.5% [100]. Regarding the recent price dynamics of energy prices, we identified a need for revision for electricity weight in HICP as we believe that this weight does not reflect the real impact of energy (mainly electricity) prices on inflation and its leakage do other items of the consumption basket.
Our analysis of inflationary pressures across Europe found that the share of renewable electricity consumption is negatively associated with inflation. This is in line with the conclusions of Gelabert, Labandeira and Linares [66], who researched the impact of renewable electricity on Spanish inflation. They also concluded that the larger the RES share, the more negative effect on the inflation.
Our results show that energy price shocks are likely to be repeated more frequently and thus cannot be disregarded as one-shot events in formulating monetary policy. This research confirms that energy prices have a significant impact on inflation expectations. We argue that policy coordination between fiscal and monetary authorities is essential as energy prices are traditionally subject to regulation.
Events that followed the global spread of COVID-19 and the Russian-Ukrainian war are real examples of how uncertainty can severely impact the global economy. The economic outlook is more uncertain than ever and vulnerable to uncertainty surrounding broad economic policy decisions by all stakeholders and governments [101]. The impact of political, regulatory, monetary and economic uncertainty extends to commodity markets, such as the negative impact on oil (fuels), gas and electricity markets, as well as to other areas such as tourism [101]. These perceived uncertainties may be why the overall economic activity is shrinking [102,103] and thus should not be underestimated.
Author Contributions
Conceptualisation, B.K. and P.Ř.; methodology, A.Č.; software, O.B.; validation, O.B. and A.Č.; formal analysis, A.Č. and O.B.; investigation, O.B.; resources, A.Č.; data curation, O.B.; writing—original draft preparation, A.Č. and O.B.; writing—review and editing, B.K. and P.Ř.; visualisation, O.B. and A.Č.; supervision, B.K. and P.Ř.; project administration, B.K. and P.Ř.; funding acquisition, B.K. and P.Ř. All authors have read and agreed to the published version of the manuscript.
Funding
This research was funded by the University of Business and Economics in Prague, grant number IGS, VŠE F5/2/2020 and Fakultni Institucionalni Podpora IP 500040.
Institutional Review Board Statement
Not applicable.
Informed Consent Statement
Not applicable.
Data Availability Statement
We have provided exact information about data used in Appendix A.
Conflicts of Interest
The authors declare no conflict of interest.
Appendix A
(1): Eurostat, HICP—monthly data (annual rate of change). Accessed on 12 February 2022. Retrieved from https://ec.europa.eu/eurostat/databrowser/view/PRC_HICP_MANR__custom_2080815/default/table?lang=en/. (2): Eurostat, HICP—annual data (average index and rate of change). Accessed on 12 February 2022. Retrieved from https://ec.europa.eu/eurostat/databrowser/view/PRC_HICP_AIND__custom_2080774/default/line?lang=en/. (3): Eurostat, HICP—contributions to EA annual inflation (in percentage points). Accessed on 12 February 2022. Retrieved from https://ec.europa.eu/eurostat/databrowser/view/PRC_HICP_CTRB/bookmark/table?lang=en&bookmarkId=bac11816-2418-49ca-8966-654723b72928/. (4): Bruegel. National policies to shield consumers from rising energy prices. Accessed on 12 February 2022. Retrieved from https://www.bruegel.org/publications/datasets/national-policies-to-shield-consumers-from-rising-energy-prices/.

Table A1.
Data retrieved from Eurostat, FED, and Bruegel.
| Use | Source | Where |
|---|---|---|
| Share of gas in electricity generation | Eurostat: NRG_BAL_C | Introduction |
| Annual inflation rates | Eurostat: PRC_HICP_MANR | Figure 1 |
| Annual inflation rates time series | Eurostat: PRC_HICP_AIND | Figure 2 |
| Contribution to the EA inflation | Eurostat: PRC_HICP_CTRB | Table 1 and Table 3 |
| Electricity contribution in EA HICP | Eurostat: PRC_HICP_CTRB | Figure 3, Figure 4 and Figure 5 |
| Non-household electricity prices | Eurostat: NRG_PC_205 | Figure 6 and Figure 7 |
| Share of renewable sources on electricity consumption | Eurostat: NRG_IND_REN | Figure 8 |
| Regression electricity prices on inflation | Eurostat: PRC_HICP_MIDX Eurostat: NRG_PC_205 | Table 4 |
| Regression electricity prices on inflation with control for macroeconomic variables | Eurostat: PRC_HICP_MIDX Eurostat: NRG_PC_205 Eurostat: SDG_08_10 Eurostat: TIPSER11 Eurostat: NRG_IND_REN FRED ST. Louis FED: Liquid Liabilities (Broad Money) | Table 5 and Table 6 |
| National policies to shield consumers from rising energy prices | Bruegel. | Table 2 |
References
- Chiou-Wei, S.Z.; Chen, C.-F.; Zhu, Z. Economic growth and energy consumption revisited—Evidence from linear and nonlinear Granger causality. Energy Econ. 2008, 30, 3063–3076. [Google Scholar] [CrossRef]
- Kanagawa, M.; Nakata, T. Assessment of access to electricity and the socio-economic impacts in rural areas of developing countries. Energy Policy 2008, 36, 2016–2029. [Google Scholar] [CrossRef]
- Brodny, J.; Tutak, M. Analyzing Similarities between the European Union Countries in Terms of the Structure and Volume of Energy Production from Renewable Energy Sources. Energies 2020, 13, 913. [Google Scholar] [CrossRef] [Green Version]
- Karekezi, S.; Kimani, J. Have power sector reforms increased access to electricity among the poor in East Africa? Energy Sustain. Dev. 2004, 8, 10–25. [Google Scholar] [CrossRef]
- Nouni, M.; Mullick, S.; Kandpal, T. Providing electricity access to remote areas in India: Niche areas for decentralized electricity supply. Renew. Sustain. Energy Rev. 2008, 34, 430–434. [Google Scholar] [CrossRef]
- Oseni, M. Household’s access to electricity and energy consumption pattern in Nigeria. Renew. Sustain. Energy Rev. 2012, 16, 990–995. [Google Scholar] [CrossRef]
- Gao, J.; Zhu, S. A New Structural Analysis of Inflation and Economic Activity. Int. J. Econ. Sci. 2019, VIII, 35–51. [Google Scholar] [CrossRef]
- Pala, A. The Relation between Climate Change and Economic Growth: The Investigation The Regional Differences with RCM Model in EU-28 Countries. Int. J. Econ. Sci. 2020, IX, 135–155. [Google Scholar] [CrossRef]
- Kumar, N.; Reddy, A. Development, Energy and Enviroment: Alternative Paradigms. Department of Management Studies, Indian Institute of Science, Bangalore, 560 012. Available online: http://amulya-reddy.org.in/ (accessed on 4 February 2022).
- Rakin, P.D.; Margolis, R.M. Global Energy, Sustainability, and the Conventional Developlment Paradigm. Energy Sources Part A Recovery Util. Environ. Eff. 1998, 20, 363–383. [Google Scholar]
- Saygın, H.; Çetin, F. New Energy Paradigm and Renewable Energy: Turkey’s Vision. Insight Turk. 2010, 12, 107–128. [Google Scholar]
- Turton, H.; Barreto, L. Long-term security of energy, supply and climate change. Energy Policy 2006, 34, 2232–2250. [Google Scholar] [CrossRef]
- Schnabel, I. Member of the Executive Board of the ECB, A New Age of Energy Inflation: Climateflation, Fossilflation and Greenflation. Speech at a Panel on “Monetary Policy and Climate Change” at the ECB and Its Watchers XXII Conference, Frankfurt am Main, 17 March. Available online: https://www.ecb.europa.eu/press/key/date/2022/html/ecb.sp220317_2~dbb3582f0a.en.html (accessed on 31 March 2022).
- Pisani-Ferry, J. The Case for Green Realism. Project Syndicate. Available online: https://www.project-syndicate.org/commentary/green-new-deal-costs-realism-by-jean-pisani-ferry-2019-02 (accessed on 31 March 2022).
- Gupta, E. Oil vulnerability index of oil-importing countries. Energy Policy 2008, 36, 1195–1211. [Google Scholar] [CrossRef]
- Dorian, J.P.; Franssen, H.T.; Simbeck, D.R. Global challenges in energy. Energy Policy 2006, 34, 1984–1991. [Google Scholar] [CrossRef]
- Qazi, A.; Hussain, F.; Rahimi, N.A.; Hardaker, G.; Alghazzawi, D.; Shaban, K.; Haruna, K. Towards Sustainable Energy: A Systematic Review of Renewable Energy Sources, Technologies, and Public Opinions. IEEE Access 2019, 7, 63837–63851. [Google Scholar] [CrossRef]
- Menges, R. Supporting renewable energy on liberalised markets: Green electricity between additionality and consumer sovereignty? Energy Policy 2003, 31, 583–596. [Google Scholar] [CrossRef]
- REN 21 (Renewable Energy Policy Network for the 21th Century). Renewables Global Status Report 2009 Update. Available online: http://www.ren21.net/pdf/RE_GSR_2009_Update.pdf/ (accessed on 4 February 2022).
- Zsiborács, H.; Hegedüsné Baranyai, N.; Vincze, A.; Zentkó, L.; Birkner, Z.; Máté, K.; Pintér, G. Intermittent Renewable Energy Sources: The Role of Energy Storage in the European Power System of 2040. Electronics 2019, 8, 729. [Google Scholar] [CrossRef] [Green Version]
- Kilinc-Ata, N. The evaluation of renewable energy policies across EU countries and US states: An econometric approach. Energy Sustain. Dev. 2016, 31, 83–90. [Google Scholar] [CrossRef]
- Haas, R.; Panzer, C.; Resch, G.; Ragwitz, M.; Reece, M.; Held, A. A historical review of promotion strategies for electricity from renewable energy sources in EU countries. Renew. Sustain. Energy Rev. 2011, 15, 1003–1034. [Google Scholar] [CrossRef]
- Čermáková, K.; Hromada, E. Change in the Affordability of Owner-Occupied Housing in the Context of Rising Energy Prices. Energies 2022, 15, 1281. [Google Scholar] [CrossRef]
- Zubíková, A.; Smolák, P. Macroeconomic impacts of the COVID-19 pandemic in the Czech Republic in the period of 2020–2021. Int. J. Econ. Sci. 2022, XI, 117–145. [Google Scholar] [CrossRef]
- Hromada, E.; Cermakova, K. Financial Unavailability Of Housing In The Czech Republic And Recommendations For Its Solution. Int. J. Econ. Sci. 2021, X, 47–57. [Google Scholar] [CrossRef]
- Eurostat. Complete Energy Balances. Available online: https://ec.europa.eu/eurostat/databrowser/view/NRG_BAL_C__custom_2080732/default/table?lang=en/ (accessed on 12 February 2022).
- Mork, K.A.; Hall, R.E. Energy Prices, Inflation, and Recession, 1974–1975. Energy J. 1980, 1, 31–63. [Google Scholar]
- Cavallo, M.; Oil Prices and Inflation. FRBSF Economic Letter. Available online: https://www.frbsf.org/economic-research/publications/economic-letter/2008/october/oil-prices-inflation/ (accessed on 4 February 2022).
- Jacques, R.; Moritz, L. Two scenarios for Europe: “Europe confronted with high energy prices” or “Europe after oil peaking”. Futures 2010, 42, 817–824. [Google Scholar]
- Cecrdlova, A. Comparison of the Approach of the Czech National Bank and the European Central Bank to the Effects of the Global Financial Crisis. Int. J. Econ. Sci. 2021, X, 18–46. [Google Scholar] [CrossRef]
- Kaderabkova, B.; Jasova, E.; Holman, R. Analysis of substitution changes in the Phillips curve in V4 countries over the course of economic cycles. Int. J. Econ. Sci. 2020, IX, 39–54. [Google Scholar] [CrossRef]
- Čermáková, K.; Jašová, E. Analysis of the Negative and Positive Impact of Institutional Factors on Unemployment in Visegrad Countries. Int. J. Econ. Sci. 2019, VIII, 20–34. [Google Scholar] [CrossRef] [Green Version]
- Kurekova, L.; Hejdukova, P. Multilevel research of migration with a focus on internal migration. Int. J. Econ. Sci. 2021, X, 86–102. [Google Scholar] [CrossRef]
- Čermáková, K.; Procházka, P.; Kureková, L.; Rotschedl, J. Do Institutions Influence Economic Growth? Prague Econ. Pap. 2020, 29, 672–687. [Google Scholar] [CrossRef]
- Rodroguez-Villalobos, M.; Julián-Arias, A.; Cruz-Montano, A. Effect of NAFTA on Mexico’s wage inequality. Int. J. Econ. Sci. 2019, VIII, 131–149. [Google Scholar] [CrossRef]
- Bernanke, B.S. Chairman of the Board of Governors of the US Federal Reserve System, Energy and The Economy. Remarks. Available online: https://www.bis.org/review/r060622a.pdf/ (accessed on 12 February 2022).
- BIS (Bank for International Settlements). Monetary Policy and the Measurement of Inflation: Prices, Wages and Expectations. BIS Papers, No. 49. Available online: https://www.bis.org/publ/bppdf/bispap49.pdf/ (accessed on 12 February 2022).
- Habermeier, K.F.; Ötker, I.; Vávra, D.; Vazquez, F.F.; Jácome, L.I.; Ishi, K.; Giustiniani, A.; Kisinbay, T. Inflation Pressures and Monetary Policy Options in Emerging and Developing Countries: A Cross Regional Perspective; IMF Working Paper No. 09/1; International Monetary Fund: Washington, DC, USA, 2009. [Google Scholar]
- Zoli, E. Commodity Price Volatility, Cyclical Fluctuations, and Convergence: What is Ahead for Inflation in Emerging Europe? IMF Working Papers; International Monetary Fund: Washington, DC, USA, 2009; pp. 1–19. [Google Scholar]
- Caceres, C.; Poplawski-Ribeiro, M.; Tartari, D. Inflation dynamics in the CEMAC region. J. Afr. Econ. 2012, 22, 239–275. [Google Scholar] [CrossRef]
- Lane, T. Deputy Governor of the Bank of Canada, Drilling Down–Understanding Oil Prices and Their Economic Impact. Remarks to the International Trade Association (MITA). Available online: https://www.bis.org/review/r150114a.htm/ (accessed on 12 February 2022).
- Abdallah, C.; Kpodar, K. How Large and Persistent is the Response of Inflation to Changes in Retail Energy Prices? IMF Working Paper; International Monetary Fund: Washington, DC, USA, 2020; p. 31. [Google Scholar]
- Rubene, L.; Koester, G. Recent Dynamics in Energy Inflation: The Role of Base Effects and Taxes. ECB Economic Bulletin, Issue 3/2021. Available online: https://www.ecb.europa.eu/pub/economic-bulletin/focus/2021/html/ecb.ebbox202103_04~0a0c8f0814.en.html (accessed on 12 February 2022).
- Schnabel, I. Member of the Executive Board of the ECB, Looking Through Higher Energy Prices? Monetary Policy and The Green Transition. Speech at a Panel on “Climate and the Financial System” at the American Finance Association 2022 Virtual Annual Meeting. Available online: https://www.ecb.europa.eu/press/key/date/2022/html/ecb.sp220108~0425a24eb7.en.html/ (accessed on 12 February 2022).
- Martinsen, D.; Krey, V.; Markewitz, P. Implications of high energy prices for energy system and emissions—The response from an energy model for Germany. Energy Policy 2007, 35, 4504–4515. [Google Scholar] [CrossRef]
- Kost, C.; Shammugam, S.; Fluri, V.; Peper, D.; Memar, A.D.; Schlegel, T. Study: Levelized Cost of Electricity–Renewable Energy Technologies. Frauenhofer Institute for Solar Energy Systems, June 2021. Available online: https://www.ise.fraunhofer.de/en/publications/studies/cost-of-electricity.html (accessed on 31 March 2022).
- Appiah-Otto, I. Impact of Economic Policy Uncertainty on Renewable Energy Growth. Energy Res. Lett. 2021, 2, 5. [Google Scholar] [CrossRef]
- Dogan, E.; Seker, F. Determinants of CO2 emissions in the European Union: The role of renewable and non-renewable energy. Renew. Energy 2016, 94, 429–439. [Google Scholar] [CrossRef]
- Sharma, S.S. Determinants of carbon dioxide emissions: Empirical evidence from 69 countries. Appl. Energy 2011, 88, 376–382. [Google Scholar] [CrossRef]
- Bose, B.K. Global Warming: Energy, Environmental Pollution, and the Impact of Power Electronics. IEEE Ind. Electron. Mag. 2010, 4, 6–17. [Google Scholar] [CrossRef]
- Saboori, B.; Sulaiman, J. Environmental degradation, economic growth and energy consumption: Evidence of the environmental Kuznets curve in Malaysia. Energy Policy 2013, 60, 892–905. [Google Scholar] [CrossRef]
- Shafiei, S.; Salim, R.A. Non-renewable and renewable energy consumption and CO2 emissions in OECD countries: A comparative analysis. Energy Policy 2014, 66, 547–556. [Google Scholar] [CrossRef] [Green Version]
- Ezzati, M.; Kammen, D.K. The Health Impacts of Exposure to Indoor Air Pollution from Solid Fuels in Developing Countries: Knowledge, Gaps, and Data Needs. Environ. Health Perspect. 2002, 110, 1057–1068. [Google Scholar] [CrossRef] [Green Version]
- COP25. Summary Report. Available online: https://www.ieta.org/resources/Documents/IETA-COP25-Report_2019.pdf/ (accessed on 4 February 2022).
- European Commission. Available online: https://ec.europa.eu/info/strategy/priorities-2019-2024/european-green-deal_en/ (accessed on 4 February 2022).
- European Commission. Available online: https://ec.europa.eu/regional_policy/en/newsroom/news/2020/01/14-01-2020-financing-the-green-transition-the-european-green-deal-investment-plan-and-just-transition-mechanism/ (accessed on 4 February 2022).
- UNFCCC, Kyoto Protocol Reference Manual on Accounting of Emissions and Assigned Amount United Nations Framework Convention on Climate Change. Available online: http://unfccc.int/kyoto_protocol/items/3145.php/ (accessed on 4 February 2022).
- Borgersen, T.A. Social Housing Policy in a Segmented Housing Market: Indirect Effects on Markets and on Individuals. Int. J. Econ. Sci. 2019, VIII, 1–21. [Google Scholar] [CrossRef] [Green Version]
- Tomaszewski, K. Energy policy of the European Union in the context of economic security issues. Przegląd Politol. 2018, 1, 133–145. [Google Scholar] [CrossRef] [Green Version]
- REN21 (Renewable Energy Policy Network for the 21st Century), Renewables Global Status Report 2021. Available online: https://www.ren21.net/gsr-2021/ (accessed on 4 February 2022).
- Piebalgs, A. Energy Commissioner, European Response to energy challenges. Speech at the EU Energy and Environment Law and Policy Conference Brussels. European Commission. Available online: https://ec.europa.eu/commission/presscorner/detail/en/SPEECH_07_70 (accessed on 4 February 2022).
- EIA (US Energy Information Administration). International Energy Outlook 2016. Available online: https://www.eia.gov/outlooks/ieo/pdf/0484.pdf (accessed on 4 February 2022).
- EIA (US Energy Information Administration). International Energy Outlook 2021. Available online: https://www.eia.gov/outlooks/ieo/electricity/sub-topic-01.php (accessed on 4 February 2022).
- Lahiani, A.; Sinha, A.; Shahbaz, M. Renewable Energy Consumption, Income, Co₂ Emissions, And Oil Prices In G7 Countries: The Importance Of Asymmetries. J. Energy Dev. 2017, 43, 157–191. [Google Scholar]
- Agora Energiewende, Renewables Overtake Gas and Coal in EU Electricity Generation. Available online: https://www.agora-energiewende.de/en/press/news-archive/renewables-overtake-gas-and-coal-and-coal-in-eu-electricity-generation-1/ (accessed on 12 February 2022).
- Gelabert, L.; Labandeira, X.; Linares, P. An ex-post analysis of the effect of renewables and cogeneration on Spanish electricity prices. Energy Econ. 2011, 33, S59–S65. [Google Scholar] [CrossRef]
- Percy, S.; Mountain, B. What Happens To Electricity Prices When The Wind And Sun Supply Half The Electricity Market? In Proceedings of the Local Energy, Global Markets, 42nd IAEE International Conference, Montreal, QC, Canada, 29 May–1 June 2019; International Association for Energy Economics: Cleveland, OH, USA, 2019. [Google Scholar]
- Choi, S.; Furceri, D.; Loungani, P.; Mishra, S.; Poplawski-Ribeiro, M. Oil Prices and Inflation Dynamics: Evidence from Advanced and Developing Economies. J. Int. Money Financ. 2017, 82, 71–96. [Google Scholar] [CrossRef]
- Apergis, N. Characteristics of inflation in Greece: Mean Spillover Effects among CPI Components. In Hellenic Observatory Papers on Greece and Southeast Europe; GreeSE Paper No. 43; London School of Economics: London, UK, 2011; p. 12. [Google Scholar]
- Hájková, D.; Král, P. CNB continues to tighten monetary policy. ČNB, Monetary Policy, 17 January 2022. [Google Scholar]
- Lagarde, C. President of the ECB, Monetary Policy in an Uncertain World. Speech at “The ECB and Its Watchers XXII” Conference, Frankfurt am Main, 17 March. Available online: https://www.ecb.europa.eu/press/key/date/2022/html/ecb.sp220317~9d2f052c92.en.html (accessed on 31 March 2022).
- De Gregorio, J.; Landerretche, O.; Neilson, C. Another Pass-through Bites the Dust? Oil Prices and Inflation. Econ. J. 2007, 7, 155–208. [Google Scholar] [CrossRef] [Green Version]
- Blanchard, O.J.; Galí, J. The Macroeconomic Effects of Oil Price Shocks: Why are the 2000s so Different from the 1970s? In International Dimensions of Monetary Policy; National Bureau of Economic Research (NBER): Cambridge, MA, USA, 2007; pp. 373–421. [Google Scholar]
- Chen, S. Oil Price Pass-through into Inflation. Energy Econ. 2009, 31, 126–133. [Google Scholar] [CrossRef]
- Gelos, G.; Ustyugova, Y. Inflation Responses to Commodity Price Shocks–How and Why Do Countries Differ. J. Int. Money Financ. 2017, 72, 28–47. [Google Scholar] [CrossRef] [Green Version]
- Álvarez, L.J.; Hurtado, S.; Sánchez, I.; Thomas, C. The impact of oil price changes on Spanish and euro area consumer price inflation. Econ. Model. 2011, 28, 422–431. [Google Scholar] [CrossRef] [Green Version]
- Kilian, L. Not All Oil Price Shocks Are Alike: Disentangling Demand and Supply Shocks in the Crude Oil Market. Am. Econ. Rev. 2009, 99, 1053–1069. [Google Scholar] [CrossRef] [Green Version]
- Peersman, G.; Van Robays, I. Cross-country differences in the effects of oil shocks. Energy Econ. 2012, 34, 1532–1547. [Google Scholar] [CrossRef] [Green Version]
- Baumeister, C.; Peersman, G. Time-Varying Effects of Oil Supply Shocks on the US Economy. Am. Econ. J. Macroecon. 2013, 5, 1–28. [Google Scholar] [CrossRef] [Green Version]
- Devore, S.; Olson, E. The Surprising Stability Between Gas Prices and Expected Inflation. Econ. Bull. Access Econ. 2020, 41, 710–719. [Google Scholar]
- Sussman, N.; Osnat, Z. Oil Prices, Inflation Expectations and Monetary Policy; Bank of Israel: Jerusalem, Israel, 2015. [Google Scholar]
- Hájková, D.; Šnobl, R. Proč je inflace v současnosti vysoká a jak dlouho tu s námi bude? ČNB, Měnová politika, 17 January 2022. [Google Scholar]
- Kilian, L.; Zhou, X. The Impact of Rising Oil Prices on US Inflation and Inflation Expectations in 2020–2023; Working Paper 2116; Federal Reserve Bank of Dallas: Dallas, TX, USA, 2021; p. 29. [Google Scholar]
- Lee, I. Oil could surge above $100 in the event of a cold winter-and spark inflation that drives the next macro crisis, BofA says. Markets Insider, 1 October 2021. [Google Scholar]
- Čermáková, K.; Bejček, M.; Vorlíček, J.; Mitwallyová, H. Neglected Theories of Business Cycle—Alternative Ways of Explaining Economic Fluctuations. Data 2021, 6, 109. [Google Scholar] [CrossRef]
- Hejduková, P.; Kureková, L.; Krechovská, M. The Measurement of Industry 4.0: An Empirical Cluster Analysis for EU Countries. Int. J. Econ. Sci. 2020, IX, 121–134. [Google Scholar] [CrossRef]
- Hromada, E.; Čermáková, K.; Krulický, T.; Machová, V.; Horák, J.; Mitwallyova, H. Labour Market and Housing Unavailability: Implications for Regions Affected by Coal Mining. Acta Montan. Slovaca 2021, 26, 404–414. [Google Scholar]
- Čermáková, K.; Filho, E.A.H. Effects of Expansionary Monetary Policy on Agricultural Commodities Market. Sustainability 2021, 13, 9317. [Google Scholar] [CrossRef]
- Kliber, P.; Rutkowska-Ziarko, A. Portfolio choice with a fundamental criterion–An algorithm and practical applicationon–A computation methods and empirical analysis. Int. J. Econ. Sci. 2021, X, 39–52. [Google Scholar] [CrossRef]
- Just, M.; Łuczak, A.; Kozera, A. Conditional Dependence Structure in the Precious Metals Futures Market. Int. J. Econ. Sci. 2019, VIII, 81–93. [Google Scholar] [CrossRef]
- Jašová, E.; Kadeřábková, B. Ambiguous effects of minimum wage tool of labour markets regulation–key study of V4 countries. Int. J. Econ. Sci. 2021, X, 58–85. [Google Scholar] [CrossRef]
- Al-Thaqeb, S.A.; Algharabali, B.G.; Alabdulghafour, K.T. The pandemic and economic policy uncertainty. Int. J. Financ. Econ. 2020, 1–11. [Google Scholar] [CrossRef]
- Lagarde, C. President of the ECB, Finding Resilience in Times of Uncertainty. Speech at an Event Organised by the Central Bank of Cyprus, Nicosia, March 30. Available online: https://www.bis.org/review/r220331a.htm (accessed on 31 March 2022).
- Istrefi, K.; Piloiu, A. Economic Policy Uncertainty and Inflation Expectations; Working papers 511; Banque de France: Paris, France, 2014; p. 43. [Google Scholar]
- Ghosh, T.; Sahu, S.; Chattopadhyay, S. Inflation expectations of households in India: Role of oil prices, economic policy uncertainty, and spillover of global financial uncertainty. Bull. Econ. Res. 2020, 73, 230–251. [Google Scholar] [CrossRef]
- Istiak, K.; Alam, R. Oil Prices, Policy Uncertainty and Asymmetries in Inflation Expectations. J. Econ. Stud. 2019, 46, 324–334. [Google Scholar] [CrossRef]
- Eser, F.; Karadi, P.; Lane, P.R.; Moretti, L.; Osbat, C. The Phillips curve at the ECB. Manch. Sch. 2020, 88, 50–85. [Google Scholar] [CrossRef]
- Topan, L.; Castro, C.; Jerez, M.; Barge-Gil, A. Oil price pass-through into inflation in Spain at national and regional level. SERIEs 2020, 11, 561–583. [Google Scholar] [CrossRef] [PubMed]
- Kassouri, Y.; Altıntaş, H. The quantile dependence of the stock returns of “clean” and “dirty” firms on oil demand and supply shocks. J. Commod. Mark. 2021, in press. [CrossRef]
- Gonçalves, E.; Henkel, L.; Kouvavas, O.; Porqueddu, M.; Trezzi, R. 2021 HICP Weights and Their Implications for the Measurement of Inflation. ECB Economic Bulletin, Issue 2/2021. Available online: https://www.ecb.europa.eu/pub/economic-bulletin/focus/2021/html/ecb.ebbox202102_06~6ead8c0475.en.html/ (accessed on 12 February 2022).
- Işık, C.; Sirakaya-Turk, E.; Ongan, S. Testing the efficacy of the economic policy uncertainty index on tourism demand in USMCA: Theory and evidence. Tour. Econ. 2019, 26, 1344–1357. [Google Scholar] [CrossRef]
- Ren, Y.; Guo, Q.; Zhu, H.; Ying, W. The effects of economic policy uncertainty on China ‘s economy: Evidence from time-varying parameter FAVAR. Appl. Econ. 2019, 52, 3167–3185. [Google Scholar] [CrossRef]
- ČNB. Vliv Dosud Rychle Rostoucích Světových cen Energetických Zdrojů. Zpráva o Inflaci–Příloha, IV/2008. Available online: https://www.cnb.cz/cs/menova-politika/zpravy-o-inflaci/tematicke-prilohy-a-boxy/Vliv-dosud-rychle-rostoucich-svetovych-cen-energetickych-zdroju/ (accessed on 21 January 2022).
Figure 1.
Annual Inflation Rates (in %) in December 2021. Supranational entities are in red and blue. Source dataset: Eurostat (1).
Figure 1.
Annual Inflation Rates (in %) in December 2021. Supranational entities are in red and blue. Source dataset: Eurostat (1).

Figure 2.
Annual Inflation Rate (in %). Source dataset: Eurostat (2).

Figure 3.
Electricity Share on HICP (El_share) = Electricity contribution/HICP, Source dataset: Eurostat (3).
Figure 3.
Electricity Share on HICP (El_share) = Electricity contribution/HICP, Source dataset: Eurostat (3).

Figure 4.
Dstributions and scatterplot between electricity share on HICP(El_share), electricity contribution to HICP as given by Eurostat and HICP in the period prior 2009. Source dataset: Eurostat: PRC_HICP_CTRB.
Figure 4.
Dstributions and scatterplot between electricity share on HICP(El_share), electricity contribution to HICP as given by Eurostat and HICP in the period prior 2009. Source dataset: Eurostat: PRC_HICP_CTRB.

Figure 5.
Distributions and scatterplot between electricity share on HICP(El_share), electricity contribution to HICP as given by Eurostat and HICP in the period after 2010. Source dataset: Eurostat: PRC_HICP_CTRB.
Figure 5.
Distributions and scatterplot between electricity share on HICP(El_share), electricity contribution to HICP as given by Eurostat and HICP in the period after 2010. Source dataset: Eurostat: PRC_HICP_CTRB.

Figure 6.
Non-household electricity prices including taxes and levies in the lowest consumption band in selected countries. Source dataset: Eurostat: NRG_IND_REN.
Figure 6.
Non-household electricity prices including taxes and levies in the lowest consumption band in selected countries. Source dataset: Eurostat: NRG_IND_REN.

Figure 7.
Non-household electricity prices including taxes and levies in the lowest consumption band in selected countries. Source dataset: Eurostat: NRG_IND_REN.
Figure 7.
Non-household electricity prices including taxes and levies in the lowest consumption band in selected countries. Source dataset: Eurostat: NRG_IND_REN.

Figure 8.
Share of renewable energy sources on electricity consumption in 2008 and 2020 in European economies, Source dataset: Eurostat: NRG_IND_REN.
Figure 8.
Share of renewable energy sources on electricity consumption in 2008 and 2020 in European economies, Source dataset: Eurostat: NRG_IND_REN.

Table 1.
Contributions to the Euro Area Annual Inflation Rate (pp), Selected Aggregates.
| COICOP | 2020-12 | 2021-06 | 2021-07 | 2021-08 | 2021-09 | 2021-10 | 2021-11 | 2021-12 |
|---|---|---|---|---|---|---|---|---|
| Food including alcohol and tobacco | 0.25 | 0.15 | 0.35 | 0.43 | 0.44 | 0.43 | 0.49 | 0.71 |
| > Processed food including alcohol and tobacco | 0.16 | 0.15 | 0.26 | 0.29 | 0.31 | 0.35 | 0.39 | 0.47 |
| > Unprocessed food | 0.09 | 0.00 | 0.09 | 0.14 | 0.13 | 0.08 | 0.10 | 0.23 |
| Energy | −0.68 | 1.16 | 1.34 | 1.44 | 1.63 | 2.21 | 2.57 | 2.46 |
| > Electricity, gas and other fuels | −0.22 | 0.47 | 0.63 | 0.71 | 0.83 | 1.19 | 1.39 | 1.50 |
| >> Electricity | 0.01 | 0.23 | 0.22 | 0.26 | 0.31 | 0.43 | 0.51 | 0.65 |
| >> Gas | −0.06 | 0.11 | 0.25 | 0.28 | 0.31 | 0.44 | 0.52 | 0.54 |
| >> Liquid fuels | −0.15 | 0.13 | 0.15 | 0.15 | 0.20 | 0.29 | 0.31 | 0.24 |
| >> Solid fuels | 0.00 | 0.00 | 0.00 | 0.00 | 0.00 | 0.01 | 0.01 | 0.01 |
| >> Heat energy | −0.01 | 0.00 | 0.01 | 0.01 | 0.02 | 0.03 | 0.04 | 0.05 |
| > Fuels and lubricants for per. transp. equipment | −0.46 | 0.69 | 0.70 | 0.74 | 0.80 | 1.02 | 1.18 | 0.96 |
| Non-energy industrial goods | −0.14 | 0.31 | 0.17 | 0.65 | 0.57 | 0.55 | 0.64 | 0.78 |
| Services (overall index excluding goods) | 0.30 | 0.28 | 0.31 | 0.43 | 0.72 | 0.86 | 1.16 | 1.02 |
Source dataset: Eurostat (3).
Table 2.
National Policies to Shield Consumers from Rising Energy Prices.
| Country/Policy | Reduced Energy Tax/VAT | Retail Price Regulation | Wholesale Price Regulation | Transfers to Vulnerable Groups | Mandate to State-Owned Firms | Windfall Profits Tax/Regulation | Other |
|---|---|---|---|---|---|---|---|
| Austria | x | ||||||
| Belgium | x | x | x | x | |||
| Bulgaria | x | x | x | ||||
| Cyprus | x | x | |||||
| Czechia | x | x | |||||
| Denmark | x | ||||||
| Estonia | x | x | |||||
| France | x | x | x | x | x | ||
| Germany | x | x | x | x | |||
| Greece | x | x | |||||
| Hungary | x | ||||||
| Irland | x | x | x | ||||
| Italy | x | x | x | ||||
| Latvia | x | ||||||
| Lithuania | x | x | x | ||||
| Luxemburg | x | ||||||
| Netherlands | x | ||||||
| Norway | x | ||||||
| Poland | x | x | x | ||||
| Portugal | x | x | x | ||||
| Romania | x | x | x | x | |||
| Spain | x | x | x | x | x | ||
| Sweden | x |
Source dataset: Bruegel (4).
Table 3.
OLS regressions of electricity contribution on HICP excluding the electricity contribution. Source dataset: Eurostat: PRC_HICP_CTRB.
Table 3.
OLS regressions of electricity contribution on HICP excluding the electricity contribution. Source dataset: Eurostat: PRC_HICP_CTRB.
| OLS Regression Results-Period before 2009 | ||||||
| Dep. Variable: | HICPexEl | R-squared: | 0.061 | |||
| Model: | OLS | Adj. R-squared: | 0.05 | |||
| Method: | Least Squares | F-statistic: | 2.462 | |||
| Date: | Friday, 25 February 2022 | Prob (F-statistic): | 0.12 | |||
| Time: | 0:27:05 | Log-Likelihood: | −63.89 | |||
| No. Observations: | 84 | AIC: | 131.8 | |||
| Df Residuals: | 82 | BIC: | 136.6 | |||
| Df Model: | 1 | |||||
| Covariance Type: | HC3 | |||||
| coef | std err | z | p > |z| | [0.025 | 0.975] | |
| const | 1.95 | 0.157 | 12.446 | 0 | 1.643 | 2.257 |
| Electricity Contribution | 4.322 | 2.755 | 1.569 | 0.117 | −1.077 | 9.721 |
| Omnibus: | 9.233 | Durbin-Watson: | 0.221 | |||
| Prob(Omnibus): | 0.01 | Jarque-Bera (JB): | 8.941 | |||
| Skew: | 0.743 | Prob(JB): | 0.0114 | |||
| Kurtosis: | 3.591 | Cond. No. | 32.9 | |||
| OLS Regression Results—Period after 2010 | ||||||
| Dep. Variable: | HICPexEl | R-squared: | 0.622 | |||
| Model: | OLS | Adj. R-squared: | 0.62 | |||
| Method: | Least Squares | F-statistic: | 53 | |||
| Date: | Friday, 25 Feburary 2022 | Prob (F-statistic): | 2E−11 | |||
| Time: | 0:27:44 | Log-Likelihood: | −132.9 | |||
| No. Observations: | 146 | AIC: | 269.9 | |||
| Df Residuals: | 144 | BIC: | 275.9 | |||
| Df Model: | 1 | |||||
| Covariance Type: | HC3 | |||||
| coef | std err | z | p > |z| | [0.025 | 0.975] | |
| const | 0.686 | 0.086 | 7.966 | 0 | 0.517 | 0.855 |
| Electricity Contribution | 6.7581 | 0.928 | 7.28 | 0 | 4.939 | 8.577 |
| Omnibus: | 7.931 | Durbin-Watson: | 0.239 | |||
| Prob(Omnibus): | 0.019 | Jarque-Bera (JB): | 4.132 | |||
| Skew: | −0.185 | Prob(JB): | 0.127 | |||
| Kurtosis: | 2.263 | Cond. No. | 8.82 | |||
Table 4.
The simplest regression of electricity prices on biannual inflation and deseasonalised inflation.
Table 4.
The simplest regression of electricity prices on biannual inflation and deseasonalised inflation.
| PanelOLS Estimation Summary-Biannual Deseasonalized Inflation | ||||
| Dep. Variable: | deseas_inflation | R-squared: | 0.0019 | |
| Estimator: | PanelOLS | R-squared (Between): | −0.7859 | |
| No. Observations: | 827 | R-squared (Within): | −0.0033 | |
| R-squared (Overall): | −0.0134 | |||
| Log-likelihood | −1185.2 | |||
| Cov. Estimator: | Robust | |||
| F-statistic: | 1.4764 | |||
| Entities: | 32 | p-value | 0.2247 | |
| Avg Obs: | 25.844 | Distribution: | F (1,768) | |
| Min Obs: | 10 | |||
| Max Obs: | 27 | F-statistic (robust): | 1.4185 | |
| p-value | 0.234 | |||
| Time periods: | 27 | Distribution: | F (1,768) | |
| Avg Obs: | 30.63 | |||
| Min Obs: | 30 | |||
| Max Obs: | 32 | |||
| Parameter Estimates | ||||
| Parameter | Std. Err. | T-stat | p-value | |
| const | 0.3264 | 0.3503 | 0.9319 | 0.3517 |
| el_price | −2.1926 | 1.8409 | −1.191 | 0.234 |
| PanelOLS Estimation Summary-Biannual Inflation | ||||
| Dep. Variable: | inflation | R-squared: | 0.0001 | |
| Estimator: | PanelOLS | R-squared (Between): | 0.0477 | |
| No. Observations: | 863 | R-squared (Within): | 0.0018 | |
| R-squared (Overall): | 0.0098 | |||
| Log-likelihood | −1554.6 | |||
| Cov. Estimator: | Robust | |||
| F-statistic: | 0.1061 | |||
| Entities: | 32 | p-value | 0.7447 | |
| Avg Obs: | 26.969 | Distribution: | F (1,802) | |
| Min Obs: | 10 | |||
| Max Obs: | 29 | F-statistic (robust): | 0.0892 | |
| p-value | 0.7653 | |||
| Time periods: | 29 | Distribution: | F (1,802) | |
| Avg Obs: | 29.759 | |||
| Min Obs: | 7 | |||
| Max Obs: | 32 | |||
| Parameter Estimates | ||||
| Parameter | Std. Err. | T-stat | p-value | |
| const | 1.1792 | 0.5158 | 2.2863 | 0.0225 |
| el_price | −0.8231 | 2.7565 | −0.2986 | 0.7653 |
Source datasets: Eurostat: Eurostat: NRG_PC_205, Eurostat: PRC_HICP_MIDX.
Table 5.
The regression with added share of renewable electricity, real GDP growth and nominal effective exchange rate and their lags with past value of inflation (ainf_lag).
Table 5.
The regression with added share of renewable electricity, real GDP growth and nominal effective exchange rate and their lags with past value of inflation (ainf_lag).
| PanelOLS Estimation Summary | ||||
| Dep. Variable: | inflation | R-squared: | 0.3624 | |
| Estimator: | PanelOLS | R-squared (Between): | 0.7885 | |
| No. Observations: | 328 | R-squared (Within): | 0.3888 | |
| Date: | Friday, 29 April 2022 | R-squared (Overall): | 0.4691 | |
| Time: | 16:47:44 | Log-likelihood | −415.64 | |
| Cov. Estimator: | Robust | |||
| F-statistic: | 17.685 | |||
| Entities: | 27 | p-value | 0 | |
| Avg Obs: | 12.148 | Distribution: | F (9,280) | |
| Min Obs: | 6 | |||
| Max Obs: | 13 | F-statistic (robust): | 5.2417 | |
| p-value | 0 | |||
| Time periods: | 13 | Distribution: | F (9,280) | |
| Avg Obs: | 25.231 | |||
| Min Obs: | 22 | |||
| Max Obs: | 27 | |||
| Parameter Estimates | ||||
| Parameter | Std. Err. | T-stat | p-value | |
| const | 1.1817 | 0.8324 | 1.4197 | 0.1568 |
| el_price | 0.5853 | 3.0162 | 0.1941 | 0.8463 |
| share | −0.0838 | 0.0413 | −2.03 | 0.0433 |
| gdp | 0.032 | 0.0324 | 0.9901 | 0.323 |
| neer | −0.0969 | 0.0249 | −3.8901 | 0.0001 |
| el_lag | −0.26 | 3.1306 | −0.0831 | 0.9339 |
| ainf_lag | 0.4328 | 0.1048 | 4.1299 | 0 |
| ren_lag | 0.0723 | 0.0417 | 1.7345 | 0.0839 |
| gdp_lag | 0.0948 | 0.035 | 2.7054 | 0.0072 |
| neer_lag | −0.0745 | 0.0241 | −3.0875 | 0.0022 |
Included effects: Entity, Time. HUSMAN_TEST_RESULTS: chi-Squared: 25.56., degrees of freedom: 10, p-Value: 0.00. Source datasets: Eurostat: PRC_HICP_MIDX, Eurostat: NRG_PC_205, Eurostat: SDG_08_10, Eurostat: TIPSER11, Eurostat: NRG_IND_REN.
Table 6.
The regression with the added share of renewable electricity, real GDP growth, nominal effective exchange rate, broad money change and their lags with past inflation.
Table 6.
The regression with the added share of renewable electricity, real GDP growth, nominal effective exchange rate, broad money change and their lags with past inflation.
| RandomEffects Estimation Summary | ||||
| Dep. Variable: | inflation | R-squared: | 0.5603 | |
| Estimator: | RandomEffects | R-squared (Between): | 0.8856 | |
| No. Observations: | 328 | R-squared (Within): | 0.4771 | |
| Date: | Friday, 29 April 2022 | R-squared (Overall): | 0.5603 | |
| Time: | 16:50:02 | Log-likelihood | −495.41 | |
| Cov. Estimator: | Unadjusted | |||
| F-statistic: | 36.6 | |||
| Entities: | 27 | p-value | 0 | |
| Avg Obs: | 12.148 | Distribution: | F (11,316) | |
| Min Obs: | 6 | |||
| Max Obs: | 13 | F-statistic (robust): | 36.6 | |
| p-value | 0 | |||
| Time periods: | 13 | Distribution: | F (11,316) | |
| Avg Obs: | 25.231 | |||
| Min Obs: | 22 | |||
| Max Obs: | 27 | |||
| Parameter Estimates | ||||
| Parameter | Std. Err. | T-stat | p-value | |
| const | 0.8212 | 0.2904 | 2.8282 | 0.005 |
| el_price | −4.2559 | 3.5435 | −1.2011 | 0.2306 |
| share | −0.0856 | 0.0446 | −1.9197 | 0.0558 |
| gdp | 0.0176 | 0.0191 | 0.9226 | 0.3569 |
| neer | −0.1084 | 0.0233 | −4.6485 | 0 |
| bm | 0.0071 | 0.0069 | 1.0208 | 0.3081 |
| ainf_lag | 0.5024 | 0.0415 | 12.098 | 0 |
| el_lag | 4.1152 | 3.4968 | 1.1768 | 0.2401 |
| ren_lag | 0.0821 | 0.0451 | 1.8203 | 0.0697 |
| gdp_lag | 0.114 | 0.0186 | 6.1211 | 0 |
| neer_lag | −0.0788 | 0.0211 | −3.7288 | 0.0002 |
| bm_lag | 0.0376 | 0.0072 | 5.205 | 0 |
Included effects: Entity, Time. HAUSMAN_TEST_RESULTS: chi-Squared: 16.07, degrees of freedom: 12, p-Value: 0.188.
Publisher’s Note: MDPI stays neutral with regard to jurisdictional claims in published maps and institutional affiliations. |
© 2022 by the authors. Licensee MDPI, Basel, Switzerland. This article is an open access article distributed under the terms and conditions of the Creative Commons Attribution (CC BY) license (https://creativecommons.org/licenses/by/4.0/).
Share and Cite
MDPI and ACS Style
Bednář, O.; Čečrdlová, A.; Kadeřábková, B.; Řežábek, P. Energy Prices Impact on Inflationary Spiral. Energies 2022, 15, 3443. https://0-doi-org.brum.beds.ac.uk/10.3390/en15093443
AMA Style
Bednář O, Čečrdlová A, Kadeřábková B, Řežábek P. Energy Prices Impact on Inflationary Spiral. Energies. 2022; 15(9):3443. https://0-doi-org.brum.beds.ac.uk/10.3390/en15093443
Chicago/Turabian StyleBednář, Ondřej, Andrea Čečrdlová, Božena Kadeřábková, and Pavel Řežábek. 2022. "Energy Prices Impact on Inflationary Spiral" Energies 15, no. 9: 3443. https://0-doi-org.brum.beds.ac.uk/10.3390/en15093443
Note that from the first issue of 2016, this journal uses article numbers instead of page numbers. See further details here.