
Charging Stations and Electromobility Development: A Cross-Country Comparative Analysis


1
Department of Process Management, Faculty of Business and Management, Wroclaw University of Economics and Business, 118/120 Komandorska Str., 53-345 Wroclaw, Poland
2
Schulich School of Business, York University, 4700 Keele Str., Toronto, ON M3J 1P3, Canada
3
Department of Advanced Research in Management, Faculty of Business and Management, Wroclaw University of Economics and Business, 118/120 Komandorska Str., 53-345 Wroclaw, Poland
*
Authors to whom correspondence should be addressed.
Energies 2023, 16(1), 32; https://0-doi-org.brum.beds.ac.uk/10.3390/en16010032
Submission received: 30 November 2022
/
Revised: 16 December 2022
/
Accepted: 19 December 2022
/
Published: 21 December 2022
(This article belongs to the Special Issue Challenges and Research Trends of Computational Intelligence)
Abstract
:The Industry 4.0 idea influences the development of both charging stations and electromobility development, due to its emphasis on device communication, cooperation, and proximity. Therefore, in electromobility development, growing attention is paid to chargers’ infrastructure density and automotive electric vehicles’ accessibility. The main goal of this scientific paper was to present the electromobility development represented in the number of charging stations and its infrastructure development calculations. In this study, the sequence of methods was used to indicate and explore the research gap. The first was the Structured Literature Review (SLR) variation method. The second method was the classical tabular comparison of gathered results. The third research method was a cluster analysis based on secondary data with cross-country comparisons of the number of charging stations and electric cars. Therefore, this paper presents a theoretical discussion and practical business implications based on the achieved results of clusters and rankings. The main finding of this paper is that charging stations play a pivotal role in electromobility development in countries with already developed road infrastructure and maritime transportation. The charging stations can support energetic infrastructure, especially in countries with vast geographical distances. The charging stations and electric vehicles statistics presented in ratios and ranks proved similarities in the electromobility development patterns in the analyzed countries. This paper also presents the limitations of the performed study and identifies possible future research avenues.
1. Introduction
New technologies and innovations [1,2], related to the Industry 4.0 idea in the energy sector [3,4], are genuinely powering the digital economy [5,6]. Industry 4.0 is a concept related to the use of automation [7], data processing [8], and data exchange [9], employed especially in practice in car charging stations, its infrastructure [10,11], and energy distribution networks [12,13]. The electromobility is developed through the Industry 4.0 features [14,15], which can be measured by the growing number of electric cars or electric vehicles (EVs) [16,17] and charging stations [18,19]. The charging stations are gathered in off-grid or on-grid networks [20,21] that require continuous data analysis [22,23] in electricity distribution or sale processes [24,25]. It should also be considered that electric vehicles vary in terms of software [26,27], technical specifications [28,29], performance [30,31], and even charging methods [16,32]. EVs can communicate between each other and also charging stations, and create the Internet of Vehicles (IoV) [33,34]. There are also different law regulations and economic and social factors worldwide [35,36], which influence electromobility popularity expressed as the growing number of electric car users [37,38]. The existing literature reviews [39,40] suggest that there is still a research gap related to the technical dimensions [41,42] of electromobility development [43,44]. Despite extensive research, cross-country and multidimensional comparisons of electromobility development in the broader energy sector context are lacking [45,46]. This perspective opens the door to a potential discussion regarding the application of foreign solutions in domestic electromobility development programs, such as incentives or energy infrastructure modernization [47] and national strategies [48,49]. On the other hand, potential drivers of electric vehicles are concerned about the lack of charging stations [50,51], while facilities owners, where stations would be useful, are hesitant to build because of the low number of electric cars [52]. Although there are multiple challenges related to very specific solutions related to the availability of electricity production from different sources or to the energy storage for charging stations, they are not subject of this research. This study integrates two research perspectives to provide theoretical and practical implications of the studied statistics and calculations in cross-country comparisons anchored in Industry 4.0. The Industry 4.0 influence on electromobility development is visible especially in the integration of communications [53,54], modern power system management [55], EVs control management [56,57], and computing technologies for IoV [58], which are based on grid stability and large-scale EV charging networks [59,60]. The importance of those Industry 4.0 characteristics is visible also in the whole energy sector [17,61].
The main goal of this scientific paper is to present the electromobility development represented in the number of charging stations and its infrastructure development calculations. Therefore, this scientific article presents selected electromobility development conditions focused most on the Industry 4.0 idea, related to the EVs infrastructure accessibility, development, and density [62]. This research primarily employs a descriptive method coupled with statistical analysis along with a more elaborated method of cluster analysis to answer the research question:
RQ: is the number of charging stations conditioned for the growing number of electric vehicles?
In this study, quantitative methods were used to indicate and explore the research gap and to address the formulated research question. The main adopted method was a secondary data analysis and cross-countries comparison of charging stations and electric cars’ numbers. A comparison was made of the relationships between the number of car charging stations and the number of electric cars in the chosen countries.
The paper is structured into four main sections: Introduction, Methods, Results, and Discussion. After presenting the main goal and research question in the introduction in the Materials and Methods, the three procedures and data sources are explained. The logic behind those three methods is to guide the reader from the general to the detailed view of the charging stations and electromobility development influenced by Industry 4.0. Then, in the fourth part of this paper, the results of the Structured Literature Review (SLR), tabular comparison, and cluster analysis methods are presented and discussed in the fifth subchapter of this paper. In the last section, the conclusion and implication of the presented results are listed. In the fifth section, the future research avenues are addressed along with the limitations of this study.
2. Materials and Methods
Instead of a single method, a sequence of methods have been employed to investigate the literature-identified [39,41,63] research gap and achieve the paper’s primary objective. The first method was the SLR variation based on the Scopus database queries [64,65]. The second method was a tabular comparison of the calculated results presented in detail in Supplementary File S1. The third method was the K-Means Clustering Algorithm, which is an unsupervised machine learning to explore secondary data from the Passport business database [66] in the R programming environment.
In the SLR variation with queries [67,68], the scientific literature was explored quantitively to check the number of publications indexed in the Scopus scientific database related to Industry 4.0, electric vehicles, and charging stations [69,70]. Each query syntax is presented in Table 1 with the obtained results in ascending order.
The scientific literature dedicated to Industry 4.0 and charging stations, as presented in Table 1, is still rare only in the case of specific queries results [64]. However, a larger number of results were achieved in the SLR when the third query was extended by the “artificial AND intelligence” keywords [64,68]. Queries presented in Table 1 were used, due to the significant number of scientific publications in the whole explored period (the only limitation was the date of research, 01 August 2022) in the Scopus database. The SLR results based on the different syntax queries proved that direct keyword search offered a better match. The definitions of electric vehicles and charging stations were agreed upon in the effect of the SLR method results. To enhance the consistency and transparency of the research in this paper, the list of following abbreviations used in this publication is presented:
- EV—Electric Vehicle, alternative fuel vehicle [71];
- BEV—Battery Electric Vehicle, a vehicle powered by an electric motor only [72];
- PHEV—Plug-In Hybrid Electric Vehicle, a vehicle powered by an internal combustion engine and an electric motor, with the possibility of an external charge;
- EREV—Extended-Range Electric Vehicle, a vehicle powered by electricity that can additionally be produced from a small internal combustion engine [72];
- FCEV—Fuel Cell Electric Vehicle, Hydrogen powered vehicle [72];
- Charging station—public EV charging device;
- Charging point—charging slot for one EV.
In this research, the electric car or electric vehicle (EV) is defined as a car that runs on alternative fuel and can be: BEV, PHEV, EREV, and FCEV. A charging station is treated as a charging point for calculation purposes, due to the lack of available data separating charging stations with 1, 2, or 3 charging points. Therefore, a charging station is a facility with one charger (charging spot). An electric vehicle charging station is equipment that connects an electric vehicle (EV) to a source of electricity to recharge it [73].
In this study, calculations were performed to present ratios between secondary data retrieved from the Passport business database [66]. Calculations are presented in an Excel file as Supplementary File S1. Equation (1) was used to calculate NEVCS, which is the number of electric vehicles per 1 charging station:
where:
NEVCS = NEV/NCS
- NEVCS—number of electric vehicles per 1 charging station;
- NEV—number of electric vehicles in country;
- NCS—number of charging stations in country.
Equation (2) was used in this study to calculate the number of charging stations per 1 km2 (NCSKM):
where:
NCSKM = NCS/AR
- NCSKM—number of charging stations per 1 km2;
- NCS—number of charging stations in a specific country;
- AR—area of analyzed country (km2).
In this scientific paper, the availability of the charging stations was also calculated with the use of Equation (3). Equation (3), the number of charging stations per 1 person (NCSP), and Equation (4), the number of people per 1 charging station (NPCS), were calculated in this study:
where:
NCSP = NCS/P
NPCS = P/NCS
- NCSP—number of charging stations per 1 person;
- NPCS—number of people per 1 charging station;
- NCS—number of charging stations in specific country;
- P—population of specific country (number of citizens).
Comparative tables were proposed to provide a global comparative cross-country analysis of the electromobility development and charging infrastructure. The tables’ content was calculated using all equations presented above and the secondary data presented in Supplementary File S1. Comparisons are consecutively presented as ranks in the following tables: countries with the highest number of charging stations (with one or more charging spots); the calculated ratio of electric cars per charging station; the ratio of charging stations per km2, and charging stations per citizen. Various articles, websites, and reports were consulted to determine the number of registered electric cars. These sources were complemented and confirmed by the Passport database. Observing secondary data led to the conclusion that the number of electric vehicles and charging stations must increase rapidly, particularly during the transition period when coexisting with gas stations [16,74]. The subject of the analysis, used as a second method, was data in the Passport business database [66]. Access to this database was provided by the registration via Wroclaw University of Business and Economics (Poland) and York University (Canada) proxy connections. In this database, two direct keywords were searched: “electric cars” and “charging stations”. There were data related directly to the electric cars registrations and car charging stations in the Passport database for years 2016–2021. The data collected for all electric car types registrations were counted in the thousands, while the charging stations were in measured units (despite their type). The data for the electric vehicles were aggregated and downloaded with default settings. The raw secondary data downloaded from the Passport business database are presented in Supplementary File S1. In this study, data significantly exceeding other numbers were excluded as outliers [75]. In addition, data reported by China (the People’s Republic of China) as the source of the non-reliable information [76,77] were also excluded.
In the section titled “Cluster Analysis Results”, the K-Means Clustering Algorithm method is explained in detail along with its results to improve the readability of this study.
3. Results
3.1. SLR Results
Industry 4.0 still poses challenges to a large group of automotive organizations and often creates opportunities related to the processes of their further growth (quantitative changes) or improvements and development (qualitative changes) [78]. Therefore, Industry 4.0 influences organizational management and cooperation between electric car producers and charging stations [79]. The number of publications is significantly lower than in the query where more general Artificial Intelligence is applied (Table 1).
The resource-based view assumes that no enterprise has all the required resources for effective performance [80]. This resource-based view results in paying attention to the association of the organization with the business environment [81]. This surrounding is the source of the resources that the organization is not able to produce independently. The desire to fill the resource gap pushes numerous organizations seeking to maintain or gain a competitive advantage, and some of them want to establish inter-organizational ties [82] and join the inter-organizational network (systems). Electric cars and charging station networks are examples of this. Vehicle manufacturers are rarely concerned with investing in a network of chargers, instead focusing on their vehicles [83]. On the other hand, there has been an expansion of companies producing and operating electric vehicle charging stations [84]. New companies providing charging services are following the official partners of large car corporations [85]. The creation of a new electric vehicle involves a high entry threshold, so there is interest in creating new service solutions [86].
The interorganizational networks are made up of at least two autonomous organizations that are becoming more similar to each other and growing the use of information technology with time [87]. The cooperation necessity with many stakeholders and business partners can bring surprises, discouragement, and resistance concerning the changes required in modern organizations that implement the Industry 4.0 infrastructure [88]. This infrastructure is crucial not only for the change in management and information. It also creates a similarity between autonomous organizations in the network [66]. However, the cooperation between organizations in such a system brings more positive than adverse effects. Companies specializing in a particular field are less likely to be re-branded, whereas newly established start-ups have the opportunity to fully adapt to the market and a given demand for specific services or products [13].
Industry 4.0 implementation in the organizations allows them to form a system and gain some organizational proximity. This organizational proximity is a crucial property of cooperating organizations. Additionally, the AI can influence the following: explaining competitiveness and efficiency sources, as well as stages and conditions for development; nodes’ basic identification features—transfer of research attention from ties to network nodes; relationship identification on the cooperative line in networks and innovation types. Industry 4.0 in organization management favors sharing information, knowledge, and technology. Therefore, Industry 4.0 is accelerating the change implementation. It is also intensifying development thanks to the practical cooperation benefits of building inter-organizational trust, reducing the level of business uncertainty [89,90]. Based on the development of electromobility, there is a phenomenon of co-opetition among the organizations responsible for charging networks [91]. Companies are trying to operate autonomously from each other and increase their number of points, but with the high level of competition, it is becoming impossible to operate independently. For this reason, subscription schemes are being created, which are based on the sharing of charging services between several operators. The assumptions of Industry 4.0 have a crucial expression in the electromobility market [92].
3.2. Tabular Comparison Results
The results of the tabular comparisons are gathered and presented in Supplementary File S1 in detail. However, the extract of these calculations is presented in four consecutive tables below. These comparisons were based on the calculation results of formulas 1–4. Therefore, the four categories were chosen to indicate a broad selection of the best developing countries. Table 2 presents the total number of charging stations in a given country (more is better in this case). Table 3 presents the number of registered electric cars per station (less is better). Table 4 indicates the number of stations per 1 km2 of national area (more is better). Table 5 presents the number of people per charging station (less is better).
The results of the Passport business database exploration were used this study. As a result, Table 2 presenting the number of charging stations (Table 2) and Table 3, Table 4 and Table 5 with the results of Equations (1)–(3) were proposed. Table 2 presents the number of public charging stations by country, due to available data from the Passport database [66,93]. The number of chargers indicates the available charging stations, regarding the output in 2021. The rank method in presenting calculated data was adopted also for Table 3, Table 4 and Table 5.
In Table 2, economically developed countries are distinguished, as the top 10 countries with the highest absolute number of charging stations. A significant development of electromobility is observed in highly developed countries, with a long history of the technological progress and discoveries [94,95]. For developing countries, there are no relevant data or the numbers are relatively small. This raises the research question of what influences EV development presented in the Section 1 of this paper.
Table 2 list the top ten countries from different continents, representing the continents of Europe, North America, and Asia. The largest number of charging stations in the world is located in the United States. The average across the list in Supplementary Files S1 is 15,687 charging stations per country. Sweden, as the lowest of the top 10, has more charging stations than the average result presented in Supplementary File S1. Countries that produce electric vehicles are leading the ranking (the USA, South Korea, Germany, France, the UK, Japan, Italy, and Sweden).
In Table 3, the ratio (NEVCS) of the number of electric cars (NEV) to charging stations (NCS), as indicated in Equation (1), is presented. Table 3 presents the selected top 10 countries, according to this ratio, but the full list is presented in Supplementary File S1.

Table 3.
The top 10 countries with the lowest number of electric vehicles per 1 charging station.
| No. | Country | NEV | NEVCS |
|---|---|---|---|
| 1. | Bulgaria | 418 | 0.61 |
| 2. | Latvia | 569 | 1.19 |
| 3. | South Korea | 115,137 | 1.39 |
| 4. | Slovakia | 2271 | 1.40 |
| 5. | Croatia | 1874 | 1.99 |
| 6. | Turkey | 6000 | 2.41 |
| 7. | Austria | 48,006 | 2.76 |
| 8. | Czechia | 6608 | 2.87 |
| 9. | Cyprus | 179 | 2.89 |
| 10. | Hungary | 8548 | 2.96 |
Table 3 presents the countries with the lowest NEVCS, the ratio of electric vehicles per charging station. This can be recognized as the theoretically better situation for EV drivers, because it means more flexibility of charging stations, smaller queues (accessibility), and, consequently, faster charging. Surprisingly, Bulgaria is the only country in the list with more charging stations than electric cars (ratio lower than 1). From the drivers’ perspective, this is a positive result, while from an economic point of view, it can mean selective use of the device and indicate the problem of network over-development. It should be taken into account that such a result is achieved through the very small number of cars registered in Bulgaria. However, there are large differences in the number of cars (EVs). The smallest NEV in the rank belongs to Cyprus, which, in the top 10 list compared to the largest (South Korea), is only about 0.0016‰ (Table 3). Countries with low numbers of electric cars are leading the way in the comparison in Table 3. The average number of electric cars registered in the researched countries is 123,248, presented in Supplementary Materials File S1. There is no country in Table 3 presented as one of the top 10 countries according the NEVCS factor list, which equals or exceeds the average of 11.58. This is because this is a reversed ratio. Hungary has the lowest value in the table, which corresponds to almost 3 cars per station.
The number of charging stations per 1 km2 were calculated according to Equation (2) in Table 4. The results presented in this table reflect the area of charging station density, as a charging stations per km2 factor of electromobility development.
Table 4.
The top 10 countries with the highest number of charging station per 1 km2.
| No. | Country | Country Area (AR) | NCSKM |
|---|---|---|---|
| 1. | Netherlands | 37,377 | 2.45442 |
| 2. | South Korea | 100,210 | 0.82433 |
| 3. | Belgium | 30,666 | 0.48855 |
| 4. | Luxembourg | 2595 | 0.40231 |
| 5. | Malta | 316 | 0.31646 |
| 6. | Slovenia | 20,273 | 0.27426 |
| 7. | Austria | 83,878 | 0.20754 |
| 8. | Switzerland | 41,285 | 0.20119 |
| 9. | Germany | 357,569 | 0.17538 |
| 10. | United Kingdom | 244,381 | 0.15845 |
The results presented in Table 4 suggest that the more charging stations per 1 square kilometer, the better the situation for EV drivers. The density of charging stations, or their dispersion in Table 4, provides a preview of chargers’ availability. The average value in the whole analyzed list, presented in Supplementary File S1, is 0.14460 charging stations per square kilometer. Each of the listed items in the top 10 position exceeds this average score (Table 4). There is only one country (the Netherlands) with a value of NCKSM exceeding 2 charging stations per square kilometer. The first country’s score, the Netherlands, by almost 17 times exceeds the average value of the whole rank list of countries (Supplementary Fie S1). The rank of ten top countries with a NCKSM factor is closed by the United Kingdom with score of 0.15845, also higher than the average for the whole analyzed set of countries.
In Table 5, the number of citizens of each country per 1 charging station (NPCS) and the reversed ratio of the number of charging stations per person (NCPS) are presented. Those values were calculated according to Equations (3) and (4), respectively. The ascending value of NPCS was the basis for the countries rank of the top 10 countries listed in Table 5.
Table 5.
The top 10 countries with the lowest number of citizens per 1 charging station.
| No. | Country | Population (P) | NPCS | NCSP |
|---|---|---|---|---|
| 1. | Netherlands | 17,475,415 | 190 | 0.0052496 |
| 2. | Norway | 5,391,369 | 218 | 0.0045788 |
| 3. | Slovenia | 2,108,977 | 379 | 0.0026363 |
| 4. | Iceland | 368,792 | 391 | 0.0025543 |
| 5. | Austria | 8,932,664 | 513 | 0.0019488 |
| 6. | Sweden | 10,379,295 | 514 | 0.0019463 |
| 7. | Luxembourg | 634,730 | 608 | 0.0016448 |
| 8. | South Korea | 51,305,184 | 621 | 0.0016101 |
| 9. | Belgium | 11,554,767 | 771 | 0.0012966 |
| 10. | Denmark | 5,840,045 | 966 | 0.0010353 |
The results presented in Table 5 suggest that with the decreasing number of citizens per charging station (possible users of the charging stations and EVs), the situation for electromobility development is better. This observation corresponds with the higher position of the country in the rank (Table 5) and the reversed ratio of NCPS. Therefore, from the user’s point of view, the accessibility is higher if fewer people share charging stations. The Netherlands tops the list with a ratio of 0.0052496 people per charging station (NCSP). The average value of NPCS is 18,688 citizens per charging station and an index of 0.0007617 of citizens per station (NCSP). Each country positioned in Table 5 is significantly above the average values of both calculated ratios. This comparison gives a preview of countries that are ready for the transition to electric vehicles in terms of providing charging points for the general population [47]. Denmark closes the table of the top 10 countries with a score around five times worse than the leading country. The comparison is particularly important for the further development of EV infrastructure. Assuming a ban on new internal combustion vehicles in 2035 [16], comparisons to the population may be appropriate when switching to an alternative vehicle power source.
3.3. Clusterization Results
The Passport Business Database (Passport) [66] was used as the source of data for the K-Means Clustering Algorithm method [111]. Data with exceptions identified and previously excluded from tabular comparisons were downloaded for the full analysis. The passport data related to EV registrations are divided into subsets of BEVs, PHEVs, and HEVs. The passport metadata also split data for charging stations into two types. The first type are the charging stations, which are the piece of infrastructure that provides electricity for charging EVs. Charging refers to a charging power that is less than 22 kW. The second type are fast-charge stations. This infrastructure element provides electric power for charging electric vehicles. Fast charging refers to a charging power greater than 22 kW [93]. Clustering analysis was performed on both categories of charging stations. However, only data for the year 2021 were collected for the analyzed countries.
The data were gathered in .csv format that consisted of countries and variables: charging stations, EV, NCSKM, NCSP, and NPCS, as indicated in Equations (1)–(4) and calculated in detail in Supplementary File S1. The next step was to remove outliers and unnecessary data. The following countries and regions were not considered, due to the outlier characteristics: Asia Pacific, Australasia, Western Europe, North America, China, Iceland, and the Netherlands. In the R environment, data were scaled by the scale R base function [112]. The Passport data were missing for some data; thus, they were complemented and verified by the additional sources and gathered in Supplementary File S1. The numbers related to citizens and area were acquired in the Passport Business Database [66]. To include a multivariate dataset, the factoextra R package was used [113]. In this package, Principal Component Analysis (PCA) was used to summarize the information contained in the continuous data’s dimensionality without affecting important information [114,115].
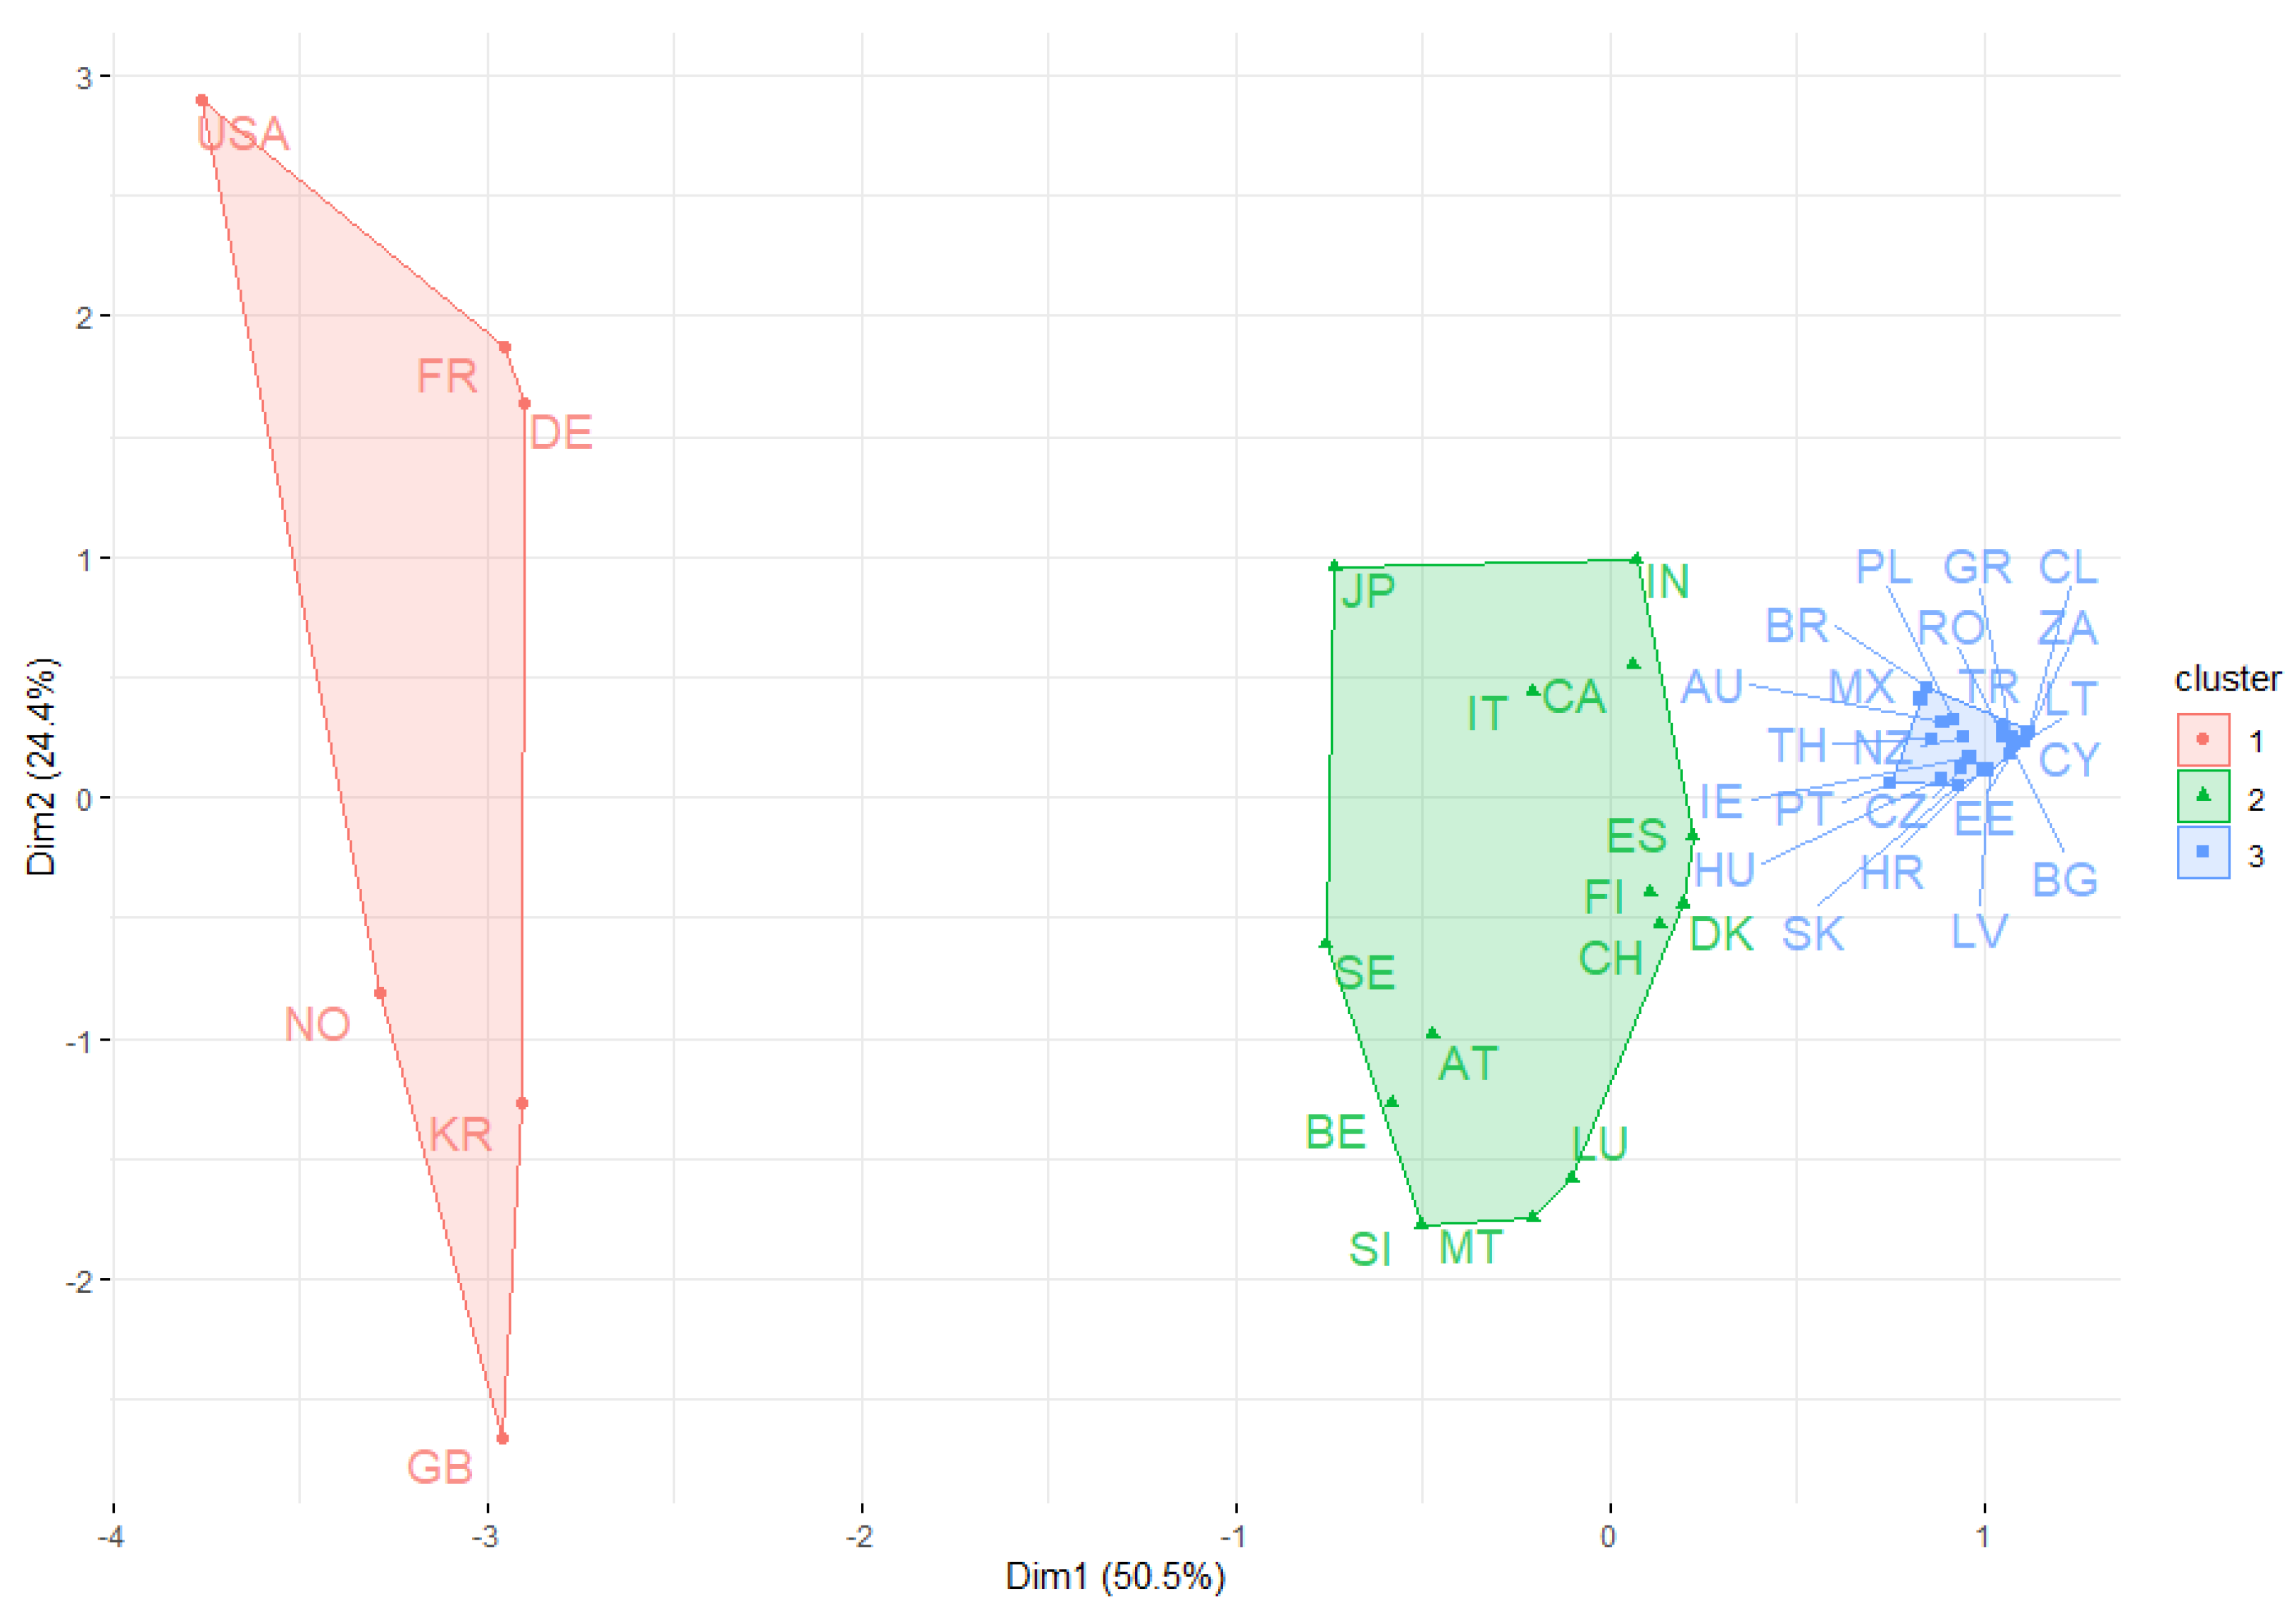
Figure 1 presents the cluster plot in two-dimensional space (Dim1 and Dim2). These dimensions are functionally equivalent to Principal Components (PCs). PCs are independent (orthogonal) to other PCs and are linear combinations of the original variables. In Figure 1, the horizontal dimension (Dim1) corresponds to the first principal component (PC1). PC1 is a new variable that explains 50.5% of the majority of the total variance of the original dataset variables. The vertical axis in Figure 1 (Dim2) refers to the second principal component (PC2), which explains 24.4% of the overall variance. Both PCs explain 74.9% of the overall variance.
The clustering method results presented in Figure 1 differ in color, shape, and area. Therefore, the three clusters were identified, and the researched countries can be classified as most developed, very developed, and least developed in terms of the factors that were taken into consideration. The detailed results of clusters are presented in Table 6, Table 7 and Table 8. Nevertheless, some relationships were discovered that occur in clusters. More specifically, cluster 1 represents countries that have a very well-developed maritime infrastructure that support the export of the produced electric vehicles. Therefore, cluster 1 was named as a cluster of the first pattern of electromobility development (Table 6).
Another cluster represents countries that are a mixture of countries with the developed maritime infrastructure allowing them trade and development, such as Japan, Belgium, or Sweden. However, most of the countries represented in the second cluster have access to the coastline or diversified geographically coastline. The exceptions are Luxembourg and Switzerland. Table 7 presents the second cluster named in the article as coastal-island.
The third cluster represents least developed countries (Table 8) that contribute least to the maritime infrastructure and are landlocked. Their development in terms of the in-depth technical aspect of electromobility development is also uncertain. In addition, this cluster consists of the largest number of countries in comparison to previous ones.
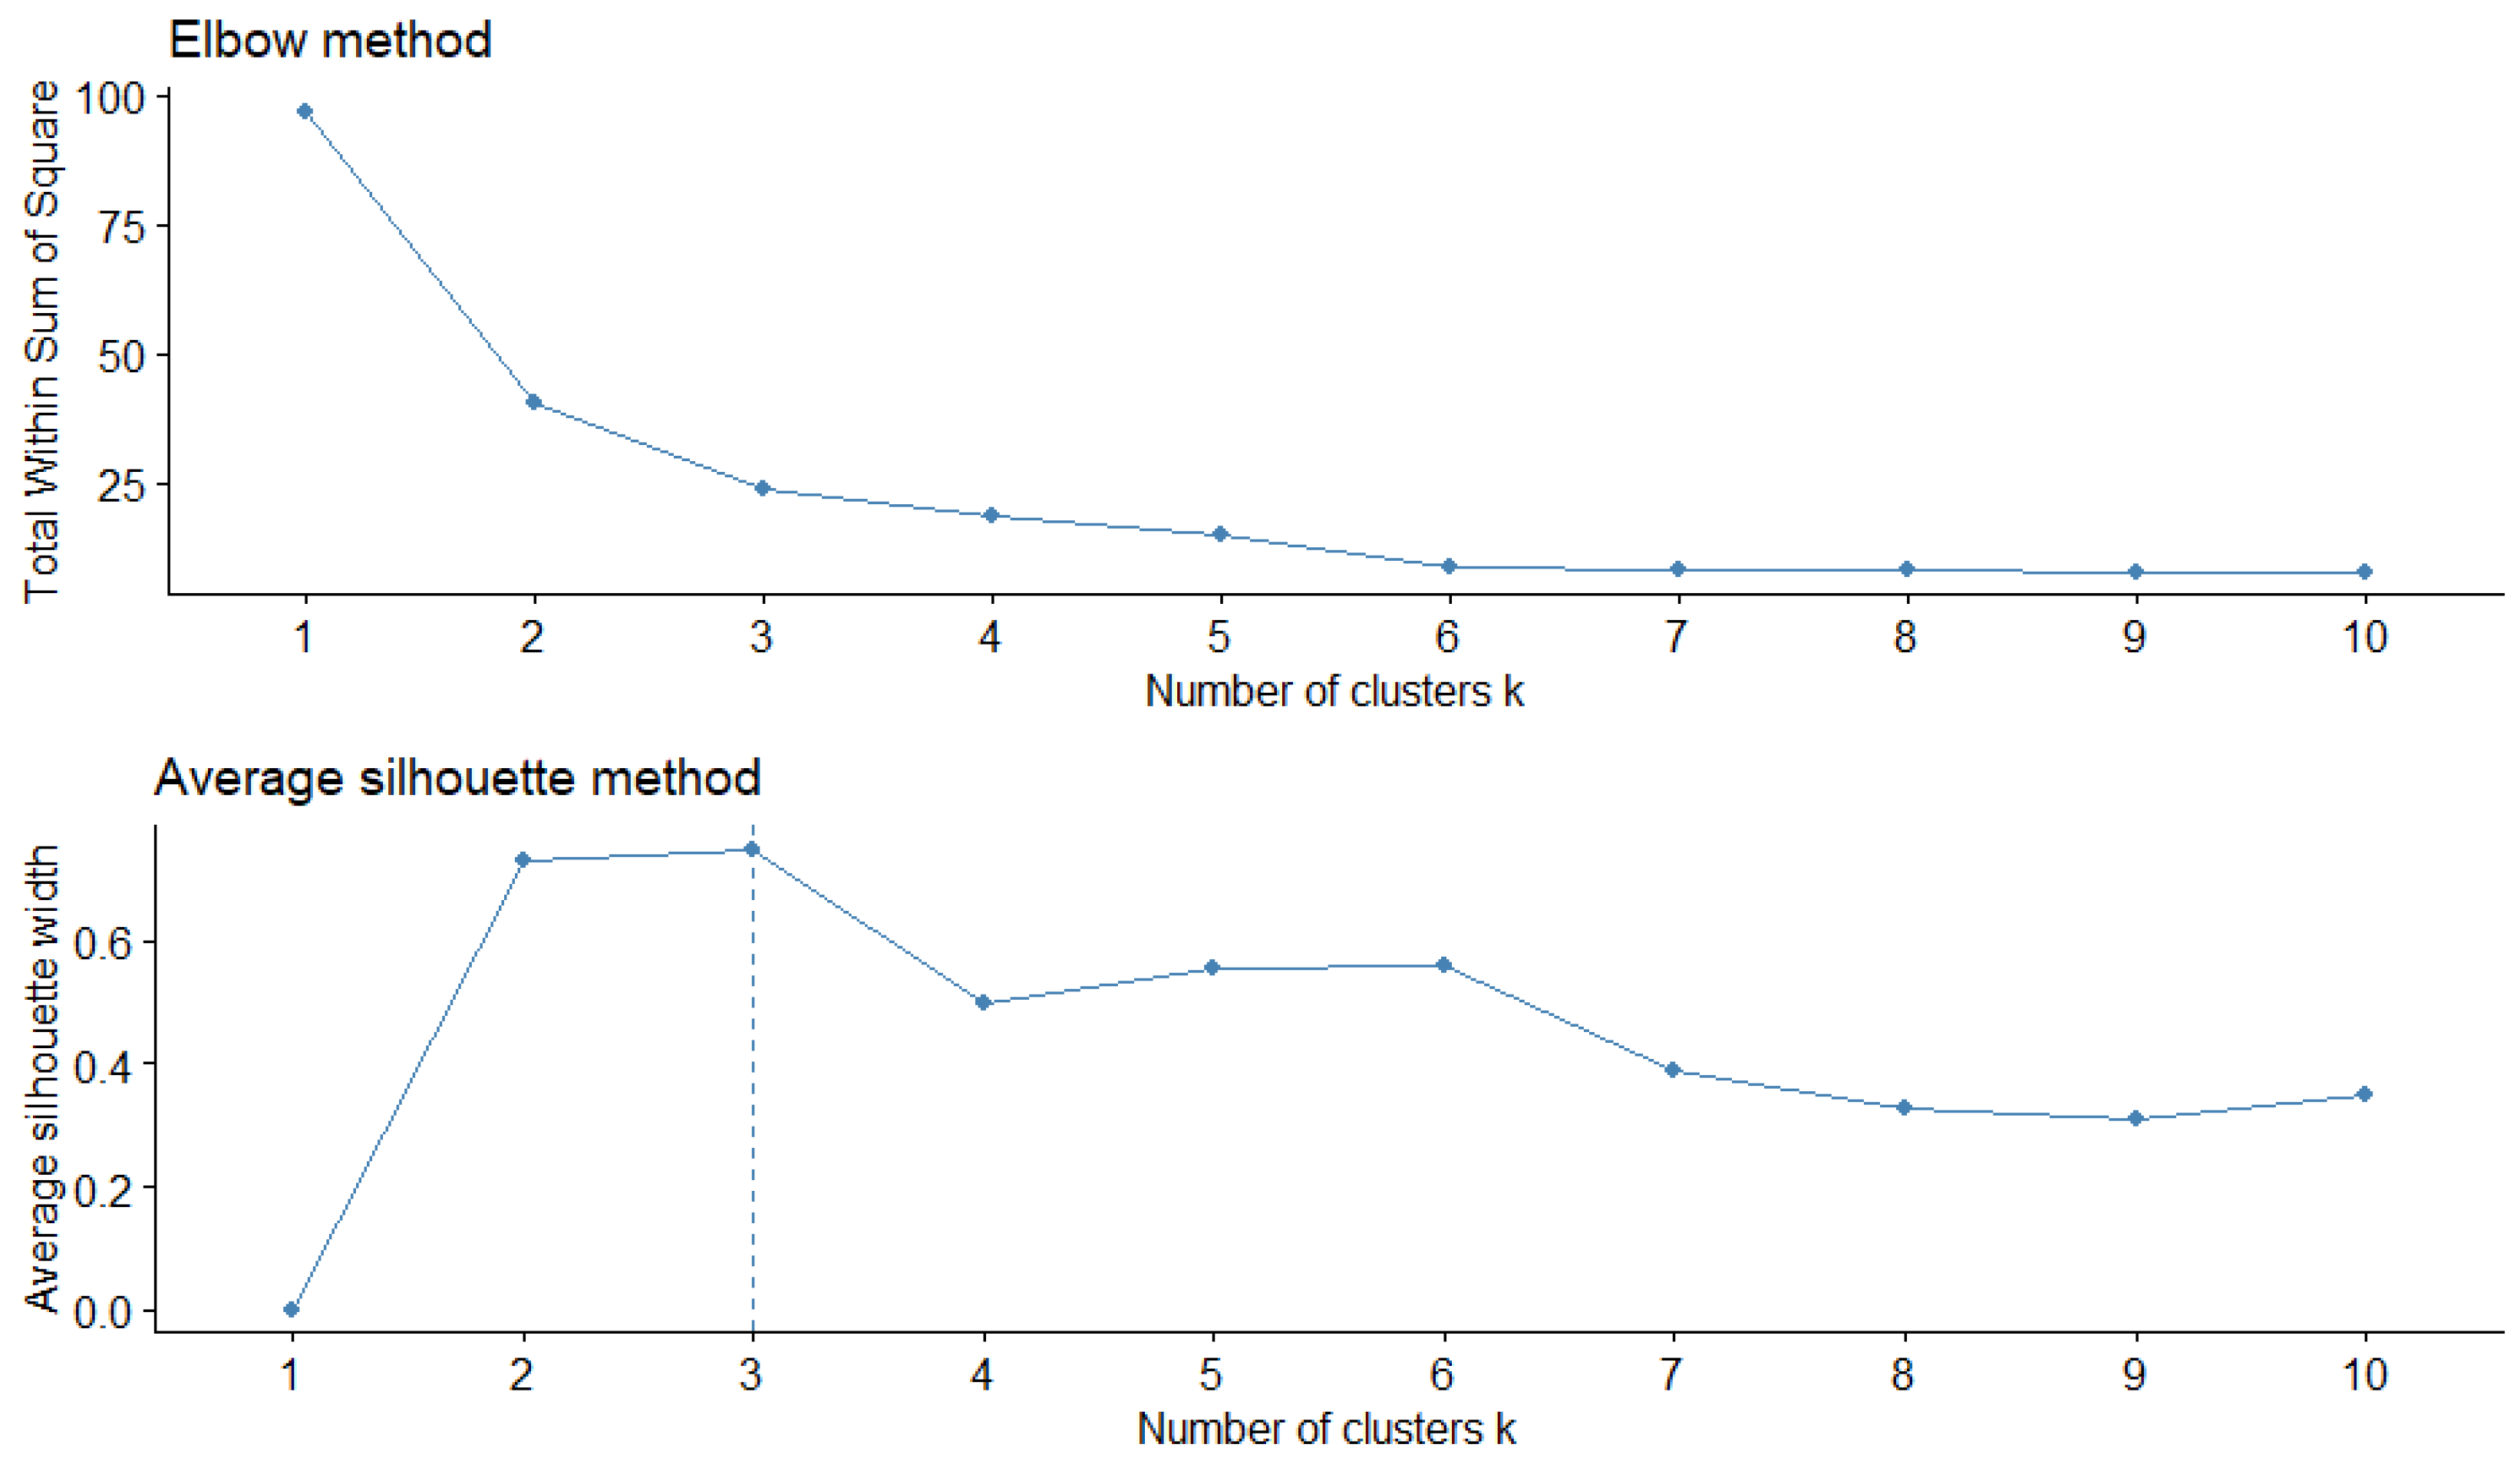
The fundamental principle of partitioning methods, such as K-Means Clustering, is to construct clusters in such a way that the total intra-cluster variation (calculate total within-cluster sum of square) is minimized. The total Within-cluster Sum of Square (WSS) assesses the clustering’s compactness, and best value is when the WSS is decreasing rapidly, but not unvarying. The elbow method [116] is a quantitative discriminant method used for establishing the optimal number of clusters in the clustering algorithm. The elbow method calculates total WSS as a function of cluster count (Figure 2). One should select a number of clusters such that adding another cluster does not significantly increase the total WSS. The optimal number of clusters determined by the elbow method steps is as follows:
- Calculate the clustering algorithm (k-means clustering) for various values of k.
- Calculate the total within-cluster sum of squares for each k (WSS).
- Plot the WSS curve based on the number of clusters k.
- The location of a bend (when WSS is decreasing rapidly) in the plot is commonly used to determine the proper number of clusters.
The silhouette analysis (Figure 2) evaluates the average distance between clusters and measures how well an observation is grouped. The silhouette plot shows how close each point in a cluster is to points in neighboring clusters. A large average silhouette width indicates that the clustering is robust. The average silhouette method calculates the average silhouette of observations for various k values. The ideal number of clusters k is the one that maximizes the average silhouette across a range of k values [116]. The algorithm is similar to the elbow approach and is as follows:
- Calculate the clustering algorithm (k-means clustering) for various values of k
- Calculate the average silhouette of observations for each k.
- Plot the average silhouette method curve based on the number of clusters k.
- The maximum location is regarded as the acceptable number of clusters.
In the upper part of Figure 2, the elbow method is presented. For data considered in this article, the use of the elbow method approach is to get an idea of clusters. It implies interpreting a line plot with an elbow shape. The number of clusters represents the number of elbow bends. The x-axis represents the number of clusters, while the y-axis represents the Within-Clusters Sum of Squares (WCSS) for each number of clusters. The elbow technique determined that three clusters are the optimal number.
Moreover, in the bottom part of Figure 2, the validity index is represented graphically by the silhouette’s method for the ten identified clusters. Figure 2 shows, on the x-axis, the number of clusters and, on the y-axis, the silhouette index. As can be seen in Figure 2, the maximum index value obtained in the analyzed range is for k = 3. Moreover, the identification of minimum values for k is close to 4 and 9, confirming that the range of partitions tested is appropriate for the analysis of the dataset under consideration. This confirms the number of clusters presented in Figure 1.
4. Discussion
Energy sector organizations operate in a network economy supported by infrastructure solutions based on Industry 4.0 [99,117]. The researched accessibility of the electric cars and density of the electromobility infrastructure in the form of a list of countries organized as ranks indicate that there are patterns of the electromobility development. There are three major patterns describing the relations between the number of electric vehicles and charging stations. These three patterns are presented in the form of the 3 clusters presented in Figure 1.
The main research of this study is that Industry 4.0 creates the space for the electromobility development [118,119]. The conditions of the modern economy are privileged by innovative organizations, using the latest technologies, which are under the Industry 4.0 influence. This is because pioneering and innovation are some of the cornerstones of the competitive advantages sought by organizations [120]. The Industry 4.0 technologies can support managerial decisions about inter-organizational cooperation, improve learning, creation, absorption, and commercialization of knowledge [121,122]. By analyzing the Industry 4.0 studies published so far, it has been discovered that they mostly discuss the technical aspects. This complex but beneficial situation is visible in cluster 1 countries.
Industry 4.0 organizations are striving to provide cutting-edge technologies [34,123]. Fleet electrification and investment in electric vehicle charging networks are such examples [124]. With a single hub location for charging, this does not pose major problems. Difficulties arise when wanting to create a network and provide conditions for electromobility development [50]. Problems can occur both when the scale is transferred vertically and horizontally (between countries). This planar shift is visible also in Figure 1, where clusters 2 and 3 provide charging infrastructure for cars produced mainly in countries from cluster 1. In terms of vertical scale, households consume relatively small amounts of electricity, with a standard connection power of 12.5 kW with 3 phases [125,126]. In the case of charging electric cars with normal power of up to 22 kW or high power of up to 400 kW [56], currently, there is a much higher power consumption, which was previously rare [127,128]. The differences in electricity consumption between countries in cluster 1 are the reason for its vertical span, wider than in other clusters. Obstacles can be outdated electrical installations that need to be extensively upgraded to accommodate EVs [116,129]. In commercial buildings, there is more power available, but in single-family homes, the increase in power comes at a significant cost [51]. The investment in building fast charging stations and adapting the infrastructure promises an uncertain return on investment [130]. In order to make the development of new stations viable, states may subsidize charging stations and the costs associated with charging [86]. However, the research question arises after the development of the charger network whether the energy capacity of the economies will sustain the demand caused by electric vehicles. This topic will be explored further in future research.
New technology, which charging stations are also commonly considered to be, is not always entirely innovative. For example, the access control to the charger was introduced as verification using RFID cards [131]. The current trend is to move away from physical items and even replace payment cards with a phone [132]. The introduction of physical RFID cards has added a complication [133] despite the research in this study of chargers’ availability. Different manufacturers started to use their cards, so an electromobility development journey required several cards [134], for example, one for own home stations and another with access to a particular operator. The various cards for several operators are currently being leveled by providing the possibility of controlling one’s own card, which is programmed for several separate companies [135]. The latest start-ups are introducing wireless control of charging sessions using a smartphone [136]. What might have seemed obvious (as even cars are controlled from an app) is only now being implemented in the charging station market [137]. Only by implementing full online verification is it possible to create common networks and facilitate communication between points. The solution comes from The Open Charge Point Protocol (OCPP) that allows the electric vehicle, charging station, and management system to communicate with each other [138]. Those two technical aspects are part of Industry 4.0 but are not presented in the statistical analyses presented in this article. There are other consequences; this Industry 4.0 revolution changes everything in business, from business models and their matching with strategies to customer service. Those subjects create another possible direction of the further studies.
In the results of tabular comparisons, the appearance of outlier results is observed. This is due to the low number of electric cars in the Netherlands, relative to charging stations. Iceland is an outlier due to the small population. Developed countries are meeting the conditions of the environmental and networked economy, in which, along with a high level of capital, investment is being made to improve the environment—in this case, through electric vehicles and all infrastructure. The Netherlands has an exceptionally developed electromobility on a global scale. It achieves high scores in many comparisons. It is definitely several years ahead of its development. As an EU country, it raises the interesting question of when the EU average will equal the Netherlands’ 2021 level of development.
Another trend is in the tourist countries, where there is a relatively high number of charging stations despite the small number of electric cars registered in the country. This may illustrate an adaptation of the needs of the developed country customer rather than a concern for the environment. Developing countries are the largest, relatively EV-developed group. For these countries, a complete change to electric vehicles could prove to be a major obstacle to electromobility development. In the example of Bulgaria (Table 3), there are more charging stations than electric vehicles in the country as a whole. In the case of Cyprus, Turkey, Croatia, and Bulgaria, the relatively high number of charging stations [139] can indicate an orientation toward external visitors to the country (tourists).
5. Conclusions
Since 1905, the global road infrastructure has gradually adapted to accommodate combustion vehicles. Petrol stations have become a permanent feature of the landscape across the globe. However, in the 21st century, electric cars have been acknowledged again and it has been decided to completely change the current market. The European Union has already mandated the possibility of buying only electric cars from 2035 [16]. It involves building an entirely new infrastructure and modernizing the entire energy sector dedicated to the electromobility [140]. Charging stations for electric cars as an essential product for EVs are starting to become a new reality. This entails upgrading electrical installations and an increased energy resource, leading to more consistent low-carbon energy sources. Therefore, this study answered positively the RQ whether the number of charging stations has an impact on the number of electric cars. The topic of electric cars and charging stations has saturated the research community in recent years, and although the number of publications presented in this study is relatively high, there are still research gaps that this research attempted to address.
This research aim was achieved by presentation of the qualitative and quantitative results from recognized databases. Presented in this research, qualitative results included the formulation of definitions, which vary in the scientific literature. On the other hand, the quantitative results of analyzed secondary data from 2021 pointed at the patterns of the electromobility development. The first was the tabular comparison, where the top 10 countries in four categories were selected for an extensive analysis of the theme of charging stations. The recurring countries were then described. However, their whole collection was then the subject of the clustering algorithm method. In the results, the first pattern was represented by countries that have a developed economy, produce electric cars, have a significant number of car chargers, and have developed a maritime infrastructure supporting the export of the produced cars. The second pattern was represented by countries of the second cluster that not only have a domestic production of the electric cars influencing their position in the ranks, but also develop the car chargers’ infrastructure. The third scenario represented countries of the third cluster where the import of the electric cars or their production is lower than the number of car chargers. The third group of countries also represented a different level of the adoption of the Industry 4.0 idea. The limitations of this research were databases and the data reliability. The Scopus and Passport databases require a standard academic subscription, which can be a source of the limitations for those who would like to replicate this study. Next to the accessibility is the structure of the data available to be exported from the database. There is a limitation of the used SLR variation method related directly to the queries formulation. The main problem with the obtained results is the large number of synonyms and the variety of spellings for the matched results. The secondary data availability is also a limitation of this part of study. The newest and most reliable data related to the numbers of registered electric vehicles are from the end of 2021 [141,142]. There are other questions opened by the provided analyses, related to the energy generation and consumption. In this study, the electromobility development measured by the number of the electric vehicles and the availability of car chargers does not reflect the required energy consumption growth, but presents an interesting pattern of the countries with a highly developed industry and transportation system (also maritime). A limitation of the method of comparing different countries with each other is that it is not possible to determine the unique trend, so outliers appeared and had to be excluded. Therefore, the method was complemented by the clustering algorithm method to overcome this limitation. Then, the main limitations of this paper were omitted by the usage of three methods used in the sequence. Therefore, this article is not only conceptual in its nature, but also provides a preview into methods that can be employed by the practitioners and scientists.
The theoretical contribution of this paper is placed in measurement of electromobility development, indicating countries not only as leaders of the trend but also patterns of the conditions provided for such a change. Another scientific contribution is a review of the secondary statistical data and their usage in calculations, to answer positively the RQ about relations between the number of electric vehicles and car chargers. The third theoretical contribution of this study is based on the exploration of the two gaps. The first is the knowledge gap about the definitions used in the scientific papers. The second is the taxonomic gap, which is satisfied in this study by the ranks in different aspects. In the future, the characteristics of the charging stations allow the use of machine learning and indicate patterns of the electromobility development. This is one of the possible research avenues associated with the exploratory research gaps.
The methodological contribution of this research paper is based on the used set of methods to explore the subject literature and business data. The bibliometric study based on the SLR variation with queries can be an initial step in the exploration of the research problem expressed in the RQ.
The practical contributions of this paper can interest researchers, managers, and policymakers interested in the energy sector and electromobility development. Presented in this study, the high number of charging stations may indicate a good level of electromobility development, but when compared to cars in use, area, or population, the indicators change significantly. For example, this is a useful indicator to check the development in terms of total conversion to EVs, but does not take into consideration actual users. The limitation of the classic comparison can be seen in the context of the distances between car chargers, which open perspectives for the new studies. Denser charging networks are expected in more populated areas. This specific direction of the electromobility development involves both managerial and technological solutions. The results of this study can serve as a prerequisite for increasing the effectiveness of public decision making, as evidence of the positive relation between electric vehicles and car charging stations in electromobility development.
The novelty of this study is based on the identification of the patterns of electromobility development presented in the logic sequence of methods, The article provides an overview of the existing literature on Industry 4.0 and electromobility development relations. However, the effects on the management of the companies that use the Industry 4.0 technologies and form inter-organizational networks should be examined in the future in the broader context of the electric vehicles chargers networks [143]. Another novelty of this study is based on the identification of leaders in the presented ranks and clusters. A presentation of the existing research gaps and identification of the main directions of future research constitute another novel feature of this study. The next research study should also define criteria for non-technological aspects of Industry 4.0 in the electromobility issues and how these should be treated. The new possible direction of the research method can be the use of the bibliometric software to analyze the literature in-depth by the bibliometric maps.
Supplementary Materials
The following supporting information can be downloaded at: https://0-www-mdpi-com.brum.beds.ac.uk/article/10.3390/en16010032/s1, Supplementary File S1: Raw Data 2021 and Calculations Results.
Author Contributions
Conceptualization, T.Z., A.S. and S.G.; methodology, T.Z., A.S. and S.G.; formal analysis, T.Z., A.S. and S.G.; investigation, T.Z., A.S. and S.G.; writing—original draft preparation, T.Z., A.S. and S.G.; writing—review and editing, T.Z., A.S. and S.G.; visualization, T.Z., A.S. and S.G.; supervision, A.S.; project administration, T.Z., A.S. and S.G.; funding acquisition, T.Z., A.S. and S.G. All authors have read and agreed to the published version of the manuscript.
Funding
(A.S.) The project is financed by the National Science Center in Poland under the program “Business Ecosystem of the Environmental Goods and Services Sector in Poland”, implemented in 2020–2022; project number 2019/33/N/HS4/02957; total funding amount PLN 120,900.00. (A.S. and T.Z.) This article has been written within the framework of the PROM Program for International Exchange of Doctoral Students and Academic Staff Contract No. PPI/PRO/2019/1/00049/U/00001. (T.Z., A.S., and S.G.) The project is financed by the Ministry of Education and Science in Poland under the program “Regional Initiative of Excellence” 2019–2023 project number 015/RID/2018/19 total funding amount 10 721 040,00 PLN.
Acknowledgments
The authors would like to thank Kinga Żmigrodzka-Ryszczyk (Wroclaw University of Economics and Business) and Alexandra Wong (York University Libraries) and John Dupuis (York University Libraries) for the Orbis database exploration and secondary data acquisition and consultations.
Conflicts of Interest
The authors declare no conflict of interest. The funders had no role in the design of the study; in the collection, analyses, or interpretation of data; in the writing of the manuscript, or in the decision to publish the results.
References
- Yang, L. Economic-Environmental Law Guarantee of the Green and Sustainable Development: Role of Health Expenditure and Innovation. Front. Public Health 2022, 10, 910643. [Google Scholar] [CrossRef]
- Drożdż, W.; Szczerba, P.; Kruszyński, D. Issues related to the development of electromobility from the point of view of Polish utilities [Problemy rozwoju elektromobilności z perspektywy polskich grup energetycznych]. Polityka Energ. 2020, 23, 49–64. [Google Scholar] [CrossRef]
- Panagiotou, D.; Stavrakoudis, A. A Stochastic Frontier Analysis Approach for Estimating Market Power in the Major US Meat Export Markets. J. Ind. Compet. Trade 2020, 20, 569–586. [Google Scholar] [CrossRef] [Green Version]
- Hernes, M.; Bytniewski, A. Knowledge Representation of Cognitive Agents Processing the Economy Events. In Proceedings of the Intelligent Information and Database Systems. 10th Asian Conference, ACIIDS 2018, Dong Hoi City, Vietnam, 19–21 March 2018; Proceedings, Part I. Nguyen, N.T., Hoang, D.H., Hong, T.-P., Pham, H., Trawiński, B., Eds.; Volume 10751, pp. 392–401. [Google Scholar]
- Bag, S.; Sahu, A.K.; Kilbourn, P.; Pisa, N.; Dhamija, P.; Sahu, A.K. Modeling barriers of digital manufacturing in a circular economy for enhancing sustainability. Int. J. Product. Perform. Manag. 2022, 71, 833–869. [Google Scholar] [CrossRef]
- Zaychikova, N.A. Industry 4.0 Technology in the Digital Economy. Lect. Notes Civ. Eng. 2022, 210, 197–205. [Google Scholar] [CrossRef]
- Niemczyk, J.; Sus, A.; Bielińska-Dusza, E.; Trzaska, R.; Organa, M. Strategies of European Energy Producers. Directions of Evolution. Energies 2022, 15, 609. [Google Scholar] [CrossRef]
- Kemmerer, J.; Labelle, E.R. Business Process Reengineering of a Large-Scale Public Forest Enterprise Through Harvester Data Integration. Croat. J. For. Eng. 2022, 43, 13–27. [Google Scholar] [CrossRef]
- Park, Y.-K.; Kim, M.-K.; Um, J. A One-Stage Ensemble Framework Based on Convolutional Autoencoder for Remaining Useful Life Estimation. Sensors 2022, 22, 2817. [Google Scholar] [CrossRef]
- Vishnu Murthy, K.; Sabareeshwaran, K.; Abirami, S.; Bharani Prakash, T. Overview of Battery Management Systems in Electric Vehicles. In EAI/Springer Innovations in Communication and Computing; Springer: Cham, Switzerland, 2022; pp. 137–147. [Google Scholar]
- Florczak-Strama, M.; Parkitna, A. Project Appraisal in the Transport Sector. In Information Systems Architecture and Technology: Proceedings of 36th International Conference on Information Systems Architecture and Technology—ISAT 2015—Pt. 4; Wilimowska, Z., Borzemski, L., Grzech, A., Świątek, J., Eds.; Springer: Cham, Germany, 2016; pp. 63–73. [Google Scholar]
- Hernes, M.; Rot, A.; Jelonek, D. Towards Industry 4.0—Current Challenges in Information Systems; Hernes, M., Rot, A., Jelonek, D., Eds.; Studies in Computational Intelligence; Springer International Publishing: Cham, Switzerland, 2020; Volume 887, ISBN 978-3-030-40416-1. [Google Scholar]
- Martusewicz, J.; Szewczyk, K.; Wierzbic, A. The Environmental Protection and Effective Energy Consumption in the Light of the EFQM Model 2020—Case Study. Energies 2022, 15, 7260. [Google Scholar] [CrossRef]
- Paudel, A.; Hussain, S.A.; Sadiq, R.; Zareipour, H.; Hewage, K. Decentralized cooperative approach for electric vehicle charging. J. Clean. Prod. 2022, 364, 1–12. [Google Scholar] [CrossRef]
- Sobiech-Grabka, K.; Stankowska, A.; Jerzak, K. Determinants of Electric Cars Purchase Intention in Poland: Personal Attitudes v. Economic Arguments. Energies 2022, 15, 3078. [Google Scholar] [CrossRef]
- Grzesiak, S.; Sulich, A. Car Engines Comparative Analysis: Sustainable Approach. Energies 2022, 15, 5170. [Google Scholar] [CrossRef]
- Siuta-Tokarska, B.; Thier, A. Progress in Implementation of Fourth and Fifth Industrial Revolutions and Artificial Intelligence. In Industry 4.0; Routledge: New York, NY, USA, 2021; pp. 215–228. [Google Scholar]
- Łuszczyk, M.; Sulich, A.; Siuta-Tokarska, B.; Zema, T.; Thier, A. The development of electromobility in the European Union: Evidence from Poland and cross-country comparisons. Energies 2021, 14, 8247. [Google Scholar] [CrossRef]
- Ardebili, A.A.; Padoano, E.; Longo, A.; Ficarella, A. The Risky-Opportunity Analysis Method (ROAM) to Support Risk-Based Decisions in a Case-Study of Critical Infrastructure Digitization. Risks 2022, 10, 48. [Google Scholar] [CrossRef]
- Tucki, K.; Orynycz, O.; Wasiak, A.; Świć, A.; Mieszkalski, L.; Mruk, R.; Gola, A.; Słoma, J.; Botwińska, K.; Gawron, J. A Computer Tool Using Open Modelica for Modelling CO2 Emissions in Driving Tests. Energies 2022, 15, 995. [Google Scholar] [CrossRef]
- Wu, Y.; Wang, Z.; Huangfu, Y.; Ravey, A.; Chrenko, D.; Gao, F. Hierarchical Operation of Electric Vehicle Charging Station in Smart Grid Integration Applications—An Overview. Int. J. Electr. Power Energy Syst. 2022, 139, 108005. [Google Scholar] [CrossRef]
- Javaid, M.; Haleem, A.; Singh, R.P.; Suman, R.; Javaid, M.; Haleem, A.; Singh, R.; Suman, R. Artificial Intelligence Applications for Industry 4.0: A Literature-Based Study. J. Ind. Integr. Manag. 2022, 7, 83–111. [Google Scholar] [CrossRef]
- Wang, J. Analyzing the Application of Blockchain and Artificial Intelligence in New Energy Vehicle Transactions from a Data Security Perspective. In Proceedings of the IEEE 2022 6th International Conference on Trends in Electronics and Informatics (ICOEI), Tirunelveli, India, 28–30 April 2022; pp. 992–995. [Google Scholar]
- Leventsov, V.; Gluhov, V.; Kamyshova, A.; Skripnichenko, D. Specifics of Forming an Innovation Sector When Developing Industry 4.0 Technology. Lect. Notes Comput. Sci. (Incl. Subser. Lect. Notes Artif. Intell. Lect. Notes Bioinf.) 2022, 13158 LNCS, 179–190. [Google Scholar] [CrossRef]
- Aoun, A.; Ilinca, A.; Ghandour, M.; Ibrahim, H. A review of Industry 4.0 characteristics and challenges, with potential improvements using blockchain technology. Comput. Ind. Eng. 2021, 162, 107746. [Google Scholar] [CrossRef]
- Falai, A.; Giuliacci, T.A.; Misul, D.; Paolieri, G.; Anselma, P.G. Modeling and On-Road Testing of an Electric Two-Wheeler towards Range Prediction and BMS Integration. Energies 2022, 15, 2431. [Google Scholar] [CrossRef]
- Bharathidasan, M.; Indragandhi, V.; Suresh, V.; Jasiński, M.; Leonowicz, Z. A review on electric vehicle: Technologies, energy trading, and cyber security. Energy Rep. 2022, 8, 9662–9685. [Google Scholar] [CrossRef]
- Kulik, A.C.; Tonolo, É.A.; Scortegagna, A.K.; da Silva, J.E.; Urbanetz Junior, J. Analysis of Scenarios for the Insertion of Electric Vehicles in Conjunction with a Solar Carport in the City of Curitiba, Paraná—Brazil. Energies 2021, 14, 5027. [Google Scholar] [CrossRef]
- Kupczyk, A.; Maczynśka, J.; Redlarski, G.; Tucki, K.; Baczyk, A.; Rutkowski, D. Selected aspects of biofuels market and the electromobility development in Poland: Current trends and forecasting changes. Appl. Sci. 2019, 9, 254. [Google Scholar] [CrossRef] [Green Version]
- Dzikuć, M.; Miśko, R.; Szufa, S. Modernization of the Public Transport Bus Fleet in the Context of Low-Carbon Development in Poland. Energies 2021, 14, 3295. [Google Scholar] [CrossRef]
- Urraca-Ruiz, A.; Durán-Romero, G. World Competences Capture by Multinationals in Environmental Technologies. Transnatl. Corp. Rev. 2013, 5, 37–53. [Google Scholar] [CrossRef]
- Hałasik, K.; Kulczycka, J. CSR, environment-friendly investments and innovations—The three elements necessary to build a modern and strong coal mining company? E3S Web Conf. 2016, 10, 00051. [Google Scholar] [CrossRef] [Green Version]
- Rimal, B.P.; Kong, C.; Poudel, B.; Wang, Y.; Shahi, P. Smart Electric Vehicle Charging in the Era of Internet of Vehicles, Emerging Trends, and Open Issues. Energies 2022, 15, 1908. [Google Scholar] [CrossRef]
- Borowiecki, R.; Siuta-Tokarska, B.; Maroń, J.; Suder, M.; Thier, A.; Żmija, K. Developing digital economy and society in the light of the issue of digital convergence of the markets in the european union countries. Energies 2021, 14, 2717. [Google Scholar] [CrossRef]
- Wang, Y.; Liu, M.; Wang, S.; Cui, X.; Hao, L.; Gen, H. Assessing the impact of governance and health expenditures on carbon emissions in China: Role of environmental regulation. Front. Public Health 2022, 10, 949729. [Google Scholar] [CrossRef]
- Viet, N.T.; Kravets, A.G. The New Method for Analyzing Technology Trends of Smart Energy Asset Performance Management. Energies 2022, 15, 6613. [Google Scholar] [CrossRef]
- Łatuszyńska, M.; Nermend, K. Energy Decision Making: Problems, Methods, and Tools—An Overview. Energies 2022, 15, 5545. [Google Scholar] [CrossRef]
- Correia, D.; Teixeira, L.; Marques, J.L. Study and analysis of the relationship between smart cities and Industry 4.0: A systematic literature review. Int. J. Technol. Manag. Sustain. Dev. 2022, 21, 37–66. [Google Scholar] [CrossRef]
- Nyangchak, N. Emerging green industry toward net-zero economy: A systematic review. J. Clean. Prod. 2022, 378, 134622. [Google Scholar] [CrossRef]
- Sulich, A.; Sołoducho-Pelc, L. Changes in Energy Sector Strategies: A Literature Review. Energies 2022, 15, 7068. [Google Scholar] [CrossRef]
- Wołek, M.; Jagiełło, A.; Wolański, M. Multi-Criteria Analysis in the Decision-Making Process on the Electrification of Public Transport in Cities in Poland: A Case Study Analysis. Energies 2021, 14, 6391. [Google Scholar] [CrossRef]
- Figura, J.; Gądek-Hawlena, T. The Impact of the COVID-19 Pandemic on the Development of Electromobility in Poland. The Perspective of Companies in the Transport-Shipping-Logistics Sector: A Case Study. Energies 2022, 15, 1461. [Google Scholar] [CrossRef]
- Erdelić, T.; Carić, T. Goods Delivery with Electric Vehicles: Electric Vehicle Routing Optimization with Time Windows and Partial or Full Recharge. Energies 2022, 15, 285. [Google Scholar] [CrossRef]
- Veza, I.; Abas, M.A.; Djamari, D.W.; Tamaldin, N.; Endrasari, F.; Budiman, B.A.; Idris, M.; Opia, A.C.; Juangsa, F.B.; Aziz, M. Electric Vehicles in Malaysia and Indonesia: Opportunities and Challenges. Energies 2022, 15, 2564. [Google Scholar] [CrossRef]
- Wątróbski, J.; Bączkiewicz, A.; Król, R.; Sałabun, W. Green electricity generation assessment using the CODAS-COMET method. Ecol. Indic. 2022, 143, 109391. [Google Scholar] [CrossRef]
- Hu, Y.; Qu, S.; Huang, K.; Xue, B.; Yu, Y. The Chinese plug-in electric vehicles industry in post-COVID-19 era towards 2035: Where is the path to revival? J. Clean. Prod. 2022, 361, 132291. [Google Scholar] [CrossRef]
- Janikowska, O.; Kulczycka, J. Just transition as a tool for preventing energy poverty among women in mining areas—A case study of the Silesia region, Poland. Energies 2021, 14, 3372. [Google Scholar] [CrossRef]
- Sołoducho-Pelc, L.; Sulich, A. Between Sustainable and Temporary Competitive Advantages in the Unstable Business Environment. Sustainability 2020, 12, 8832. [Google Scholar] [CrossRef]
- Sołoducho-Pelc, L. Strategy Implementation Versus the Concept of Strategy. Eurasian Stud. Bus. Econ. 2016, 2, 411–421. [Google Scholar] [CrossRef]
- Fredriksson, H.; Dahl, M.; Holmgren, J. Optimal placement of charging stations for electric vehicles in large-scale transportation networks. Procedia Comput. Sci. 2019, 160, 77–84. [Google Scholar] [CrossRef]
- Blankenship, B.; Kennedy, R.; Mahajan, A.; Wong, J.C.Y.; Urpelainen, J. Increasing rural electrification through connection campaigns. Energy Policy 2020, 139, 111291. [Google Scholar] [CrossRef]
- Sun, X.; Wang, X. Modeling and Analyzing the Impact of the Internet of Things-Based Industry 4.0 on Circular Economy Practices for Sustainable Development: Evidence From the Food Processing Industry of China. Front. Psychol. 2022, 13, 866361. [Google Scholar] [CrossRef]
- Kollmann, J.; Dobrovič, J. Key factors of organizational and management structures in the formation of competitive strategy. J. Int. Stud. 2022, 15, 130–144. [Google Scholar] [CrossRef]
- Sendek-Matysiak, E.; Rzedowski, H.; Skrucany, T. Electromobility in Poland and Slovakia. Benchmarking of Electric Vehicles for 2019. Commun.—Sci. Lett. Univ. Zilina 2020, 22, 35–45. [Google Scholar] [CrossRef]
- Suresh, V.; Bazmohammadi, N.; Janik, P.; Guerrero, J.M.; Kaczorowska, D.; Rezmer, J.; Jasinski, M.; Leonowicz, Z. Optimal location of an electrical vehicle charging station in a local microgrid using an embedded hybrid optimizer. Int. J. Electr. Power Energy Syst. 2021, 131. [Google Scholar] [CrossRef]
- Spöttle, M.; Jörling, K.; Schimmel, M.; Staats, M.; Grizzel, L.; Jerram, L.; Drier, W.; Gartner, J. Charging Infrastructure for Electric Road Vehicles Policy Department for Structural and Cohesion Policies. Available online: https://data.europa.eu/doi/10.2861/62486 (accessed on 8 August 2022).
- European Union Parliament; Jerram, L.; Staats, M.; Jörling, K.; Schimmel, M.; Gartner, J.; Spöttle, M.; Drier, W.; Grizzel, L. Charging Infrastructure for Electric Road Vehicles: Research for TRAN Committee; European Parliament: Strasbourg, France, 2018.
- Tara, A.; Taban, N.; Turesson, H. Performance Analysis of an Ontology Model Enabling Interoperability of Artificial Intelligence Agents. In Lecture Notes in Networks and Systems; Radek, S., Ed.; Springer Science and Business Media Deutschland GmbH: Berlin/Heidelberg, Germany, 2022; Volume 502 LNNS, pp. 395–406. [Google Scholar]
- Bibri, S.E. The IoT for smart sustainable cities of the future: An analytical framework for sensor-based big data applications for environmental sustainability. Sustain. Cities Soc. 2018, 38, 230–253. [Google Scholar] [CrossRef]
- Yasir, M.; Haidar, A.; Chaudhry, M.U.; Habib, M.A.; Hussain, A.; Jasińska, E.; Leonowicz, Z.; Jasiński, M. Performing in-situ analytics: Mining frequent patterns from big IoT data at network edge with D-HARPP. Eng. Appl. Artif. Intell. 2022, 116, 105480. [Google Scholar] [CrossRef]
- Gomółka, K.; Kasprzak, P. Household Ability of Expenditures on Electricity and Energy Resources in the Countries That Joined the EU after 2004. Energies 2022, 15, 3052. [Google Scholar] [CrossRef]
- Trzaska, R.; Sulich, A.; Organa, M.; Niemczyk, J.; Jasiński, B. Digitalization Business Strategies in Energy Sector: Solving Problems with Uncertainty under Industry 4.0 Conditions. Energies 2021, 14, 7997. [Google Scholar] [CrossRef]
- Adenaw, L.; Lienkamp, M. A Model for the Data-based Analysis and Design of Urban Public Charging Infrastructure. In Proceedings of the IEEE 2020 Fifteenth International Conference on Ecological Vehicles and Renewable Energies (EVER), Monte-Carlo, Monaco, 10–12 September 2020; pp. 1–14. [Google Scholar]
- Zema, T.; Sulich, A. Models of Electricity Price Forecasting: Bibliometric Research. Energies 2022, 15, 5642. [Google Scholar] [CrossRef]
- van Eck, N.J.; Waltman, L. Software survey: VOSviewer, a computer program for bibliometric mapping. Scientometrics 2010, 84, 523–538. [Google Scholar] [CrossRef] [Green Version]
- Euromonitor International Passport Business Database. Available online: https://www.portal.euromonitor.com/portal/magazine/homemain/ (accessed on 14 November 2022).
- van Eck, N.J.; Waltman, L.; Dekker, R.; van den Berg, J. A comparison of two techniques for bibliometric mapping: Multidimensional scaling and VOS. J. Am. Soc. Inf. Sci. Technol. 2010, 61, 2405–2416. [Google Scholar] [CrossRef] [Green Version]
- Waltman, L.; van Eck, N.J.; Wouters, P. Counting publications and citations: Is more always better? In Proceedings of the SSI 2013—14th International Society of Scientometrics and Informetrics Conference, Vienna, Austria, 15–19 July 2013; Volume 1, pp. 455–467. [Google Scholar]
- Krzywonos, M.; Piwowar-Sulej, K. Plant-Based Innovations for the Transition to Sustainability: A Bibliometric and in-Depth Content Analysis. Foods 2022, 11, 3137. [Google Scholar] [CrossRef]
- Nowaczek, A.; Kulczycka, J. Overview of funding sources and technologies for the recovery of raw materials from spent batteries and rechargeable batteries in Poland [Przegląd źródeł finansowania i technologii odzyskiwania surowców z zużytych baterii i akumulatorów w polsce]. Gospod. Surowcami Miner./Miner. Resour. Manag. 2020, 36, 153–172. [Google Scholar] [CrossRef]
- Un-Noor, F.; Padmanaban, S.; Mihet-Popa, L.; Mollah, M.N.; Hossain, E. A Comprehensive Study of Key Electric Vehicle (EV) Components, Technologies, Challenges, Impacts, and Future Direction of Development. Energies 2017, 10, 1217. [Google Scholar] [CrossRef] [Green Version]
- Elgowainy, A.; Rousseau, A.; Wang, M.; Ruth, M.; Andress, D.; Ward, J.; Joseck, F.; Nguyen, T.; Das, S. Cost of ownership and well-to-wheels carbon emissions/oil use of alternative fuels and advanced light-duty vehicle technologies. Energy Sustain. Dev. 2013, 17, 626–641. [Google Scholar] [CrossRef]
- Bernstein, C. What Is Electric Vehicle Charging Station? Available online: https://www.techtarget.com/whatis/definition/electric-vehicle-charging-station (accessed on 30 November 2022).
- Brodacki, D.; Polaszczyk, J. Emissivity of the operation of electric cars in the context of the strategic goals of the development of electromobility in Poland and the Netherlands [Emisyjność dwutlenku wȩgla przez samochody elektryczne w kontekście strategicznych celów rozwoju elektr. Polityka Energ. 2018, 21, 99–115. [Google Scholar]
- Błaśkiewicz, P.; Kutyłowski, M.; Wodo, W.; Wolny, K. Extreme propagation in an ad-hoc radio network—Revisited. Lect. Notes Comput. Sci. (Incl. Subser. Lect. Notes Artif. Intell. Lect. Notes Bioinf.) 2012, 7654 LNAI, 142–151. [Google Scholar] [CrossRef]
- Liu, S.; Zhang, X.; Ma, L.; He, L.; Zhang, S.; Cheng, M. Data quality evaluation and calibration of on-road remote sensing systems based on exhaust plumes. J. Environ. Sci. 2022, 123, 317–326. [Google Scholar] [CrossRef]
- Xiaoyan, D.; Ali, M.; Le, X.; Qian, W.; Xuelian, G. Impact of digitalization on clean governance: An analysis of China’s experience of 31 provinces from 2019 to 2021. Front. Psychol. 2022, 13, 947388. [Google Scholar] [CrossRef] [PubMed]
- Sus, A.; Organa, M. Triangle of dynamics factors in inter-organizational networks. In Proceedings of the 6th International Scientific Conference Contemporary Issues in Business, Management and Economics Engineering ‘2019, Vilnius, Lithuania, 9–10 May 2019; Skvarciany, V., Ed.; Vilnius Gediminas Technical University: Vilnius, Lithuania, 2019; pp. 590–599. [Google Scholar]
- Gungor, O.; Rosing, T.S.; Aksanli, B. DOWELL: Diversity-Induced Optimally Weighted Ensemble Learner for Predictive Maintenance of Industrial Internet of Things Devices. IEEE Internet Things J. 2022, 9, 3125–3134. [Google Scholar] [CrossRef]
- Niemczyk, J.; Trzaska, R.; Trzaska, M. Scalability 4.0 as the main rent in Industry 4.0: The case study of Amazon. Inform. Ekon. 2020, 2019, 69–84. [Google Scholar] [CrossRef]
- Stanczyk, S. Organizational Routines, Practices and Artefacts. At the Intersection between the Evolutionary and the Cultural Approach. Probl. Zarządzania 2019, 17, 127–141. [Google Scholar] [CrossRef]
- Ribeiro, V.H.; Barata, J.; Cunha, P.R. Business Process Improvement in Industry 4.0: An Interorganizational Perspective. Lect. Notes Bus. Inf. Process. 2022, 436 LNBIP, 286–298. [Google Scholar] [CrossRef]
- Enelion Charging Stations and Energy Management Systems. Available online: https://enelion.com/dedicated-for-business/ (accessed on 11 November 2022).
- Greenway Poland Greenway Poland Is Going to Deliver Electric Chargers for Mazda [GreenWay Polska dostarczy ładowarki dla Mazdy]. Available online: https://greenwaypolska.pl/blog/media/green-way-polska-dostarczy-ladowarki-dla-mazdy (accessed on 11 November 2022).
- Adamtsevich, L. Industry 4.0 Technologies for Ensuring the Functionality of Urban Infrastructure Socially Significant Elements: A Review. In Lecture Notes in Civil Engineering; Springer: Cham, Switzerland, 2022; Volume 231, pp. 3–22. [Google Scholar]
- Greaker, M. Optimal regulatory policies for charging of electric vehicles. Transp. Res. Part D Transp. Environ. 2021, 97, 102922. [Google Scholar] [CrossRef]
- Kashi, K.; Franek, J. Applying group decision making and multiple attribute decision making methods in business processes. Appl. Mech. Mater. 2014, 693, 237–242. [Google Scholar] [CrossRef]
- Przysucha, Ł. Crowdsourcing as a Tool Supporting Intra-city Communication. In Artificial Intelligence for Knowledge Management, Proceedings of the 8th IFIP WG 12.6 International Workshop, AI4KM 2021, Held at IJCAI 2020, Yokohama, Japan, 7–8 January 2021, Revised Selected Papers; Mercier-Laurent, E., Kayalica, M.O., Owoc, M.L., Eds.; IFIP Advances in Information and Communication Technology; Springer: Cham, Switzerland, 2021; Volume 614, pp. 104–116. [Google Scholar]
- Kotak, Y.; Marchante Fernández, C.; Canals Casals, L.; Kotak, B.S.; Koch, D.; Geisbauer, C.; Trilla, L.; Gómez-Núñez, A.; Schweiger, H.-G. End of Electric Vehicle Batteries: Reuse vs. Recycle. Energies 2021, 14, 2217. [Google Scholar] [CrossRef]
- Hernes, M.; Bytniewski, A.; Mateńczuk, K.; Rot, A.; Dziuba, S.; Fojcik, M.; Nguyet, T.L.; Golec, P.; Kozina, A. Data Quality Management in ERP Systems—Accounting Case. In Advances in Computational Collective Intelligence, Proceedings of the 12th International Conference, ICCCI 2020, Da Nang, Vietnam, 30 November–3 December 2020; Hernes, M., Wojtkiewicz, K., Szczerbicki, E., Eds.; Communications in Computer and Information Science; Springer: Cham, Switzerland, 2020; Volume 1287, pp. 353–362. [Google Scholar]
- Elocity Roaming at Elocity. Go Even More Comfortably and Even Further [Roaming w Elocity. Jedź Jeszcze Wygodniej i Jeszcze Dalej]. Available online: https://elo.city/news/roaming-w-elocity (accessed on 11 November 2022).
- Minos, S. New Plug-In Electric Vehicle Sales in the United States Nearly Doubled from 2020 to 2021. Available online: https://www.energy.gov/energysaver/articles/new-plug-electric-vehicle-sales-united-states-nearly-doubled-2020-2021 (accessed on 11 October 2022).
- Euromonitor International Definitions Passport Business Database. Available online: https://www.portal.euromonitor.com/portal/help/definitionstab (accessed on 19 November 2022).
- Piłatowska, M.; Włodarczyk, A. The environmental Kuznets curve in the CEE countries–the threshold cointegration approach. Argum. Oeconomica 2017, 39, 307–340. [Google Scholar] [CrossRef]
- Gregersen, B.; Johnson, B. A policy learning perspective on developing sustainable energy technologies. Argum. Oeconomica 2009, 23, 9–33. [Google Scholar]
- Bnamericas Chile Looks to Speed Up Electric Vehicle Adoption through New Strategy. Available online: https://www.bnamericas.com/en/news/chile-looks-to-speed-up-electric-vehicle-adoption-through-new-strategy (accessed on 11 October 2022).
- Samgongustofa Statistics [Tölfræði]. Available online: https://bifreidatolur.samgongustofa.is/#aramotatolfraedi (accessed on 11 October 2022).
- González, J. Brazil Could Reach 100,000 Electric Cars on the Road by 2022. Available online: https://latamobility.com/en/brazil-could-reach-100000-electric-cars-on-the-road-by-2022/ (accessed on 11 October 2022).
- Daily Sabah New Regulation in Turkey Revs Up Support for EV Charging Stations. Available online: https://www.dailysabah.com/business/automotive/new-regulation-in-turkey-revs-up-support-for-ev-charging-stations (accessed on 11 October 2022).
- Electric Vehicles Association of Thailand (EVAT) Current Status. Available online: http://www.evat.or.th/15708256/current-status (accessed on 11 October 2022).
- Schmidt, B. How Many Electric Cars Are There in Australia, and Where Are They? Available online: https://thedriven.io/2020/12/23/how-many-electric-cars-are-there-in-australia-and-where-are-they/ (accessed on 11 October 2022).
- India Brand Equity Foundation (IBEF) EV Sales Up 163% in 2021, UP Registers Highest Sales, Followed by Karnataka and Tamil Nadu|IBEF. Available online: https://www.ibef.org/news/ev-sales-up-163-in-2021-up-registers-highest-sales-followed-by-karnataka-and-tamil-nadu (accessed on 11 October 2022).
- Ralev, R. Slovenia’s New Hybrid Car Registrations Soar 169% in 2021. Available online: https://seenews.com/news/slovenias-new-hybrid-car-registrations-soar-169-in-2021-780105 (accessed on 11 October 2022).
- Portal Movilidad Ranking: Colombia Overtakes Mexico and Brazil in Electric Vehicle Sales—Portal Movilidad: Noticias sobre vehículos eléctricos. Available online: https://portalmovilidad.com/ranking-colombia-overtakes-mexico-and-brazil-in-electric-vehicle-sales/ (accessed on 11 October 2022).
- Federal Statistical Office Road Vehicles—New Registrations. Available online: https://www.bfs.admin.ch/bfs/en/home/statistics/mobility-transport/transport-infrastructure-vehicles/vehicles/road-new-registrations.html (accessed on 11 October 2022).
- BIL Sweden Definitive New Registrations in 2021 BilSweden [Definitiva Nyregistreringar under 2021 BilSweden]. Available online: https://mobilitysweden.se/statistik/Nyregistreringar_per_manad_1/nyregistreringar-2021/definitiva-nyregistreringar-under-2021 (accessed on 11 October 2022).
- Norsk Elbilforening Electric Car Stock—Norwegian Electric Car Association [Elbilbestand—Norsk Elbilforening]. Available online: https://elbil.no/om-elbil/elbilstatistikk/elbilbestand/ (accessed on 11 October 2022).
- International Energy Agency Global EV Data Explorer—Data Tools—IEA. Available online: https://www.iea.org/data-and-statistics/data-tools/global-ev-data-explorer (accessed on 11 October 2022).
- Avere France [Barometer] 20.4% Market Share in December 2021 for Electric and Plug-In Hybrid Vehicles… and 15% for the Whole of 2021! Available online: https://www.avere-france.org/publication/barometre-204-de-parts-de-marche-en-decembre-2021-pour-les-vehicules-electriques-et-hybrides-rechargeables-et-15-sur-lensemble-de-2021/ (accessed on 11 October 2022).
- Netherlands Enterprise Agency Electric Vehicles Statistics in the Netherlands. Available online: https://www.rvo.nl/sites/default/files/2022/01/Statistics%20Electric%20Vehicles%20and%20Charging%20in%20The%20Netherlands%20up%20to%20and%20including%20December%202021.pdf (accessed on 11 October 2022).
- Aksan, F.; Jasiński, M.; Sikorski, T.; Kaczorowska, D.; Rezmer, J.; Suresh, V.; Leonowicz, Z.; Kostyła, P.; Szymańda, J.; Janik, P. Clustering methods for power quality measurements in virtual power plant. Energies 2021, 14, 5902. [Google Scholar] [CrossRef]
- RDocumentation Scale: Scaling and Centering of Matrix-like Objects (Version 3.6.2). Available online: https://www.rdocumentation.org/packages/base/versions/3.6.2/topics/scale (accessed on 14 November 2022).
- Lê, S.; Josse, J.; Husson, F. FactoMineR: An R Package for Multivariate Analysis. J. Stat. Softw. 2008, 25, 1–18. [Google Scholar] [CrossRef] [Green Version]
- Wróblewski, P.; Drożdż, W.; Lewicki, W.; Miązek, P. Methodology for Assessing the Impact of Aperiodic Phenomena on the Energy Balance of Propulsion Engines in Vehicle Electromobility Systems for Given Areas. Energies 2021, 14, 2314. [Google Scholar] [CrossRef]
- Hernes, M. Performance evaluation of the customer relationship management agent’s in a cognitive integrated management support system. Lect. Notes Comput. Sci. (Incl. Subser. Lect. Notes Artif. Intell. Lect. Notes Bioinf.) 2015, 9240 LNCS, 86–104. [Google Scholar] [CrossRef]
- Gentle, J.E.; Kaufman, L.; Rousseuw, P.J. Finding Groups in Data: An Introduction to Cluster Analysis. Biometrics 1991, 47, 788. [Google Scholar] [CrossRef]
- Arevalo, J.A.; Castelló, I.; de Colle, S.; Lenssen, G.; Neumann, K.; Zollo, M. Introduction to the special issue: Integrating sustainability in business models. J. Manag. Dev. 2011, 30, 941–954. [Google Scholar] [CrossRef]
- Jacob, K.; Quitzow, R.; Bär, H. Green Jobs: Impacts of a Green Economy on Employment; Deutsche Gesellschaft für Internationale Zusammenarbeit (GIZ) GmbH: Eschborn, Germany, 2015. [Google Scholar]
- Nowak, A.; Kasztelan, A. Economic competitiveness vs. green competitiveness of agriculture in the European Union countries. Oeconomia Copernic. 2022, 13, 379–405. [Google Scholar] [CrossRef]
- Ghosh, R.K.; Banerjee, A.; Aich, P.; Basu, D.; Ghosh, U. Intelligent IoT for Automotive Industry 4.0: Challenges, Opportunities, and Future Trends. In Internet of Things; Springer: Cham, Switzerland, 2022; pp. 327–352. [Google Scholar]
- Carayannis, E.G.; Christodoulou, K.; Christodoulou, P.; Chatzichristofis, S.A.; Zinonos, Z. Known Unknowns in an Era of Technological and Viral Disruptions—Implications for Theory, Policy, and Practice. J. Knowl. Econ. 2022, 13, 587–610. [Google Scholar] [CrossRef]
- Hlihel, F.B.; Chater, Y.; Boumane, A. Maintenance 4.0 Employees’ Competencies: Systematic Literature Review. In Proceedings of the IEEE 2022 2nd International Conference on Innovative Research in Applied Science, Engineering and Technology (IRASET), Meknes, Morocco, 3–4 March 2022; pp. 1–14. [Google Scholar]
- Hollowell, J.C.; Kollar, B.; Vrbka, J.; Kovalova, E. Cognitive decision-making algorithms for sustainable manufacturing processes in industry 4.0: Networked, smart, and responsive devices. Econ. Manag. Financ. Mark. 2019, 14, 9–15. [Google Scholar] [CrossRef]
- Mutter, A.; Rohracher, H. Competing Transport Futures: Tensions between Imaginaries of Electrification and Biogas Fuel in Sweden. Technol. Hum. Values 2022, 47, 85–111. [Google Scholar] [CrossRef]
- Energa Operator S.A. Submitting an Application for Connection Conditions [Złożenie Wniosku o Warunki Przyłączenia]. Available online: https://energa-operator.pl/przylaczenie-do-sieci/odbiorcy-1 (accessed on 8 August 2022).
- Ropuszyńska-Surma, E.; Węglarz, M. The Behavioural Profiles of Energy Consumers: Comparison of the Decision Tree Method and the Logit Model. In Contributions to Management Science; Springer: Cham, Switzerland, 2020; pp. 211–239. [Google Scholar] [CrossRef]
- Kim, J.; Song, I.; Choi, W. An Electric Bus with a Battery Exchange System. Energies 2015, 8, 6806–6819. [Google Scholar] [CrossRef] [Green Version]
- Yohanis, Y.G.; Mondol, J.D.; Wright, A.; Norton, B. Real-life energy use in the UK: How occupancy and dwelling characteristics affect domestic electricity use. Energy Build. 2008, 40, 1053–1059. [Google Scholar] [CrossRef]
- Kempton, W.; Letendre, S.E. Electric vehicles as a new power source for electric utilities. Transp. Res. Part D Transp. Environ. 1997, 2, 157–175. [Google Scholar] [CrossRef]
- Wang, F.; Chen, R.; Miao, L.; Yang, P.; Ye, B. Location Optimization of Electric Vehicle Mobile Charging Stations Considering Multi-Period Stochastic User Equilibrium. Sustainability 2019, 11, 5841. [Google Scholar] [CrossRef] [Green Version]
- Ching-Yen, C.; Shepelev, A.; Qiu, C.; Chi-Cheng, C.; Gadh, R. Design of RFID mesh network for Electric Vehicle smart charging infrastructure. In Proceedings of the 2013 IEEE International Conference on RFID-Technologies and Applications (RFID-TA), Johor Bahru, Malaysia, 4–5 September 2013; pp. 1–6. [Google Scholar]
- Leng, S.Y.; Talib, A.; Gunardi, A. Financial Technologies: A Note on Mobile Payment. J. Keuang. Perbank. 2018, 22. [Google Scholar] [CrossRef] [Green Version]
- Ferreira, J.C.; da Silva, C.F.; Martins, J.P. Roaming Service for Electric Vehicle Charging Using Blockchain-Based Digital Identity. Energies 2021, 14, 1686. [Google Scholar] [CrossRef]
- Thananusak, T.; Punnakitikashem, P.; Tanthasith, S.; Kongarchapatara, B. The Development of Electric Vehicle Charging Stations in Thailand: Policies, Players, and Key Issues (2015–2020). World Electr. Veh. J. 2020, 12, 2. [Google Scholar] [CrossRef]
- Ferwerda, R.; Bayings, M.; van der Kam, M.; Bekkers, R. Advancing E-Roaming in Europe: Towards a Single “Language” for the European Charging Infrastructure. World Electr. Veh. J. 2018, 9, 50. [Google Scholar] [CrossRef]
- Share.P How It Works—Share.P. Available online: https://sharep.io/how-it-works/ (accessed on 8 August 2022).
- Nextcharge Nextcharge Network. Available online: https://nextcharge.app/?lang=en (accessed on 8 August 2022).
- Zhao, C.; You, X. Research and Implementation of OCPP 1.6 Protocol. In Proceedings of the 2017 2nd International Conference on Machinery, Electronics and Control Simulation (MECS 2017), Taiyuan, China, 24–25 June 2017; Atlantis Press: Paris, France, 2017; pp. 283–291. [Google Scholar]
- Aytaç, D.; Güran, M.C. The relationship between electricity consumption, electricity price and economic growth in Turkey: 1984–2007. Argum. Oeconomica 2011, 27, 101–123. [Google Scholar]
- Korkidis, P.; Dounis, A.; Kofinas, P. Computational Intelligence Technologies for Occupancy Estimation and Comfort Control in Buildings. Energies 2021, 14, 4971. [Google Scholar] [CrossRef]
- Longueira-Romero, Á.; Iglesias, R.; Flores, J.L.; Garitano, I. A Novel Model for Vulnerability Analysis through Enhanced Directed Graphs and Quantitative Metrics. Sensors 2022, 22, 2126. [Google Scholar] [CrossRef] [PubMed]
- Miller, I.; Gençer, E.; O’Sullivan, F. A General Model for Estimating Emissions from Integrated Power Generation and Energy Storage. Case Study: Integration of Solar Photovoltaic Power and Wind Power with Batteries. Processes 2018, 6, 267. [Google Scholar] [CrossRef] [Green Version]
- Mohamed, A.; Hassan, M.; M’Saoubi, R.; Attia, H. Tool Condition Monitoring for High-Performance Machining Systems—A Review. Sensors 2022, 22, 2206. [Google Scholar] [CrossRef] [PubMed]
Figure 1.
Clustering of charging stations data for different countries. Source: Authors’ elaboration based on [66].
Figure 1.
Clustering of charging stations data for different countries. Source: Authors’ elaboration based on [66].

Figure 2.
Determining cluster k numbers. Source: Authors’ elaboration.

Table 1.
Quantitative research gap analysis based on keyword search in Scopus (1 August 2022).
| No. | Query Syntax | No. of Results (1 August 2022) |
|---|---|---|
| 1 | (TITLE-ABS-KEY (“industry 4.0”)) AND (“charging stations”) | 28 |
| 2 | (TITLE-ABS-KEY (charging AND stations)) AND (electric AND vehicles) AND (“industry 4.0”) | 34 |
| 3 | (TITLE-ABS-KEY ((charging AND stations) AND (artificial AND intelligence)) | 120 |
Source: author’s elaboration.
Table 2.
Top 10 countries with highest absolute number of charging stations.
| No. | Country | NCS |
|---|---|---|
| 1 | USA | 123,000 |
| 2 | Netherlands | 91,739 |
| 3 | South Korea | 82,606 |
| 4 | Germany | 62,711 |
| 5 | France | 54,653 |
| 6 | United Kingdom | 38,722 |
| 7 | Japan | 32,100 |
| 8 | Italy | 26,860 |
| 9 | Norway | 24,686 |
| 10 | Sweden | 20,201 |
Source: Authors’ elaboration based on data collected in Supplementary File S1 based on [66].
Table 6.
Countries of the first cluster—electric vehicles producers.
| No. | Country | Country Code |
|---|---|---|
| 1. | United States of America | USA |
| 2. | France | FR |
| 3. | Germany | DE |
| 4. | Norway | NO |
| 5. | South Korea | KR |
| 6. | Great Britain | GB |
Source: Authors’ elaboration based on data in Supplementary File S1.
Table 7.
Countries of coastal-island cluster.
| No. | Country | Country Code |
|---|---|---|
| 1. | Japan | JP |
| 2. | Sweden | SE |
| 3. | Belgium | BE |
| 4. | Slovenia | SI |
| 5. | Malta | MT |
| 6. | Austria | AT |
| 7. | Luxembourg | LU |
| 8. | Switzerland | CH |
| 9. | Finland | FI |
| 10. | Denmark | DK |
| 11. | Spain | ES |
| 12. | Italy | IT |
| 13. | Canada | CA |
| 14. | India | IN |
Source: Authors’ elaboration based on data in Supplementary File S1.
Table 8.
Countries distinguished in the third cluster.
| No. | Country | Country Code |
|---|---|---|
| 1. | Poland | PL |
| 2. | Greece | GR |
| 3. | Chile | CL |
| 4. | Brazil | BR |
| 5. | Romania | RO |
| 6. | South Africa | ZA |
| 7. | Australia | AU |
| 8. | Mexico | MX |
| 9. | Turkey | TR |
| 10. | Lithuania | LT |
| 11. | Thailand | TH |
| 12. | New Zealand | NZ |
| 13. | Cyprus | CY |
| 14. | Ireland | IE |
| 15. | Portugal | PT |
| 16. | Czechia | CZ |
| 17. | Estonia | EE |
| 18. | Bulgaria | BG |
| 19. | Hungary | HU |
| 20. | Croatia | HR |
| 21. | Slovakia | SK |
| 22. | Latvia | LV |
Source: Authors’ elaboration based on data in Supplementary File S1.
Disclaimer/Publisher’s Note: The statements, opinions and data contained in all publications are solely those of the individual author(s) and contributor(s) and not of MDPI and/or the editor(s). MDPI and/or the editor(s) disclaim responsibility for any injury to people or property resulting from any ideas, methods, instructions or products referred to in the content. |
© 2022 by the authors. Licensee MDPI, Basel, Switzerland. This article is an open access article distributed under the terms and conditions of the Creative Commons Attribution (CC BY) license (https://creativecommons.org/licenses/by/4.0/).
Share and Cite
MDPI and ACS Style
Zema, T.; Sulich, A.; Grzesiak, S. Charging Stations and Electromobility Development: A Cross-Country Comparative Analysis. Energies 2023, 16, 32. https://0-doi-org.brum.beds.ac.uk/10.3390/en16010032
AMA Style
Zema T, Sulich A, Grzesiak S. Charging Stations and Electromobility Development: A Cross-Country Comparative Analysis. Energies. 2023; 16(1):32. https://0-doi-org.brum.beds.ac.uk/10.3390/en16010032
Chicago/Turabian StyleZema, Tomasz, Adam Sulich, and Sebastian Grzesiak. 2023. "Charging Stations and Electromobility Development: A Cross-Country Comparative Analysis" Energies 16, no. 1: 32. https://0-doi-org.brum.beds.ac.uk/10.3390/en16010032
Note that from the first issue of 2016, this journal uses article numbers instead of page numbers. See further details here.