

Simulation Analysis of Heat Pumps Application for the Purposes of the Silesian Botanical Garden Facilities in Poland


1
Department of Heating, Ventilation and Dust Removal Technology, Faculty of Energy and Environmental Engineering, Silesian University of Technology, ul. S. Konarskiego 20, 44-100 Gliwice, Poland
2
Department of Geotechnics and Roads, Faculty of Civil Engineering, Silesian University of Technology, ul. Akademicka 5, 44-100 Gliwice, Poland
*
Author to whom correspondence should be addressed.
Energies 2023, 16(1), 340; https://0-doi-org.brum.beds.ac.uk/10.3390/en16010340
Submission received: 13 November 2022
/
Revised: 20 December 2022
/
Accepted: 22 December 2022
/
Published: 28 December 2022
(This article belongs to the Special Issue Geotechnologies and Structures in the Energy Sector)
Abstract
:Generating energy from renewable sources is becoming more and more popular and widespread. Air source heat pumps are one of the most popular types of heat pumps due to the general availability of a heat source and relatively low investment costs. The aim of the paper was to investigate the impact of the use of air heat pumps on the improvement of energy efficiency of Silesian Botanical Garden facilities in Poland. Year-round numerical analyses of energy consumption were carried out with the use of IDA ICE software, based on data received from the facility administrator. Different variants of the boiler room configuration including air-to-water heat pumps were analysed. The results showed that implementation of heat pumps led to significant decrease of energy consumption in the building and reduction of values of Primary Energy and CO2 emission.

1. Introduction
The increase in the use of renewable energy sources is now becoming a necessity due to compliance with the regulations on the limitation of pollutant emissions caused by the combustion of fossil fuels, but are also due to the need to ensure one’s own energy needs, including heating for buildings. As 75% of EU greenhouse gas emissions come from energy use and production, decarbonising the energy sector plays a key role in achieving EU climate neutrality [1]. The Polish energy market relies mainly on fossil fuels, primarily on coal. Fossil fuels represented 84% of energy generation sources in 2020, which are one of the highest indicators in Europe. At the same time, the share of renewable energy is one of the lowest in the EU, and the share of renewable energy sources in the energy mix is only 15% [2].
The European Union, wishing to meet the assumptions of the international Paris Agreement [3] and assuming the introduction of measures to reduce greenhouse gas emissions, introduced a package of political initiatives called the European Green Deal [4]. The ultimate goal of this strategy is to achieve climate neutrality by 2050. Achieving this goal requires the Member States of the European Union to undergo a socio-economic transformation. EU Member States are required to submit national plans outlining and reporting on their activities to achieve energy and climate goals, such as the reduction of greenhouse gas emissions, use of renewable energy, improvement of energy efficiency and electricity interconnections. The first reporting period covers the period of 2021–2030. Buildings are the largest consumers of energy in Europe. It was estimated that in Poland, buildings account for 38% of the total energy consumption and 33% of energy-related emissions [5]. Therefore, the efforts to reduce emissions and increase energy efficiency should be intensified, with a special emphasis on the building sector.
Poland can achieve the above-mentioned goals, provided that, i.a., such actions are implemented, including a reduction of 80% of consumption of non-renewable Primary Energy in buildings by 2050. This action should be the result of improving the energy efficiency of buildings and increasing the share of energy from renewable sources. In addition, the share of heat from renewable sources should reach 23% (in the power generation sector 32%) in 2030. Continued decarbonisation of heating and cooling in the coming years should result in at least 80% reduction in CO2 emission in 2050 compared to the 2016 level. In addition, by 2030, buildings located in individually heated cities should have their coal systems replaced by system heat, gas and biomass (e.g., pellets). This should occur by 2040 for buildings in rural areas. In the longer term, other renewable energy sources will be used and the electrification of heating will continue. These activities are also included in the Energy Policy of Poland until 2040 [6].
As of 1 January 2020, there are approximately 14.2 million buildings in Poland, of which almost 40% are single-family residential buildings, and less than 30% are public buildings, according to the long-term building renovation strategy [7]. A significant part of these buildings is characterized by low energy efficiency and will require thermal modernisation in the coming years. The strategy assumes an average annual rate of thermal modernisation at the level of approximately 3.8%, assuming that by 2050, 65% of buildings will achieve a Primary Energy of no more than 50 kWh/m2/year. According to the data of the Central Emission Register of Buildings in Poland, among the declarations submitted by October 2022 regarding the type of heat source in buildings, solid fuel boilers and gas boilers had the largest share, accounting for 33% and 24%, respectively, while heat pumps accounted for just over 2% [8]. However, the share of heat pumps used to heat newly constructed buildings is significantly higher.
Wider implementation of renewable energy sources such as heat pumps, also in older buildings, is an important element on the path to decarbonisation [9]. In Poland, an intensive increase in the number of heat pumps has been observed for several years. In particular, compressor heat pumps to heat buildings and to prepare domestic hot water, has become more popular. The increase in interest in heat pumps was significant, and has more than doubled, and is due to increases in the prices of energy carriers and fuels calculated year on year. It was also encouraged by financial support in the form of subsidies for efficient heat pumps under the “Clean Air” [10] and “My heat” [11] programs, or due to thermo-modernisation relief support which consists of deducting the expenses incurred for the implementation of the thermo-modernisation project from income (revenue). The popularity of renewable heat sources is also growing due to the increase in environmental awareness and the high comfort of operating these systems. When heat pumps are installed as the only heat source in the building, they do not emit any air pollutants, and hybrid heat pumps, for example, cooperate with a gas boiler, which allows for a significant reduction of emissions [12]. The energy and economic performance of the combined system are highly influenced by the control strategies implemented and by the objective functions adopted [13]. Hybrid heat pumps, i.e., heat pumps combined with complementary technologies, are transitional solutions towards full decarbonisation.
Heat pumps with a ground heat exchanger as a heat source are characterized by higher efficiency coefficients than air-to-water heat pumps [14,15,16]. Ground-source heat pumps also demand slightly less power than air-to-water heat pumps [14,17]. Air-to-water heat pumps may, in some cases, underperform the manufacturer’s laboratory test results [18]. Nevertheless, air-to-water heat pumps are very popular. In Poland, in the first quarter of 2022, there was an increase of over 130% in air-to-water heat pump sales, while the increase in ground source heat pumps was 45% [19]. Significant advantages are the ease of installation and the lack of investment costs related to the construction of the heat source installation. In the case of a ground heat exchanger, the installation costs constitute a significant part of the investment costs of the entire heating installation.
The benefits of using heat pumps are particularly evident when the replacement of the heat source is a part of the deep renovation process, which also includes improved thermal insulation and heat recovery, allowing for the reduction of peak power required by heat pumps [20]. Further enhancement of energy efficiency and reducing the payback period when using heat pumps also depends on appropriate design and control optimization [21,22].
The cooperation of heat pumps with photovoltaic installations [23], which supply electricity to the compressor drive, is justifiable. Installations that enable the storage of generated electricity [24,25] and heat [26,27] have an additional advantage. Analyses conducted for Polish conditions [28] showed significant economic and ecological benefits of heating with heat pumps. Plenty of research presenting the results of case studies with heat pumps was carried out for single-family houses [14,23,24,26,29]; fewer results apply to larger buildings as well as public buildings [30,31,32].
The paper analyses a building belonging to the Silesian Botanical Garden (SBG), which is a public utility building that fulfils many functions. SBG is located in the south of Poland, in the area of Silesia, in the commune of Mikołów. The building houses offices, educational rooms, as well as a restaurant with kitchen facilities. Currently, the use of renewable heat sources is limited to four solar collectors preparing domestic hot water. Previously conducted analyses [33] indicate the possibility of a photovoltaic (PV) installation or a local wind turbine.
This research extends the use of renewable energy sources in the existing SBG building with the modernisation of the heat source through the application of a heat pump. Due to the poor thermal properties of the ground, semi-solid silt and sandy loams without groundwater [34], as well as a limited area free from shading plants that limit the possibility of regeneration of the ground in the summer, the ground heat pump was abandoned in favour of an air-to-water heat pump.
To determine the legitimacy of using air heat pumps, simulation analyses were carried out for the local outdoor climate. IDA ICE simulation tool was used to analyse the operation of heat pumps under dynamic climatic conditions, which had previously been successfully used in many analyses of heat pump operation [35,36,37,38]. In order to reduce the investment costs, no changes were made to the existing heat distribution system in the building.
2. Analysed Building
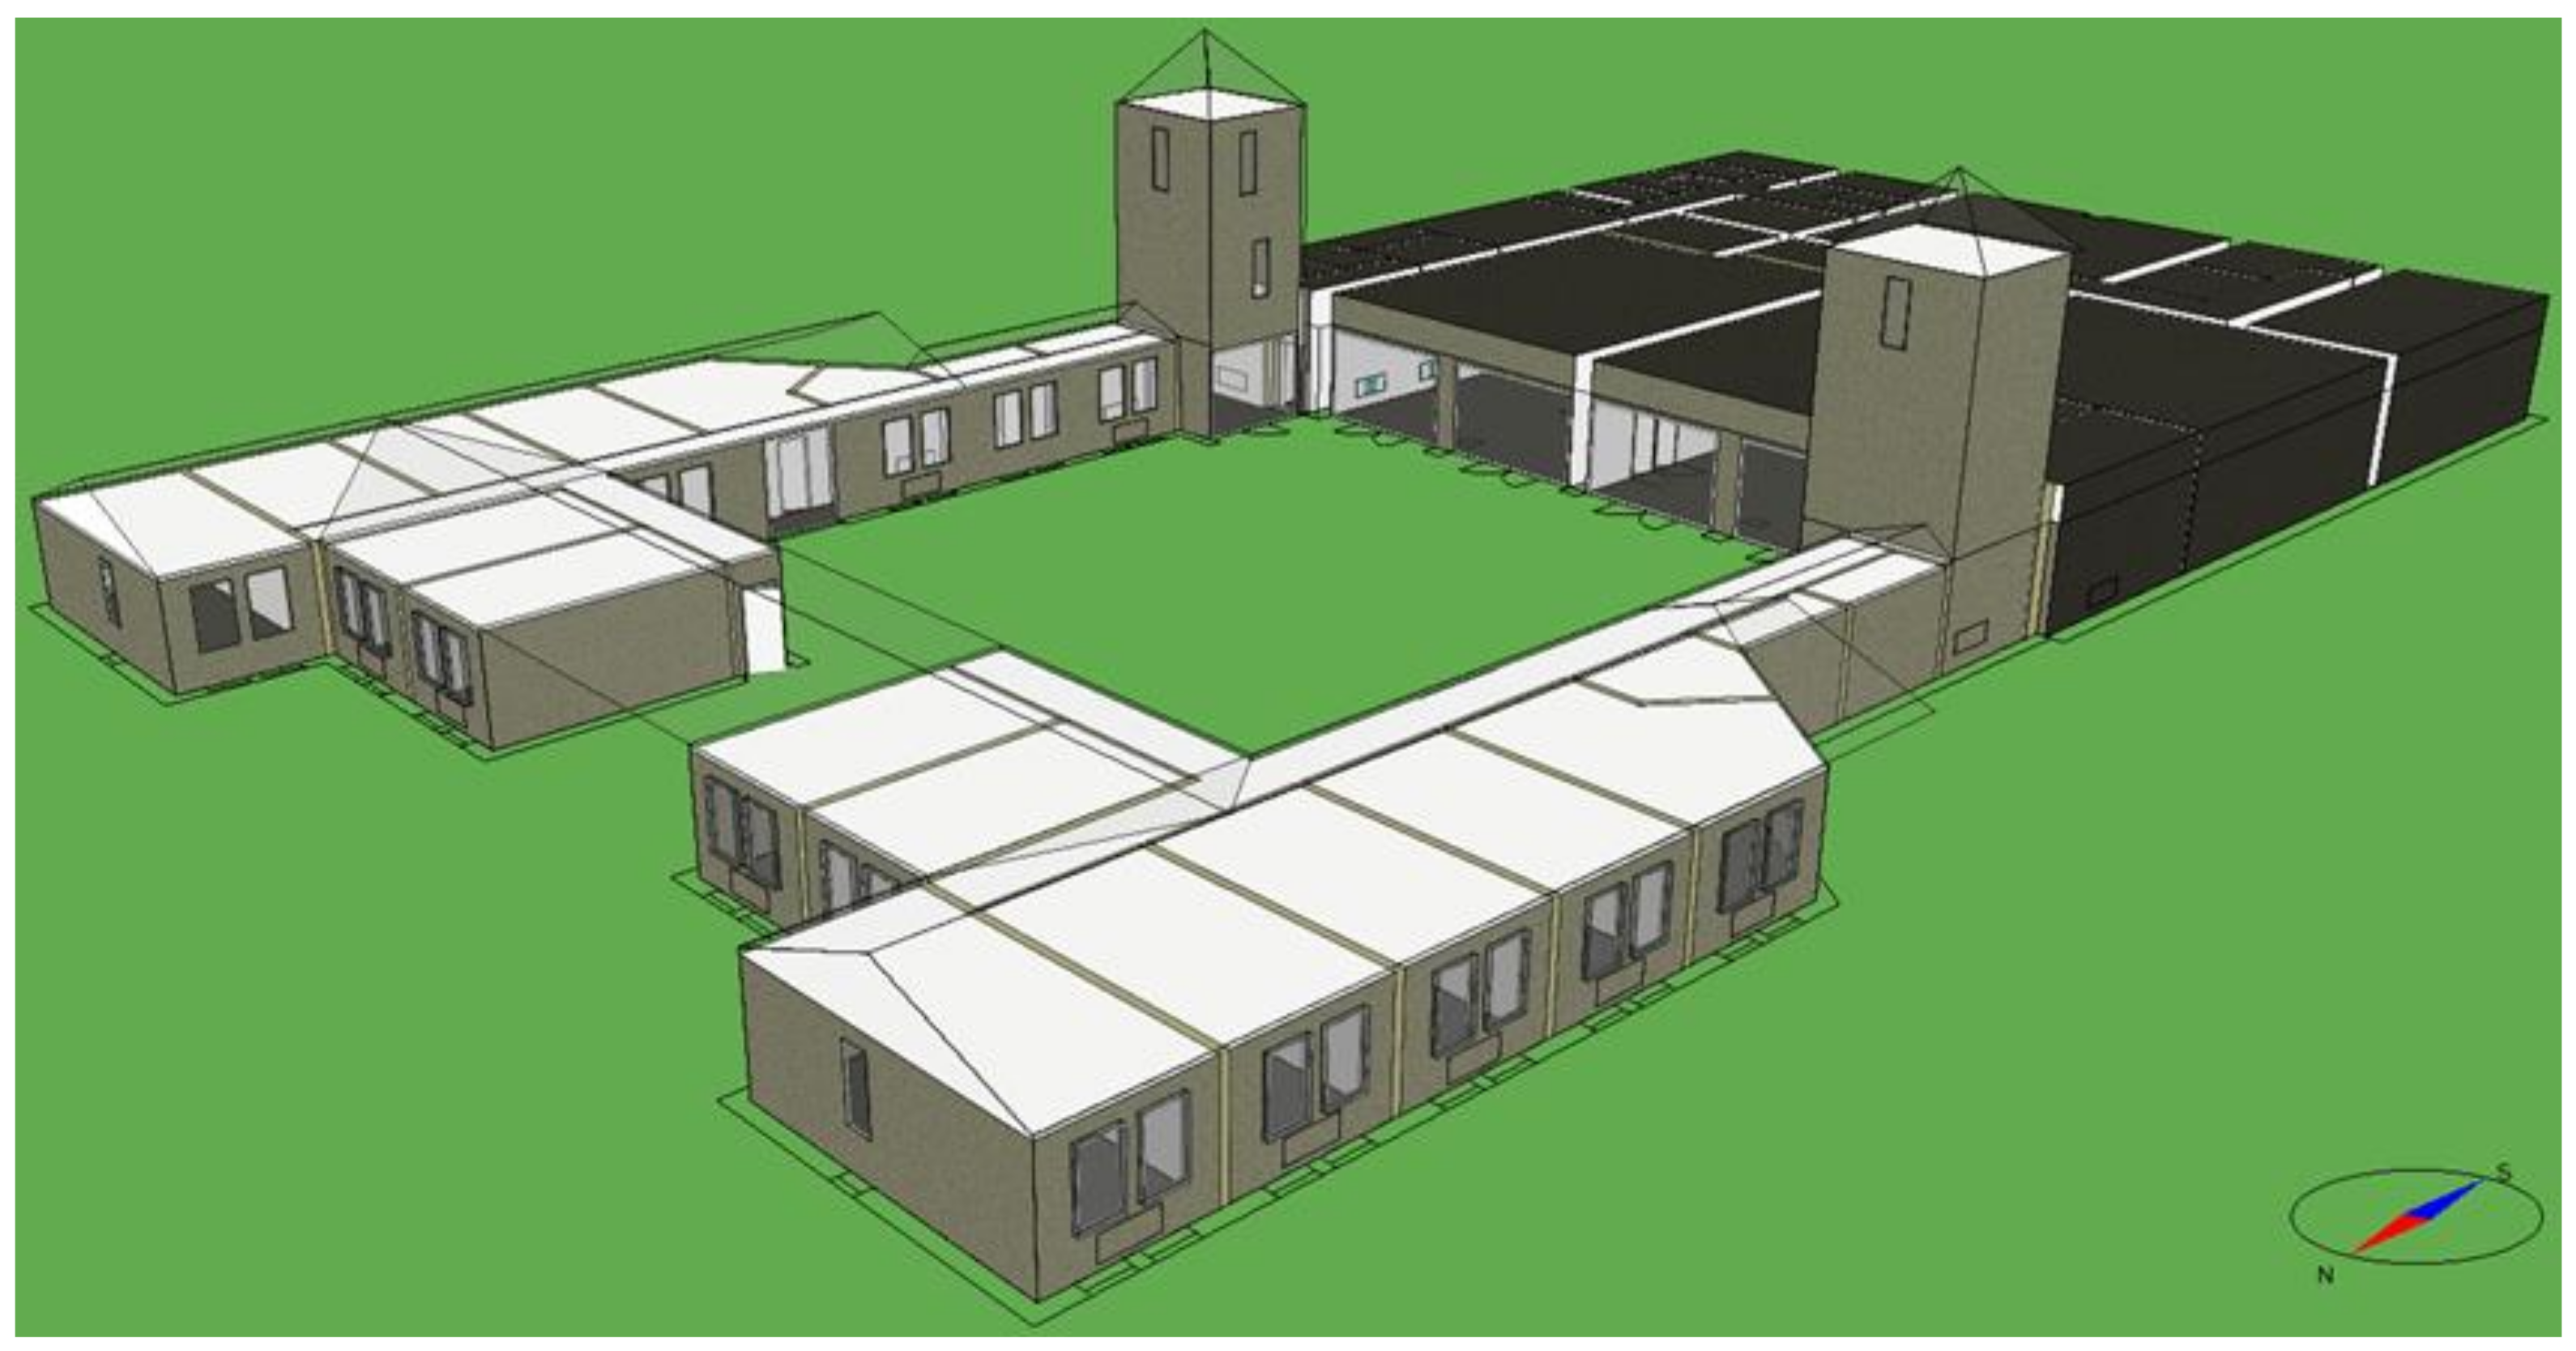
The energy analyses were carried for the building of the Centre for Ecological and Environmental Education (CEEE), on the area called Sośnia Góra (former military areas). It belongs to the Silesian Botanical Garden complex in Mikołów, Poland. The building was constructed in 2010. It is oriented towards the north-east. The building area is 1058 m2 and its cubature is 3540 m3. Figure 1 shows the view of the building.
The building consists of 52 rooms for various purposes. The part of the building with 22 rooms, i.e., offices, storage rooms, server room and boiler room, is a one-story building with a room height of 2.6 m. The second part of the building has 28 rooms, i.e., an audio-visual room, conference room, library, social rooms, kitchen, canteen, cold storage room, food processing rooms, cloakrooms and toilets (with a room height of 3.6 m), is located underground in the converted former bunker building. Both parts of the building are connected by two staircases of 8.86 m height. At the top of the staircases, there are exits to the terrace and the lookout tower. The share of windows in the building envelope is 5%. The heat transfer coefficients of external partitions are the following: external wall: 0.25 W/m2K; roof: 0.19 W/m2K; floor: 0.52 W/m2K; windows: 1.9 W/m2K.
The building is equipped with a conventional gas boiler room. It consists of a gas boiler with a capacity of 32 kW and two hot water tanks, each with a capacity of 750 L. The building is also equipped with four flat solar collectors with dimensions of 2.38 m (height) × 1.06 m (width) and an absorber area of 2.32 m2. The building is equipped with a two-pipe central heating installation with parameters of 70/50 °C, which is supplied from the gas boiler room. Plate water radiators are used as heating elements. The building has a domestic hot water and circulation installation. Domestic hot water preparation takes place in hot water tanks located in the boiler room and then water is supplied to the sanitary facilities. The audio-visual room and canteen are equipped with a mechanical ventilation air supply and an exhaust system. The air is prepared in air handling units with heat recovery and water heaters. Ventilation air is supplied to the library, kitchen and kitchen facilities by two supply air handling units and exhausted by duct fans. The air from the cloakrooms and toilets is removed by duct fans. In offices, air is supplied through window diffusers and removed by duct fans. The values of the ventilation air volume flow rate were adopted based on the number of occupants in the rooms.
3. Energy Analyses Methodology
The energy analyses were carried out in the IDA ICE (Indoor Climate and Energy) 4.8 software [39]. The calculations were carried out for the period of the whole year with the use of climate data for Katowice, located 21 km from the building [40]. The actual geometry of the building and all rooms, as well as the construction of building partitions were implemented in accordance with the construction documentation of the facility. Figure 2 shows the floor plan of the building and Figure 3 presents the 3D model of the building, created with IDA ICE software.
3.1. Adopted Assumptions for Energy Simulations
In the numerical model of the building, typical values of thermal bridge values were taken into account. Wind dependent infiltration of the building was assumed with three air changes per hour at a pressure difference of 50 Pa.
The actual values of internal heat gains from occupants, electronic equipment, radiators and air conditioners were implemented based on the data received from the building administrator. The number of occupants and the type of their work (sitting/moving) were assumed. For the audio-visual room, conference room, library and canteen, half the number of users from the maximum range was assumed, e.g., for the range of 0–60 occupants, 30 occupants were taken into account. In total, there were 128 occupants in the building. For the seated people, the value of the MET coefficient was assumed equal to 1, and for the people physically active (in the kitchen and in the social room), MET was equal to 2. The days and hours of the occupants’ presence in the building were assumed in accordance with the obtained data. On weekends and public holidays, it was assumed that there were no people in the building, except for the following rooms: kitchen, scullery and canteen, as the restaurant is open every day. The total power of electronic equipment was set for all devices in a given room. The total output of electronic equipment in the entire building was 67.74 kW. The schedule of using the equipment was adopted in accordance with the schedule of the occupants present in a given room. In the server room and food processing rooms, the operating times of the devices were assumed as 24 h/day throughout the year. The power of luminaires were assumed as a total value for a given room. The maximum lighting output in the building was 21.72 kW. Most of the luminaires consisted of fluorescent lamps, and only three rooms were equipped with LED lighting. Lighting control was adopted in accordance with the assumed setpoint (minimum 100 Lux, maximum 10,000 Lux daylight in the room). The schedule for the use of lighting was adopted in accordance with the occupants’ schedule. For rooms not intended for permanent residence of people (corridors, toilets and utility rooms), irregular lighting operation times during the day, for a total of 2 h/day, were assumed. In the case of electronic equipment and lighting, it was assumed that they were fully used for 50% of the intended time in a given room, with half of them in use for the remaining 50% of the time. Panel water radiators with a total maximum power of 44.43 kW were implemented in 39 rooms. The heating capacity of individual radiators, their geometry, number and location in the rooms, as well as the supply and return water temperature, were adopted in accordance with the sanitary installation documentation and the data obtained from the building administrator. Cooling units (wall air-conditioners) of a total cooling capacity of 25.7 kW were implemented in eight rooms. The operation of radiators and air conditioners was controlled by proportional controllers.
The indoor air temperature setpoints were adopted according to the purpose of the rooms. For rooms intended for permanent residence of people and toilets, the value of the indoor air temperature was set equal to 20 °C, while for staircases it was equal to 8 °C. The average daily domestic heat water consumption was assumed in the amount of 7 l/per occupant and day in accordance with [41]. Consumption of domestic hot water was assumed to occur between 06:00 and 20:00 (end of restaurant operation). For weekends and holidays, half of the consumption was assumed, as only the restaurant was open. For the heating system, a distribution heat loss of 4% was assumed. For the domestic hot water system, a heat loss of 0.5 W/m2 of the room area was assumed. It was assumed that 25% of the heat loss was released to the rooms. The values of ventilation air volume flow rate were determined in accordance with the sanitary installation documentation. It was assumed that the air supplied to the audio-visual room, library, canteen, kitchen and kitchen facilities was provided by four supply-exhaust air handling units with heat recovery in the form of a cross-flow heat exchanger and a water heater. The total value of supply air volume flow rate was 7189 m3/h and the total value of exhaust air volume flow was 6195 m3/h. In the offices, the air was supplied through the window diffusers. They were simulated in the form of a fixed schedule of windows opening controlled by a PI regulator. In the toilets, the air was supplied through the contact grilles in the doors. In the offices and toilets, a mechanical exhaust system was used in a form of three exhaust air handling units. In the supply-exhaust and supply air handling units, the efficiency of heat recovery in the heat exchanger was set as 60%, the pressure of the supply fan was 600 Pa and the pressure of the exhaust fan was 400 Pa. The energy loss in the ventilation system was assumed as 1 W/m2 with 25% of the heat loss being released to the rooms.
The configuration of boiler room was developed in the ESBO (Early Stage Building Optimalization) module of the IDA ICE software. The total heat output of the gas boiler, the total capacity and shape factor of hot water tanks, as well as the dimensions, absorber area and deviation (25% in the vertical and 15% in the south direction) of the solar collectors were applied. The heating system control was adopted in accordance with the heating curve set in the actual building.
3.2. Calculation Variants
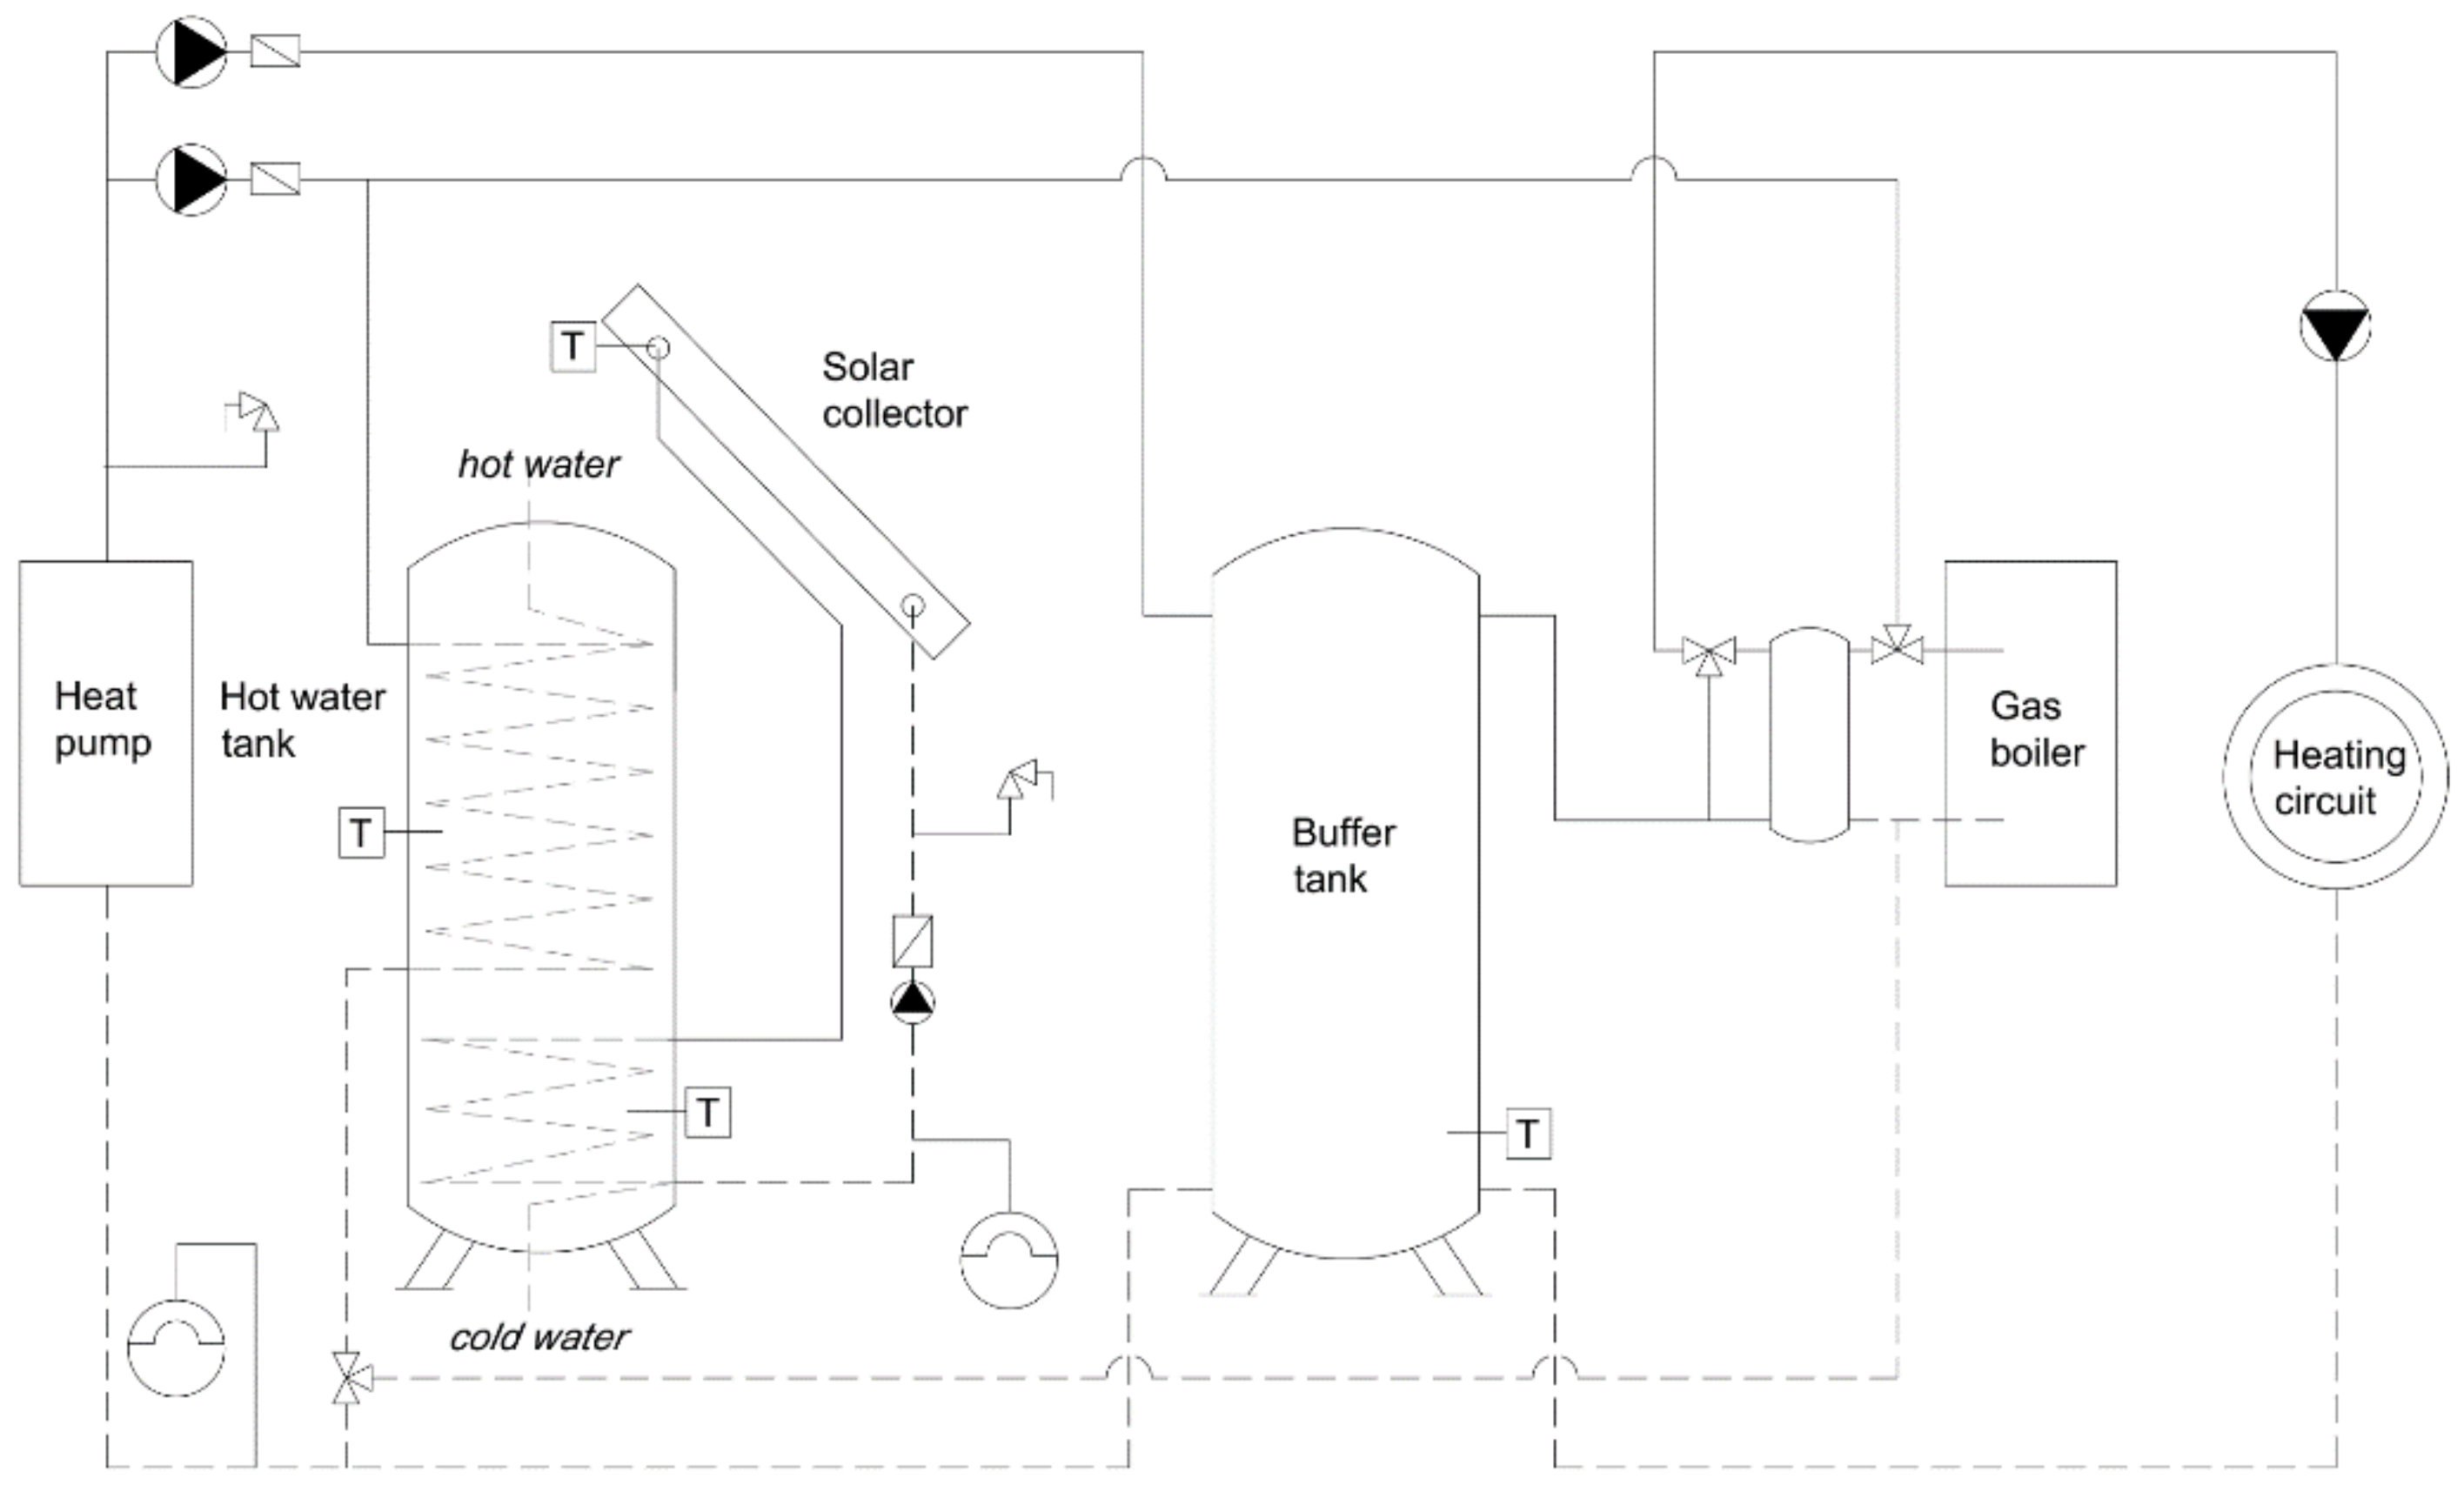
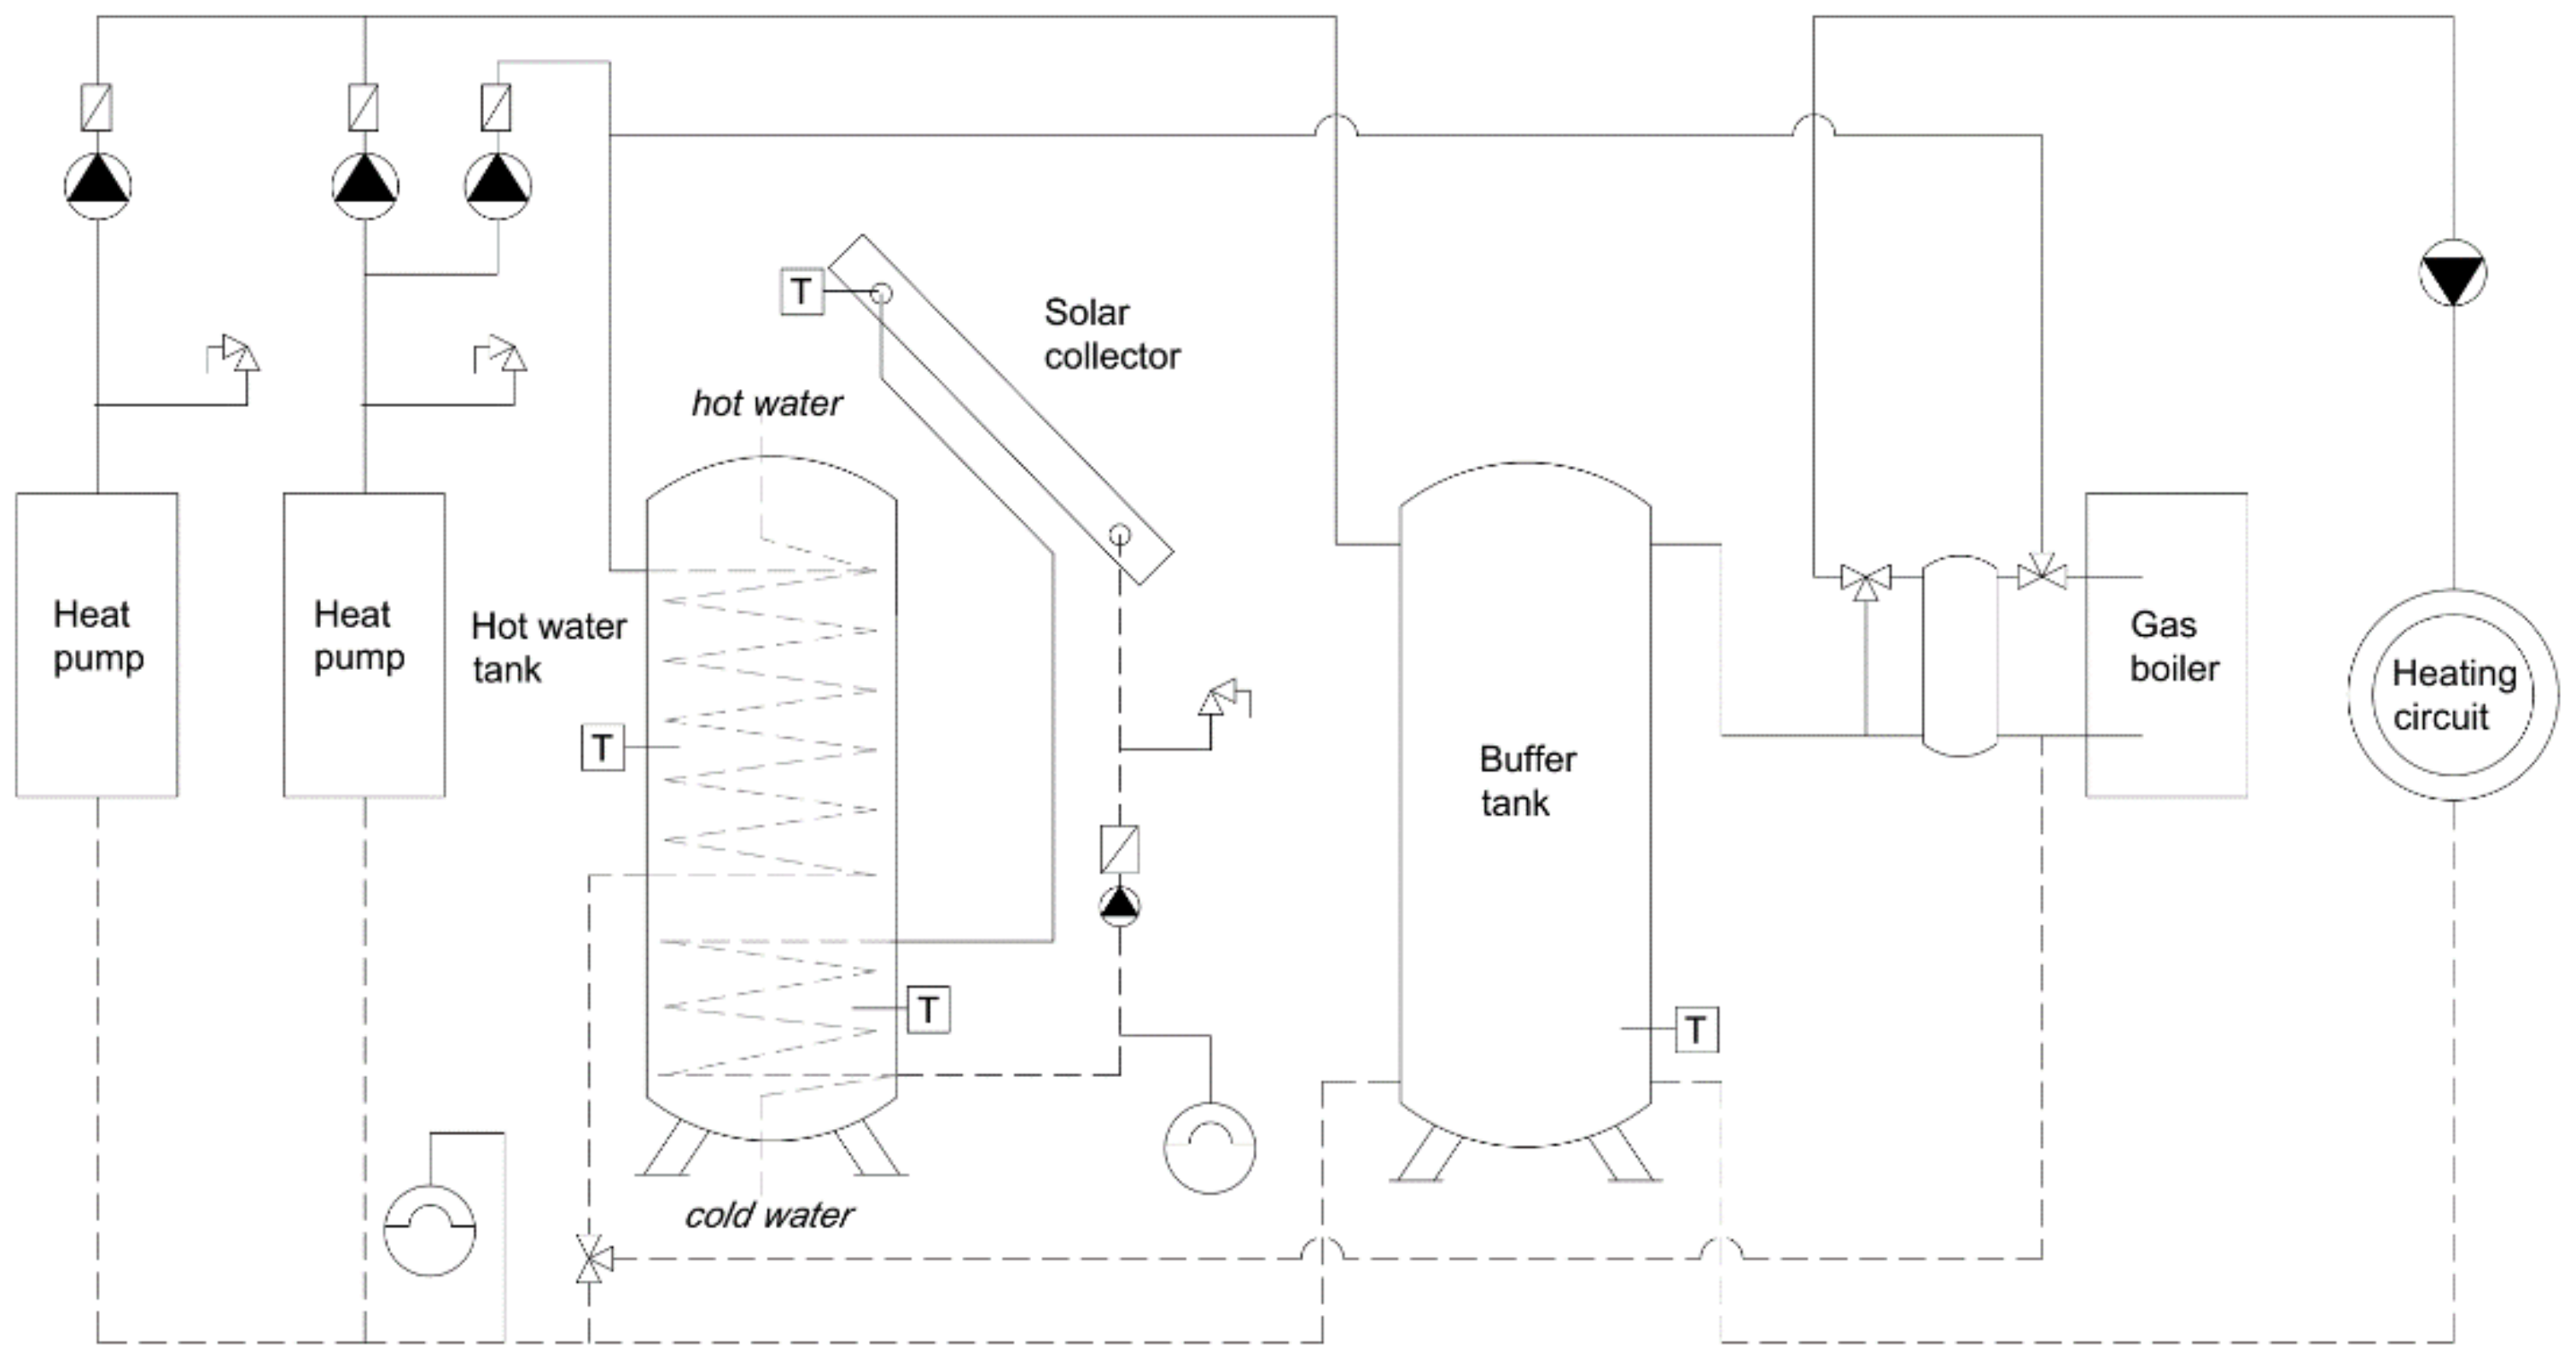
The dynamic energy analyses were carried out for the entire period of the calendar year for four variants: three basic variants, Variant 1, 2 and 3, which differed in the boiler room configuration and the fourth variant, Variant 3*, which was modification of Variant 3 and consisted in additional thermal insulation of external walls. Hydraulic diagrams of all calculation variants are presented in Figure 4, Figure 5 and Figure 6.
Variant 1 represented the existing conventional gas boiler room consisting of a gas boiler with an output of 32 kW and two hot water storage tanks of 750 litres each. The installation was complemented by four flat solar collectors with dimensions of 2.38 m (height) × 1.06 m (width) and an absorber surface of 2.32 m2 each. The heating circuit was operated by a gas boiler and the circulation pump was activated depending on the heating temperature setpoint. Domestic hot water preparation was primarily carried out by a solar installation. If necessary, priority was given to domestic water heating over space heating by a separate circulation pump charging a hot water tank with an internal heat exchanger.
Variant 2 represented existing conventional gas boiler plant complemented by one air-to-water compressor heat pump with an output of 30 kW. The COP value of the heat pump was 3.6 (A7/W40). The heat pump charged the buffer tank operating in accordance with the weather-controlled space heating temperature setpoint. The return of the heating circuit was connected directly to the parallel buffer tank in order to keep the heat pump temperature as low as possible and to avoid the heat pump’s running time being adversely affected by the gas boiler. The buffer tank was used for optimal hydraulic separation of the heat pump from the heating circuit, ensuring the necessary minimum flow rate through the heat pump and storing heat until the defrosting process of the heat pump. In addition, the capacity of the buffer tank functioned as a heat storage during periods when heat pump did not operate and during power failures. At the supply of the heating circuit, the gas boiler was separated by an additional hydraulic clutch. By an additional mixing system, the supply temperature was raised to the level required in the heating circuit. If necessary, priority was given to domestic water heating over space heating by the heat pump or the gas boiler.
Variant 3 represented existing conventional gas boiler room complemented by two air-to-water compressor heat pumps with a total output of 60 kW. The COP value of the heat pump was 3.6 (A7/W40). In comparison to Variant 2, this variant was complemented by an additional parallel-installed heat pump. Each unit was equipped its own circulation pump. Both heat pumps loaded the buffer tank operating in accordance with the weather-controlled space heating temperature setpoint.
Variant 3* took into account the assumptions of Variant 3 and additionally introduced lower values of heat transfer coefficients of building envelope and building elements, according to the current Polish requirements [42]. The aim of this variant was to analyse possible extra energy savings resulting from implementing better thermal insulation of the building.
The variant in which only heat pumps were used instead of a gas boiler was also analysed. However, in order to limit investment costs, the analyses were carried out for the existing heating system in the form of panel radiators without changing them to underfloor heating. Therefore, in the winter period, there were problems with obtaining the indoor air temperature setpoint in some of the rooms as they were excessively cooled. For this reason, this variant was not taken into account.
3.3. Analysed Parameters and Calculations Methodology
In the course of year-round dynamic simulations, the values of following parameters were calculated by the IDA ICE software:
- heat demand for the entire building, including heat losses through the building envelope and thermal bridges, internal partitions, windows (in winter), infiltration air and mechanical air supplied by air handling units and heat losses from sanitary installations, as well as heat gains of occupants, electronic equipment, lighting and windows (in summer);
- monthly heating energy consumption for space heating and preparation of domestic hot water, and cooling energy consumption;
- monthly utilized free energy in a building from heat recovery in air handling units and from solar collectors;
- monthly electric energy consumption for lighting, electronic equipment, air conditioners, auxiliary devices and heat pump compressor;
- monthly fuel gas consumption for each calculation variant.
For all variants the calculations of Primary Energy were carried out in accordance with Equations (1)–(6), presented in [43].
where:
EP = Qp/Af, kWh/m2/year
- Qp—annual demand for non-renewable Primary Energy for technical systems, kWh/year
- Af—area of rooms with regulated air temperature, m2
Qp = Qp,H + Qp,W + Qp,C + Qp,L, kWh/year
- Qp,H—annual demand for non-renewable Primary Energy for the heating system, kWh/year
- Qp,W—annual demand for non-renewable Primary Energy for the preparation of domestic hot water, kWh/year
- Qp,C—annual demand for non-renewable Primary Energy for the cooling system, kWh/year
- Qp,L—annual demand for non-renewable Primary Energy for the lighting installation, kWh/year
Qp,H = Qf,H · wH + Eel,aux,H · wel, kWh/year
Qp,W = Qf,W · wW + Eel,aux,W · wel, kWh/year
Qp,C = Qf,C · wC + Eel,aux,C · wel, kWh/year
Qp,L = Qf,L · wel, kWh/year
- Qf,H—annual demand for final energy supplied to the building for the heating system, kWh/year
- Qf,W—annual demand for final energy supplied to the building for preparation of domestic hot water, kWh/year
- Qf,C—annual demand for final energy supplied to the building for the cooling system, kWh/year
- Qf,L—annual demand for final energy supplied to the building for the lighting installation, kWh/year
- wi—non-renewable Primary Energy input factor for production and delivery of:
- energy for the heating system (wH factor, for gas equal 1.1), -
- energy for preparation of domestic hot water (wW factor, for gas equal 1.1), -
- energy for the cooling system (wC factor), -
- electrical energy (wel factor, for system power grid equal 3), -
- Eel,aux,H—annual demand for auxiliary final energy supplied to the building for the heating system, kWh/year
- Eel,aux,W—annual demand for auxiliary final energy supplied to the building for preparation of domestic hot water, kWh/year
- Eel,aux,C—annual demand for auxiliary final energy supplied to the building for the cooling system, kWh/year
Calculations of CO2 emission were carried out for each variant in accordance with the Equation (7). The value of CO2 emission factor for the gas boiler was assumed to be equal 0.23 kg/kWh [44].
CO2 emission [kg] = fuel gas consumption [kWh] × CO2 emission factor [kg/kWh]
4. Results and Discussion
Dynamic simulations carried out in this research document the energy performance of the SBG building during the whole year of operation. The current state of the building, represented by Variant 1 was compared to the performance of the building equipped with one heat pump (Variant 2) and two heat pumps (Variant 3). Moreover, the impact of additional thermal insulation was analysed in Variant 3*. The analysis presented in this section includes the building’s heat balance to better understand the functioning of the building through the course of the whole year. This section also presents possible CO2 emission reduction as well as analysis of the necessary local electricity production from photovoltaic installation in order to fulfil the actual requirements of Primary Energy limit value.
4.1. Heat Balance of the CEEE’s Building
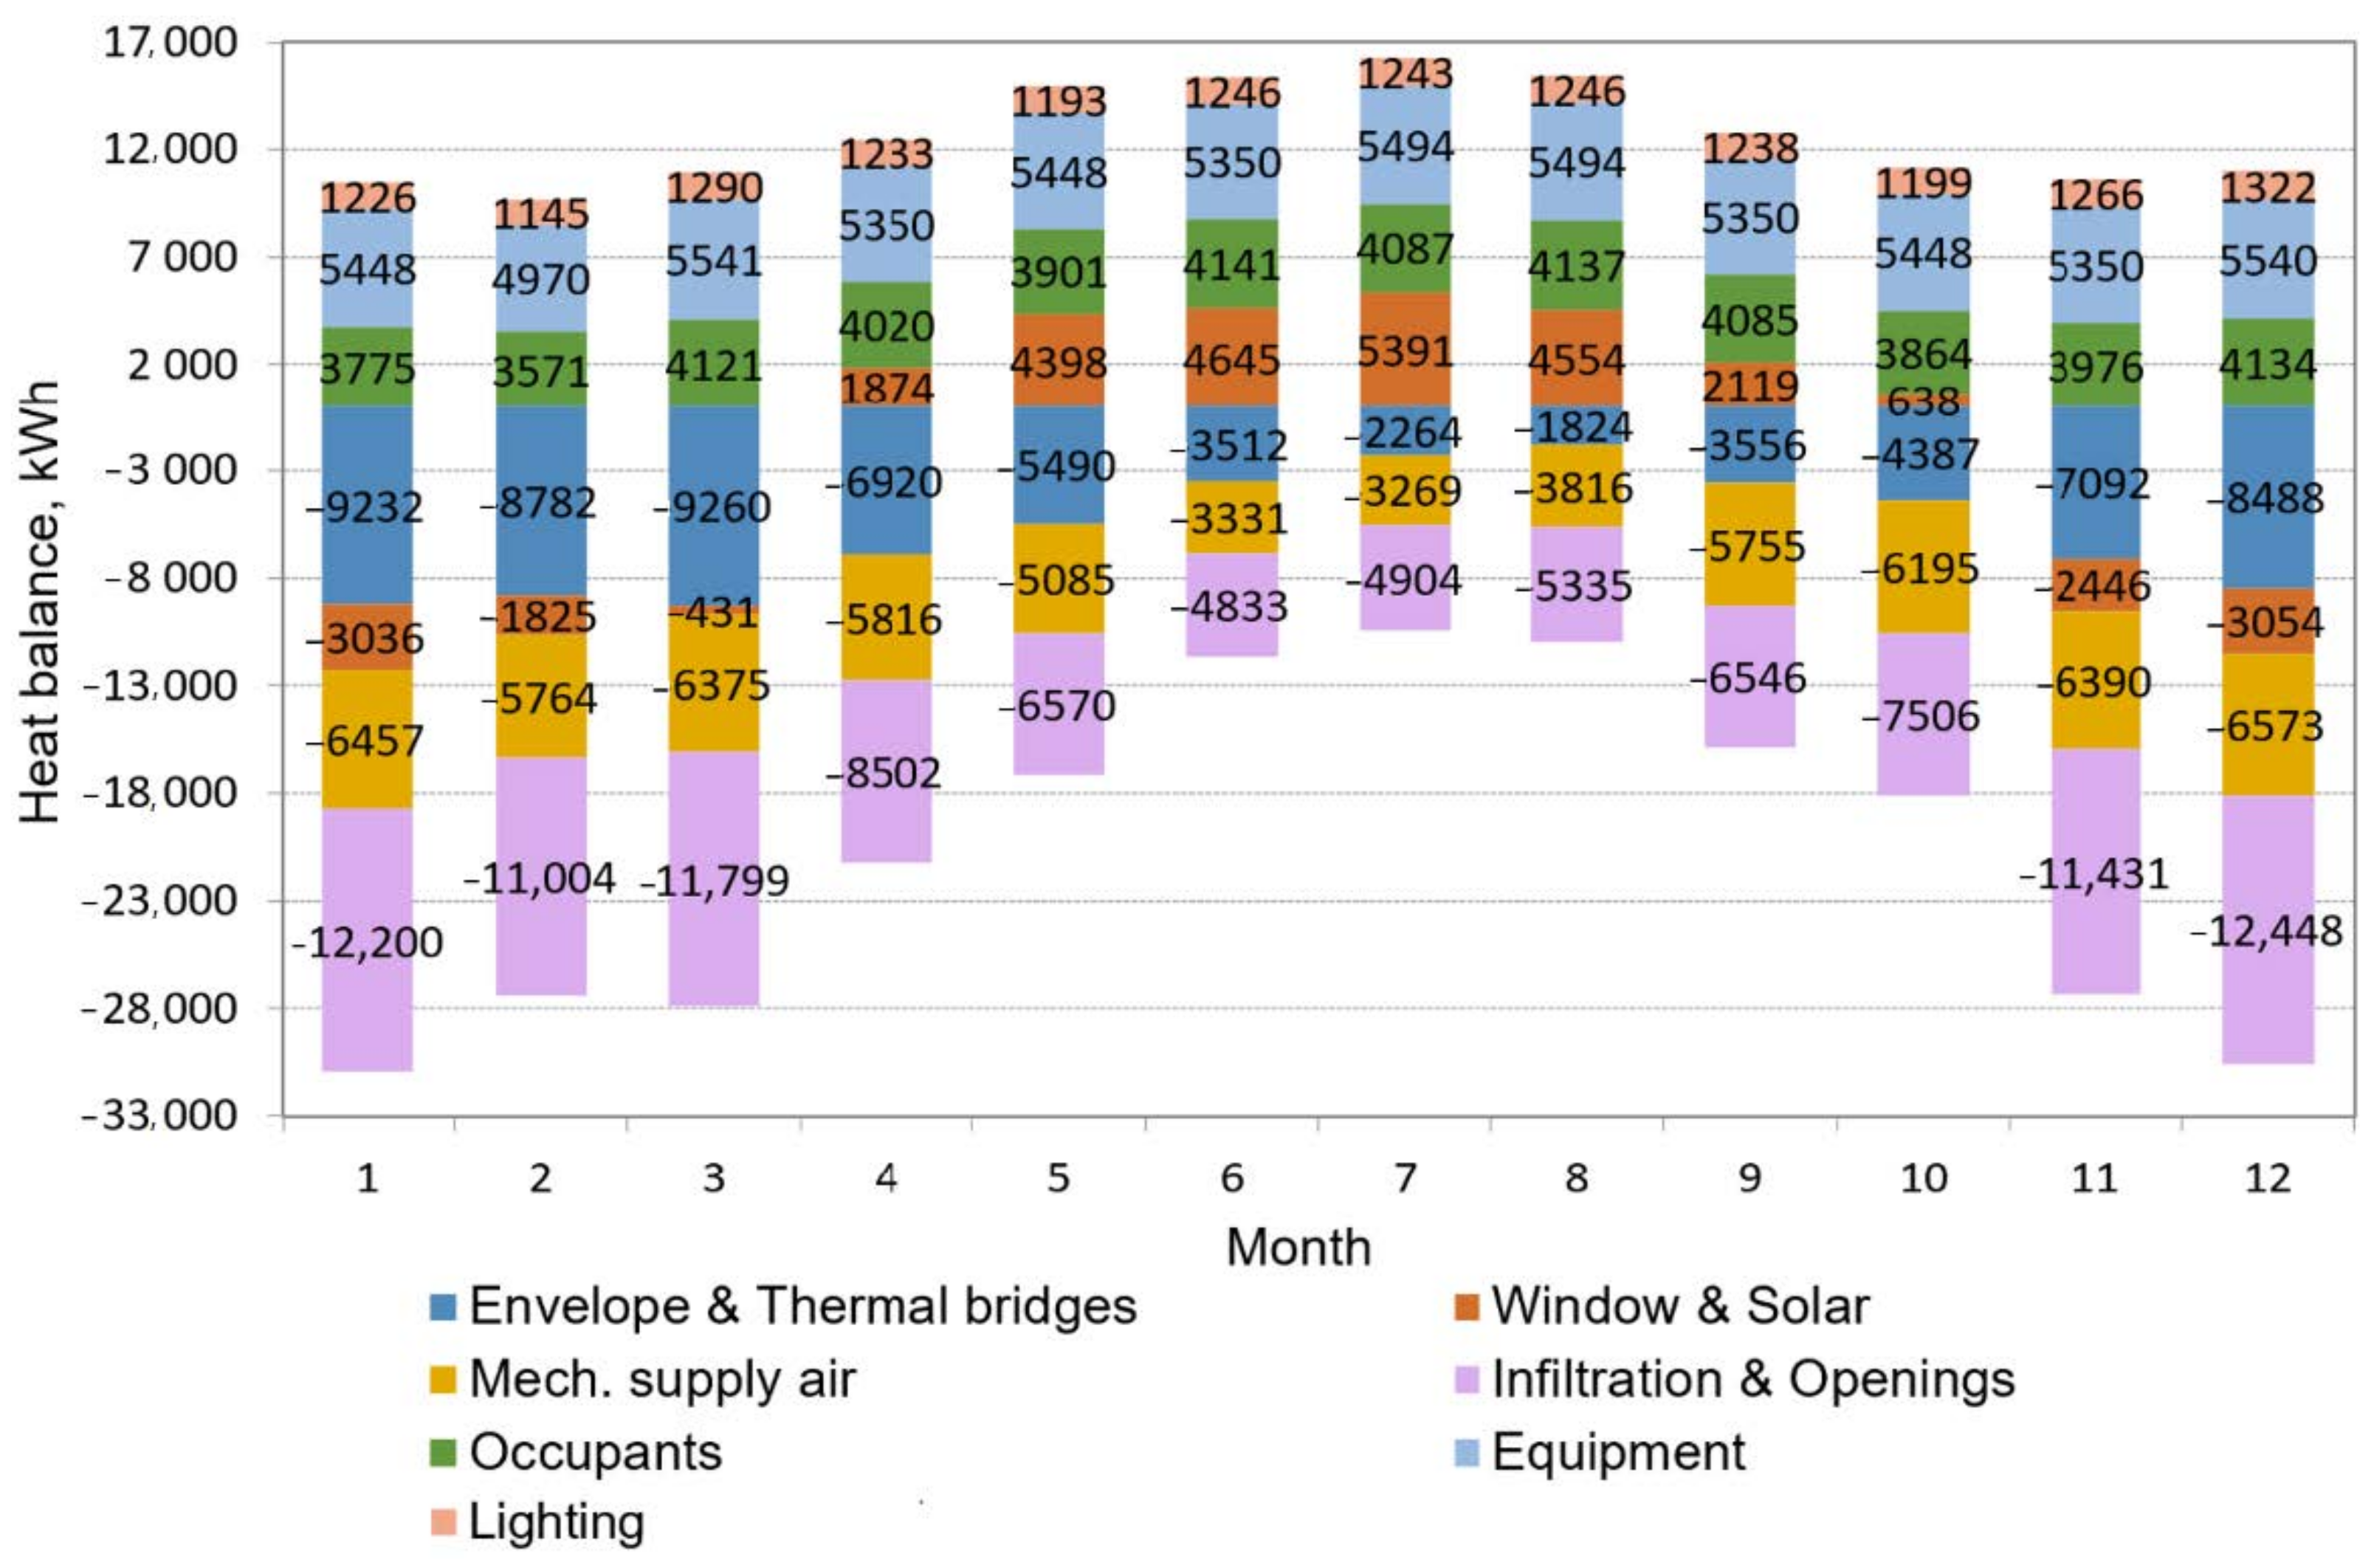
The total year-round heat losses in the building amounted to 248,677 kWh, and heat gains amount to 151,330 kWh. The monthly distribution of heat losses and gains of the building is presented in Figure 7. The heat balance includes heat losses through building partitions and for heating ventilation air, as well as heat gains from electronic equipment, lighting and occupants. The year-round heat losses through external partitions and thermal bridges amounted to 70,808 kWh. The heat losses for heating the infiltration air amounted to 103,078 kWh, and the heat required for the supply air in the mechanical ventilation system was 64,826 kWh. The year-round heat gains through internal partitions amounted to 92 kWh, from electronic equipment to 64,781 kWh, from lighting to 14,847 kWh and from occupants to 47,809 kWh. The heat balance also includes heat losses and gains through windows due to radiation and penetration through the window frame. In the winter period (January–March, November–December), heat losses through the windows amounted to 10,791 kWh, while in the summer and transitional periods (April–October), the heat gains through the windows amounted to 23,619 kWh. In addition, the heat balance includes heat losses of the heating, domestic hot water and ventilation systems, which amounted to 1057 kWh.
Heat gains in the building were mainly influenced by electronic equipment, occupants and lighting, which accounted for 91% of total value of heat gains. These values depended on the assumed operation schedule adopted on the basis of data received from the building administrator. The specificity of many rooms in the building allows the assumption that they are not regularly occupied, which in fact may lead to a significant reduction in the use of electronic equipment and lighting in comparison to the adopted assumptions.
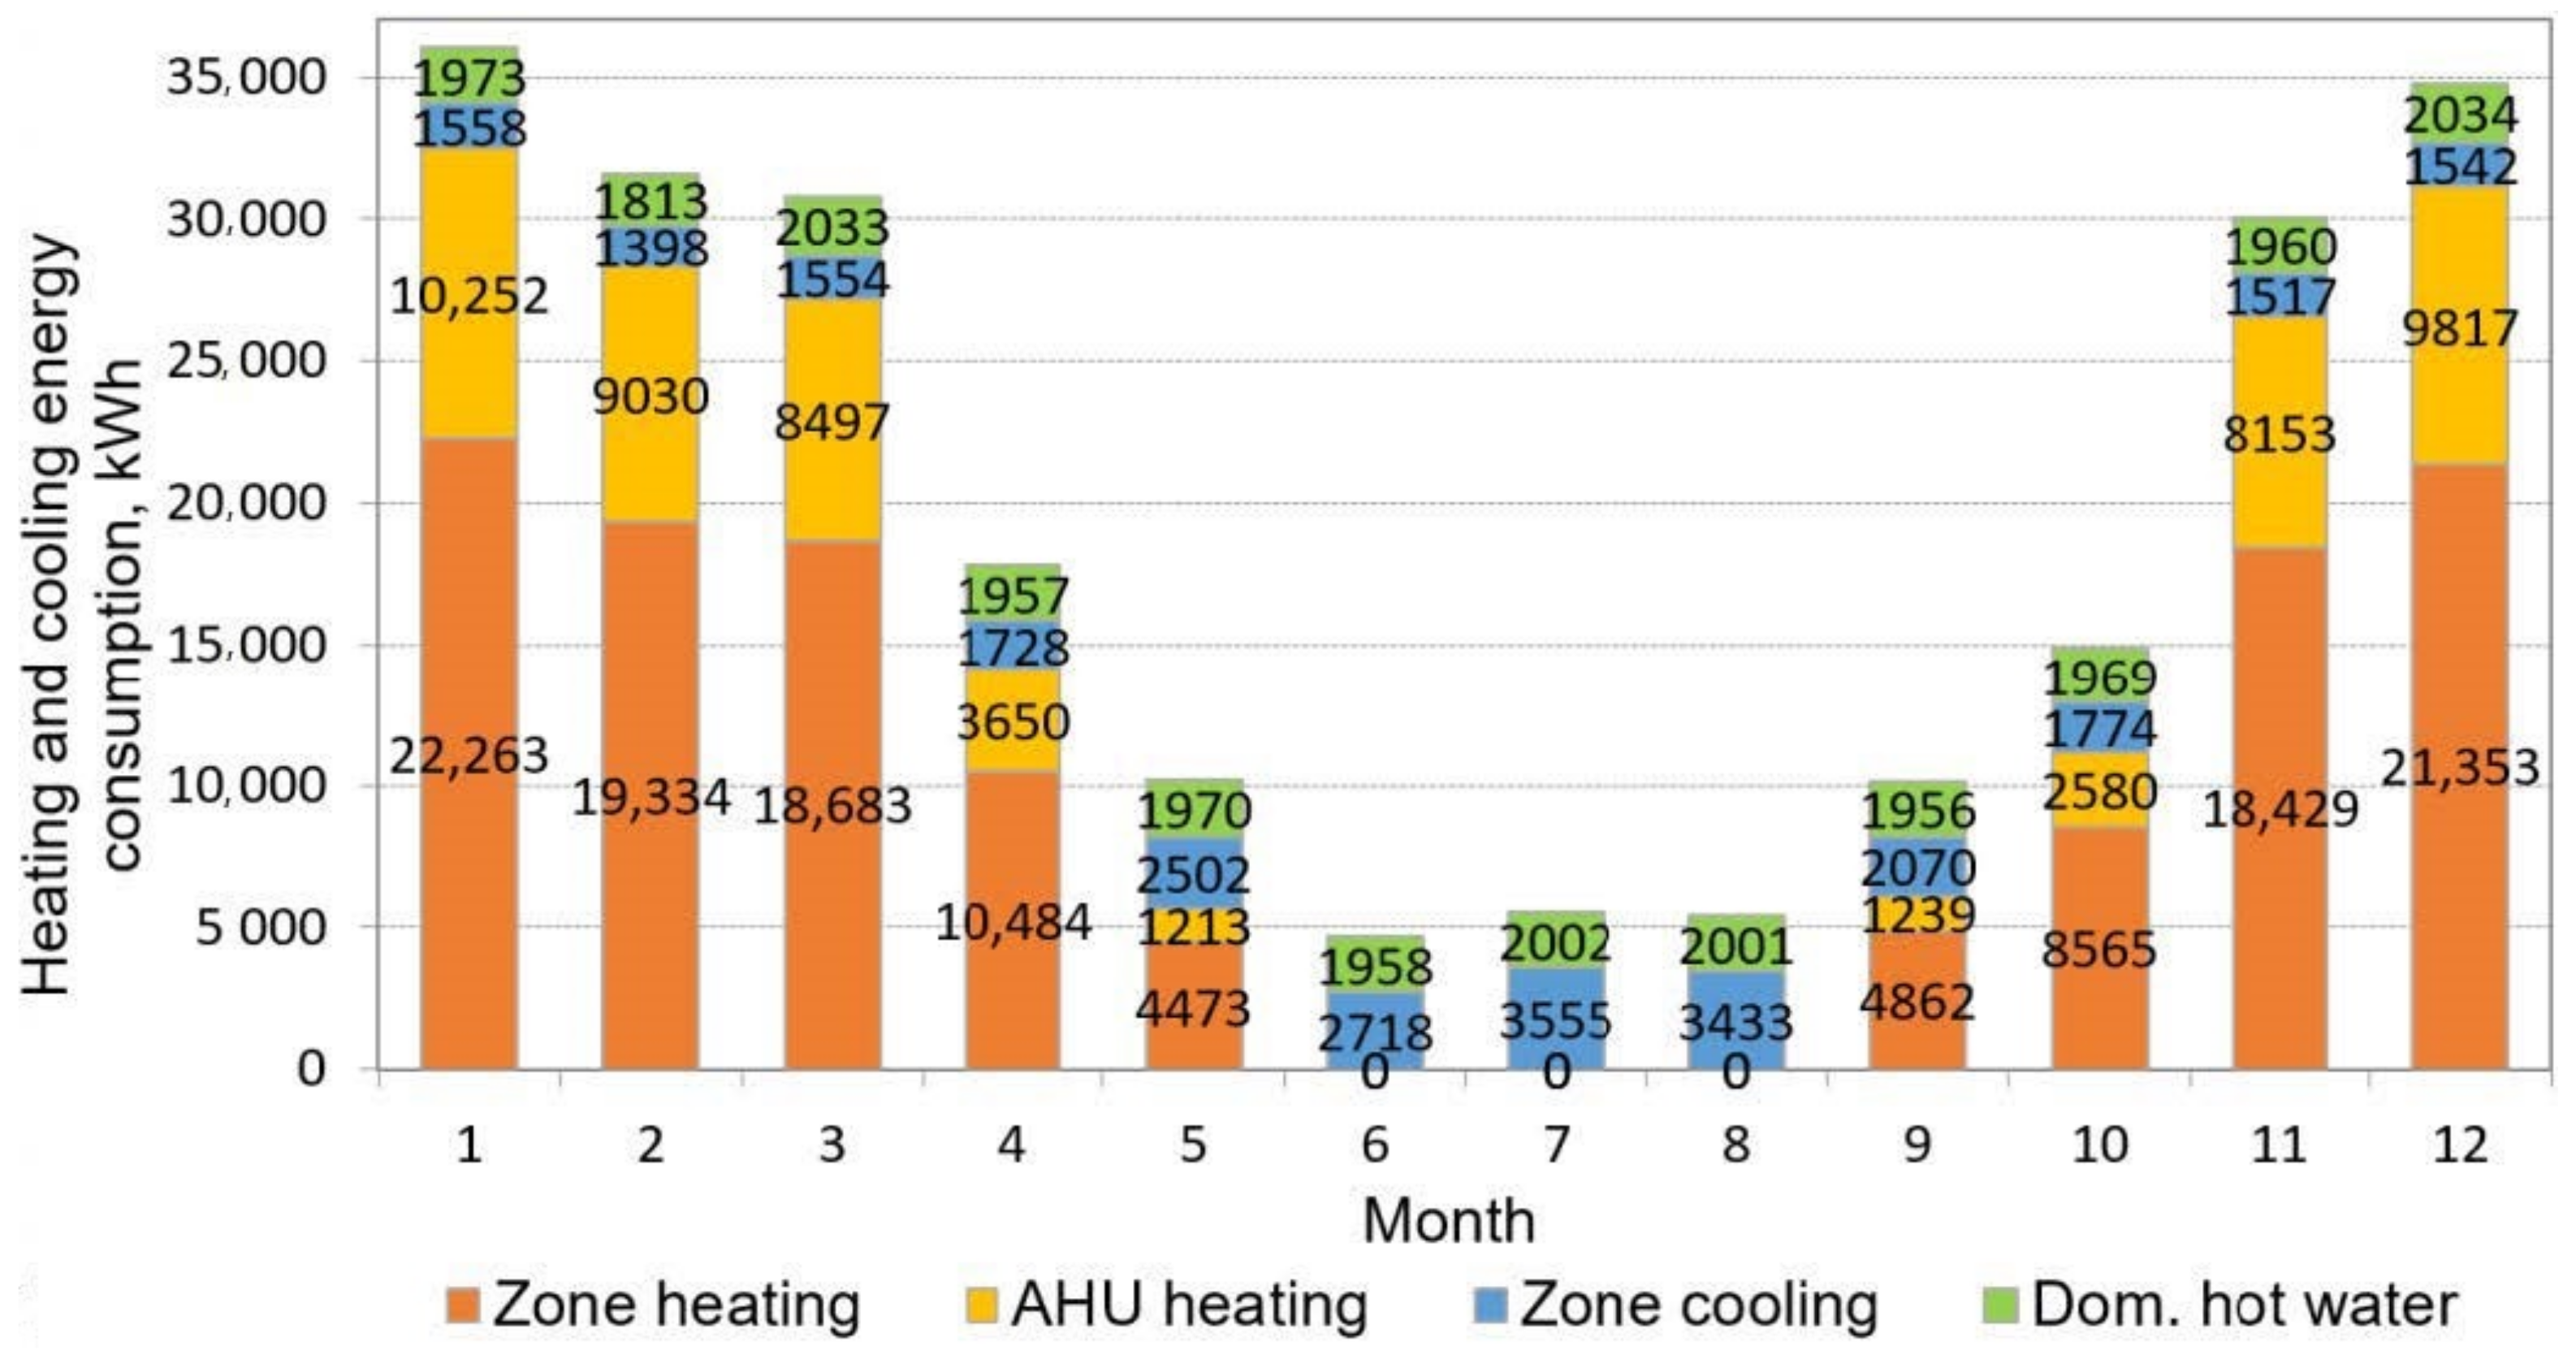
4.2. Heating and Cooling Energy Consumption in the CEEE’s Building
The year-round distribution of heating and cooling energy consumption in the CEEE’s building is presented in Figure 8. It accounts for the energy required for heating of the rooms by room panel radiators and heaters in air handling units, for the domestic hot water system, as well as for cooling in the form of cooling energy supplied to rooms by air conditioners. The total amount of heat supplied from the boiler room to the room radiators (taking into account heat generation and distribution losses) was equal to 128,446 kWh. The total amount of heat supplied to the heaters in the air handling units was 54,431 kWh. The total amount of heat supplied to the domestic hot water system was 23,626 kWh. The total amount of cooling supplied by air conditioners in the rooms was 25,349 kWh.
The highest heat consumption occurred in the winter period, while in the summer period (June–August), there was no heat supplied from the boiler room for heating purposes. In this period, the share of cooling energy was the biggest. The value of energy for purposes of domestic heat water preparation was maintained at a constant level, but during summer period, it was provided mainly by solar collectors and only supplemented by the gas boiler. The occurrence of cooling energy during the transition and winter periods is noteworthy. This was related to the significant gains of internal heat, which led to the increase of the indoor air temperature and triggered the air conditioners controller in order to meet the indoor air temperature setpoint.
4.3. Utilized Free Energy in the CEEE’s Building
The CEEE’s building currently uses solar energy from collectors and recovers heat from the exhausted ventilation air. The year-round consumption of utilized free heat from the solar installation and heat recovery in the heat exchangers of the air handling units is presented in Figure 9. The total value of heat obtained from the solar collectors was 5374 kWh and from the heat exchangers in the ventilation system 114,481 kWh. The total value of free energy utilized in the building was 119,856 kWh.
The value of recovered heat resulted from the use of four air handling units with heat recovery in the form of cross-flow heat exchangers. The year-round distribution of utilized free energy shows that the most heat in heat exchangers in air handling units was recovered in the winter, and the least in the summer. The inverse relationship occurs in the case of solar collectors, which supplied the most heat to the solar installation in summer, and the least in winter. The value of utilized free energy contributed to the decrease of heating energy consumption in the building.
4.4. Electric Energy Consumption in the CEEE’s Building
The year-round distribution of electric energy consumption by the building for the needs of electronic equipment, lighting, air conditioners and HVAC auxiliary energy (fans and circulation pumps) is presented in Figure 10. Total energy consumption by electronic equipment was 64,781 kWh, by lighting 14,847 kWh, by air conditioners 8450 kWh, by fans and by circulation pumps 33,657 kWh. The total year-round electricity consumption in the building was 121,735 kWh.
Table 1 presents year-round electric energy consumption by lighting, air conditioners and auxiliary devices in heating and domestic hot water systems. These values are taken into account during the calculations of Primary Energy [43]. The relatively high value of electricity used by auxiliary devices can be noticed, which resulted from the introduced assumptions and default air handling units adopted in the IDA ICE software. In Variant 3*, energy consumption for HVAC aux and heat pump compressors decreased, which was related to lower heat losses as a result of a better thermal insulation of the building.
Monthly electric energy consumption by heat pump compressor is presented in Table 2. The total consumption in Variant 3 was 39% higher in comparison to Variant 2 due to the use of two heat pumps with scroll compressors. The consumption in Variant 3* was 9% lower in comparison to Variant 3 as a result of reducing the value of heat losses through building envelope due to improving the thermal insulation of the building.
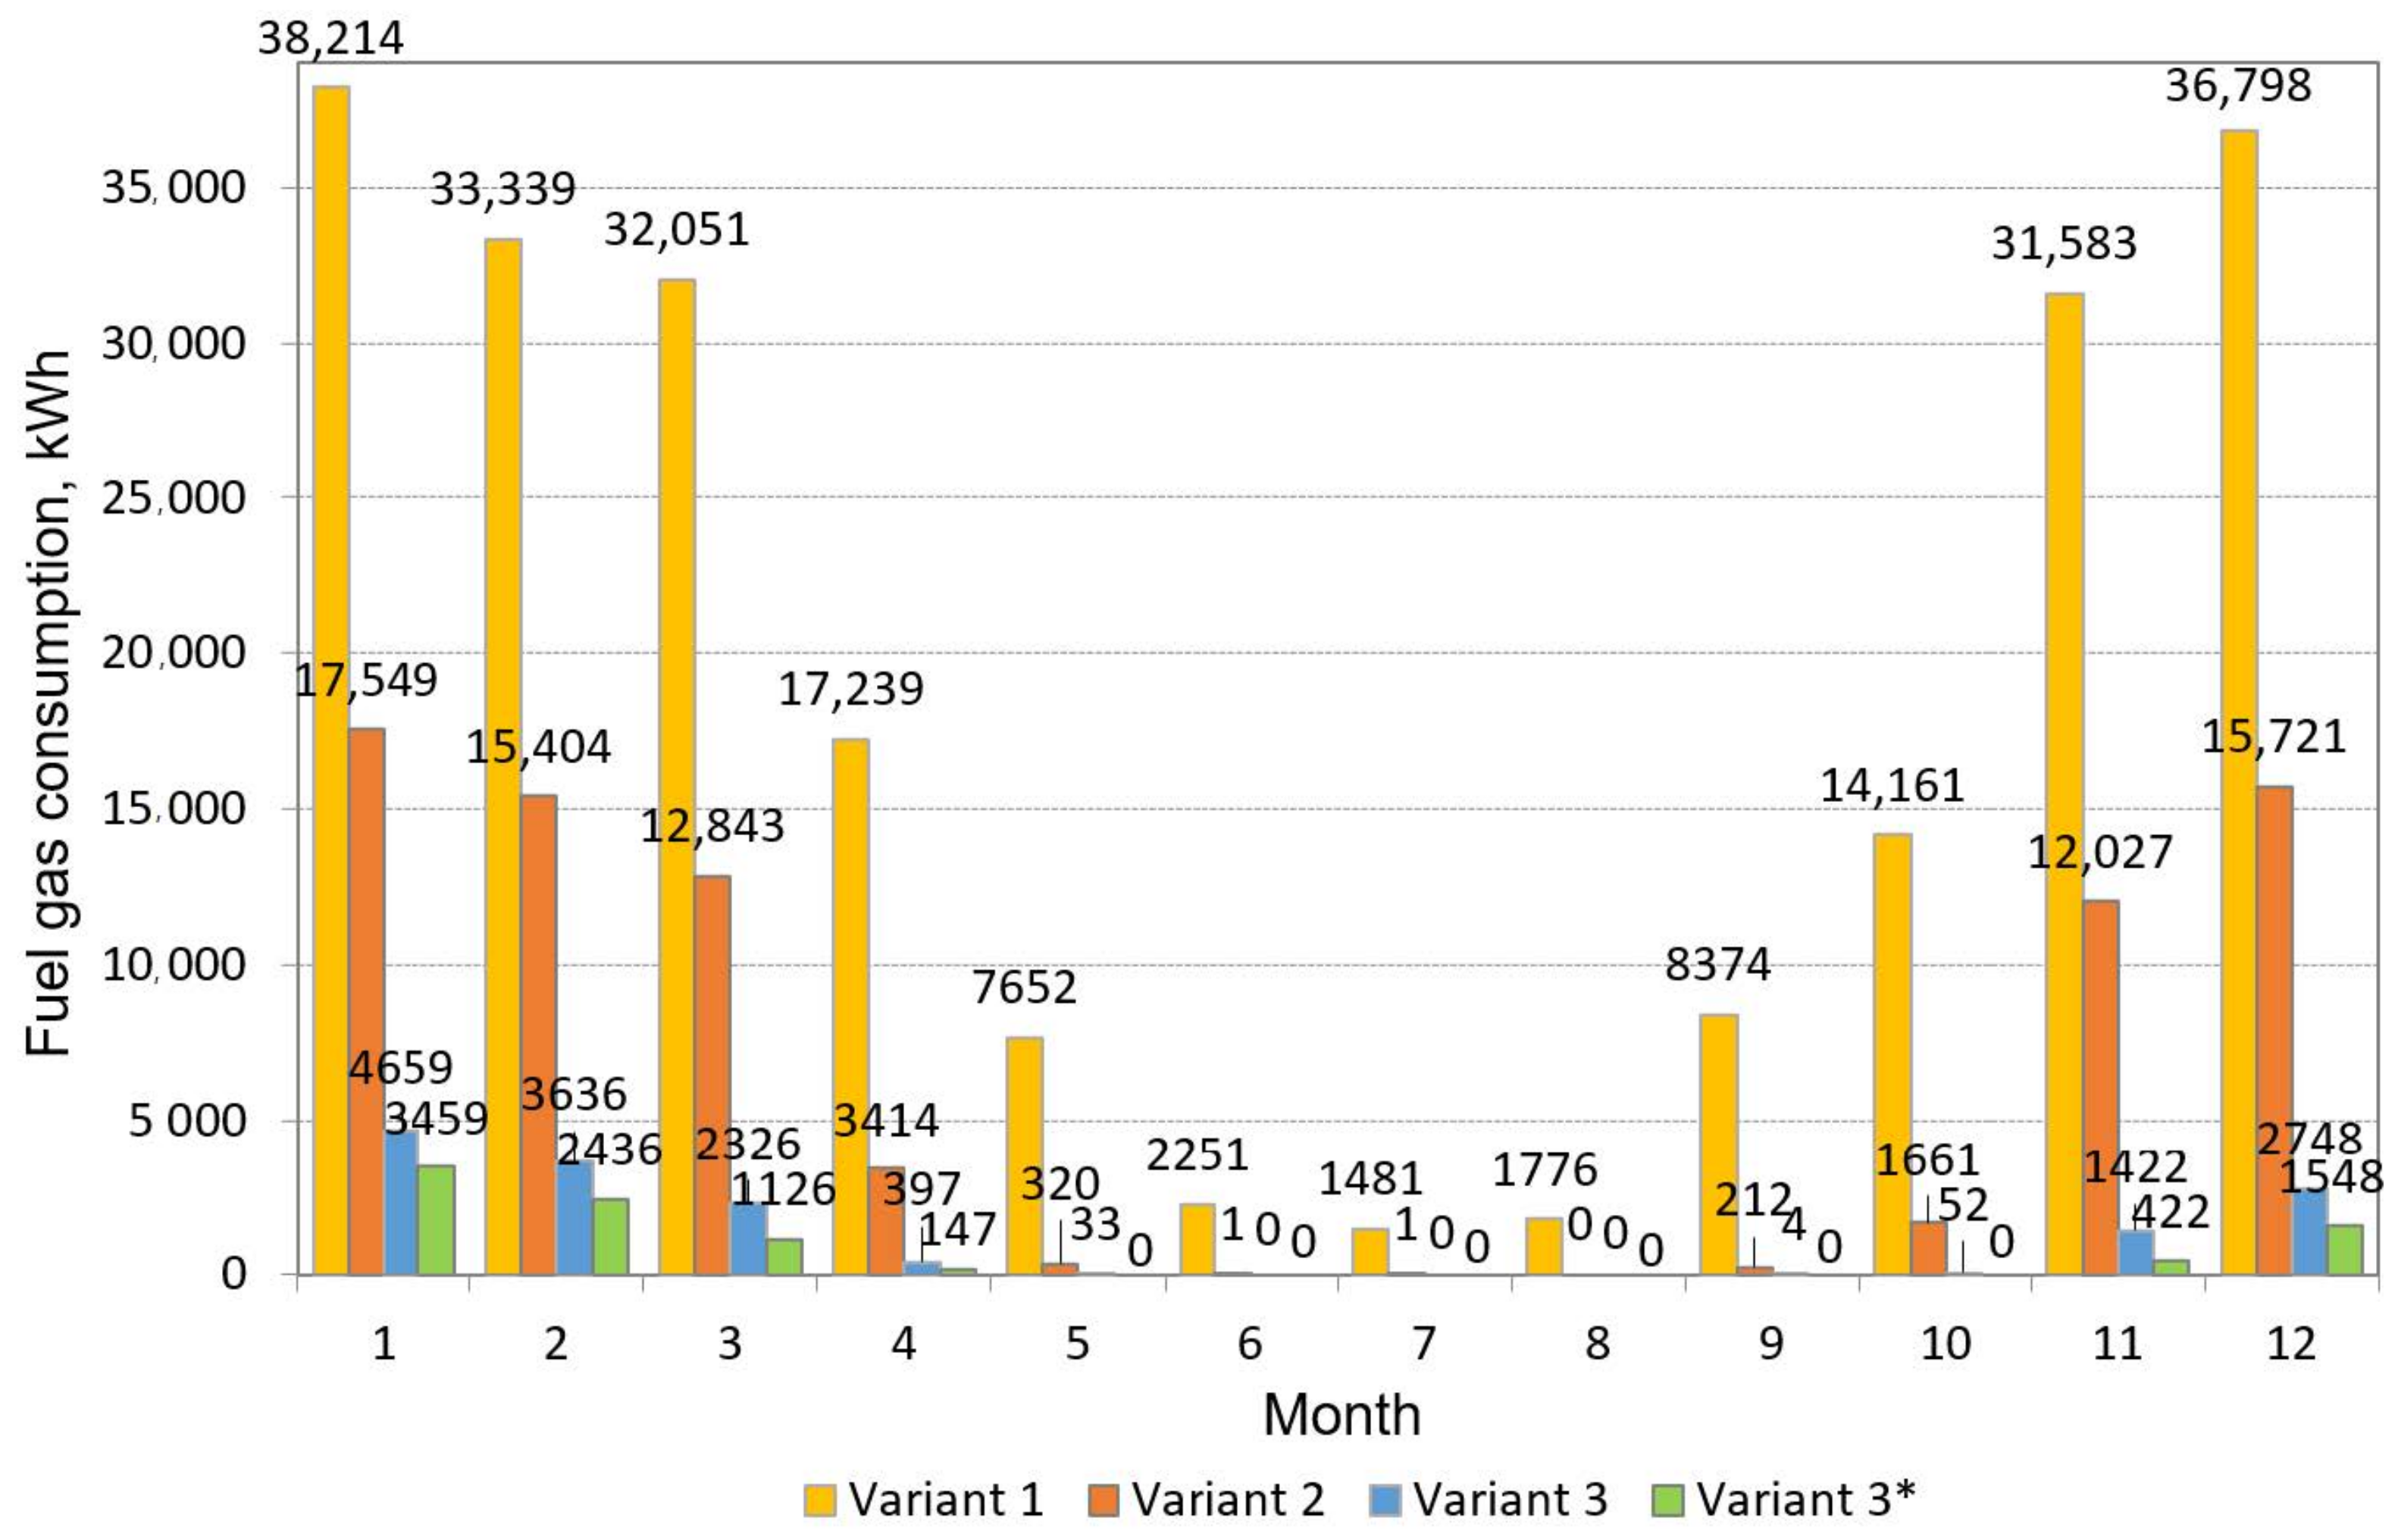
4.5. Fuel Gas Consumption for All Calculation Variants
The year-round gas fuel consumption for the purposes of heat preparation in the heating system and for the domestic hot water preparation for all calculation variants is presented in Figure 11. The highest year-round gas consumption occurred for the existing gas boiler room in Variant 1 and was equal to 230,425 kWh. In Variant 2, the total gas consumption was reduced to 79,153 kWh due to the use of a single heat pump. Implementation of a second heat pump in Variant 3 resulted in further reduction of year-round gas consumption to 15,276 kWh. In Variant 3*, the total gas consumption was the lowest (9138 kWh) as a result of introducing better thermal insulation of the building.
The highest gas fuel consumption occurred in winter and transitional periods, when it was necessary to supply heat to the heating system. The lowest consumption occurred in the summer period, when heat was supplied only to the domestic hot water system.
Year-round gas consumption in the building for all calculation variants is presented in Table 3. By supplementing the existing boiler room (Variant 1) with a single 30 kW heat pump (Variant 2), gas consumption was reduced by 66%, and by supplementing it with two heat pumps of a total capacity of 60 kW (Variant 3), gas consumption was reduced by 93%. Implementing better thermal insulation of the building (Variant 3*) led to a 96% reduction in gas consumption.
4.6. Validation of Energy Simulations
The numerical values of year-round total consumption of electric energy and fuel gas of the building for the existing boiler room (Variant 1), were compared with the actual average values for the building for years 2019–2021. In the case of year-round electricity consumption, the numerical value was 121,735 kWh, and the actual value was 114,684 kWh. In the case of year-round gas consumption, the numerical value was 230,425 kWh, and the actual value was 206,583 kWh. The numerical value of electricity consumption was 6% higher than the actual value, and the numerical value of gas fuel consumption was 10% higher than the actual value. The discrepancies between the results may be due to the assumptions and the coronavirus pandemic, which could affect operation of the building and lower actual consumption of electricity and gas fuel. It should also be noted that the differences may have arisen from the fact that the simulations were not performed for the historic local data, but standard weather data. Nevertheless, the obtained results prove the good quality of the numerical model.
4.7. Analysis of Primary Energy Values for All Calculation Variants
Four calculation variants encompassing three variants of the boiler room configuration were analysed. Variant 1 included the existing gas boiler room supplemented by solar collectors. Variant 2 additionally introduced an air heat pump with a power of 30 kW, while Variant 3 introduced two heat pumps with a total power of 60 kW. Variant 3* took into account the same boiler room configuration as Variant 3, while introducing better thermal insulation of building envelope. Simulation results showed that, when heat pumps were introduced, the heat demand of the building covered by renewable energy sources (heat pump and solar collectors) increased to 62% in Variant 2 and up to 93% in Variant 3. The air-to-water heat pumps supported by the gas boiler were implemented as a transitional solution for decarbonizing buildings—to reduce investment costs and adopt the existing, functioning boiler. For the same reason, it was decided to adopt the existing panel radiators. The Primary Energy values were calculated based on final energy values for all analysed variants. The calculations took into account the gas consumption for heating and domestic hot water systems, as well as the electric energy consumption for lighting, cooling (air conditioners) and auxiliary energy in the HVAC system for fans, circulation pumps and heat pump compressor [43].
Table 4 presents a summary of the partial values of the Primary Energy for electricity consumption from system power grid and for gas consumption, as well as the total Primary Energy for the building for all calculation variants. According to [43], the non-renewable Primary Energy input factor for electricity from system power grid is three. For this reason, when the electricity was supplied to the building entirely from this source, it was not possible to meet the criterion of the limit value of total Primary Energy, which is 45 kWh/m2/year for public utility buildings in Poland [42]. It was necessary to diversify sources of electricity supply and ensure supplies from renewable energy sources installation, for which the non-renewable Primary Energy input factor value is 0 [43].
Table 5 presents the required electricity supply from renewable energy installation in order to ensure the limit value of total Primary Energy for the building. The summary is presented for two variants with the lowest gas consumption. In Variant 3, it would be necessary to supply 113,414 kWh/year, and in Variant 3*, 101,835 kWh/year of electricity from renewable energy sources installation must be supplied in order to meet the limit value of total Primary Energy of 45 kWh/m2/year [42]. In the paper [33], the concept of renewable energy sources installation to supply electricity for the needs of SBG was presented. The installation included wind turbine producing 73 MWh/year and PV panels producing 54 MWh/year of electricity. In total, the installation was able to produce 127 MWh/year of electricity. Assuming a self-consumption ratio of 40% [45,46], double the size of such an installation would be necessary to achieve the limit value of total Primary Energy for the building in Variant 3*.
4.8. Analysis of CO2 Emission for All Calculation Variants
The increase in carbon dioxide (CO2) content on a global scale increases gas isolation around the world, which may lead to catastrophic events like climate change. The concentration of carbon dioxide in the Earth’s atmosphere is constantly increasing. Currently, more and more attention is paid to reducing the emission of harmful compounds into the atmosphere, including CO2. New alternative ways to reduce the carbon footprint are sought. One of them uses energy from renewable sources; for example, by introducing heat pumps in existing buildings.
Table 6 presents the year-round CO2 emission by the SBG building for all calculation variants. Supplementing the existing boiler room (Variant 1) with a single heat pump (Variant 2) resulted in reduction of year-round CO2 emission by the building by 66%, and by supplementing it with two heat pumps (Variant 3), reductions of 93% could be achieved. Implementation of two heat pumps and better thermal insulation of the building (Variant 3*) led to a 96% reduction in CO2 emission. The results prove that retrofitting existing buildings by implementation of heat pumps can also have positive ecological effects by reducing CO2 emission.
Although the heat pump solutions proposed in the paper do not completely exclude conventional heat sources, such as a gas boiler, in the SBG building, they are in line with the strategy of phasing out fossil fuels in the heating and cooling of buildings.
To improve the energy efficiency of the building following solutions could be introduced:
- The electronic equipment and lighting had a relatively large share in electricity consumption. Reducing energy consumption could be achieved by replacing the fluorescent light sources with LEDs [47];
- The implementation of ground heat exchangers for preliminary air heating. The systems were tested in Mediterranean and cold Norwegian climate conditions, demonstrating the possibility of reducing electricity consumption for heat pump operation and the reduction of the shutdown time when the outside temperature is below the limit operating temperature [36]. Due to the high power of the adopted pumps and the need to supply high values of ventilation air volume flow rate, it is necessary to carry out additional analyses of the possibilities of their implementation.
5. Conclusions
For the analysed building of the Silesian Botanical Garden in Mikołów, Poland, year-round energy consumption analyses were carried out for four calculation variants including three variants of the boiler room supported by air-to-water heat pumps. In order to limit investment costs, the analyses were carried out for the existing heating system in the form of panel radiators without changing them to underfloor heating. The analysed variants were in line with the strategy of phasing out fossil fuels in the heating and cooling of buildings. The following conclusions can be drawn from the carried-out calculations:
- The numerical model of the SBG building reflected the operation of the actual facility to a good degree. The year-round numerical value of electricity consumption was 6% higher than the actual one, and the year-round numerical value of gas fuel consumption was 10% higher than the real one. The lower actual energy and gas consumption may be the result of assumptions made and a different operation of the building due to the coronavirus pandemic in recent years as well as different actual weather conditions from those assumed in the simulation;
- By supplementing the existing boiler room (Variant 1) with a single 30 kW heat pump (Variant 2), gas consumption was reduced by 66%. By supplementing it with two heat pumps with a total capacity of 60 kW (Variant 3), gas consumption was reduced by 93%. Implementing the better thermal insulation of the building in Variant 3* led to a 96% reduction in gas consumption. The CO2 emission was reduced from 53,889 kg/year in Variant 1 to 18,205 kg/year in Variant 2 to 3513 kg/year in Variant 3 and 2 102 kg/year in Variant 3*;
- the significant share of electricity should be provided to the building from the renewable energy sources installation. The concept was presented in [33] to ensure the limit value of total Primary Energy 45 kWh/m2/year. Assuming a self-consumption ratio of 40%, a two-fold size of proposed installation would be necessary. Providing the electricity only from system power grid did not ensure the required value of total Primary Energy;
- To improve the energy efficiency of the building, the solution with ground heat exchangers for preliminary air heating should be analysed.
Author Contributions
Conceptualization, P.C.; methodology, P.C.; investigation, formal analysis, P.C., J.K. and M.J.; resources, J.K.; writing—original draft preparation, review and editing, P.C., J.K. and M.J. All authors have read and agreed to the published version of the manuscript.
Funding
The APC was partially funded by the Department of Heating, Ventilation and Dust Removal Technology, Silesian University of Technology (Gliwice, Poland) (under state research project 08/010/BK_22/0060).
Institutional Review Board Statement
Not applicable.
Data Availability Statement
The data presented in this study are available on request from the corresponding author.
Acknowledgments
The work was supported by Polish Ministry of Science and Higher Education, within statutory research subsidy.
Conflicts of Interest
The authors declare no conflict of interest.
References
- Energia i Zielony Ład. Available online: https://ec.europa.eu/info/strategy/priorities-2019-2024/european-green-deal/energy-and-green-deal_pl (accessed on 30 October 2022).
- Energy Transformation in Poland|American Chamber of Commerce in Poland. Available online: https://amcham.pl/news/energy-transformation-poland (accessed on 30 October 2022).
- Porozumienie Paryskie. Available online: https://climate.ec.europa.eu/eu-action/international-action-climate-change/climate-negotiations/paris-agreement_pl (accessed on 30 October 2022).
- A European Green Deal. Available online: https://ec.europa.eu/info/strategy/priorities-2019-2024/european-green-deal_en (accessed on 30 October 2022).
- Improving the Energy Efficiency of Poland’s Buildings|News|CORDIS|European Commission. Available online: https://cordis.europa.eu/article/id/435871-improving-the-energy-efficiency-of-poland-s-buildings (accessed on 30 October 2022).
- Energy Policy of Poland until 2040 (EPP2040)—Ministry of Climate and Environment—Gov.Pl Website. Available online: https://www.gov.pl/web/climate/energy-policy-of-poland-until-2040-epp2040 (accessed on 30 October 2022).
- Polska przyjęła strategię w zakresie renowacji budynków—Ministerstwo Rozwoju i Technologii—Portal Gov.pl. Available online: https://www.gov.pl/web/rozwoj-technologia/polska-przyjela-strategie-w-zakresie-renowacji-budynkow (accessed on 30 October 2022).
- Statystyki|Główny Urząd Nadzoru Budowlanego. Available online: https://www.gunb.gov.pl/strona/statystyki (accessed on 30 October 2022).
- Abbasi, M.H.; Abdullah, B.; Ahmad, M.W.; Rostami, A.; Cullen, J. Heat transition in the European building sector: Overview of the heat decarbonisation practices through heat pump technology. Sustain. Energy Technol. Assess. 2021, 48, 101630. [Google Scholar] [CrossRef]
- Program Czyste Powietrze–STOP Smog. Available online: https://www.czystepowietrze.gov.pl/ (accessed on 30 October 2022).
- Mojecieplo.Gov.Pl. Available online: https://mojecieplo.gov.pl/# (accessed on 31 October 2022).
- Sevindik, S.; Spataru, C.; Domenech Aparisi, T.; Bleischwitz, R. A comparative environmental assessment of heat pumps and gas boilers towards a circular economy in the UK. Energies 2021, 14, 3027. [Google Scholar] [CrossRef]
- Beccali, M.; Bonomolo, M.; Martorana, F.; Catrini, P.; Buscemi, A. Electrical hybrid heat pumps assisted by natural gas boilers: A review. Appl. Energy 2022, 322, 119466. [Google Scholar] [CrossRef]
- Aprianti, T.; Tan, E.; Diu, C.; Sprivulis, B.; Ryan, G.; Srinivasan, K.; Chua, H.T. A comparison of ground and air source heat pump performance for domestic applications: A case study in Perth, Australia. Int. J. Energy Res. 2021, 45, 20686–20699. [Google Scholar] [CrossRef]
- Valancius, R.; Singh, R.M.; Jurelionis, A.; Vaiciunas, J. A review of heat pump systems and applications in cold climates: Evidence from Lithuania. Energies 2019, 12, 4331. [Google Scholar] [CrossRef] [Green Version]
- Aprianti, T.; Tan, E.; Diu, C.; Sprivulis, B.; Ryan, G.; Srinivasan, K.; Chua, H.T. Performance comparison of Ground Source Heat Pump (GSHP) against Air Source Heat Pump (ASHP) for domestic applications: A case study in Perth, Australia. Teknomekanik 2021, 4, 55–63. [Google Scholar] [CrossRef]
- Sankelo, P.; Ahmed, K.; Mikola, A.; Kurnitski, J. Renovation results of Finnish single-family renovation subsidies: Oil boiler replacement with heat pumps. Energies 2022, 15, 7620. [Google Scholar] [CrossRef]
- Chesser, M.; Lyons, P.; O’Reilly, P.; Carroll, P. Air source heat pump in-situ performance. Energy Build. 2021, 251, 111365. [Google Scholar] [CrossRef]
- Ponad dwukrotny wzrost sprzedaży powietrznych pomp ciepła w I poł. 2022 roku! Polska Organizacja Rozwoju Technologii Pomp Ciepła. 2022. Available online: https://portpc.pl/ponad-dwukrotny-wzrost-sprzedazy-powietrznych-pomp-ciepla-w-i-pol-2022-roku/ (accessed on 31 October 2022).
- Sarevet, H.; Fadejev, J.; Thalfeldt, M.; Kurnitski, J. Residential buildings with heat pumps peak power reduction with high performance insulation. E3S Web Conf. 2020, 172, 12008. [Google Scholar] [CrossRef]
- Ma, Z.; Xia, L.; Gong, X.; Kokogiannakis, G.; Wang, S.; Zhou, X. Recent advances and development in optimal design and control of ground source heat pump systems. Renew. Sustain. Energy Rev. 2020, 131, 110001. [Google Scholar] [CrossRef]
- Montero, O.; Brischoux, P.; Callegari, S.; Fraga, C.; Rüetschi, M.; Vionnet, E.; Calame, N.; Rognon, F.; Patel, M.; Hollmuller, P. Large air-to-water heat pumps for fuel-boiler substitution in non-retrofitted multi-family buildings—Energy performance, CO2 savings, and lessons learned in actual conditions of use. Energies 2022, 15, 5033. [Google Scholar] [CrossRef]
- Schreurs, T.; Madani, H.; Zottl, A.; Sommerfeldt, N.; Zucker, G. Techno-economic analysis of combined heat pump and solar PV system for multi-family houses: An Austrian case study. Energy Strategy Rev. 2021, 36, 100666. [Google Scholar] [CrossRef]
- Hesaraki, A.; Madani, H. Energy Performance of Ground-Source Heat Pump and Photovoltaic/Thermal (PV/T) in Retrofitted and New Buildings: Two Case Studies Using Simulation and On-Site Measurements; SINTEF Academic Press: Trondheim, Norway, 2020; ISBN 978-82-536-1679-7. [Google Scholar]
- Xu, W.; Liu, C.; Li, A.; Li, J.; Qiao, B. Feasibility and performance study on hybrid air source heat pump system for ultra-low energy building in severe cold region of China. Renew. Energy 2020, 146, 2124–2133. [Google Scholar] [CrossRef]
- Zator, S.; Skomudek, W. Impact of DSM on energy management in a single-family house with a heat pump and photovoltaic installation. Energies 2020, 13, 5476. [Google Scholar] [CrossRef]
- Marijanovic, Z.; Theile, P.; Czock, B.H. Value of short-term heating system flexibility–A case study for residential heat pumps on the German intraday market. Energy 2022, 249, 123664. [Google Scholar] [CrossRef]
- Niekurzak, M.; Lewicki, W.; Drożdż, W.; Miązek, P. Measures for assessing the effectiveness of investments for electricity and heat generation from the hybrid cooperation of a photovoltaic installation with a heat pump on the example of a household. Energies 2022, 15, 6089. [Google Scholar] [CrossRef]
- Aira, R.; Fernández-Seara, J.; Diz, R.; Pardiñas, Á.Á. Experimental analysis of a ground source heat pump in a residential installation after two years in operation. Renew. Energy 2017, 114, 1214–1223. [Google Scholar] [CrossRef]
- Carroll, P.; Chesser, M.; Lyons, P. Air source heat pumps field studies: A systematic literature review. Renew. Sustain. Energy Rev. 2020, 134, 110275. [Google Scholar] [CrossRef]
- Han, J.; Cui, M.; Chen, J.; Lv, W. Analysis of thermal performance and economy of ground source heat pump system: A case study of the large building. Geothermics 2021, 89, 101929. [Google Scholar] [CrossRef]
- Gao, B.; Zhu, X.; Yang, X.; Yuan, Y.; Yu, N.; Ni, J. Operation performance test and energy efficiency analysis of ground-source heat pump systems. J. Build. Eng. 2021, 41, 102446. [Google Scholar] [CrossRef]
- Jastrzębska, M. Installation’s conception in the field of renewable energy sources for the needs of the Silesian Botanical Garden. Energies 2022, 15, 6598. [Google Scholar] [CrossRef]
- Informational Materials of Mikołów Commune: Geotechnical Documentation, Mikołów, Sosnowa Street—The Centre for Ecological and Environmental Education (CEEE)—Freestanding Building, 2010 and 2013. Own Documentation of the Mayor of Mikołów Commune Made Available Directly to the Author of This Study in January 2014. unpublished. (In Polish)
- Vujnović, N.; Dović, D. Cost-optimal energy performance calculations of a new NZEB hotel building using dynamic simulations and optimization algorithms. J. Build. Eng. 2021, 39, 102272. [Google Scholar] [CrossRef]
- Arghand, T.; Javed, S.; Dalenbäck, J.-O. Combining direct ground cooling with ground-source heat pumps and district heating: Borehole sizing and land area requirements. Geothermics 2022, 106, 102565. [Google Scholar] [CrossRef]
- Clauß, J.; Georges, L. Model complexity of heat pump systems to investigate the building energy flexibility and guidelines for model implementation. Appl. Energy 2019, 255, 113847. [Google Scholar] [CrossRef]
- Congedo, P.M.; Baglivo, C.; Bonuso, S.; D’Agostino, D. Numerical and experimental analysis of the energy performance of an Air-Source Heat Pump (ASHP) coupled with a horizontal Earth-to-Air Heat Exchanger (EAHX) in different climates. Geothermics 2020, 87, 101845. [Google Scholar] [CrossRef]
- IDA Indoor Climate and Energy (IDA ICE). Available online: https://www.equa.se/en/ida-ice (accessed on 31 October 2022).
- American Society of Heating, Refrigerating and Air Conditioning Engineers. ASHRAE Handbook; Fundamentals (SI Edition); American Society of Heating, Refrigerating and Air Conditioning Engineers: Atlanta, GA, USA, 2011. [Google Scholar]
- Regulation of the Minister for Infrastructure of 14 January 2002 on the Determination of Average Standards for Water Consumption (Journal of Laws, Dz.U. 2002 nr 8 poz. 70). Available online: https://isap.sejm.gov.pl/isap.nsf/DocDetails.xsp?id=wdu20020080070 (accessed on 31 October 2022). (In Polish)
- Announcement of the Minister of Development and Technology of 15 April 2022 on the Announcement of the Consolidated Text of the Regulation of the Minister of Infrastructure on the Technical Conditions to be Met by Buildings and Their Location (Journal of Laws, Dz.U. 2022 poz. 1225). Available online: https://isap.sejm.gov.pl/isap.nsf/download.xsp/WDU20220001225/O/D20221225.pdf (accessed on 31 October 2022). (In Polish)
- Regulation of the Minister of Infrastructure and Development of 27 February 2015 on the Methodology for Determining the Energy Performance of a Building or Part of a Building and Performance Certificates (Journal of Laws, Dz.U. poz. 376 with Amendments). Available online: http://isap.sejm.gov.pl/isap.nsf/DocDetails.xsp?id=WDU20150000376 (accessed on 31 October 2022). (In Polish)
- The National Centre for Emissions Management (KOBiZE). Calorific Values and CO2 Emission Factors for Reporting under the Emission Trading Scheme for 2021. Available online: https://kobize.pl/uploads/materialy/materialy_do_pobrania/monitorowanie_raportowanie_weryfikacja_emisji_w_eu_ets/WO_i_WE_do_monitorowania-ETS-2021.pdf (accessed on 31 October 2022). (In Polish).
- Allouhi, A. Solar PV integration in commercial buildings for self-consumption based on life-cycle economic/environmental multi-objective optimization. J. Clean. Prod. 2020, 270, 122375. [Google Scholar] [CrossRef]
- Marańda, W. Analysis of self-consumption of energy from grid-connected photovoltaic system for various load scenarios with short-term buffering. SN Appl. Sci. 2019, 1, 406. [Google Scholar] [CrossRef] [Green Version]
- Da Silva de Souza, D.; de Souza Silva, P.; Barbosa de Alencar, D. Comparative analysis of compact fluorescent lamps versus led lamps: An economy factor. Int. J. Innov. Educ. Res. 2020, 8, 198–212. [Google Scholar] [CrossRef]
Figure 1.
View of the analysed building of the Silesian Botanical Garden, Mikołów, Poland (source: phot. of Janusz Moczulski, 2013); available thanks to 2013 Paweł Kojs’ permission).
Figure 1.
View of the analysed building of the Silesian Botanical Garden, Mikołów, Poland (source: phot. of Janusz Moczulski, 2013); available thanks to 2013 Paweł Kojs’ permission).

Figure 2.
Floor plan of the analysed CEEE’s building of the Silesian Botanical Garden, Mikołów, Poland, created in the IDA ICE software.
Figure 2.
Floor plan of the analysed CEEE’s building of the Silesian Botanical Garden, Mikołów, Poland, created in the IDA ICE software.

Figure 3.
3D model of the analysed CEEE’s building of the Silesian Botanical Garden, Mikołów, Poland, created in the IDA ICE software.
Figure 3.
3D model of the analysed CEEE’s building of the Silesian Botanical Garden, Mikołów, Poland, created in the IDA ICE software.

Figure 4.
Hydraulic diagram of calculation Variant 1.

Figure 5.
Hydraulic diagram of calculation Variant 2.

Figure 6.
Hydraulic diagram of calculation Variant 3.

Figure 7.
Monthly heat balance of the CEEE’s building.

Figure 8.
Monthly heating and cooling energy consumption in the CEEE’s building.

Figure 9.
Monthly utilized free energy in the CEEE’s building.

Figure 10.
Monthly electric energy consumption in the CEEE’s building.

Figure 11.
Monthly fuel gas consumption for all calculation variants.


Table 1.
Year-round electric energy consumption in the building for all calculation variants.
| Year-Round Electric Energy Consumption (kWh/Year) | ||||
|---|---|---|---|---|
| Lighting | Cooling (Air Conditioners) | HVAC aux (Fans, Pumps) | Heat Pump Compressor | |
| Variant 1 | 14,847 | 8450 | 33,657 | 0 |
| Variant 2 | 14,847 | 8450 | 33,657 | 40,945 |
| Variant 3 | 14,847 | 8450 | 33,657 | 66,675 |
| Variant 3* | 14,847 | 8450 | 30,209 | 61,014 |
Table 2.
Electric energy consumption by heat pump compressor.
| Electric Energy Consumption by Heat Pump Compressor (kWh/year) | |||
|---|---|---|---|
| Month | Variant 2 | Variant 3 | Variant 3* |
| 1 | 5616 | 10,649 | 9533 |
| 2 | 4917 | 9380 | 8379 |
| 3 | 5267 | 9335 | 8435 |
| 4 | 3675 | 5109 | 4709 |
| 5 | 1992 | 2195 | 2098 |
| 6 | 1229 | 1305 | 1286 |
| 7 | 860 | 940 | 948 |
| 8 | 983 | 1056 | 1064 |
| 9 | 2253 | 2392 | 2313 |
| 10 | 3292 | 4124 | 3859 |
| 11 | 5208 | 9414 | 8678 |
| 12 | 5653 | 10,776 | 9712 |
Table 3.
Year-round gas consumption in the CEEE’s building for all calculation variants.
| Year-Round Gas Consumption (kWh/Year) | Reduction of Year-Round Gas Consumption (%) | |
|---|---|---|
| Heating System and Domestic Hot Water System | ||
| Variant 1 | 230,425 | - |
| Variant 2 | 79,153 | 66 |
| Variant 3 | 15,276 | 93 |
| Variant 3* | 9138 | 99 |
Table 4.
Primary Energy values for all calculation variants.
| Primary Energy (kWh/m2/Year) | |||
|---|---|---|---|
| For Electric Energy Consumption from System Power Grid | For Gas Consumption, | Total Primary Energy | |
| Variant 1 | 161 | 240 | 401 |
| Variant 2 | 278 | 82 | 360 |
| Variant 3 | 351 | 16 | 367 |
| Variant 3* | 325 | 9 | 334 |
Table 5.
Necessary share of electric energy from renewable energy sources installation to meet the limit value of total Primary Energy for the building.
Table 5.
Necessary share of electric energy from renewable energy sources installation to meet the limit value of total Primary Energy for the building.
| Electric Energy Consumption (kWh/Year) | Primary Energy (kWh/m2/Year) | ||||
|---|---|---|---|---|---|
| From System Power Grid | From Renewable Energy Sources | For Electric Energy Consumption | For Gas Consumption | Total Primary Energy | |
| Variant 3 | 10,215 | 113,414 | 29 | 16 | 45 |
| Variant 3* | 12,685 | 101,835 | 36 | 9 | 45 |
Table 6.
Year-round CO2 emission by the building for all calculation variants.
| Year-Round CO2 Emission (kg/Year) | Reduction of Year-Round CO2 Emission (%) | |
|---|---|---|
| Variant 1 | 53,889 | - |
| Variant 2 | 18,205 | 66 |
| Variant 3 | 3513 | 93 |
| Variant 3* | 2102 | 96 |
Disclaimer/Publisher’s Note: The statements, opinions and data contained in all publications are solely those of the individual author(s) and contributor(s) and not of MDPI and/or the editor(s). MDPI and/or the editor(s) disclaim responsibility for any injury to people or property resulting from any ideas, methods, instructions or products referred to in the content. |
© 2022 by the authors. Licensee MDPI, Basel, Switzerland. This article is an open access article distributed under the terms and conditions of the Creative Commons Attribution (CC BY) license (https://creativecommons.org/licenses/by/4.0/).
Share and Cite
MDPI and ACS Style
Ciuman, P.; Kaczmarczyk, J.; Jastrzębska, M. Simulation Analysis of Heat Pumps Application for the Purposes of the Silesian Botanical Garden Facilities in Poland. Energies 2023, 16, 340. https://0-doi-org.brum.beds.ac.uk/10.3390/en16010340
AMA Style
Ciuman P, Kaczmarczyk J, Jastrzębska M. Simulation Analysis of Heat Pumps Application for the Purposes of the Silesian Botanical Garden Facilities in Poland. Energies. 2023; 16(1):340. https://0-doi-org.brum.beds.ac.uk/10.3390/en16010340
Chicago/Turabian StyleCiuman, Piotr, Jan Kaczmarczyk, and Małgorzata Jastrzębska. 2023. "Simulation Analysis of Heat Pumps Application for the Purposes of the Silesian Botanical Garden Facilities in Poland" Energies 16, no. 1: 340. https://0-doi-org.brum.beds.ac.uk/10.3390/en16010340
Note that from the first issue of 2016, this journal uses article numbers instead of page numbers. See further details here.