
Machine Learning-Based Energy Consumption Estimation of Wastewater Treatment Plants in Greece

Department of Business Administration, University of Thessaly, Geopolis Campus, Larissa Ringroad, 41500 Larissa, Greece
*
Author to whom correspondence should be addressed.
Energies 2023, 16(21), 7408; https://0-doi-org.brum.beds.ac.uk/10.3390/en16217408
Submission received: 4 October 2023
/
Revised: 20 October 2023
/
Accepted: 31 October 2023
/
Published: 2 November 2023
(This article belongs to the Special Issue Multi-Criteria Decision-Making Methods in Sustainable Energy Development)
Abstract
:Amidst a global discourse on energy resources, it is imperative to provide decision makers with a comprehensive overview of energy consumption (EC) associated with various projects, particularly wastewater treatment plants (WWTPs). Ensuring compliance with stringent effluent quality criteria in the treatment of municipal wastewater necessitates a substantial EC, representing a predominant factor contributing to the operational expenses incurred by WWTP. Machine learning (ML) techniques can contribute to the estimation of the WWTPs’ EC, which requires efficient and accurate data. This article uses data from several municipal WWTP projects in Greece, which are examined in order to produce EC estimation models. Data were first statistically analyzed, according to the context of project attributes and the context of EC, and correlation analysis identified the appropriate predictive project variables. Then, the attribute selection function in Waikato Environment for Knowledge Analysis 3.8.4 (WEKA 3.8.4) software emphasized the most effective subset of variables. The extracted variables from the combination of the correlation analysis and the WEKA attribute function were used as input neurons for the construction of neural network (NN) models, in the Fast Artificial Neural Network Tool 1.2 (FANN Tool 1.2). The optimum NN model resulted in a mean squared error (MSE) of 8.99899 × 10⁻⁵ and was based on treatment capacity, flow rate, influent load, and served population as its inputs. Notably, the research highlights the potential generalizability of these models in Greece and beyond the Greek context, offering valuable tools for stakeholders to inform decision making, allocate resources efficiently, and improve energy-efficient designs, resulting in cost savings and sustainability benefits.
1. Introduction
Comprehending the energy consumption (EC) of a wastewater treatment plant (WWTP) is crucial for various reasons [1]. Efficient energy management plays a direct role in enhancing cost-effectiveness by facilitating optimal resource allocation and the potential for savings. These insights support the fine-tuning of processes, channeling efforts towards energy-intensive stages to enhance overall operational efficiency. Beyond financial implications, a grasp of EC knowledge contributes to environmental sustainability and sustainable development by mitigating the carbon footprint linked with elevated energy use. Precise energy data facilitate regulatory compliance, while well-informed infrastructure planning, benchmarking, and funding decisions draw advantages from this comprehension [1]. Transparent endeavors to manage EC not only enhance public perception but also foster community engagement, aligning WWTPs with responsible resource stewardship and sustainable practices. Hence, it becomes evident that the prediction of EC in WWTPs can play a pivotal role in achieving sustainable development, improved decision making, power management, monitoring various operational functions, and environmental protection [1,2,3].
Municipal WWTPs, typically employing conventional activated sludge (CAS) processes, are intensive energy consumers [4,5,6,7,8]. The EC of CAS plants typically falls within the range of 0.3 to 0.6 kWh/m3, with approximately half of this energy being allocated to aeration for oxygen supply and the conversion of organic pollutants to sludge [4,7,9]. In the European Union (EU), the energy requirements of WWTPs constitute over 1% of the total electricity consumption in Europe [10]. It has also been documented that WWTPs are responsible for 4% of the United States’ national electricity consumption and approximately 7% of global electrical energy usage [5,11,12,13]. They exhibit a high energy demand due to the substantial energy required for executing the various treatment procedures essential for wastewater purification. EC can contribute to as much as 48% of the operational costs of a WWTP [14]. The majority of WWTPs in Greece function as extended aeration facilities, leading to elevated operational expenses primarily attributed to substantial energy requirements [15]. The notable energy-intensive processes within a WWTP include the aeration, mixing, and pumping of water and solids for recirculation, filtration, and disinfection [1]. Furthermore, energy is also essential for biosolids processing, encompassing activities like aerobic digestion, heat drying, and dewatering. The energy requirements for disinfection may differ based on the selected method, with chlorination exhibiting lower energy requirements compared to ultraviolet (UV) or ozone disinfection. Although sedimentation is an essential process in wastewater treatment, it is not generally regarded as a highly energy-intensive process [1]. These energy-demanding activities, in addition to the electrical and mechanical equipment utilized in WWTPs, make a substantial contribution to the overall EC. Enhancing energy efficiency through measures like incorporating renewable energy sources or optimizing treatment processes can mitigate WWTP energy consumption.
Rojas et al. [16] have highlighted that the design of most WWTPs primarily focuses on meeting effluent quality standards, often neglecting energy efficiency considerations. This aspect presents an opportunity for enhancement. At present, optimizing energy efficiency in WWTPs is a prominent topic in the scientific community [17,18,19,20]. Accurately predicting the EC of WWTPs is one potential approach to optimize them and achieve energy savings. Notably, machine learning (ML) techniques are being harnessed within WWTPs to bolster efficiency and curtail operational expenditures. Forecasting EC in WWTPs provides a better understanding of the energy needs for various operational strategies, ultimately leading to energy reduction [3]. When WWTP operators have access to swift and accurate EC predictions, they can adjust their operational strategies to minimize energy usage while maintaining treatment efficiency. For example, they can optimize aeration levels, reducing energy consumption during periods of low influent loading or when influent quality is relatively good. ML techniques have gained substantial traction across numerous domains, including predicting and optimizing wastewater components, due to their remarkable precision; all this can be accomplished without the need for an intricate comprehension of the underlying mechanisms typically essential for constructing mechanistic models [21]. Until this moment, only a limited number of studies have explored the utilization of ML technologies for predicting EC in WWTPs [3], and to our best of knowledge, the combination of wastewater characteristics, WWTPs’ hydraulic parameters, and the treatment lines for wastewater and sludge for a full-scale WWTP energy consumption prediction has not been studied yet.
In Greece, there is a significant variation in energy requirements among WWTPs, indicating the potential for improvements to reduce energy consumption [15]. This underscores the critical importance of having swift and accurate predictions for the EC of WWTPs, allowing for the optimization of their operations.
The main aim of the current study is to produce reliable and efficient NN models for the estimation of EC, regarding the operation of WWTPs in Greece. The models were produced by considering the combined influence of wastewater characteristics, WWTP hydraulic parameters, and the treatment processes for both wastewater and sludge, enabling accurate predictions of EC for WWTPs in Greece.
This study starts by introducing the findings of prior research on project performance models, along with the associated documented methodologies Subsequently, within the scope of our sample projects, the study underscores the correlation outcomes of the selected variables and their influence on the EC of WWTPs. Moreover, a structured methodology for generating NNs is analyzed. The associated models are introduced alongside their individual performance results. Finally, discussions and conclusions were conducted in the study, with attention given to limitations and prospects for future research.
The format of this paper proceeds as follows: Section 2 presents an outline of EC prediction and corresponding ML methodologies. In Section 3, the research methodology is presented, detailing the approach taken for this study, while also elaborating on the application and the architecture of NN, highlighting their role in the analysis. Furthermore, the section explores the application of the Waikato Environment for Knowledge Analysis 3.8.4 (WEKA 3.8.4) software for attribute selection, showcasing its significance in the context of the study. Finally, Section 4 contains some conclusions, limitations, and future thoughts.
2. Project Performance Prediction Models
Artificial intelligence (AI) finds application across various domains for the prediction of both natural and artificial processes. As a subgroup of AI, machine learning constitutes a technique for identifying specific patterns based on provided data, facilitating prediction or classification [22].
Recent publications have explored energy consumption (EC) modeling and prediction for WWTPs using various statistical and machine learning algorithms.
Bonescu et al. [23] considered the logistic regression method (LRM). This approach involved the use of input variables such as flow rate and wastewater properties to predict the EC of a WWTP in Romania. The study gathered data from a WWTP spanning 2015 to 2017, compiling a dataset of 403 records to verify the efficiency of this method. The findings demonstrated a satisfactory predictive performance, achieving an accuracy rate of 80%. Żyłka et al. [24] evaluated the implementation of a least squares linear regression model to forecast EC in a WWTP serving a Polish dairy. This initiative resulted in the optimization of energy utilization. Furthermore, they observed the influence of air temperature and biological load as significant factors affecting EC. A regression model for the annual EC of WWTPs under various influent conditions was developed by Yang et al. [25] Their findings indicated that the main correlated features with EC in bioreactors were the influent flow rate and chemical oxygen demand (COD) concentration. The obtained model showed a high accuracy in predicting the annual EC. Using Bayesian semiparametric quantile regression (QR), Yu et al. [26] employed wastewater parameters including biochemical oxygen demand (BOD), COD, pH, and total nitrogen as input variables to estimate the EC of WWTPs. Correlation analysis revealed the strongest correlations were observed between the dependent variable and COD (0.96) and BOD (0.86), respectively.
S. Zhang et al. [27] employed a random forest (RF) model to forecast the EC of WWTPs. They evaluated this ML method utilizing a dataset consisting of 2387 records extracted from the China Urban Drainage Yearbook. The findings demonstrate that the RF approach displayed satisfactory predictive capabilities, achieving an R2 value of 0.702.
Oulebsir et al. [28] introduced an approach involving the utilization of an artificial neural network (ANN) to construct an optimal EC model for WWTP employing the activated sludge process. The model demonstrated good results, exhibiting a coefficient of determination ranging from 90% to 92% during the training phase and 74% to 82% during testing. Furthermore, when the most proficient model was applied, substantial energy gains were observed across a significant portion of the dataset. Z. Zhang et al. [29] employed an NN model to estimate the EC of pumps within a wastewater treatment plant. This utilization facilitates the creation of the scheduling of pump system operations with the intention of minimizing EC. The performance of the ANN model was satisfactory, achieving a mean absolute error (MAE) of 0.78 and a mean absolute percentage error (MAPE) of 0.02, underscoring its ability to deliver accurate predictions. Z. Zhang et al. [12] focused on the modeling and optimization of a wastewater pumping system with the objective of curbing energy consumption, employing the ANN model. Precisely, NNs were harnessed to construct models for both pump EC and wastewater flow rate. To tackle the optimization challenge encompassing the dual goal of minimizing EC and maximizing pumped wastewater flow rate, an artificial immune network algorithm (AINA) was implemented. The outcome of this endeavor demonstrated energy savings ranging from 6% to 14%, while simultaneously upholding optimal pumping performance. Qiao and Zhou [30] introduced an approach for EC and effluent quality prediction, employing a density peak-based adaptive fuzzy neural network (DP-AFNN). The experimental results showed that the proposed DP-AFNN can achieve fast convergence speed and high prediction accuracy in comparison with some existing methods such as multiple linear regression (MLR), the FNN-EBP (error backpropagation), and the dynamic FNN.
To optimize EC in a large-scale WWTP located in Italy, Borzooei et al. [31] conducted weather-based cluster analysis on historical influent data along with various aeration strategies. An extensive dataset of historical and meteorological records was subjected to two clustering techniques: the K-means algorithm and the Gaussian mixture model (GMM) utilizing the expectation–maximization (EM) algorithm. The findings suggest that integrating weather-based aeration strategies into the WWTP operations enhances the efficiency of energy utilization.
Torregrossa et al. [32] applied ANN and RF to forecast energy costs within WWTPs. This comprehensive study enfolded a dataset encompassing 279 WWTPs distributed across northwest Europe, encompassing countries such as Belgium, France, Holland, Denmark, Germany, Luxembourg, and Austria. In terms of average R2 values, RF exhibited a notable performance level of 0.82, closely followed by ANN at 0.81. The primary objective of Torregrossa et al. [33] was to improve energy efficiency in WWTPs by conducting an extensive daily benchmark analysis. They explored the applicability of support vector regression (SVR), ANN, and RF algorithms, employing the Solingen–Burg WWTP dataset. The RF algorithm emerged as the optimal choice due to its superior performance, achieving an R2 value of 0.72 during validation and 0.71 during testing. Bagherzadeh et al. [3] delved into investigating the effect of wastewater, hydraulic, and climate related factors on the daily EC of the East Melbourne WWTP, utilizing a six-year dataset spanning from 2014 to 2019. Employing four different feature selection (FS) algorithms, the research aimed to unveil the relationships among these variables and identify the most relevant for training ML models. The study further explored the application of ANN and two decision tree algorithms—gradient boosting machine (GBM) and RF —to predict EC values, followed by a thorough assessment of a 95% confidence interval. Findings from the FS algorithms underscored the substantial impact of total nitrogen, COD, and inflow on WWTP energy consumption. Notably, GBM exhibited superior predictive performance compared to other regression algorithms. A 95% confidence interval analysis demonstrated a reasonable error band for prediction (±68 MWh/day). Ramli and Hamid [34] conducted an extensive investigation to investigate the effectiveness of various predictive models, including linear regression (LR), K-nearest neighbors (KNN), ANN, and SVM, in forecasting the EC of a WWTP situated in Peninsular Malaysia. The dataset for EC was sourced from the Tenaga National Berhad electrical bills spanning from March 2011 to February 2015. The outcomes of this research indicated that among the considered models, the ANN model demonstrated a notable superiority in performance.
Oliveira et al. [35] endeavored to formulate, fine-tune, and assess an array of prospective deep learning models, all with the overarching objective of predicting the EC of a WWTP using a recursive multistep methodology. Within this exploration, three distinct types of models were tested: long short-term memory networks (LSTMs), gated recurrent units (GRUs), and unidimensional convolutional neural networks (CNNs). The evaluation encompassed both uni- and multivariate configurations, accompanied by diverse techniques for addressing outliers. Notably, CNN-based models yielded promising forecasting outcomes, with a statistically significant disparity compared to LSTMs and GRUs. The most optimal model demonstrated an approximate overall error of 630 kWh in a multivariate context. Yusuf et al. [36] employed the widely recognized statistical method known as autoregressive integrated moving average (ARIMA) and deep learning techniques to predict the daily electric consumption across a month, as well as the 15 min moving average electric consumption within a single day. This forecasting effort was conducted for two distinct locations within a water utility in southern California. A comprehensive comparative analysis of these methodologies was presented, incorporating relevant error metrics. The prediction of electric consumption for a water treatment plant and a pumping station was executed using both approaches. Notably, deep learning techniques emerge as superior in consumption prediction for both scenarios and across both time resolutions.
Das et al. [37] employed and trained sophisticated ML models, including ANN, recurrent neural networks (RNN), LSTM, and GRU, using real-world data, to forecast the EC of WWTPs. Through the utilization of four ML algorithms on the provided dataset, the optimal-fitting model was determined. Performance assessment of the models hinges on established metrics like MAE and root mean square error (RMSE). The findings highlight that the GRU model demonstrates the best fit and is thus suggested for further future analyses. Alali et al. [1] conducted an evaluation and comparison of 23 candidate ML models to predict EC in WWTPs, utilizing real data sourced from the Melbourne WWTP. To enhance model performance, Bayesian optimization was employed to calibrate the investigated ML models. XGBoost (extreme gradient boosting) and RF were applied to evaluate the impact of the integrated features on EC prediction. Furthermore, the investigation delved into the potential of integrating time-lagged measurements from past data to enhance prediction accuracy. The findings unveiled the superiority of dynamic models employing time-lagged data, outperforming the static and streamlined ML models. The study showed that including lagged measurements in the model improves prediction accuracy, and the results indicate that the dynamic K-nearest neighbors (kNN) model outperforms the state-of-the-art methods by reaching promising EC predictions. Ahmad and Chen [2] presented four different ML forecasting models, which were conditional decision trees (CDT), FitcKnn, a linear regression model (LRM), and stepwise-LRM for the EC demand of water source pumps within the water industry. The input data for these models encompassed environmental and power usage variables associated with the water source pumps, analyzed at both weekly and monthly intervals.
3. Research Methodology
The main aim of the current study is to produce reliable and efficient neural network (NN) models for the prediction of energy consumption (EC), regarding the operation of WWTPs in Greece. The sample projects under evaluation comprise 31 WWTPs. For these specific projects, it became possible to collect a substantial amount of the same type of data, both quantitative and qualitative. Numerous studies have concentrated on the utilization of multiple linear regression techniques to estimate EC in WWTPs. The constraints of these approaches mainly centered around their linear and parametric characteristics. Furthermore, the dataset includes qualitative parameters, making NN a superior alternative to multiple regression models. Additionally, Juszczyk [38] underscores that NN possesses traits such as the ability to learn and generalize acquired knowledge, adapt to changing conditions, and exhibit limited sensitivity to input data errors. The latter is crucial, given the ongoing concern about data reliability, particularly in the case of EC. Considering these facts and the international literature, the present study applies NNs to forecast the EC for WWTPs operating in Greece. In addition to presenting the developed models, this paper introduces a novel methodological approach (inspired by [39]) that ensures the identification of the most highly performing and reliable models through an effective variable screening process, based on available data and suitable input variable combinations. This research methodology has been successfully applied to predict construction costs and project durations for highway and bridge projects [39,40,41]. However, it has not yet been applied and tested to WWTPs and their operational characteristics, particularly in predicting EC. For the aforementioned reasons, this specific method was selected for use in the current work. In this section, we provide an outline of the research methodology, the project sample, the application of neural networks and the application of WEKA.
3.1. The Methodological Approach
The proposed methodology is built upon the following tools (inspired by [39]): the Fast Artificial Neural Network Tool 1.2 (FANN Tool 1.2) for neural network development, Waikato Environment for Knowledge 3.8.4 Analysis (WEKA 3.8.4) for feature selection, and IBM SPSS 29.0, a software application designed for statistical analysis and data management, for performing correlation analysis. To elaborate, FANN Tool 1.2 facilitated the implementation of various NN libraries. IBM SPSS 29.0 in conjunction with WEKA 3.8.4 facilitated the screening of variables. Essentially, FANN Tool 1.2 generated an array of distinct ANN models. IBM SPSS 29.0 was used for data description and correlation analysis, enabling the identification and ranking of independent variables based on their correlation coefficients’ predictive capability. Subsequently, the WEKA 3.8.4 application pinpointed a subset of variables within the group of highly correlated variables, as identified by the correlation analysis [40]. The methodological framework encompassed the following stages:
- Stage 1.
- Consideration of 31 selected WWTPs and collection of the relevant data.
- Stage 2.
- Development of a suitable SPSS database that encompasses all types of variables (quantitative and qualitative).
- Stage 3.
- Descriptive statistics of the variables.
- Stage 4.
- Correlation analysis was conducted between the independent variables and EC. The analysis was conducted separately for quantitative as well as for quantitative and qualitative in type variables.
- Stage 5.
- Creation of a ranked list of variables, ordered in descending correlation values for potential input neurons.
- Stage 6.
- Proposal of NN models utilizing the FANN Tool 1.2 application. The NNs were formulated by initially incorporating the most highly correlated variable, followed by sequential addition of variables from the ranked list (stage 5), based on their correlation degree.
- Stage 7.
- Further selection of the highly correlated variables using the WEKA 3.8.4 software, leading to the identification of the most effective subset of variables for input into the NN models.
- Stage 8.
- Proposal of neural networks, utilizing FANN Tool 1.2, to forecast EC in WWTP projects using the subset of variables found in stage 7.
3.2. Model Structure
An SPSS database was created, encompassing all variables. These could be categorized as either quantitative, represented by numerical values, or qualitative, characterized by ordinal values. Table 1 presents the variables at hand:
The description of the examined variables are as follows:
- Flow rate: the average daily incoming flow rate, measured in cubic meters per day (m3/d).
- Treatment capacity: the maximum amount of the population equivalent (p.e.) of wastewater the facility can effectively process per day.
- Served population: the daily average of equivalent population for which the WWTP provides wastewater treatment services.
- Influent load: the daily average of organic pollution entering the treatment plant, measured in terms of biochemical oxygen demand over a five-day period (BOD5/d).
- Energy consumption: the daily average amount of energy used by the treatment plant, measured in kilowatt-hours per day (kWh/d).
- Aeration: this variable takes on values ranging from 1 to 3 (ordinal values), determined by the aeration process of wastewater treatment (surface aeration = 1, diffusion = 2, surface aeration and diffusion = 3).
- Wastewater treatment line: the variable’s value ranges from 1 to 9 (ordinal values), depending on the wastewater treatment line stages (Table 2).
- Sludge treatment line: the variable’s value ranges from 1 to 7 (ordinal values), depending on the sludge treatment line stages (Table 3).
3.3. Sample and Database Description
The database encompasses data from 31 municipal WWTPs currently in operation across Greece all of which employ the activated sludge treatment method. Wastewater treatment facilities are subject to the conditions of the Mediterranean climate, which include mild wet winters and warm to hot, dry summers [42]. Out of the 31 WWTPs recorded, 12 of them are associated with small-scale facilities serving populations of up to 10,000 p.e. Additionally, 12 out of the 31 WWTPs are dedicated to medium-sized plants catering to populations ranging from 10,000 to 100,000 p.e. Finally, 7 out of the 31 WWTPs are associated with large-scale facilities serving populations exceeding 100,000 p.e. The 31 facilities encompass treatment capacities ranging from a few hundred equivalent residents to as high as 4,000,000, collectively exceeding a total treatment capacity of 6,000,000 equivalent residents. This indicates that they encompass a significant proportion of the served population in Greece. The sample displays significant diversity, encompassing WWTPs of varying scales, serving populations from small-scale facilities to large-scale plants, and featuring treatment capacities ranging from a few hundred equivalent residents to millions. The data for the database were sourced from multiple channels, including the National WWTPs Operation Monitoring Database in Greece [43], and Master’s thesis works [44,45,46]. Additionally, we enriched this dataset through direct interactions with the responsible authorities overseeing WWTPs. Specifically, data were extracted for 25 WWTPs from the thesis works. For the additional six WWTPs, data were collected by the author of this study using the National WWTPs Operation Monitoring Database in Greece and by contacting the relevant responsible authorities. The National WWTPs Database was also used to fill in data gaps in the information obtained from the aforementioned thesis. Selection criteria for inclusion in the database were primarily predicated on data availability and uniformity to facilitate the creation of a comprehensive dataset. This selection process ensured that quantitative and qualitative data of a consistent nature could be gathered for these projects. Subsequently, an SPSS database was generated to facilitate the ensuing analysis. This database encompassed 31 distinct cases, representing individual projects, and featured 8 variables that collectively covered data commonly available across all projects. These variables were recorded as quantitative and qualitative. Descriptive statistics of the sample are included in Table 4. Figure 2 illustrates the variations in energy consumption across different WWTPs in Greece.
3.4. Correlation Analysis for Quantitative Variables
The SPSS database was used to find the correlations among independent quantitative variables and EC. The FANN tool demonstrates greater reliability when applied to quantitative variables rather than qualitative ones. Subsequently, based on the results of the correlation analysis, a series of neural networks were generated and employed, in order to create suitable models for the forecast of EC. According to Field [47], Pearson correlation coefficient and the significance value are the indicators for evaluating the results of the correlation analysis. The Pearson correlation coefficient takes on values close to 1 for strong relationships and −1 for adverse strong relationships. A correlation of 0 implies no relationship whatsoever. Typically, a Pearson correlation coefficient ranging from 0.3 to 0.5 is deemed moderate, while a coefficient exceeding 0.5 is categorized as a strong correlation. Furthermore, significance values less than 0.05 indicate strong correlations, while those ranging between 0.05 and 0.06 demonstrate the tendency to correlate. When the significance factor falls below 0.01 (p < 0.01), it is denoted by **, and when it ranges between 0.01 and 0.05 (0.01 < p < 0.05), it is denoted by *. Table 5 and Figure 3 depict the results meeting the previously outlined criteria.
A brief examination of the correlation analysis results reveals a strong correlation between all the independent variables and EC. More specifically, EC is associated with the following variables in descending order of correlation:
- Treatment capacity;
- Flow rate;
- Influent load;
- Served population.
The findings align with expectations and make sense.
3.5. Correlation Analysis—Quantitative and Qualitative Variables
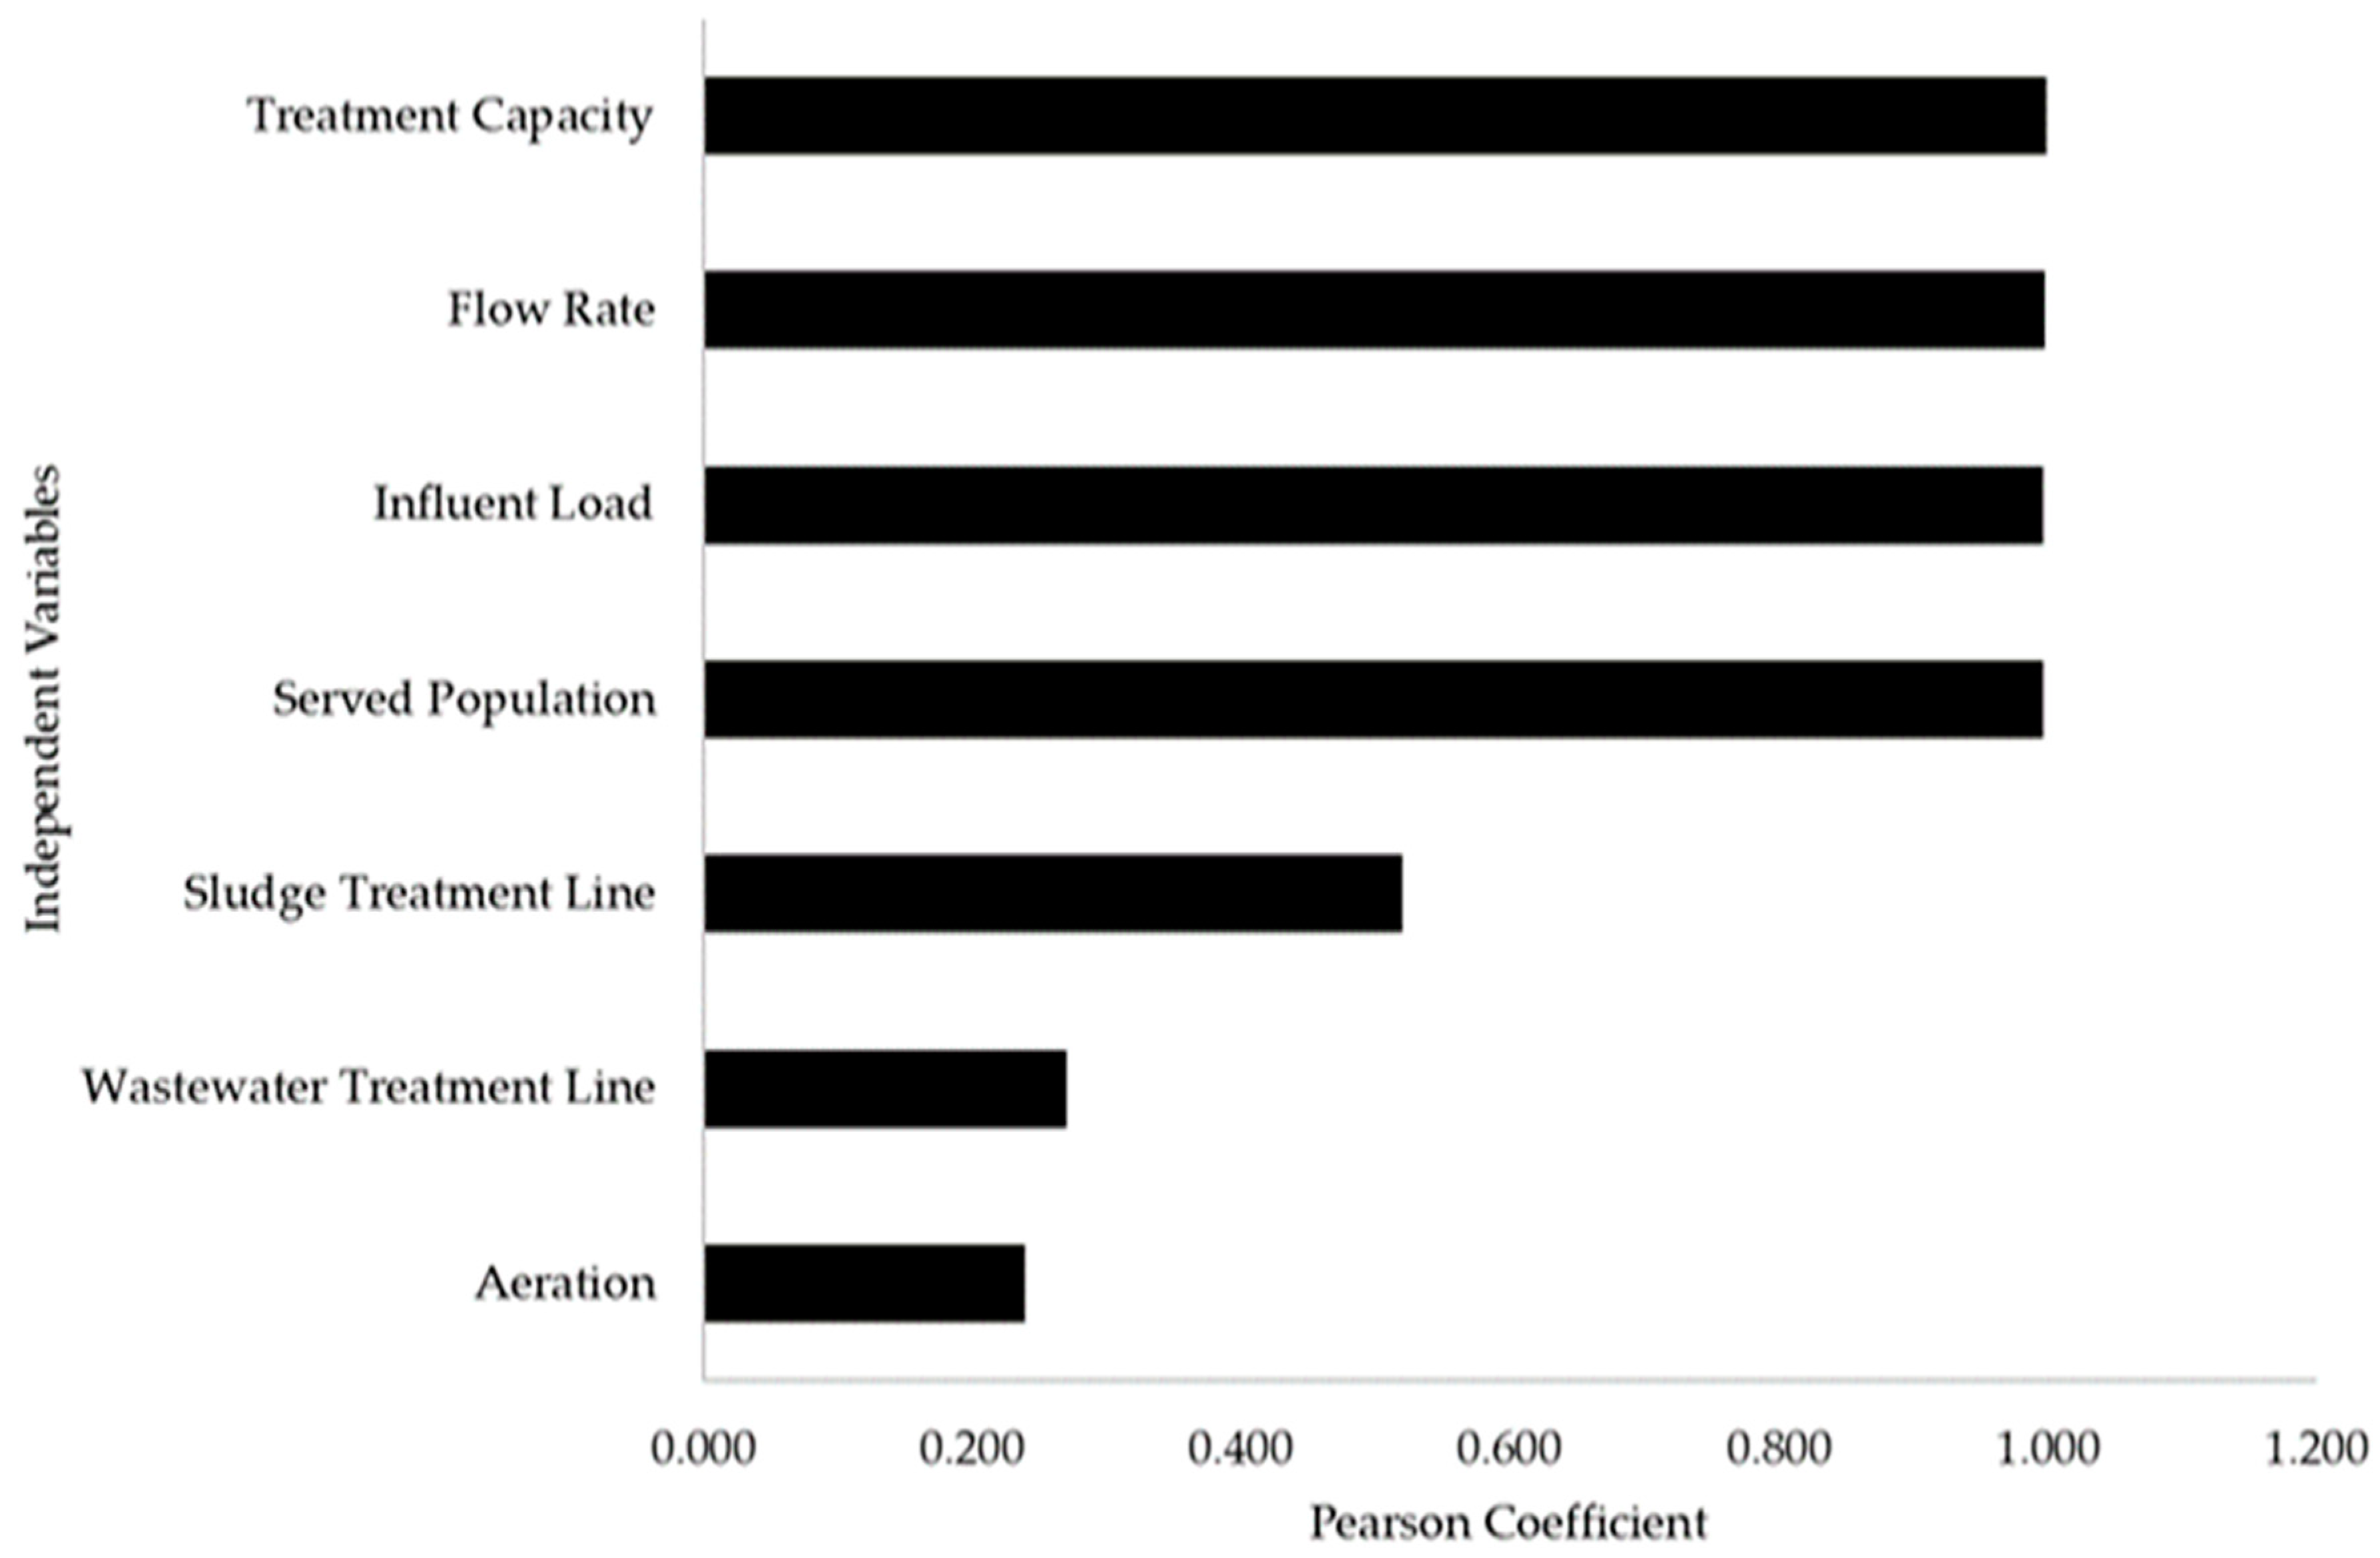
This time, the qualitative variables were also included, as depicted in Table 6 and Figure 3. The following list represents their ranked order according to correlation coefficients:
- Treatment capacity;
- Flow rate;
- Influent load;
- Served population;
- Sludge treatment line;
- Wastewater treatment line;
- Aeration.
The findings align with expectations and make sense.
3.6. Neural Network Development
The NNs were created using the FANN Tool 1.2 application, which is freely available software. Users have the option to choose one of the following learning algorithms: FANN Train Incremental (gradual increase), FANN Train Batch (clustering), FANN Train Rprop (Resilient backpropagation), and FANN Train Quickprop [48].
The fundamental operations provided by the software include:
- NN → Detect → Optimum training algorithm: Each available training algorithm is applied for multiple epochs. All other parameters are fixed, and the weight initialization is identical. The training algorithm that yields the lowest MSE is selected [49].
- NN → Detect → Optimum activation functions: Each available activation function is applied for multiple epochs. All other parameters are fixed, and the weight initialization is identical. The activation function that results in the lowest MSE is chosen [49].
- NN → Training → Normal: training with a fixed topology: Neural network’s size and topology are predetermined, and training adjusts the weights to reduce the difference between the desired output values and the actual output values [49].
- Neural network → Train → Cascade: Evolving topology training. Training begins with an empty ANN, containing only input and output neurons. Hidden neurons and connections are dynamically added during the training process, aiming to achieve the same objective as fixed-topology training [49].
The current research also aims to identify the most effective input variable combinations to optimize prediction accuracy. Concerning the neural network structure and associated equations, the application is responsible for searching and identifying them to establish the best design and parameter settings, employing its ‘cascade’ function each time.
3.7. Neural Network Models Based on Quantitative Variables
Table 5 displays the available variables pool for constructing NN models for forecasting EC. NN models are presented in Table 7, including their input variables and the corresponding MSE. These models are arranged in ascending order based on their MSE values. The first model to be implemented used as a single input neuron the top correlated variable. Subsequent models were created by adding every time a new, additional, variable, following the ranking based on correlation coefficient. Table 7 displays the resulting models.
The top-performing model comprises all the quantitative variables, specifically treatment capacity, flow rate, influent load, and served population.
3.8. Neural Network Models Based on Both Quantitative and Qualitative Variables
The order of variables from ‘treatment capacity’ to ‘served population’ mirrors the ranking determined through the corresponding correlation analysis. The models used in the previous tests remain unchanged. The research focused only on the ‘sludge treatment’ variable and the combination with the rest of quantitative independent variables. It is important to mention that the variables of ‘wastewater treatment line’ and ‘aeration’ display a Pearson correlation coefficient of less than 0.3, along with a two-tailed significance greater than 0.05. As a result, they will not be incorporated into the NN models. Table 8 includes the proposed models. Figure 4 displays the MSE variations for both quantitative and qualitative variables.
Model 5, which incorporates the sole qualitative variable, ranks fourth in performance. This consists of the highest-ranked five variables according to their correlation ranking: treatment capacity, flow rate, influent load, served population, and sludge treatment line.
3.9. WEKA Software for Selecting Attributes
WEKA is a popular open-source software tool used for data mining and machine learning tasks. WEKA offers a range of tools for tasks such as data preprocessing, regression, classification, clustering, association rule mining, and data visualization. Furthermore, it serves as an effective platform for the development of novel machine learning methodologies [50].
The WEKA 3.8.4 software was utilized to discover subsets of crucial variables within the variables. The evaluator chosen was ‘CfsSubsetEval-P1-E1’, and the selected search method was ‘BestFirst-D1-N5’. This analysis considered the four most correlated variables: treatment capacity, flow rate, influent load and served population. WEKA identified two attributes: treatment capacity and flow rate. These two chosen attributes were previously utilized as input neurons in Model 3, as shown in Table 7 and Table 8. The application of this NN resulted in an MSE equal to 9.32792 × 10⁻⁵. This makes it the third-best model.
3.10. Neural Network Architecture
Table 9 depicts information about the neural network configuration. More specifically:
- Model 1 is composed of 11 layers: an input layer with 4 neurons (treatment capacity, flow rate, influent load, served population); 9 hidden layers; and an output layer with a single neuron, the EC. The NN uses the FANN_TRAIN_RPROP training algorithm. The output activation function is FANN_SIGMOID_SYMMETRIC, while the activation function used in hidden layers is FANN_ELLIOT_SYMMETRIC.
- Model 2 is composed of 12 layers: an input layer with 3 neurons (treatment capacity, flow rate, influent load); 10 hidden layers; and an output layer with a single neuron, the EC. The NN uses the FANN_TRAIN_RPROP training algorithm. The output activation function is FANN_SIN_SYMMETRIC, while the activation function used in hidden layers is FANN_COS_SYMMETRIC.
- Model 3 is composed of eight layers: an input layer with two neurons (treatment capacity, flow rate); six hidden layers; and an output layer with a single neuron, the EC. The NN uses the FANN_TRAIN_RPROP training algorithm. The output activation function is FANN_SIGMOID_SYMMETRIC_STEPWISE, while the activation function used in hidden layers is FANN_SIGMOID_STEPWISE.
- Model 4 is composed of two layers: an input layer with one neuron (treatment capacity), and an output layer with a single neuron, the EC. The NN uses the FANN_TRAIN_RPROP training algorithm. The output activation function is FANN_ELLIOT-SYMMETRIC.
- Model 5 is composed of seven layers: an input layer with five neurons (treatment capacity, flow rate, influent load, served population, sludge treatment); five hidden layers; and an output layer with a single neuron, the EC. The NN uses the FANN_TRAIN_RPROP training algorithm. The output activation function is FANN_SIN_SYMMETRIC, while the activation function used in hidden layers is FANN_GAUSSIAN.
3.11. Discussion
In this paper, a methodological approach was employed to construct efficient and reliable NN models for predicting the energy consumption (EC) of WWTPs based in Greece.
Concerning the sample and database, the treatment capacity statistics reveal a wide range of capacities among wastewater treatment plants, with an average capacity of approximately 291,632.26 p.e. The statistics indicate significant diversity in treatment infrastructure within our study area. The served population statistics demonstrate the substantial reach of wastewater treatment plants, serving an average of around 192,626.16 p.e per plant. The descriptive statistics underscore the varying demands and demographics across the communities served by these facilities.
The methodology employed involved conducting a correlation analysis using the IBM SPSS 29.0 software. The primary objective was to assess the extent of correlation between the independent variables (both quantitative and qualitative) with the dependent variable of EC. Concerning the outcomes of the correlation analysis, significant attention was given to the acquired Pearson coefficient values and their comparative evaluations.
Regarding the correlation of the quantitative independent variables with the dependent variable of EC, what has emerged is the very high degree of correlation they have. The results reveal high correlation coefficients for all the independent variables: treatment capacity (0.999 **), flow rate (0.998 **), influent load (0.997 **), and served population (0.997 **). The double asterisks (**) suggest a high degree of statistical significance, indicating strong relationships between these independent variables and EC. The strong correlations indicate that each of the independent variables (treatment capacity, flow rate, influent load, and served population) has a significant impact on EC. This suggests that changes or variations in these factors will likely result in corresponding changes in EC by wastewater treatment plants. All four of the independent variables—treatment capacity, flow rate, influent load, and served population—exhibit nearly identical correlation coefficients (0.999, 0.998, and 0.997).
When considering the qualitative independent variables group, the results reveal that among the three qualitative variables, only the sludge treatment line (0.520**) exhibits a strong correlation with EC, while the wastewater treatment line and aeration method do not demonstrate significant correlations. Furthermore, the sludge treatment line is the only variable with a high degree of statistical significance, indicating a strong relationship with EC. This suggests that changes or variations in the sludge treatment line are likely to result in corresponding changes in EC in wastewater treatment plants.
Following the described methodological approach, the next step involved the creation of NN models. Initially, models were constructed using quantitative variables. The best-performing model incorporates the top four most correlated variables: treatment capacity, flow rate, influent load, and served population. The next most efficient model comprises the three most correlated variables: treatment capacity, flow rate, and influent load. The third most efficient model includes the two most correlated variables: treatment capacity and flow rate.
In models that include quantitative and mixed quantitative and qualitative variables, the four most highly correlated variables remain the same across both scenarios. Only one qualitative variable, the sludge treatment line, is added, ranking as the fifth most correlated with EC. A new efficient model was identified, incorporating the top four quantitative independent variables and the one qualitative variable based on their correlation rankings, namely treatment capacity, flow rate, influent load, served population, and sludge treatment line. In terms of MSE, this model ranked fourth in performance compared to the previously mentioned ones.
The WEKA 3.8.4 application identified a potential input neuron subset for the FANN Tool. Notably, the subset included the variables of ‘treatment capacity’ and ‘flow rate’. The resulting model was constructed using a combination of variables that had already been used, specifically the one that gave the third-best model. This indicates that the application of WEKA did not yield a new, more efficient model containing previously unused input variable combinations.
In general, the models created are considered highly reliable in their EC predictions, as all of them exhibited very low MSE values, typically on the order of 10−5.
Regarding the architecture of neural network models, it emerges that all neural networks (NNs) have the same output layer with one neuron for energy consumption, and they all use the FANN-TRAIN-RPROP training algorithm. This advanced batch training algorithm consistently delivers good results for most problems [49]. Overall, these models demonstrate the versatility of NN in accommodating different input combinations and layer compositions to address the prediction of EC. The selection of activation functions plays a crucial role in shaping the network’s behavior and its ability to learn and generalize from the data. Activation functions play a crucial role in neural networks, as they introduce nonlinearity into the model, allowing it to capture complex relationships in the data. The choice of activation functions, such as FANN_SIGMOID, FANN_ELLIOT, FANN_SIN, and others, can significantly impact the network’s learning capability and its ability to adapt to different types of data.
The same methodology implemented in this research has been successfully used for estimating attributes of construction projects. More specifically, this method has been employed to predict the actual construction cost of highway projects, resulting in neural network models with an MSE on the order of 10−5 [39]. It has also been applied to predict both the actual construction cost and duration of bridge projects, yielding neural network models with an MSE on the order of 10−5 [40]. Furthermore, it has been utilized to predict the actual duration of highway projects, resulting in neural network models with a MSE on the order of 10−6 [41]. The methodology is versatile and can be broadly applied for predicting various attributes of projects. It has demonstrated its effectiveness in estimating costs, durations, and EC for different types of construction projects, indicating its potential for broader use in the prediction of project attributes.
In the context of estimating the energy consumption of WWTPs using machine learning, there are relatively few available studies in the international literature. The current study is pioneering in that it incorporates qualitative variables, such as wastewater treatment line, sludge treatment line, and aeration, as independent variables for predicting EC in WWTPs using machine learning. To enable a meaningful comparison between the results of this study and those of other research utilizing different machine learning methods, it is imperative that both studies employ the same variables and database. Therefore, in a potential extension of this study, it may be beneficial to explore the use of alternative machine learning methods for predicting energy consumption (EC).
4. Conclusions
This paper addressed the problem of predicting the EC of WWTPs. After collecting data from 31 WWTPs operating in Greece and applying IBM SPSS 29.0 for correlation analysis and WEKA 3.8.4 software, it identified critical factors affecting EC of WWTPs. Additionally, several NN models were proposed to predict EC based on available data.
The results of this study can inform decision making and promote energy efficiency in WWTPs. They can also be valuable during the planning stage of a WWTP. By accurately estimating the required EC, the influential factors can be optimized, resulting in cost and energy savings within the operational systems. These findings are valuable for WWTP operating authorities, project-awarding authorities, contractors, software development companies, and researchers.
Today, the synergy of technological progress and substantial managerial expertise in modern and intricate projects empowers the effective operational management of existing projects and the precise planning of new projects during their early stages. Through this ΝΝ approach, it becomes possible to predict EC, employing customized models based on historical data. The primary objective is to provide users with the ability to easily analyze and investigate the EC of a WWTP using a simple model, incorporating values of variables known during plant operation and even before project construction when we are in the planning phase. Each contractor can apply the NN with their organization’s historical project data and develop customized models for predicting EC.
The constructed NN models assist stakeholders in obtaining a swift and precise estimation of the EC of either existing WWTPs or plants in the planning stages, utilizing data that are known even from the project conception phase. Swift and accurate EC prediction benefits operational authorities by enabling precise cost management, efficient resource planning, and environmental optimization. They enable precise cost management, ensuring that funds are allocated efficiently for the energy needs of WWTPs. Additionally, EC predictions support efficient resource planning, allowing operators to optimize energy resource allocation based on anticipated demand, thus reducing waste. Moreover, these predictions contribute to environmental optimization by minimizing the carbon footprint of WWTPs and reducing their environmental impact through judicious energy use. This integrated approach enhances operational efficiency, environmental responsibility, and cost-effectiveness for WWTPs. Long-term forecasts aid infrastructure planning and compliance with energy efficiency regulations. They help in planning for the future needs of the WWTPs, such as expansion or upgrades, by providing insights into the expected energy demands. Additionally, these forecasts assist in ensuring compliance with energy efficiency regulations, as WWTPs can prepare to meet or exceed efficiency standards. Furthermore, the forecasts inform investment decisions for energy-saving technologies by providing valuable insights into the future energy needs of WWTPs. By having a clear picture of their anticipated energy demand, the operational authorities can make informed investment decisions regarding energy-saving technologies. In emergencies, anticipated demand guides backup power preparations, ensuring essential services. By knowing the anticipated energy demand, the operational authorities can plan and deploy backup power sources effectively, preventing disruptions in wastewater treatment operations. This ensures the protection of public health and the environment during emergencies. Overall, energy predictions empower WWTP operators to work sustainably, economically, and efficiently. Accurate EC predictions in WWTPs are also vital for project-awarding authorities. They inform decision making at all project stages, estimating long-term costs, evaluating cost-effective contractor bids, ensuring energy efficiency compliance, and efficient funding allocation. The estimation of long-term costs can be conducted from the initial planning and design phases through construction and operation, assisting awarding authorities in allocating resources efficiently. Additionally, accurate EC predictions enable project-awarding authorities to effectively evaluate contractor bids by assessing whether the proposed costs align with the predicted energy consumption, helping them select the most cost-effective and reliable contractors. Also, by using the forecasts, project-awarding authorities can verify that proposed projects meet energy-efficient standards and align with sustainability objectives. By having precise EC predictions, project awarding authorities can allocate funding efficiently. They can distribute resources according to the expected energy needs, ensuring that projects remain economically viable while minimizing waste. Furthermore, these forecasts align projects with sustainability goals. After implementation, they become essential benchmarks for monitoring energy efficiency and project performance, ensuring economic viability and environmental responsibility. Predicting EC accurately in WWTPs using the constructed models of the present study provides contractors with numerous benefits. It enables precise bidding, efficient resource allocation, energy-efficient designs, regulatory compliance, risk mitigation, and improved client satisfaction. The precision in estimations helps contractors offer competitive bids closely aligned with actual energy costs, increasing their chances of winning contracts. It also aids them in effective resource allocation, ensuring optimal utilization of energy resources, materials, and labor to minimize waste and maximize efficiency. Accurate predictions for WWTP design prioritize energy efficiency by optimizing equipment, processes, and technologies, reducing energy consumption throughout the facility’s life. Contractors can design WWTPs that meet regulatory requirements, ensuring compliance and avoiding penalties. Accurate EC predictions assist contractors in identifying potential risks and challenges related to energy consumption early in the project, enabling the implementation of effective risk mitigation strategies. These predictions empower contractors to deliver cost-effective, environmentally responsible WWTP projects, contributing to project success and client satisfaction while minimizing operational risks. The utilization of the NN models of the present study offers researchers valuable tools for advancing various aspects of work. Researchers can explore and refine ΝΝ models, analyze data to uncover EC patterns, assess energy efficiency, and study the environmental impact of WWTPs. Regarding software development companies, the utilization of NN models for EC in WWTPs offers software opportunities to develop customized software solutions.
The primary strategy for advancing the current models is to continuously enhance the existing database. A larger sample size enhances the models’ reliability. Equally significant is the inclusion of supplementary variables in the analysis, such as climate conditions, influent characteristics, and operational parameters. These models’ outcomes can then be compared to derive valuable insights.
Regarding the prediction of EC, the preferred model is the quantitative version with the lowest MSE (8.99899 × 10⁻⁵). Shared variables in both models encompass treatment capacity, flow rate, influent load, and served population. These constitute the overall count of variables within the first model. The fewer variables needed, the more straightforward it becomes to record or gather the required data, simplifying the model’s implementation. Every variable is distinct. Each parameter is susceptible to external events. Considering this, the predictive variables can be ranked or evaluated based on their vulnerability or the risk associated with each variable. Consequently, the vulnerability of each generated model can also be assessed by measuring the vulnerability of each included variable.
The research methodology employed to identify the most effective variables and build suitable models can be applied and executed in various project types. The suggested models, particularly the most efficient, show considerable potential. The best model included the four independent variables mentioned earlier. These data are readily available, reliable, and entail low risk in the calculations. Simultaneously, these data are commonplace in all WWTPs. Based on the aforementioned factors, there is the belief that the suggested model has the potential for success in other WWTPs in Greece. However, it is prudent to note that expanding the number of projects used as training data could enhance the model’s predictive capacity and reliability. Additional research in this domain might emphasize the development and evaluation of outcomes using alternative methods and approaches. An intriguing comparison would involve assessing the results relative to those produced by other ML methods, such as RF, SVM, regression methods, and Monte Carlo. Moreover, to encompass any trends and correlations that may not have been identified in this study, it is essential to include a more extensive dataset of projects in future research. Furthermore, a comprehensive analysis could be achieved by incorporating additional variables, such as climate parameters, influent characteristics, and operational parameters. Additionally, this research could be extended by exploring additional combinations of highly correlated independent input variables with the dependent variable of energy consumption, generating new neural network models. For instance, combinations involving the second, third, fourth, and fifth most correlated variables, or just the third and fourth, or the second and fourth, among others, could be considered. This extension could yield new models, some of which may prove to be more efficient than those discovered in the current research. This study identified the optimal combination of input variables and achieved the best prediction results among the combinations generated through the specific methodological approach followed. Lastly, it is important to emphasize that when creating neural network models, the responsibility of selecting and constructing the most suitable neural network structure lies with the application itself. In this case, the cascade method was selected for designing the NN. There is ample room for the experimentation of users to propose their own network designs, which could potentially result in even more high-performing models.
The limitations of this study primarily revolve around the scope of the data source, which is confined to Greece, and the relatively small number of cases in the dataset, even if they represent 60% of the Greek population. Firstly, the limited geographical focus on Greece raises questions about the generalizability of the models to other regions with different environmental and climatic conditions. WWTPs in other countries might exhibit distinct energy consumption patterns influenced by variations in climate, population density, or treatment methods. Secondly, the relatively small number of cases, while being a characteristic of the available dataset, may not encapsulate the full spectrum of factors influencing energy consumption. A larger dataset would potentially capture more diverse operational scenarios, which could enhance the robustness of the models. In addition, these limitations may influence the precision of the models when applied to WWTPs that differ significantly from those in Greece. However, despite these limitations, the models presented here still serve as valuable proof of concept and can potentially be used as a foundation for further research and model development in different geographical contexts. Future work should strive to collect more extensive and diverse datasets to ensure the generalizability and applicability of the models in broader global contexts.
Author Contributions
Conceptualization, L.A.; methodology, L.A. and P.K.; software, L.A. and P.K.; validation, L.A. and P.K.; formal analysis, L.A. and P.K.; investigation, L.A. and P.K.; resources, L.A. and P.K.; data curation, P.K.; writing—original draft preparation, P.K.; writing—review and editing, P.K. and L.A.; visualization, P.K.; supervision, L.A.; project administration, L.A.; funding acquisition, L.A. All authors have read and agreed to the published version of the manuscript.
Funding
This research received no external funding.
Data Availability Statement
The data presented in this study are available in the article.
Conflicts of Interest
The authors declare no conflict of interest.
References
- Alali, Y.; Harrou, F.; Sun, Y. Unlocking the potential of wastewater treatment: Machine learning based energy consumption prediction. Water 2023, 15, 2349. [Google Scholar] [CrossRef]
- Ahmad, T.; Chen, H. Utility companies’ strategy for short-term energy demand forecasting using machine learning based models. Sustain. Cities Soc. 2018, 39, 401–417. [Google Scholar] [CrossRef]
- Bagherzadeh, F.; Nouri, A.S.; Mehrani, M.J.; Thennadil, S. Prediction of energy consumption and evaluation of affecting factors in a full-scale WWTP using a machine learning approach. Process Saf. Environ. Prot. 2021, 154, 458–466. [Google Scholar] [CrossRef]
- Dai, W.; Xu, X.; Liu, B.; Yang, F. Toward energy-neutral wastewater treatment: A membrane combined process of anaerobic digestion and nitritation–anammox for biogas recovery and nitrogen removal. Chem. Eng. J. 2015, 279, 725–734. [Google Scholar] [CrossRef]
- Daw, J.; Hallett, K.; DeWolfe, J.; Venner, I. Energy Efficiency Strategies for Municipal Wastewater Treatment Facilities; National Renewable Energy Lab.: Golden, CO, USA, 2012. [Google Scholar] [CrossRef]
- Gikas, P. Towards energy positive wastewater treatment plants. J. Environ. Manag. 2017, 203, 621–629. [Google Scholar] [CrossRef] [PubMed]
- Shoener, B.D.; Bradley, I.M.; Cusick, R.D.; Guest, J.S. Energy positive domestic wastewater treatment: The roles of anaerobic and phototrophic technologies. Environ. Sci. Process. Impacts 2014, 16, 1204–1222. [Google Scholar] [CrossRef]
- Yan, P.; Qin, R.C.; Guo, J.S.; Yu, Q.; Li, Z.; Chen, Y.P.; Shen, Y.; Fang, F. Net-zero-energy model for sustainable wastewater treatment. Environ. Sci. Technol. 2017, 51, 1017–1023. [Google Scholar] [CrossRef]
- Scherson, Y.D.; Criddle, C.S. Recovery of freshwater from wastewater: Upgrading process configurations to maximize energy recovery and minimize residuals. Environ. Sci. Technol. 2014, 48, 8420–8432. [Google Scholar] [CrossRef]
- Community Research and Development Information Service (CORDIS)—European Commission, Standard Method and Online Tool for Assessing and Improving the Energy Efficiency of Wastewater Treatment Plants. 2017. (Online). Available online: https://cordis.europa.eu/project/id/649819 (accessed on 7 September 2023).
- Goldestein, R.; Smith, W. US electricity consumption for water supply & treatment-the next half century. Electr. Power Res. Inst. Water Sustain. 2002, 4, 1–14. [Google Scholar]
- Zhang, Z.; Kusiak, A.; Zeng, Y.; Wei, X. Modeling and optimization of a wastewater pumping system with data-mining methods. Appl. Energy 2016, 164, 303–311. [Google Scholar] [CrossRef]
- Plappally, A.K.; Lienhard, H. Energy requirements for water production, treatment, end use, reclamation, and disposal. Renew. Sustain. Energy Rev. 2012, 16, 4818–4848. [Google Scholar] [CrossRef]
- Wang, S.; Zou, L.; Li, H.; Zheng, K.; Wang, Y.; Zheng, G.; Li, J. Full-scale membrane bioreactor process WWTPs in East Taihu basin: Wastewater characteristics, energy consumption and sustainability. Sci. Total Environ. 2020, 723, 137983. [Google Scholar] [CrossRef]
- Siatou, A.; Manali, A.; Gikas, P. Energy consumption and internal distribution in activated sludge wastewater treatment plants of Greece. Water 2020, 12, 1204. [Google Scholar] [CrossRef]
- Rojas, J.; Zhelev, T. Energy efficiency optimisation of wastewater treatment: Study of ATAD. Comput. Chem. Eng. 2012, 38, 52–63. [Google Scholar] [CrossRef]
- Singh, P.; Carliell-Marquet, C.; Kansal, A. Energy pattern analysis of a wastewater treatment plant. Appl. Water Sci. 2012, 2, 221–226. [Google Scholar] [CrossRef]
- Awe, O.W.; Liu, R.; Zhao, Y. Analysis of energy consumption and saving in wastewater treatment plant: Case study from Ireland. J. Water Sustain. 2016, 6, 63–76. [Google Scholar] [CrossRef]
- Matos, C.; Pereira, S.; Amorim, E.V.; Bentes, I.; Briga-Sá, A. Wastewater and greywater reuse on irrigation in centralized and decentralized systems—An integrated approach on water quality, energy consumption and CO2 emissions. Sci. Total Environ. 2014, 493, 463–471. [Google Scholar] [CrossRef]
- Estrada, J.M.; Lebrero, R.; Quijano, G.; Kraakman, N.B.; Muñoz, R. Odour abatement technologies in WWTPs: Energy and economic efficiency. Sew. Treat. Plants 2020, 163–187. [Google Scholar]
- Picos-Benítez, A.R.; Martínez-Vargas, B.L.; Duron-Torres, S.M.; Brillas, E.; Peralta-Hernández, J.M. The use of artificial intelligence models in the prediction of optimum operational conditions for the treatment of dye wastewaters with similar structural characteristics. Process Saf. Environ. Prot. 2020, 143, 36–44. [Google Scholar] [CrossRef]
- Géron, A. Hands-On Machine Learning with Scikit-Learn, Keras and TensorFlow; O’Reilly Media, Inc.: Sebastopol, CA, USA, 2022. [Google Scholar]
- Bonescu, C.; Robescu, L.D.; Bondrea, D.A.; Măcinic, M.E. Study of energy consumption in a wastewater treatment plant using logistic regression. IOP Conf. Ser. Earth Environ. Sci. 2021, 664, 12054. [Google Scholar] [CrossRef]
- Żyłka, R.; Dąbrowski, W.; Malinowski, P.; Karolinczak, B. Modeling of electric energy consumption during dairy wastewater treatment plant operation. Energies 2020, 13, 3769. [Google Scholar] [CrossRef]
- Yang, X.; Wei, J.; Ye, G.; Zhao, Y.; Li, Z.; Qiu, G.; Li, F.; Wei, C. The correlations among wastewater internal energy, energy consumption and energy recovery/production potentials in wastewater treatment plant: An assessment of the energy balance. Sci. Total Environ. 2020, 714, 136655. [Google Scholar] [CrossRef] [PubMed]
- Yu, Y.; Zou, Z.; Wang, Z. Statistical regression modeling for energy consumption in wastewater treatment. J. Environ. Sci. 2019, 75, 201–208. [Google Scholar] [CrossRef] [PubMed]
- Zhang, S.; Wang, H.; Keller, A.A. Novel machine learning-based energy consumption model of wastewater treatment plants. ACS EST Water 2021, 1, 2531–2540. [Google Scholar] [CrossRef]
- Oulebsir, R.; Lefkir, A.; Safri, A.; Bermad, A. Optimization of the energy consumption in activated sludge process using deep learning selective modeling. Biomass Bioenergy 2020, 132, 105420. [Google Scholar] [CrossRef]
- Zhang, Z.; Zeng, Y.; Kusiak, A. Minimizing pump energy in wastewater processing plant. Energy 2012, 47, 505–514. [Google Scholar] [CrossRef]
- Qiao, J.; Zhou, H. Modeling of energy consumption and effluent quality using density peaks-based adaptive fuzzy neural network. IEEE/CAA J. Autom. Sin. 2018, 5, 968–976. [Google Scholar] [CrossRef]
- Borzooei, S.; Miranda, G.H.B.; Abolfathi, S.; Scibilia, G.; Meucci, L.; Zanetti, M.C. Application of unsupervised learning and process simulation for energy optimization of a WWTP under various weather conditions. Water Sci. Technol. 2020, 81, 1541–1551. [Google Scholar] [CrossRef]
- Torregrossa, D.; Leopold, U.; Hernández-Sancho, F.; Hansen, J. Machine learning for energy cost modelling in wastewater treatment plants. J. Environ. Manag. 2018, 223, 1061–1067. [Google Scholar] [CrossRef]
- Torregrossa, D.; Schutz, G.; Cornelissen, A.; Hernández-Sancho, F.; Hansen, J. Energy saving in WWTP: Daily benchmarking under uncertainty and data availability limitations. Environ. Res. 2016, 148, 330–337. [Google Scholar] [CrossRef]
- Ramli, N.A.; Hamid, M. Data based modeling of a wastewater treatment plant by using machine learning methods. J. Eng. Technol. 2018, 6, 14–21. [Google Scholar]
- Oliveira, P.; Fernandez, B.; Analide, C.; Novais, P. Forecasting energy consumption of wastewater treatment plants with a transfer learning approach for sustainable cities. Electronics 2021, 10, 1149. [Google Scholar] [CrossRef]
- Yusuf, J.; Faruque, R.B.; Hasan, A.J.; Ula, S. Statistical and Deep Learning Methods for Electric Load Forecasting in Multiple Water Utility Sites. In Proceedings of the 2019 IEEE Green Energy and Smart Systems Conference (IGESSC), Long Beach, CA, USA, 4–5 November 2019. [Google Scholar]
- Das, A.; Kumawat, P.K.; Chatuvredi, N.D. A Study to Target Energy Consumption in Wastewater Treatment Plant using Machine Learning Algorithms. Comput. Aided Chem. Eng. 2021, 50, 1511–1516. [Google Scholar] [CrossRef]
- Juszczyk, M. The challenges of nonparametric cost estimation of construction works with the use of artificial intelligence tools. Procedia Eng. 2017, 196, 415–422. [Google Scholar] [CrossRef]
- Aretoulis, G.N. Neural network models for actual prediction in Greek public highway projects. Int. J. Proj. Organ. Manag. 2019, 11, 41–64. [Google Scholar] [CrossRef]
- Karadimos, P.; Anthopoulos, L. Neural network models for actual cost and actual duration estimation in construction projects: Findings from Greece. Int. J. Struct. Constr. Eng. 2021, 15, 250–261. [Google Scholar]
- Titirla, M.; Aretoulis, G. Neural network models for actual duration of Greek highway projects. J. Eng. Des. Technol. 2019, 17, 1323–1339. [Google Scholar] [CrossRef]
- Lionello, P.; Malanotte-Rizzoli, P.; Boscolo, R.; Alpert, P.; Artale, V.; Li, L.; Luterbacher, J.; May, W.; Trigo, R.; Tsimplis, M.; et al. The Mediterranean climate: An overview of the main characteristics and issues. Dev. Earth Environ. Sci. 2006, 4, 1–26. [Google Scholar] [CrossRef]
- Wastewater Treatment Plants-Operation Monitoring Database. Special Water Secretariat. (Εγκαταστάσεις Επεξεργασίας Λυμάτων-Βάση Δεδομένων Παρακολούθησης Λειτουργίας, Ειδική Γραμματεία Υδάτων). Available online: http://84.205.254.113/Services/Pages/Browse.aspx (accessed on 3 September 2023).
- Gkoliopoulos, N. Assessment and Recording of Energy Consumption and Greenhouse Gas Emissions in Wastewater Treatment Plants in Greece. Master’s Thesis, National Technical University of Athens, Athens, Greece, 2019. (Ν.Γκολιόπουλος, Εκτίμηση και καταγραφή ενεργειακής κατανάλωσης και εκπομπών αερίων του θερμοκηπείου σε εγκαταστάσεις επεξεργασίας λυμάτων στην Ελλάδα, Μεταπτυχιακή διατριβή, Εθνικό Μετσόβιο Πολυτεχνείο: Aθήνα, Ελλάδα, 2019). [Google Scholar] [CrossRef]
- Kounadis, C. Estimation of Energy Consumption and Operational Cost of Small and Medium-Scale Wastewater Treatment Plants. Master’s Thesis, National Technical University of Athens, Athens, Greece, 2018. (X. Κουνάδης, Εκτίμηση ενεργειακής κατανάλωσης και λειτουργικού κόστους εγκαταστάσεων επεξεργασίας λυμάτων μικρής και μεσαίας κλίμακας, Μεταπτυχιακή διατριβή, Εθνικό Μετσόβιο Πολυτεχνείο: Aθήνα, Ελλάδα, 2018). [Google Scholar] [CrossRef]
- Dimopoulou, A.I. Comparative Assessment of Energy Consumption and Greenhouse Gas Emissions in Wastewater Treatment Plants (WWTPs); National Technical University of Athens: Athens, Greece, 2011; (A.Ι. Δημοπούλου, Συγκριτική αξιολόγηση ενεργειακής κατανάλωσης και εκπομπών αερίου θερμοκηπίου σε εγκαταστάσεις επεξεργασίας λυμάτων (ΕΕΛ), Μεταπτυχιακή διατριβή, Εθνικό Μετσόβιο Πολυτεχνείο: Aθήνα, Ελλάδα, 2011). [Google Scholar] [CrossRef]
- Field, A. Discovering Statistics Using SPSS, 3rd ed.; Sage Publications: London, UK, 2009. [Google Scholar]
- Glymis, E.; Kanelakis, A.; Aretoulis, G.; Mastoras, T. Predicting highway projects’ actual duration using neural networks. In Proceedings of the Joint Conference on Computing in Construction (JC3), Heraklion, Greece, 4–7 July 2017. [Google Scholar]
- FANN Tool Users Guide. Available online: https://www.slideshare.net/bluekid/fann-tool-usersguide (accessed on 4 September 2023).
- WEKA. Available online: https://www.cs.waikato.ac.nz/ml/weka/index.html (accessed on 4 September 2023).
Figure 1.
Methodological approach (inspired by [39]).
Figure 1.
Methodological approach (inspired by [39]).

Figure 2.
Energy consumption across different WWTPs in Greece.

Figure 3.
Pearson coefficients for quantitative and qualitative variables.

Figure 4.
Model performance: MSE analysis.


Table 1.
Quantitative and qualitative variables.
| Quantitative Variables | Qualitative Variables |
|---|---|
| Flow rate (m3/d) | Aeration |
| Treatment capacity (population equivalent—p.e.) | Wastewater treatment line |
| Served population (population equivalent—p.e.) | Sludge treatment line |
| Influent load (BOD5/d) | |
| Energy consumption (kWh/d) |
Table 2.
Stages of wastewater treatment line and variable values.
| Stages | Value |
|---|---|
| Pre-Treatment, Secondary Treatment, Disinfection–Chlorination | 1 |
| Pre-Treatment, Primary Treatment, Secondary Treatment, Disinfection–Chlorination | 2 |
| Pre-Treatment, Secondary Treatment, Nitrogen Removal, Disinfection–Chlorination | 3 |
| Pre-Treatment, Primary Treatment, Secondary Treatment, Nitrogen Removal, Phosphorus Removal | 4 |
| Pre-Treatment, Primary Treatment, Secondary Treatment, Nitrogen Removal, Disinfection–Chlorination | 5 |
| Pre-Treatment, Secondary Treatment, Nitrogen Removal, Phosphorus Removal, Disinfection–Chlorination | 6 |
| Pre-Treatment, Primary Treatment, Secondary Treatment, Nitrogen Removal, Phosphorus Removal, Disinfection–Chlorination | 7 |
| Pre-Treatment, Secondary Treatment, Further Process—Rotating Discs, Nitrogen Removal, Phosphorus Removal, Disinfection–Chlorination | 8 |
| Pre-Treatment, Primary Treatment, Secondary Treatment, Further Process—Sand Filters, Nitrogen Removal, Phosphorus Removal, Disinfection Chlorination, UV Radiation | 9 |
Table 3.
Stages of sludge treatment line and variable values.
| Stages | Value |
|---|---|
| Thickening | 1 |
| Dewatering | 2 |
| Thickening, Dewatering | 3 |
| Stabilization, Dewatering | 4 |
| Thickening, Stabilization, Dewatering | 5 |
| Thickening, Digestion, Dewatering | 6 |
| Thickening, Stabilization, Dewatering, Thermal Drying | 7 |
Table 4.
Descriptive statistics.
| Variables | N | Range | Minimum | Maximum | Sum | Mean |
|---|---|---|---|---|---|---|
| Flow Rate (m3/d) | 31 | 726,751.00 | 50.00 | 726,801.00 | 1,174,349.00 | 37,882.23 |
| Treatment Capacity (p.e.) | 31 | 5,628,500.00 | 1500.00 | 5,630,000.00 | 9,040,600.00 | 291,632.26 |
| Served Population (p.e.) | 31 | 3,646,138.00 | 250.00 | 3,646,388.00 | 5,971,411.00 | 192,626.16 |
| Influent Load (BOD5/d) | 31 | 218,768.00 | 15.00 | 218,783.00 | 358,286.00 | 11,557.62 |
| Aeration | 31 | 2.00 | 1.00 | 3.00 | 45.00 | 1.45 |
| Wastewater Treatment Line | 31 | 8.00 | 1.00 | 9.00 | 155.00 | 5.00 |
| Sludge Treatment Line | 31 | 6.00 | 1.00 | 7.00 | 116.00 | 3.74 |
| Energy Consumption (kWh/d) | 31 | 294,293.67 | 179.33 | 294,473.00 | 494,116.37 | 15,939.24 |
Table 5.
Correlations of quantitative variables with energy consumption.
| A/A | Quantitative Variables | Pearson Coefficient |
|---|---|---|
| 1 | Treatment Capacity | 0.999 ** |
| 2 | Flow Rate | 0.998 ** |
| 3 | Influent Load | 0.997 ** |
| 4 | Served Population | 0.997 ** |
Note: N = 31; ** p < 0.01, two-tailed significance.
Table 6.
Correlations of quantitative and qualitative variables with energy consumption.
| A/A | Quantitative Variables | Pearson Coefficient |
|---|---|---|
| 1 | Treatment Capacity | 0.999 ** |
| 2 | Flow Rate | 0.998 ** |
| 3 | Influent Load | 0.997 ** |
| 4 | Served Population | 0.997 ** |
| 5 | Sludge Treatment Line | 0.520 ** |
| 6 | Wastewater Treatment Line | 0.271 |
| 7 | Aeration | 0.240 |
Note: N = 31; ** p < 0.01, two-tailed significance.
Table 7.
NN models based on quantitative variables.
| Model | Combination | Input Variables | MSE |
|---|---|---|---|
| 1 | All variables | Treatment Capacity, Flow Rate, Influent Load, Served Population | 8.99899 × 10⁻⁵ |
| 2 | Top three | Treatment Capacity, Flow Rate, Influent Load | 9.09519 × 10⁻⁵ |
| 3 | Top two | Treatment Capacity, Flow Rate | 9.32792 × 10⁻⁵ |
| 4 | Single top correlated | Treatment Capacity | 9.71212 × 10⁻⁵ |
Table 8.
NN based on both quantitative and qualitative variables.
| Model | Combination | Input Variables | MSE |
|---|---|---|---|
| 1 | All variables | Treatment Capacity, Flow Rate, Influent Load, Served Population | 8.99899 × 10⁻⁵ |
| 2 | Top three | Treatment Capacity, Flow Rate, Influent Load | 9.09519 × 10⁻⁵ |
| 3 | Top two | Treatment Capacity, Flow Rate | 9.32792 × 10⁻⁵ |
| 5 | Top five | Treatment Capacity, Flow Rate, Influent Load, Served Population, Sludge Treatment Line | 9.60919 × 10⁻⁵ |
| 4 | Single top correlated | Treatment Capacity | 9.71212 × 10⁻⁵ |
Table 9.
Neural network configuration.
| Model. No | Input Layer—Neurons No | No of Hidden Layers | Best Train Algorithm | Activation Functions Used in Hidden Layers | Output Activation Function |
|---|---|---|---|---|---|
| 1 | 4 | 9 | FANN_TRAIN_RPROP | FANN_ELLIOT_SYMMETRIC | FANN_SIGMOID_SYMMETRIC |
| 2 | 3 | 10 | FANN_TRAIN_RPROP | FANN_COS_SYMMETRIC | FANN_SIN_SYMMETRIC |
| 3 | 2 | 6 | FANN_TRAIN_RPROP | FANN_SIGMOID_STEPWISE | FANN_SIGMOID_SYMMETRIC_STEPWISE |
| 4 | 1 | 0 | FANN_TRAIN_RPROP | - | FANN_ELLIOT-SYMMETRIC |
| 5 | 5 | 5 | FANN_TRAIN_RPROP | FANN_GAUSSIAN | FANN_SIN_SYMMETRIC |
Disclaimer/Publisher’s Note: The statements, opinions and data contained in all publications are solely those of the individual author(s) and contributor(s) and not of MDPI and/or the editor(s). MDPI and/or the editor(s) disclaim responsibility for any injury to people or property resulting from any ideas, methods, instructions or products referred to in the content. |
© 2023 by the authors. Licensee MDPI, Basel, Switzerland. This article is an open access article distributed under the terms and conditions of the Creative Commons Attribution (CC BY) license (https://creativecommons.org/licenses/by/4.0/).
Share and Cite
MDPI and ACS Style
Karadimos, P.; Anthopoulos, L. Machine Learning-Based Energy Consumption Estimation of Wastewater Treatment Plants in Greece. Energies 2023, 16, 7408. https://0-doi-org.brum.beds.ac.uk/10.3390/en16217408
AMA Style
Karadimos P, Anthopoulos L. Machine Learning-Based Energy Consumption Estimation of Wastewater Treatment Plants in Greece. Energies. 2023; 16(21):7408. https://0-doi-org.brum.beds.ac.uk/10.3390/en16217408
Chicago/Turabian StyleKaradimos, Panagiotis, and Leonidas Anthopoulos. 2023. "Machine Learning-Based Energy Consumption Estimation of Wastewater Treatment Plants in Greece" Energies 16, no. 21: 7408. https://0-doi-org.brum.beds.ac.uk/10.3390/en16217408
Note that from the first issue of 2016, this journal uses article numbers instead of page numbers. See further details here.