
Review of Different Methods for Identification of Transients in Pressure Measurements by Permanent Downhole Gauges Installed in Wells
 ,
,
Abstract
:1. Introduction
- Define the common terms used in processing pressure measurements from permanent downhole gauges (PDG);
- Provide strategies to identify transients from PDG datasets for well surveillance or similar transient datasets;
- Facilitate further developments of field data interpretation techniques by the R&D community and academia via helping in the selection of a proper method for further application in well surveillance workflows applied in industry.
- Introduce the terminology for transient identification;
- Introduce the reviewed transient identification methods;
- Compare the methods;
- Discussions;
- Conclusions.
Terminology
- A pressure transient is a predominantly monotonic change of pressure in response to a sudden change of rate;
- A break point is a point in time separating two transients;
- Transient identification is a process of dividing pressure time series into sequential transients based on the objectives of the data interpretation.
2. Methods for Transient Identification
- Wavelet modulus maxima method;
- Data grouping method;
- Pressure-data slope method;
- Pressure derivative method;
- Filter convolution method;
- Image pattern method;
- Segmentation method.
2.1. Wavelet Decomposition Methods
2.1.1. Wavelet Modulus Maxima Method
- a.
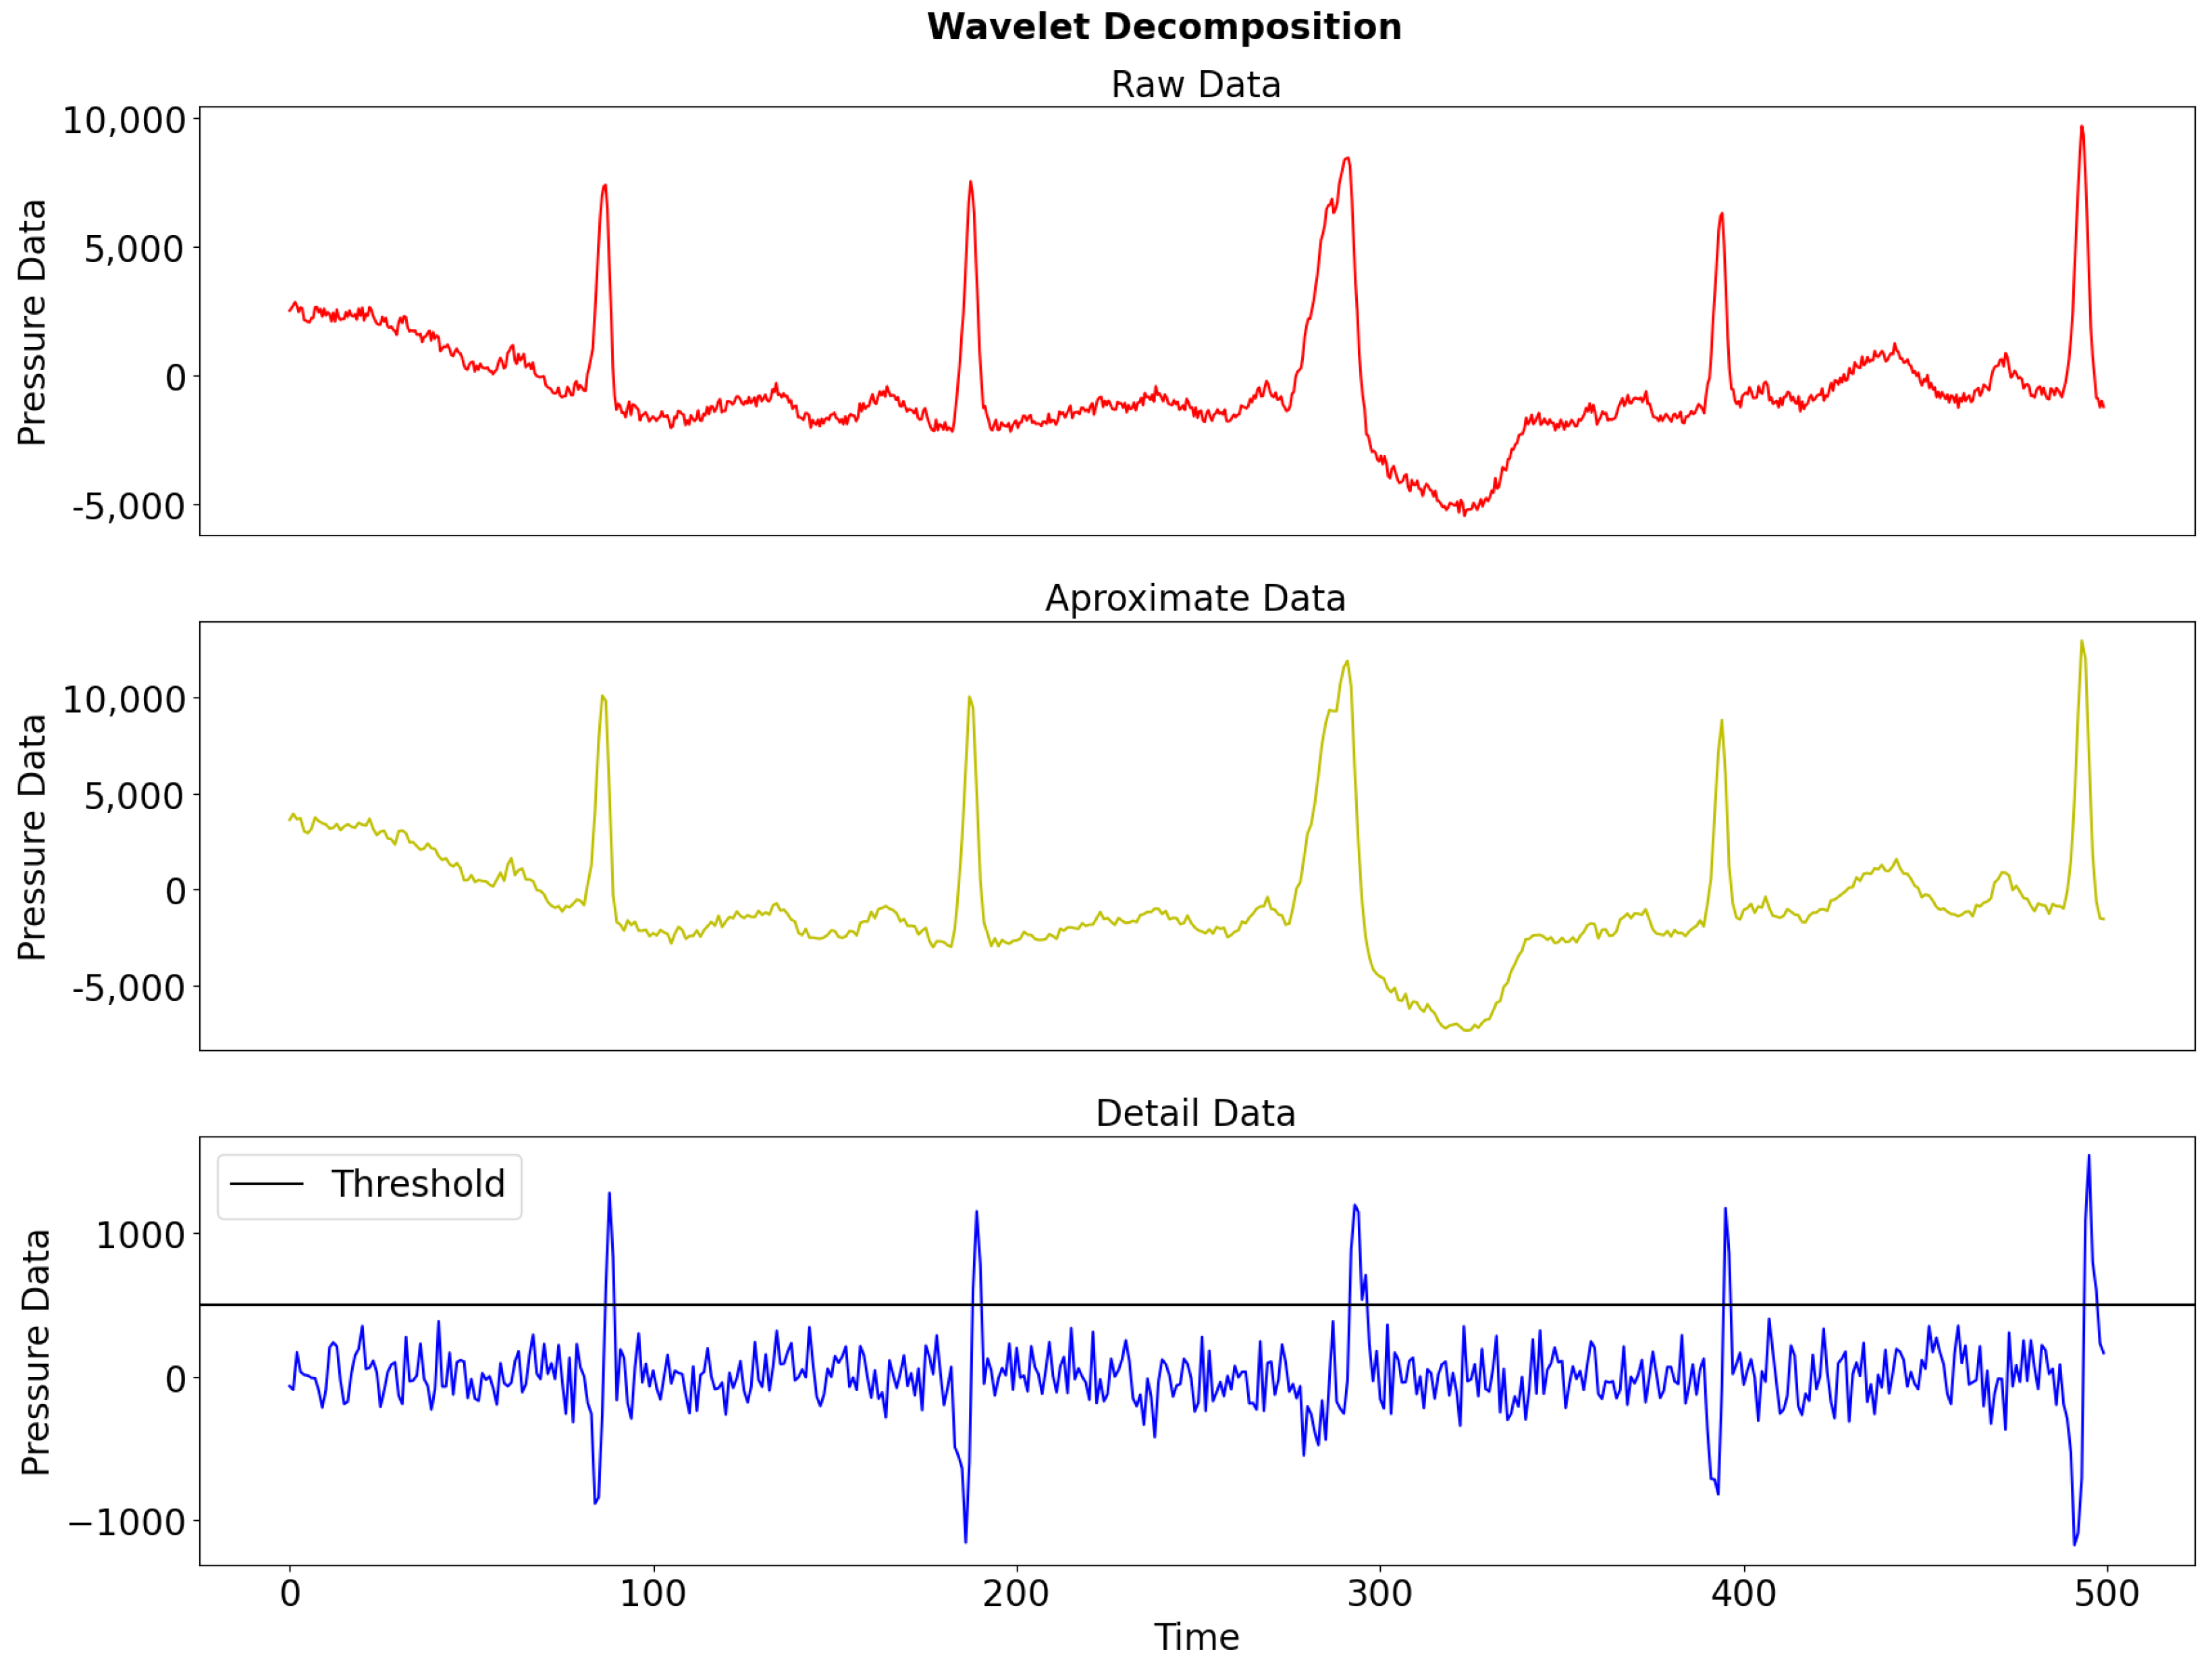
- Detection theoryAthichanagorn processed the original data by using spline wavelet decomposition, which decomposes the data into approximation signal data by using the scaling function and detail signal data by using the spline wavelet function [22]. Depending on the resolution level, the scaling function provides an approximation of the original data, while the wavelet function provides the differences between the approximation data and the original data. Breakpoints are detected by finding the modulus maxima over a certain pressure slope threshold, denoted as , in the detailed signal at an intermediate decomposition level L.
- b.
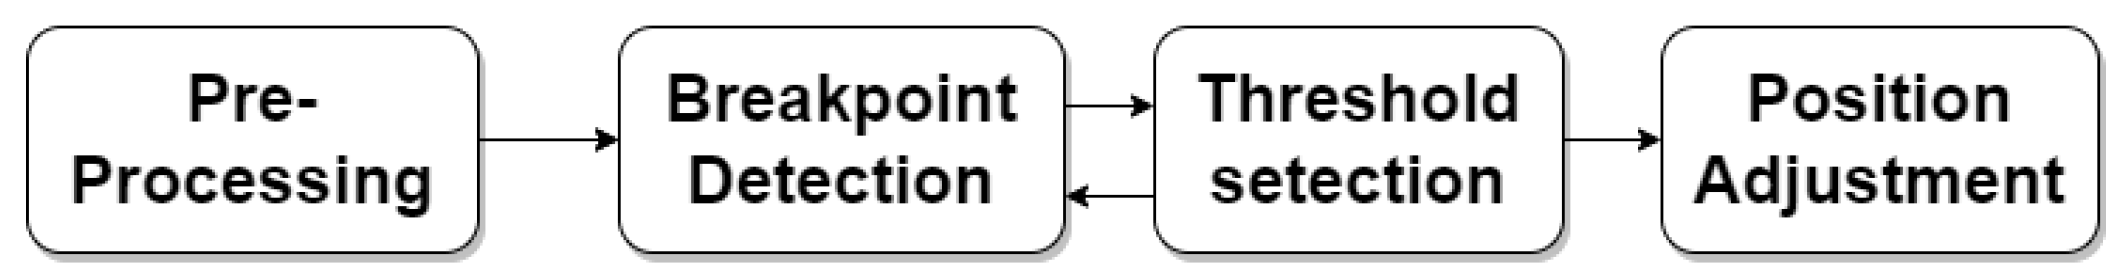
- Detection procedureThe detection procedure can be defined as follows:
- Pre-process data for outlier removal and denoising;
- Determine the level of spline wavelet decomposition L, according to desired data resolution;
- Try proper slope or pressure thresholds to detect the break points by wavelet modulus maxima higher than threshold ;
- Confirm the position of break points by checking slope changes.
- c.
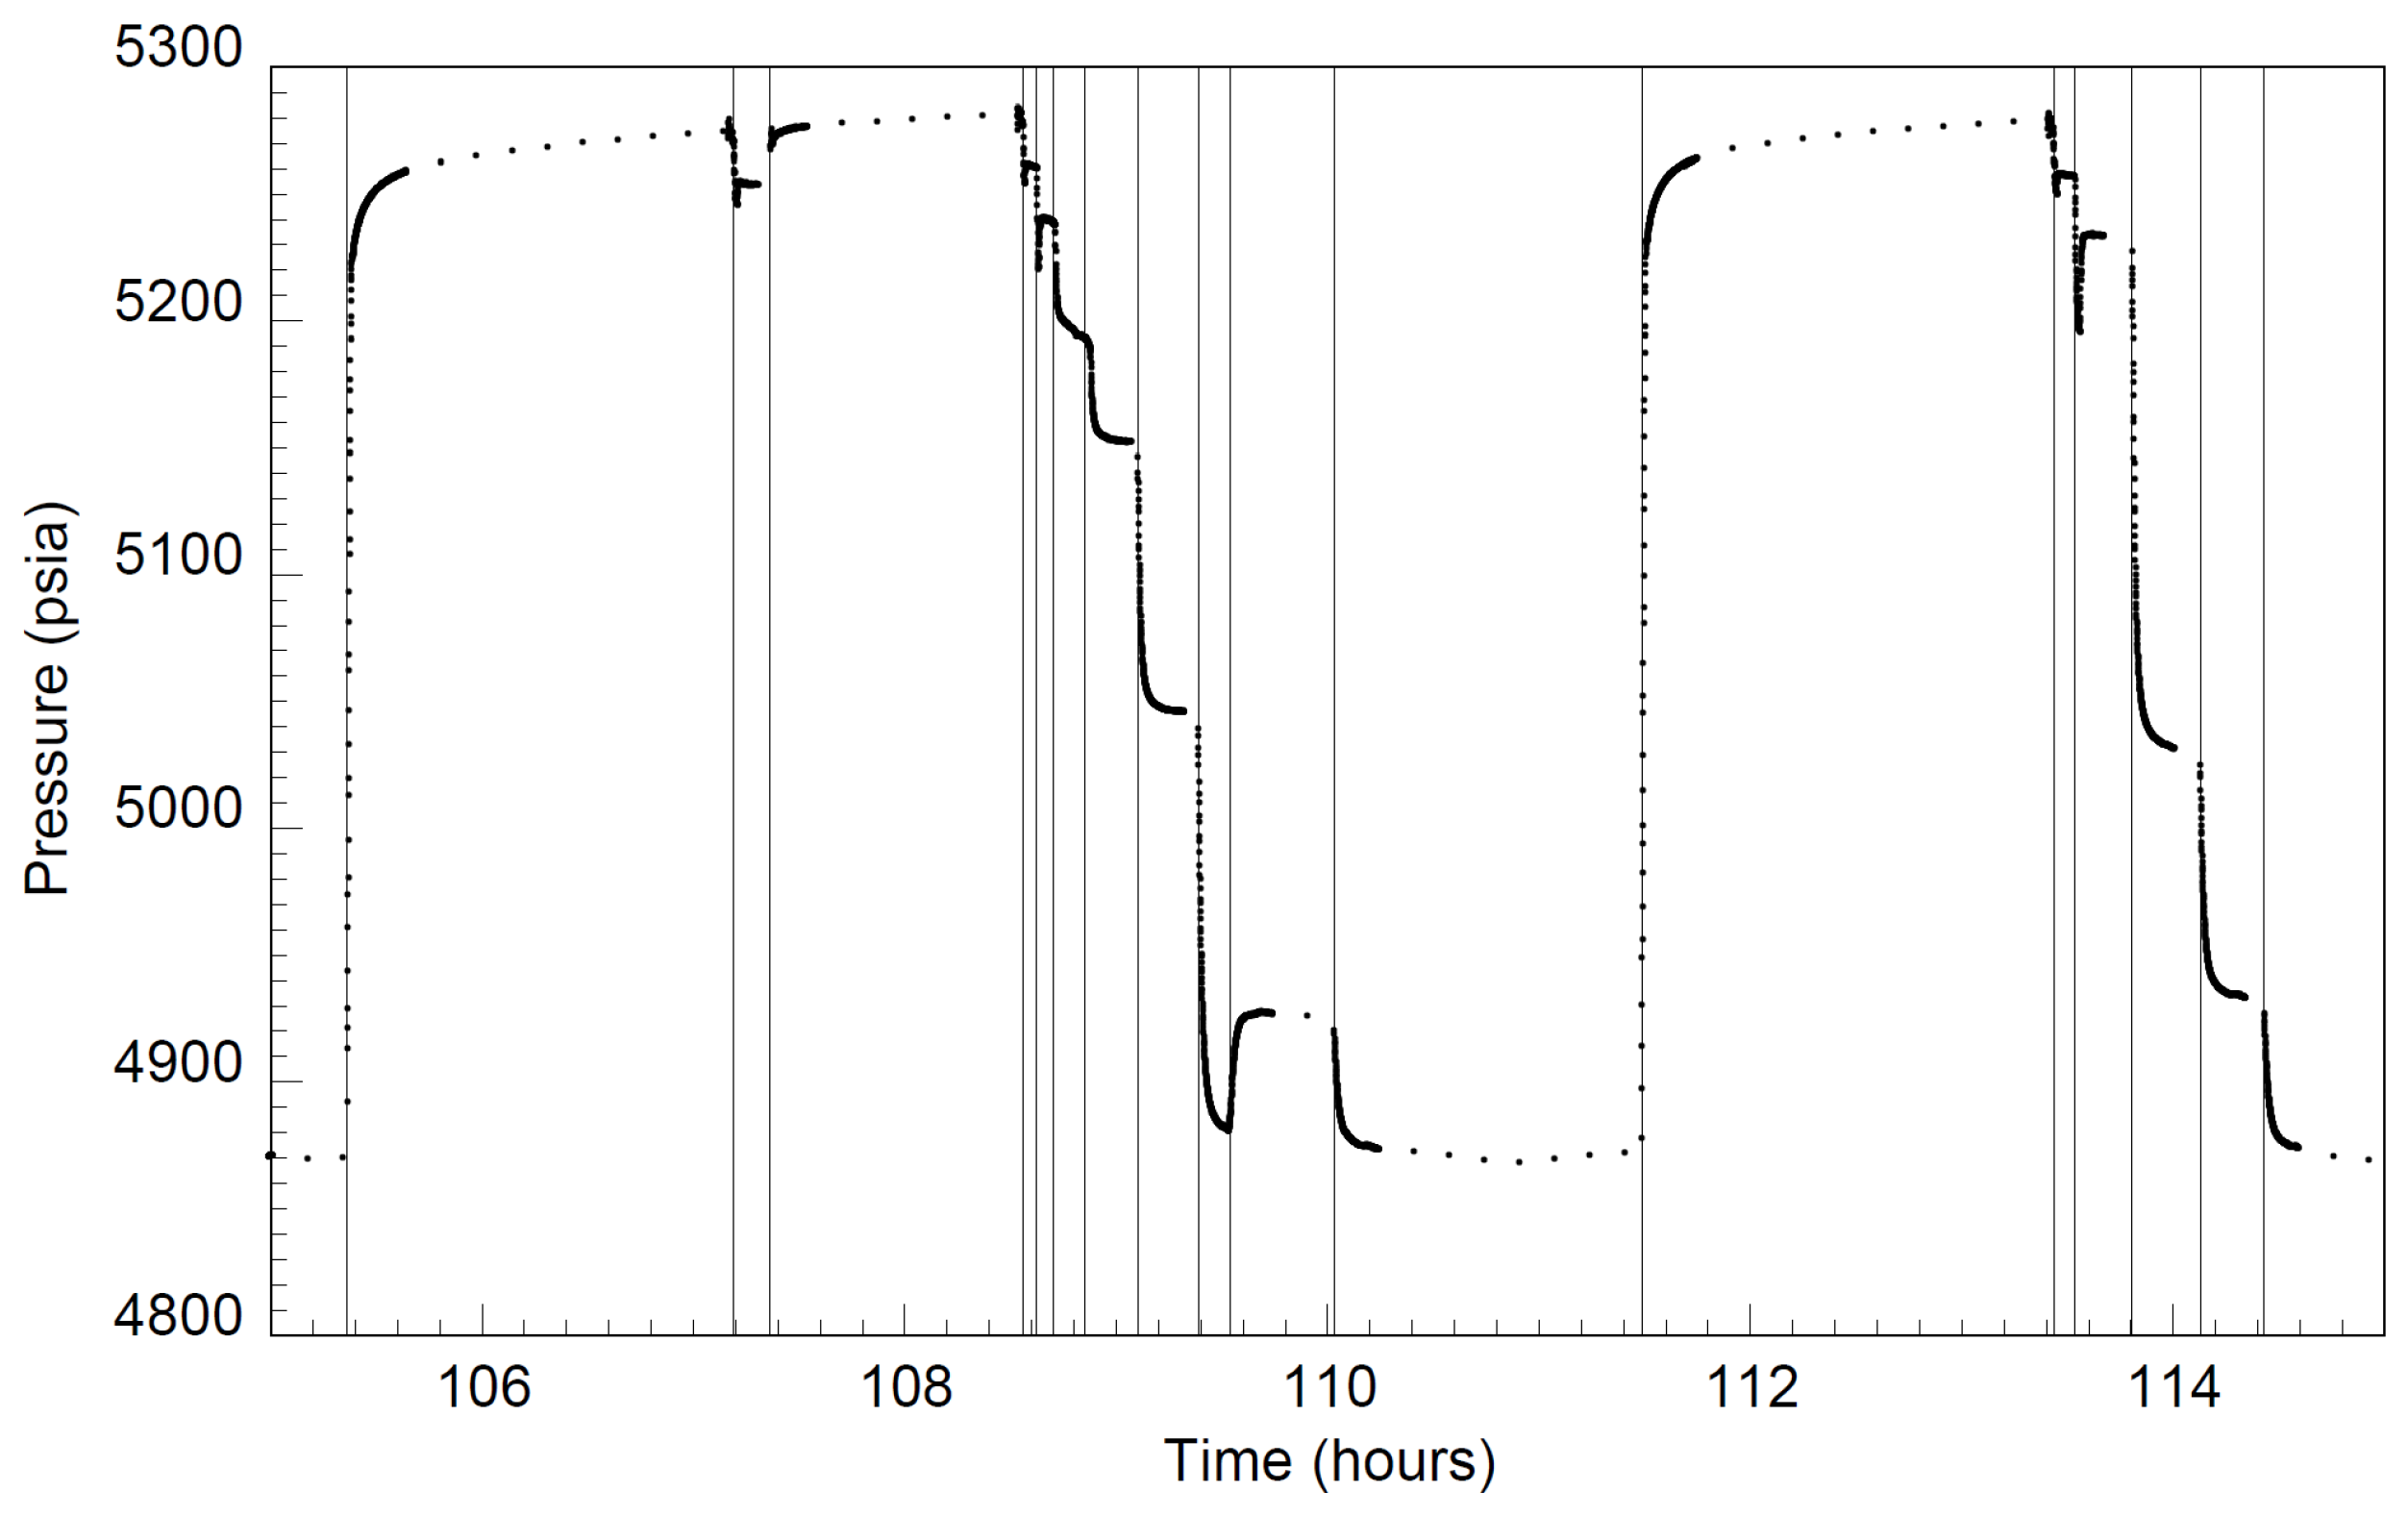
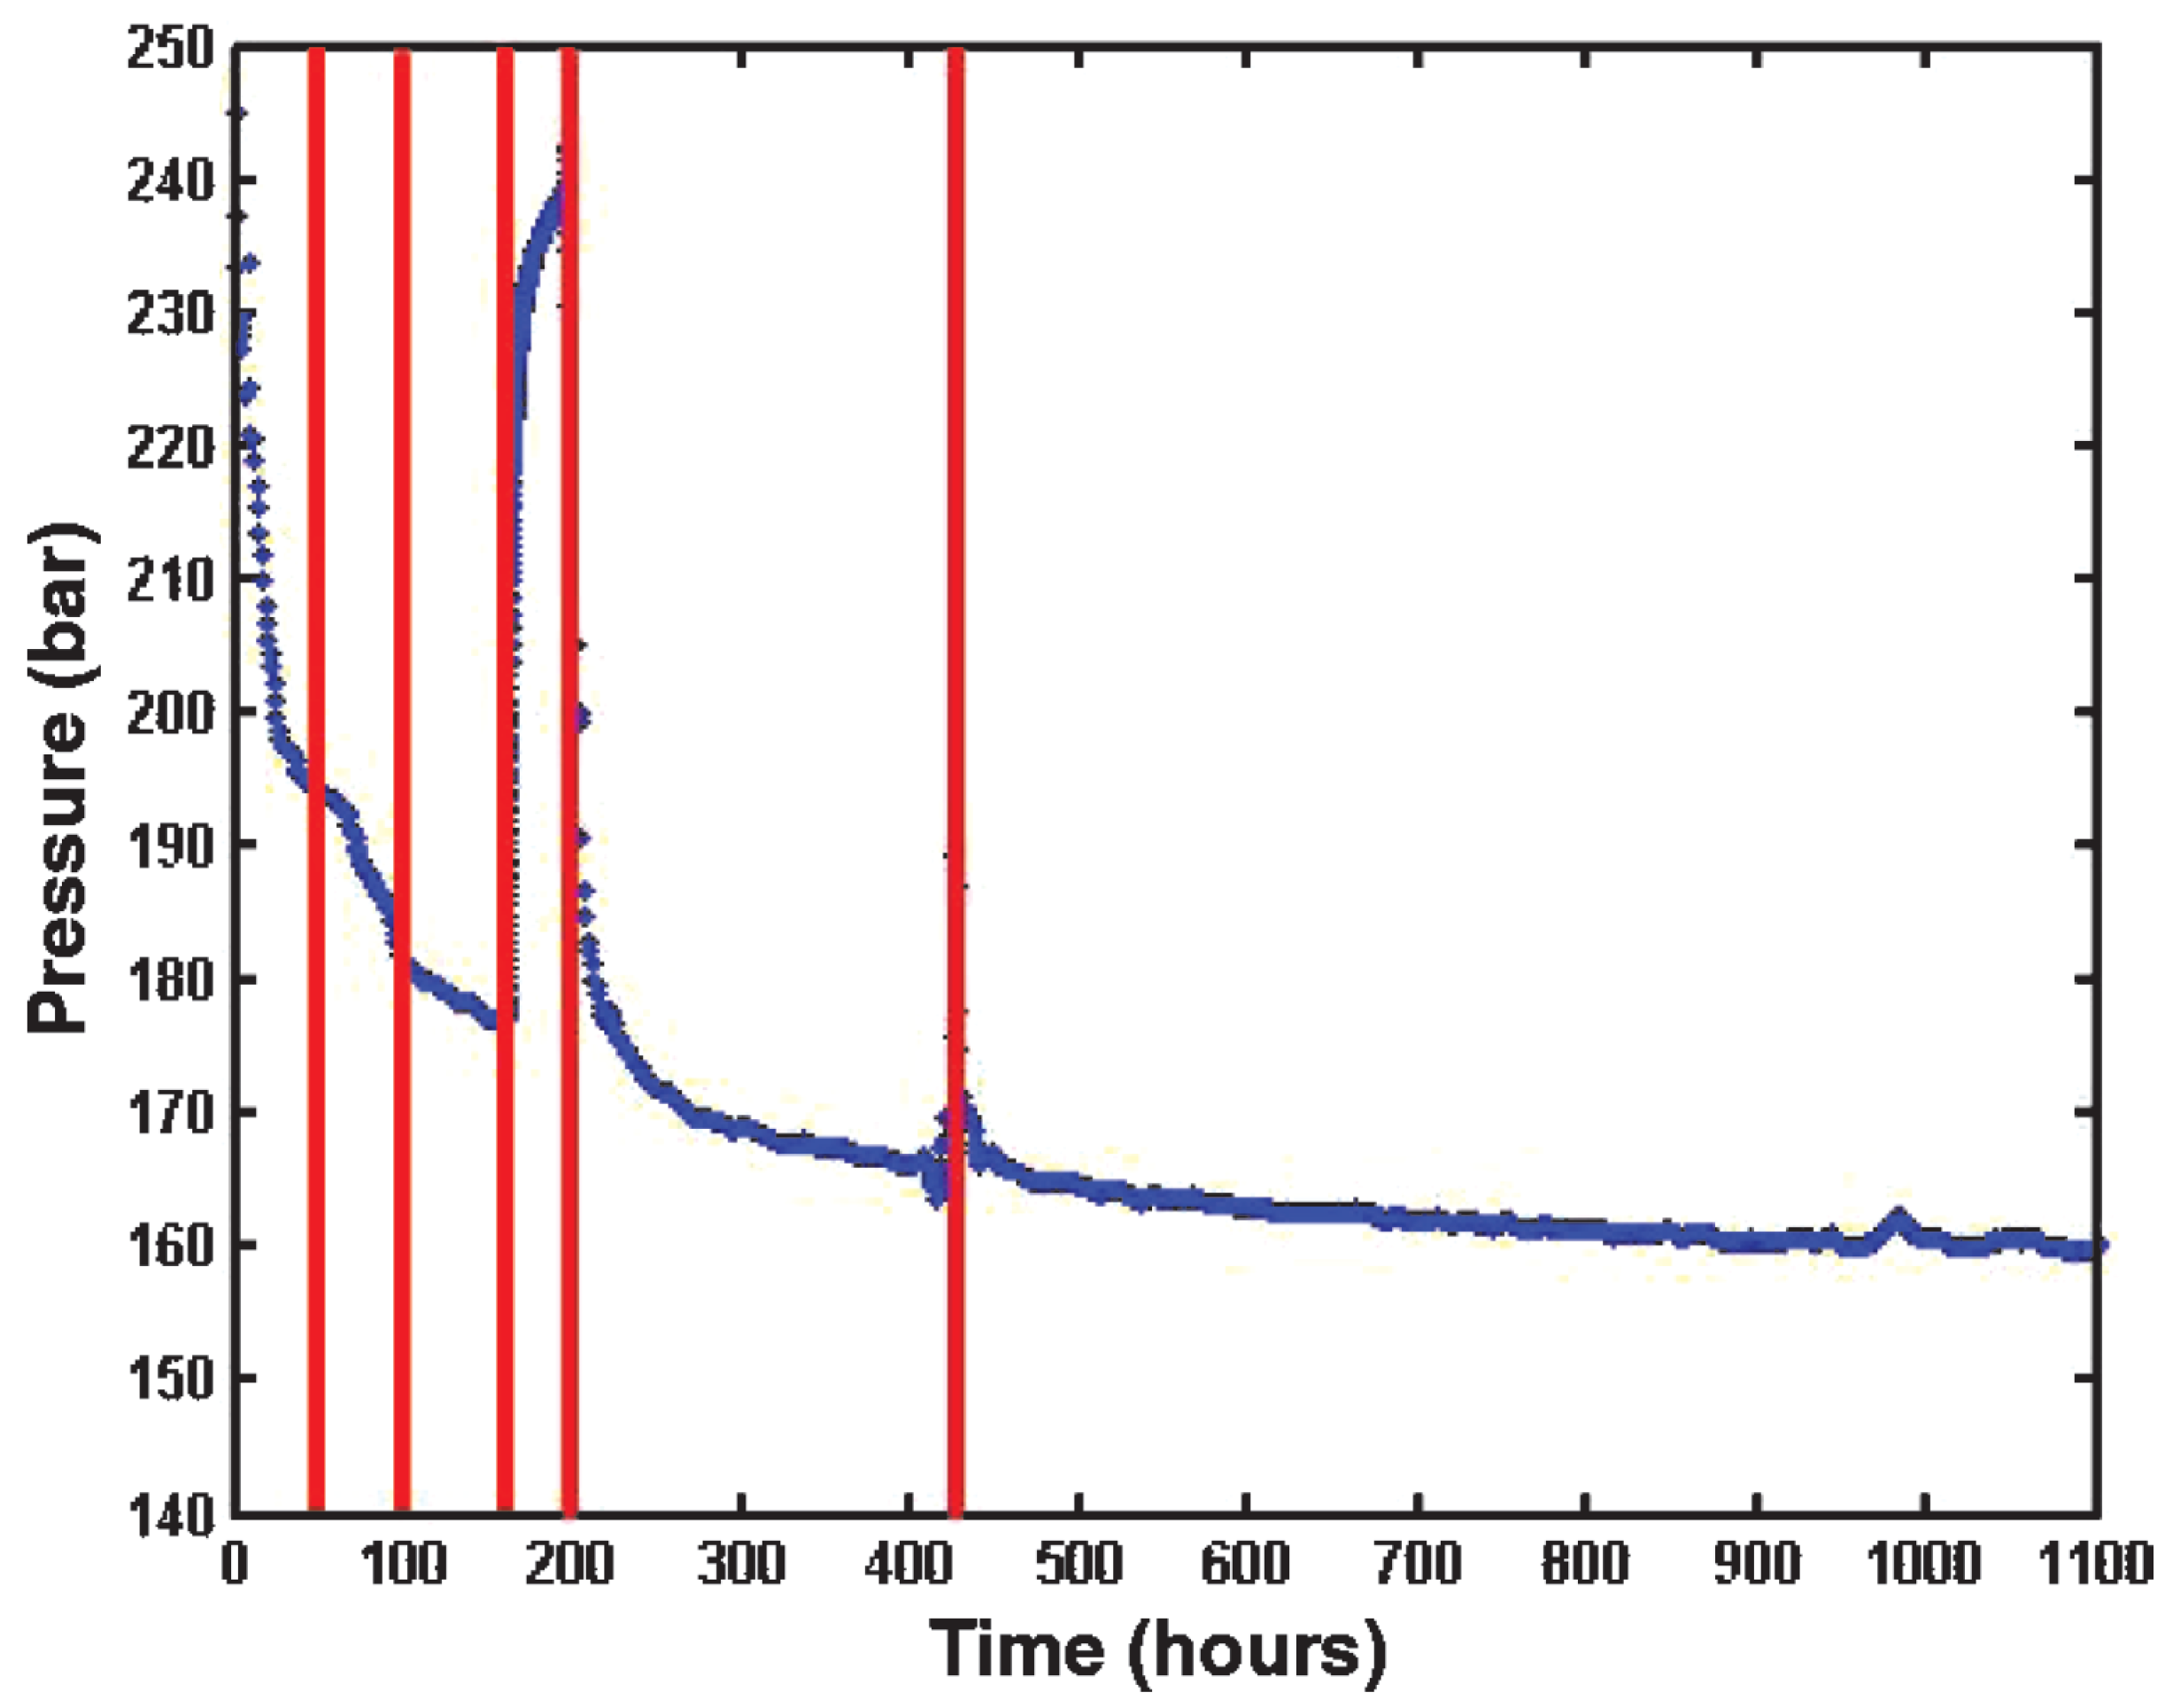
- Experiment resultThe author conducted three experiments using this method, and Figure 3 shows the detection results based on the denoised data. The vertical lines indicate the positions of the detected breakpoints. The level of spline wavelet decomposition used was intermediate, and the pressure slope threshold, , was set at 10 psi/h.
- d.
- Advantages and DisadvantagesThis method can effectively detect obvious breakpoints, but it may fail to detect breakpoints with small magnitudes. The final detection quantity of breakpoints is determined by the threshold selection. Pre-processing, including outlier removal and denoising, is necessary to avoid false breakpoint detection. The detection result is highly affected by the wavelet decomposition level and the threshold, which requires human intervention to achieve the desired result. Additionally, the final position of a breakpoint needs to be confirmed in the original data.
2.1.2. Data Grouping Method
- a.
- Detection theoryLi [23] presented that decomposition by Haar wavelet transforms, a discrete wavelet transform, can detect more accurate breakpoint positions compared to spline wavelet transform (used in the wavelet modulus maxima method). Based on Haar wavelet decomposition, Li proposed a method to detect breakpoints by grouping data in the detailed signal. The threshold is decided by statistical grouping with the assistance of the mean and standard deviation calculated from the detailed signal.
- b.
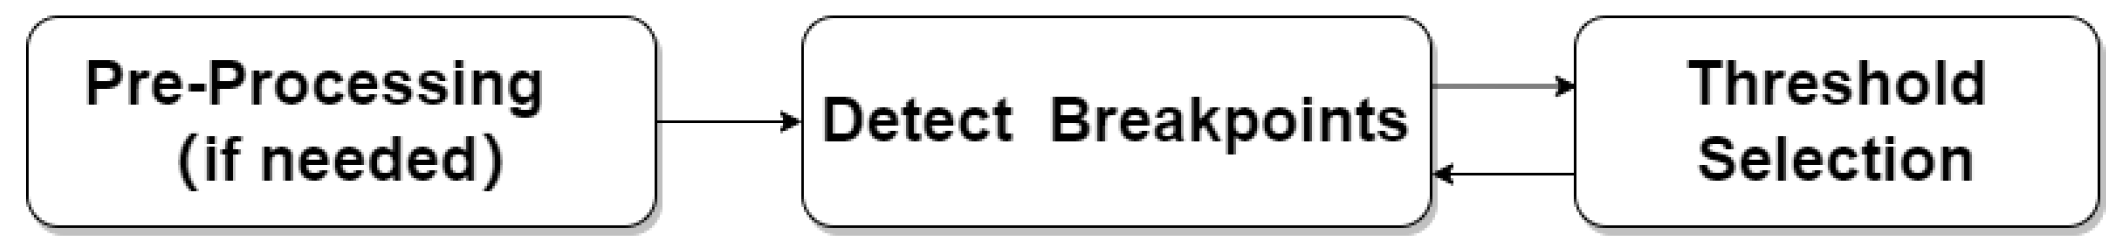
- Detection procedureThe detection procedure can be detailed as follows:
- Pre-process includes removing overlap data, outliers, and denoising;
- Apply wavelet decomposition and use the detail signal in Level 1 as default data resolution for subsequent processing;
- Identify the break points by grouping the data by setting proper threshold and regarding the break points located in the data group in which the data values are bigger than the threshold;
- Refine break points position.
- c.
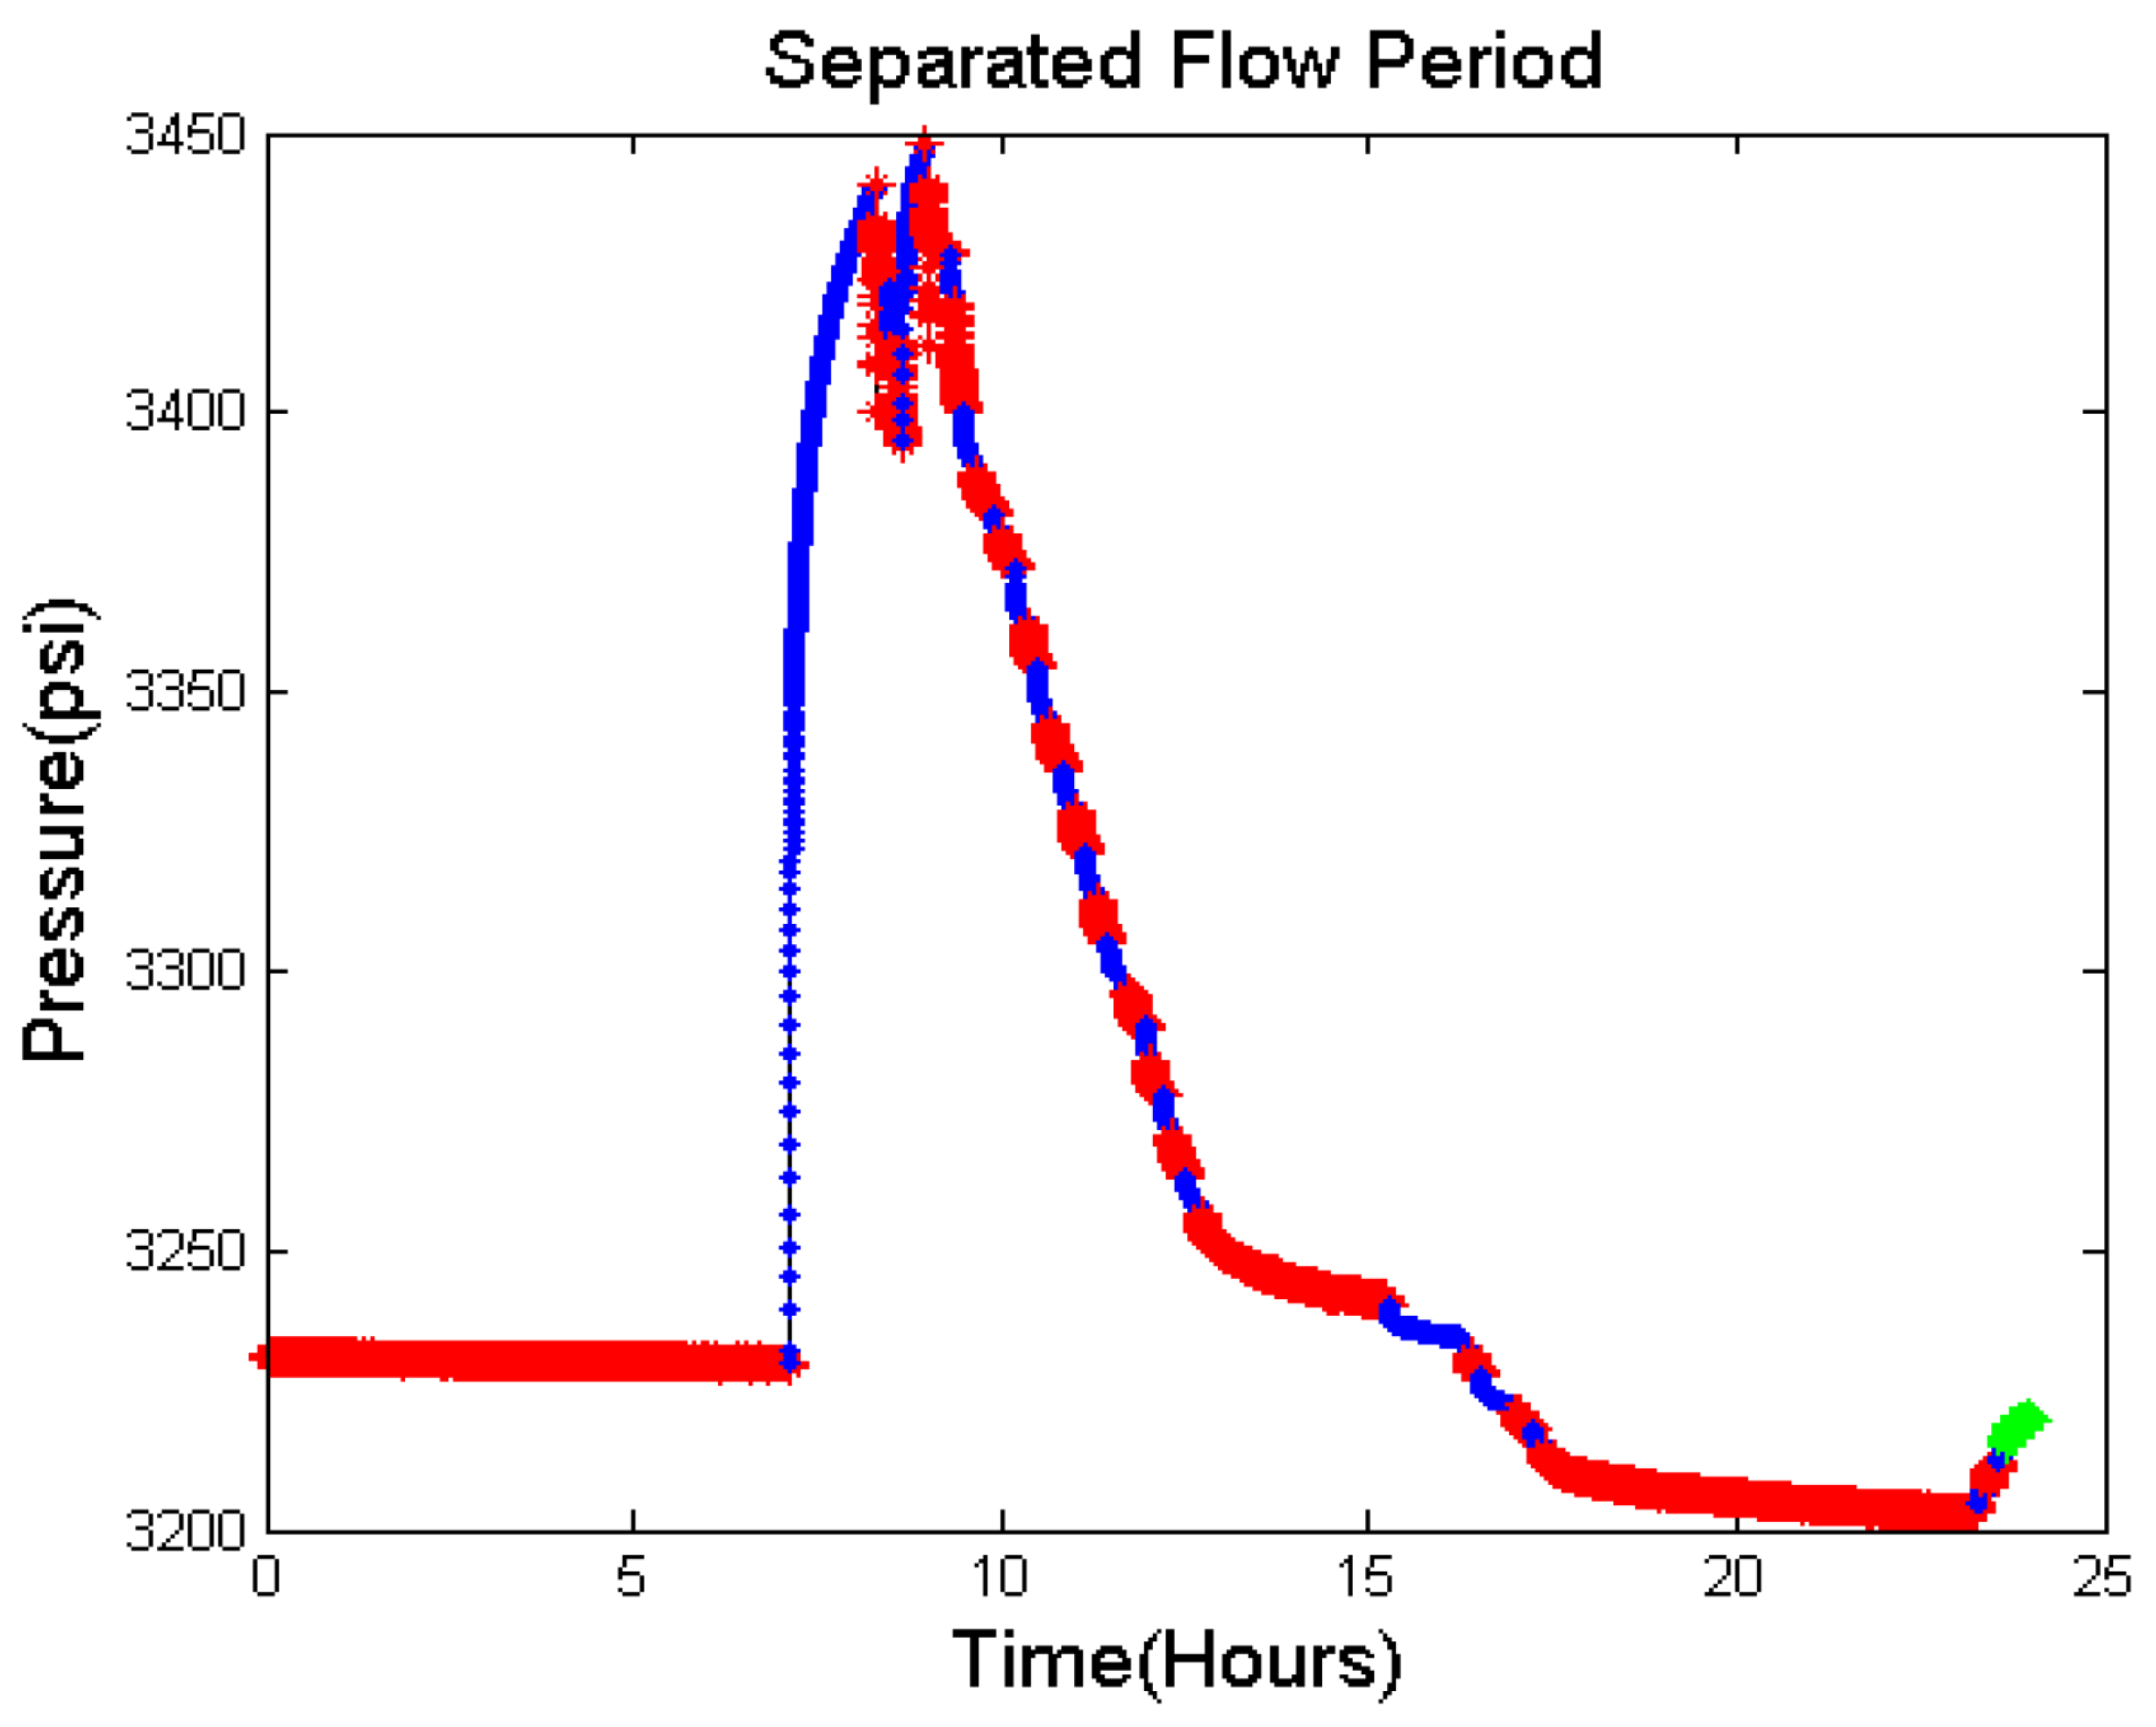
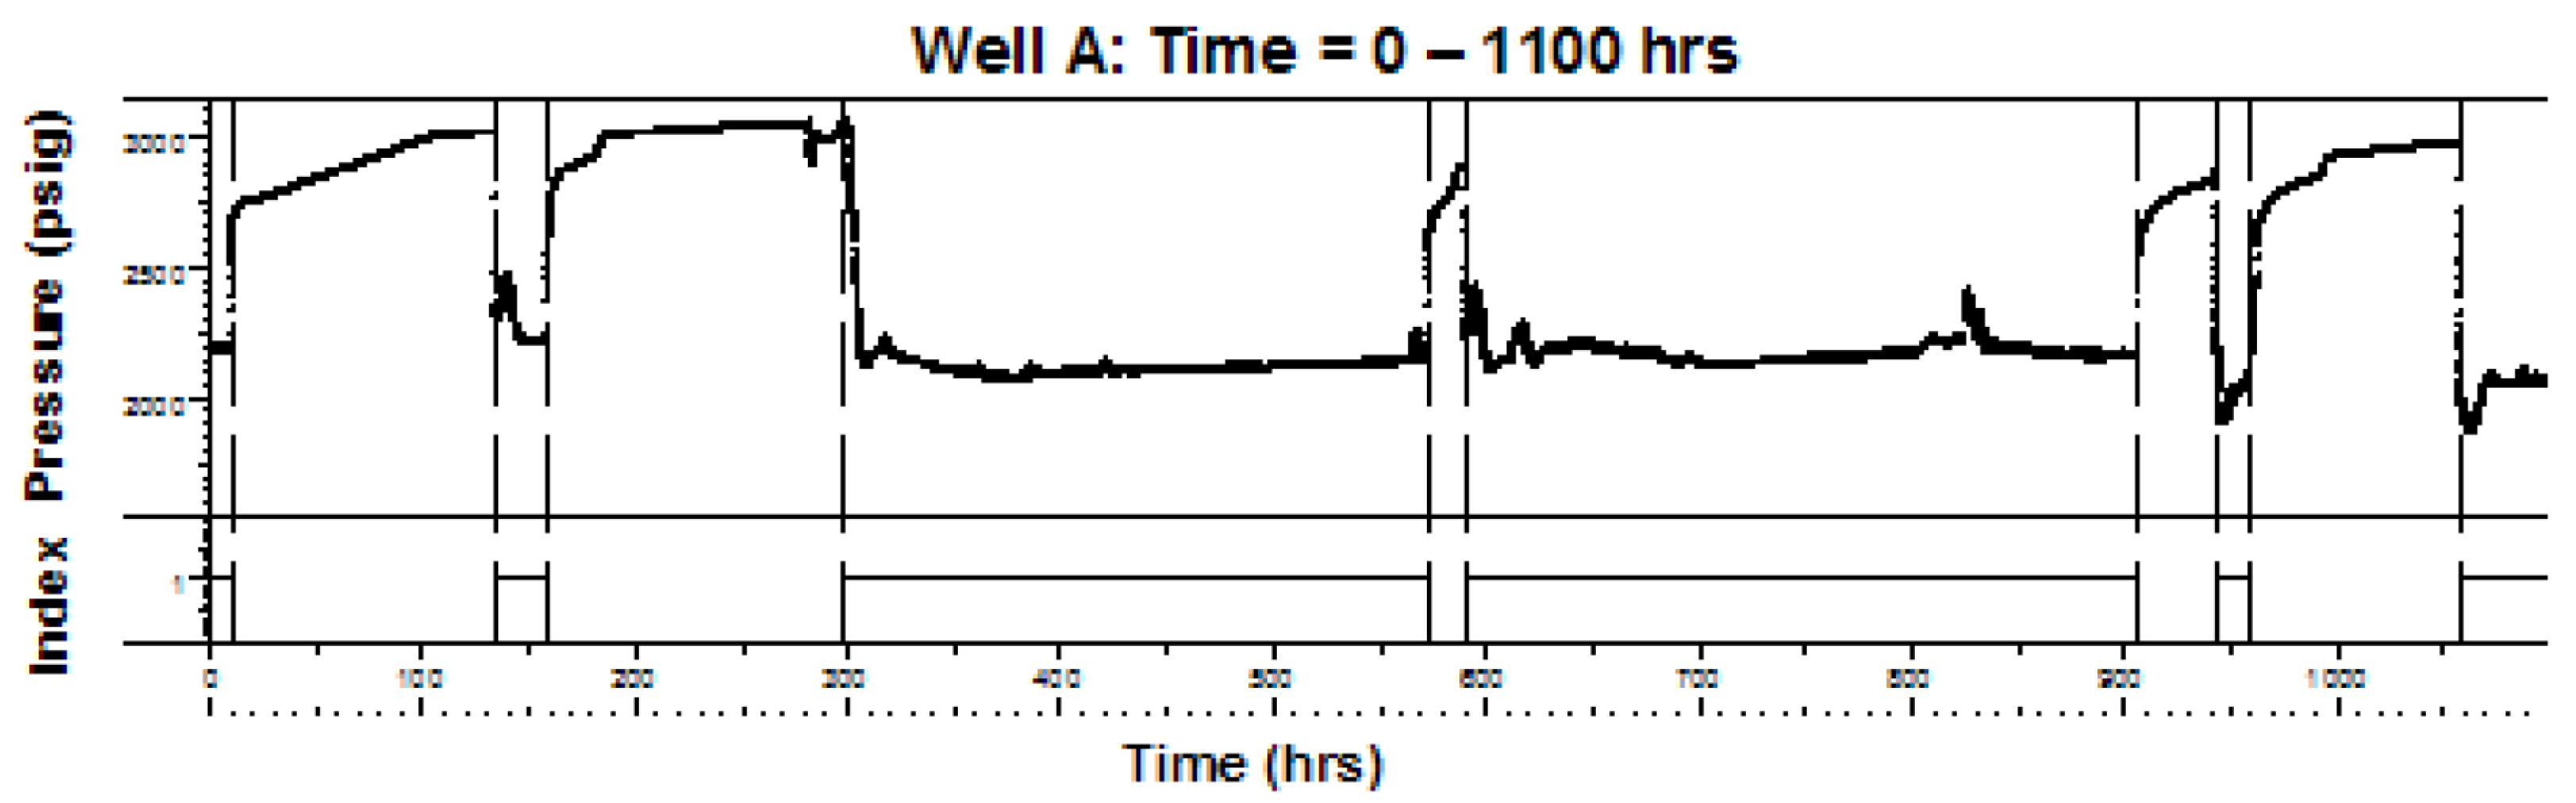
- Experiment resultThe author conducted five experiments using this method [23], and the significant transients were detected, but with over-detection on transients with small magnitudes. The periods with different color represent different flow periods, and the period with green color represents the final flow period (Figure 4).
- d.
- Advantages and DisadvantagesLi improved detection of the break points with a more precise position in the original data by using the Haar wavelet transform and detecting more break points with smaller magnitudes by determining the threshold in statistic consideration. However, pre-processing including outlier removal and denoising is necessary, and the threshold selection by a statistic method results in over-detection with redundant transients.
2.2. Pressure Data Trend Methods
2.2.1. Pressure–Data Slope Method
- a.
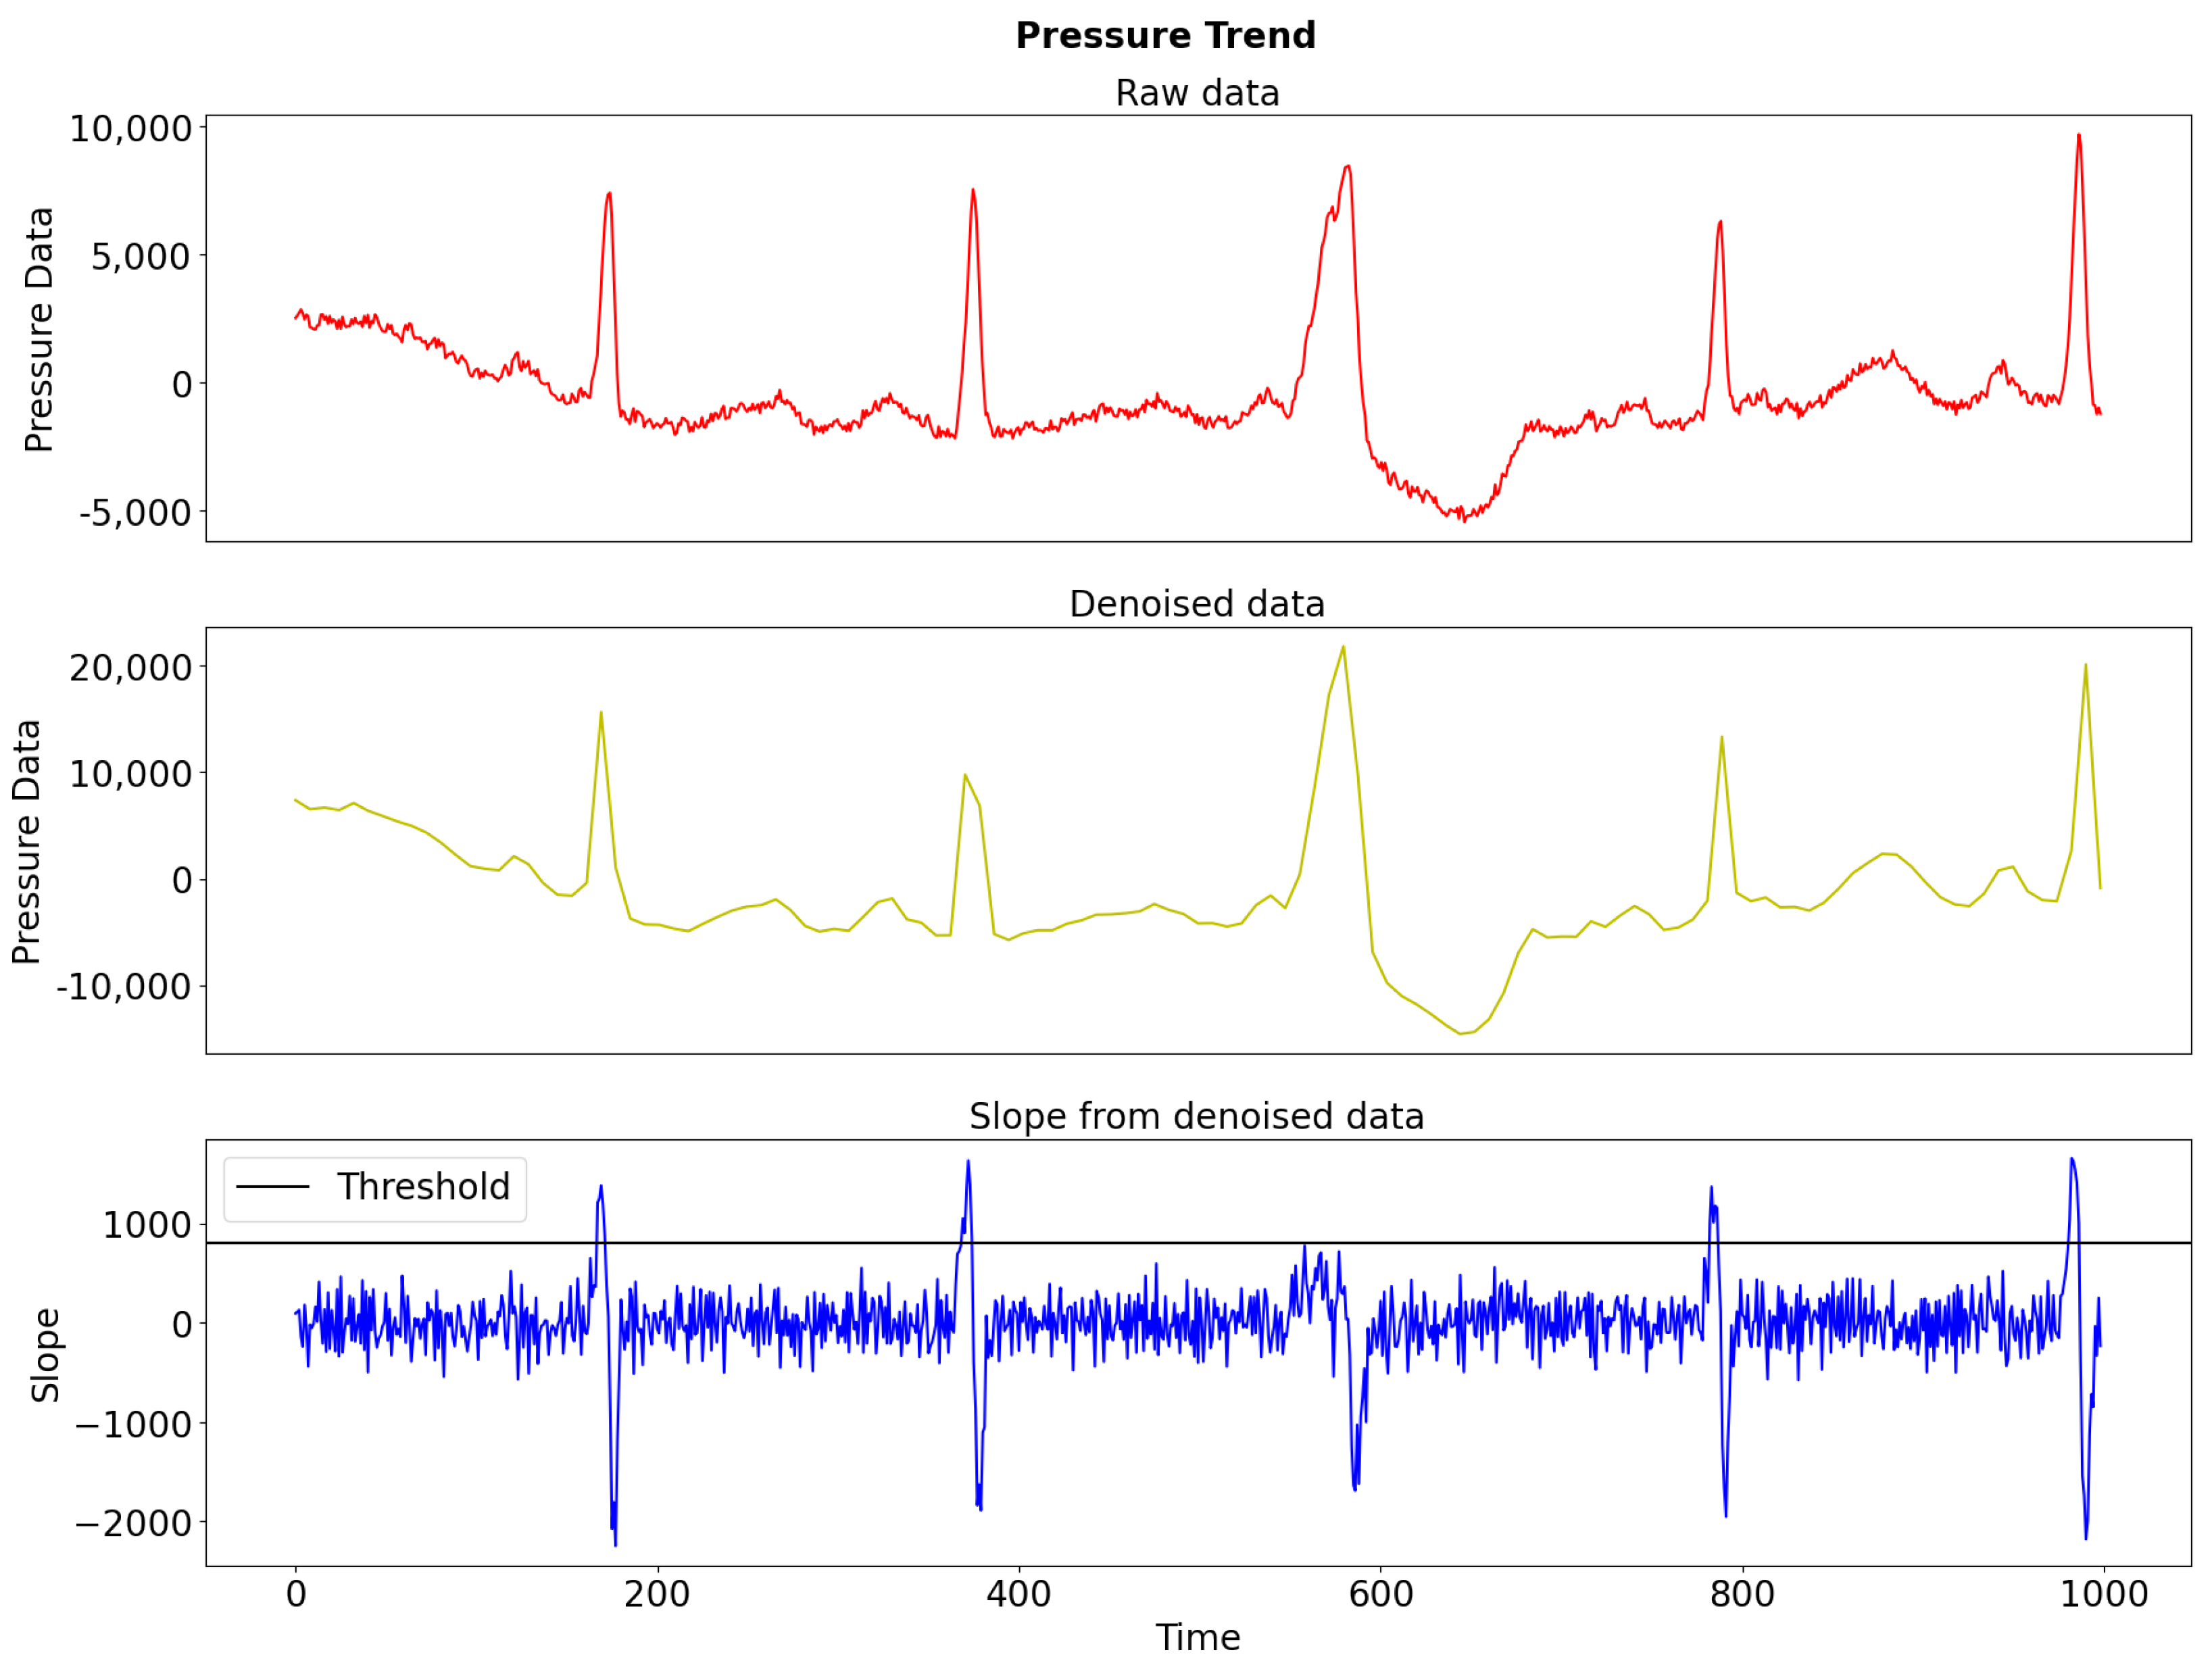
- Detection theoryViberti proposed a method that uses the slope of pressure data as the criterion to identify transients [30]. The original PDG data are first pre-processed by wavelet algorithms for outlier removal and denoising. Then, the detection process starts by setting the number of points k for calculating the slope in the pre-processed data. Finally, the calculated slope values greater or less than the thresholds will be detected as breakpoints.
- b.
- Detection procedureThe detection procedure can be detailed as follows:
- Pre-processing includes removing outliers and denoising;
- Decide the number of points k and calculate the slope from the pre-processed data;
- Set slope thresholds for flowing and shut-in break points.
- c.
- Experiment resultThe author made two experiments using this method, and Figure 6 shows the detection results based on the denoised data. The vertical line indicates the detected position of break points.
- d.
- Advantages and DisadvantagesThe pressure-slope-based method is a simple method for detecting large magnitude break points in data. It relies on pre-processing the data and selecting an appropriate threshold. The effectiveness of the approach can be affected by the quality of pre-processing and threshold selection. Human involvement is necessary in these steps.
2.2.2. Pressure Derivative Method
- a.
- Detection theoryRai proposed using the derivative of pressure as a criterion to detect breakpoints in a pressure curve [19]. The Savitzky-Golay filter is used to smooth and transform the discrete pressure data into a continuous curve. The derivative of this curve is then calculated and used as the source data for breakpoint detection. The derivative of pressure exhibits peaks when there are significant changes in the gradient of the data. These peaks in the first and higher derivatives indicate the vicinity of the breakpoints location.
- b.
- Detection procedureThe detection procedure can be detailed as follows:
- Smoothen the original pressure data using the Savitzky–Golay filter by adjusting the size of the filtering window S and the order of the polynomial ;
- Calculate the pressure derivative and select the proper order of derivative ;
- Detect break points by derivative values bigger than the threshold or smaller than the threshold ;
- Adjust break points position by checking slope changes.
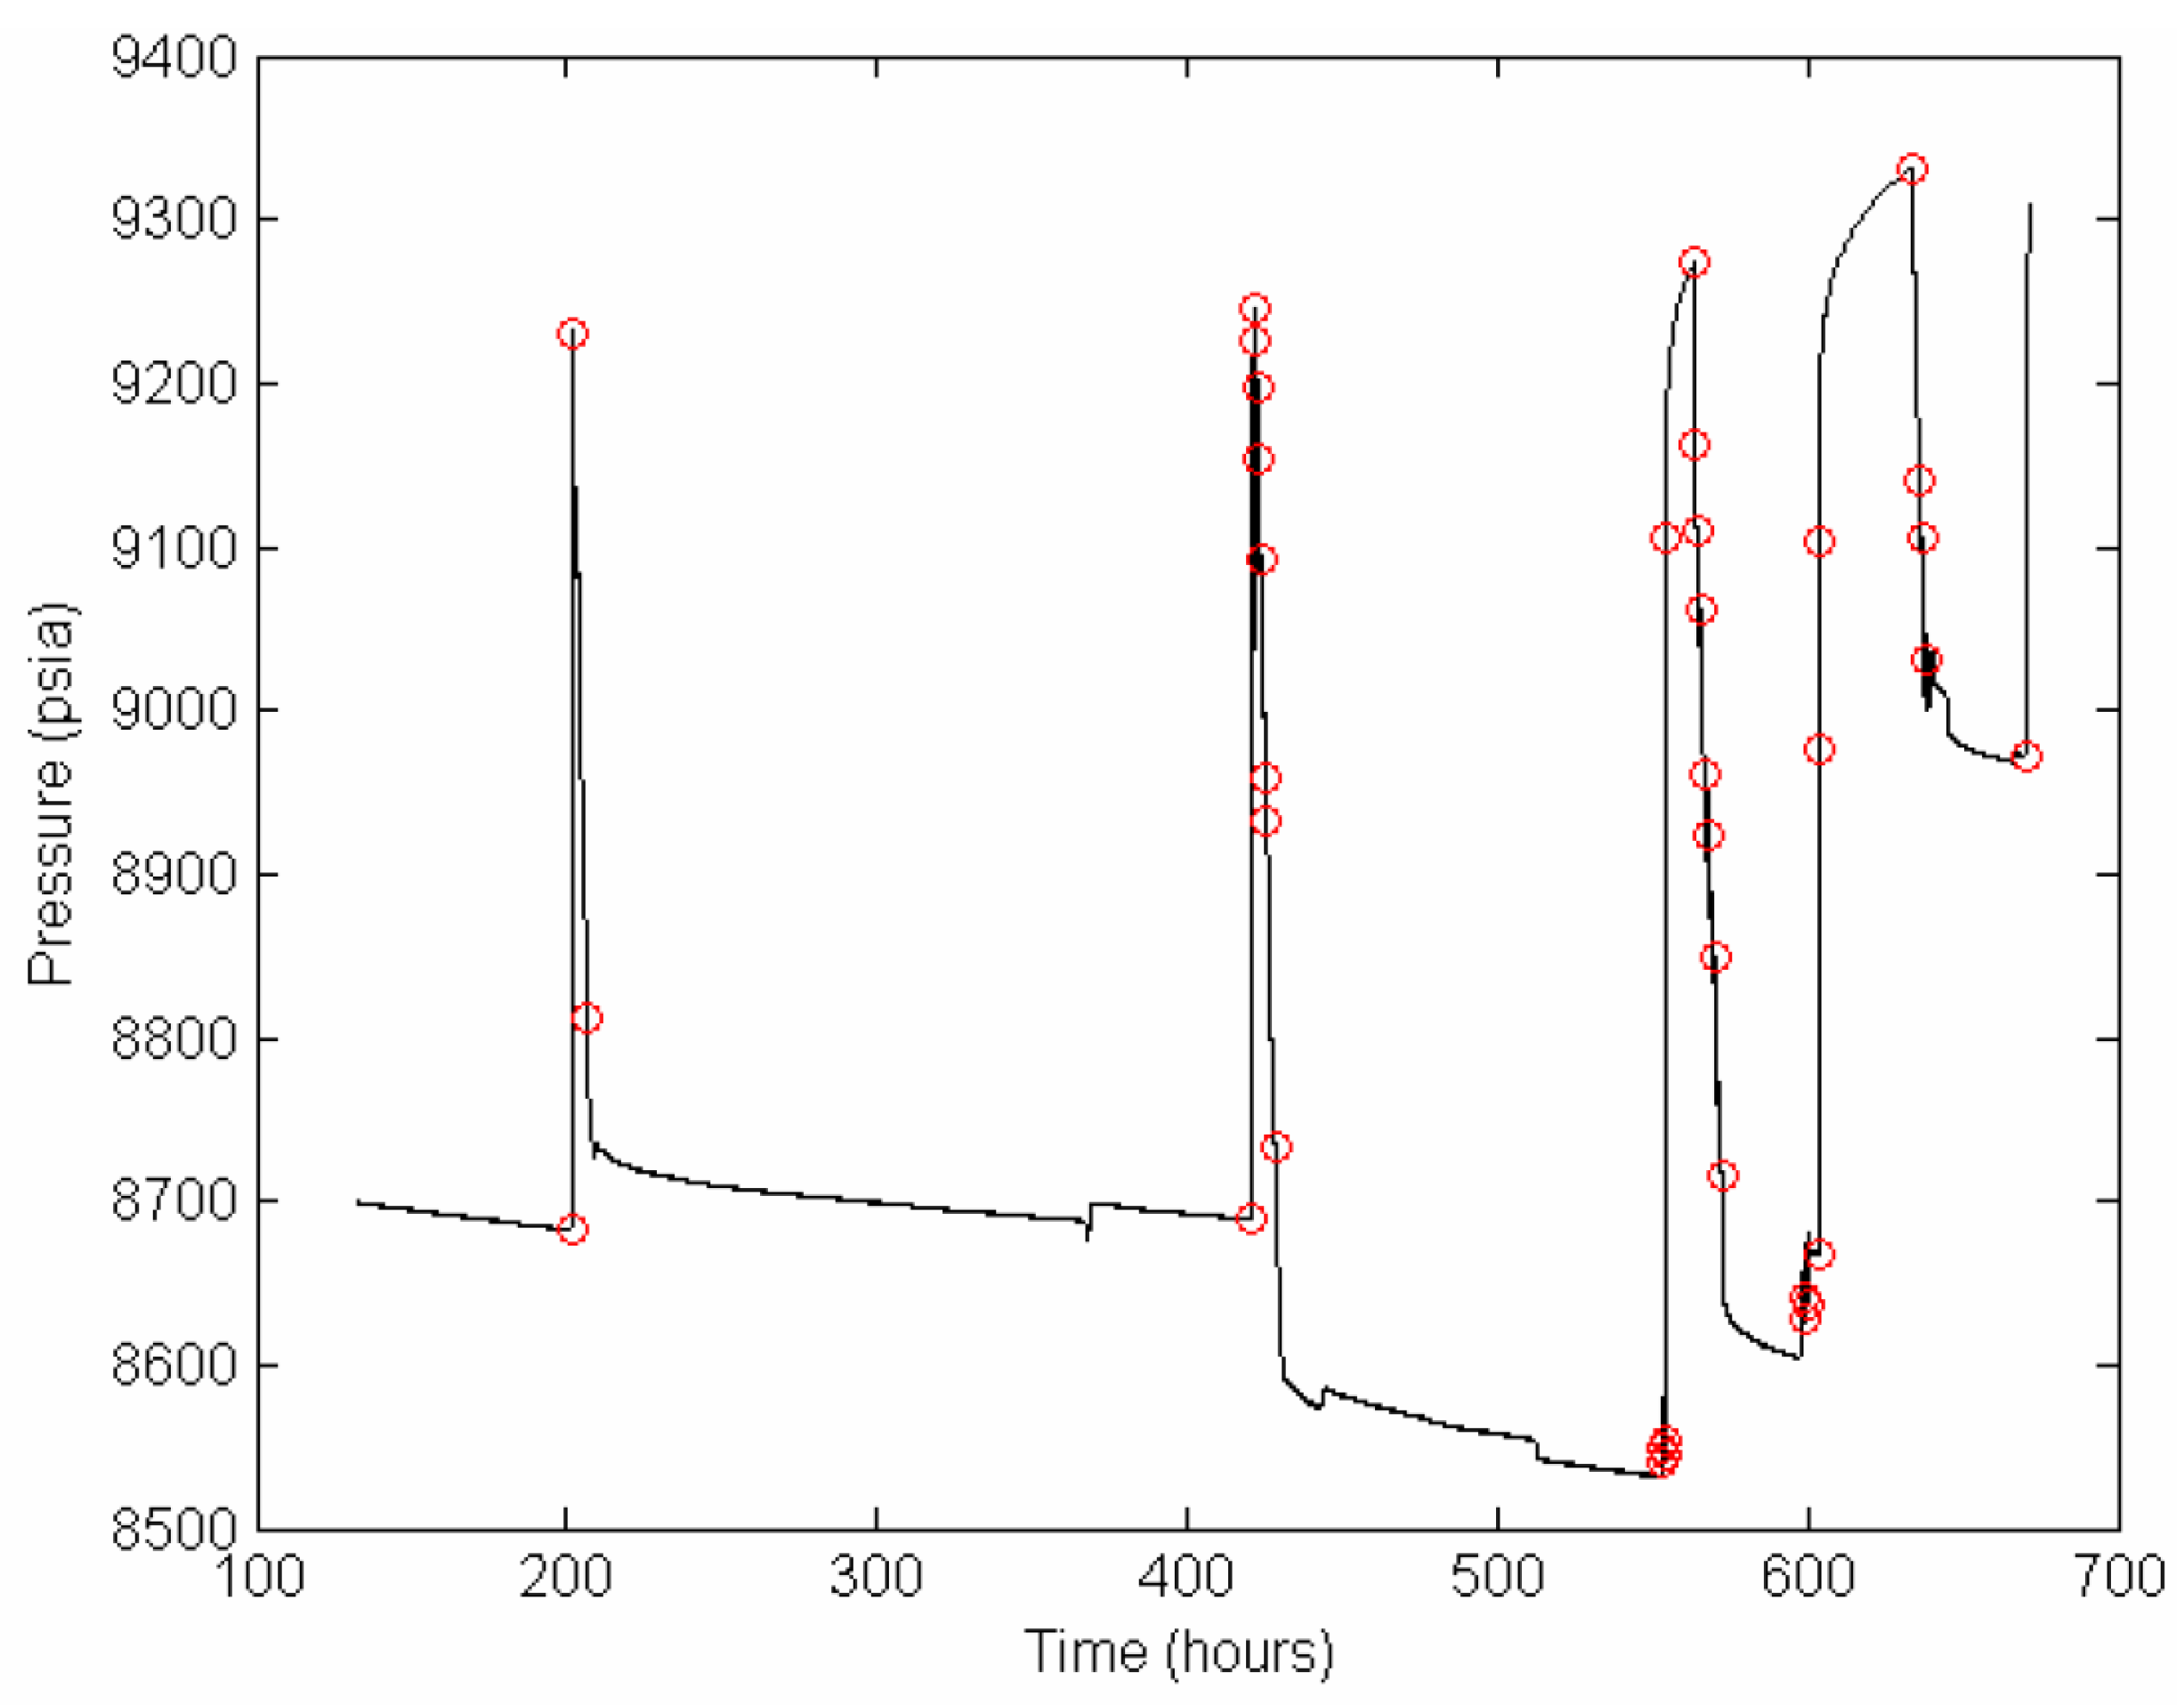
- c.
- Experiment resultThe author conducted one experiment using this method, and Figure 7 shows the detection results based on the denoised data. The red dot indicates the detected position of break points.
- d.
- Advantages and DisadvantagesThe method can effectively detect significant breakpoints. However, it requires many parameters to be set and involves many human interactions. Additionally, the method may fail to detect a few breakpoints with small magnitudes, as seen in the author’s experiments.
2.3. Pattern Recognition Methods
2.3.1. Filter Convolution Method
- a.
- Detection theorySuzuki’s method is a break-point detection method that uses filter convolution to detect specific patterns in the pressure derivative rather than just changes in frequency. This method can also be combined with noise-removal filters to improve its tolerance to noise, as described in the reference [33].
- b.
- Detection procedureThe detection procedure can be detailed as follows:
- Pre-process data for outlier removal and denoising;
- Calculate the pressure derivative;
- Determine the criterion for patterns by deciding the size of time window S in the filter function according to the minimum buildup interval desired to detect;
- Detect the break points by locating the maxima of the filter function bigger than threshold .
- c.
- Experiment resultThe author conducted one experiment with oil well PDG data and two experiments with gas well PDG data by using this method. The author mentioned that the detection result was better with the oil well PDG data than with gas wells. Figure 8 shows the detection results based on the denoised data with oil well PDG data. The vertical line indicates the detected position of break points.
- d.
- Advantages and DisadvantagesThe Suzuki method is designed to be tolerant to noise to some extent through the use of a filter function. However, the results of the experiment indicate that it is difficult to pre-define universal patterns for different datasets. The threshold criteria selection requires human interaction and is a trial-and-error process.
2.3.2. Image Pattern Method
- a.
- Detection theoryIn the article [35], Olsen proposed a pattern recognition method for transient identification, which is further elaborated on in his Ph.D. thesis [34]. The method pre-defines two patterns for break points, one for build-up, as shown in Figure 9, and one for draw-down, and represents the break points as binary images (0 or 1). The break points will be detected when the shape made by the points belongs to the pre-defined transient pattern. To remove the smallest transient patterns, the author proposed a complementary measure that uses statistical validation criteria. This may cause some of the smallest transients to be missed, but it also decreases the number of faulty detected transients.
- b.
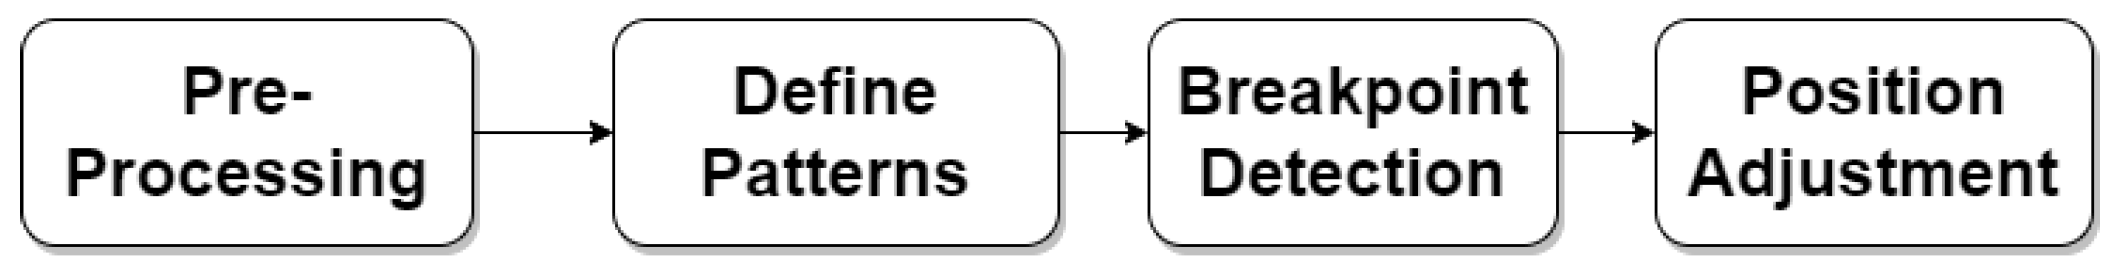
- Detection procedureThe detection procedure can be detailed as follows:
- Pre-process data for outlier removal and denoising;
- Pre-define patterns considering various reservoir models and the influence of noise;
- Choose the number of measurements N that represent the image for pattern recognition; decide the pressure interval in each window;
- Keep the detected break points by discarding the ones below a certain signal standard deviation value .
- c.
- Experiment resultThe author conducted an experiment with synthetic data and two experiments with real data using this method. The detection rate was 86% for the synthetic data and 80% for the real data. The missed detections were mainly due to small pressure changes. The results of the experiment with real data are shown in Figure 10, where the red vertical line indicates the position of the detected break points. The results are based on denoised data.
- d.
- Advantages and DisadvantagesThe Olsen’s method uses pre-defined patterns for break-point detection and can be used for real-time automatic detection once the patterns are properly defined, requiring less user interaction during the detection stage. The method can detect most break points, but may miss some with small magnitude, as seen in the author’s experiments. Data pre-processing is necessary before detection, but care must be taken to avoid oversmoothing the data.
2.4. Segmentation Method
- a.
- Detection theoryRai proposed a segmentation method for break-point detection in [19] which requires only one user input parameter for identifying the break points. The method is based on time series segmentation from Wallace [36] and involves solving a sequence of maximum orthogonal (Euclidean) distance problems at strategic points, as illustrated in Figure 11. The author also attempted to improve the performance by incorporating flow rate data into the segmentation method as a variant.
- b.
- Detection procedureThe detection procedure can be detailed as follows:
- Label the first and the last points in the dataset as two strategic points;
- Find the third point with the maximum orthogonal distance from the line segment joining the two strategic points. Put the third point in the list of strategic points;
- Perform this iterative calculation until the greatest orthogonal distance is smaller than a prescribed threshold .
- c.
- Experiment resultThe author conducted the experiment using this method with the same data using the pressure derivative method mentioned in the pressure data trend type with the derivative method. Figure 12 shows the detection results. The red dots indicate the detected position of break points.
- d.
- Advantages and DisadvantagesThe Rai’s method can detect significant break points without pre-processing or denoising, which is an advantage over other methods. Additionally, it requires less human intervention, as only one threshold is needed to decide the number of break points. However, it may fail to detect some break points with small magnitude, and there are no similar methods found to process PDG data without denoising, so more tests are needed to prove the method’s feasibility. Additionally, the author improved the method’s performance by incorporating flow rate data, but this may not always be available.
3. Comparison of the Methods
4. Discussions
- Pre-processing is considered a necessary step by most methods for transient identification. However, pre-processing should be cautiously used because the processed data may lose the signal of the original data. There is no clear answer to decide on the level of processing.
- Selection of a threshold is crucial for transient identification in many methods reviewed. How to minimize its effect is still an unsolved challenge.
- Transient identification includes considerations of shut-in and flowing transients. From the reviewed literature, both types of identification use the same methods. However, a combined identification methods, which mean identification shut-in transients and multi-rate transients by using different methods may help in improving the identification results.
- The methods reviewed in this article need to be further tested on different datasets. The capabilities of the methods tested on gas or oil wells needs to be studied and further tested on different cases of wells producing or injecting different fluids (like liquid and gases).
- Integrating the methods reviewed with machine learning (ML, including hybrid ML guided by physical models) and other relevant methods is worth to be tested in order to evaluate their suitability for automated transient identification.
5. Conclusions
- The common terms used for processing pressure measurements from permanent downhole gauges (PDG) are defined based on a critical review of the concepts and the terms available in the literature.
- A pressure transient is a predominantly monotonic change of pressure in response to a sudden change of rate.
- A break point is a point in time separating two transients.
- Transient identification is a process of dividing pressure time series into sequential transients based on the objectives of the data interpretation.
- Seven methods for transient identification have been reviewed and grouped into four types.
- Wavelet decomposition methods can effectively detect significant transients, but it needs human interaction for better performance.
- Pressure data trend methods can be easily implemented and understood but require high-quality data pre-processing.
- Pattern recognition methods can be used for real-time transient identification without human interaction during the identification. Human interaction is however needed before the identification of pre-defined patterns.
- The segmentation method can detect transients without pre-processing, but threshold selection is needed for better performance as for the wavelet decomposition above.
- The segmentation and pattern recognition methods may be suggested as the best candidates in the context of automated workflow development. The segmentation method may be considered the best choice taking the simplicity of its application and reduced workload for pre-processing. The main advantage of the pattern recognition method is the ability to use it without human interaction, although based on human pre-defined patterns.
Author Contributions
Funding
Data Availability Statement
Acknowledgments
Conflicts of Interest
References
- Shchipanov, A.A.; Berenblyum, R.A.; Kollbotn, L. Pressure Transient Analysis as an Element of Permanent Reservoir Monitoring. In Proceedings of the SPE Annual Technical Conference and Exhibition, Amsterdam, The Netherlands, 27–29 October 2014. [Google Scholar] [CrossRef]
- Soeriawinata, T.; Kelkar, M. Reservoir Management Using Production Data. In Proceedings of the SPE Oklahoma City Oil and Gas Symposium/Production and Operations Symposium, Oklahoma City, OK, USA, 28–31 March 1999. [Google Scholar] [CrossRef]
- Kamal, M.; Tian, C.; Suleen, S. Use of Transient Tests to Monitor Progress of Flooding in IOR/EOR Operations. In Proceedings of the SPE Annual Technical Conference and Exhibition, Dubai, United Arab Emirates, 26–28 September 2016. [Google Scholar] [CrossRef]
- Ribeiro, P.M.; Horne, R.N. Pressure and Temperature Transient Analysis: Hydraulic Fractured Well Application. In Proceedings of the SPE Annual Technical Conference and Exhibition, New Orleans, LA, USA, 2 October 2013. [Google Scholar] [CrossRef]
- Yousef, A.A.; Gentil, P.; Jensen, J.L.; Lake, L.W. A Capacitance Model To Infer Interwell Connectivity From Production- and Injection-Rate Fluctuations. SPE Reserv. Eval. Eng. 2006, 9, 630–646. [Google Scholar] [CrossRef]
- Sankaran, S.; Wright, D.; Gamblin, H.; Kumar, D. Creating Value by Implementing an Integrated Production Surveillance and Optimization System—An Operator’s Perspective. In Proceedings of the SPE Annual Technical Conference and Exhibition, San Antonio, TX, USA, 9–11 October 2017. [Google Scholar] [CrossRef]
- Ahmadi, M.A.; Ebadi, M.; Hosseini, S.M. Prediction breakthrough time of water coning in the fractured reservoirs by implementing low parameter support vector machine approach. Fuel 2014, 117, 579–589. [Google Scholar] [CrossRef]
- Chorneyko, D.M. Real-Time Reservoir Surveillance Utilizing Permanent Downhole Pressures—An Operator’s Experience. In Proceedings of the SPE Annual Technical Conference and Exhibition, San Antonio, TX, USA, 24–27 September 2006. [Google Scholar] [CrossRef]
- Horne, R.N. Listening to the Reservoir—Interpreting Data From Permanent Downhole Gauges. J. Pet. Technol. 2007, 59, 78–86. [Google Scholar] [CrossRef]
- Shchipanov, A.; Kollbotn, L.; Berenblyum, R. Characterization and monitoring of reservoir flow barriers from pressure transient analysis for CO2 injection in saline aquifers. Int. J. Greenh. Gas Control 2019, 91, 102842. [Google Scholar] [CrossRef]
- Athichanagorn, S.; Horne, R.N.; Kikani, J. Processing and Interpretation of Long-Term Data Acquired From Permanent Pressure Gauges. SPE Reserv. Eval. Eng. 2002, 5, 384–391. [Google Scholar] [CrossRef]
- Nomura, M. Processing and Interpretation of Pressure Transient Data from Permanent Downhole Gauges. Ph.D. Thesis, Stanford University, Stanford, CA, USA, 2006. [Google Scholar]
- Cumming, J.A.; Wooff, D.A.; Whittle, T.; Gringarten, A.C. Multiwell Deconvolution. SPE Reserv. Eval. Eng. 2014, 17, 457–465. [Google Scholar] [CrossRef]
- Liu, Y.; Horne, R.N. Interpreting Pressure and Flow-Rate Data From Permanent Downhole Gauges by Use of Data-Mining Approaches. SPE J. 2012, 18, 69–82. [Google Scholar] [CrossRef]
- Liu, Y.; Horne, R.N. Interpreting Pressure and Flow Rate Data from Permanent Downhole Gauges Using Convolution-Kernel-Based Data Mining Approaches. In Proceedings of the SPE Western Regional Meeting, Monterey, CA, USA, 19–25 April 2013. [Google Scholar] [CrossRef]
- Tian, C.; Horne, R.N. Applying Machine Learning Techniques to Interpret Flow Rate, Pressure and Temperature Data From Permanent Downhole Gauges. In Proceedings of the SPE Western Regional Meeting, Garden Grove, CA, USA, 27–30 April 2015. [Google Scholar] [CrossRef]
- Tian, C.; Horne, R.N. Recurrent Neural Networks for Permanent Downhole Gauge Data Analysis. In Proceedings of the SPE Annual Technical Conference and Exhibition, San Antonio, TX, USA, 9–11 October 2017. [Google Scholar] [CrossRef]
- Kin, K. Permanent Downhole Gauge Data Interpretation. Master’s Thesis, Stanford University, Stanford, CA, USA, 2001. [Google Scholar]
- Rai, H.; Horne, R.N. Analyzing Simultaneous Rate and Pressure Data from Permanent Downhole Gauges. In Proceedings of the SPE Annual Technical Conference and Exhibition, Anaheim, CA, USA, 11–14 November 2007. [Google Scholar] [CrossRef]
- Liu, Y. Interpreting Pressure and Flow Rate Data from Permanent Downhole Gauges Using Data Mining Approaches. Ph.D. Thesis, Stanford University, Stanford, CA, USA, 2013. [Google Scholar]
- Thomas, A.O. The Data as the Model: Interpreting Permanent Downhole Gauge Data without Knowing the Reservoir Model. Master’s Thesis, Stanford University, Stanford, CA, USA, 2002. [Google Scholar]
- Athichanagorn, S. Development of an Interpretation Methodology for Long-Term Pressure Data from Permanent Downhole Gauges. Ph.D. Thesis, Stanford University, Stanford, CA, USA, 1999. [Google Scholar]
- Li, X. Processing and Analysis of Transient Data from Permanent Down-Hole Gauges (PDG). Ph.D. Thesis, Heriot-Watt University, Edinburgh, Scotland, 2009. [Google Scholar]
- Tian, C. Machine Learning Approaches for Permanent Downhole Gauge Data Interpretation. Ph.D. Thesis, Stanford University, Stanford, CA, USA, 2018. [Google Scholar]
- Shchipanov, A.A.; Kollbotn, L.; Prosvirnov, M. Step Rate Test as a Way to Understand Well Performance in Fractured Carbonates. In Proceedings of the 79th EAGE Annual Conference & Exhibition, Paris, France, 12–15 June 2017. [Google Scholar] [CrossRef]
- Mallat, S.; Hwang, W. Singularity detection and processing with wavelets. IEEE Trans. Inf. Theory 1992, 38, 617–643. [Google Scholar] [CrossRef]
- Crouse, M.; Nowak, R.; Baraniuk, R. Wavelet-based statistical signal processing using hidden Markov models. IEEE Trans. Signal Process. 1998, 46, 886–902. [Google Scholar] [CrossRef] [Green Version]
- Ouyang, L.B.; Kikani, J. Improving Permanent Downhole Gauge (PDG) Data Processing via Wavelet Analysis. In Proceedings of the European Petroleum Conference, Aberdeen, UK, 29–31 October 2002. [Google Scholar] [CrossRef]
- Soliman, M.Y.; Ansah, J.; Stephenson, S.; Mandal, B. Application of Wavelet Transform to Analysis of Pressure Transient Data. In Proceedings of the SPE Annual Technical Conference and Exhibition, New Orleans, LA, USA, 30 September–3 October 2001. [Google Scholar] [CrossRef]
- Viberti, D.; Verga, F.; Delbosco, P. An Improved Treatment of Long-Term Pressure Data for Capturing Information. SPE Reserv. Eval. Eng. 2007, 10, 359–366. [Google Scholar] [CrossRef]
- Maragos, P. Slope transforms: Theory and application to nonlinear signal processing. IEEE Trans. Signal Process. 1995, 43, 864–877. [Google Scholar] [CrossRef]
- Culea-Florescu, A.; Aiordachioaie, D. Some results on change detection based on advanced signal processing paradigm. In Proceedings of the 2016 8th International Conference on Electronics, Computers and Artificial Intelligence (ECAI), Ploiesti, Romania, 30 June–2 July 2016. [Google Scholar] [CrossRef]
- Suzuki, S.; Chorneyko, D. Automatic Detection of Pressure-Buildup Intervals From Permanent Downhole Pressure Data Using Filter Convolution. In Proceedings of the SPE Annual Technical Conference and Exhibition, New Orleans, LA, USA, 4–7 October 2009. [Google Scholar] [CrossRef]
- Olsen, S. On Automatic Data Processing and Well-Test Analysis in Real-Time Reservoir Management Applications. Ph.D. Thesis, University of Bergen, Bergen, Norway, 2011. [Google Scholar]
- Olsen, S.; Nordtvedt, J.E. Automatic Filtering and Monitoring of Real-Time Reservoir and Production Data. In Proceedings of the SPE Annual Technical Conference and Exhibition, Dallas, TX, USA, 9–12 October 2005. [Google Scholar] [CrossRef]
- Wallace, W.E.; Kearsley, A.J.; Guttman, C.M. An Operator-Independent Approach to Mass Spectral Peak Identification and Integration. Anal. Chem. 2004, 76, 2446–2452. [Google Scholar] [CrossRef] [PubMed]
- Chen, L. Transient Identification and Interpretation of Real-Time Pressure Data from Modern Well Surveillance Systems. Master’s Thesis, University of Stavanger, Stavanger, Norway, 2022. [Google Scholar]


| Main Idea | Advantages | Disadvantages | Key Input | |
|---|---|---|---|---|
| Wavelet modulus maxima | Detect break points by detailed signal higher than threshold after wavelet decomposition. | Significant break points can be detected. | Pre-processing is needed. Some false break points are detected. Human intervention to adjust threshold. | Decomposition level L, Threshold |
| Data grouping | Detect break points by statistical analysis in the detailed signal after wavelet decomposition. | Both big and small break points can be detected. The detected position is more precise. | Pre-processing is needed. Some false break points are detected. Human intervention to adjust threshold. | Decomposition level L, Threshold |
| Pressure slope | Detect break points by slope value higher than threshold. | Easy to implement. Significant break points can be detected. | Pre-processing is needed. Some false break points are detected. Human intervention to adjust threshold. Some break points missed. | Number of points N, Threshold |
| Pressure derivative | Detect break points by derivative value higher than threshold. | Significant break points can be detected. Filtering is part of pre-processing. | Pre-processing is needed. Many parameters to choose. Human interaction to adjust threshold. Some break points missed | Window size S, Polynomial order , Derivative order , Threshold |
| Filter convonlution | Detect break points by processed signal higher than threshold. | Significant break points can be detected. Tolerant to low level noise. Less human interaction. | Pre-processing is needed. Sensitive to high noise level. Human interaction to adjust threshold. | Patterns criterion C Window size S, Threshold |
| Pattern recognition | Detect break points by the shape belongs to pre-defined patterns | Significant break points can be detected. Require less human interaction. | Pre-processing is needed. Failed to detect break points with small magnitude. Caution to avoid oversmoothing. | Patterns criterion C, Number of points N, Pressure difference P |
| Segmentation | Detect break points by calculating data distance smaller than threshold. | Significant break points can be detected. Denoising may not be required. Less human interaction. | Outliers affect result. Some break points missed. Human interaction to adjust threshold. Need to confirm the detected position | Threshold |
Disclaimer/Publisher’s Note: The statements, opinions and data contained in all publications are solely those of the individual author(s) and contributor(s) and not of MDPI and/or the editor(s). MDPI and/or the editor(s) disclaim responsibility for any injury to people or property resulting from any ideas, methods, instructions or products referred to in the content. |
© 2023 by the authors. Licensee MDPI, Basel, Switzerland. This article is an open access article distributed under the terms and conditions of the Creative Commons Attribution (CC BY) license (https://creativecommons.org/licenses/by/4.0/).
Share and Cite
Cui, B.; Chen, L.; Zhang, N.; Shchipanov, A.; Demyanov, V.; Rong, C. Review of Different Methods for Identification of Transients in Pressure Measurements by Permanent Downhole Gauges Installed in Wells. Energies 2023, 16, 1689. https://0-doi-org.brum.beds.ac.uk/10.3390/en16041689
Cui B, Chen L, Zhang N, Shchipanov A, Demyanov V, Rong C. Review of Different Methods for Identification of Transients in Pressure Measurements by Permanent Downhole Gauges Installed in Wells. Energies. 2023; 16(4):1689. https://0-doi-org.brum.beds.ac.uk/10.3390/en16041689
Chicago/Turabian StyleCui, Boyu, Lejun Chen, Nan Zhang, Anton Shchipanov, Vasily Demyanov, and Chunming Rong. 2023. "Review of Different Methods for Identification of Transients in Pressure Measurements by Permanent Downhole Gauges Installed in Wells" Energies 16, no. 4: 1689. https://0-doi-org.brum.beds.ac.uk/10.3390/en16041689