
Impact Assessment of Electric Vehicle Charging in an AC and DC Microgrid: A Comparative Study †

 ,
,  ,
,  , and
, and
Abstract
:1. Introduction
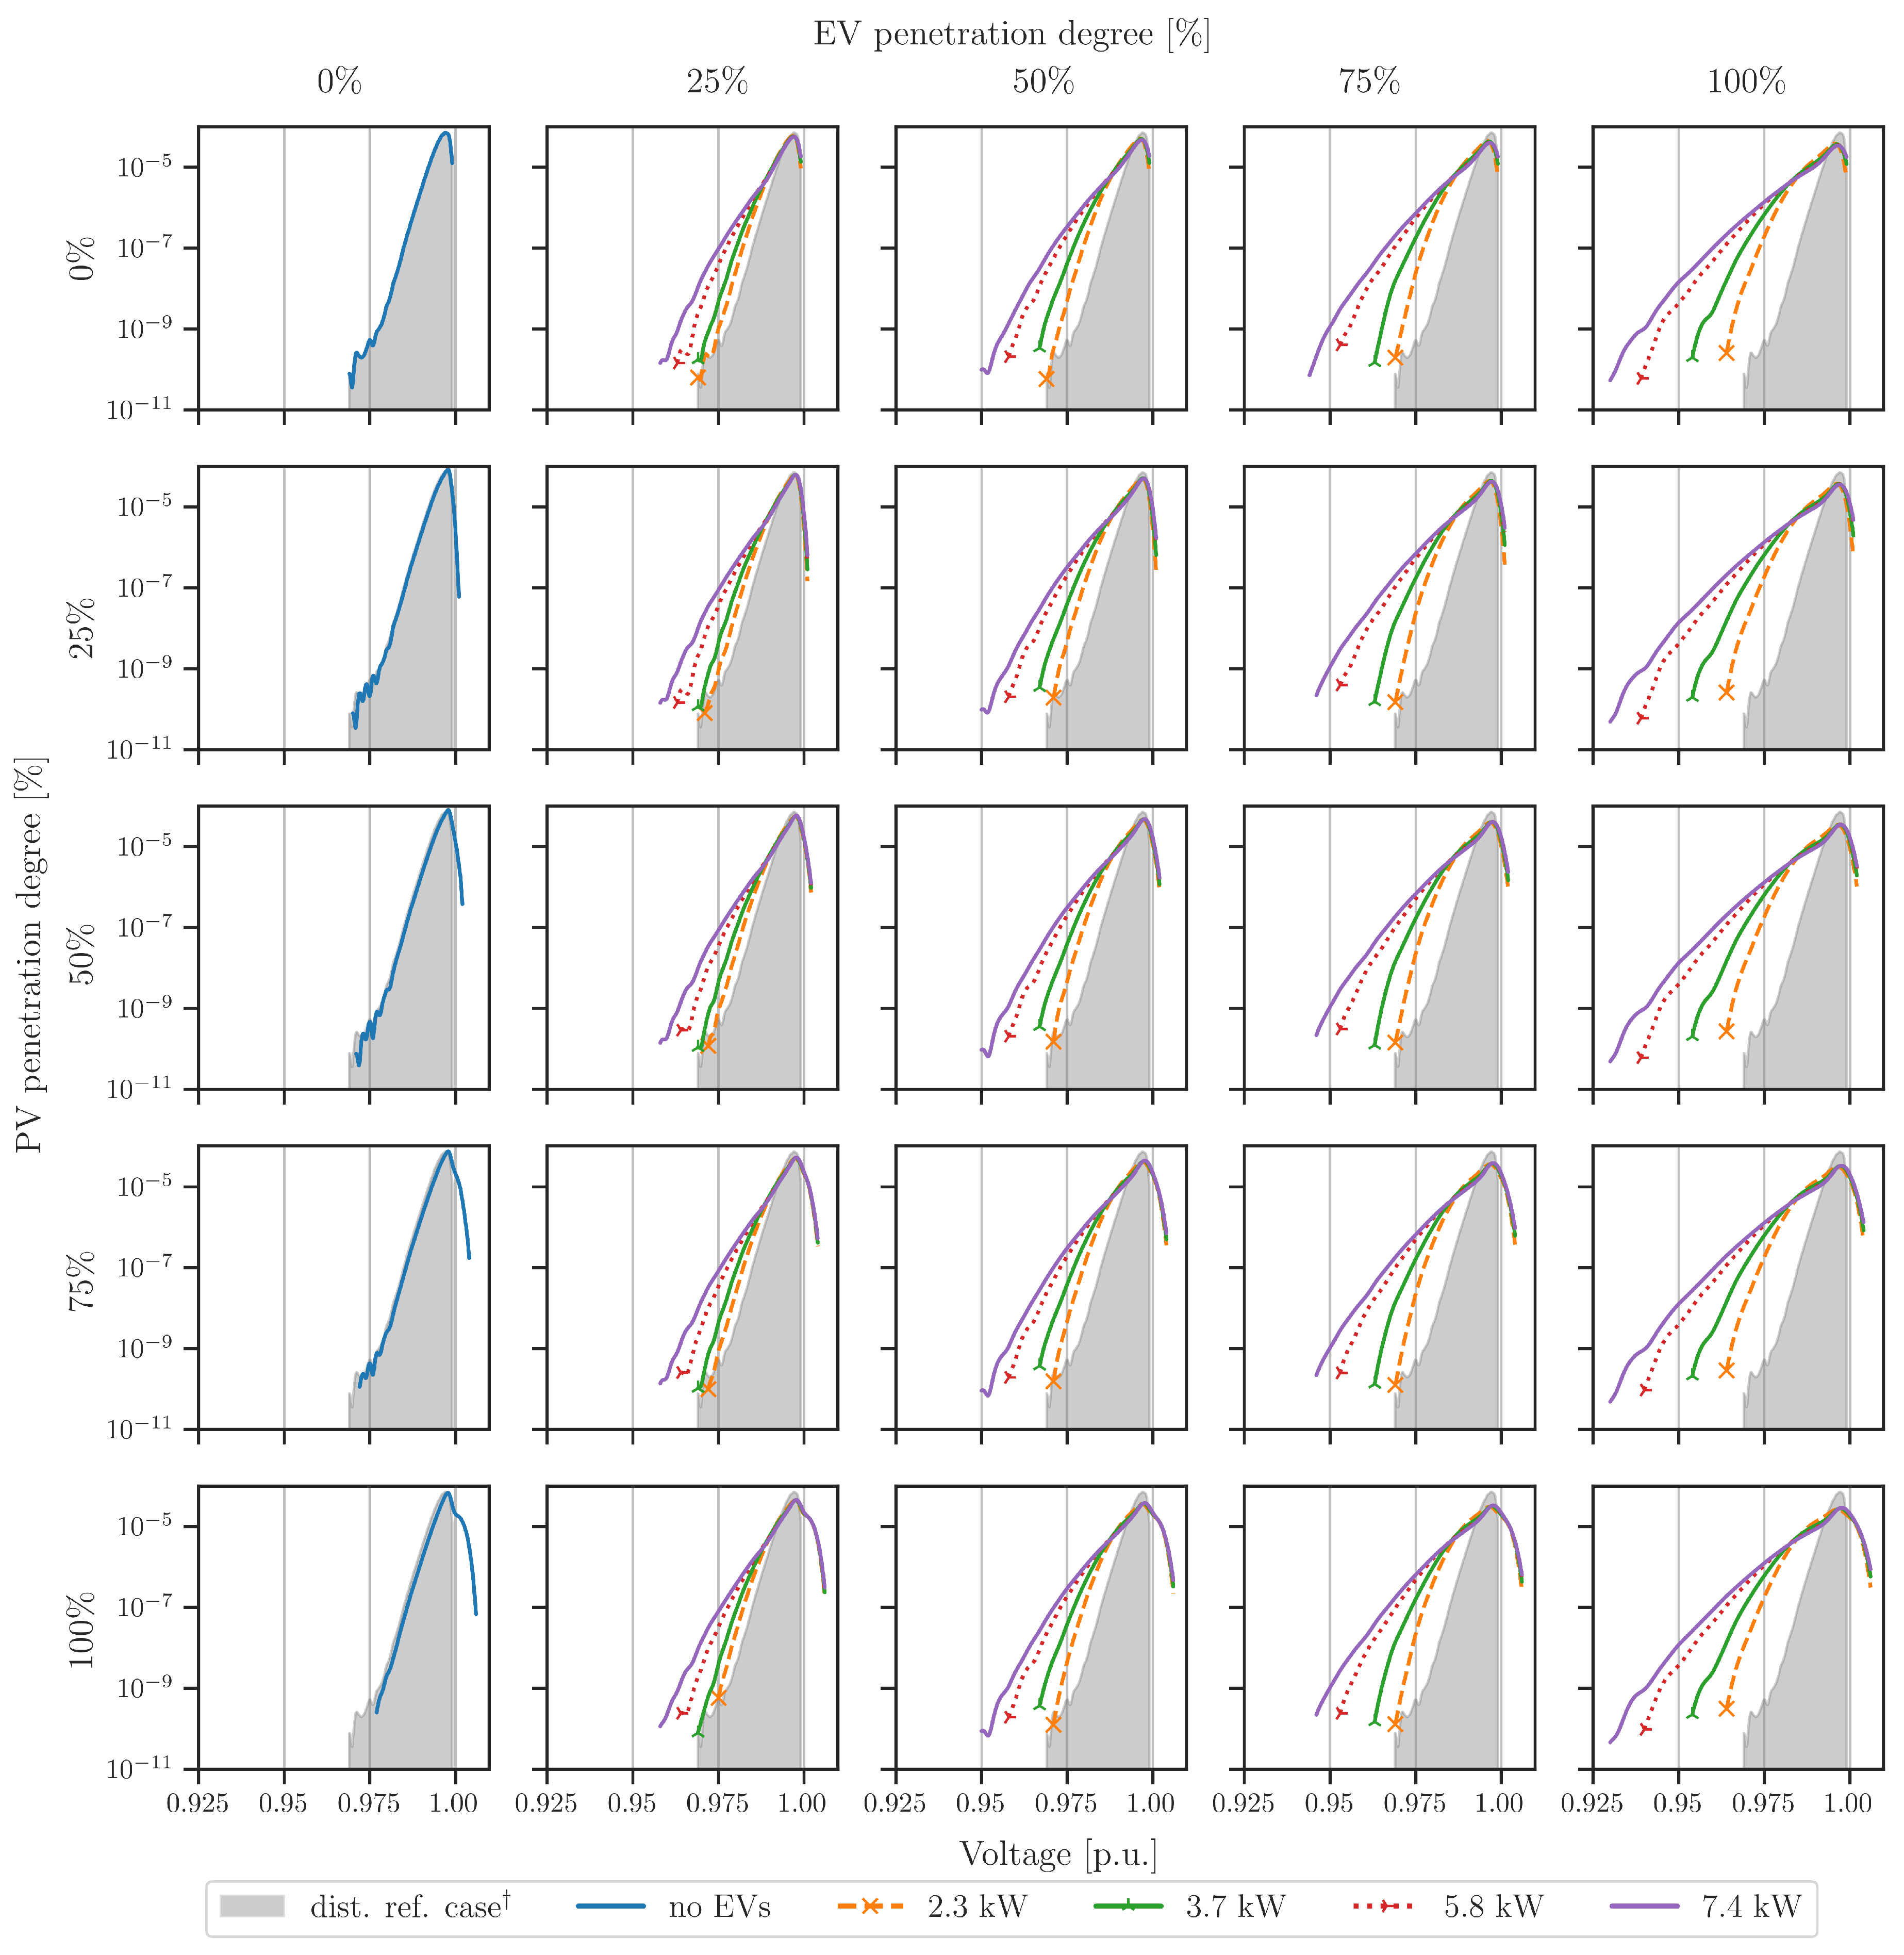
- An analysis of the impact of various EV and PV penetrations on the voltage profiles is performed based on the probability distributions of the arrival times and state-of-charge (SoC) conditions upon arrival. Results are assessed for compliance with the EN 50160 standard.
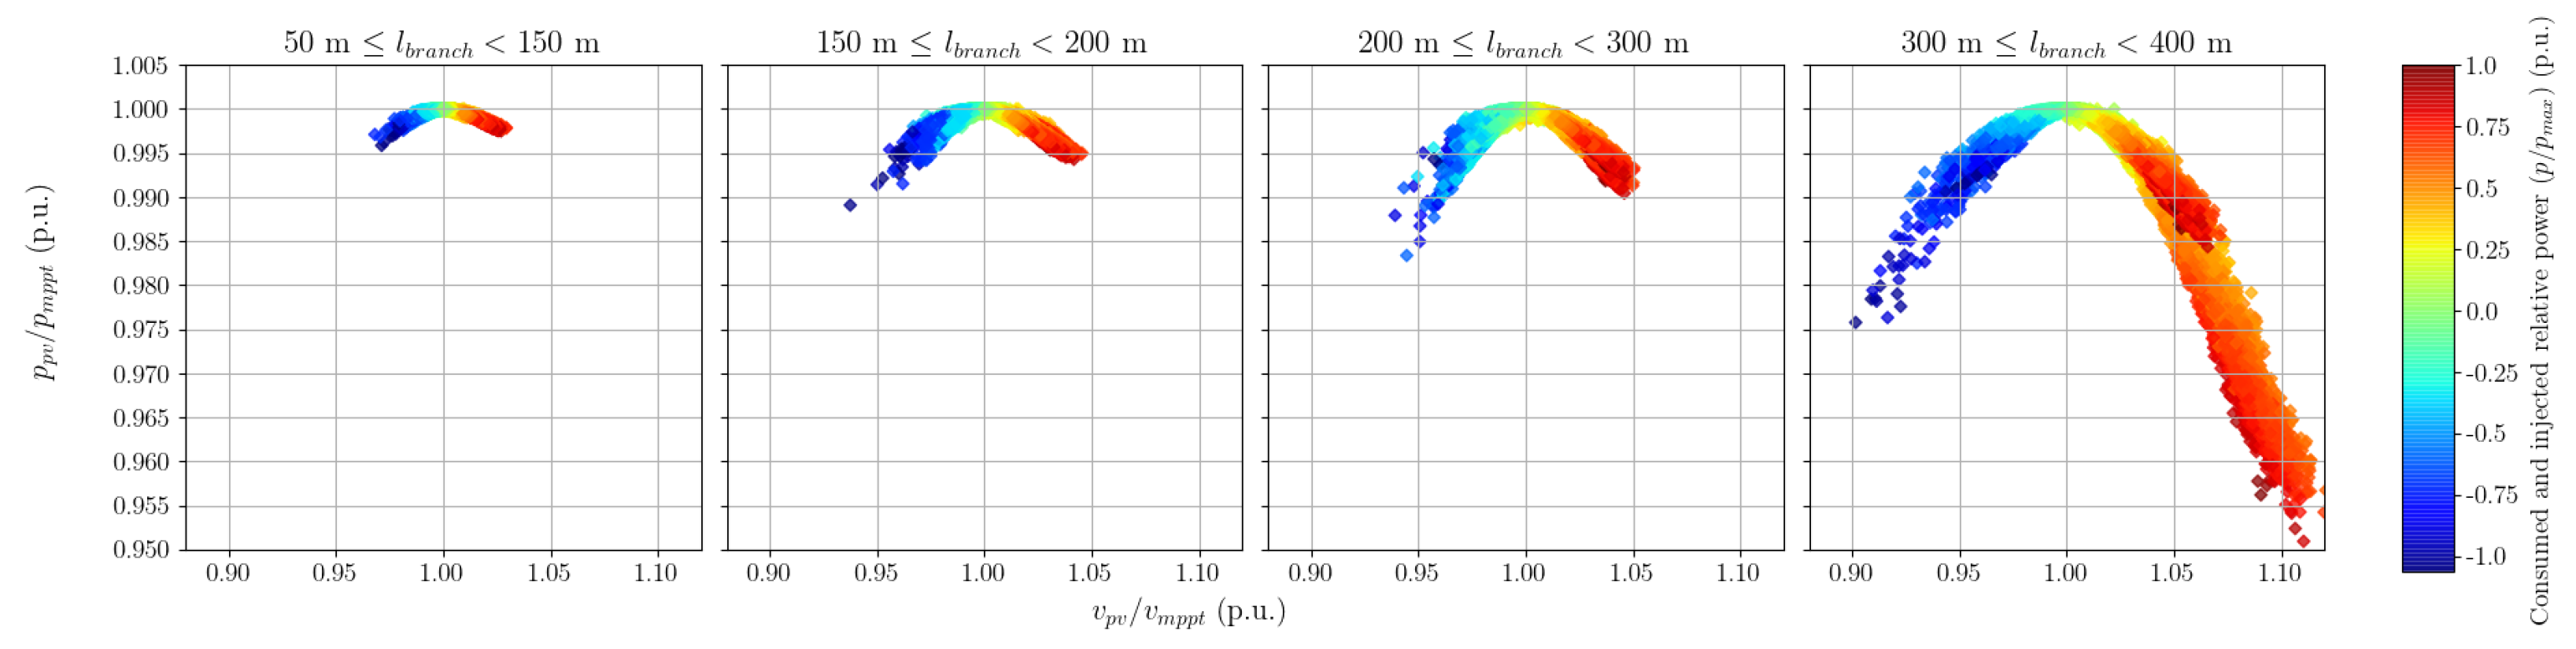
- The impact of the voltage profiles on the PV curtailment losses on the LVDC backbone is assessed. This is due to the fact that all PV systems are directly connected to the branch without an intermediate DC/DC converter. Branch voltages are set in the central DC/DC converters to follow the maximum power point voltage of the PV systems. The stochastic EV demand and solar irradiance may cause the voltage profile along the network to fluctuate, resulting in PV curtailment losses.
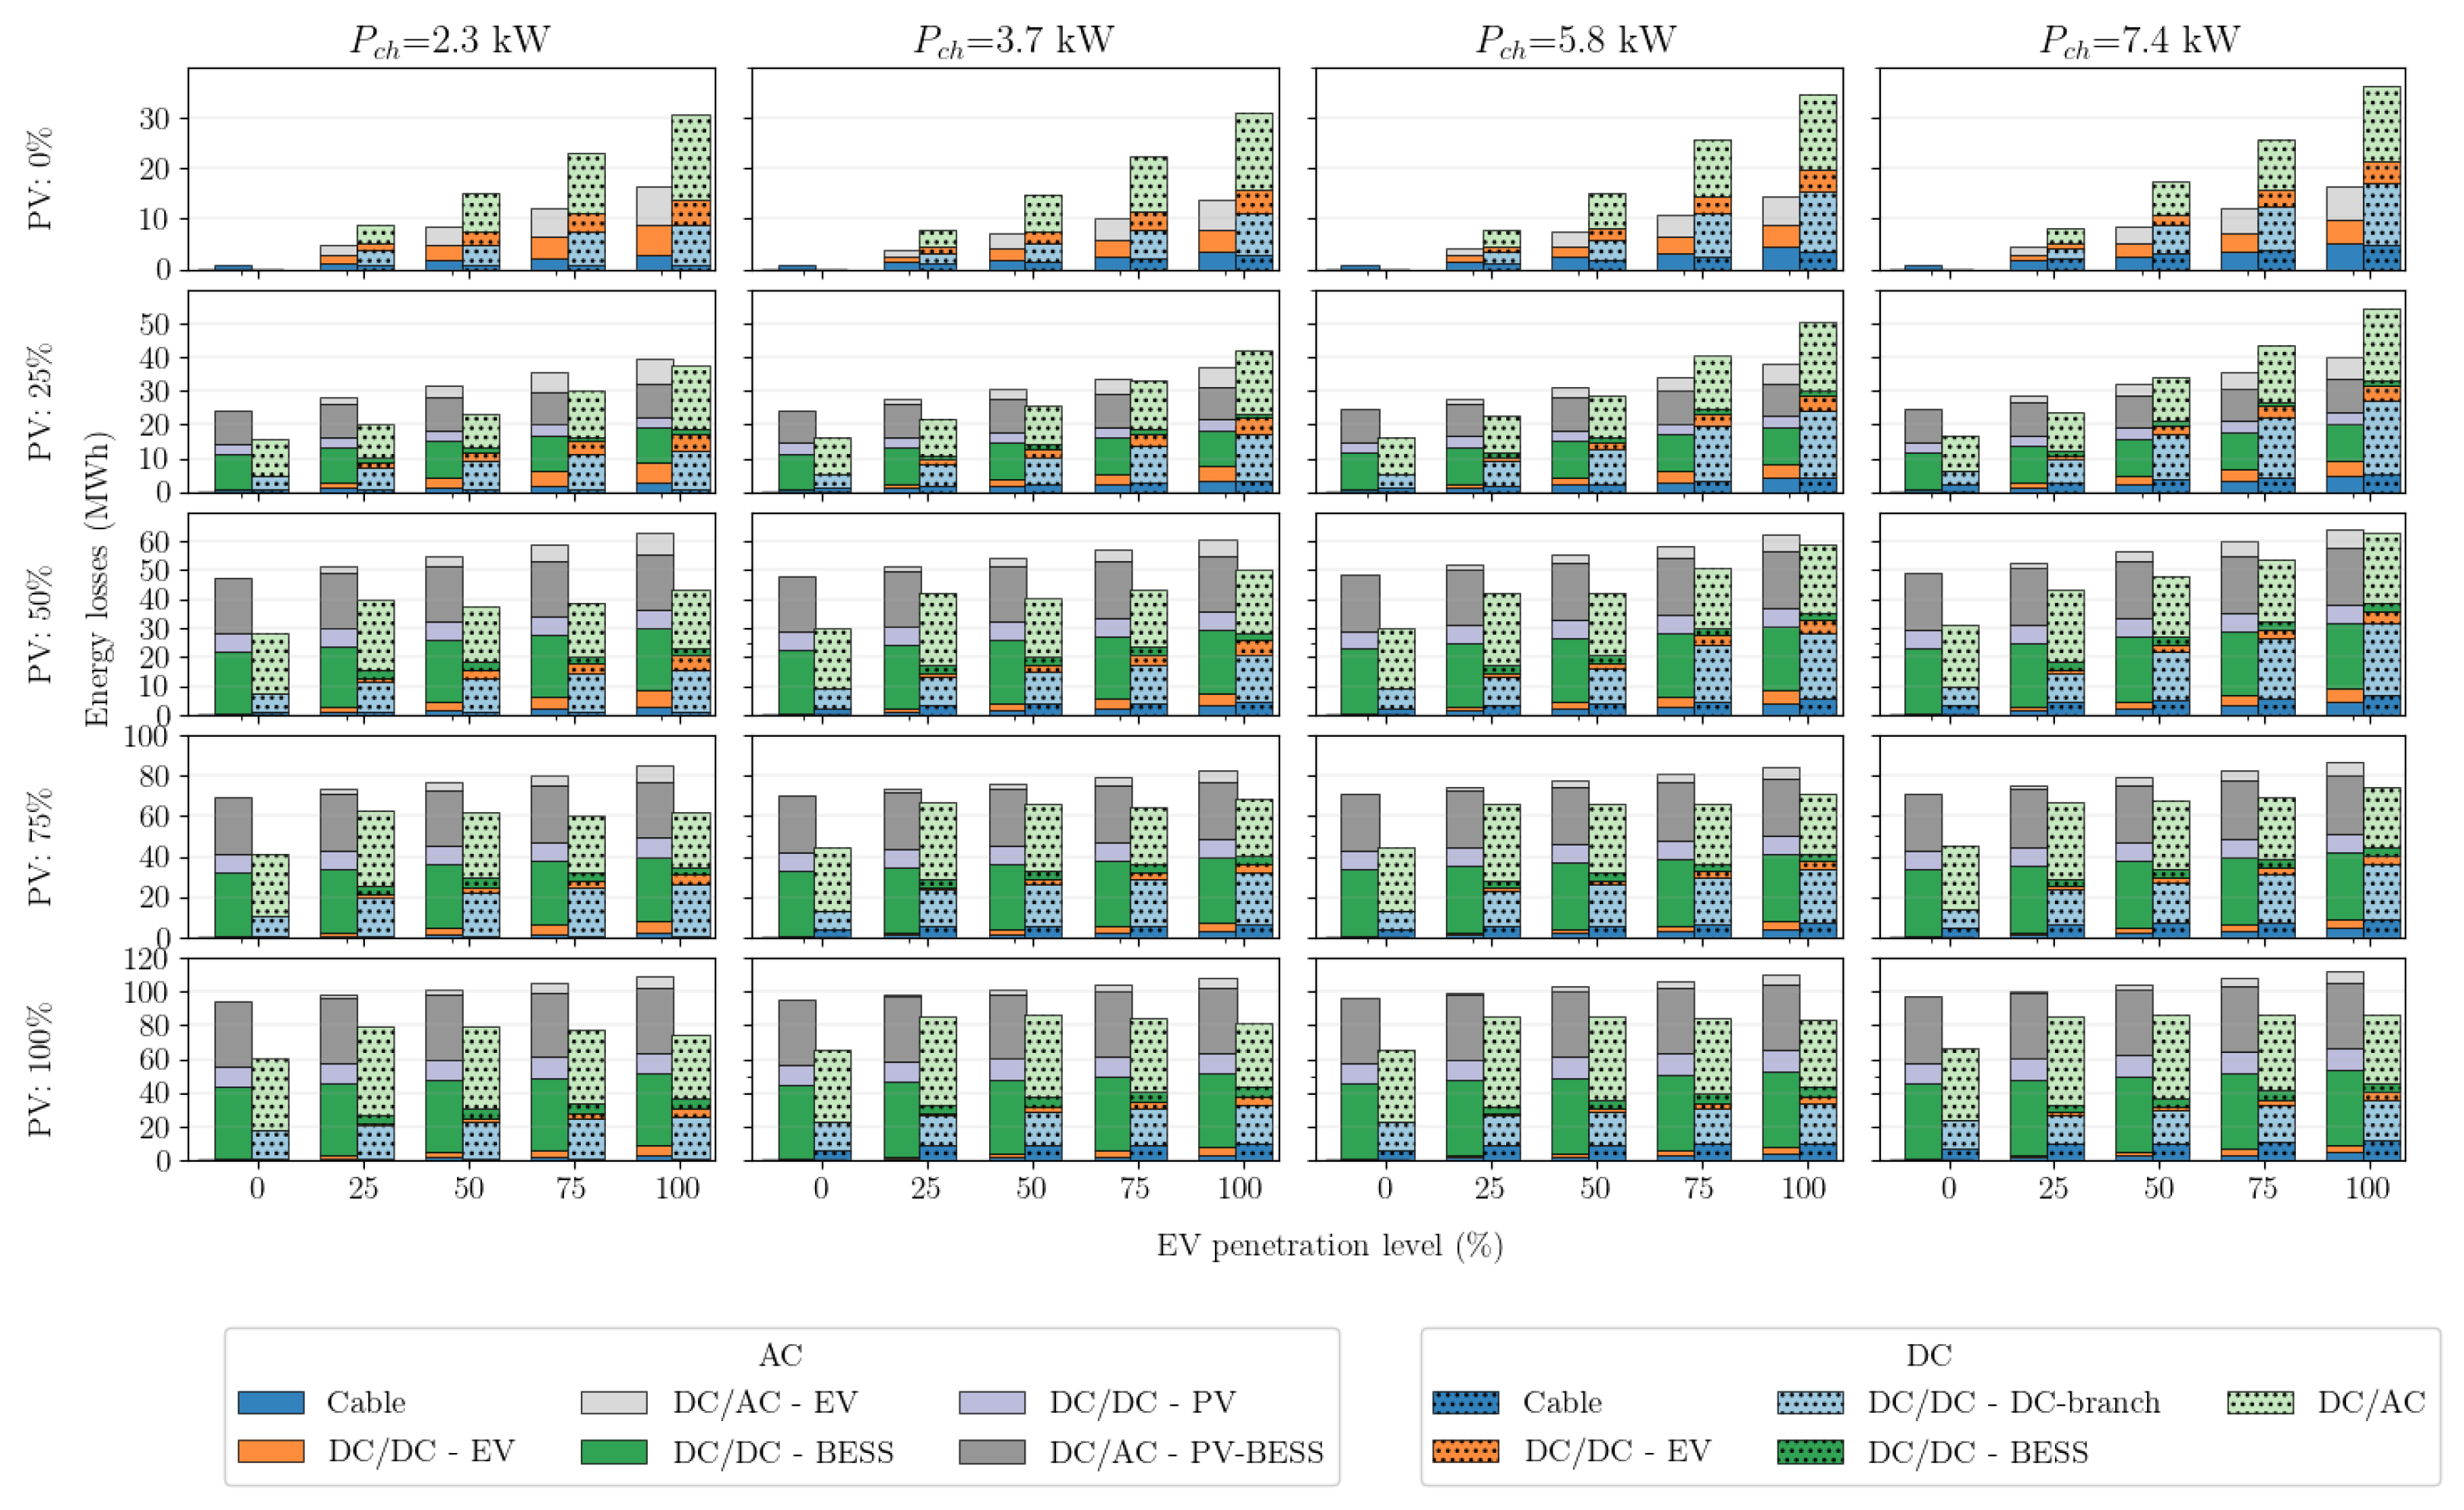
- The different losses to distinguish the cable losses and converter losses in both architectures are extensively investigated.
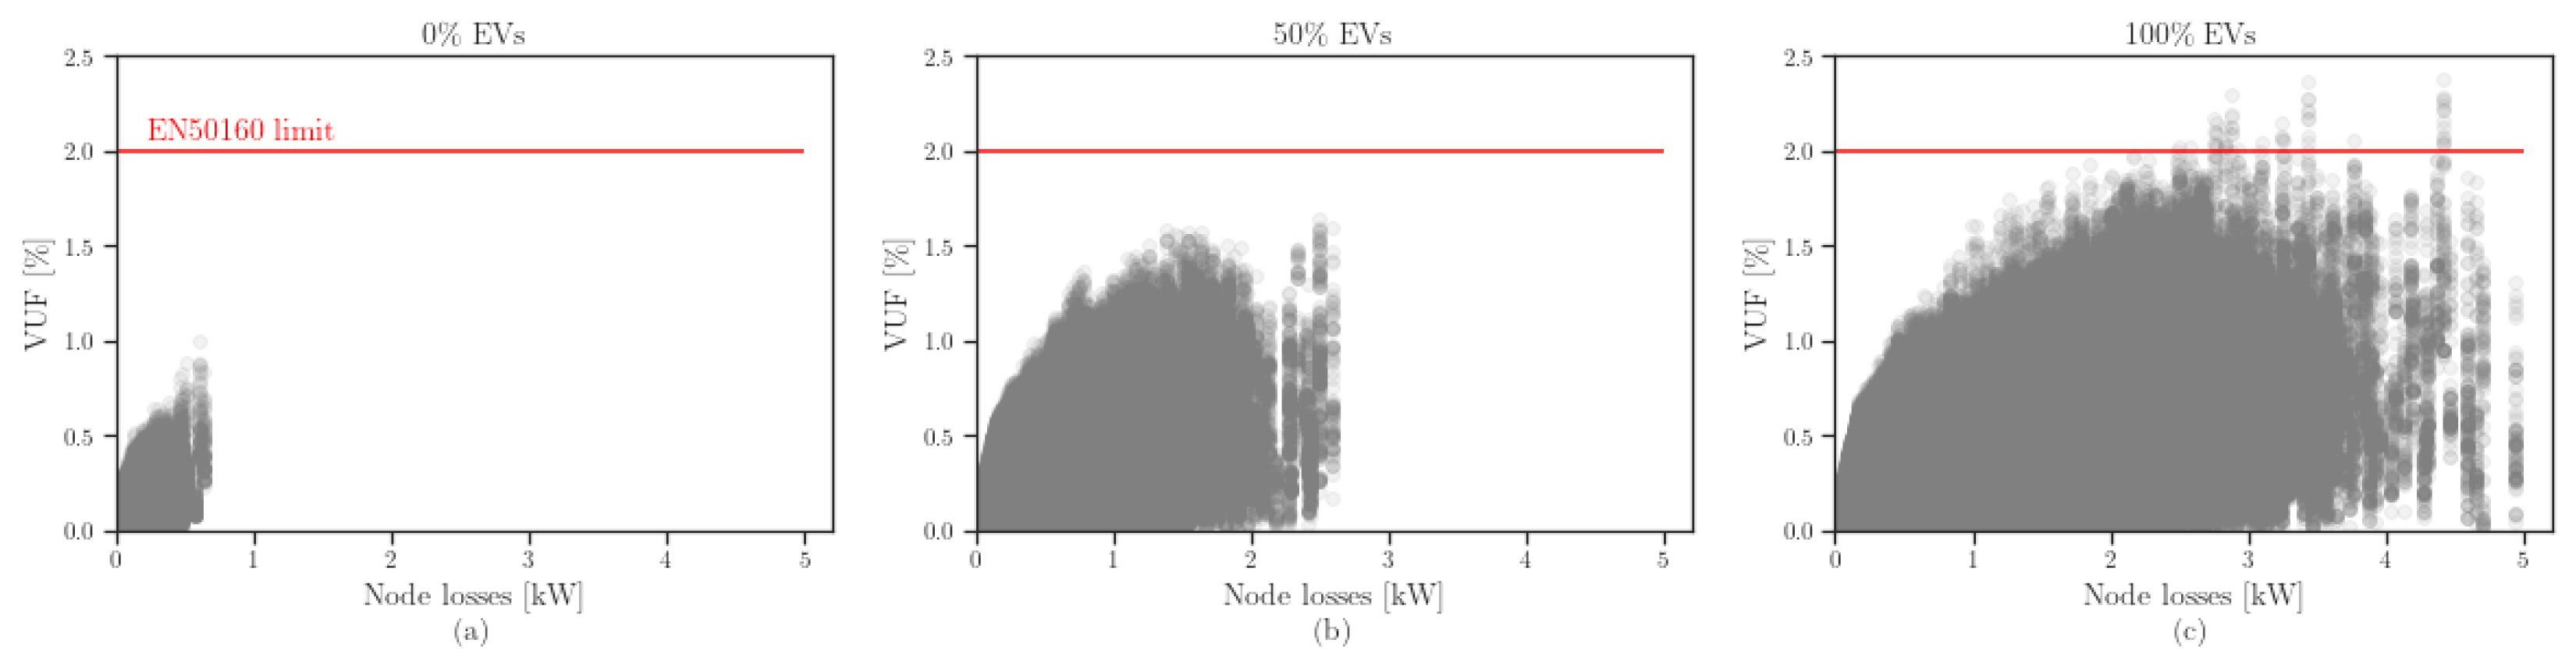
- The voltage unbalance factor () for the worst-case scenario with different EV penetration levels, the correlation with the node losses and the violation thresholds will all be assessed and identified.
2. Literature Review
2.1. Research in the Field of LVDC Backbones
2.2. Research Related to the Impact of EVs
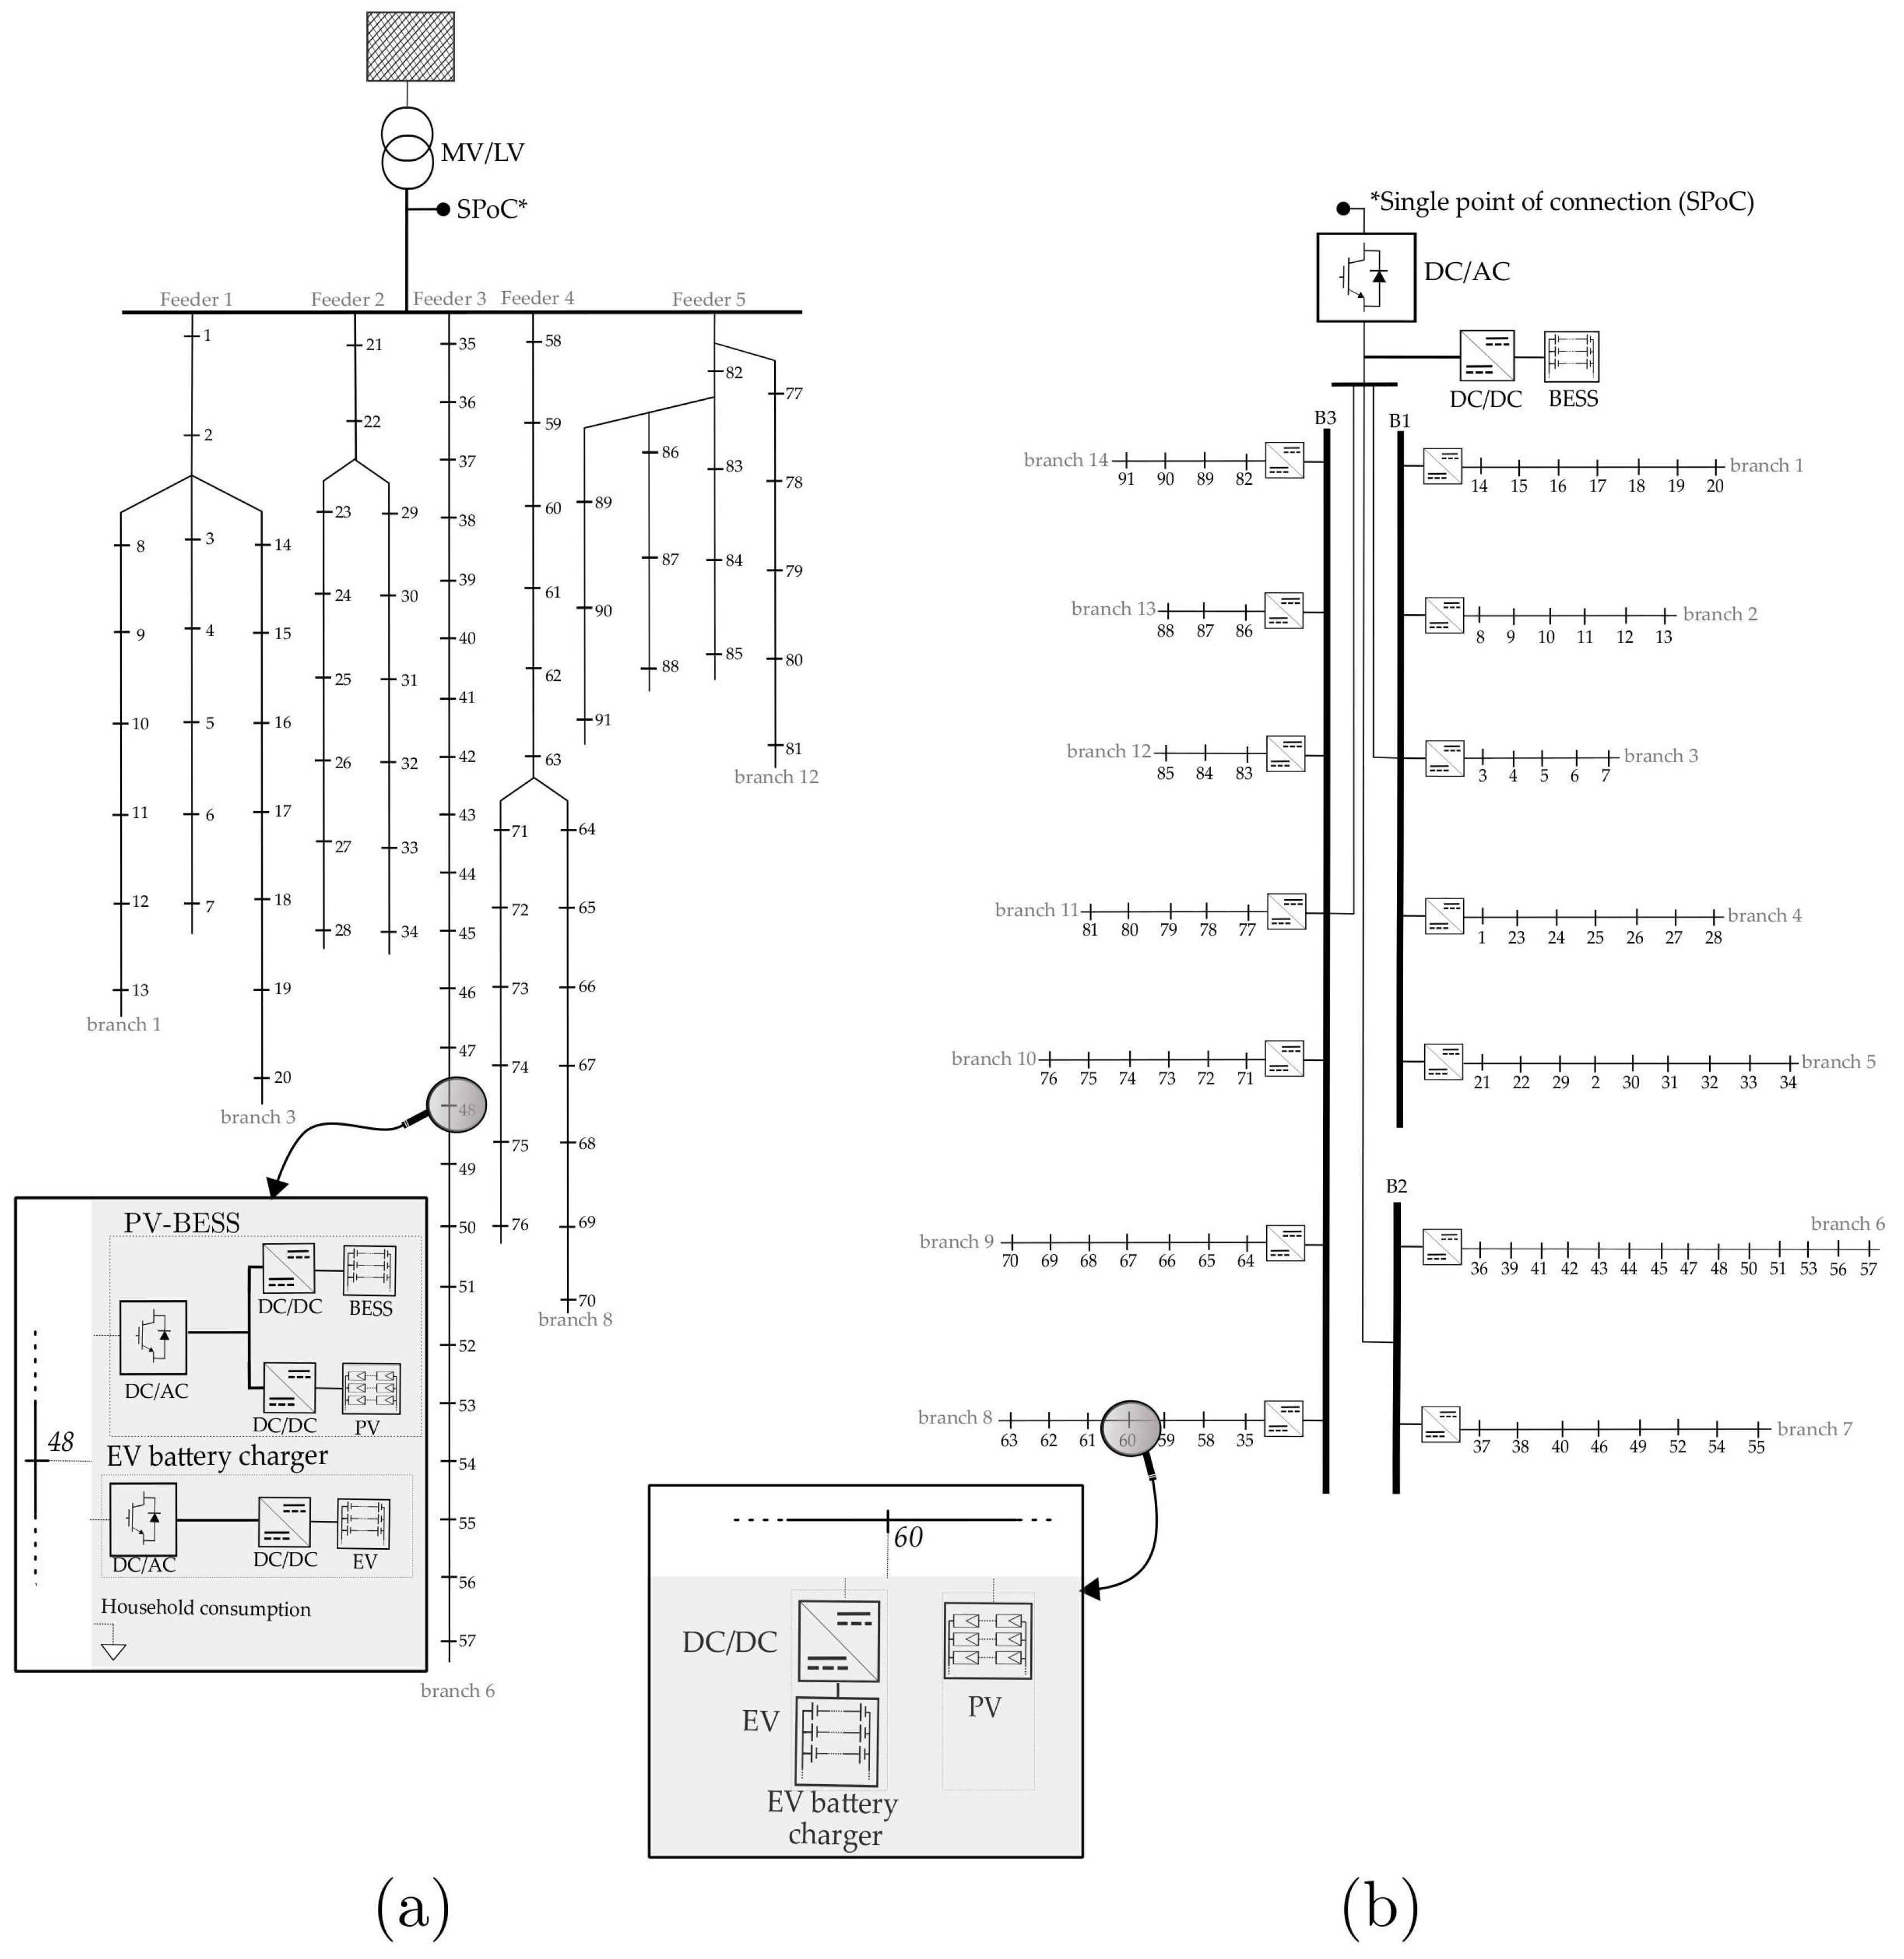
3. Methodology
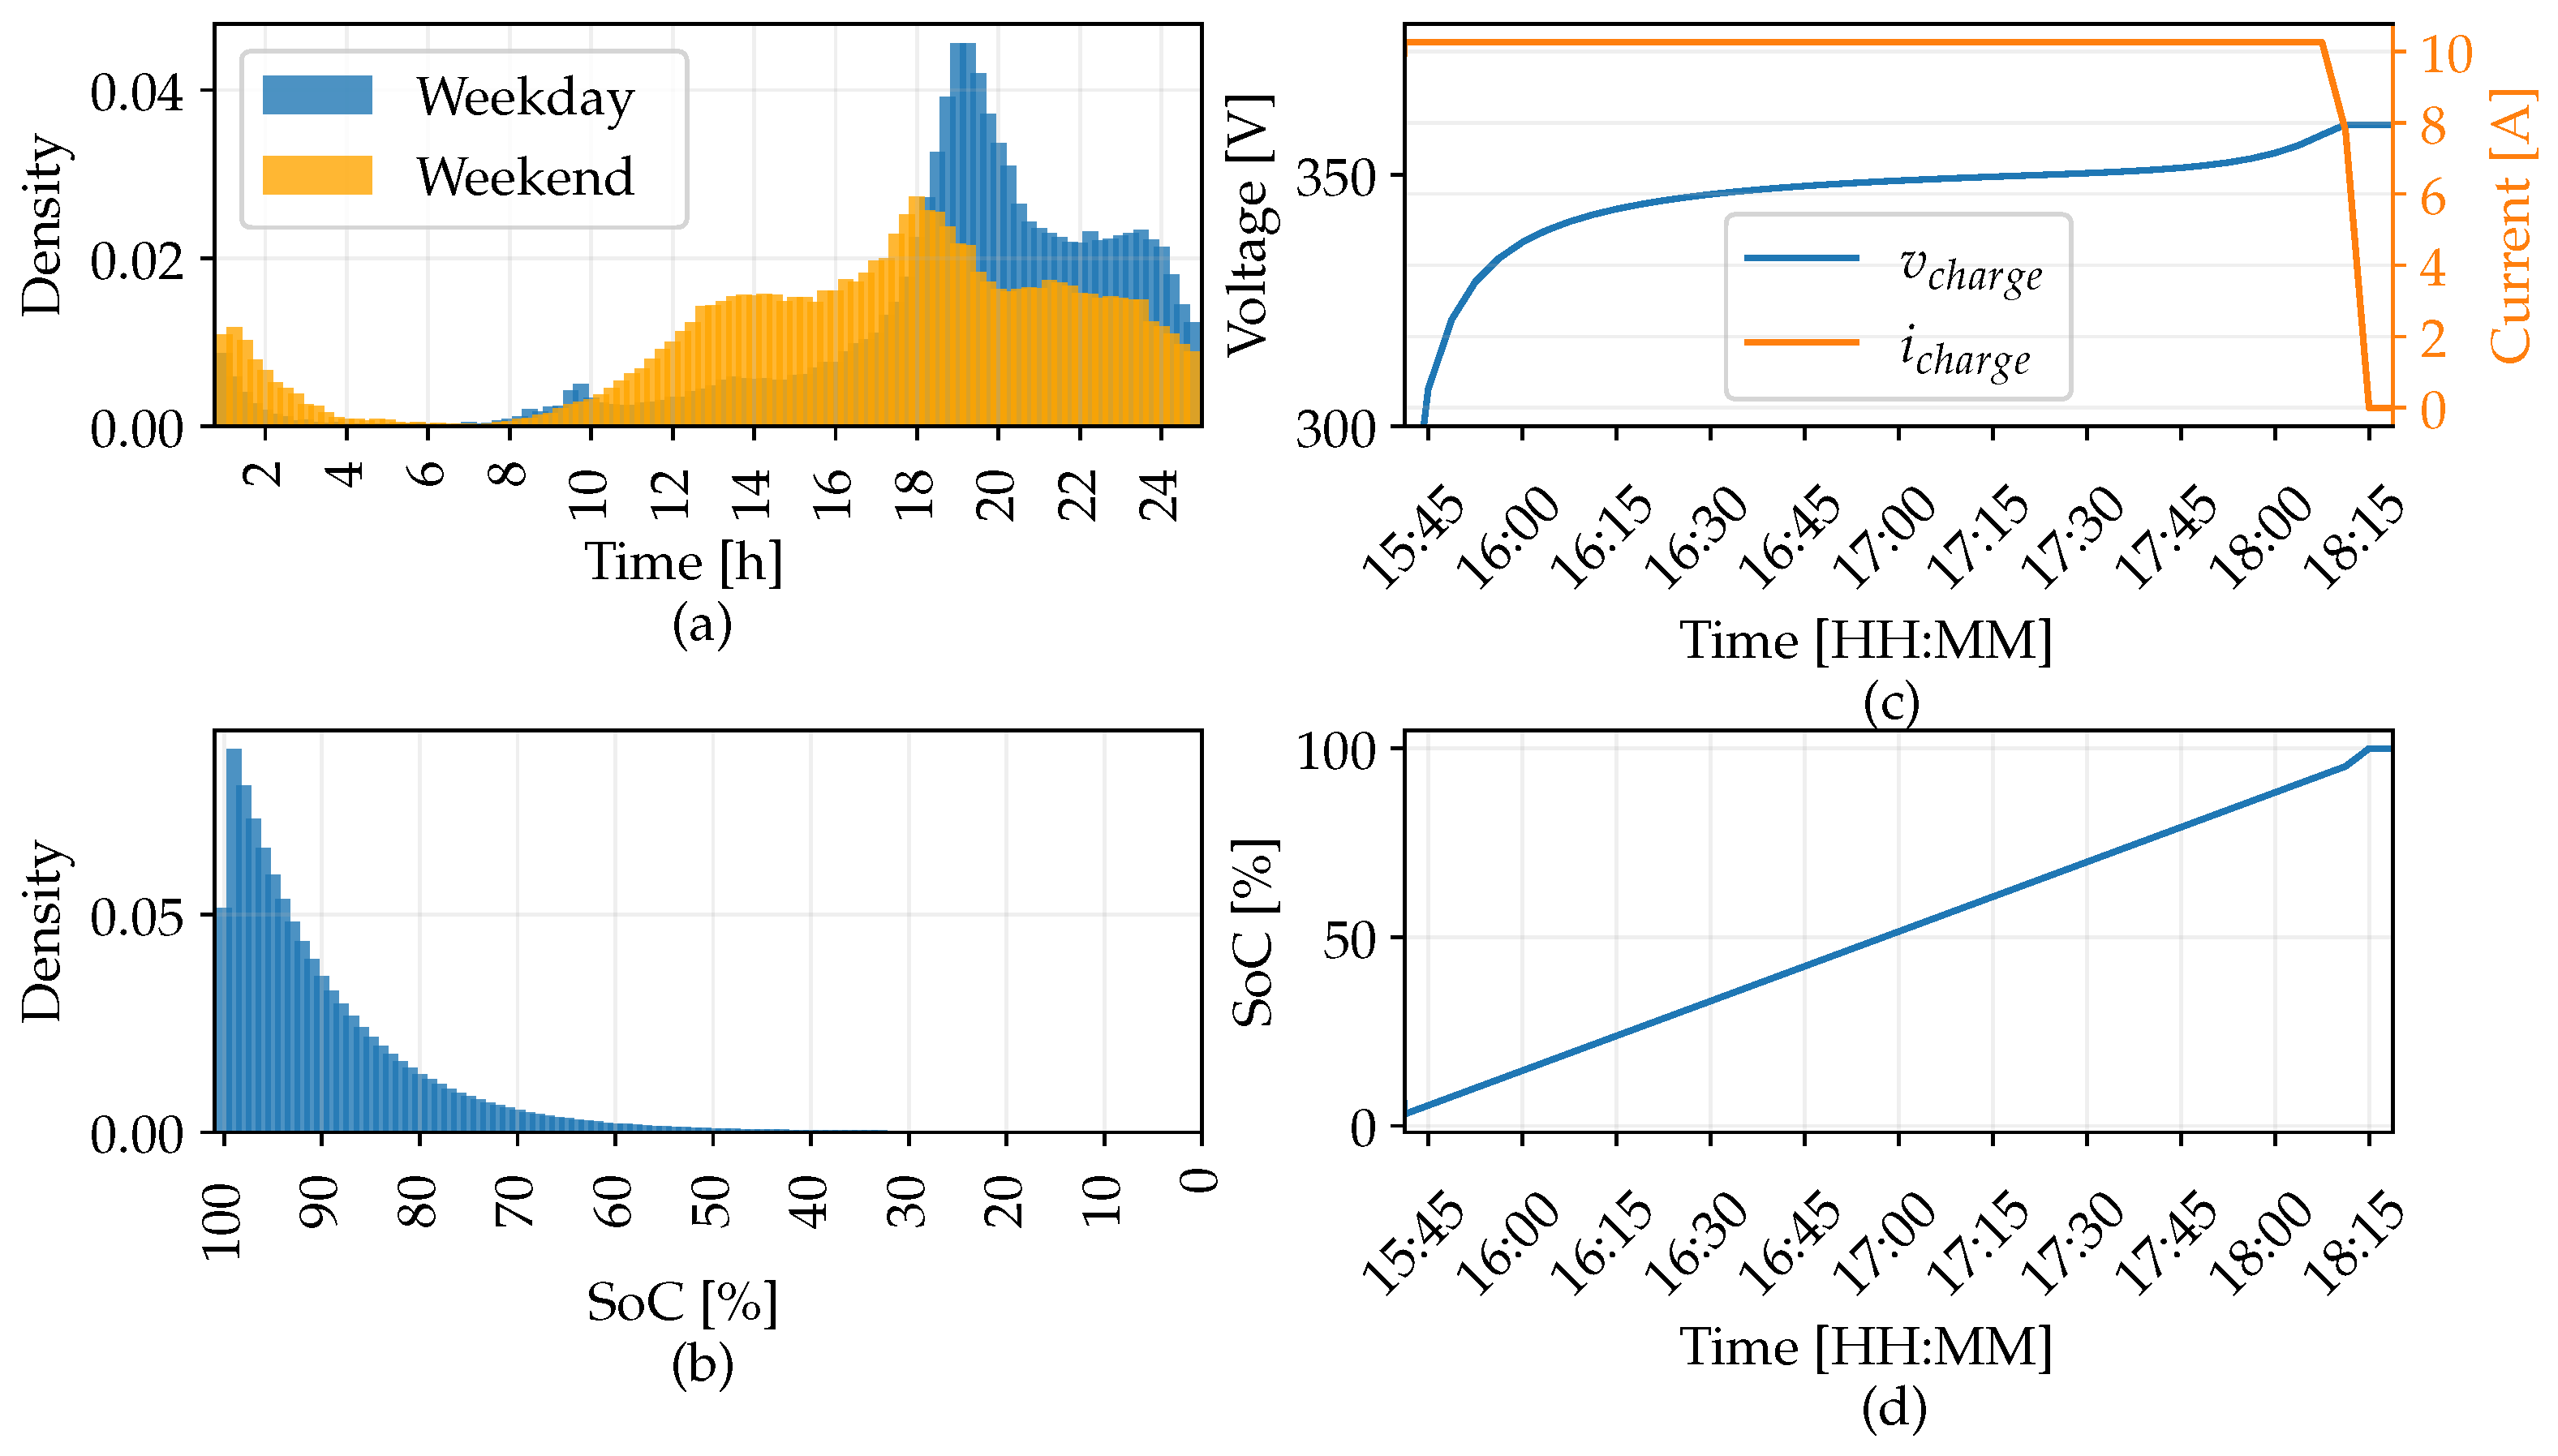
3.1. Datasets
3.2. PV-BESS Modelling
3.3. Power Flow Analysis
4. Results
4.1. Voltage Profiles—Partim AC
4.2. Voltage Profiles—Partim DC
4.3. Energy Losses
4.4. Voltage Unbalance
4.5. Results Discussion
- –
- No violation of the voltage limit was observed in the AC part. This was highly expected for the case with PV systems since the coupled BESS ensures that the injection is limited. However, when exclusively EVs are connected, the occurring voltage drop strongly depends on the load capacity on the one hand and on the presence or absence of a PV system on the other hand. In the case of 100% penetration of EVs with a 7.4 kW charging rate, the minimum voltage level observed is 0.92 p.u., corresponding to 211 V.
- –
- The directly connected PV systems on the DC-branches increase the SC by the locally distributed EV chargers. However, a drawback of this architecture is that a voltage drop or rise leads to a reduction in power, going up to 5% for longer cable lengths. Nevertheless, an undervoltage caused by a high simultaneity of EV charging leads to a limited power reduction of 2.5%. This can be explained by the fact that during undervoltage, the PV systems operate on the left side of the maximum power which has a lower slope than on the right side.
- –
- Comparing the absence of electric vehicles with the systematic introduction of EVs (i.e., in steps of 25%), one notices that the energy losses associated with charging not only cause higher losses but reveal a linear relationship with the voltage imbalance within the DN. Furthermore, the study demonstrates that from integration levels of 75% and onwards, voltage unbalance violations of the EN 50160 standard are recorded. Consequently, a considerable advantage of unipolar LVDC backbones manifests itself in the absence of voltage unbalance. Therefore, higher levels of EVs can be connected to the DN without causing predominant losses.
- –
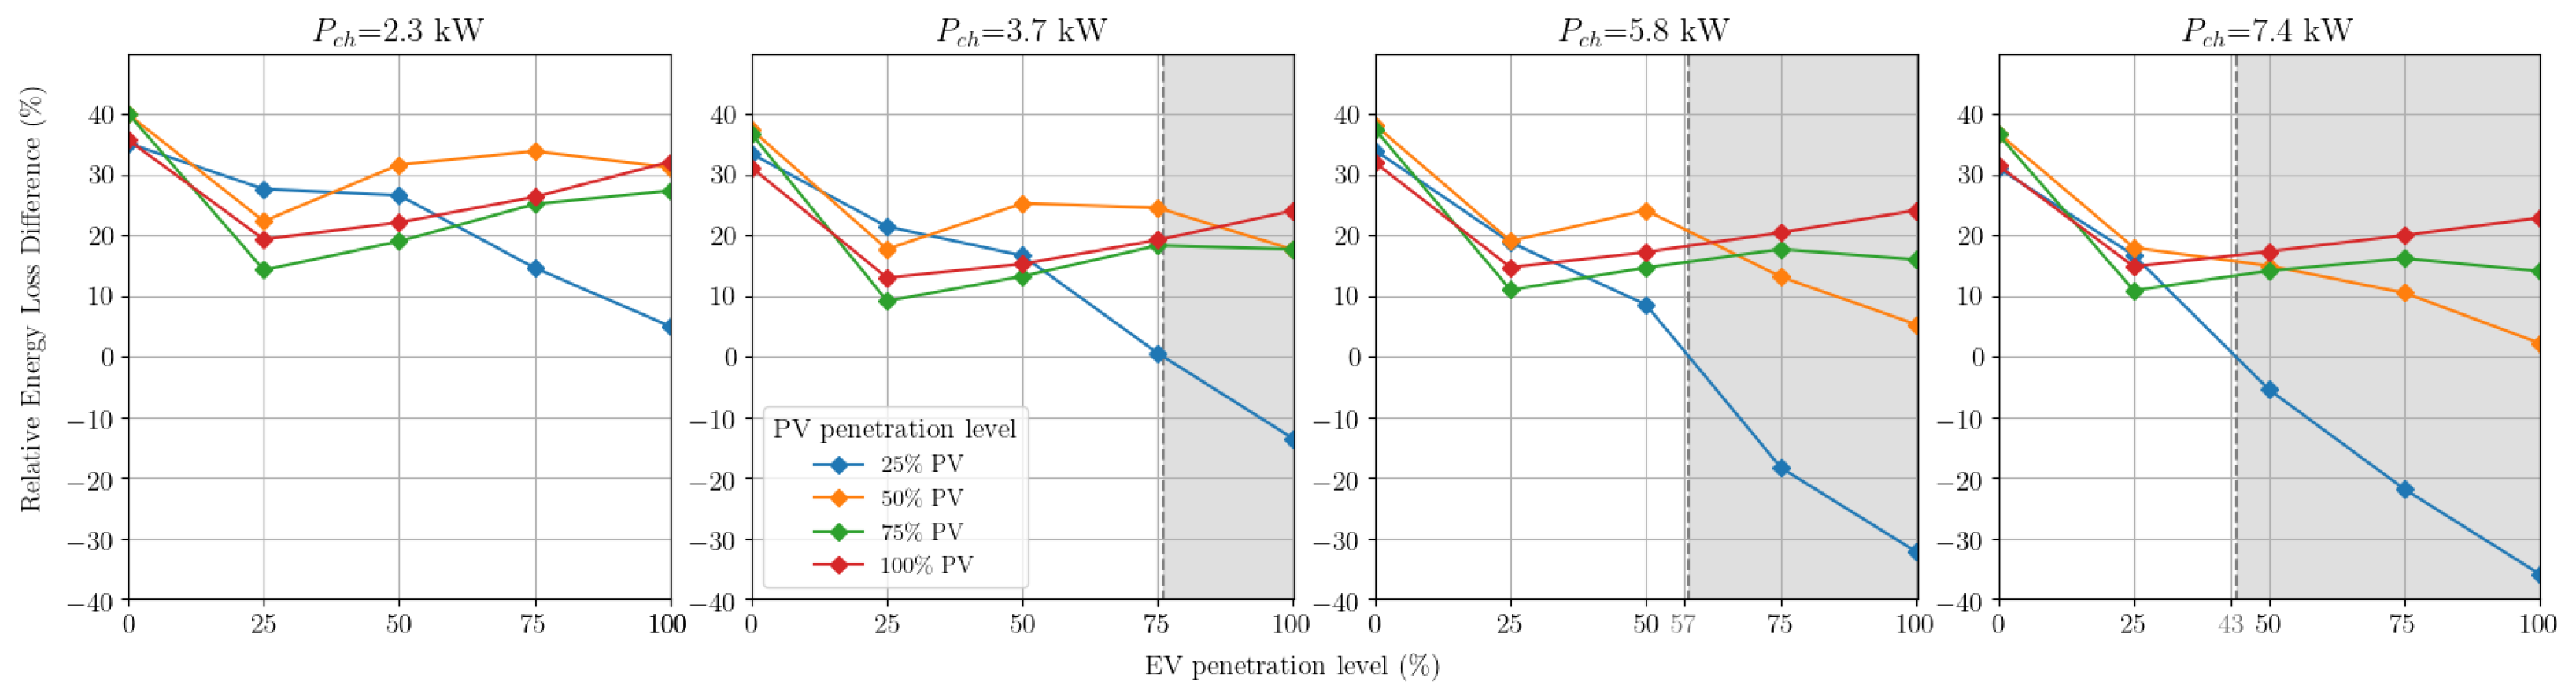
- The benefit of an LVDC backbone compared to a conventional AC system is especially observed when the stored BESS and PV energy can be consumed within the DC system. Hence, it is important that a high EV penetration is accompanied with a certain penetration level of PV systems and BESS. Results also demonstrated that the charging power is an important parameter, whereas the higher the charging power, the lower the EV penetration level threshold for which the LVDC backbone becomes unfavourable. The amount of energy withdrawn from the grid reduces by almost 12% when the proposed LVDC backbone is applied.
5. Conclusions
6. Future Research and Discussions
Author Contributions
Funding
Data Availability Statement
Acknowledgments
Conflicts of Interest
Abbreviations
| BESS | Battery Energy Storage System |
| CC | Constant current |
| CV | Constant voltage |
| DN | Distribution Networks |
| EV | Electric Vehicle |
| LVDC | Low-voltage Direct Current |
| MPP | Maximum Power Point |
| MPPT | Maximum Power Point Tracking |
| PCC | Point of Common Coupling |
| PV | Photovoltaic |
| Relative Energy Loss Difference | |
| RES | Renewable Energy Sources |
| Relative Feed-out Energy Difference | |
| SC | Self-consumption |
| SDGE | Stochastic Distribution Grid Exchangers |
| State of Charge | |
| SPoC | Single Point of Connection |
| Voltage Unbalance Factor |
References
- Monteiro, V.; Gonçalves, H.; Afonso, J.a.L. Impact of Electric Vehicles on power quality in a Smart Grid context. In Proceedings of the 11th International Conference on Electrical Power Quality and Utilisation, Lisbon, Portugal, 17–19 October 2011; pp. 1–6. [Google Scholar] [CrossRef] [Green Version]
- Lopes, J.a.A.P.; Soares, F.J.; Almeida, P.M.R. Integration of Electric Vehicles in the Electric Power System. Proc. IEEE 2011, 99, 168–183. [Google Scholar] [CrossRef] [Green Version]
- Apostolaki-Iosifidou, E.; Codani, P.; Kempton, W. Measurement of power loss during electric vehicle charging and discharging. Energy 2017, 127, 730–742. [Google Scholar] [CrossRef]
- Rönnberg, S.; Bollen, M. Power quality issues in the electric power system of the future. Electr. J. 2016, 29, 49–61. [Google Scholar] [CrossRef]
- Leemput, N.; Geth, F.; Van Roy, J.; Delnooz, A.; Büscher, J.; Driesen, J. Impact of Electric Vehicle On-Board Single-Phase Charging Strategies on a Flemish Residential Grid. IEEE Trans. Smart Grid 2014, 5, 1815–1822. [Google Scholar] [CrossRef]
- Ploumpidou, E. Supporting the Transition to DC Micro Grids in the Built Environment. Ph.D. Thesis, Technische Universiteit Eindhoven, Eindhoven, The Netherlands, 2017. [Google Scholar]
- Yang, S.; Bryant, A.; Mawby, P.; Xiang, D.; Ran, L.; Tavner, P. An industry-based survey of reliability in power electronic converters. IEEE Trans. Ind. Appl. 2011, 47, 1441–1451. [Google Scholar] [CrossRef]
- Rekola, J. Factors Affecting Efficiency of LVDC Distribution Network–Power Electronics Perspective. Ph.D. Thesis, Tampere University of Technology, Tampere, Finland, 2015. [Google Scholar]
- Azaioud, H.; Claeys, R.; Knockaert, J.; Vandevelde, L.; Desmet, J. A Low-Voltage DC Backbone with Aggregated RES and BESS: Benefits Compared to a Traditional Low-Voltage AC System. Energies 2021, 14, 1420. [Google Scholar] [CrossRef]
- Kabus, M.; Nolting, L.; Mortimer, B.J.; Koj, J.C.; Kuckshinrichs, W.; De Doncker, R.W.; Praktiknjo, A. Environmental impacts of charging concepts for battery electric vehicles: A comparison of on-board and off-board charging systems based on a life cycle assessment. Energies 2020, 13, 6508. [Google Scholar] [CrossRef]
- Huynh, W.; Hoang, T.; Abhisek, U.; Nirmal-Kumar, C.N. Comparison of Low-Voltage AC and DC Distribution Networks for EV Charging. In Proceedings of the 2022 7th IEEE Workshop on the Electronic Grid (eGRID), Auckland, New Zealand, 29 November–2 December 2022; pp. 1–5. [Google Scholar] [CrossRef]
- Konstantinos, S.; Gonçalves, J.E.; Saelens, D.; Baert, K.; Driesen, J. Electrical system architectures for building-integrated photovoltaics: A comparative analysis using a modelling framework in Modelica. Appl. Energy 2020, 261, 114247. [Google Scholar] [CrossRef]
- Gerber, D.L.; Vossos, V.; Feng, W.; Marnay, C.; Nordman, B.; Brown, R. A simulation-based efficiency comparison of AC and DC power distribution networks in commercial buildings. Appl. Energy 2018, 210, 1167–1187. [Google Scholar] [CrossRef] [Green Version]
- Hernández, J.C. and Ruiz-Rodriguez, F.J. and Jurado, F.. Modelling and assessment of the combined technical impact of electric vehicles and photovoltaic generation in radial distribution systems. Energy 2017, 141, 316–332. [Google Scholar] [CrossRef]
- Brinkel, N.; Gerritsma, M.; AlSkaif, T.; Lampropoulos, I.; van Voorden, A.; Fidder, H.; van Sark, W. Impact of rapid PV fluctuations on power quality in the low-voltage grid and mitigation strategies using electric vehicles. Int. J. Electr. Power Energy Syst. 2020, 118, 105741. [Google Scholar] [CrossRef]
- Fachrizal, R.; Ramadhani, H.; Munkhammar, J.; Widén, J. Combined PV–EV hosting capacity assessment for a residential LV distribution grid with smart EV charging and PV curtailment. Sustain. Energy Grids Netw. 2021, 26, 100445. [Google Scholar] [CrossRef]
- EN 50160:2011; Voltage Characteristics of Electricity Supplied by Public Distribution Networks. IEC: Geneva, Switzerland, 2011.
- Masoum, M.A.; Moses, P.S.; Hajforoosh, S. Distribution transformer stress in smart grid with coordinated charging of Plug-In Electric Vehicles. In Proceedings of the 2012 IEEE PES Innovative Smart Grid Technologies (ISGT), Washington, DC, USA, 16–22 January 2012; pp. 1–8. [Google Scholar] [CrossRef] [Green Version]
- De Hoog, J.; Alpcan, T.; Brazil, M.; Thomas, D.A.; Mareels, I. Optimal Charging of Electric Vehicles Taking Distribution Network Constraints Into Account. IEEE Trans. Power Syst. 2015, 30, 365–375. [Google Scholar] [CrossRef] [Green Version]
- Gemassmer, J.; Daam, C.; Reibsch, R. Challenges in Grid Integration of Electric Vehicles in Urban and Rural Areas. World Electr. Veh. J. 2021, 12, 206. [Google Scholar] [CrossRef]
- Held, L.; Märtz, A.; Krohn, D.; Wirth, J.; Zimmerlin, M.; Suriyah, M.R.; Leibfried, T.; Jochem, P.; Fichtner, W. The Influence of Electric Vehicle Charging on Low Voltage Grids with Characteristics Typical for Germany. World Electr. Veh. J. 2019, 10, 88. [Google Scholar] [CrossRef] [Green Version]
- Bhattacharyya, S.; Wijnand, M.; Slangen, T. Estimating the future impact of residential EV loads on low voltage distribution networks. In Proceedings of the CIRED Porto Workshop 2022: E-mobility and power distribution systems, Porto, Portugal, 2–3 June 2022; pp. 128–132. [Google Scholar] [CrossRef]
- Marah, B.; Bhavanam, Y.; Taylor, G.; Ekwue, A. Impact of electric vehicle charging systems on low voltage distribution networks. In Proceedings of the 2016 51st International Universities Power Engineering Conference (UPEC), Coimbra, Portugal, 6–9 September 2016; pp. 1–6. [Google Scholar] [CrossRef]
- Alame, D.; Azzouz, M.; Kar, N. Assessing and mitigating impacts of electric vehicle harmonic currents on distribution systems. Energies 2020, 13, 3257. [Google Scholar] [CrossRef]
- Khaligh, A.; D’Antonio, M. Global Trends in High-Power On-Board Chargers for Electric Vehicles. IEEE Trans. Veh. Technol. 2019, 68, 3306–3324. [Google Scholar] [CrossRef]
- Synergrid. Technical Prescription C10/11—Specific Technical Prescriptions Regarding Power-Generating Plants Operating in Parallel to the Distribution Network; Synergrid: Brussels, Belgium, 2019. [Google Scholar]
- Claeys, R.; Azaioud, H.; Cleenwerck, R.; Knockaert, J.; Desmet, J. A Novel Feature Set for Low-Voltage Consumers, Based on the Temporal Dependence of Consumption and Peak Demands. Energies 2021, 14, 139. [Google Scholar] [CrossRef]
- Claeys, R.; Delerue, T.; Desmet, J. Assessing the influence of the aggregation level of residential consumers through load duration curves. In Proceedings of the 2019 IEEE PES Innovative Smart Grid Technologies Europe (ISGT-Europe), Bucharest, Romania, 29 September–2 October 2019; pp. 1–5. [Google Scholar] [CrossRef]
- Elaad, N.L. Data Analytics. Available online: www.elaad.nl/research/data-analytics/ (accessed on 24 February 2022).
- Pelletier, S.; Jabali, O.; Laporte, G.; Veneroni, M. Battery degradation and behaviour for electric vehicles: Review and numerical analyses of several models. Transp. Res. B: Methodol. 2017, 103, 158–187. [Google Scholar] [CrossRef]
- Tremblay, O.; Louis, -A.D.; Dekkiche, A.I. A Generic Battery Model for the Dynamic Simulation of Hybrid Electric Vehicles. In Proceedings of the 2007 IEEE Vehicle Power and Propulsion Conference, Arlington, TX, USA, 9–12 September 2007; pp. 284–289. [Google Scholar] [CrossRef]
- Villalva, M.G.; Gazoli, J.R.; Filho, E.R. Comprehensive Approach to Modeling and Simulation of Photovoltaic Arrays. IEEE Trans. Power Electron. 2009, 24, 1198–1208. [Google Scholar] [CrossRef]
- King, D.; Boyson, W.; Kratochvill, J. Photovoltaic Array Performance Model; Technical Report; Sandia National Lab: Albuquerque, NM, USA, 2004. [Google Scholar]
- Azaioud, H.; Desmet, J.; Vandevelde, L. Benefit Evaluation of PV Orientation for Individual Residential Consumers. Energies 2020, 13, 5122. [Google Scholar] [CrossRef]
- Li, K.; Tseng, K.J. Energy efficiency of lithium-ion battery used as energy storage devices in micro-grid. In Proceedings of the IECON 2015—41st Annual Conference of the IEEE Industrial Electronics Society, Yokohama, Japan, 9–12 November 2015; pp. 005235–005240. [Google Scholar] [CrossRef]
- Trichakis, P.; Taylor, P.; Cipcigan, L.; Lyons, P.; Hair, R.; Ma, T. An Investigation of Voltage Unbalance in Low Voltage Distribution Networks with High Levels of SSEG. In Proceedings of the 41st International Universities Power Engineering Conference, Newcastle Upon Tyne, UK, 6–8 September 2006; pp. 182–186. [Google Scholar] [CrossRef]
- Dugan, R.C.; McDermott, T.E. An open source platform for collaborating on smart grid research. In Proceedings of the 2011 IEEE Power and Energy Society General Meeting, Detroit, Michigan, USA, 24–29 July 2011; pp. 1–7. [Google Scholar] [CrossRef]
- Hariri, A.; Newaz, A.; Faruque, O. Open-source python-OpenDSS interface for hybrid simulation of PV impact studies. IET Gener. Trans. Distrib. 2017, 11, 3125–3133. [Google Scholar] [CrossRef]
- Cleenwerck, R.; Azaioud, H.; Claeys, R.; Coosemans, T.; Knockaert, J.; Desmet, J. An approach to the impedance modelling of low-voltage cables in digital twins. Electr. Power Syst. Res. 2022, 210, 108075. [Google Scholar] [CrossRef]
- Fluvius. Heb Je Nood Aan 400V Om Je Elektrische Auto Op Te Laden? Available online: www.fluvius.be/sites/fluvius/files/2020-10/brochure-heb-je-nood-aan-400v-om-je-elektrischeauto-op-te-laden.pdf (accessed on 16 February 2022).
- Girigoudar, K.; A. Roald, L. On the impact of different voltage unbalance metrics in distribution system optimization. Electr. Power Syst. Res. 2020, 189, 106656. [Google Scholar] [CrossRef]
- Azaioud, H.; Farnam, A.; Knockaert, J.; Vandevelde, L.; Desmet, J. Efficiency optimisation and converterless PV integration by applying a dynamic voltage on an LVDC backbone. 2023; submitted. [Google Scholar]


| Description | Values |
|---|---|
| Transformer rating | 250 kVA |
| Grid voltage | 3 × 400 V + N |
| DC Backbone voltage | 700 V |
| Distribution cable | EAXeVB 4 × 150 mm2 |
| Connection cable | EXVB 4 × 16 mm2 |
| No. of house-units | 91 |
| Max. feeder length | 400 m |
| Distance to junction | [8, …, 15] m |
| Yearly consumption | [1000, …, 5000] kWh |
| Total Annual Load Demand Eload [kWh] | Modules in Parallel | Modules in Series | Total Power of Installed PV Ppv,tot [kWp] |
|---|---|---|---|
| 0 < Eload ≤ 2435 | 1 | 9 | 2.07 |
| Eload > 2435 | 2 | 9 | 4.14 |
| Description | Values | Unit |
|---|---|---|
| EV penetration | ℸ{0; 25; 50; 75; 100} * | [%] |
| PV penetration | ℸ{0; 25; 50; 75; 100} * | [%] |
| Charging power | ℸ{2.3; 3.7; 5.8; 7.4} | [kW] |
| [kW] | 2.3 | 3.7 | 5.8 | 7.4 |
|---|---|---|---|---|
| AC [MWh] | 374.448 | 374.184 | 376.151 | 377.885 |
| DC [MWh] | 329.347 | 331.617 | 335.574 | 338.808 |
| RFOED [%] | 12.04 | 11.38 | 10.79 | 10.34 |
Disclaimer/Publisher’s Note: The statements, opinions and data contained in all publications are solely those of the individual author(s) and contributor(s) and not of MDPI and/or the editor(s). MDPI and/or the editor(s) disclaim responsibility for any injury to people or property resulting from any ideas, methods, instructions or products referred to in the content. |
© 2023 by the authors. Licensee MDPI, Basel, Switzerland. This article is an open access article distributed under the terms and conditions of the Creative Commons Attribution (CC BY) license (https://creativecommons.org/licenses/by/4.0/).
Share and Cite
Cleenwerck, R.; Azaioud, H.; Vafaeipour, M.; Coosemans, T.; Desmet, J. Impact Assessment of Electric Vehicle Charging in an AC and DC Microgrid: A Comparative Study. Energies 2023, 16, 3205. https://0-doi-org.brum.beds.ac.uk/10.3390/en16073205
Cleenwerck R, Azaioud H, Vafaeipour M, Coosemans T, Desmet J. Impact Assessment of Electric Vehicle Charging in an AC and DC Microgrid: A Comparative Study. Energies. 2023; 16(7):3205. https://0-doi-org.brum.beds.ac.uk/10.3390/en16073205
Chicago/Turabian StyleCleenwerck, Rémy, Hakim Azaioud, Majid Vafaeipour, Thierry Coosemans, and Jan Desmet. 2023. "Impact Assessment of Electric Vehicle Charging in an AC and DC Microgrid: A Comparative Study" Energies 16, no. 7: 3205. https://0-doi-org.brum.beds.ac.uk/10.3390/en16073205