Article

An Environmentally-Friendly Tourist Village in Egypt Based on a Hybrid Renewable Energy System––Part Two: A Net Zero Energy Tourist Village

1
College of Automation, Harbin Engineering University, Harbin 150001, China
2
Electrical Engineering Department, Faculty of Engineering, Assiut University, Assiut 71516, Egypt
*
Author to whom correspondence should be addressed.
Energies 2015, 8(7), 6945-6961; https://0-doi-org.brum.beds.ac.uk/10.3390/en8076945
Submission received: 23 April 2015 / Revised: 17 June 2015 / Accepted: 18 June 2015 / Published: 10 July 2015

Abstract

:
The main objective of this study is to discuss the economical and the environmental analysis of a net zero energy (NZE) tourist village in Alexandria, Egypt, by maximizing the renewable energy fraction and minimizing the greenhouse gases (GHG) emissions. The hybrid photovoltaics (PV)/wind/diesel/battery system is found to be the optimum hybrid renewable energy system (HRES) for the proposed tourist village under the study. The optimum HRES consists of 1600 kW of PV panels (58.09% solar energy penetration), 1000 kW of wind turbines (41.34% wind energy penetration), 1000 kW of power converters, 200 kW diesel generator (only 0.57% diesel generator penetration) in addition to 2000 batteries with the capacity of 589 Ah each. The levelized cost of energy (COE) from the optimum HRES is $0.17/kWh and the total net present cost (NPC) of this system is $15,383,360. Additionally, the maximum renewable energy fraction is 99.1% and the amount of GHG emitted from the optimum HRES is only 31,289 kg/year, which is negligible in comparison with the other system configurations, therefore the optimum HRES can be considered as a green system. In addition to this, the achieved percentage of the capacity shortage and the unmet load in the optimal HRES is only 0% for both.

1. Introduction

Alexandria is the second largest city and the second largest metropolitan area in Egypt after Greater Cairo by size and population. It extends about 32 km along the coast of the Mediterranean Sea in the north central part of the country. It is also the largest city lying directly on the Mediterranean Coast. Alexandria is Egypt’s largest seaport, serving approximately 80% of Egypt’s imports and exports [1]. It is an important industrial center because of its natural gas and oil pipelines from the Suez Canal. Additionally, Alexandria is also one of the most important tourist resorts in Egypt [1].
Alexandria is rich with many historical, cultural and tourist sites that express different ancient civilizations across different ages. Some examples are, the Alexandria National Museum, the Royal Jewelry Museum, the Museum of Fine Arts, the Greco-Roman Museum, and the Aquarium Museum. Additionally, the Roman Theater, Mustafa Kamel necropolis, the Anfushi necropolis, the Submerged Antiquities, the Palace Gardens, the Antoniadis Gardens, the Citadel of Qaitbay, the Pompey’s Pillar and the Library of Alexandria are attractive places for tourists in Alexandria [2].
Alexandria features over 35 beaches along 24 km on the coast between from the east to the west. Because of Alexandria’s geographical location and the natural characteristics, it became one of the largest ports of the Eastern Mediterranean and the Middle East and gained a reputation as a tourist destination for holidaymakers from all over the world [2].
Tourism is one of the most important sectors in Egypt’s economy. There are many tourist cities in Egypt; Alexandria is the selected city for this study due to the previous brief highlights of some of the tourist landmarks found in the city. Additionally, it is the optimum city in most of the configurations of hybrid renewable energy system (HRES) compared to the other four tourist cities (Luxor, Giza, Qena and Aswan) to establish an environment-friendly tourist village which had been carried out in the first part of this study [3] according to the economic cost (cost of energy (COE) and net present cost (NPC)) and the amount of GHG emitted from this configurations of HRES. Figure 1a,b show the different COE and NPC of PV/wind/diesel/battery, PV/diesel/battery, wind/diesel/battery and diesel/battery systems in Alexandria, Egypt.
Figure 2 shows the different amounts of GHG emitted of PV/wind/diesel/battery, wind/diesel/battery, PV/diesel/battery and diesel/battery systems in Alexandria, Egypt. The results shown in Figure 1a,b and Figure 2 were obtained from the first part of this study [3].
Figure 1. (a) The different cost of energy (COE) of photovoltaics (PV)/wind/diesel/battery, PV/diesel/battery, wind/diesel/battery and diesel/battery systems in Alexandria, Egypt. (b) The different net present cost (NPC) of PV/wind/diesel/battery, PV/diesel/battery, wind/diesel/battery and diesel/battery systems in Alexandria, Egypt.
Energies 08 06945 g001
Figure 2. The different amounts of greenhouse gases (GHG) emitted by PV/wind/diesel/battery, wind/diesel/battery, PV/diesel/battery and diesel/battery systems in Alexandria, Egypt.
Energies 08 06945 g002

2. Literature Review
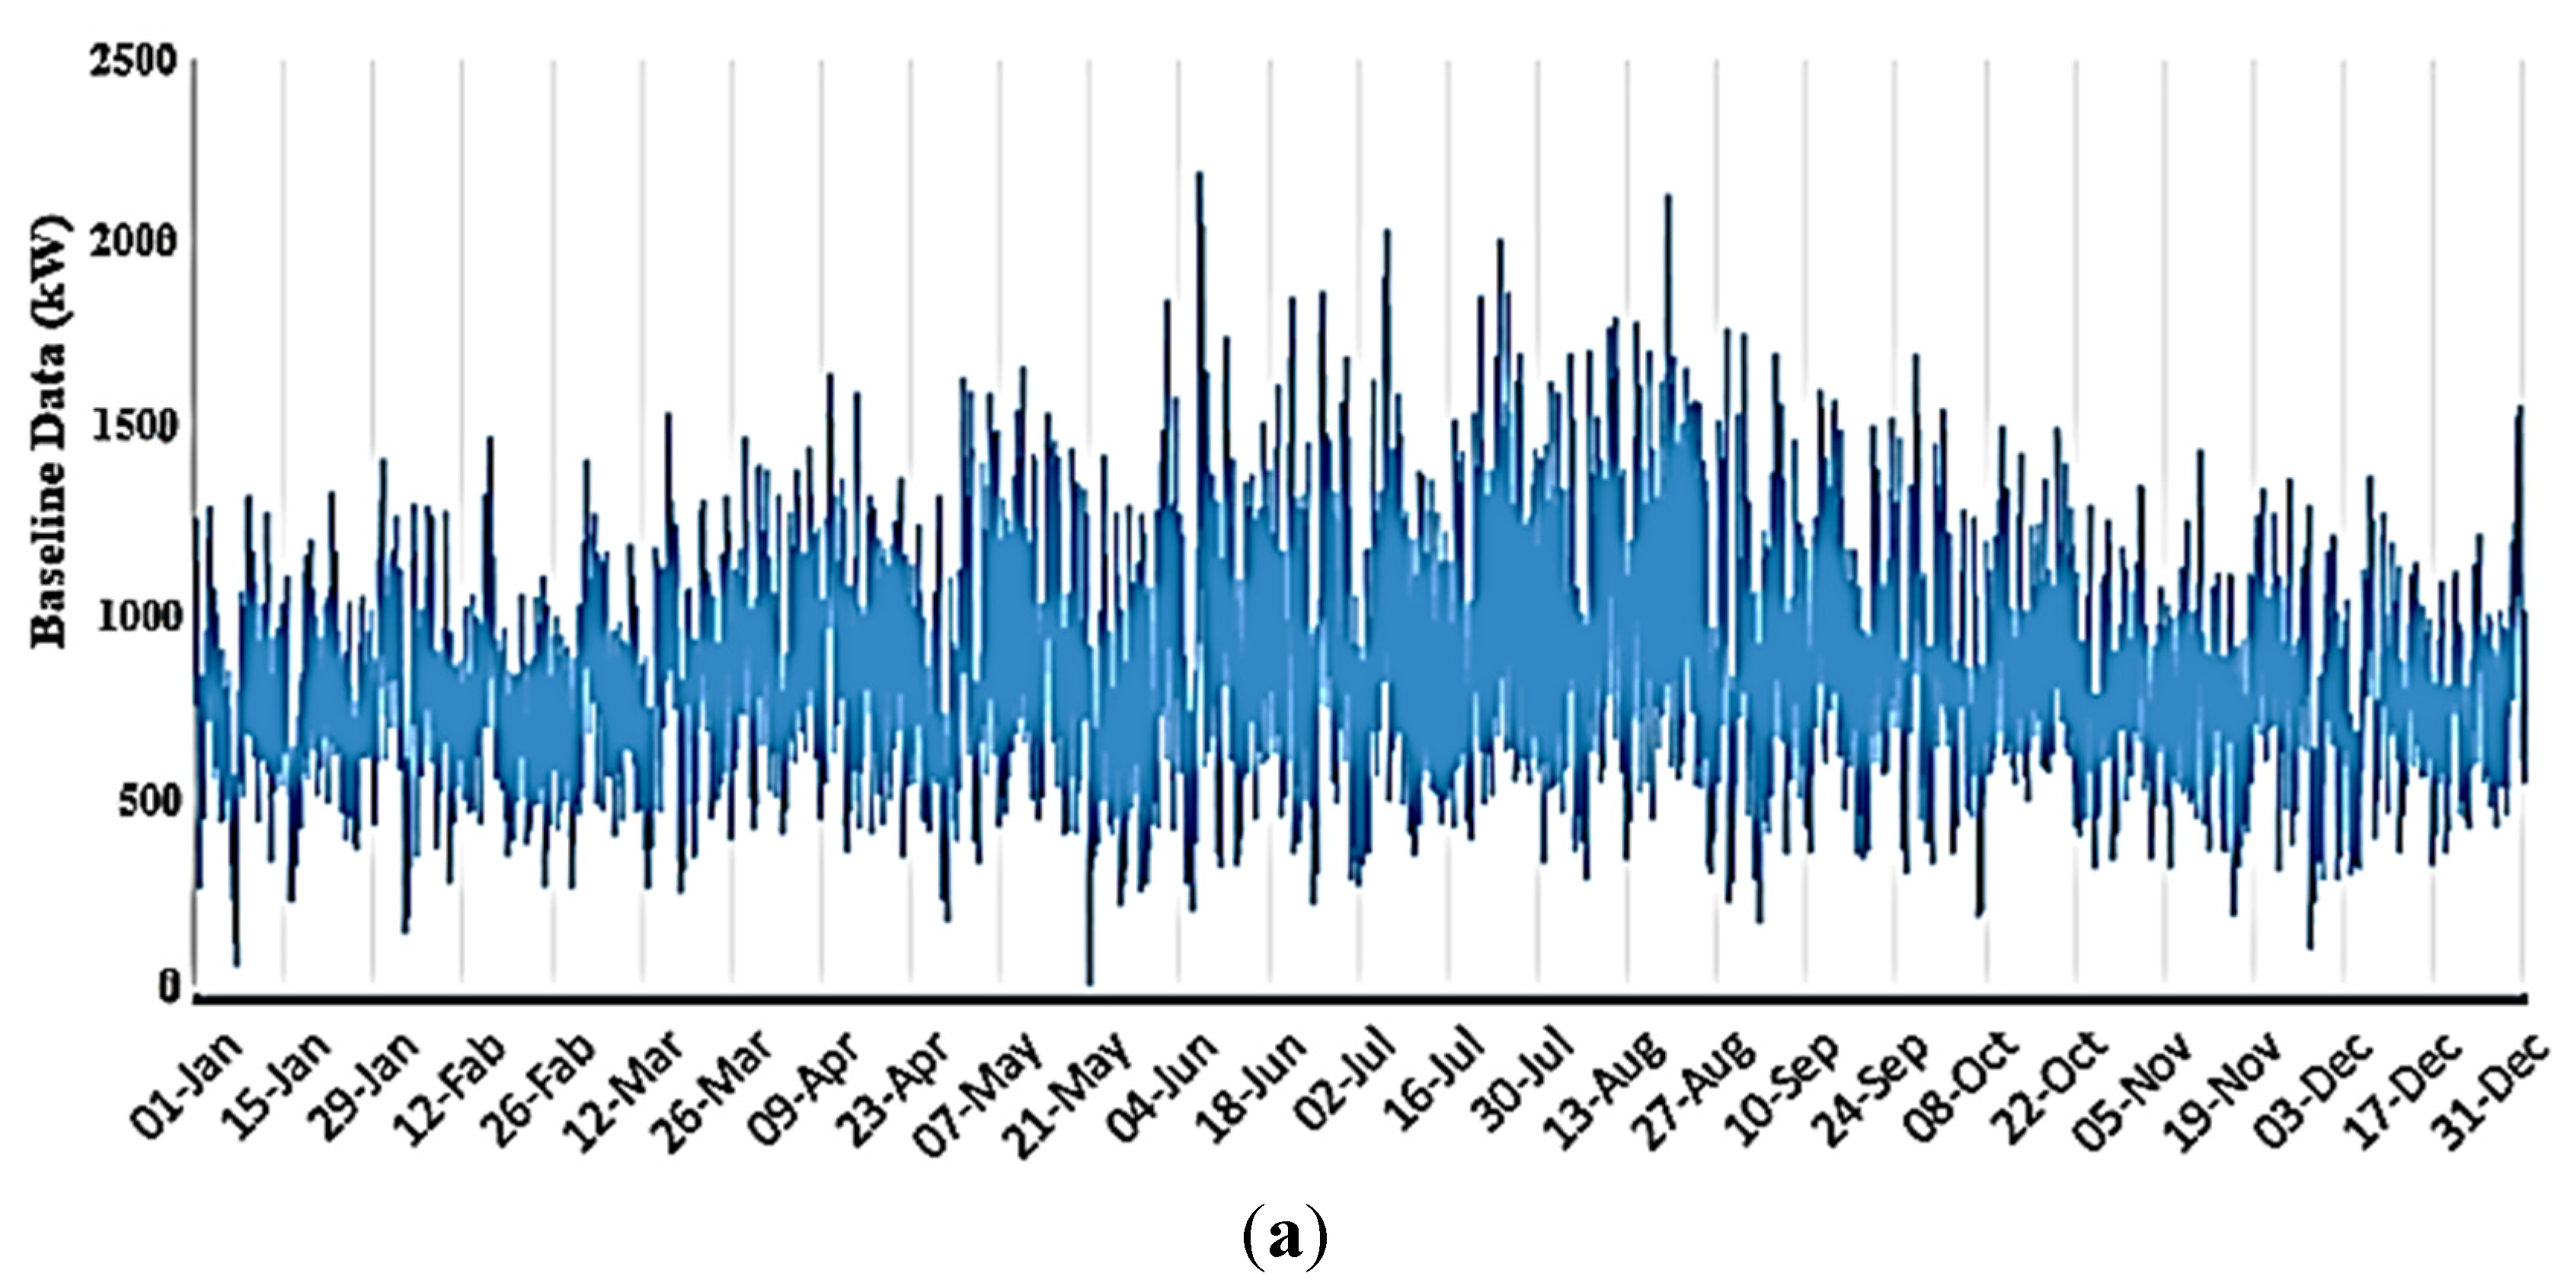
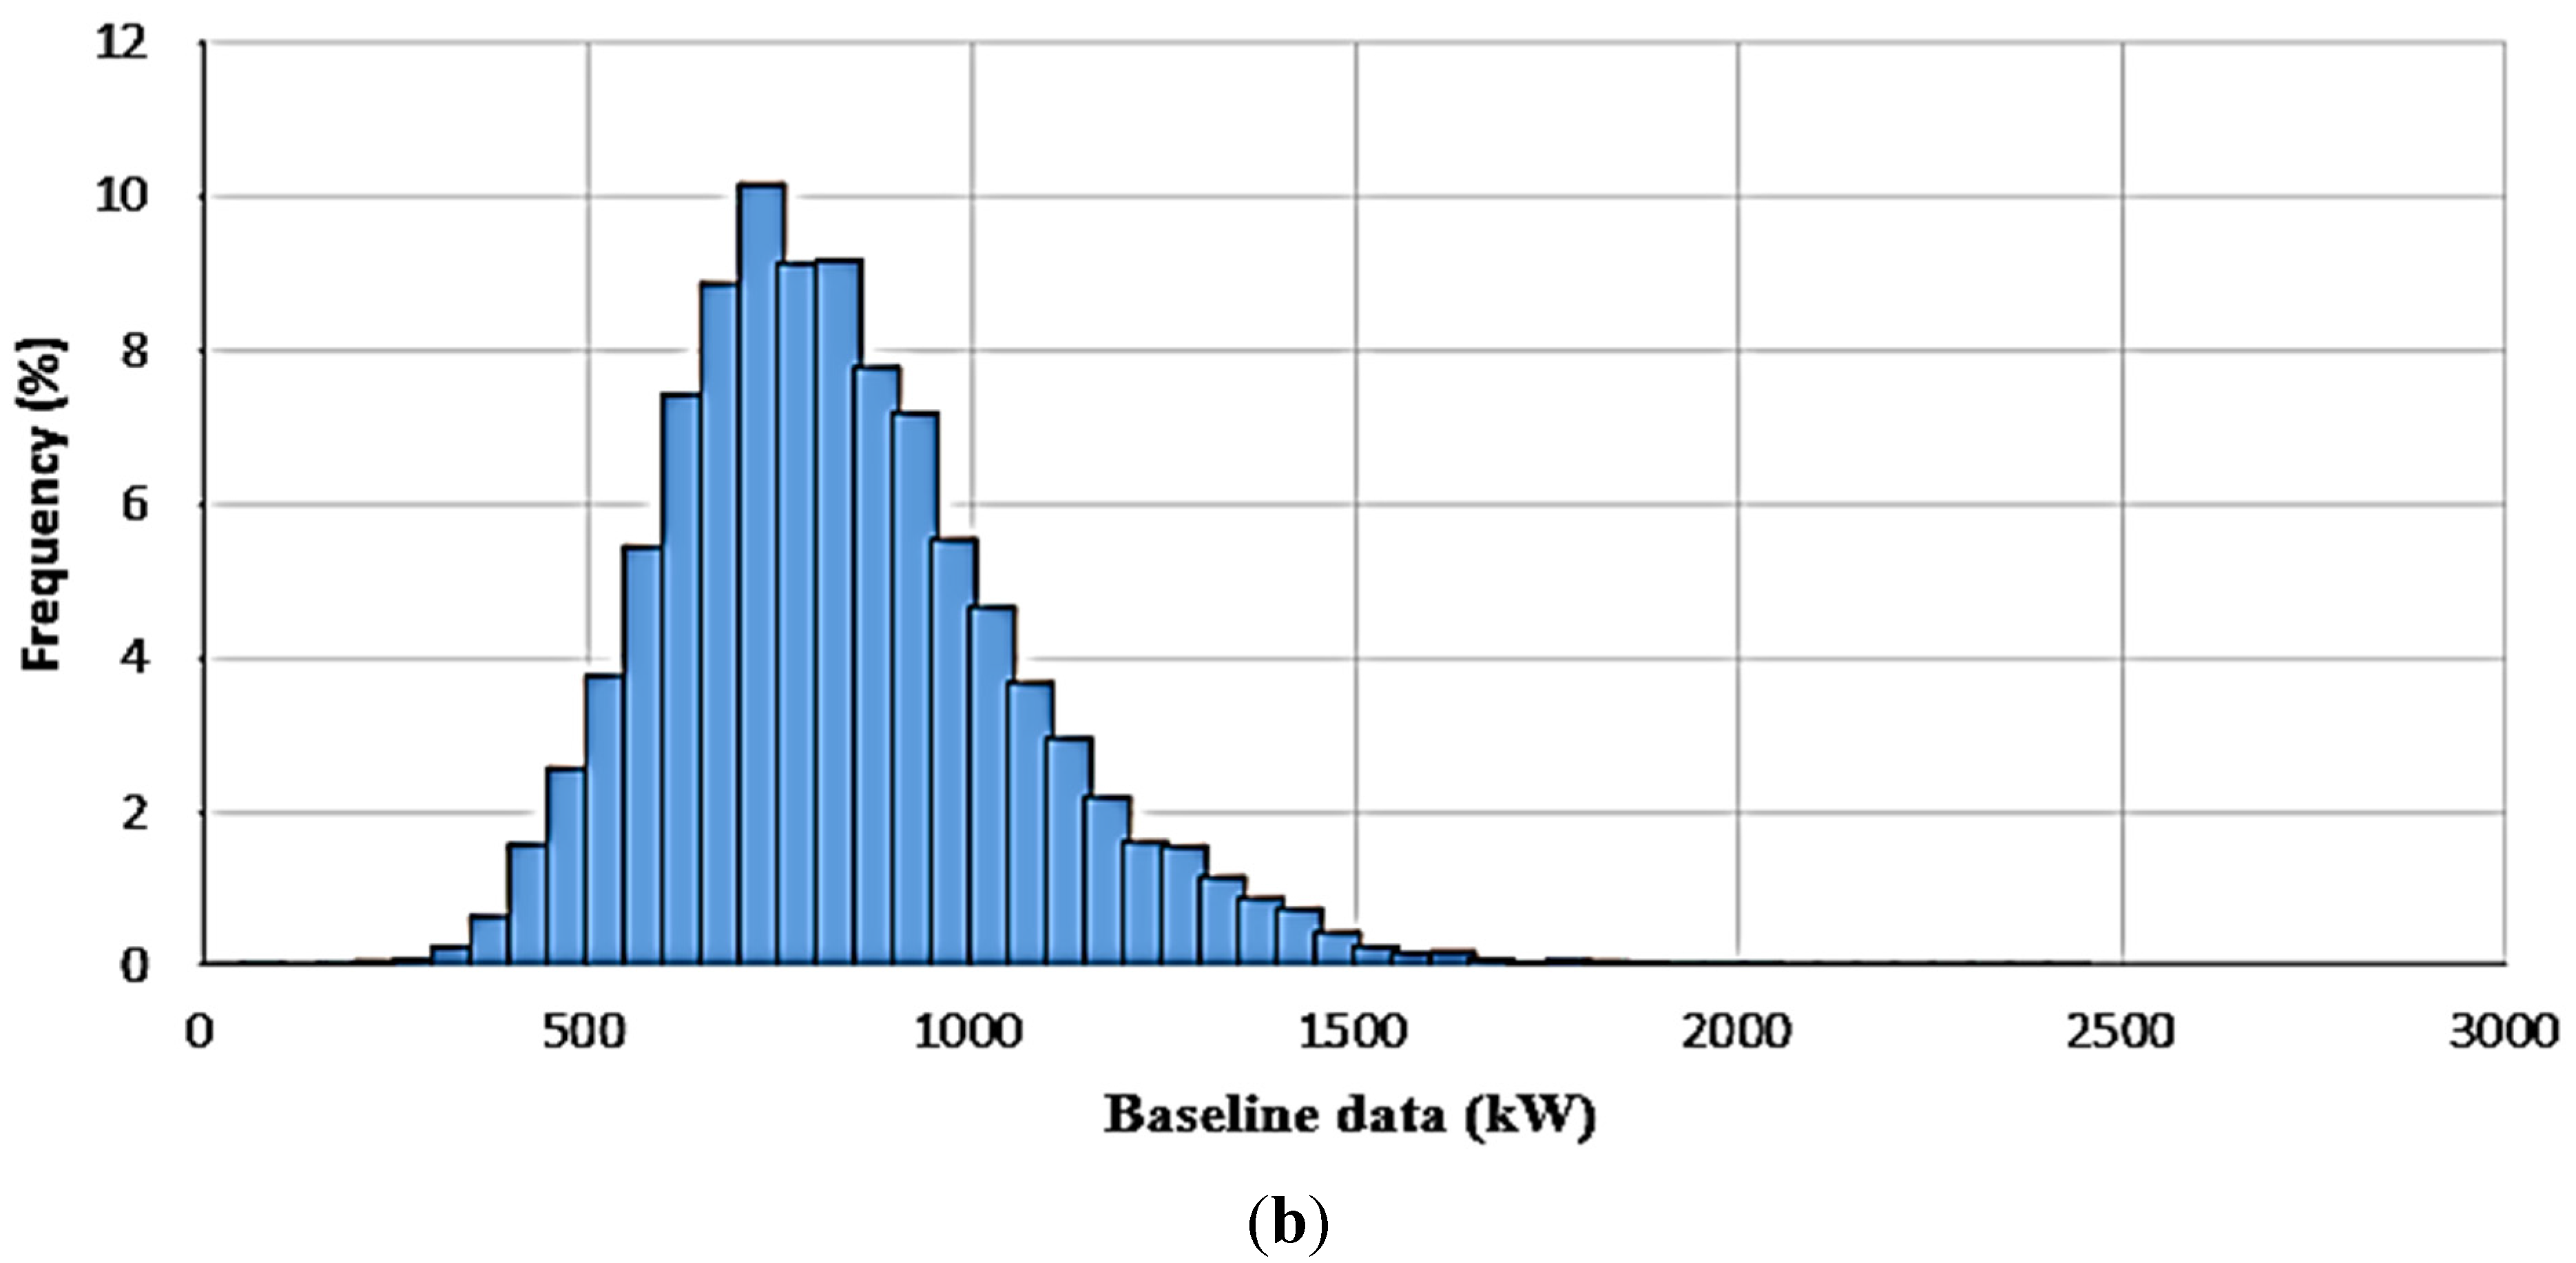
The definition of a net zero energy building (NZEB) according to the U.S. Department of Energy (DOE) Building Technologies Program is: “A net zero energy building is a residential or commercial building with greatly reduced energy needs through efficiency gains such that the balance of energy needs can be supplied with renewable technologies” [4]. An off-grid NZEB has an arrangement for large energy storage; usually in the form of batteries, additionally these buildings not consumed fossil fuels [5].
Photovoltaics (PV) seems to be one of the most suitable energy generation technologies, due to their low cost, good technical features, and additionally they are an environmentally friendly renewable energy source [6]. Currently, the PV market is one of the fastest growing renewable energy technology markets. The globally installed PV capacity has multiplied by a factor of 37.44 in 10 years from 1.8 GW in 2000 to 67.4 GW at the end of 2011 with a growth rate of 44% per year. In the year 2013, more than 39 GW were added [7].
It is planned for the buildings in the cities to achieve a 40% reduction of greenhouse gases emissions by 2020 through sustainable use and production of energy [8]. Therefore, there is a lot of research work regarding these buildings all over the world, some of these previous work from several authors are as follows:
Elkinton et al., and Gallo et al. [9,10] made an investigation of using wind power and solar thermal systems in renewable energy housing developments in the USA and Spain to determine how the wind power and solar thermal system economics differ with various climates and energy prices. On other hand, Da Graça et al., and Norisa [11,12] explored the feasibility of solar NZEB systems for a single-family home in the mild southern European climate zone. They sized solar collector systems using dynamic thermal simulation of two representative house geometries in order to meet all annual energy needs. Additionally, Rodriguez-Ubinas et al., and Song et al. [13,14] provided the analysis of the passive approaches used in net energy plus homes. The contributing houses of the Solar Decathlon Europe 2012 competition were used as case studies.
Wang et al. [15] discussed possible solutions for ZEB design in UK. EnergyPlus and TRNSYS 16 were used in their study as a Simulation software. Various design methods were compared and optimal design approaches for typical homes and energy systems were provided. Additionally, Lu et al., and Pudleiner et al. [16,17] presented an evaluation study on two-design optimization approaches for renewable energy systems in NZEBs, with a single objective optimization using Genetic Algorithm and a multi-objectives optimization using Non-dominated Sorting Genetic Algorithm (NSGA-II). On the other side, Milan et al., and Marszal et al. [18,19] developed a model based on linear programming for the ideal sizing of 100% renewable supply systems. It had been well applied in a case study for a NZEB in Denmark with three technology opportunities.
Kwan C. and Kwan T. [20] attempted to evaluate the financial feasibility of the Los Angeles Community College District’s project, taking into account the availability of financial incentives by local municipal utility companies, state and federal renewable energy incentives. On the other hand, Deng et al. [21] discussed energy supply concepts for zero energy residential building (ZERB) in Shanghai (humid) and Madrid (dry). Two typical housing models were designed according to the life schedule, the real residence condition, and the controls settings for the two locations. Nevertheless, Salom et al., and Adhikari et al. [22,23] addressed the role of NZEBs on future energy systems by the relationship between on-site generation and the load matching, and the resulting import/export interaction with the surrounding grid interaction. In addition to, Pacheco and Heffernan [24,25] discussed the feasibility of remodeling single-family housing buildings in Brazil into zero energy buildings (ZEBs).
Kilkis [26] explored the net-zero targets, nexus of exergy, and sustainable cities as a means of exploring the role of exergy-aware plans at the district and building level. The same author [27] investigated the district of Ostra Sala backe in Uppsala Municipality in Sweden as a case study, near net-zero exergy district. In addition to, the energy performance of net-zero energy buddings and near net-zero energy buddings were studied in References [28,29,30] in New England and Australia. They defined the enactment procedure, which contains regularly more stringent principles coupled with financial inducements.
Recently, Becchio et al. [31] obtained different cost best results of buildings and technical arrangements for NZEBs in Italy. There are no rules for defining the features of ZEBs in Italy, while buildings for which these features are pertinent have been developing in the market [32,33]. Additionally, Jina et al., and Zhang et al. [34,35] discussed the possibility of a NZE house design aiming to energy balance, environmental and financial sustainability from the initial development to the final construction for Northern China. On the other hand, Kalinci [36] investigated different energy scenarios for Bozcaada Island, Turkey. The island has enough wind and solar energy potentials while connecting to the grid. Therefore, it was considered a grid connected and standalone system in the study.
One of the most important challenges facing the application of zero energy homes in Saudi Arabia is hesitation about their flexibility in local climate. Alrashed and Asif [37] examined this hesitation, generally focusing on the four climatic factors related to the application of zero energy houses (ZEHs) including air temperature, relative humidity, worldwide solar radiation and wind speed. On other side, Hassoun, Dincer and Zabaneh [4,38] compared various power design possibilities and their improved strategies for a net-zero house to cover its all-electrical needs while maximizing renewable energy and minimizing the greenhouse gases emissions. The study defined the essential measures needed to decrease the total electrical load by improvements in efficiency.
The literature review mentioned above shows that several approaches discussed regarding the net zero energy applications all over the world. However, there is no published work so far regarding a net zero energy application in Egypt. Besides, Egypt experiences frequent electricity blackouts because of rising demand and natural gas supply shortages, particularly during the summer time. Additionally, ongoing political and social unrest in Egypt has slowed the government’s plans to expand power generation capacity by 30 GW by 2020 [39].
Furthermore, the main objective of this work is to discuss the economical and the environmental analysis of a net zero energy (NZE) tourist village in Alexandria, Egypt by maximizing the renewable energy fraction and minimizing the greenhouse gases emissions. The well-known HOMER (Hybrid Optimization of Multiple Electric Renewables) package is used as a software tool in this work as it has maximum combination of renewable energy systems and performs optimization and sensitivity analysis that makes it easier and faster to evaluate possible system configurations [40].

3. Electric Load

The proposed tourist village comprises several units including; hotel building, which consists of 350 bedrooms, that can accommodate a guest capacity of approximately 1000 guests, in addition to service areas and recreational areas. Figure 3a shows the yearly baseline data load profile of the proposed tourist village in the study. Homer assembles the yearlong array of load data from the specified daily profiles. Then it steps through that time series, and in each time step, it multiplies the value in that time step by a perturbation factor α, which can be given as:
α = β d + β t
where
  •   β d the day-to-day variability is taken as 5% in this study.
  •   β t the time-step-to-time-step variability is taken as 5% in this study.
Figure 3. (a) The yearly baseline data load profile of the proposed tourist village in the study; (b) The baseline data load histogram of the proposed tourist village in the study.
Energies 08 06945 g003aEnergies 08 06945 g003b
Figure 3b shows the distribution of the load histogram baseline data of the proposed tourist village in the study. The scaled total annual energy consumption of the proposed tourist village load is 3650 MWh with peak of load demand around 1007.28 kW during the summer period due to the activities of the tourists during that time. The baseline average value of the energy is 19,906 kWh/d with peak of load demand around 2005.1 kW.

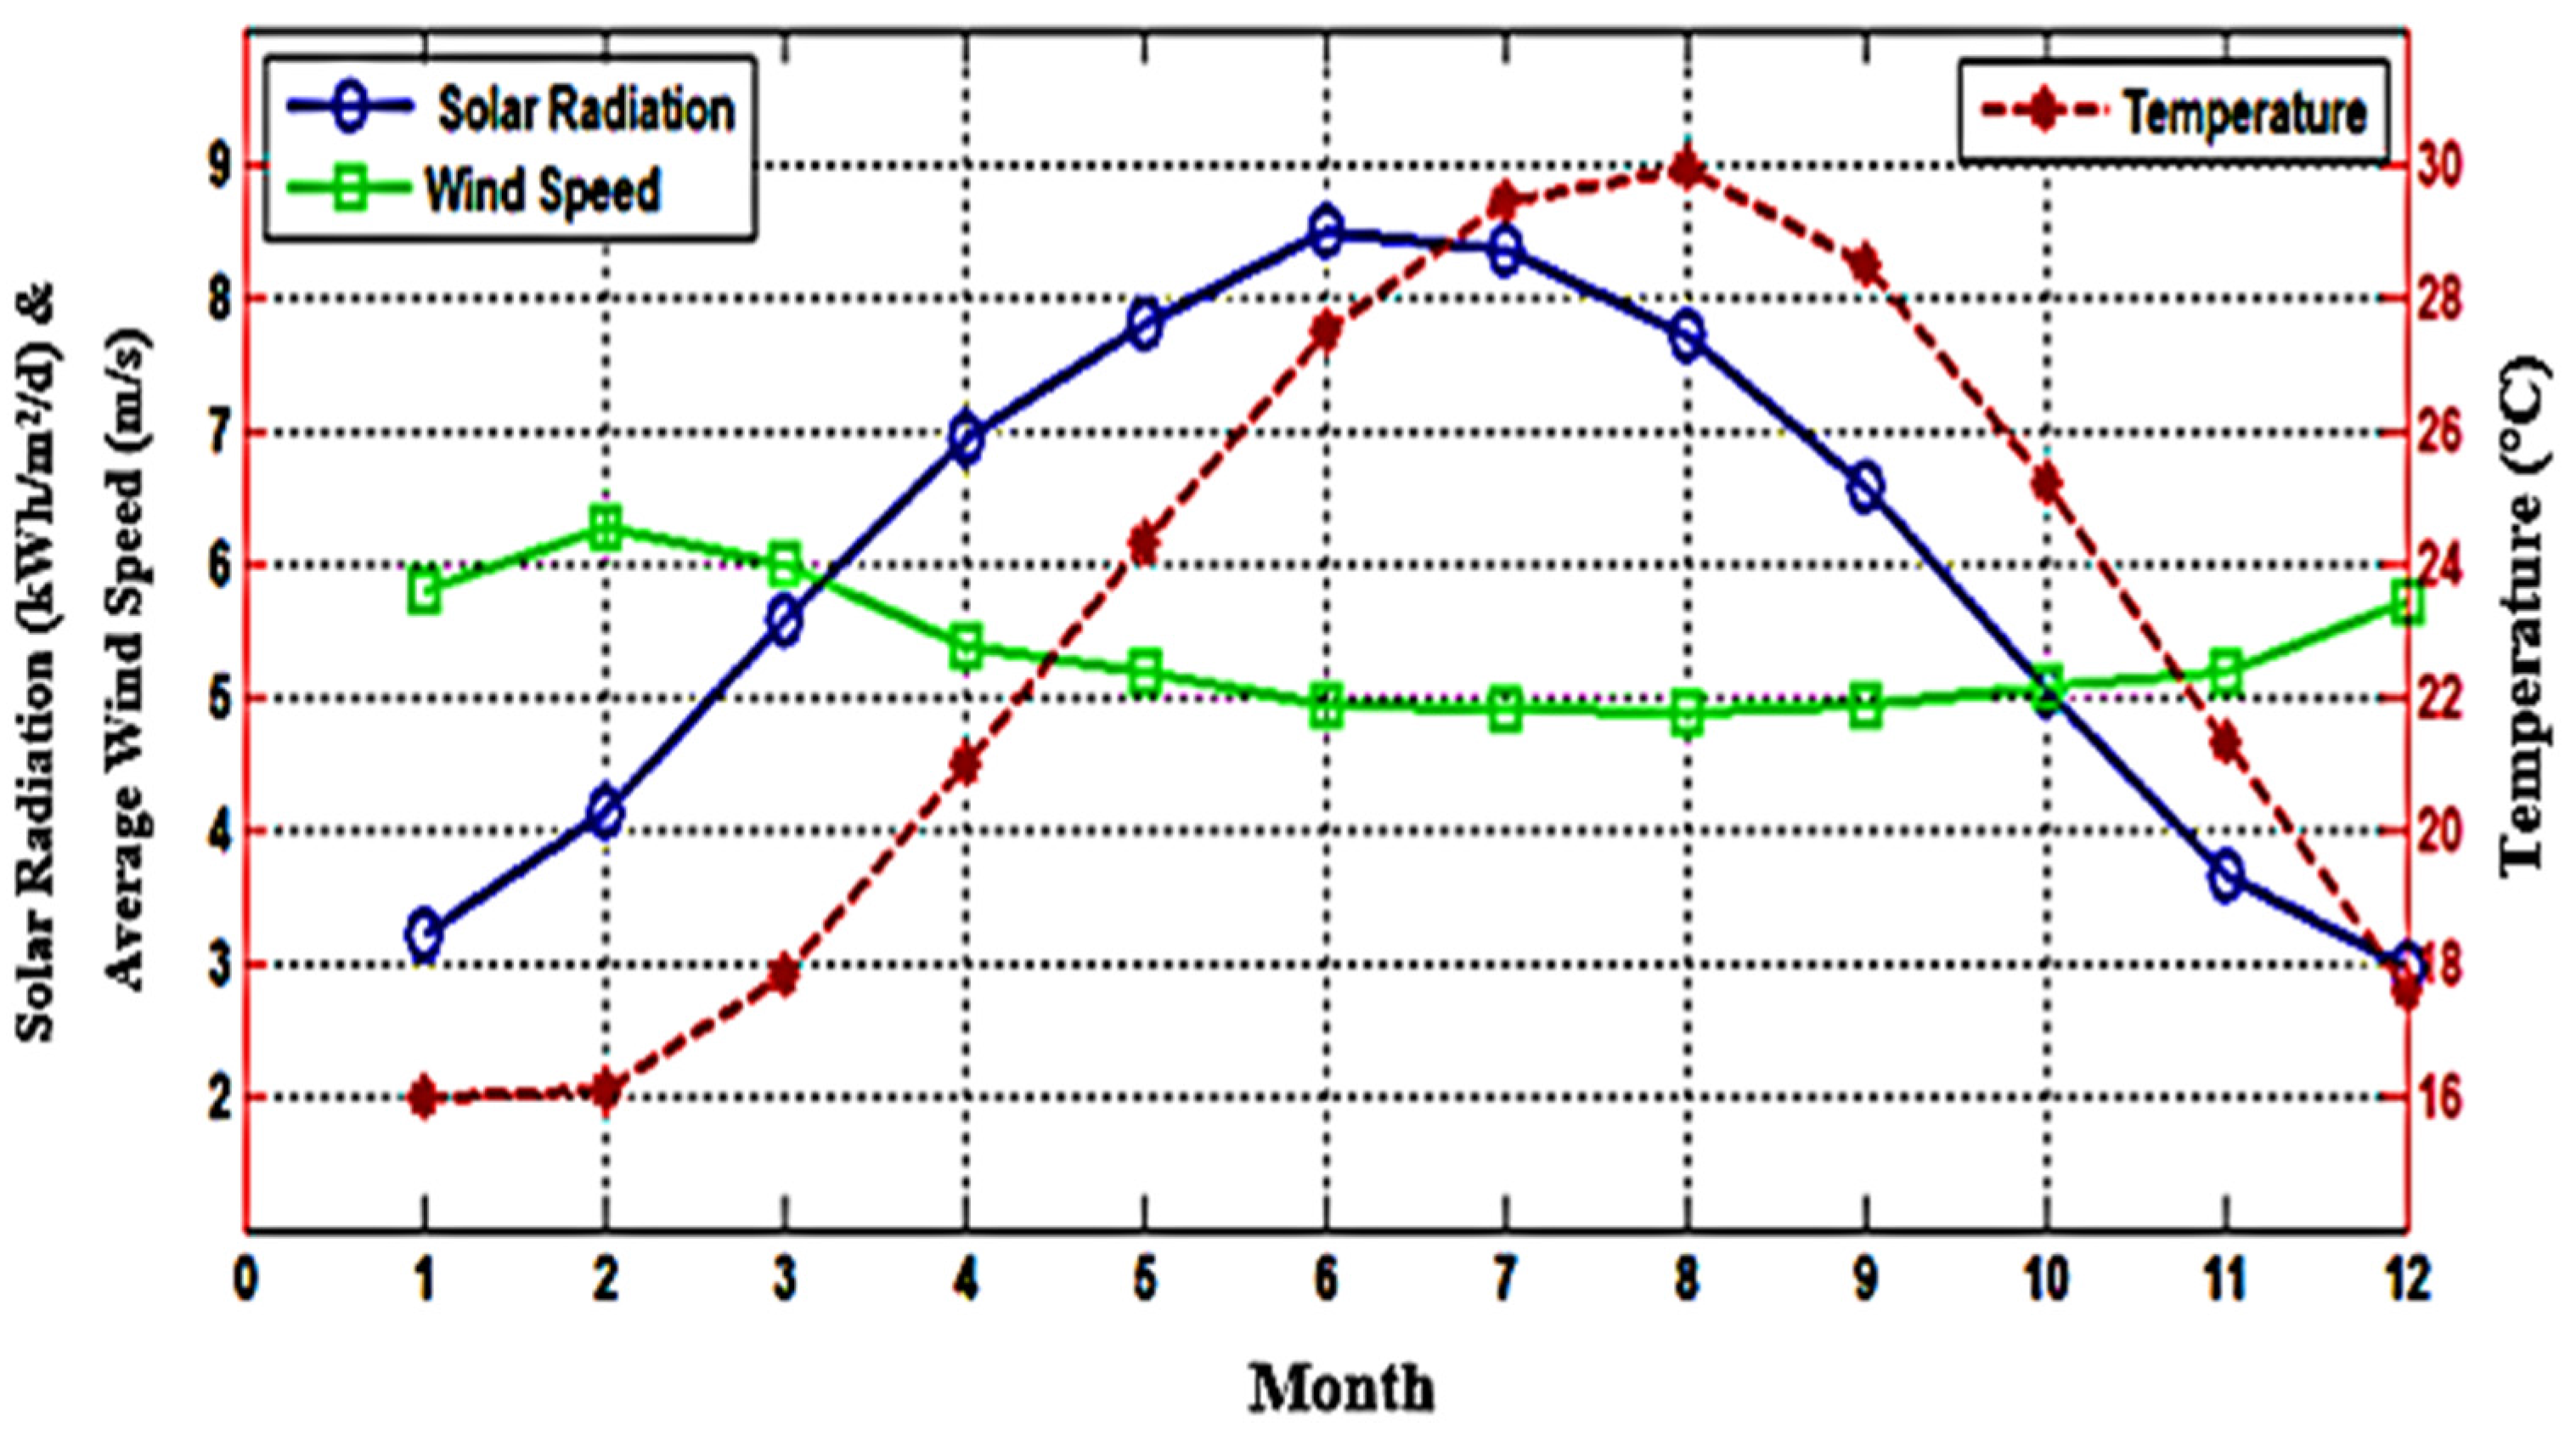
4. The Resources of Solar Radiation, Wind Speed and Temperature

Figure 4 shows the average monthly solar radiation, wind speed and earth’s surface temperature data in Alexandria, Egypt. The 22-year average monthly solar radiation data, the 10-year average monthly wind speed data and the 22-year average monthly of the earth’s surface temperature of Alexandria, which is located at (31.2 N, 29.92 E); were obtained from NASA (National Aeronautics and Space Administration) database [41]. According to NASA data, the annual average solar radiation is 5.87 kWh/m2/day, the annual average wind speed is 5.34 m/s and the annual average earth’s surface temperature is 22.9 °C.

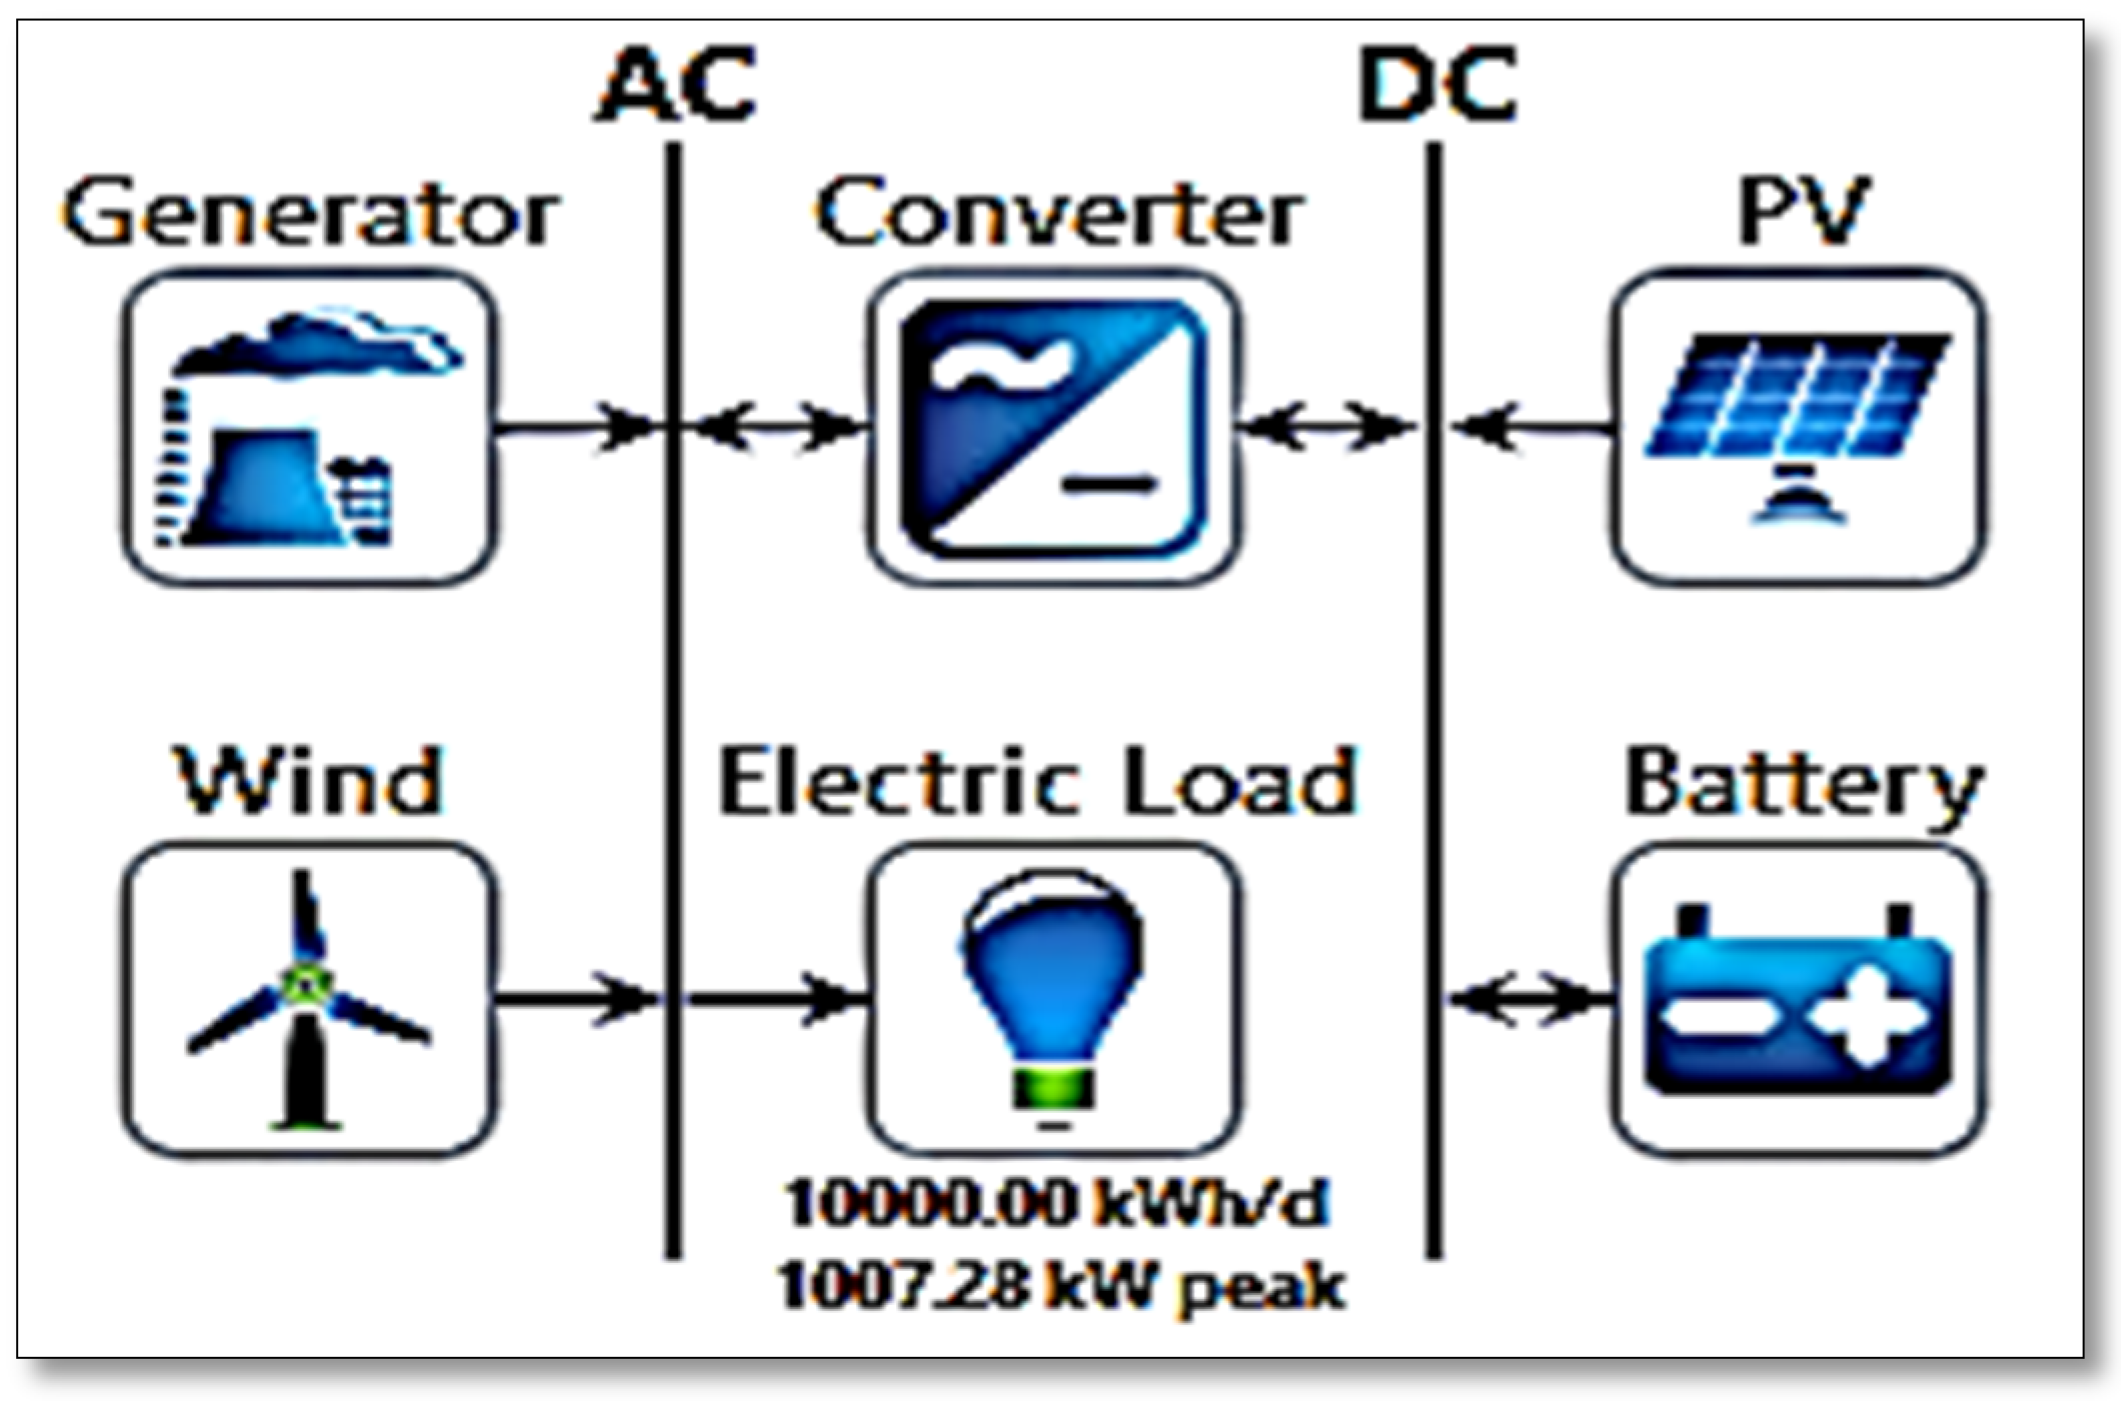
5. Hybrid System Modeling

According to Figure 4, we can note that the peak value of the average monthly solar radiation in summer season in contrast of the average monthly wind speed. Furthermore, it is an indicator that the optimum hybrid configuration system is the system, which combines PV with wind to make the best use of their operating characteristics and to obtain efficiencies higher than, which could have been obtained from a single power source. This feature results from the ability of HRES to take advantage of the complementary diurnal (night/day) and seasonal characteristics of the available renewable energy resources at a given site [42,43]. Figure 5 shows the optimum configuration model of hybrid PV/wind/diesel/battery system of the proposed tourist village in the study based on the user inputs of the load, components costs, components technical details, solar and wind resources availability.
Figure 4. The average monthly solar radiation, wind speed and earth’s surface temperature data in Alexandria, Egypt.
Energies 08 06945 g004
Figure 5. The optimum configuration model of hybrid PV/wind/diesel/battery system of the proposed tourist village in the study.
Energies 08 06945 g005

6. Results and Discussion

The optimal configuration of HRES (PV/wind/diesel/battery) for the proposed tourist village in the study consists of:
1
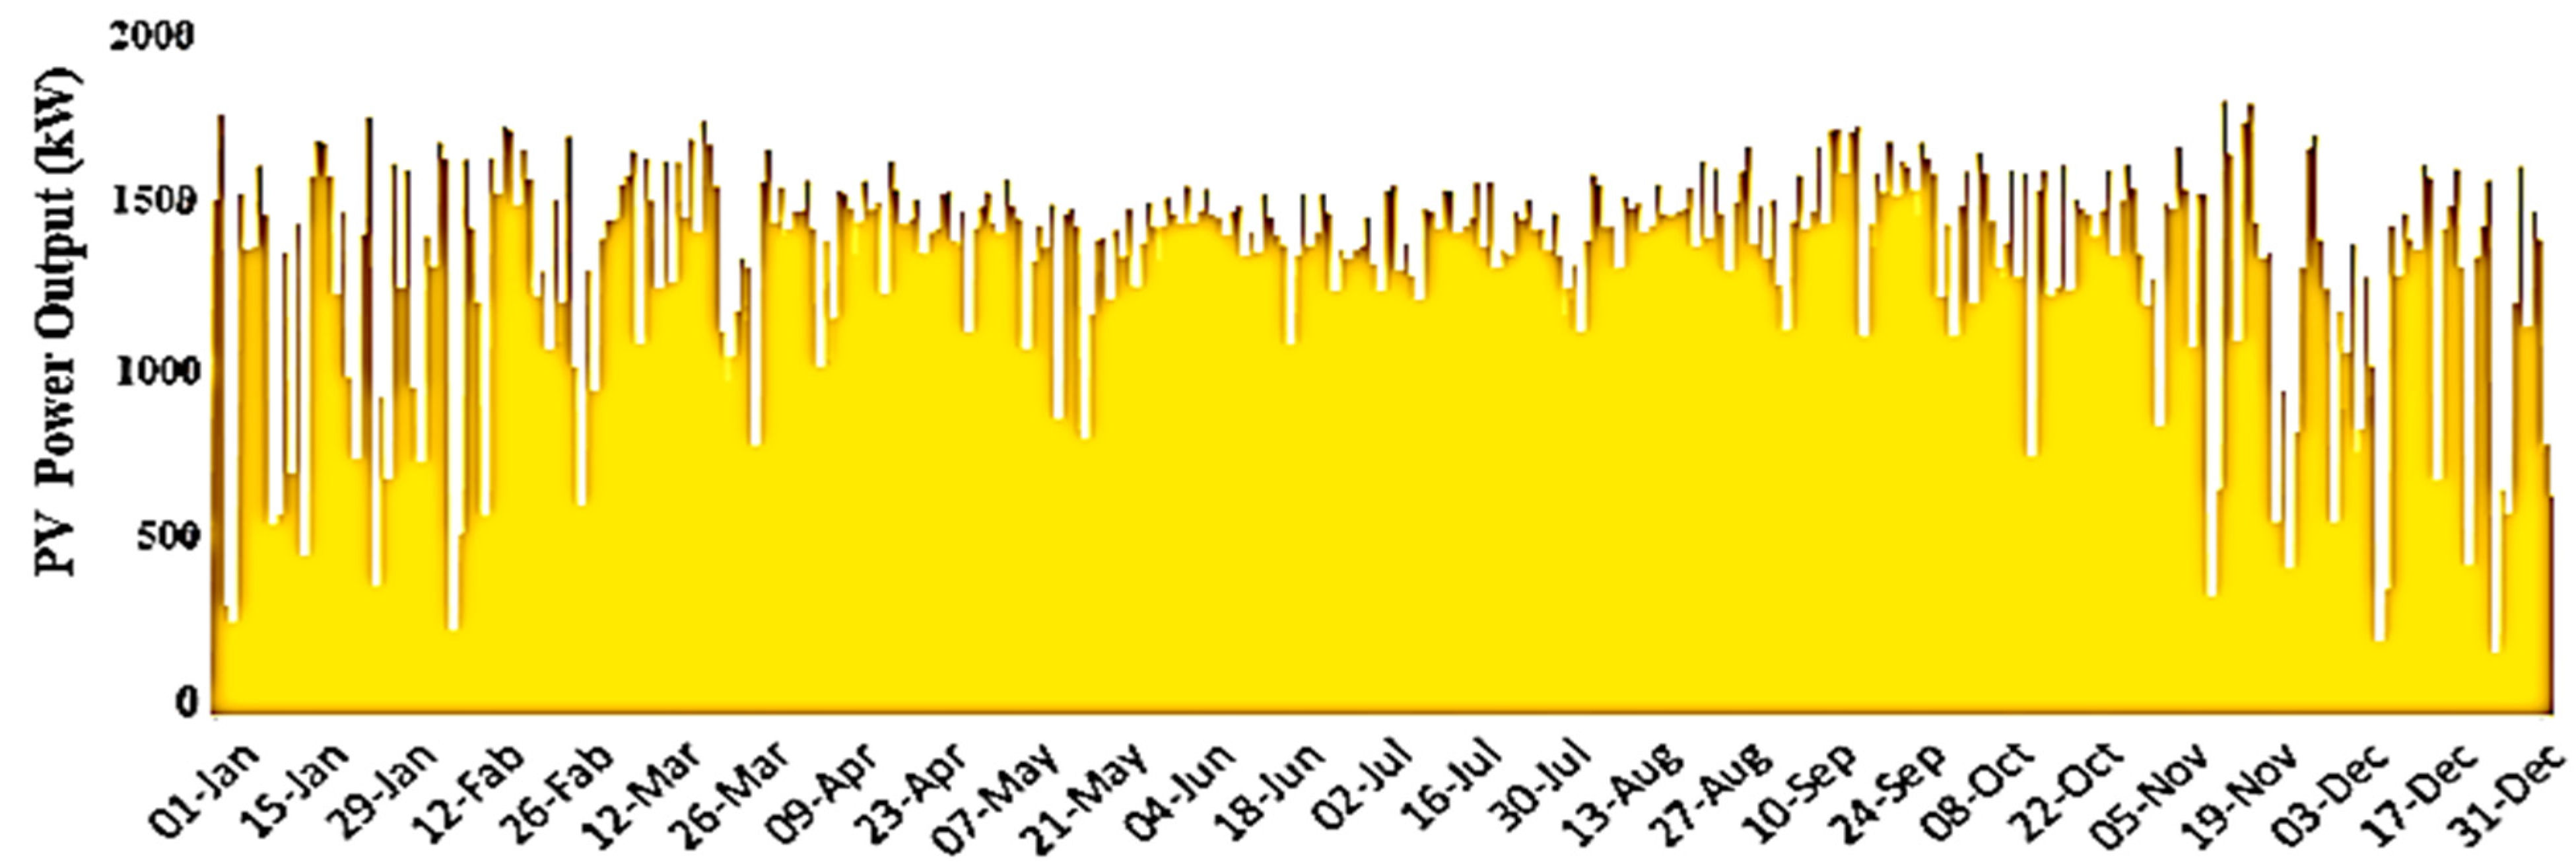
PV panels (1600 kW), Figure 6 shows the yearly power output of the PV system of the HRES for the proposed tourist village in the study. The mean power output of the PV is 383.8 kW of the total rated capacity 1600 kW (capacity factor is 23.988%); the time of operation of the PV during the year is 4385 h. The levelized COE using the PV power is $0.0595/kWh.
2
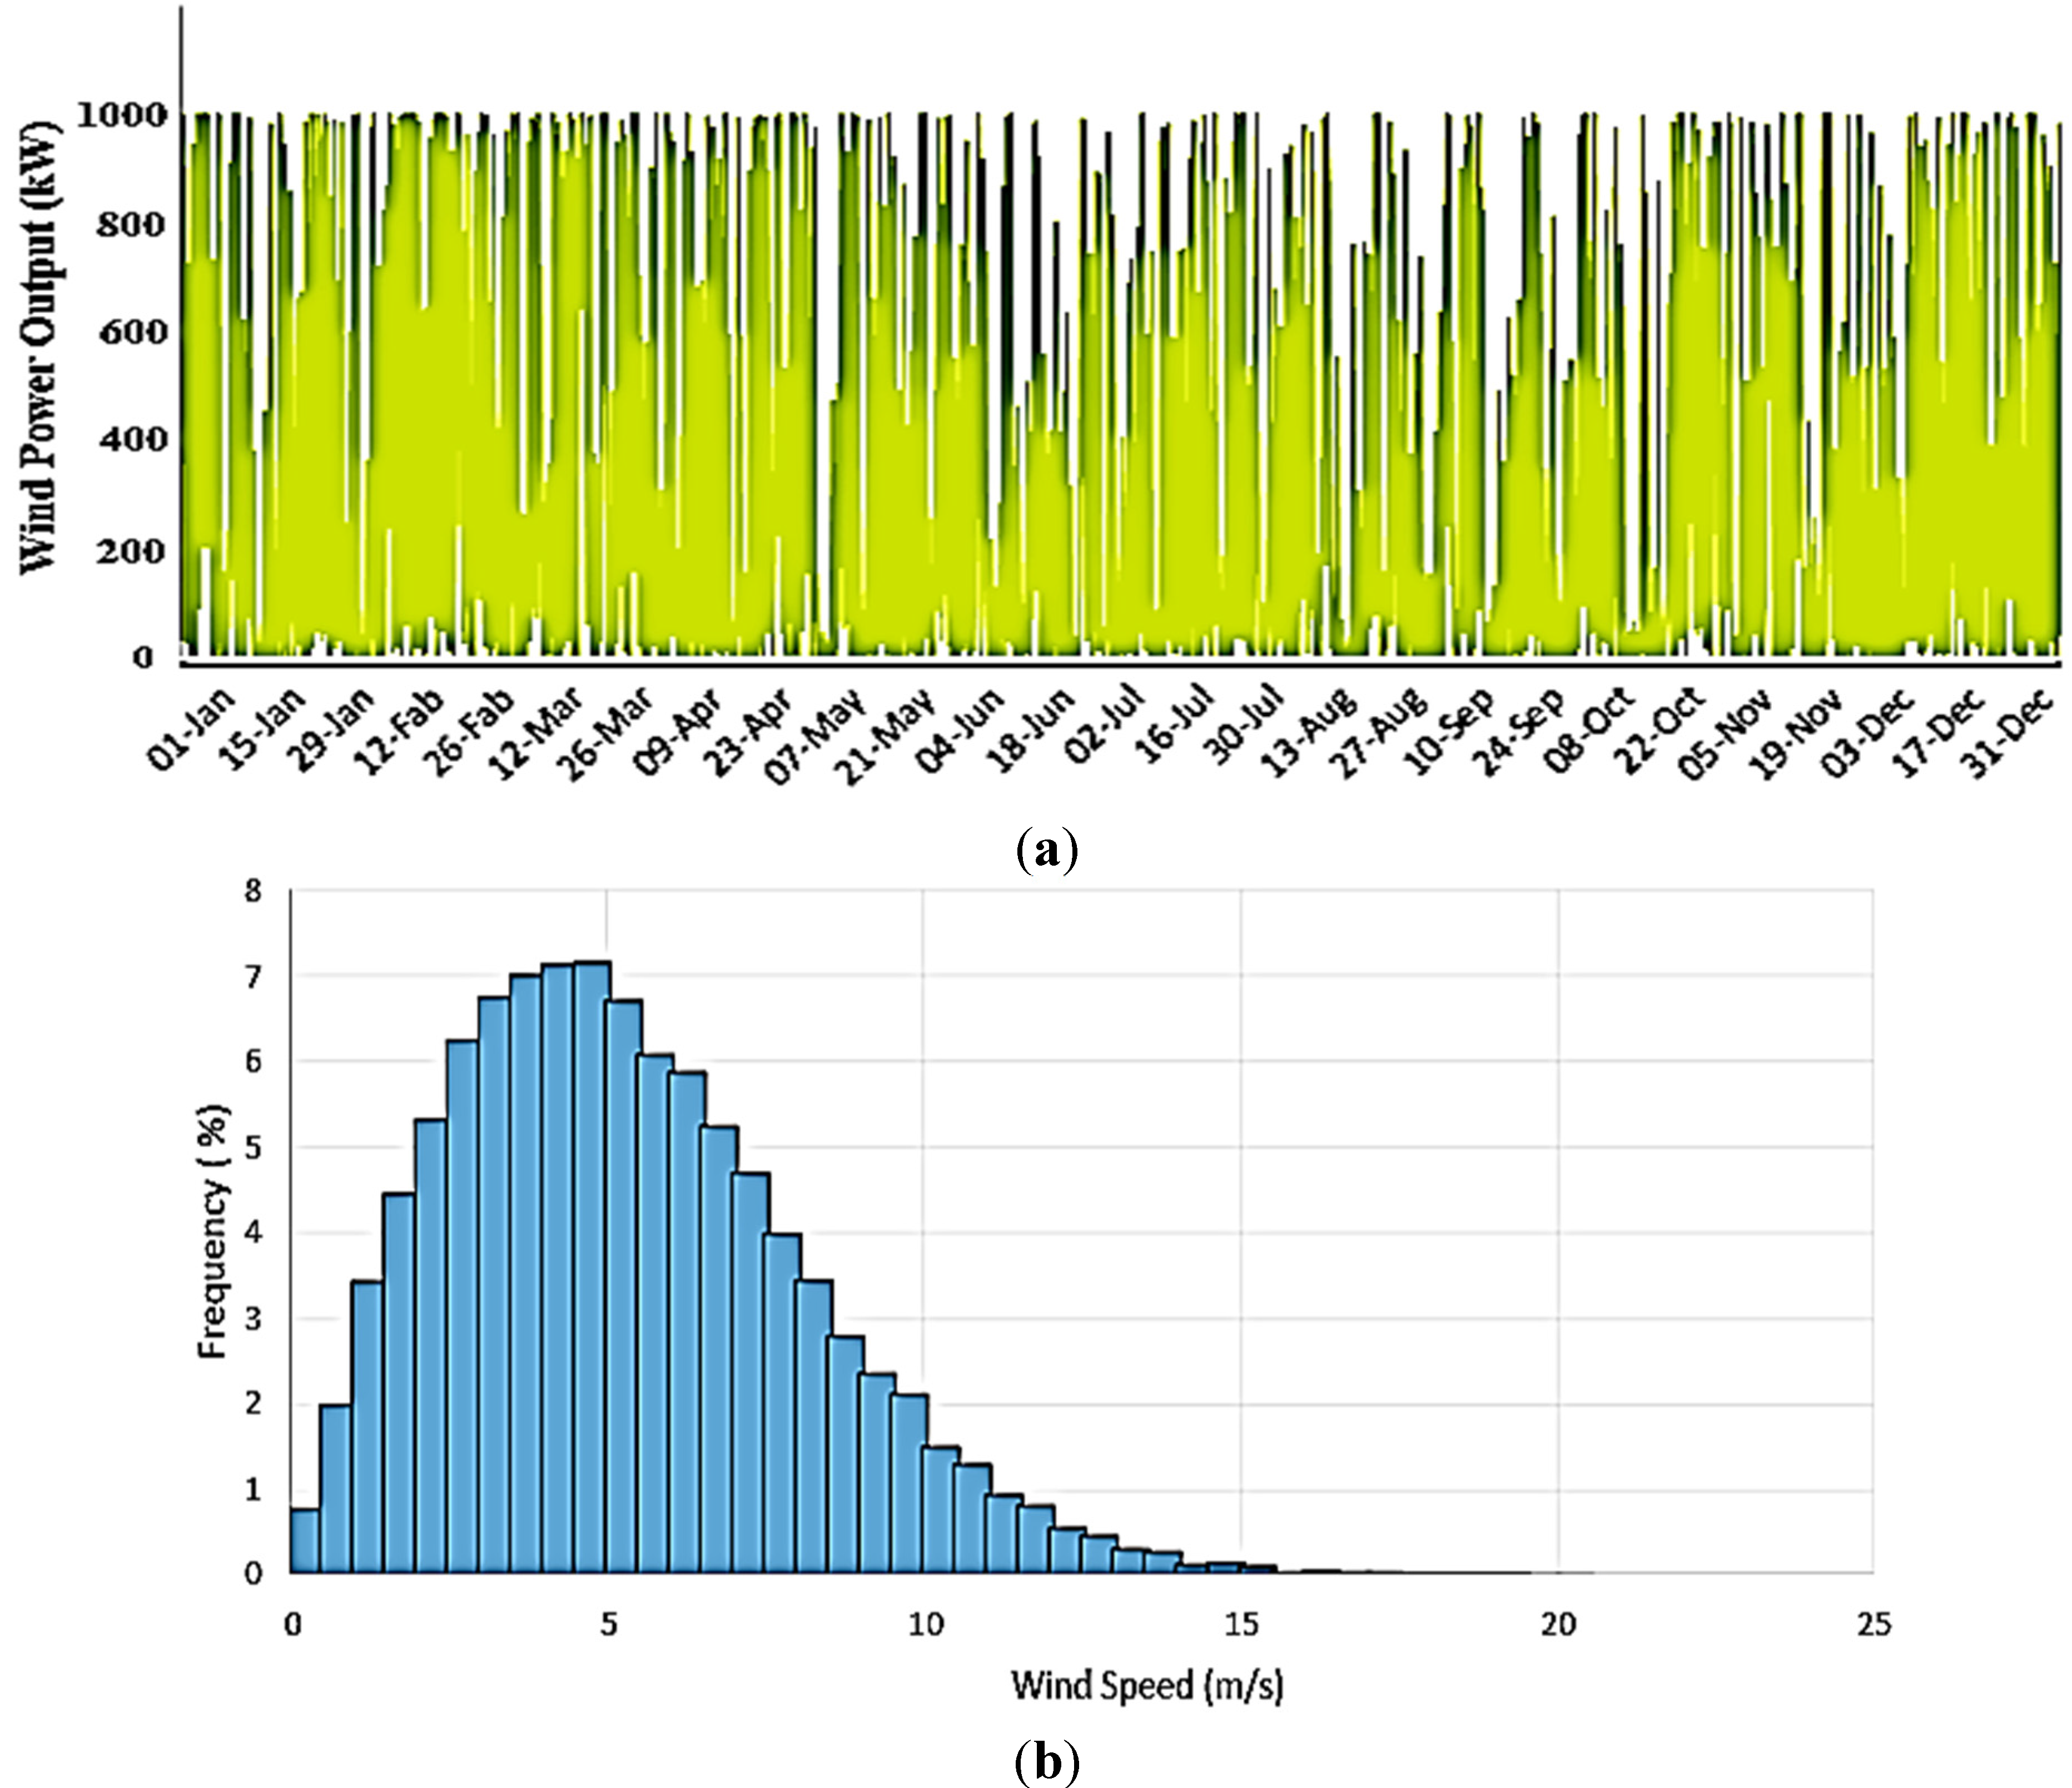
Wind turbines (1000 kW), Figure 7a,b show the yearly wind power output and Weibull probability distribution function of the wind speed histogram of the HRES for the proposed tourist village in the study. The mean power output of the wind turbine is 273.17 kW of the total rated capacity 1000 kW (capacity factor is 27.317%); the time of operation of the wind turbine during the year is 7426 h. The levelized COE using the wind turbine power is $0.0752/kWh.
Figure 6. The yearly PV power output of the HRES for the proposed tourist village in the study.
Energies 08 06945 g006
Figure 7. (a) The yearly wind turbine power output of the HRES for the proposed tourist village in the study; (b) Weibull probability distribution function of wind speed histogram.
Energies 08 06945 g007
3
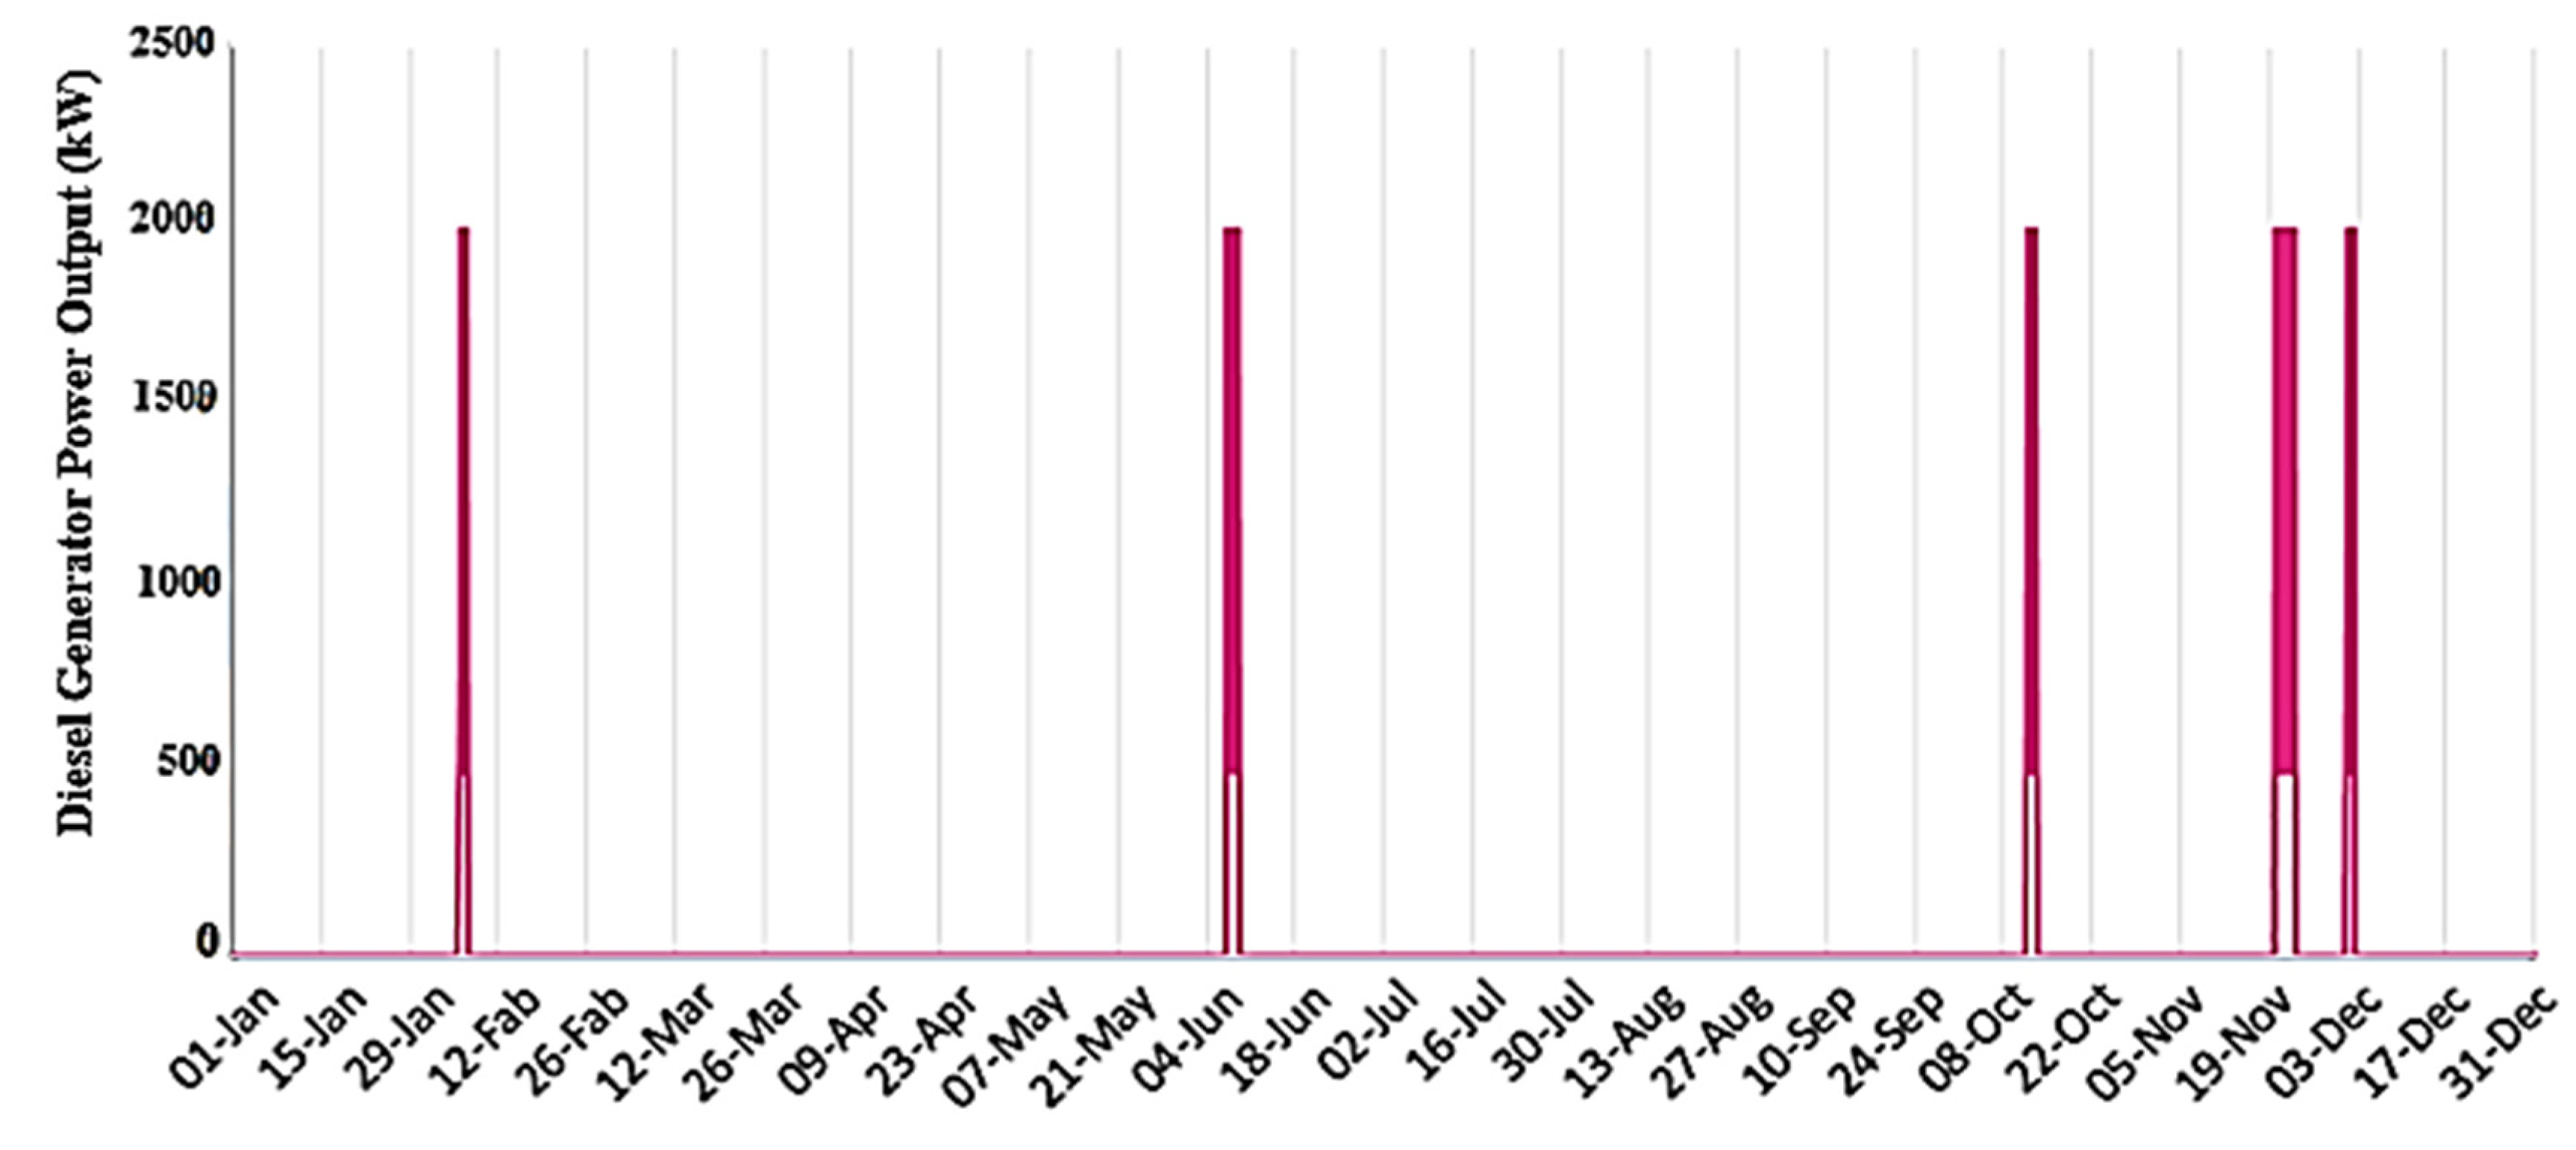
Diesel generator (200 kW), Figure 8 shows the yearly diesel generator power output of the HRES for the proposed tourist village in the study. The maximum power output of the diesel generator is 200 kW, the minimum power output is 50 kW and the mean power output is 146.24 kW. The time of operation of the diesel generator is 225 h in five starts during the year as shown in Figure 8. Additionally, the total consumed amount of fuel is 11,570 L/year and the marginal generation cost of the diesel generator is $0.06/kWh.
Figure 8. The yearly diesel generator power output of the HRES for the proposed tourist village in the study.
Energies 08 06945 g008
4
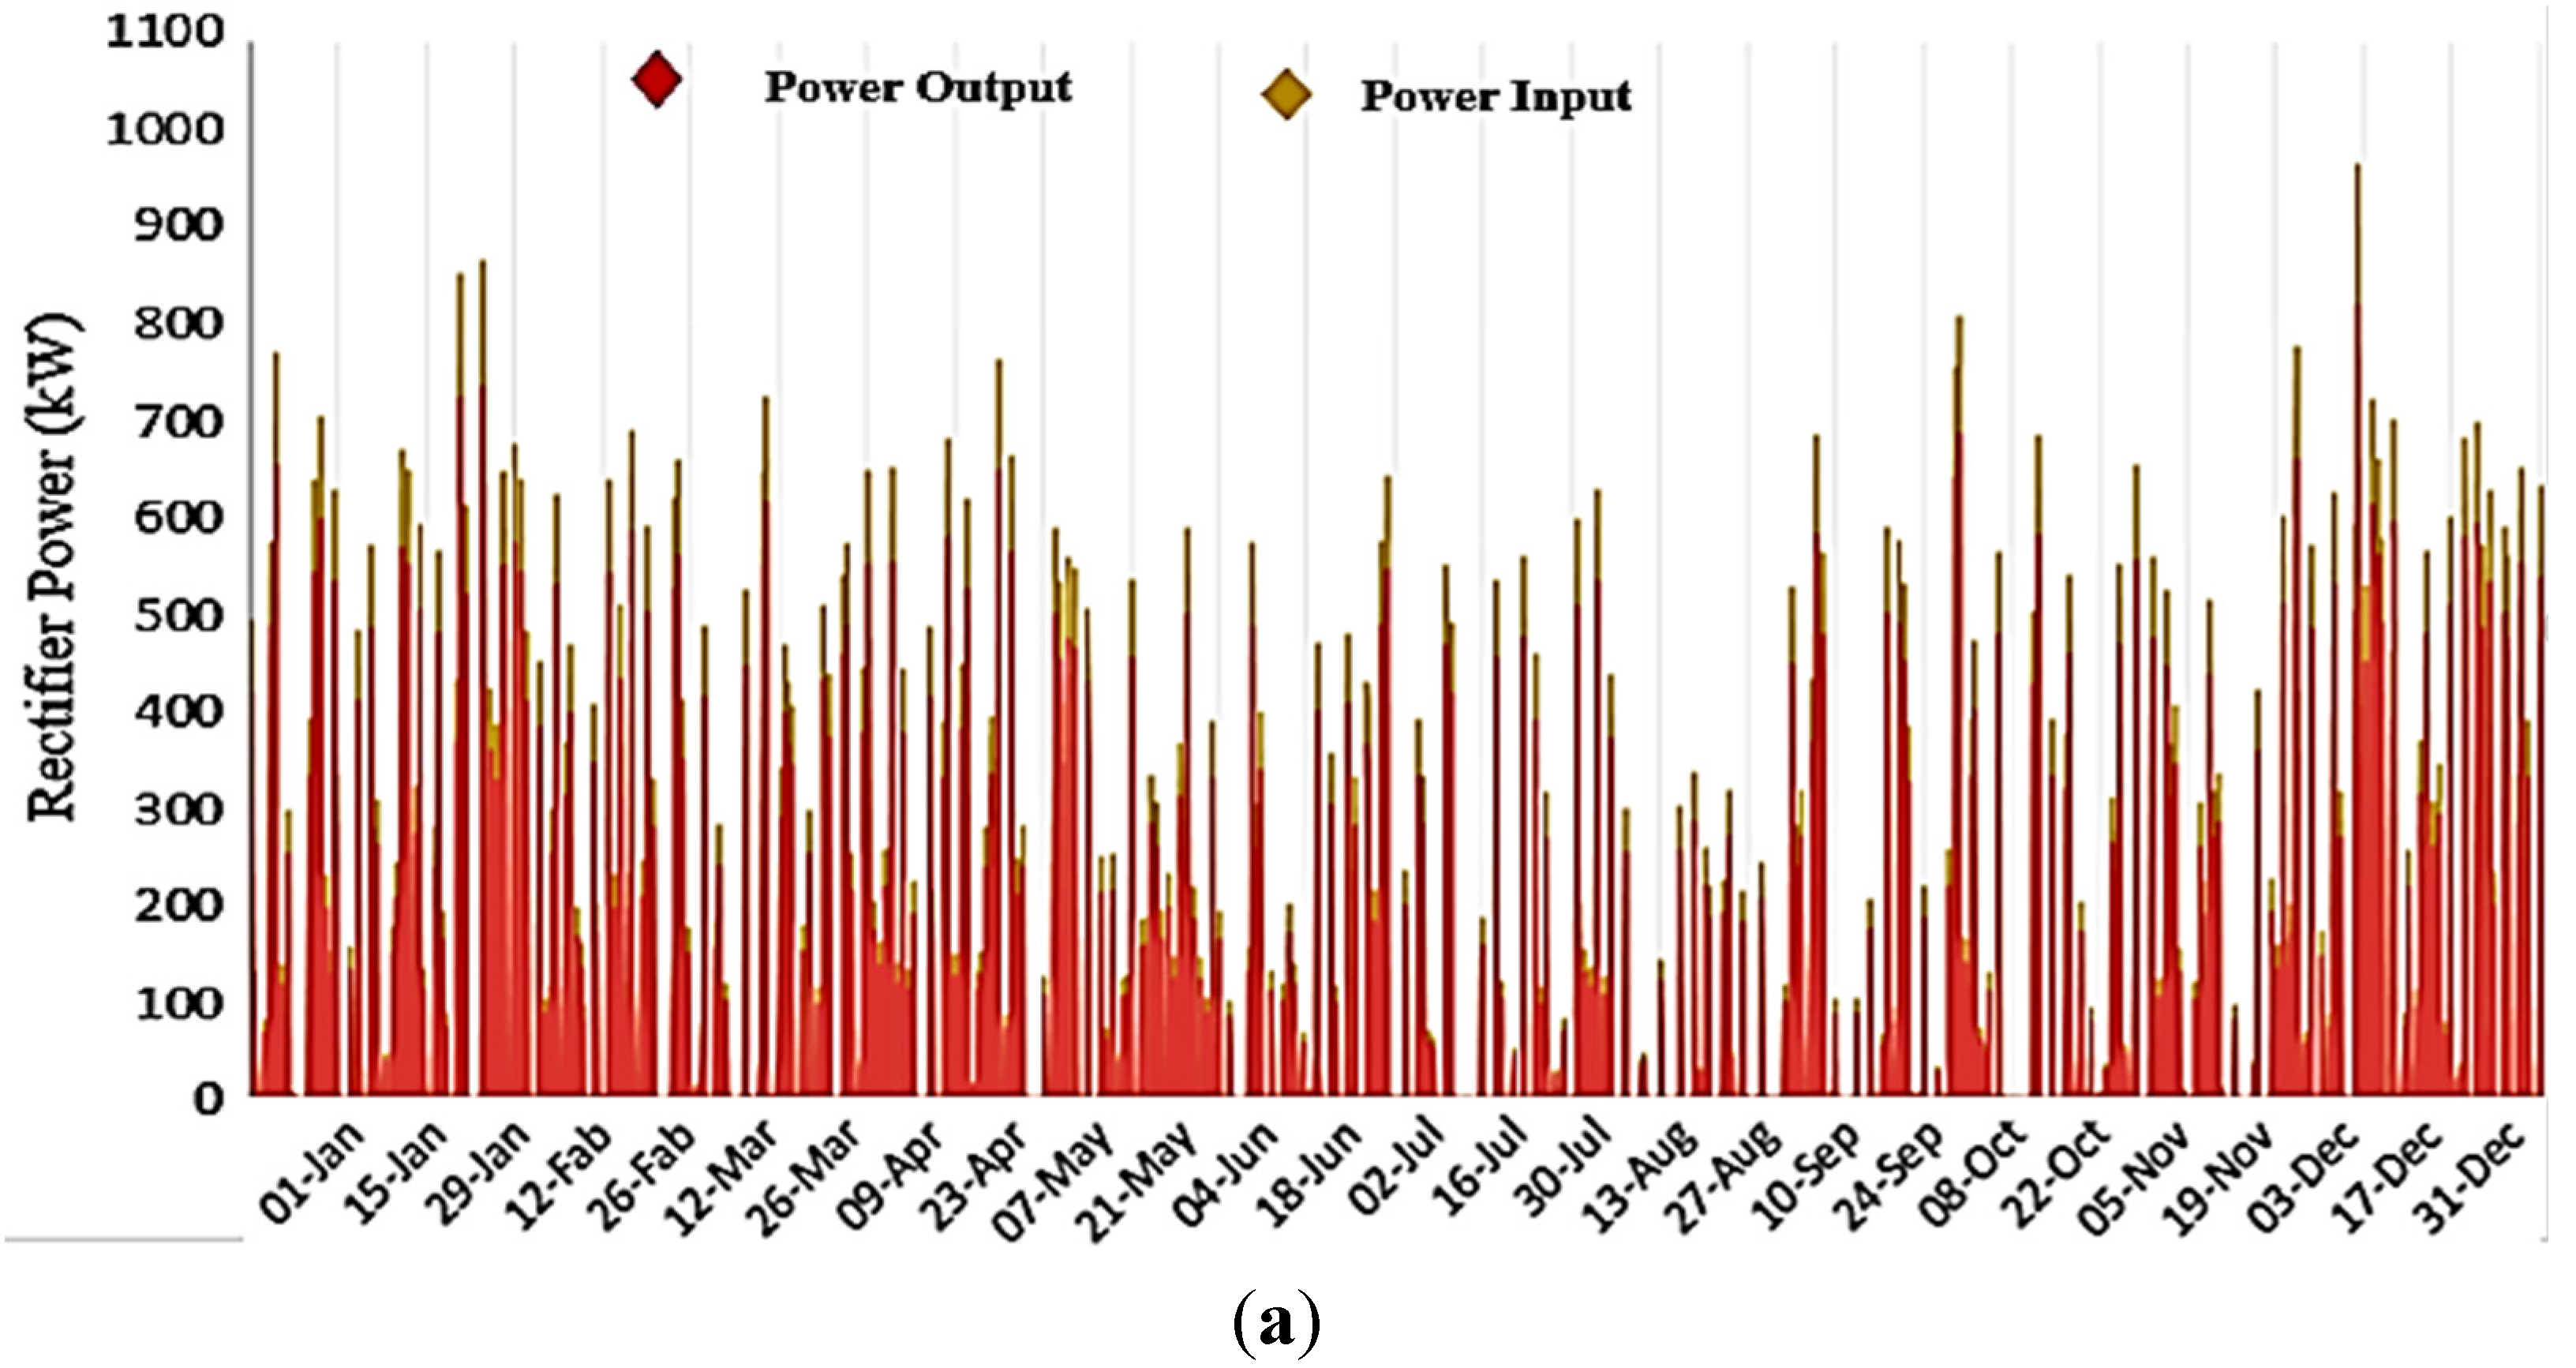
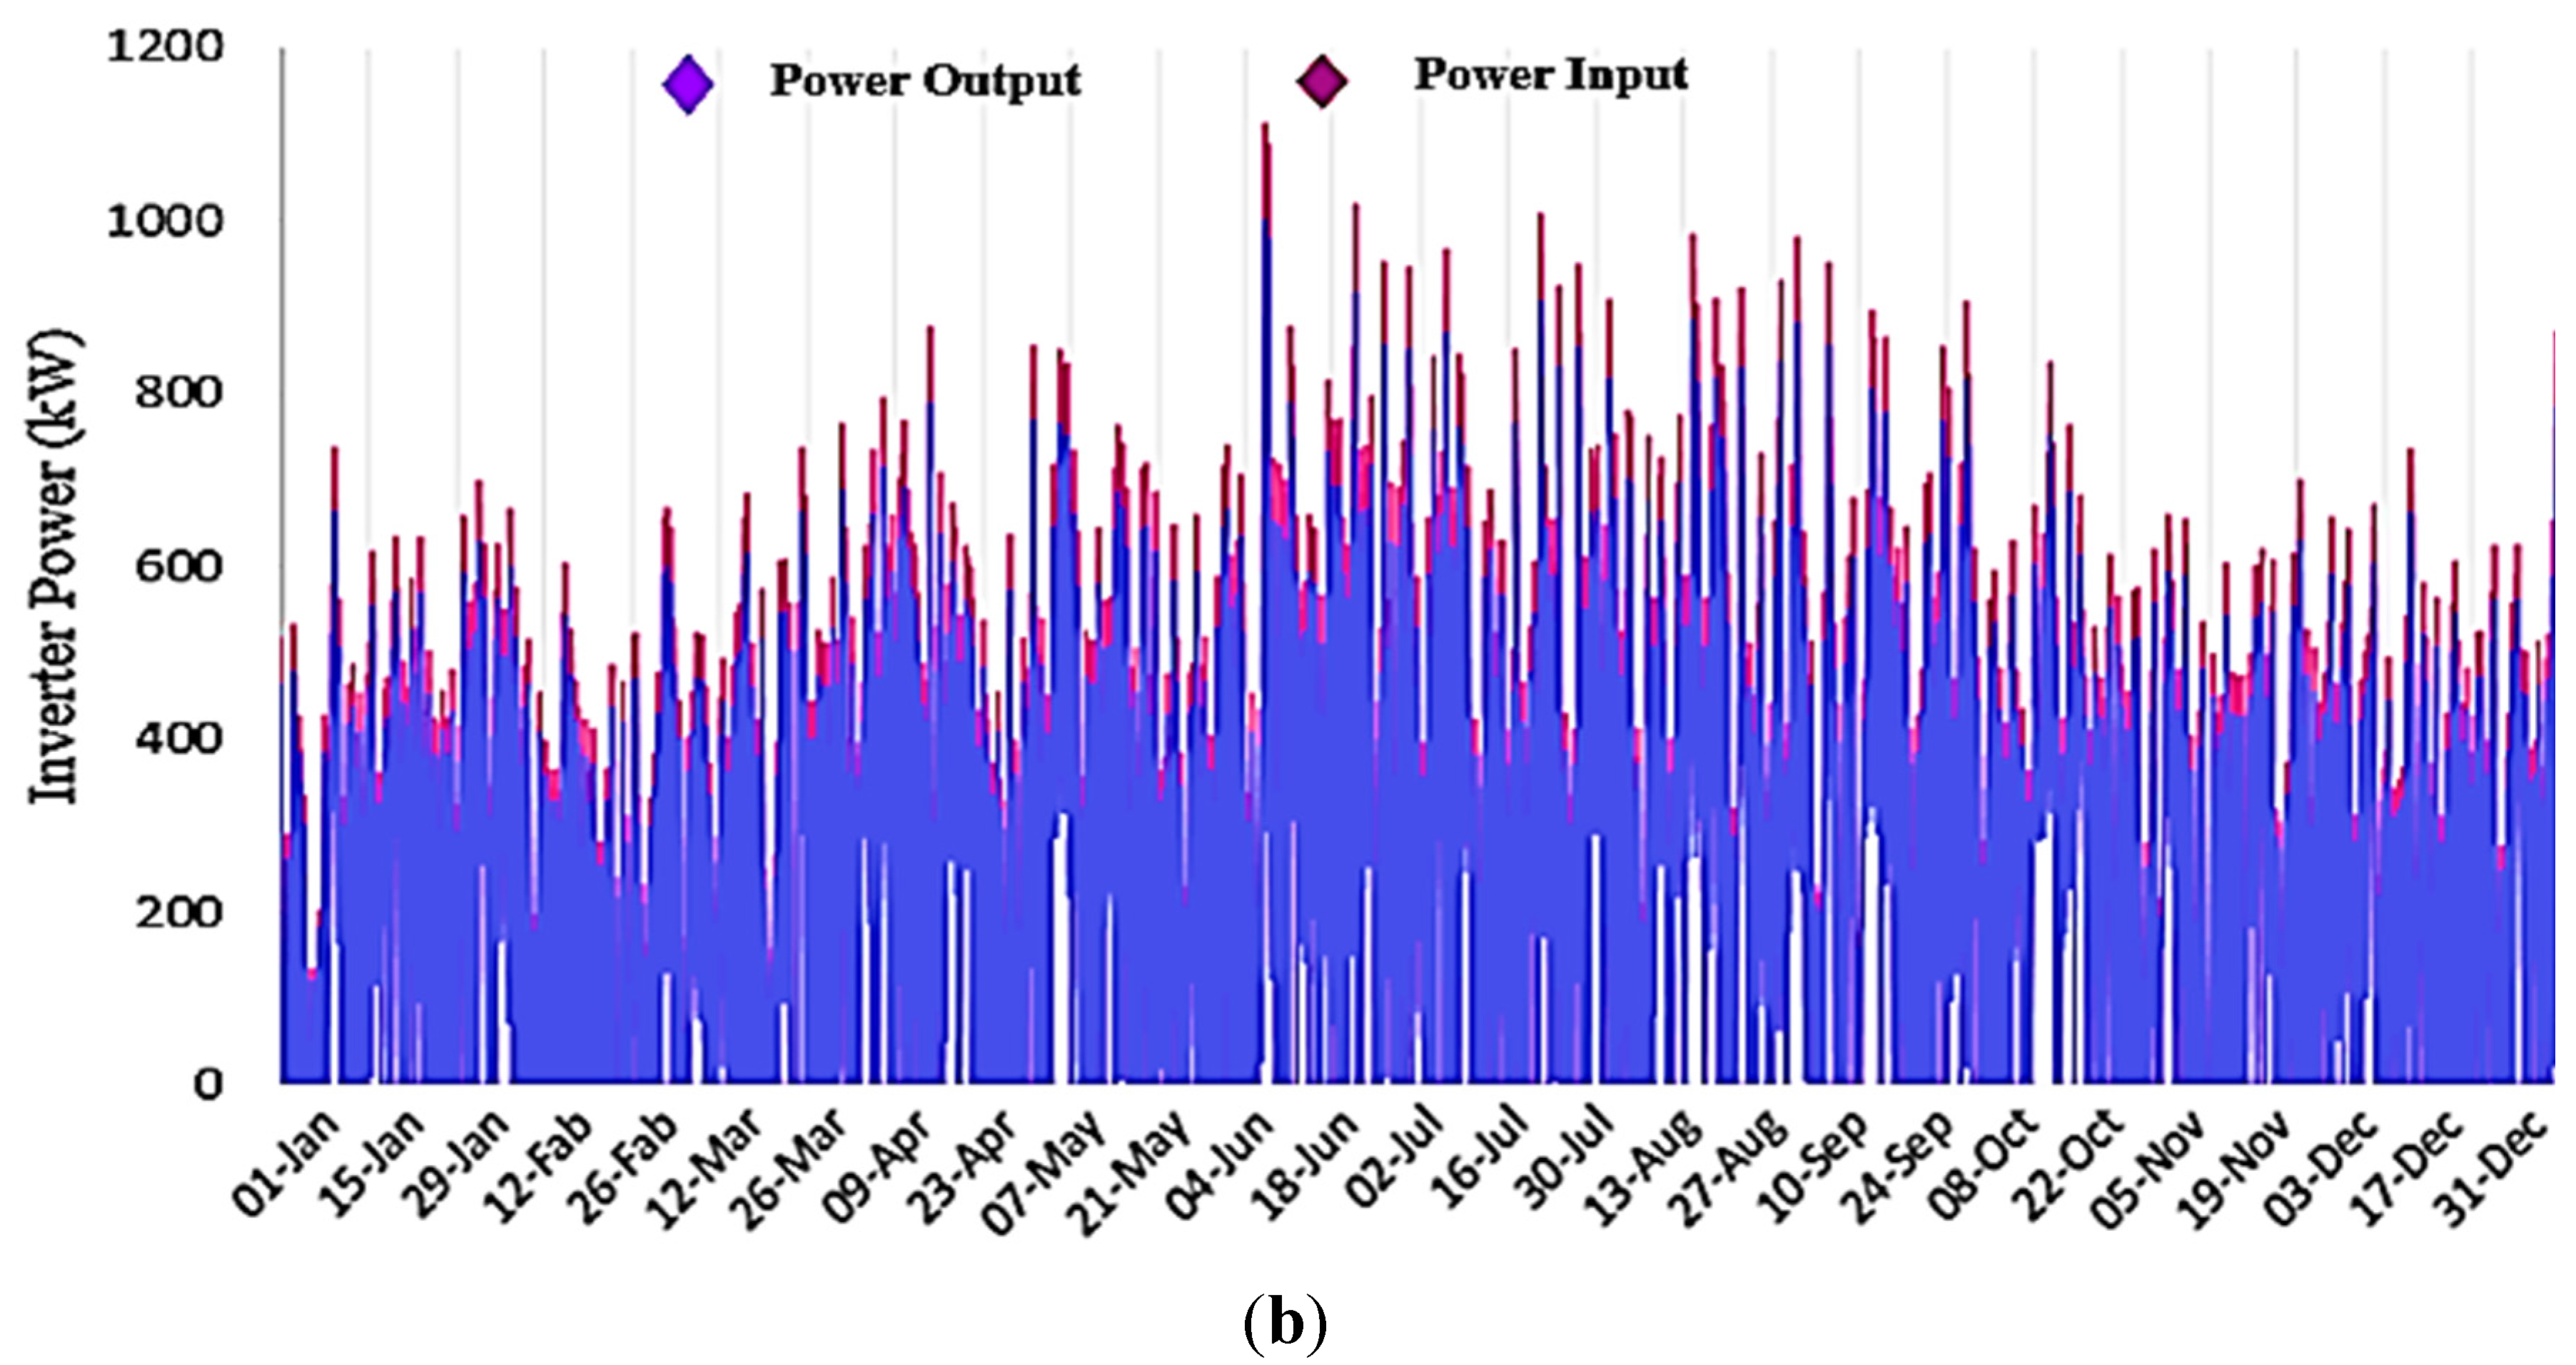
Power converters (1000 kW), Figure 9a,b show the yearly rectifier and inverter power input and power output of the HRES for the proposed tourist village in the study. It should be noted that the converter has two functions; first rectifier to convert AC power to DC power (batteries charger), second inverter to convert DC power to AC power (energy flow from the PV or the batteries to the AC load). The energy output from the rectifier is 229,757 kWh/year while the energy input to the rectifier is 270,303 kWh/year with losses of 40,546 kWh/year. The time of operation of the power converter as a rectifier during the year is 1433 h. The energy output from the inverter is 2,045,117 kWh/year while the energy input to the inverter is 2,272,351 kWh/year with losses of 227,234 kWh/year. The time of operation of the power converter as an inverter during the year is 6295 h.
Figure 9. (a) The yearly rectifier power input and power output; (b) the yearly inverter power input and power output.
Energies 08 06945 g009aEnergies 08 06945 g009b
5
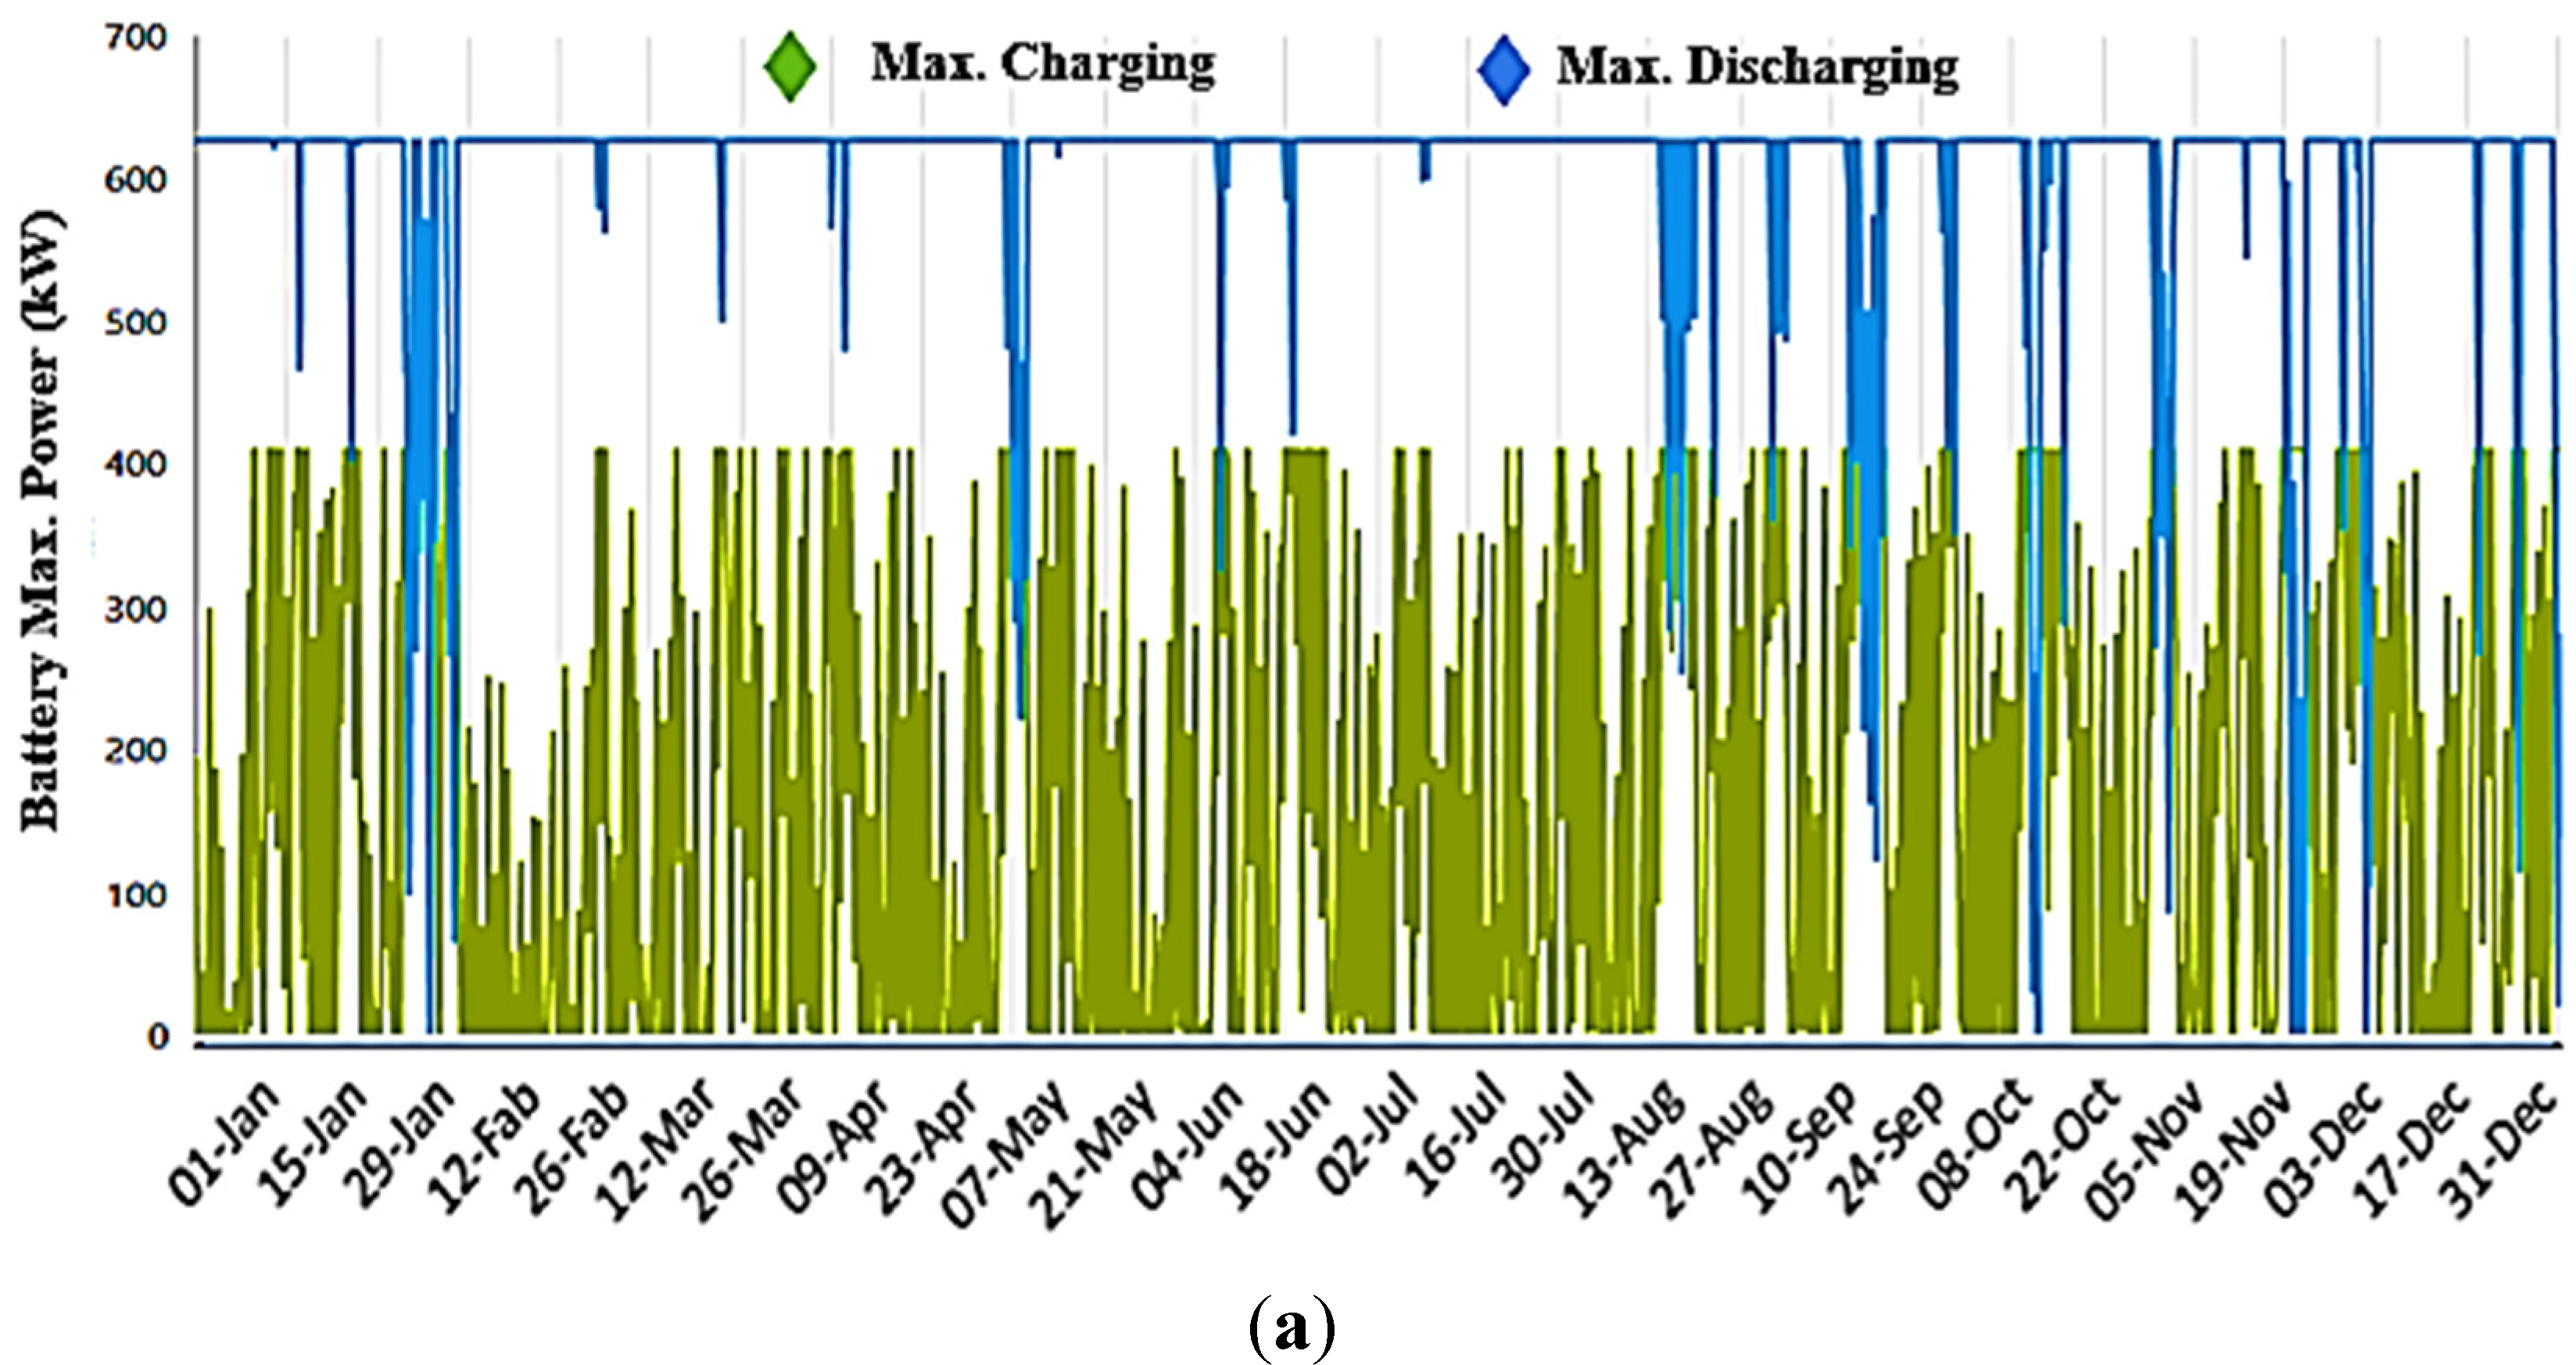
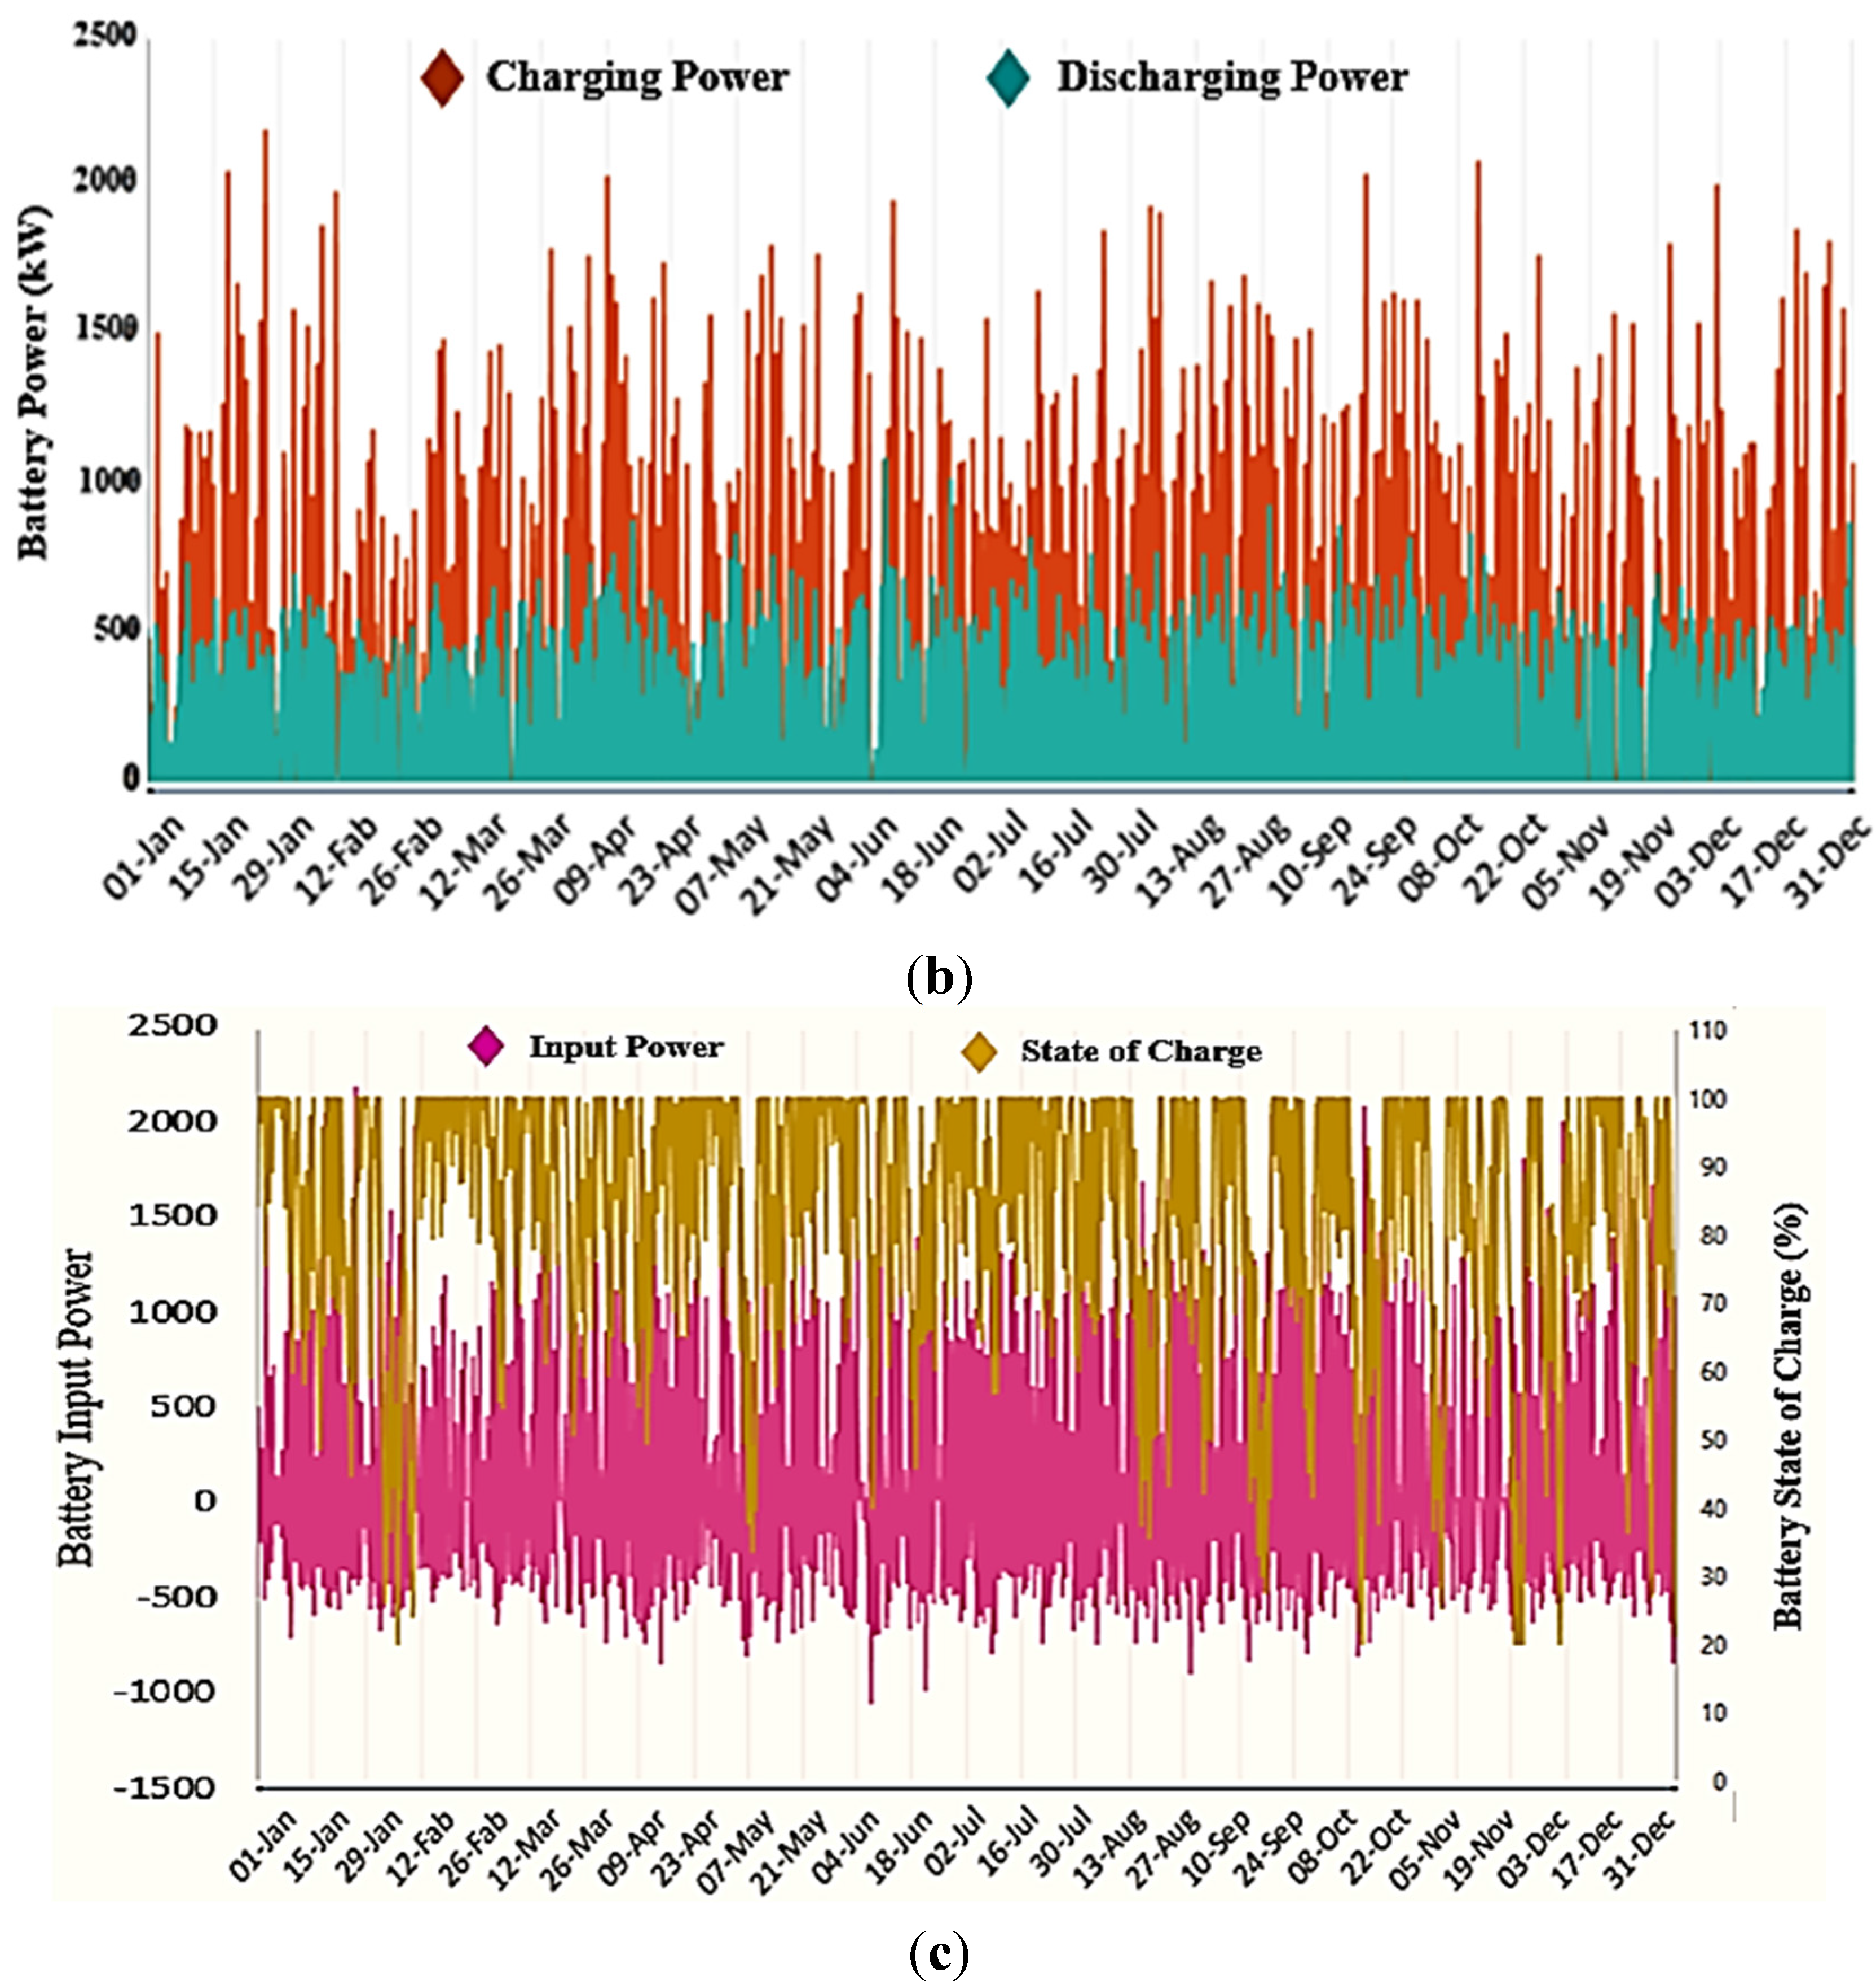
Batteries (2000 batteries, with the capacity of 589 Ah each), Figure 10a,b show the yearly battery charging and discharging power and maximum power. Figure 10c shows the yearly batteries input power and batteries state of charge. The batteries state of charge is around 100% most of the year. The energy output from the batteries is 1,346,038 kWh/year while the energy input to the batteries is 1,569,687 kWh/year with losses of 214,431 kWh/year and storage depletion of 9218 kWh/year. Additionally, the expected lifetime of the batteries is 17.26 years.
Figure 10. (a) The yearly battery maximum charging and maximum discharging power; (b) The yearly battery charging and discharging power; (c) The yearly batteries input power and batteries state of charge.
Energies 08 06945 g010aEnergies 08 06945 g010b
Figure 11 shows the cost of each component of the optimum hybrid PV/wind/diesel/battery system as a percentage. The cost of PV system, wind turbines, diesel generator, batteries and power converters during the 25 years of the project’s lifetime, using 8% annual interest rate are $5,000,000, $4,500,000, $202,851, $4,405,509 and $1,275,000 respectively. Moreover, the PV system has the maximum cost in the optimum hybrid PV/wind/diesel/battery system followed by wind turbines, batteries and power converters. On the other hand, the diesel generator has the minimum component cost in the optimum hybrid PV/wind/diesel/battery system as it is time of operation is only 225 h in five starts during the year as shown in Figure 8.
The levelized COE from this hybrid system is $0.17/kWh. The total NPC of this system is $15,383,360. Based on the concept of net zero energy, the maximum renewable fraction is 99.1%. In other words, we have achieved a zero sustainable energy proposed tourist village. Additionally, the amount of greenhouse gases (GHG) emitted from the optimum HRES is only 31,289 kg/year, which is negligible compared to other system configurations, so the HRES can be considered as a green system.
Figure 11. Cost of each component of the optimum HRES as a percentage.
Energies 08 06945 g011
According to Figure 12, the electricity produced from the solar radiation is (3,362,070 kWh/year, 58.09%), and from the wind source is (2,392,986 kWh/year, 41.34%) from the total annual electricity production (5,787,959 kWh/year). On the other hand, only 0.57% (32,903 kWh/year) produced from the diesel generator during five months of the year (February, June, October, November and December). The excess electricity produced by the HRES always exists, however the dump load in the form of a heating or cooling load can use this excess electricity. Moreover, this would increase the efficiency of the HRES and decrease the levelized COE less than $0.17/kWh.
Figure 12. Monthly electricity production from different components of the optimum HRES.
Energies 08 06945 g012
The achieved percentage of the capacity shortage of the optimal HRES is only 0%. This means the actual amount of operating capacity that the system can provide, equals the required operating capacity. The percentage of the capacity shortage can be given by the following equation:
% F cs = (   E cs E d   ) × 100
where
  • E cs the total annual capacity shortage (kWh/year).
  • E d   the total annual electric demand ( primary plus deferrable) (kWh/year).
The unmet load is the electrical load that the power system is unable to serve. It occurs when the electrical demand exceeds the supply. The achieved percentage of the unmet load is only 0% of the optimal HRES, which can be given by the following equation:
% F um = (   E um E d   ) × 100
where
  • E um the total annual unmet electric load (kWh/year).

7. Conclusions

Based on the simulations and the discussions of the economical and the environmental analysis presented in this paper, the following conclusions can be drawn:
1
Alexandria is the optimum Egyptian tourist city to establish an environmentally-friendly tourist village in comparison with the other four tourist cities (Luxor, Giza, Qena and Aswan).
2
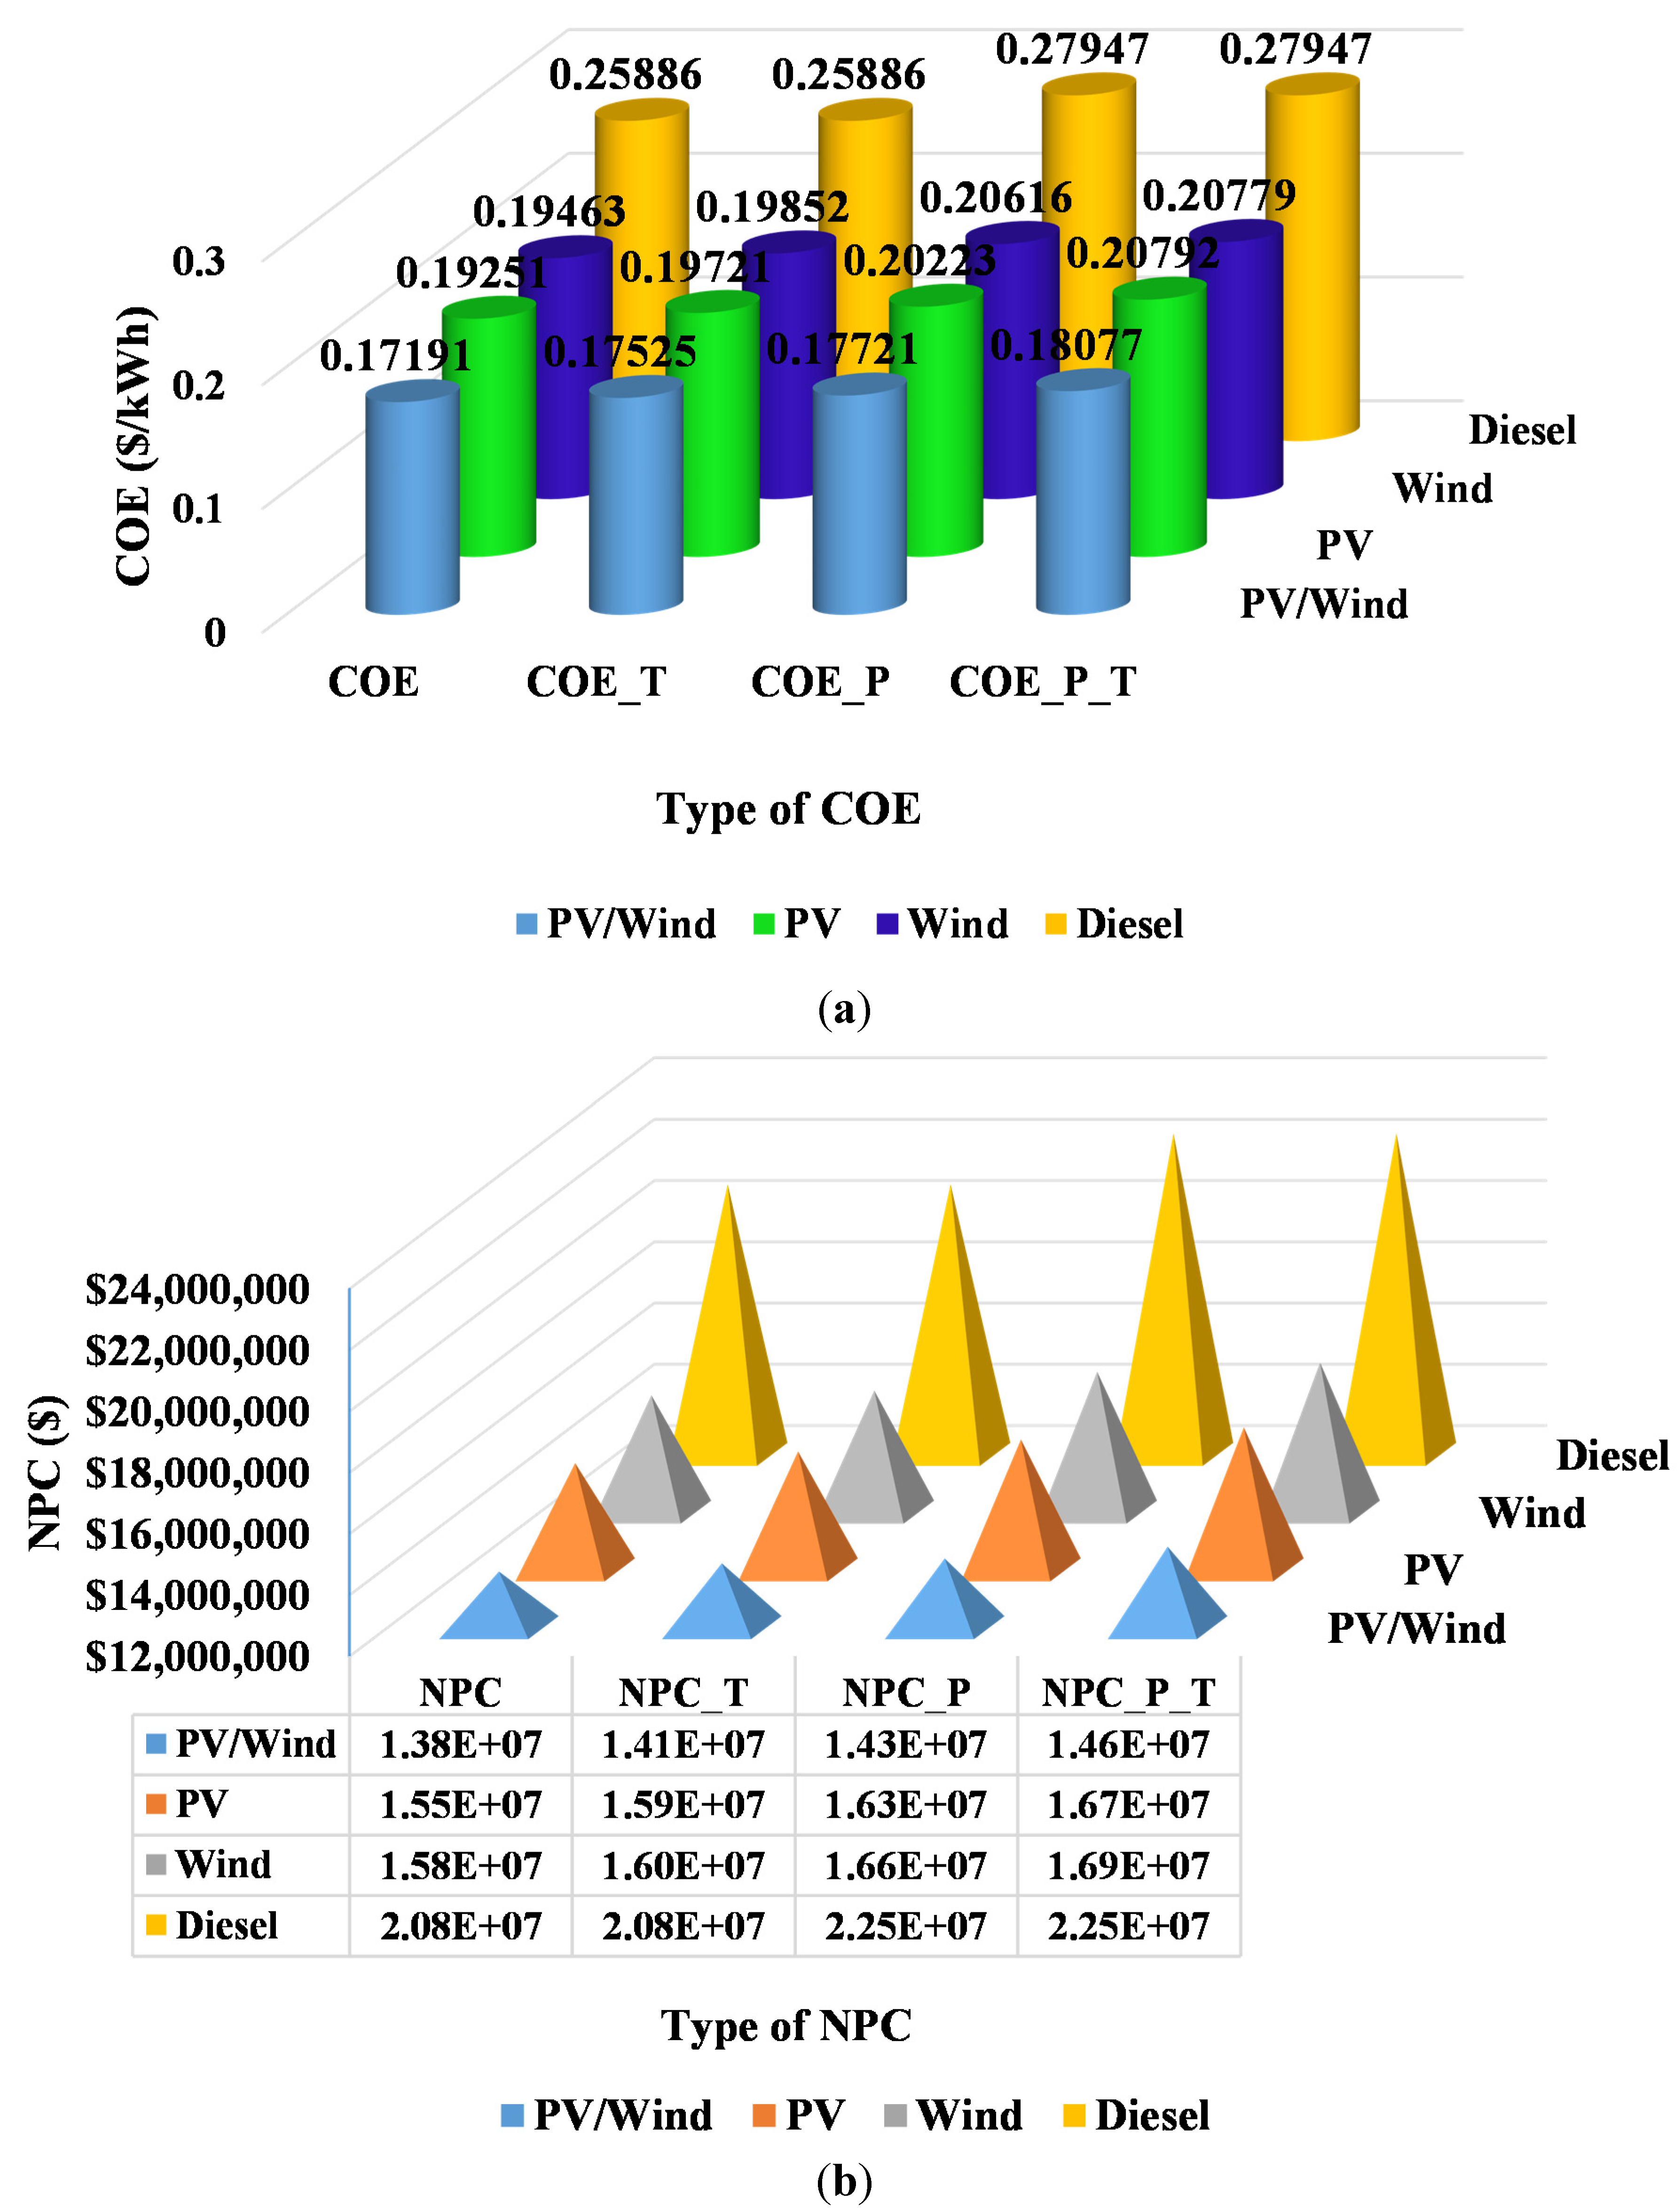
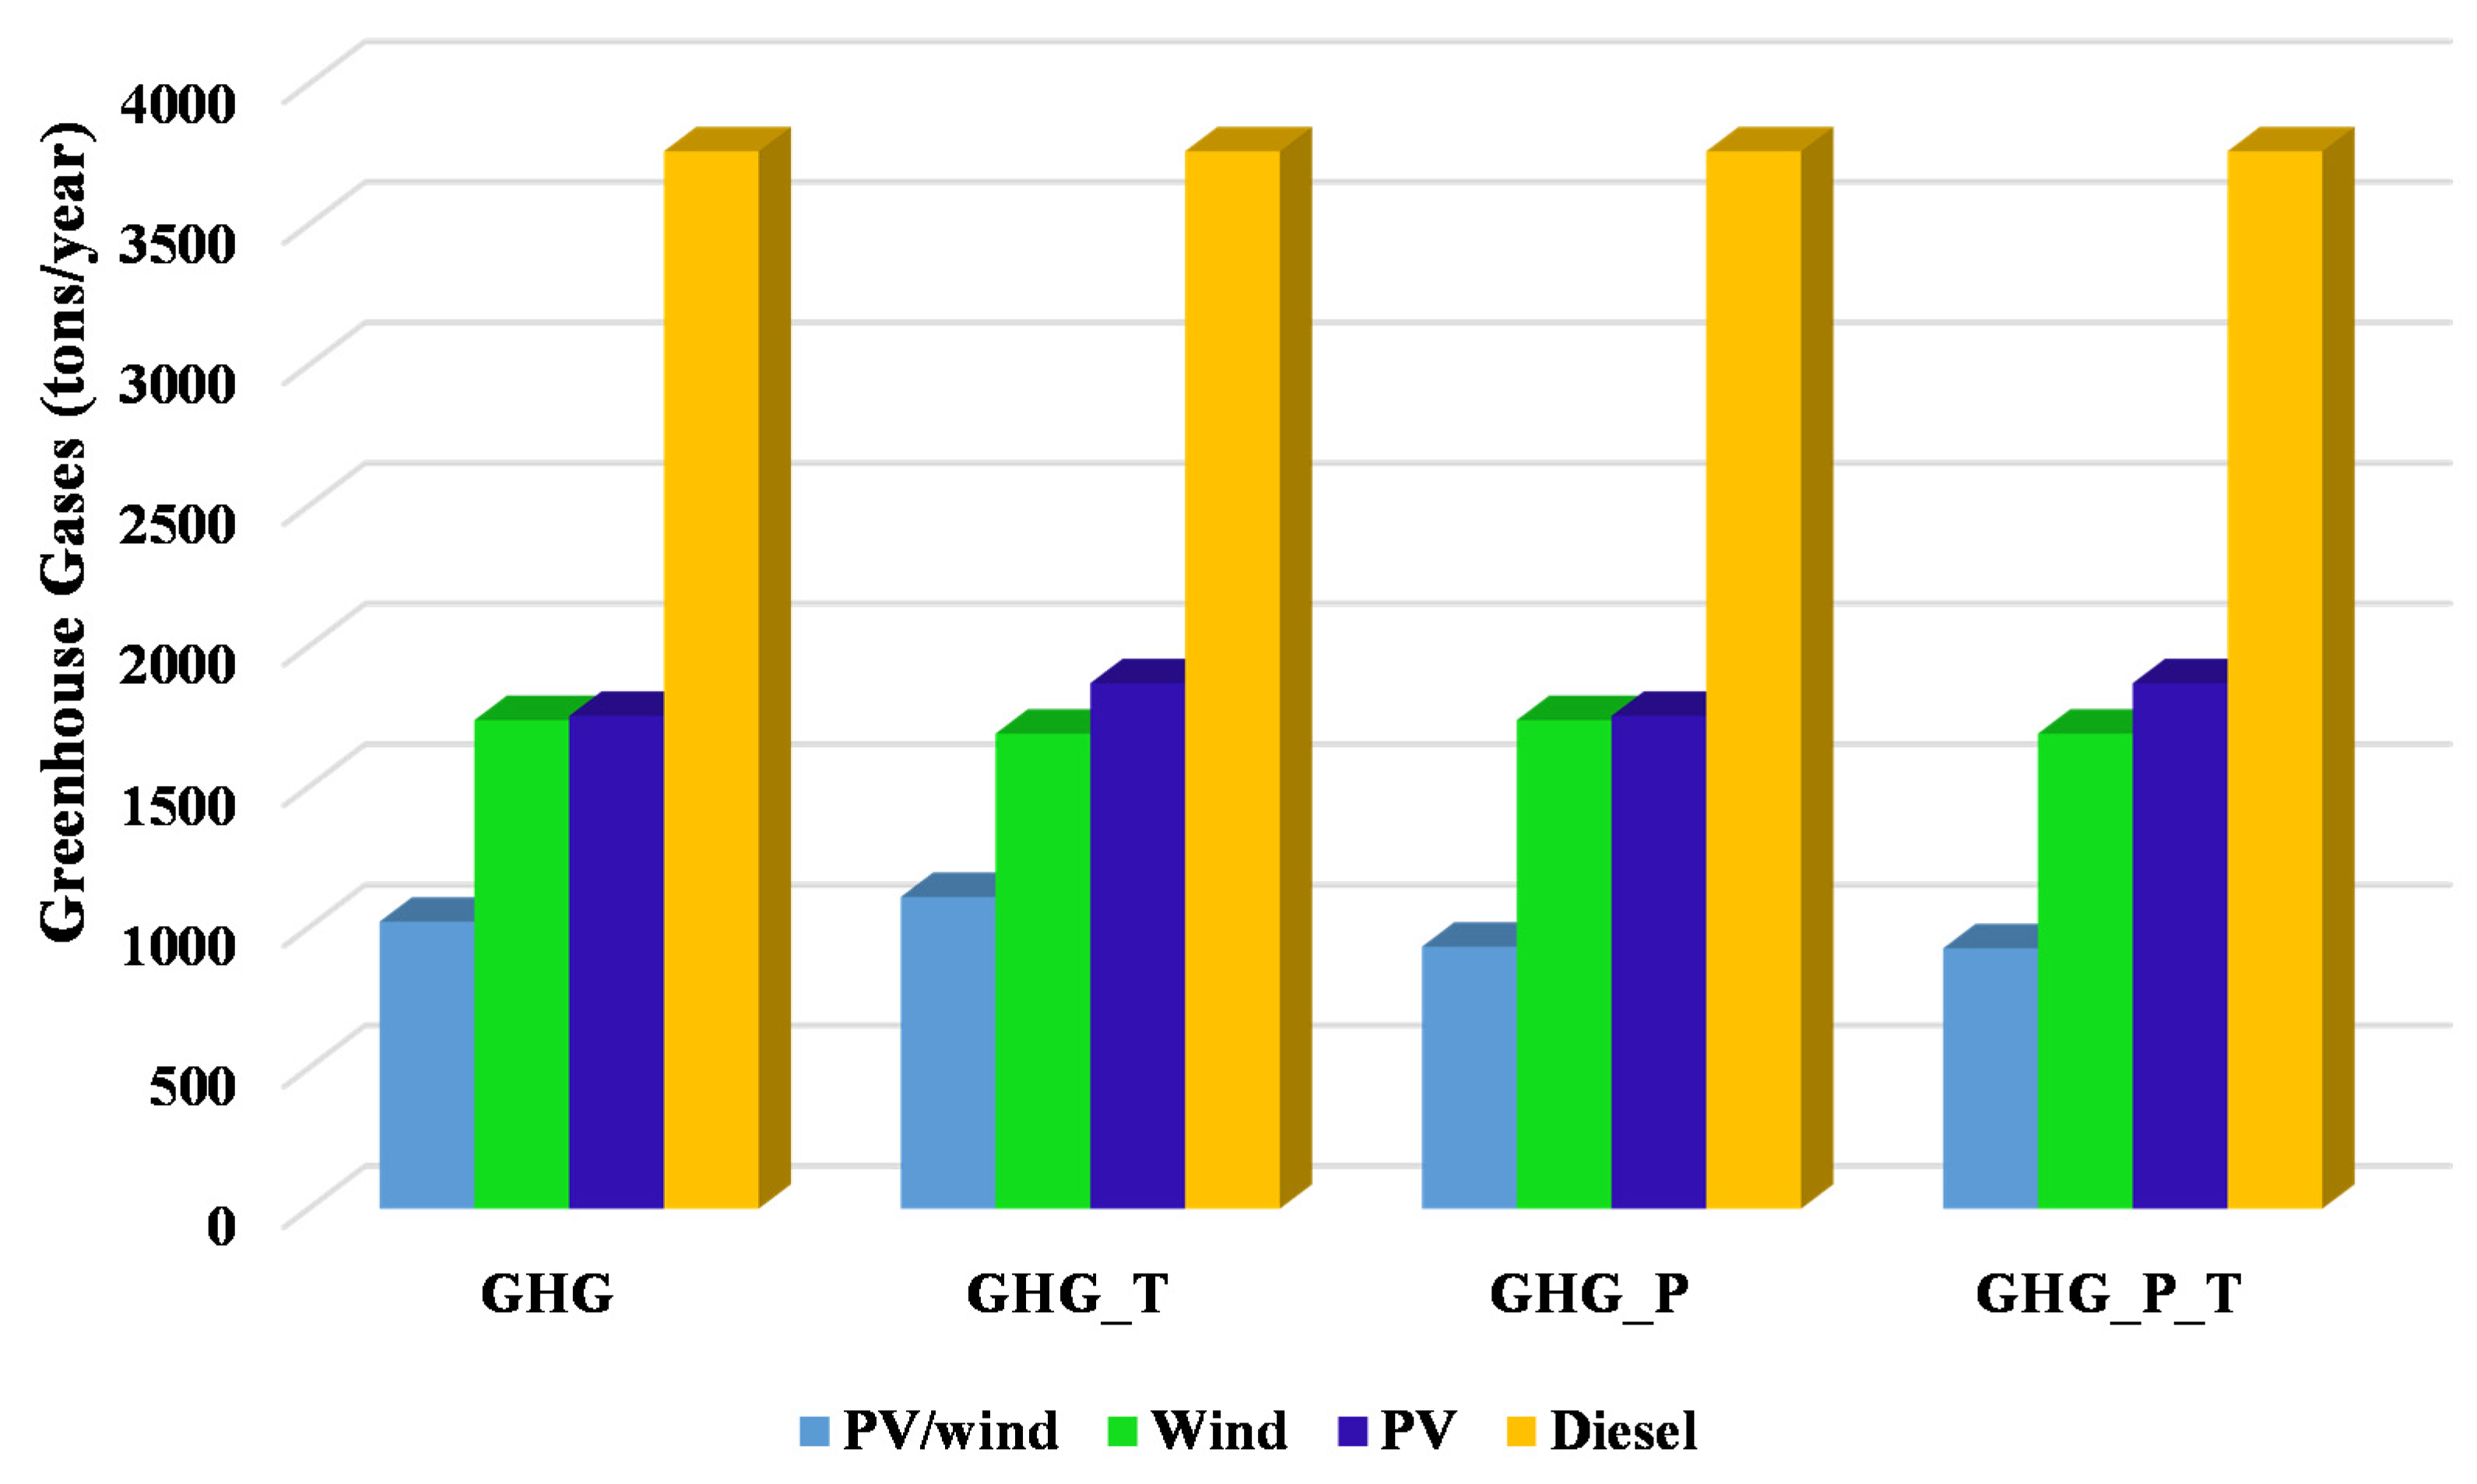
The hybrid PV/wind/diesel/battery system is found to be the optimum HRES for the proposed tourist village in Alexandria according to the economic cost (cost of energy (COE) and net present cost (NPC)) and the amount of GHG emitted.
3
The optimum HRES consists of 1600 kW of PV panels, 1000 kW of wind turbines, 1000 kW of power converters, 200 kW diesel generator and 2000 batteries with the capacity of 589 Ah each.
4
The cost of PV system, wind turbines, diesel generator, batteries and power converters during the 25 years the project’s lifetime, using 8% annual interest rate are $5,000,000, $4,500,000, $202,851, $4,405,509 and $1,275,000 respectively.
5
The levelized COE from the optimum HRES is $0.17/kWh, which is the least expensive COE in comparison with other systems configurations additionally, the total NPC of this system is $15,383,360.
6
The maximum renewable energy fraction of the optimum system is 99.1%, In other words, we have achieved a zero sustainable energy tourist village.
7
The amount of greenhouse gases (GHG) emitted from the optimum HRES is only 31,289 kg/year, which is negligible in comparing with the other system configurations, therefore the optimum HRES can be considered as a green system.
8
The electricity produced from the diesel generator is only 0.57% (32,903 kWh/year). Additionally, the excess electricity produced by the optimum HRES can be used by any dump load in the form of a heating or cooling load, which would increase the efficiency of the optimum HRES and decrease the levelized COE less than $0.17/kWh.
9
The achieved percentage of the capacity shortage of the optimum HRES is only 0%, which means this system is a reliable system.
10
The achieved percentage of the unmet load of the optimal HRES is only 0%. Additionally, the same study can be applied on any other application in any other site in the world by maximizing the renewable energy fraction and minimizing the greenhouse gases emissions, which could provide more benefits by reducing CO2 emissions and providing a reliable supply of electricity in all load conditions.

Author Contributions

All authors contributed to this work. Fahd Diab and Salwa Ali performed the research, discussed the results, prepared the manuscript; Hai Lan, Lijun Zhang suggested the research idea and contributed to writing and revise the paper. All authors revised and approved the manuscript.

Conflicts of Interest

The authors declare no conflict of interest.

References

  1. Alexandria Wikipedia. Available online: http://en.wikipedia.org/wiki/Alexandria (accessed on 17 April 2015).
  2. Alexandria Portal, Alexandria Tourism. Available online: http://www.alexandria.gov.eg/services/tourism/alextourism/beaches.html (accessed on 17 April 2015). (In Arabic)
  3. Diab, F.; Lan, H.; Zhang, L.; Ali, S. An environmentally-friendly tourist village in Egypt based on a hybrid renewable energy system—Part one: What is the optimum city? Energies 2015, 8, 6926–6944. [Google Scholar]
  4. Hassoun, A.; Dincer, I. Development of power system designs for a net zero energy house. Energy Build. 2014, 73, 120–129. [Google Scholar] [CrossRef]
  5. Iqbal, M.T. A feasibility study of a zero energy home in Newfoundland. Renew. Energy 2004, 29, 277–289. [Google Scholar] [CrossRef]
  6. Scognamiglio, A.; Adinolfi, G.; Graditi, G.; Saretta, E. Photovoltaics in net zero energy buildings and clusters: Enabling the smart city operation. Energy Procedia 2014, 61, 1171–1174. [Google Scholar] [CrossRef]
  7. Said, M.; EL-Shimy, M.; Abdelraheem, A. Photovoltaics’ energy: Improved modeling and analysis of the levelized cost of energy (LCOE) and grid parity––Egypt case study. Sustain. Energy Technol. Assess. 2015, 9, 37–48. [Google Scholar] [CrossRef]
  8. Kylili, A.; Fokaides, A. European smart cities: The role of zero energy buildings. Sustain. Cities Soc. 2015, 15, 86–95. [Google Scholar] [CrossRef]
  9. Elkinton, R.; McGowan, G.; Manwell, F. Wind power systems for zero net energy housing in the United States. Renew. Energy 2009, 34, 1270–1278. [Google Scholar] [CrossRef]
  10. Gallo, A.; Molina, B.; Prodanovic, M.; Aguilar, J.; Romero, M. Analysis of net zero-energy building in Spain, integration of PV, solar domestic hot water and air-conditioning systems. Energy Procedia 2014, 48, 828–836. [Google Scholar] [CrossRef]
  11. Da Graça, G.; Augusto, A.; Lerer, M. Solar powered net zero energy houses for southern Europe: Feasibility study. Solar Energy 2012, 86, 634–646. [Google Scholar] [CrossRef]
  12. Norisa, F.; Musallb, E.; Salomc, J.; Berggrend, B.; Jensene, S.; Lindberg, K.; Sartori, I. Implications of weighting factors on technology preference in net zero energy buildings. Energy Build. 2014, 82, 250–262. [Google Scholar] [CrossRef]
  13. Rodriguez-Ubinas, E.; Montero, C.; Porteros, M.; Vega, S.; Navarro, I.; Castillo-Cagigal, M.; Matallanas, E.; Gutiérrez, A. Passive design strategies and performance of net energy plus houses. Energy Build. 2014, 83, 10–22. [Google Scholar] [CrossRef]
  14. Song, Y.; Sun, J.; Li, J.; Xie, D. Towards net zero energy building: Collaboration-based sustainable design and practice of the Beijing waterfowl pavilion. Energy Procedia. 2014, 57, 1773–1782. [Google Scholar] [CrossRef]
  15. Wang, L.; Gwilliam, G.; Jone, P. Case study of zero energy house design in UK. Energy Bulid. 2009, 41, 1215–1222. [Google Scholar] [CrossRef]
  16. Lu, Y.; Wang, S.; Zhao, Y.; Yan, C. Renewable energy system optimization of low/zero energy buildings using single-objective and multi-objective optimization methods. Energy Bulid. 2015, 89, 61–75. [Google Scholar] [CrossRef]
  17. Pudleiner, D.; Colton, J. Using sensitivity analysis to improve the efficiency of a net-zero energy vaccine warehouse design. Build. Environ. 2015, 87, 302–314. [Google Scholar] [CrossRef]
  18. Milan, C.; Bojesen, C.; Nielsen, M. A cost optimization model for 100% renewable residential energy supply systems. Energy 2012, 48, 118–127. [Google Scholar] [CrossRef]
  19. Marszal, A.; Heiselberg, P.; Jensen, R.; Nørgaard, J. On-site or off-site renewable energy supply options? Life cycle cost analysis of a net zero energy building in Denmark. Renew. Energy 2012, 44, 154–165. [Google Scholar] [CrossRef]
  20. Kwan, C.; Kwan, T. The financials of constructing a solar PV for net-zero energy operations on college campuses. Util. Policy 2011, 19, 226–234. [Google Scholar] [CrossRef]
  21. Deng, S.; Dalibard, A.; Martin, M.; Dai, J.; Eicker, U.; Wanga, Z. Energy supply concepts for zero energy residential buildings in humid and dry climate. Energy Conv. Manag. 2011, 52, 2455–2460. [Google Scholar] [CrossRef]
  22. Salom, J.; Marszal, A.; Widén, J.; Candanedo, J.; Byskov, K. Analysis of load match and grid interaction indicators in net zero energy buildings with simulated and monitored data. Appl. Energy 2014, 136, 119–131. [Google Scholar] [CrossRef]
  23. Adhikari, R.; Aste, N.; Pero, C.; Manfren, M. Net zero energy buildings: Expense or investment? Energy Procedia. 2012, 14, 1331–1336. [Google Scholar] [CrossRef]
  24. Heffernan, E.; Pan, W.; Liang, X.; de Wilde, P. Zero carbon homes: Perceptions from the UK construction industry. Energy Policy 2015, 79, 23–36. [Google Scholar] [CrossRef] [Green Version]
  25. Pacheco, M.; Lamberts, R. Assessment of technical and economical viability for large-scale conversion of single-family residential buildings into zero energy buildings in Brazil: Climatic and cultural considerations. Energy Policy 2013, 63, 716–725. [Google Scholar] [CrossRef]
  26. Kilkis, S. A net-zero building application and its role in exergy-aware local energy strategies for sustainability. Energy Conv. Manag. 2012, 63, 208–217. [Google Scholar] [CrossRef]
  27. Kilkis, S. Energy system analysis of a pilot net-zero exergy district. Energy Conv. Manag. 2014, 87, 1077–1092. [Google Scholar] [CrossRef]
  28. Thomas, W.; Duffy, J. Energy performance of net-zero and near net-zero energy homes in New England. Energy Bulid. 2013, 67, 551–558. [Google Scholar] [CrossRef]
  29. Moore, T. Modelling the through-life costs and benefits of detached zero (net) energy housing in Melbourne, Australia. Energy Bulid. 2014, 70, 463–471. [Google Scholar] [CrossRef]
  30. Saman, Y. Towards zero energy homes down under. Renew. Energy 2013, 49, 211–215. [Google Scholar] [CrossRef]
  31. Becchio, C.; Dabbene, P.; Fabrizio, E.; Monetti, V.; Filippi, M. Cost optimality assessment of a single-family house: Building and technical systems solutions for the NZEB target. Energy Bulid. 2015, 90, 173–187. [Google Scholar] [CrossRef]
  32. Dall’O’, G.; Bruni, E.; Sarto, L. An Italian pilot project for zero energy buildings: Towards a quality-driven approach. Renew. Energy 2013, 50, 840–846. [Google Scholar] [CrossRef]
  33. Cellura, M.; Guarino, F.; Longo, S.; Mistretta, M. Different energy balances for the redesign of nearly net zero energy buildings: An Italian case study. Renew. Sustain. Energy Rev. 2015, 45, 100–112. [Google Scholar] [CrossRef]
  34. Jina, Y.; Wang, L.; Xiong, Y.; Cai, H.; Li, Y.; Zhang, W. Feasibility studies on net zero energy building for climate considering: A case of “All Green House” for Datong, Shanxi, China. Energy Bulid. 2014, 85, 155–164. [Google Scholar] [CrossRef]
  35. Zhang, H.; Li, J.; Dong, L.; Chen, H. Integration of sustainability in net-zero house: Experiences in solar decathlon China. Energy Procedia. 2014, 57, 1931–1940. [Google Scholar] [CrossRef]
  36. Kalinci, Y. Alternative energy scenarios for Bozcaada Island, Turkey. Renew. Sustain. Energy Rev. 2015, 45, 468–480. [Google Scholar] [CrossRef]
  37. Alrashed, F.; Asif, M. Analysis of critical climate related factors for the application of zero-energy homes in Saudi Arabia. Renew. Sustain. Energy Rev. 2015, 41, 1395–4103. [Google Scholar] [CrossRef]
  38. Zabaneh, A. Zero net house: Preliminary assessment of suitability for Alberta. Renew. Sustain. Energy Rev. 2011, 15, 3237–3242. [Google Scholar] [CrossRef]
  39. U.S. Energy Information Administration. Available online: http://www.eia.gov/countries/country-data.cfm?fips=EG (accessed on 18 April 2015).
  40. Sinha, S.; Chandel, S. Review of software tools for hybrid renewable energy systems. Renew. Sustain. Energy Rev. 2014, 32, 192–205. [Google Scholar] [CrossRef]
  41. NASA Surface Meteorology and Solar Energy. Available online: https://eosweb.larc.nasa.gov/cgi-bin/sse/[email protected] (accessed on 5 April 2015).
  42. Ramli, M. Optimal sizing of grid-connected photovoltaic energy system in Saudi Arabia. Renew. Energy 2015, 75, 489–495. [Google Scholar] [CrossRef]
  43. Zhao, B.; Zhang, X.; Li, P.; Wang, K.; Xue, M.; Wang, C. Optimal sizing, operating strategy and operational experience of a stand-alone microgrid on Dongfushan Island. Appl. Energy 2014, 113, 1656–1666. [Google Scholar] [CrossRef]

