Article

Multi-Objective Reservoir Optimization Balancing Energy Generation and Firm Power

1
College of Water Resources & Civil Engineering, China Agricultural University, Beijing 100083, China
2
Institute for Aero-Engine, School of Aerospace Engineering, Tsinghua University, Beijing 100084, China
*
Authors to whom correspondence should be addressed.
Energies 2015, 8(7), 6962-6976; https://0-doi-org.brum.beds.ac.uk/10.3390/en8076962
Submission received: 14 April 2015 / Revised: 12 June 2015 / Accepted: 23 June 2015 / Published: 10 July 2015

Abstract

:
To maximize annual power generation and to improve firm power are important but competing goals for hydropower stations. The firm power output is decisive for the installed capacity in design, and represents the reliability of the power generation when the power plant is put into operation. To improve the firm power, the whole generation process needs to be as stable as possible, while the maximization of power generation requires a rapid rise of the water level at the beginning of the storage period. Taking the minimal power output as the firm power, both the total amount and the reliability of the hydropower generation are considered simultaneously in this study. A multi-objective model to improve the comprehensive benefits of hydropower stations are established, which is optimized by Non-dominated Sorting Genetic Algorithm-II (NSGA-II). The Three Gorges Cascade Hydropower System (TGCHS) is taken as the study case, and the Pareto Fronts in different search spaces are obtained. The results not only prove the effectiveness of the proposed method, but also provide operational references for the TGCHS, indicating that there is room of improvement for both the annual power generation and the firm power.

1. Introduction

Hydropower energy is an important component of the power system with the advantages compared to thermal or nuclear power of being clean, renewable, low-cost, and flexible. The optimization of hydropower is of great significance to the stable, safe, and economic operation of the whole power system. China has abundant hydropower resources, with a theoretical amount of 6.9 × 10⁸ kW, and an exploitable amount of up to 4 × 10⁸ kW. However, the exploited hydropower resource in China only accounts for about 21% of the total amount, which is far below that in the developed countries with rates of over 80% [1]. China is going through a peak time of hydropower development. With the construction of more and more hydropower plants, operational problems are showing increasing importance.
Masse firstly put forward the notion of reservoir optimization in 1946 [2]. After almost 70 years of studies, single objective reservoir optimization is fairly developed. The methodologies can be categorized into two: one is mathematical programming, mainly including linear programming (LP) [3], non-linear programming (NLP) [4], dynamic programming (DP) [5], decomposition and coordination of large scale system network-flow methods (LSSDC) [6], and the progressive optimality algorithm (POA) [7]. Mathematical programming methods can obtain a determinate scheme by a series of conversions, but they place high demands on the mathematical structure of the model, and inevitably simplifications are needed to satisfy such requirements. The other kind of reservoir optimization is based on heuristic algorithms, such as the genetic algorithm (GA) [8], simulated algorithm (SA) [9], evolutionary algorithms (EA) [10], particle swarm optimization (PSO) [10], and ant colony algorithm (ACO) [11]. These stochastic algorithms do not put so many requirements on the model as mathematical programming, and thus are applied widely on complex systems.
The majority of current studies on reservoir optimization focus on finding the optimal scheduling for a certain single objective, such as flood control, power generation, navigation, and environmental protection. With respect to power generation, both the energy production and the system reliability have to be taken into account due to the diversification of property rights and stakeholders. To maximize the economic benefit of any single subject is improper. The difficulty of considering energy production and firm power simultaneously not only lies in their incommensurability, but also the complex inverse relationships between them. To find the quantitative relationship between these two contradictory indicators is a dynamic, non-convex, non-linear multi-objective optimization problem that has to meet various constraints such as operational regulation, security, energy demand, and electricity utilization.
Multi-objective problems are usually handled in two ways. A simple method is to convert the multiple objectives into a single by constraint, weighting, or membership. Chen et al. [12] present an interactive decision method to simplify their multi-objective reservoir problem to a single objective problem, which is optimized by DP. The constraint method was adopted by Du et al. [13] to convert the optimization with objectives of net benefit, power generation, and water consumption into a single target and solve it by using a progressive optimal algorithm (POA). Wu et al. [14] used a satisfaction approach to transform the power generation, discarded water, and the storage at the end of scheduling horizon into one objective. Although these studies have proven their effectiveness, it is difficult to describe or obtain precisely the weights of different targets. Another disadvantage of such methods is their low efficiency. The whole calculation procedure has to be restarted when the weights are changed.
With the proposal of the concept of non-dominated solutions, i.e., the Pareto set, multiple objectives can be optimized simultaneously with no simplification, and a set of optimum instead of a certain particular optimal solution is obtained to provide references for decision makers. Kim et al. [15] optimized a multi-objective problem of four reservoirs by Non-dominated Sorting Genetic Algorithm II (NSGA-II) [16], thus obtaining non-dominated solutions balancing reservoir release and water level. Reddy et al. [17] applied a Multi-Objective Genetic Algorithm (MOGA) to multi-reservoir optimization with multiple objectives to resolve the conflicts between irrigation and power generation. Li et al. [18] proposed a novel multi-objective shuffled frog leaping algorithm with application to reservoir flood control operation. A multi-objective cultured differential evolution method to generate optimal trade-offs in reservoir flood control operation was presented by Qin et al. [19]. The methods based on non-dominated solutions respect the inherent characteristics of the multi-objective problems, such as incommensurability and contradictoriness, and offer a series of alternative schemes, so that the decision makers can select the one that best meets the requirement according to the current situation.
The optimization of hydropower plants is able to produce remarkable economic benefits without any additional expense. Both theoretical research and practice have demonstrated that the optimization of hydropower scheduling can increase power generation by 1% to 7% [20]. At the same time, the hydropower reliability also has to be evaluated, as it is based on a natural inflow with some uncertainty. Firm power can be used as an indicator for the reliability of power generation. Theoretically, firm power is the mean power output in a certain critical period. The critical periods are distinct for different kinds of hydropower plants, for instance, run-of-river or daily regulated plants take a day as the critical period, and annually regulated plants take the dry season as the critical period. For most studies, the calculation of firm power is handled by the duration frequency curve of the outputs, of which the one with the design guarantee rate of the hydropower station is chosen as the firm power. As a result, the calculated firm power differs from the defined one. For example, suppose the outputs in a certain critical period are 70, 30 and 200 MW, respectively, and thus the mean output is 100 MW, which is defined as the firm power. Normal operation is inferred for this hydropower plant according to the definition. However, in reality, the normal operation is broken twice as the output has been below 100 MW twice. To avoid such a contradiction, a penalty function is frequently used to guide the power output process towards the firm output. Nevertheless, the use of penalty functions equalizes the generation process and affects the optimization of the whole power generation.
In this study, a multi-objective model not only maximizing the annual power generation, but also improving the reliability of the power output is presented. The firm power is selected to represent the reliability of the power output. The reservoir release in each time period is taken as the decision variable to determine an optimal operational scheme. Various operational constraints have to be met during the optimization, mainly including the constraints of water level, release, water balance and so on. With respect to the incommensurability of the two objectives, the optimization adopts NSGA-II to obtain the Pareto solutions, i.e., the Pareto front, instead of incorporating the objectives into one with different weights. The Three Gorges Cascade Hydropower System (TGCHS), the largest hydropower system in the world, is taken as the study case. Pareto fronts after different iterations within different search spaces are obtained. The results prove both the effectiveness and the efficiency of the proposed method. On average, the annual power generation can be increased by 4.66%, equivalent to 41.91 × 10⁸ kWh of the energy, while the firm power increase is around 1.37%, amounting to 9.00 × 10⁴ kW. The calculation of power generation or firm power presented in this paper can be used for multi-objective optimization models other than the one studied here.

2. Multi-Objective Model Maximizing the Benefit of Hydropower Generation

2.1. Objective Functions

2.1.1. Objective 1: Maximizing Power Generation of the System

To maximize power generation as one of the operational objectives a way of accomplishing that is to utilize the water head to increase the power generation while reducing the abandoned water. The objective function can be written as:
Z 1 = M a x E ( Q ) = M a x t = 1 T i = 1 n N i t ( Q ) × Δ t = M a x t = 1 T i = 1 n K i Q i t Δ H i t × Δ t
where E is the annual power generation; t and i are the index of the time and reservoirs, respectively; N is the output of the hydropower plant, which is a function of the reservoir release Q; Δ H is the water head; and Δ t is the time step.

2.1.2. Objective 2: Maximizing Firm Power

The calculation of the firm power differs from the design stage to operation period. In the design stage, firm power is calculated to determine the install capacity of the hydropower station. According to the definition, all the existing hydrological data should be used to calculate the mean power outputs in each dry season, and then they should be ranked according to their frequency to plot an output-frequency curve. The output corresponding to the design guarantee rate on this curve is determined to be firm power.
In the published literature there are several methods to work out firm power, such as the equal power output method, the equal discharge method, basic curve method, and graphical method. In this study, the Maxmin model is selected to optimize the firm power, as shown in Equation (2), which has been proved to be capable of obtaining the same minimal output as the equal output method with more direct and reliable results [21]:
Z 2 = M a x { M i n ( i = 1 n N i t ) }

2.2. Decision Variables

According to Equations (1) and (2), hydropower output depends on reservoir release, which thus is determined to be the decision variable, shown in Equation (3):
u = { Q i t }

2.3. Constraints

The main constraints of reservoir operation can be classified into:

2.3.1. Constraints on Water Level

L i , min t L i t L i , max t
where L is the water level; and L i , min t and L i , max t are the allowable lowest and highest level during time t, respectively.

2.3.2. Constraints on the Water Discharge of the Reservoir

The lower limit of the water discharge from a reservoir is to satisfy the downstream needs, such as navigation and ecology, while the upper limit of the discharge is set as the maximum allowable discharge of the reservoir, as shown in Equation (5):
Q i , min t Q i t Q i , max t
where Q i , min t and Q i , max t are the lower and the upper limits of the water discharge, respectively.

2.3.3. Water Balance Equation

V i t = V i t 1 + ( I i t Q i t ) × Δ t
where V is the storage; and I is the incoming inflow.

2.3.4. Water Level-Storage Curve

The relationship between water level and the reservoir storage is presented by piecewise linear interpolation function f(x):
V i = f ( L i ) L i = f ( V i )

2.3.5. Tail Water Level-Discharge Curve

The relationship between tail water level and the discharge is also presented by piecewise linear interpolation function g(x):
T i = g ( Q i )
where T is the tail water level.

2.3.6. The Characteristic Curve of Unit Output

The power output N is a function of the reservoir release Q and water head Δ H :
N i t = K i Q i t Δ H i t
where K is the comprehensive coefficient of power output.

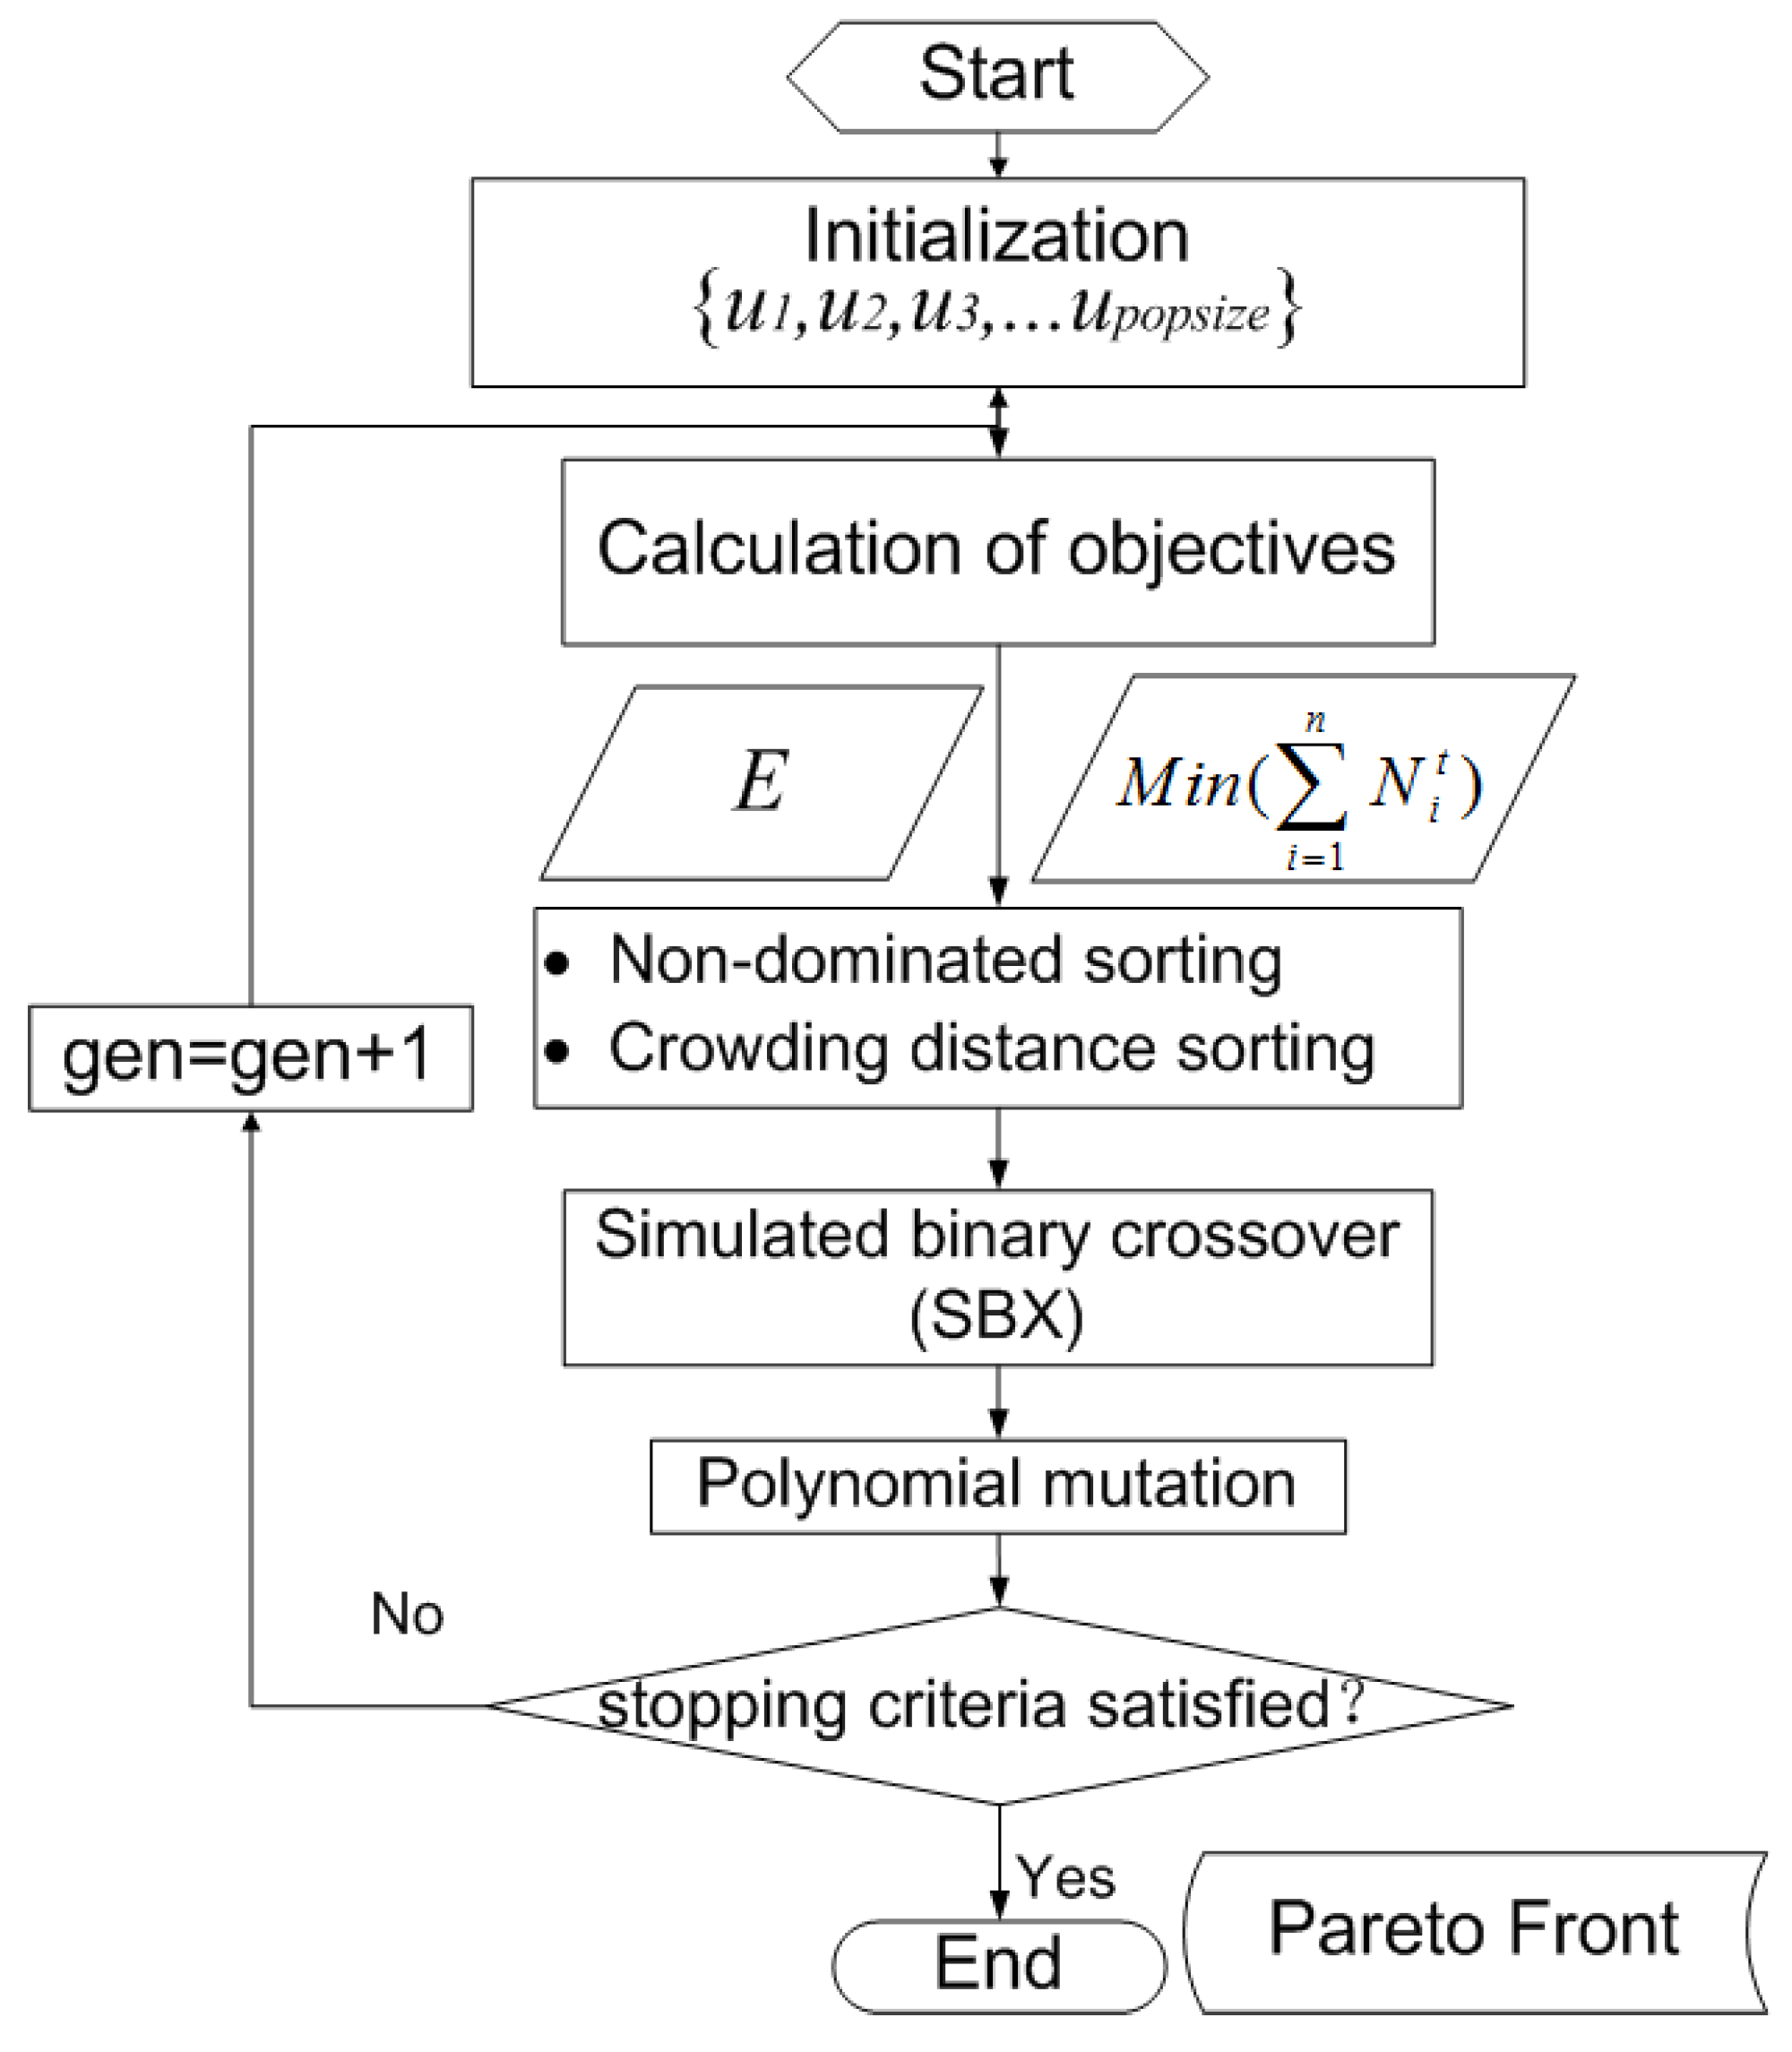
3. Optimization with NSGA-II

3.1. Multi-Objective Problem

A general multi-objective optimization problem (MOP) can be described as a vector function F that maps a tuple of k parameters (decision variables) to a tuple of m objectives. Formally:
M i n / M a x    y = F ( x ) = ( F 1 ( x ) , F 2 ( x ) , ... , F n ( x ) )
subject to:
x = ( x 1 , x 2 , ... , x m ) X y = ( y 1 , y 2 , ... , y m ) Y
where x is the decision vector, X is the parameter space, y is the objective vector, and Y is the objective space.
In MOP, the desired goals are often conflicting with each other and it is not possible to satisfy all the goals at the same time. Hence, it gives a set of non-inferior solutions also known as Pareto optimal solutions [22]. Mathematically, the concept of Pareto optimality is as follows:
Without a loss of generality, a minimization problem considering two decision vectors a , b X . a is said to dominate b ( a b ) if:
i { 1 , 2 , ... , m } : f i ( a ) f i ( b )    j { 1 , 2 , ... , m } : f j ( a ) < f j ( b )
All decision vectors which are not dominated by any other decision vector of a given set are called non-dominated regarding this set. In other words, a solution a of the MOP is said to be Pareto optimal if and only if no other solution in the solution space gives a better value for one objective without also causing degraded performance in at least one other objective.

3.2. NSGA-II

The NSGA-II proposed by Deb et al. [16] is effective and popular for MOP, using population-based evolutionary algorithms. A great number of NSGA-II applications can be found in multi-objective water-resources problems, such as those described in [23,24,25,26,27,28].
Genetic algorithms are based on the mechanics of natural selection and natural genetics, the main procedure of which includes selection, crossover and mutation. They exploit not a single solution but a set of possible solutions, namely a population, to search for the global optimum. Such a characteristic shows the superiority when dealing with MOP, as it can easily determine which solution is superior to the others, even though only one run of the optimization model is performed [24]. An approach based on GA, called non-dominated sorting genetic algorithm (NSGA) was proposed by Srinivas and Deb [29]. Like GA, it starts with a randomly generated population of candidate solutions, and the fitness assignment is carried out in several steps. In each, the non-dominated solutions constituting a non-dominated front are assigned the same dummy fitness value. These solutions are shared with their dummy fitness values and ignored in the further classification process. Finally, the dummy fitness is set to a value less than the smallest shared fitness value in the current non-dominated front. Then the next front is extracted. This procedure is repeated until all individuals in the population are classified [30].
The NSGA-II proposed by Deb et al. [16] improves the original NSGA by incorporating two important sorting procedures: non-dominated sorting and crowding distance sorting [31]. The former helps speed up the sorting process and reduce the time complexity. The crowding distance calculated by Equation (13) represents the density of individuals in the same class and it keeps the population diverse and consistently spread-out on a Pareto-optimal front:
D ( k ) = j = 1 m | f j k + 1 f j k 1 | f j max f j min
where D(k) is the crowding distance of the k-th individual, f j k is the j-th objective function value of k + 1 individual; f j max and f j min are the maximum or the minimum values for the j-th objective function and m is the number of objectives.

3.3. Implementation

The NSGA-II starts with randomly generated individuals in the feasible region. The genes on each individual are expressed as shown in Equation (3). The reservoir inflow in each time period has been chosen as the model input. With the reservoir release and inflow, the storage in each time period can be worked out according to Equation (6), and the water level and the tail water level can be derived from Equations (7) and (8). The power outputs are then calculated by Equation (9), and the objective functions in Equations (1) and (2) of each individual are finally evaluated.
Selected by non-dominated sorting and crowding distance sorting in succession, those solutions with higher quality are preserved to take part in crossover and mutation. The objectives of those new individuals are calculated again, and the iterations continue until a certain stop criterion is satisfied. A scheme of the proposed optimization model is given in Figure 1.
Figure 1. Flow chart of the proposed method.
Energies 08 06962 g001

4. Results and Discussions

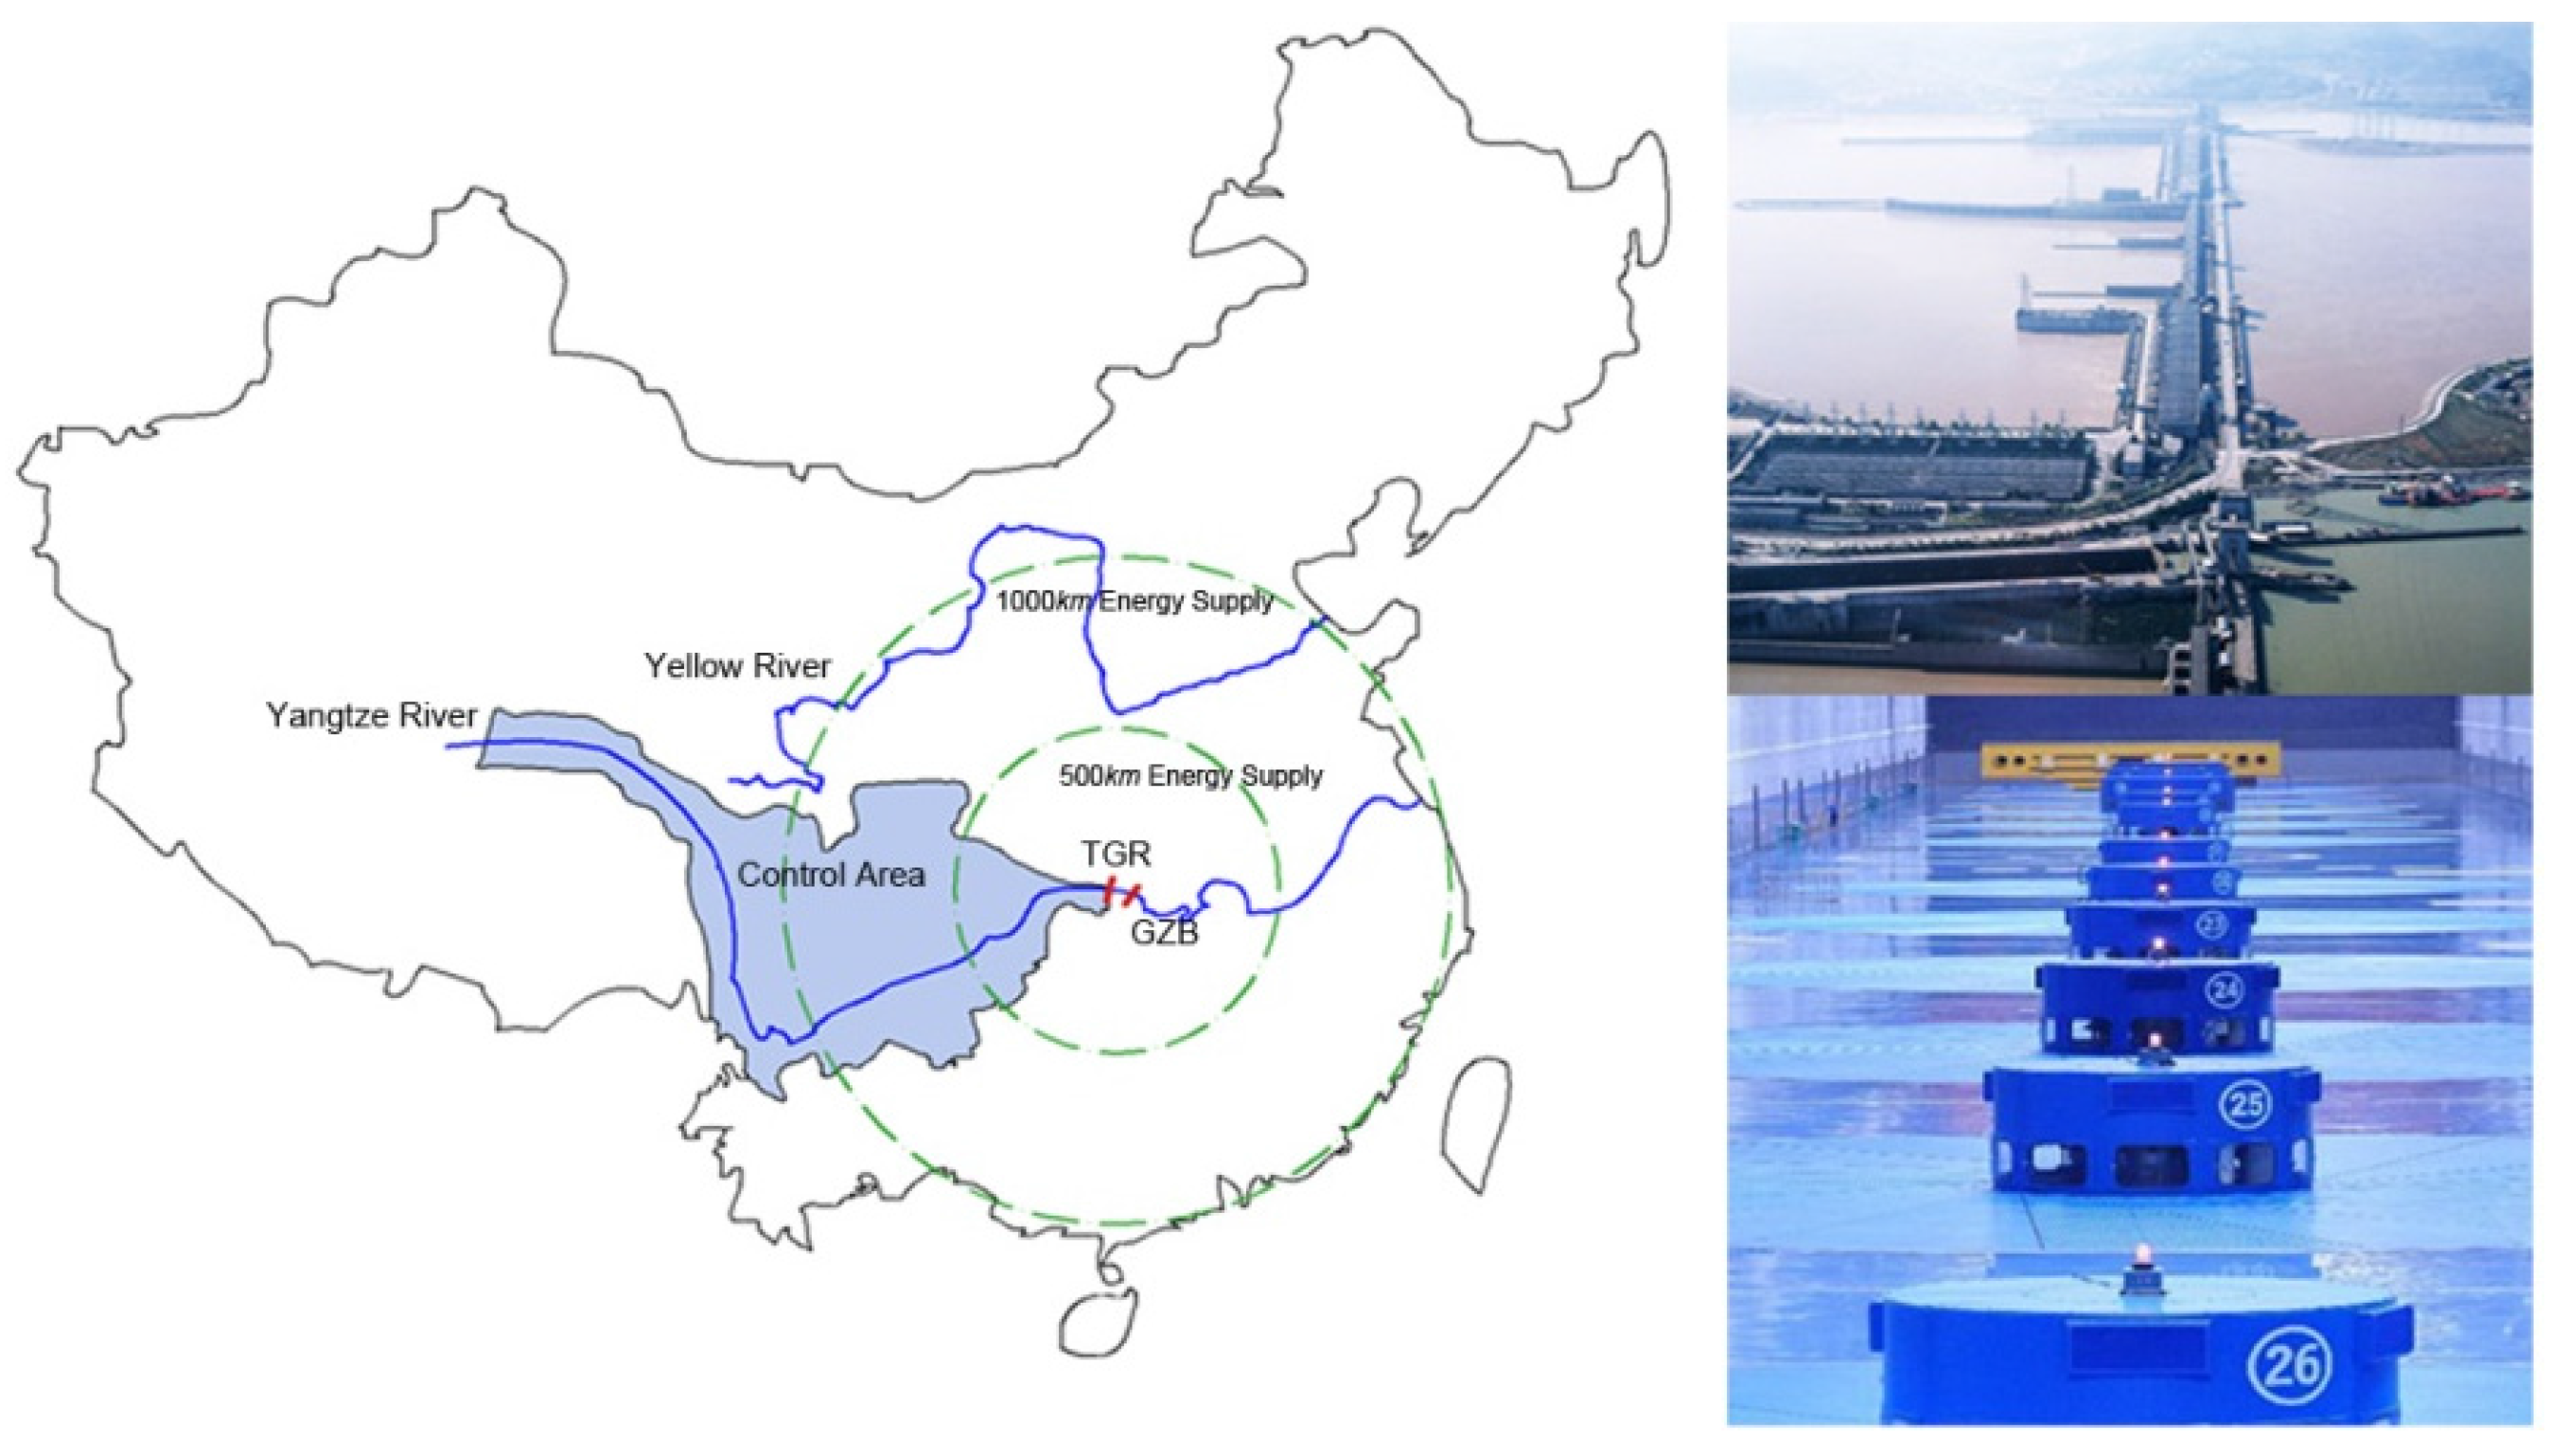
4.1. Case Study-Three Gorges Project
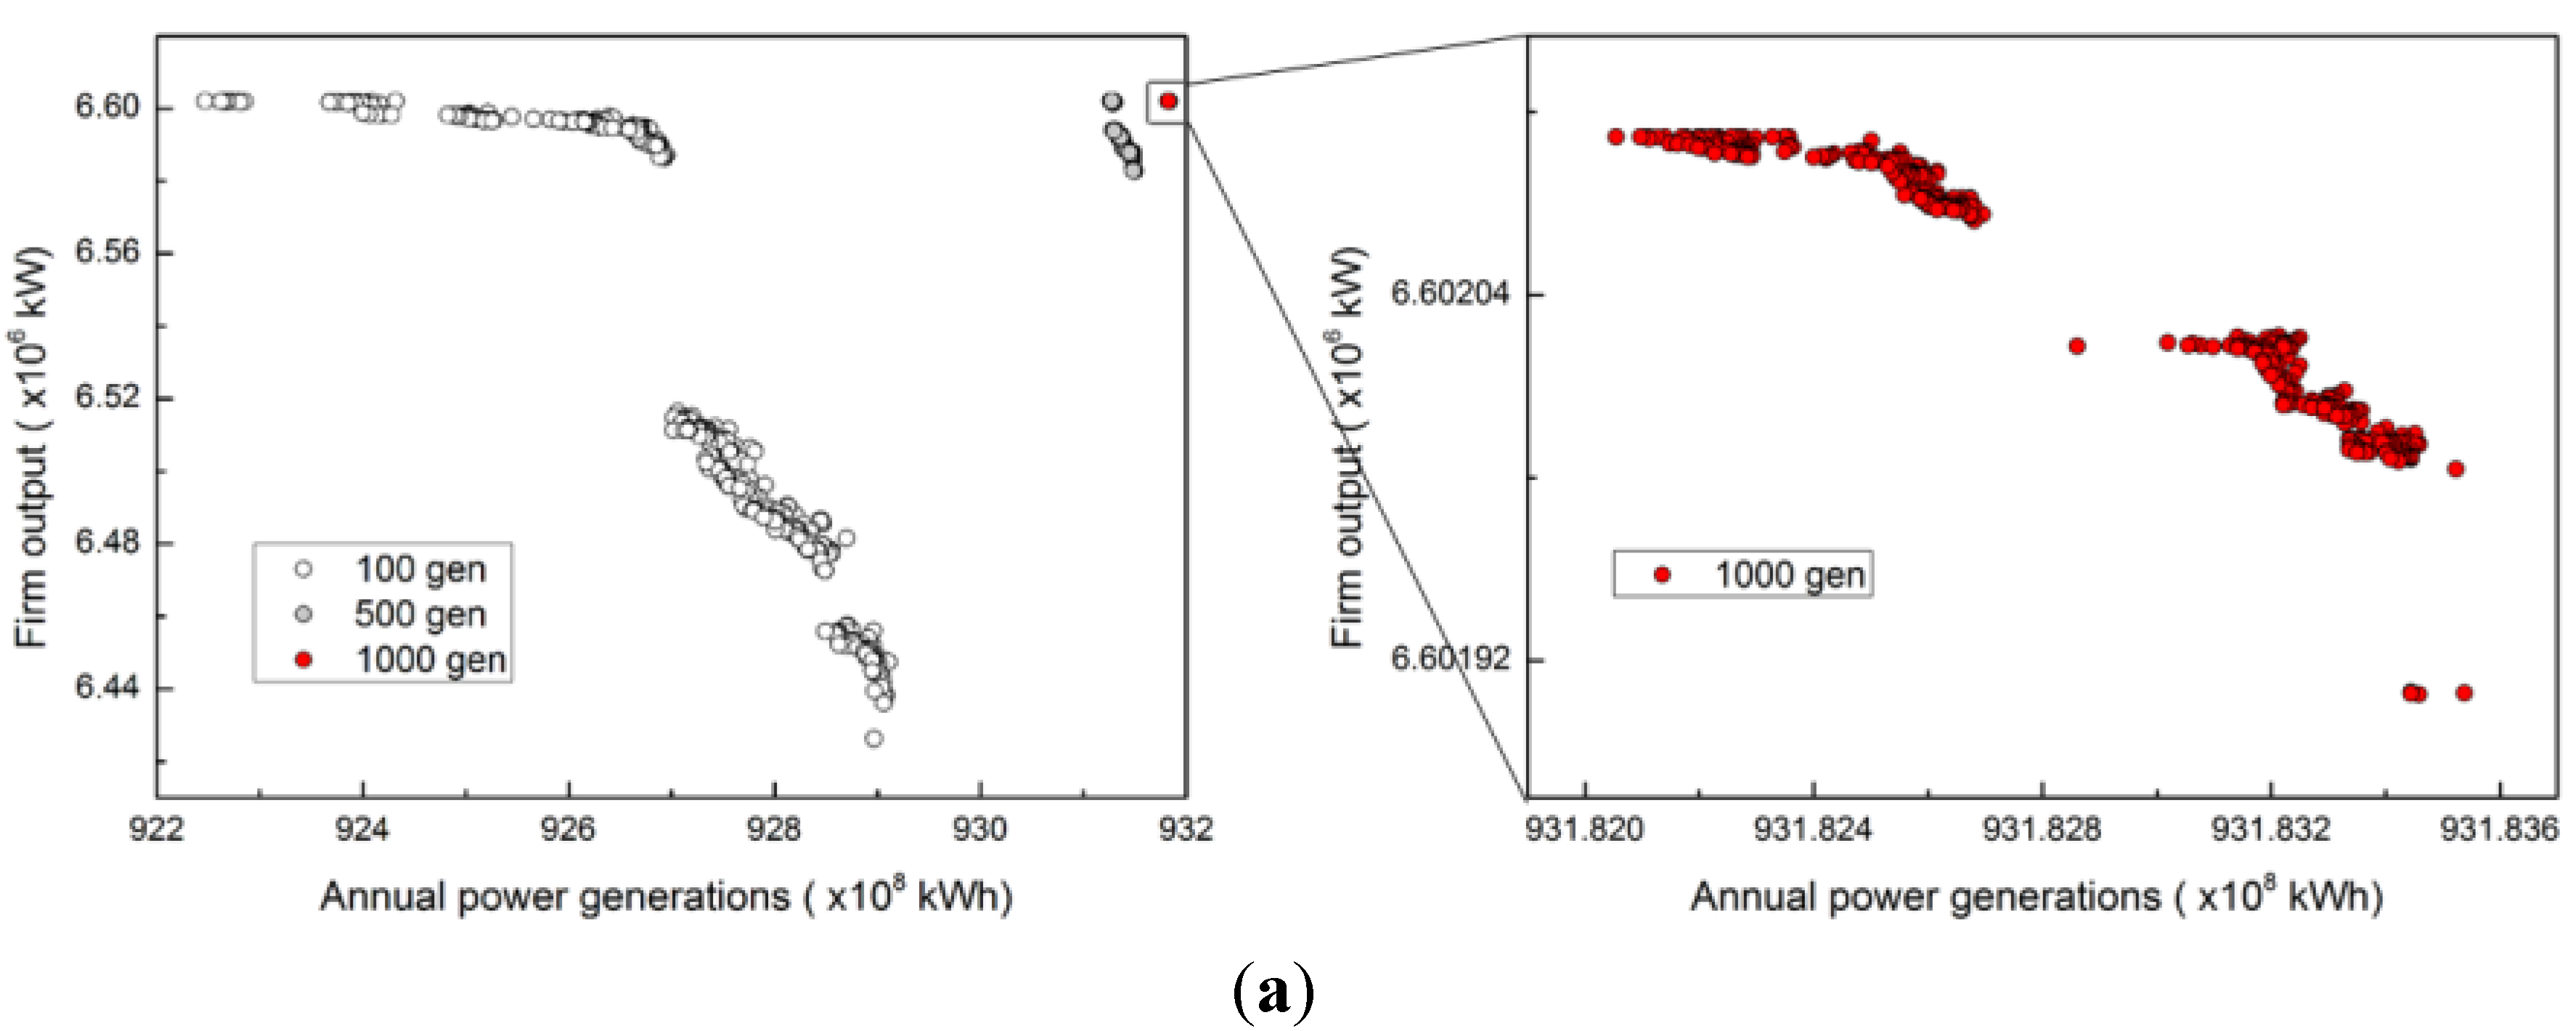
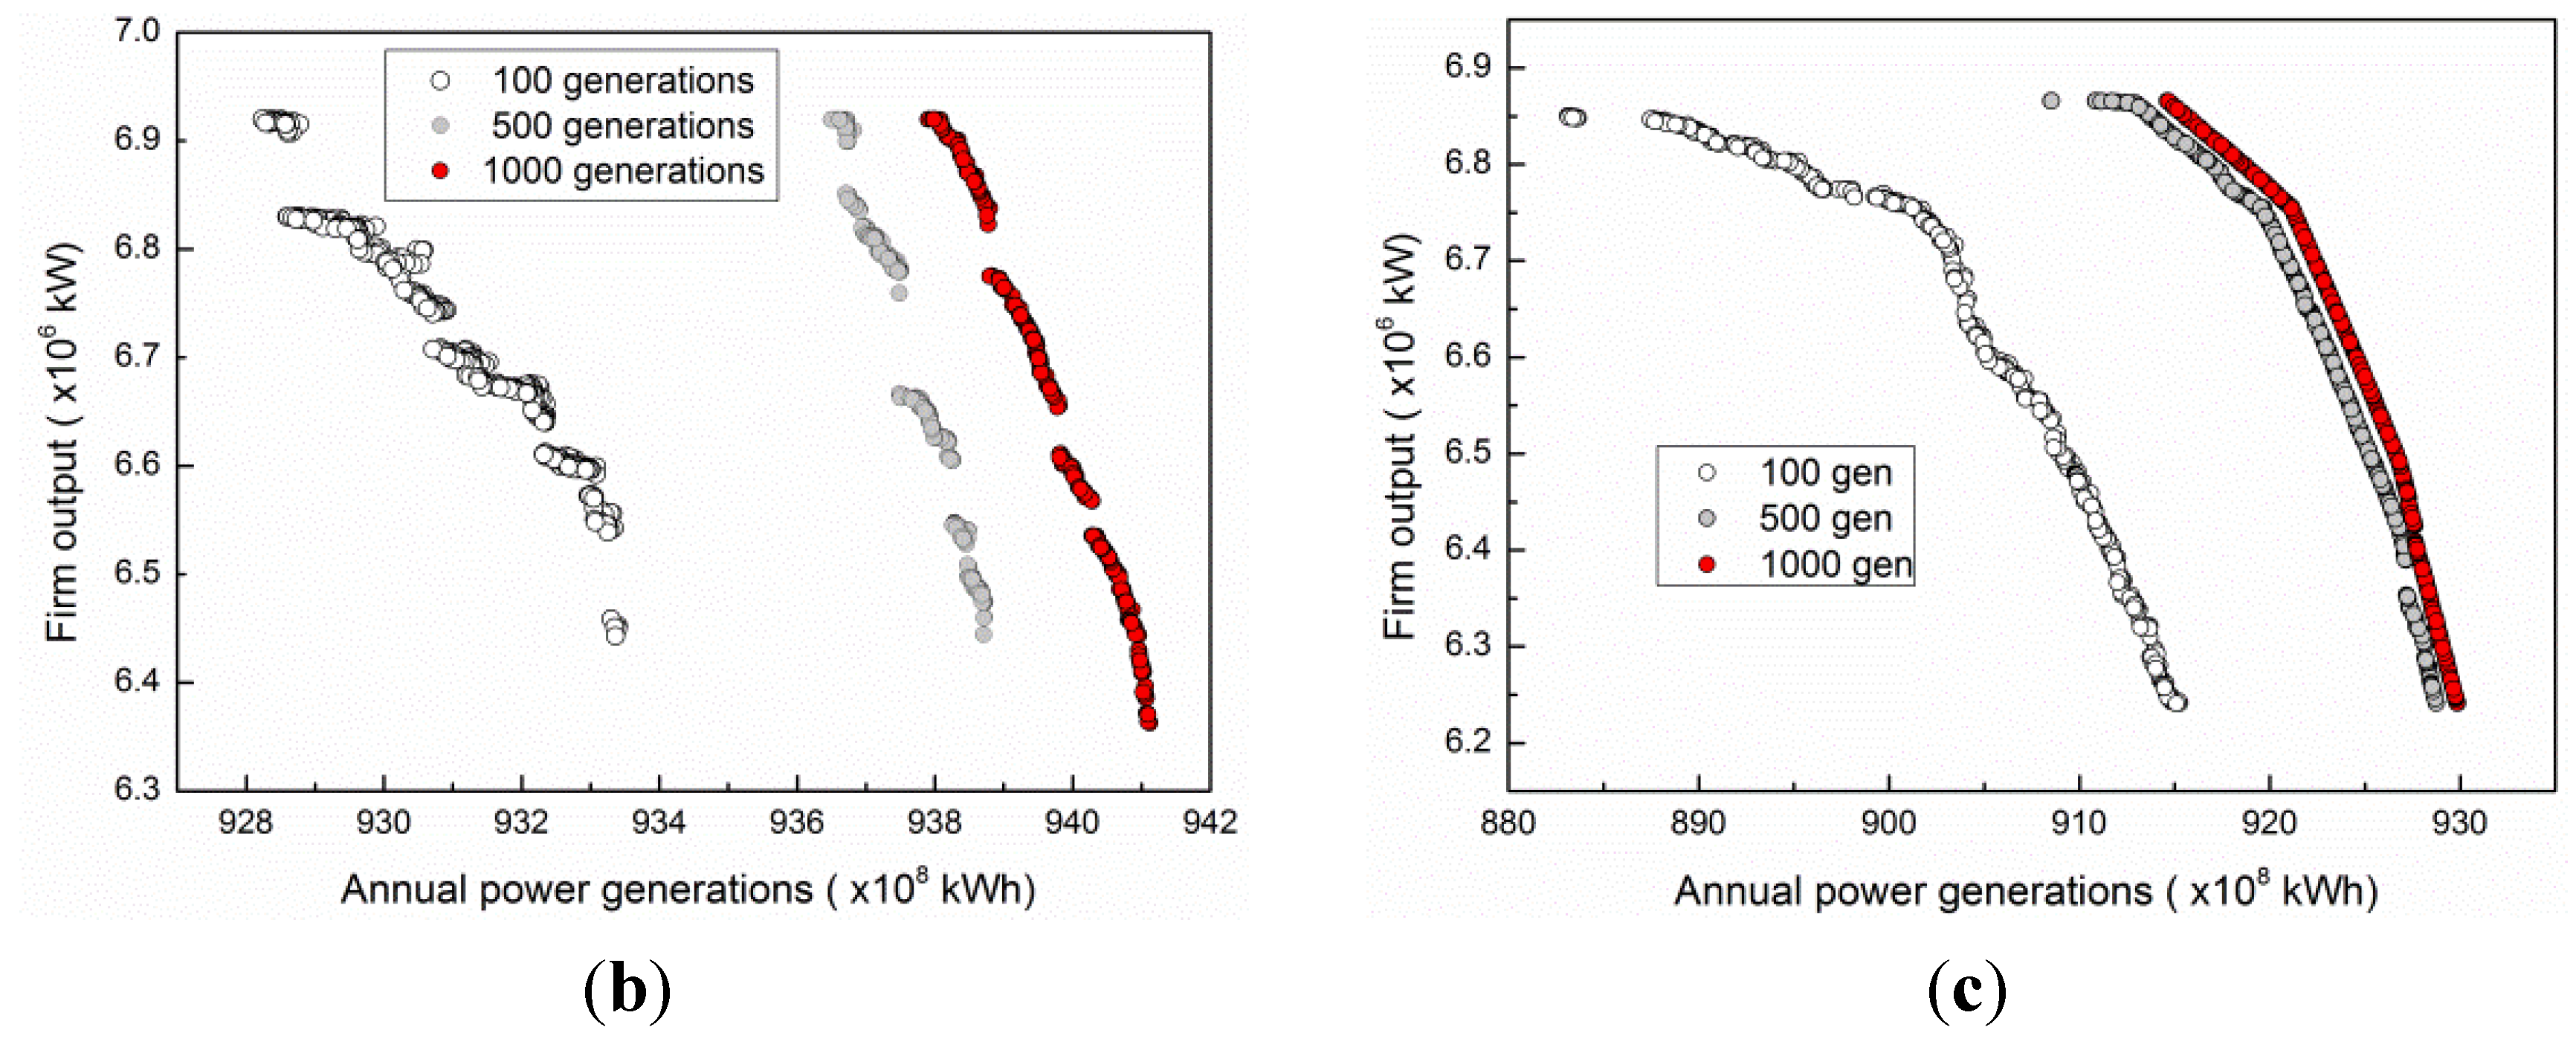
The Yangtze River, with a length of 6363 km, is the longest river in China. It originates on the Tibet Plateau and goes through 11 Chinese provinces. The total drainage area of the Yangtze River takes up about 20% of the national territorial area occupied by 1/3 of the national population. The gross output value of industry and agriculture in this area accounts for almost half the national total.
The watershed system of the Yangtze River is enormous and the river flow is also abundant with a slope fall of over 5000 m, with huge hydro energy potential. The theoretical hydroelectric potential is 2.68 × 10⁸ kW, or 40% of the national total, of which 1.97 × 10⁸ kW is exploitable, accounting for 53.4% of the national total.
The Three Gorges Project (TGP) which is located on the Yangtze River in the middle of the China, as shown in Figure 2, is currently the largest hydropower station in the world for both the installed capacity and the annual power generation. There are 26 units of 700 MW installed in the TGP, which could generate about 850 × 108 kwh energy per year, which is the equivalent of a coal mine with annual output of 5000 × 104 t raw coal or an oil field with output of 2500 × 107 kg or ten thermal power plants with 200 × 104 kW installed capacity per plant.
Figure 2. The control area and the energy supply area of the TGP.
Energies 08 06962 g002
The operation of the TGP reduces 1000 × 107 kg CO2, 100–200 × 107 kg SO2, 30–40 × 107 kg NOx, 1 × 10⁷ kg CO and tons of dust. The Gezhouba (GZB) project, the auxiliary-regulating reservoir of the TGP, lies 38 km downstream of the TGP. As the largest runoff hydropower station in the world, the GZB has a total installed capacity of 2715 MW. The cascade hydropower system composed of the TGP and the GZB, the Three Gorges Cascade Hydropower System (TGCHS), supplies electricity for almost half of China. The economic power transmission region within 400–1000 km includes central China, eastern China, and the Guangdong area, so that these regions can be connected as a big electric power system to benefit from off-peak power consumption, and hydro-thermal power alterations. Only for the networking of central and eastern power system, the off-peak power consumption of 300–400 × 104 kW can be obtained. Because of its importance, not only its total energy generation should be optimized, but also the reliability of the power generation of the TGCHS needs to be assured.

4.2. Results

The TGP began its pilot run in 2003, and the reservoir reached the normal water level of 175 m in 2007. 2011 was the driest year after the TGP was put into operation, when the balance between power generation and the reliability of the power output was particularly important, thus we selected 2011 as the study case. The TGP inflows in 2011 were taken as the model input. The comprehensive coefficients of power output for TGP and GZB were set to be 8.5 and 8.35, respectively, as suggested by Cai [32]. Operational parameters were provided by the Three Gorges Corporation. In the optimization, the initial population was set to 500; Simulated Binary (SBX) Crossover [33] with the probability of 0.90 and polynomial mutation [34] with the probability of 0.10 were carried out.
No feasible solution can be found if each variable is generated randomly in the whole search space. The reason for this is the premature convergence of GA resulting from the high dimensionality of the decision variables and large feasible domain of each variable. A good quality search space should not be too large but cover the global optimum, if possible [35]. In this study, the search space was constrained within a certain range of the historical data. Taking the historical average monthly flow as the benchmark, the half range width of 5%, 10% and 11% were tested to determine the best search space for this case, as shown in Figure 3.
When the search space is set as [−5%, +5%] fluctuation of the historical data, i.e., each decision variable was generated randomly in [95%, 105%] of the corresponding monthly release of 2011, the Pareto fronts after 100, 500, and 1000 iterations are shown in Figure 3a, represented by hollow, grey and red bubbles, respectively. It can be seen that the optimal solutions converge sharply as the iterations go on. The contradiction between increasing power generation and improving firm power can be also illustrated by the figures.
Figure 3. Pareto Front within the search space of different range around the historical release. (a) 5% fluctuation; (b) 10% fluctuation; (c) 11% fluctuation.
Energies 08 06962 g003aEnergies 08 06962 g003b
Although the convergence rate in Figure 3a is desirable, the optimization seems trapped in a local optimum, and the improvement room is limited compared to Figure 3b, which enlarges the search space to [−10%, +10%] fluctuation of the historical data. The optimization process in Figure 3b appears steady and improving with the iteration. However, if the search space continues expansion, the optimization drops as seen in Figure 3c. Such performance reaffirms that if the search space is too small, the global optimum may be lost; while if it is too large, the difficulty of premature convergence may still arise. A further evidence is that with a range larger than [−11%, +11%] fluctuation, no feasible solution can be found.
To inspect the quantitative relationships between annual power generation and firm power, the statistical results of the Pareto Front, including the mean, the maximum, the minimum, the variance, and the SD value of the two objectives in the Pareto Front after 1000 generations within [−10%, +10%] fluctuation are presented in Table 1. It needs to be illustrated that, to avoid the errors caused by the modeling, the original power generation is the one calculated by Equation (9) instead of the historical data. The annual power generation can be maximized by 4.83%, amounting to 43.37 × 10⁸ kWh of the energy, while it costs 0.21 × 10⁶ kW of the firm power, which accounts for 3.20%. If the firm power is increased by 5.33%, the annual power generation can only be optimized by 4.47%, equivalent to 40.15 × 10⁸ kWh of power generation. Generally, annual power generation on the Pareto Front has an improvement room of about 4.66% on average, and that of the firm power is around 1.37%. The results not only illustrate the room for power generation and firm power improvement, but also indicate that the two competing objectives can be increased simultaneously in some cases.
The optimal operation scheme with best objective function values of power generation and firm power after 1000 generations is presented in Figure 4, which provides a reference for the operation of TGP in the future. To increase power generation, a high water level needs to be maintained as long as possible, thus less water should be released before the flood season. In flood season, the water level has to be lowered to around 145 m for the TGP, and the release becomes the dominant factors of the power generation instead of water head. More water should be released in flood season to improve the energy production. Compared with historical release process, to maximize the firm power requires a more flat release process, which means the electricity should be as equalized as possible.
Table 1. Statistic results of the Pareto solutions.
ObjectivesPareto FrontOriginal
MinimumMaximumMeanSDVariance
Annual power generation (× 108 kWh)937.90 (+4.47%)941.12 (+4.83%)939.66 (+4.66%)0.980.953897.75
Firm power (× 106 kW)6.36 (−3.20%)6.92 (+5.33%)6.66 (+1.37%)0.170.0296.57
Figure 4. Optimal release with maximal values of objective functions.
Energies 08 06962 g004
The differences in the power generation processes between the maximum and the actual value are shown in Figure 5. Figure 5a shows the monthly power generation differences with optimal release for maximal annual energy generation, which is the scenario represented by black circles in Figure 4; and Figure 5b shows the monthly firm power differences with the scenario of grey squares in Figure 4. For the optimization of both the energy production and the firm power, the power output should be more focused in the flood season from June to September, and also, more water should be distributed to the TGP instead of the GZB. However, to maximize the gross power generation, more water needs to be reserved to the flood season, and in the non-flood season before that, the power output should be reduced. On the contrary, the maximization of firm power prefers a stable process, even though the gross power generation decreases. Such analysis provides quantitative references for the actual operation.
Figure 5. The difference in the power generation processes between the maximum and the actual value. (a) With the maximal annual power generation; (b) With the maximal firm power.
Energies 08 06962 g005

5. Conclusions

To increase the annual power generation and the firm power represents a pair of important but conflicting objectives for the operation of hydropower stations, with distinct economic benefits. As the largest cascade hydropower stations in the world, the Three Gorges Cascade Hydropower System (TGCHS) supplies electricity for large areas of China. The reliability of its power production, which is represented by firm power in this study, is thus of great significance. The annual power generation of the TGCHS is over 100 billion kWh, and just a 5% improvement means 5 billion kWh of electric power, which is worth as much as 0.2 billion US dollars (the on-grid price of the TGCHS is about $0.04 US dollars). A multi-objective model considers both the gross amount of power production and its reliability is proposed, which is optimized by the Non-dominated Sorting Genetic Algorithm-II (NSGA-II). The application on the TGCHS of the proposed method indicates:
(1) An efficient search space has a great influence on the random optimization algorithm, such as the NSGA-II. The search space should be neither so large that it brings about a large number of infeasible solutions, nor so small that it loses information. Taking a relatively good solution as a benchmark to establish such an efficient sub search space is effective.
(2) Quantitative relationships between annual power generation and firm power, the statistical results on the Pareto Front prove their contradictoriness. The annual power generation can be maximized by 4.66% on average, amounting to 41.91 × 10⁸ kWh of the energy, while and that of the firm power is around 1.37%.
(3) The improvement of the annual power generation and firm power requires different water distribution schemes. High water levels need to be maintained as long as possible to increase the power generation, while the whole power production process needs to be as stable as possible for the firm power increment.
The results not only prove the effectiveness of the proposed study, but also provide quantitative relationships between power generation and firm power, as well as operational references. Extensions of the proposed method to the integration with other objectives such as environmental protection can be expected.

Acknowledgments

This research was supported by Chinese Universities Scientific Fund (Grant No.2015QC012), National Natural Science Foundation of China (Grant No. 51409248 & 11402136), and the Open Research Fund of State Key Laboratory of Simulation and Regulation of Water Cycle in River Basin (China Institute of Water Resources and Hydropower Research) (Grant No. WHR-SKL-201409).

Author Contributions

Fang-Fang Li makes substantial contributions to conception and design of the work; Jun Qiu does the numerical experiments and calculation, as well as the results analysis; and they draft and revise the article together.

Conflicts of Interest

The authors declare no conflict of interest.

References

  1. Fan, X.L. Long-term Multi-objective Optimal Scheduling Method of Cascade Hydroelectric Stations. Master’s Thesis, Dailian University of Technology, Dailian, China, 2010. [Google Scholar]
  2. Masse, P. Les Reserves et la Regulation de l’Avenir Dans la vie Economique; Hermann & Co: Aachen, Germany, 1946. [Google Scholar]
  3. Needham, J.T.; Watkins, D.W., Jr.; Lund, J.R.; Nanda, S.K. Linear programming for flood control in the Iowa and Des Moines rivers. J. Water Resour. Plan. Manag. ASCE 2000, 126, 118–127. [Google Scholar] [CrossRef]
  4. Grygier, J.C.; Stedinger, J.R. Algorithms for optimizing hydropower system operation. Water Resour. Res. 1985, 21, 1–10. [Google Scholar] [CrossRef]
  5. Nandalal, K.D.W.; Bogardi, J.J. Dynamic Programming Based Operation of Reservoir; Cambridge University Press: New York, NY, USA, 2007. [Google Scholar]
  6. Jia, B.Y.; Zhong, P.A.; Wan, X.Y.; Xu, B.; Chen, J. Decomposition-coordination model of reservoir group and flood storage basin for real-time flood control operation. Hydrol. Res. 2015, 46, 11–25. [Google Scholar] [CrossRef]
  7. Turgeon, A. Optimal short-term hydro scheduling from the principle of progressive optimality. Water Resour. Res. 1981, 17, 481–486. [Google Scholar] [CrossRef]
  8. Li, F.F.; Shoemaker, C.A.; Wei, J.H.; Fu, X.D. Estimating maximal annual energy given heterogeneous hydropower generating units with application to the Three Gorges system. J. Water Resour. Plan Manag. ASCE 2013, 139, 265–276. [Google Scholar] [CrossRef]
  9. Teegavarapu, R.S.V.; Simonovic, S.P. Optimal operation of reservoir systems using simulated annealing. Water Resour. Manag. 2002, 16, 401–428. [Google Scholar] [CrossRef]
  10. Arunkumar, R.; Jothiprakash, V. Chaotic evolutionary algorithms for multi-reservoir optimization. Water Resour. Manag. 2013, 27, 5207–5222. [Google Scholar] [CrossRef]
  11. Kumar, D.N.; Reddy, M.J. Ant Colony Optimization for multi-purpose reservoir operation. Water Resour. Manag. 2006, 20, 879–898. [Google Scholar] [CrossRef]
  12. Chen, Y.B.; Wang, X.J.; Fen, S.Y. A multiobjective optimization method considering power output and firm power for reservoir dispatching. Syst. Eng. 1998, 4, 95–101. [Google Scholar]
  13. Du, S.J.; Chen, C.; Li, H.; Bai, Y. Application of multi-objective operation model to Nishan reservoir. J. Hydroelectr. Eng. 2006, 25, 69–73. [Google Scholar]
  14. Wu, J.K.; Zhu, Y.N.; Wei, S.G. Multi-objective optimal scheduling for cascaded hydroelectric power plant based on improved membership functions. Power Syst. Technol. 2011, 35, 48–52. [Google Scholar]
  15. Kim, T.S.; Heo, J.-H. Application of multi-objective genetic algorithms to multireservoir system optimization in the han river basin. Hydrol. Process. 2006, 10, 371–380. [Google Scholar] [CrossRef]
  16. Deb, K.; Pratap, A.; Agarwal, S.; Meyarivan, T. A fast and elitist multiobjective genetic algorithm: NSGA-II. IEEE Trans. Evol. Comput. 2002, 6, 182–197. [Google Scholar] [CrossRef]
  17. Reddy, M.J.; Kumar, D.N. Optimal reservoir operation using multi-objective evolutionary algorithm. Water Resour. Manag. 2006, 20, 861–878. [Google Scholar] [CrossRef]
  18. Li, Y.H.; Zhou, J.Z.; Zhang, Y.C.; Qin, H.; Liu, L. Novel multiobjective shuffled frog leaping algorithm with application to reservoir flood control operation. J. Water Resour. Plan. Manag. ASCE 2010, 136, 217–226. [Google Scholar] [CrossRef]
  19. Qin, H.; Zhou, J.Z.; Lu, Y.L.; Li, Y.H.; Zhang, Y.C. Multi-objective cultured differential evolution for generating optimal trade-offs in reservoir flood control operation. Water Resour. Manag. 2010, 24, 2611–2632. [Google Scholar] [CrossRef]
  20. Qu, Y.L. The Research and Realization of Multi-objective Optimal the Tree Gorge Reservoir Dispatching. Master’s Thesis, Huazhong University of Science & Technology, Wuhan, China, 2007. [Google Scholar]
  21. He, L.; Li, B.Y.; Li, H. Maxmin model for determining the guaranteed output of a hydropower plant based on dynamic programming. Power Syst. Clean Energy 2011, 27, 78–85. [Google Scholar]
  22. Deb, K. Multi-Objective Optimization Using Evolutionary Algorithms; John Wiley and Sons: Chichester, UK, 2011. [Google Scholar]
  23. Schardong, A.; Simonovic, S.P.; Vasan, A. Multiobjective evolutionary approach to optimal reservoir operation. J. Comput. Civil Eng. 2013, 27, 139–147. [Google Scholar] [CrossRef]
  24. Kim, T.; Heo, J.H.; Bae, D.H.; Kim, J.H. Single-reservoir operating rules for a year using multiobjective genetic algorithm. J. Hydroinform. 2008, 10, 163–179. [Google Scholar] [CrossRef]
  25. Chen, L.; McPhee, J.; Yeh, W.W.G. A diversified multiobjective GA for optimizing reservoir rule curves. Adv. Water Resour. 2007, 30, 1082–1093. [Google Scholar] [CrossRef]
  26. Malekmohammadi, B.; Zahraie, B.; Kerachian, R. Ranking solutions of multi-objective reservoir operation optimization models using multi-criteria decision analysis. Expert Syst. Appl. 2011, 38, 7851–7863. [Google Scholar] [CrossRef]
  27. Ahmadi, M.; Haddad, O.B.; Marino, M.A. Extraction of flexible multi-objective real-time reservoir operation rules. Water Resour. Manag. 2014, 28, 131–147. [Google Scholar] [CrossRef]
  28. Cioffi, F.; Gallerano, F. Multi-objective analysis of dam release flows in rivers downstream from hydropower reservoirs. Appl. Math. Model. 2012, 36, 2868–2887. [Google Scholar] [CrossRef]
  29. Srinivas, N.; Deb, K. Multiobjective Optimization Using Nondominated Sorting in Genetic Algorithms. Evol. Comput. 1994, 2, 221–248. [Google Scholar] [CrossRef]
  30. Zitzler, E.; Thiele, L. Multiobjective evolutionary algorithms: A comparative case study and the Strength Pareto approach. IEEE Trans. Evol. Comput. 1999, 3, 257–271. [Google Scholar] [CrossRef]
  31. Hajiabadi, R.; Zarghami, M. Multi-objective reservoir operation with sediment flushing; case study of the Sefidrud reservoir. Water Resour. Manag. 2014, 28, 5357–5376. [Google Scholar] [CrossRef]
  32. Cai, Z.G. Research and Development of the Power Generation Benefit Evaluation of the Three Gorges-Gezhouba Cascade Power Stations; China Three Gorges Corporation: Beijing, China, 2007. [Google Scholar]
  33. Deb, K.; Agrawal, R.B. Simulated binary crossover for continuous search space. Complex Syst. 1995, 9, 115–148. [Google Scholar]
  34. Deb, K.; Goyal, M. A combined genetic adaptive search (Gene AS) for engineering design. Comput. Sci. Inform. 1996, 26, 30–45. [Google Scholar]
  35. Li, F.F.; Wei, J.H.; Fu, X.D.; Wan, X.Y. An effective approach to long-term optimal operation of large-scale reservoir systems: Case study of the Three Gorges system. Water Resour. Manag. 2012, 26, 4073–4090. [Google Scholar] [CrossRef]

