Article

The Evaluation of Energy Conservation Performance on Electricity: A Case Study of the TFT-LCD Optronics Industry

Department of Occupational Safety and Health, China Medical University, 91 Hsueh-Shih Rd., Taichung 40402, Taiwan
*
Author to whom correspondence should be addressed.
Submission received: 9 December 2015 / Revised: 16 February 2016 / Accepted: 4 March 2016 / Published: 17 March 2016

Abstract

:
This study describes the performance evaluation of an energy management system, based on electricity consumption, for a Gen 6 Thin Film Transistor Liquid Crystal Display (TFT-LCD) panel plant. Of the various production lines and facility systems, the array system and the compressed dry air consumed the most electricity of 21.8% and 19.8%, respectively, while the public utility used only 1.6% of the total electricity. The baseline electricity consumptions were correlated well (R2 ≥ 0.77) to the monthly average wet-bulb temperatures of ambient air and the panel yield rates, which were determined by the product yield over the equipment available time index. After implementing the energy saving projects, the energy conservation performance was determined using a three-parameter change-point regression model incorporated with the panel yield rates. The post-retrofit monthly savings of the total electricity consumption for the panel manufacture were 5.35%–10.36%, with the efficiency of the electricity performance revealing an upswing trend following the implementation of the energy management system.

1. Introduction

Thin Film Transistor Liquid Crystal Display (TFT-LCD) panel manufacturers are numbered among the most energy-intensive and high capital investment industrial groups [1]. Electricity expenses have accounted for a significant percentage of the investment costs for these enterprises in recent years. The panel manufacturing industry also faces intense competition from companies both locally and internationally due to the saturation of the market. The average selling price of the LCD panel fluctuates, which adversely affects profit margins. Electricity is the major energy consumed by TFT-LCD industries, therefore, the electricity conservation policy of a company is key to the enhancement of its competitiveness [2,3].
In terms of production values and shipments, Taiwan is one of the world’s major TFT-LCD suppliers, holding approximately 30% of the global market share of TFT-LCD and module packaging in 2014 [4]. However, more than 97% of Taiwan’s energy resources are importation dependent and most consumption is from industrial activities [5,6]. The safety of nuclear power plants continues to be a controversial subject, especially after the Fukushima Nuclear disaster in 2011, as the area in and around Taiwan is seismically active. As the fairness of the electricity subsidies’ policy of the Taiwanese government is questioned by different industrial sectors, energy users whose electricity consumption reaches a stipulated level are required to establish an energy audit system, as well as setting energy conservation goals and implementing energy-saving plans, as proclaimed in the Regulations for Implementing the Energy Management Law of Taiwan [7,8].
Literature has investigated the energy conservation performance in the semiconductor and TFT-LCD factories [1,9,10]. However, their studies addressed the facility systems of clean room applications, such as the make-up air unit (MAU), the cooling plant system, and the chiller system. This paper presents the establishment of the energy management system at a Generation 6 TFT-LCD plant of an optronics corporation, which has a full lineup of operating production lines of various generations, capable of offering TFT-LCD panels from 1.4 to 85 inches in sizes. Based on the results of an electricity review and audit, the energy saving plans were implemented with the aim of improving the overall performance of the electricity system. In addition, the post-retrofit savings in electricity consumption were measured using regression models developed from the baseline electricity use. This pioneering study provides the practical application in implementing and measuring savings for the energy management system of TFT-LCD manufacturing industry.

2. Methodology

2.1. Establishing Energy Management System

The company of this study is one of the top manufacturers of TFT-LCD panels in the world, with a market share of over 15% in large-sized panels worldwide [4]. In order for its sustainable development plans to meet the prescribed regulations for electricity savings, as well as to fulfill its corporate social responsibility commitments, the factory of this study voluntarily initiated an energy management system. This factory as a whole had already implemented OHSAS 18001 Occupational Health and Safety System, ISO 14001 Environmental Management System and ISO 9001 Quality Management System.
In June 2011, the energy management system was introduced and integrated into the routine operations of the factory with ISO 9001, ISO 14001 and OHSAS 18001 systems, as per the company’s commitment to energy conservation that was overseen by the general manager. The general manager appointed the management representative for the energy management system, and the team members included staff from the production, logistics, procurement, human resources, facility, and information technology sections. Figure 1 shows the energy management structure of the factory. The section managers and staff from Environmental Safety and Health (ESH), acted as coordinators, played a key role in integrating the system operations.
The systematic approach to establishing the energy management system was crucial. In-factory training was of great importance in providing on-site hands on field training for the implementation and continuous operation of an effective energy system, as it is highly personnel dependent. The commitment to the company’s energy saving was conveyed from top management to all personnel of the sections involved. Both administrative management and process engineering techniques, such as section specialized and cross-cutting technologies, were included in the topics of in-factory personnel training programs.
Staff recruited for the energy management system utilized any internal communication opportunities, e.g., personnel training programs, routine section meetings and web-based systems, to offer their suggestions on how to improve the management system and/or engineering techniques. A reward system was put in place so as to encourage any such suggestions for increasing the system performance and energy efficiency. Section personnel who met the energy saving targets would receive a practical reward in return.

2.2. Preliminary Review of Electricity Consumption

The preliminary electricity review, initiated in 2011, was based on documents provided by individual sections and confined to the energy management system. The required documents included: (1) definition of the responsibilities, boundaries and scope of individual sections; (2) job functions and practices; (3) equipment design schemes and specifications, operation parameters, electricity consumption measurements and statistical evaluation data; (4) electricity conservation measures as noted in operation manuals and equipment instruction guides; (5) detailed checklists for equipment, work areas, daily operations and maintenance records inspections; (6) labeling on machinery designating energy resource and chemical usage; (7) comments and/or complaints from personnel, contract suppliers and customers; (8) temporary electricity review documents for new and/or modified operational procedures; and (9) non-conformity issues with internal assessments, audits from government, customer relations or insurance company data.
An inventory of the electricity consumption records, including identifying electricity sources, performing electricity measurements, establishing baselines, collecting and reviewing electricity data, as well as proposing energy saving projects, was available by December 2011. In addition, various factors which had an influence on electricity consumption in the production process and facility systems in 2010 were investigated. The results from the preliminary electricity review allowed suitable improvement strategies to be identified and proposed. Energy saving opportunities in terms of strategy and methodology within a specific time frame were proposed and approved by the relevant authority.

2.3. Electricity Audit

The energy performance results were collected and then reviewed in monthly meetings called by the management representative starting in January 2012. Individual section managers reported on the compliance status of the energy targets. The purpose of the internal audit was to investigate the effectiveness of the energy saving system through the appropriate strategies and technical methodologies applied to different sections. The internal audit was designated as an independent audit, for which cross-divisional personnel with qualified technical knowledge, as determined by the management representative, were recruited. The company set the internal audit schedule and proceeded to verify all elements of the energy management system performed in the designated departments.
The on-site audit was performed in order to confirm that the energy saving projects and user operation practices were consistent. Auditors reviewed the standard operating procedures (SOPs) and specifications of the electricity consumption equipment and interviewed electricity users to verify that the SOPs were being followed. The routine operation and maintenance records were checked for consistency of electricity consumption. The integrated performance of the energy management system and the results related to its electricity efficiency were reported by the coordinator from ESH. The management representative tracked the energy performance.

3. Results and Discussion

3.1. Analysis of Electricity Consumption

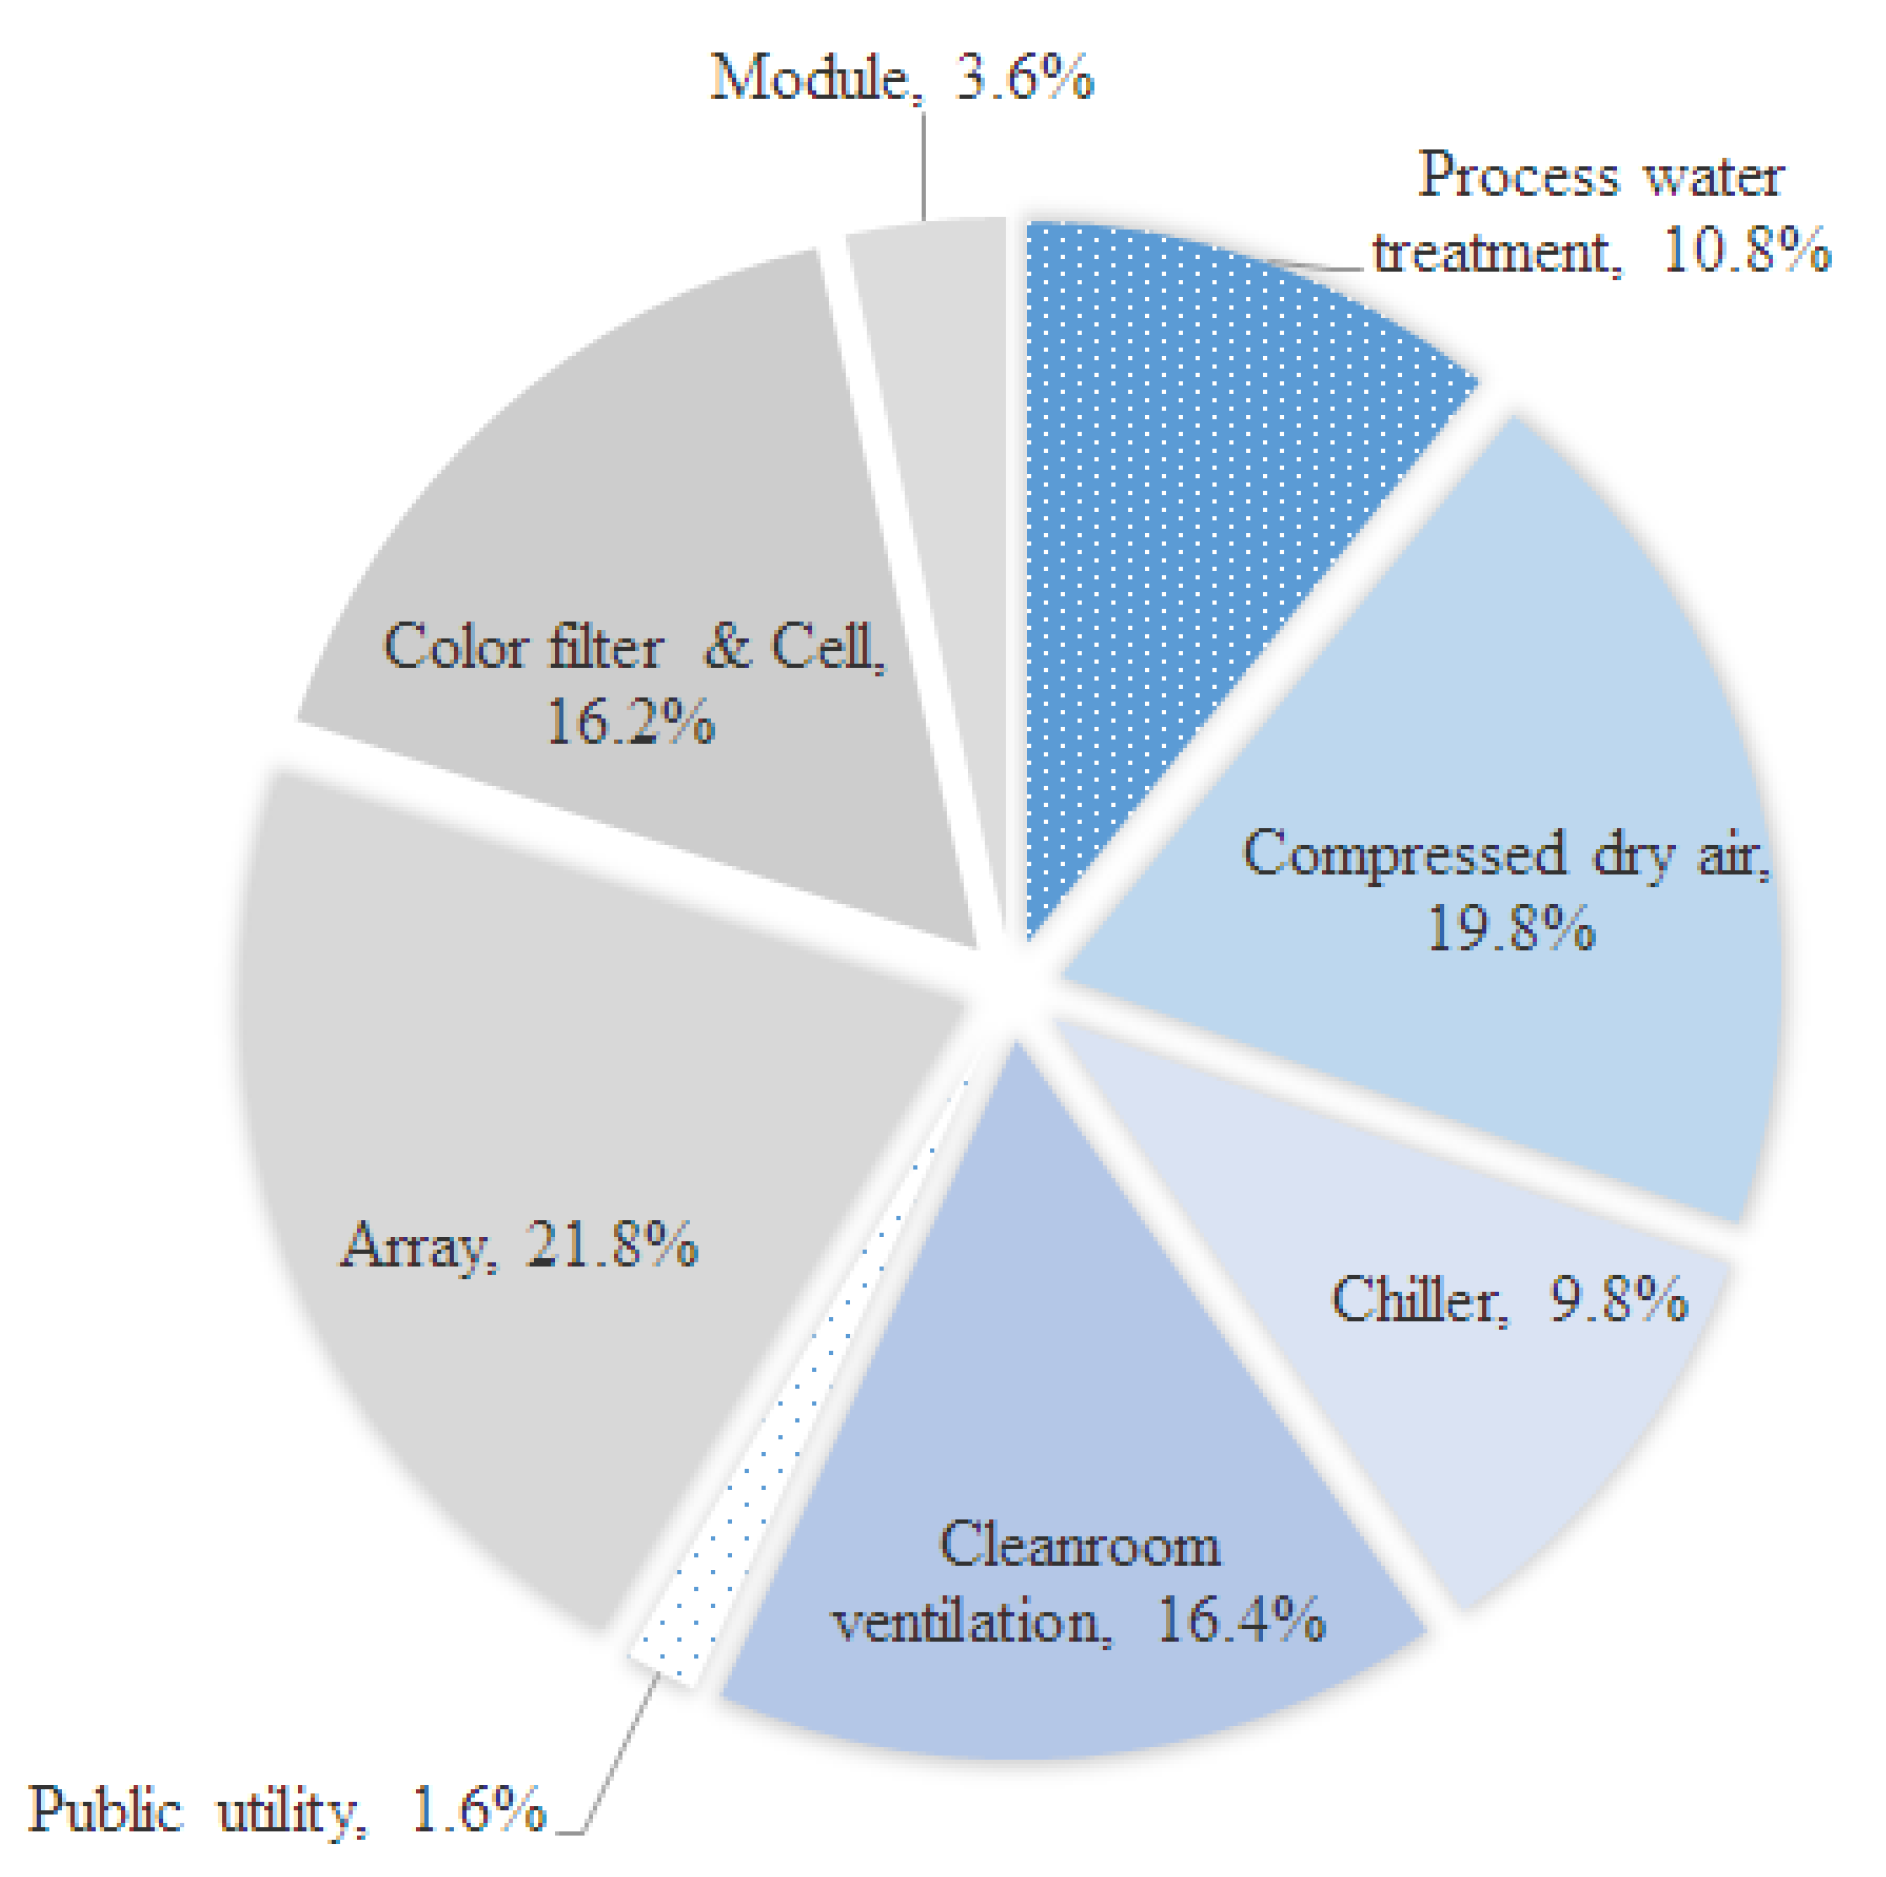
TFT-LCD manufacturing consists of production processes for array, color filter, cell and module, as well as the facility systems for water treatment, compressed dry air, chiller, cleanroom ventilation and public utility. The distribution of electricity utilization in 2010 is shown in Figure 2, with the total electricity consumption for TFT-LCD panel plant counted to 506,662 MWh, i.e., 271,065 tons of CO2e emissions [11]. As illustrated in Figure 2, the production processes and facility systems consumed 41.6% and 58.4% of the total electricity, respectively. Of the production lines, the array system consumed the most electricity of 21.8%. For the facility systems, the most electricity was used by the compressed dry air (19.8%) and the cleanroom ventilation equipment (16.4%). Saidur et al. [12] found that compressed air systems should use less than 10% of the total industrial energy. Therefore, the compressed dry air system of the panel plant had the potential for energy savings. Also shown in Figure 2, the public utility consumed only 1.6% of the total electricity.
The process production lines were considered to be the electricity-intensive sections in the factory and were outlined in the pilot implementation of the energy management system. Energy conservation strategies were scrupulously investigated and specific proposals provided for each electricity consumption section. The significant electricity uses were investigated and analyzed for each section through the 20/80 rule (also known as the Pareto Principle) [13]. In brief, the 20% of equipment, facilities and systems which consumed more than 80% of the total electricity were identified as significant electricity uses and, therefore, designated as prospects for potential electricity usage reductions. The setting of energy targets was function-based, and the annual energy conservation target for the TFT-LCD panel plant called for a 5% reduction of electricity consumption. The major strategy of energy conservation was to increase the energy efficiency and reduce electricity consumption of the equipment.

3.2. Establishing the Baseline Model

Data on the 2010 electricity consumption were used to establish the baseline model for the whole TFT-LCD panel plant. Taiwan lies on the Tropic of Cancer, and its general climate is marine tropical. Therefore, the electricity consumption of the air conditioning system is basically affected by the actual air temperature (dry-bulb temperature) and the amount of moisture in the air (humidity), which is especially true for the sub-generation panel plant. 
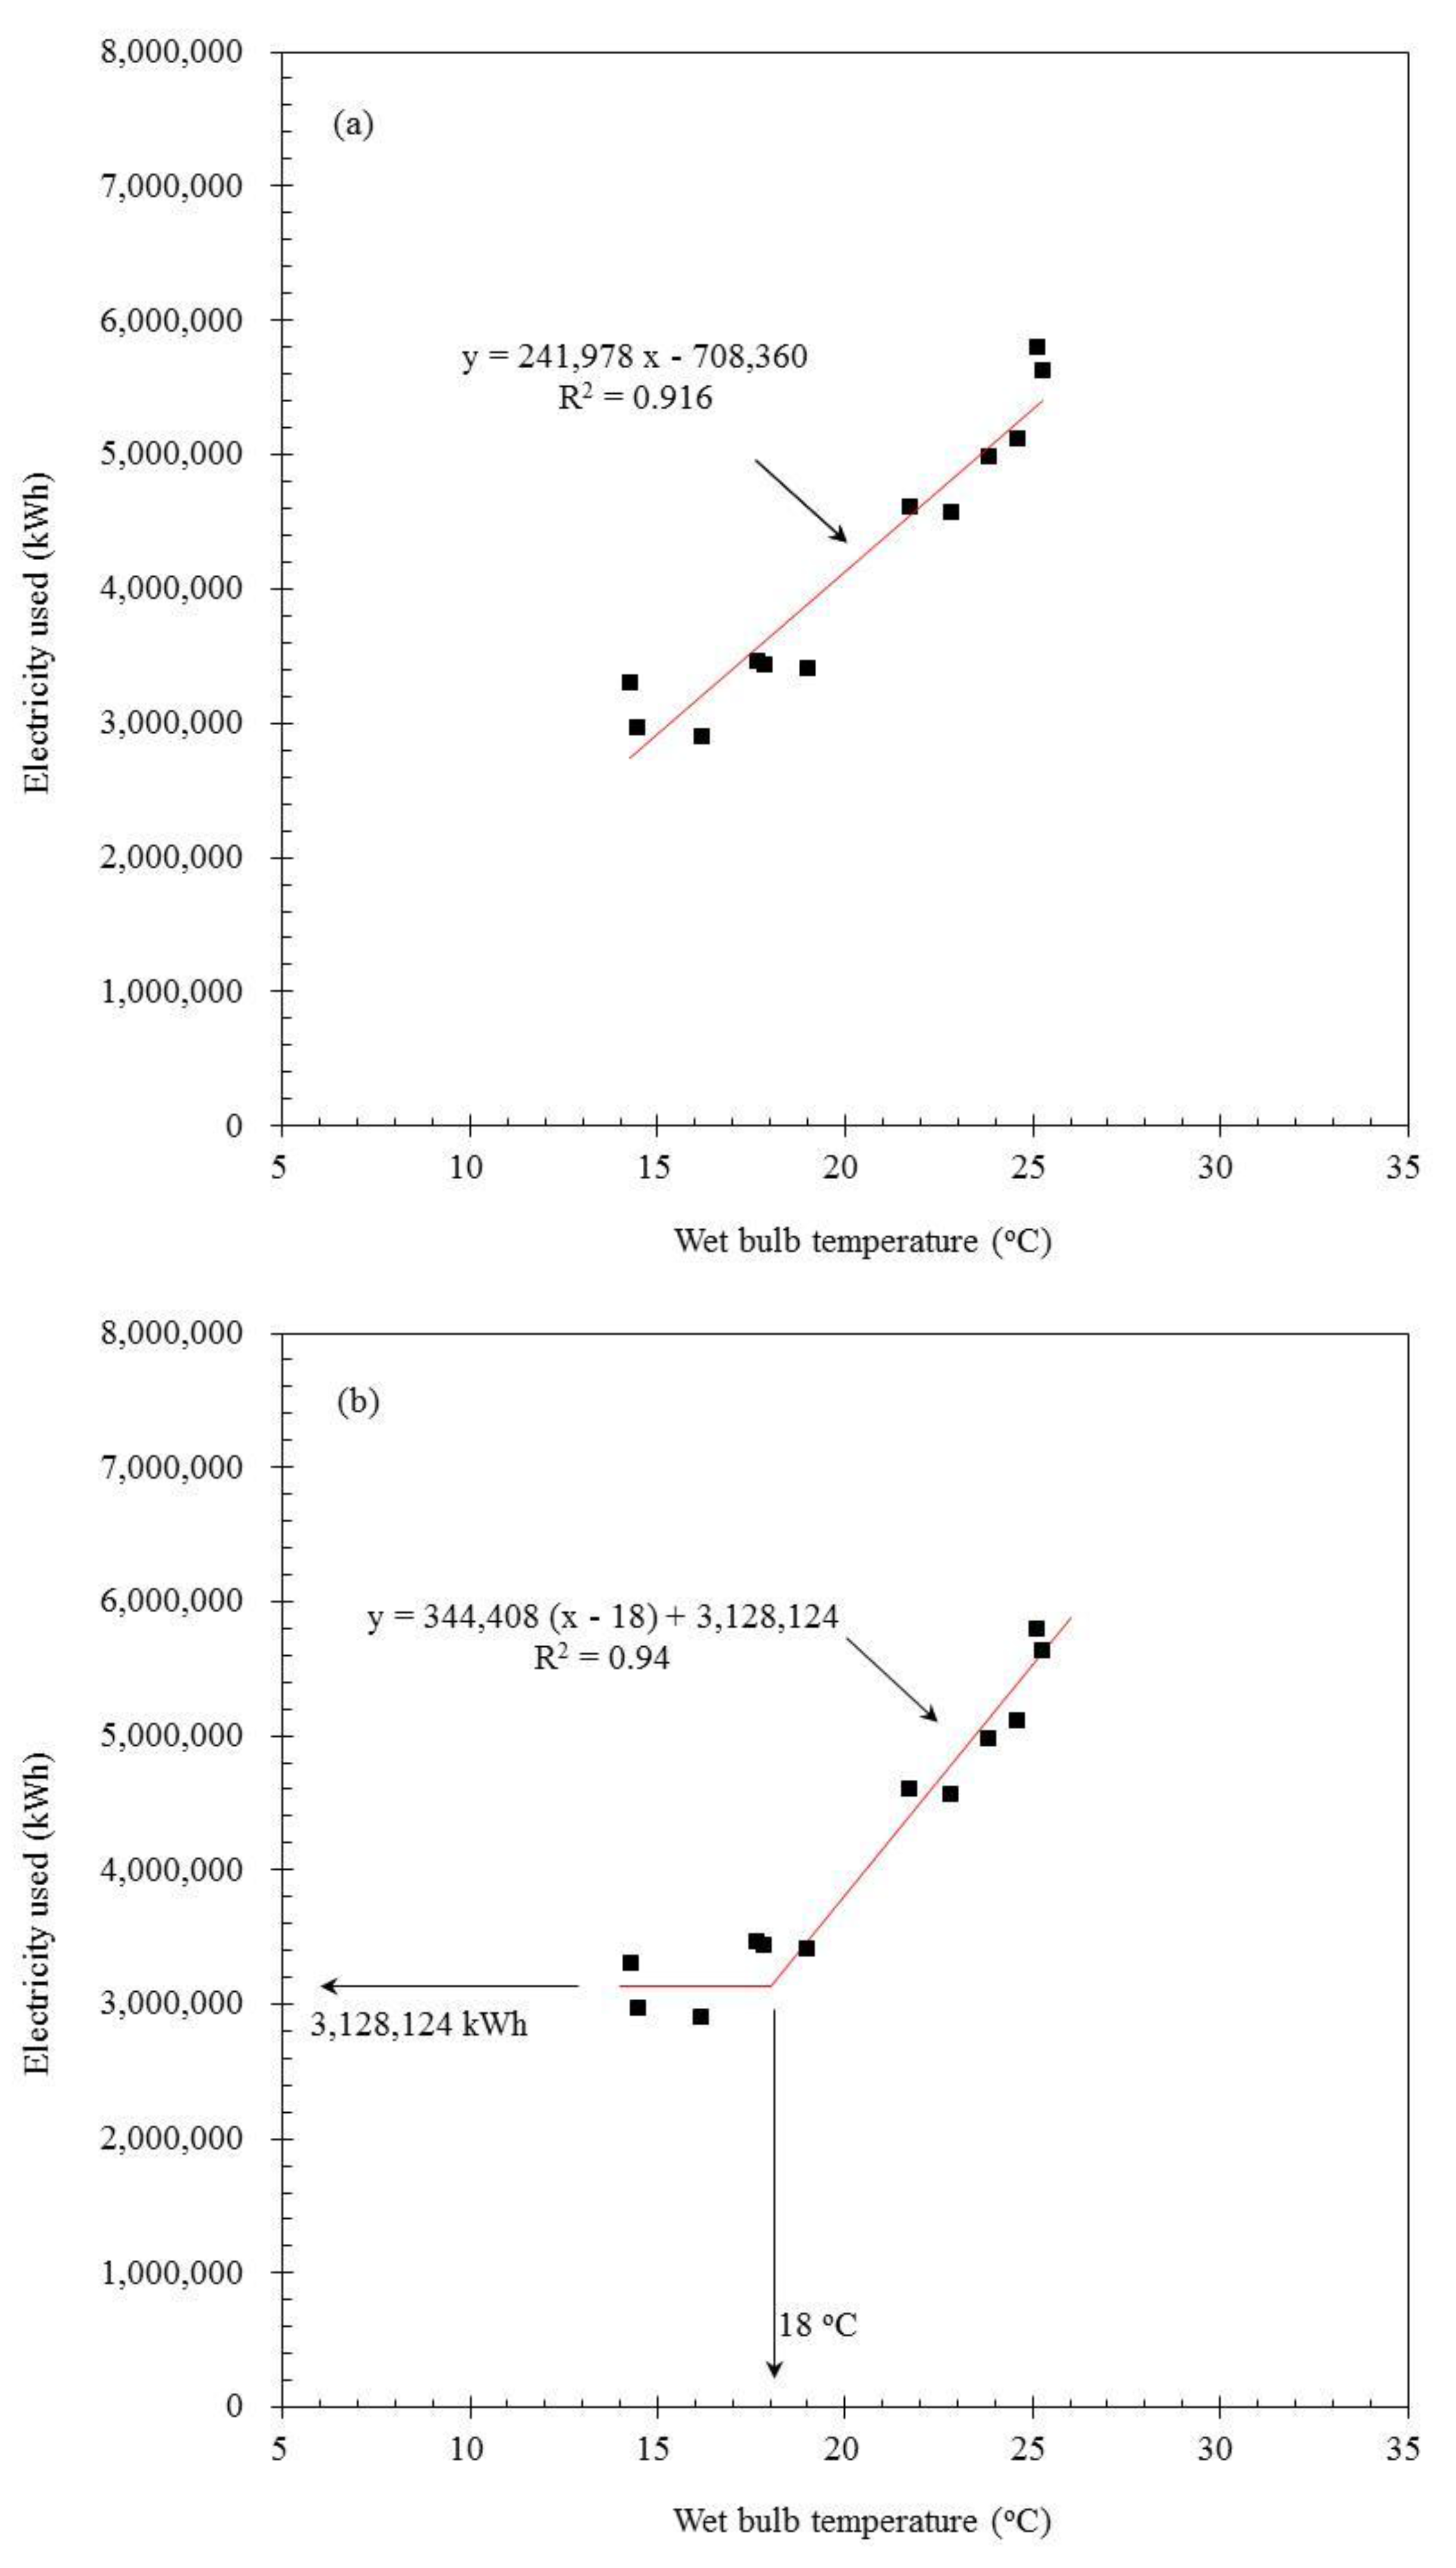
Figure 3 indicates the monthly based amounts of electricity consumed by the chillers in 2010. As shown in Figure 3a, the chillers’ electricity usage (kWh) was linearly proportional to the monthly average wet-bulb temperature of the ambient air, T (°C), with R2 = 0.916 as follows:
E c h i l l e r   =   241 , 978   T 708 , 360
where the wet-bulb temperature was determined by both the dry-bulb temperature and the humidity. The hourly weather data were measured on-line using a Vaisala HUMICAP® Transmitter (HMT330, USA) from the outside of inlet pipes of the air conditioning systems for the clean rooms. The monthly average wet-bulb temperature of 2010 was 20.2 ± 4.1 °C.
Literature has described the electricity use of heating or cooling systems using a three-parameter change-point model [14,15]. As shown in Figure 3b, the chiller electricity use increased linearly (R2 = 0.94) with the outdoor wet-bulb temperature when it was above the balance-point temperature, i.e., 18 °C in this study. The electricity (kWh) used by the chillers can be described as follows:
E c h i l l e r   =   3 , 128 , 124 + 344 , 408   ( T 18 ) +
where the superscript + notation indicates that the value of the parenthetic term is zero, as T < 18 °C.
Table 1 indicates that the square of the correlation coefficient (R2) of Equation (2) is 0.957, and the coefficient of variation of the root-mean-square error (CV-RMSE) is 5.17%. Therefore, the outdoor wet-bulb temperature of 18 °C can be an appropriate change-point temperature for Equation (2) [16].
Chua et al. found that per 1 °C temperature increase would result in 9.4%–15% and 12%–20% increases in the energy consumption for the residential and commercial cooling, respectively [18]. Huang [19] indicated that by increasing 1 °C temperature, the cooling energy consumption increased by 10%–15%. According to the calculation of Equation (1), the chillers’ electricity usage was raised by 6.6% for an increase in 1 °C temperature. On the other hand, increasing 1 °C temperature could increase the electricity consumption of chillers by 11% estimated using Equation (2), which was similar to the results of Huang’s study [19].
Several studies have indicated that the electricity consumption is dependent on the total quantity and output value of products, as well as the overall equipment efficiency [6,8,20]. However, the selling price of TFT-LCD panels was not stable from 2010 to 2011. In this study, a baseline model of the monthly electricity consumption (kWh) for the plant was developed as follows:
E   =   α o +   α 1 ( T 18 ) + + α 2 P
where αi, i = 0, 1, 2, are the fitted parameters; and P is the monthly average yield rate of production (m2), which is defined as the product yield, in terms of the area of the panels produced (m2), divided by the equipment available time index (%). In this study, the equipment available time index for the production process was determined as the percentage of up-time (i.e., the sum of the run-time and the idle-time) versus the total time of machinery operation.
The parameters αi in Equation (3) were determined by fitting the monthly electricity consumption to the monthly average wet-bulb temperature and the yield rate of production in 2010. If the parameter α1 is 344,408, as obtained from Equation (2), the baseline model of Equation (3) is:
E   =   6 , 701 , 999 + 344 , 408   ( T 18 ) + + 4039   P
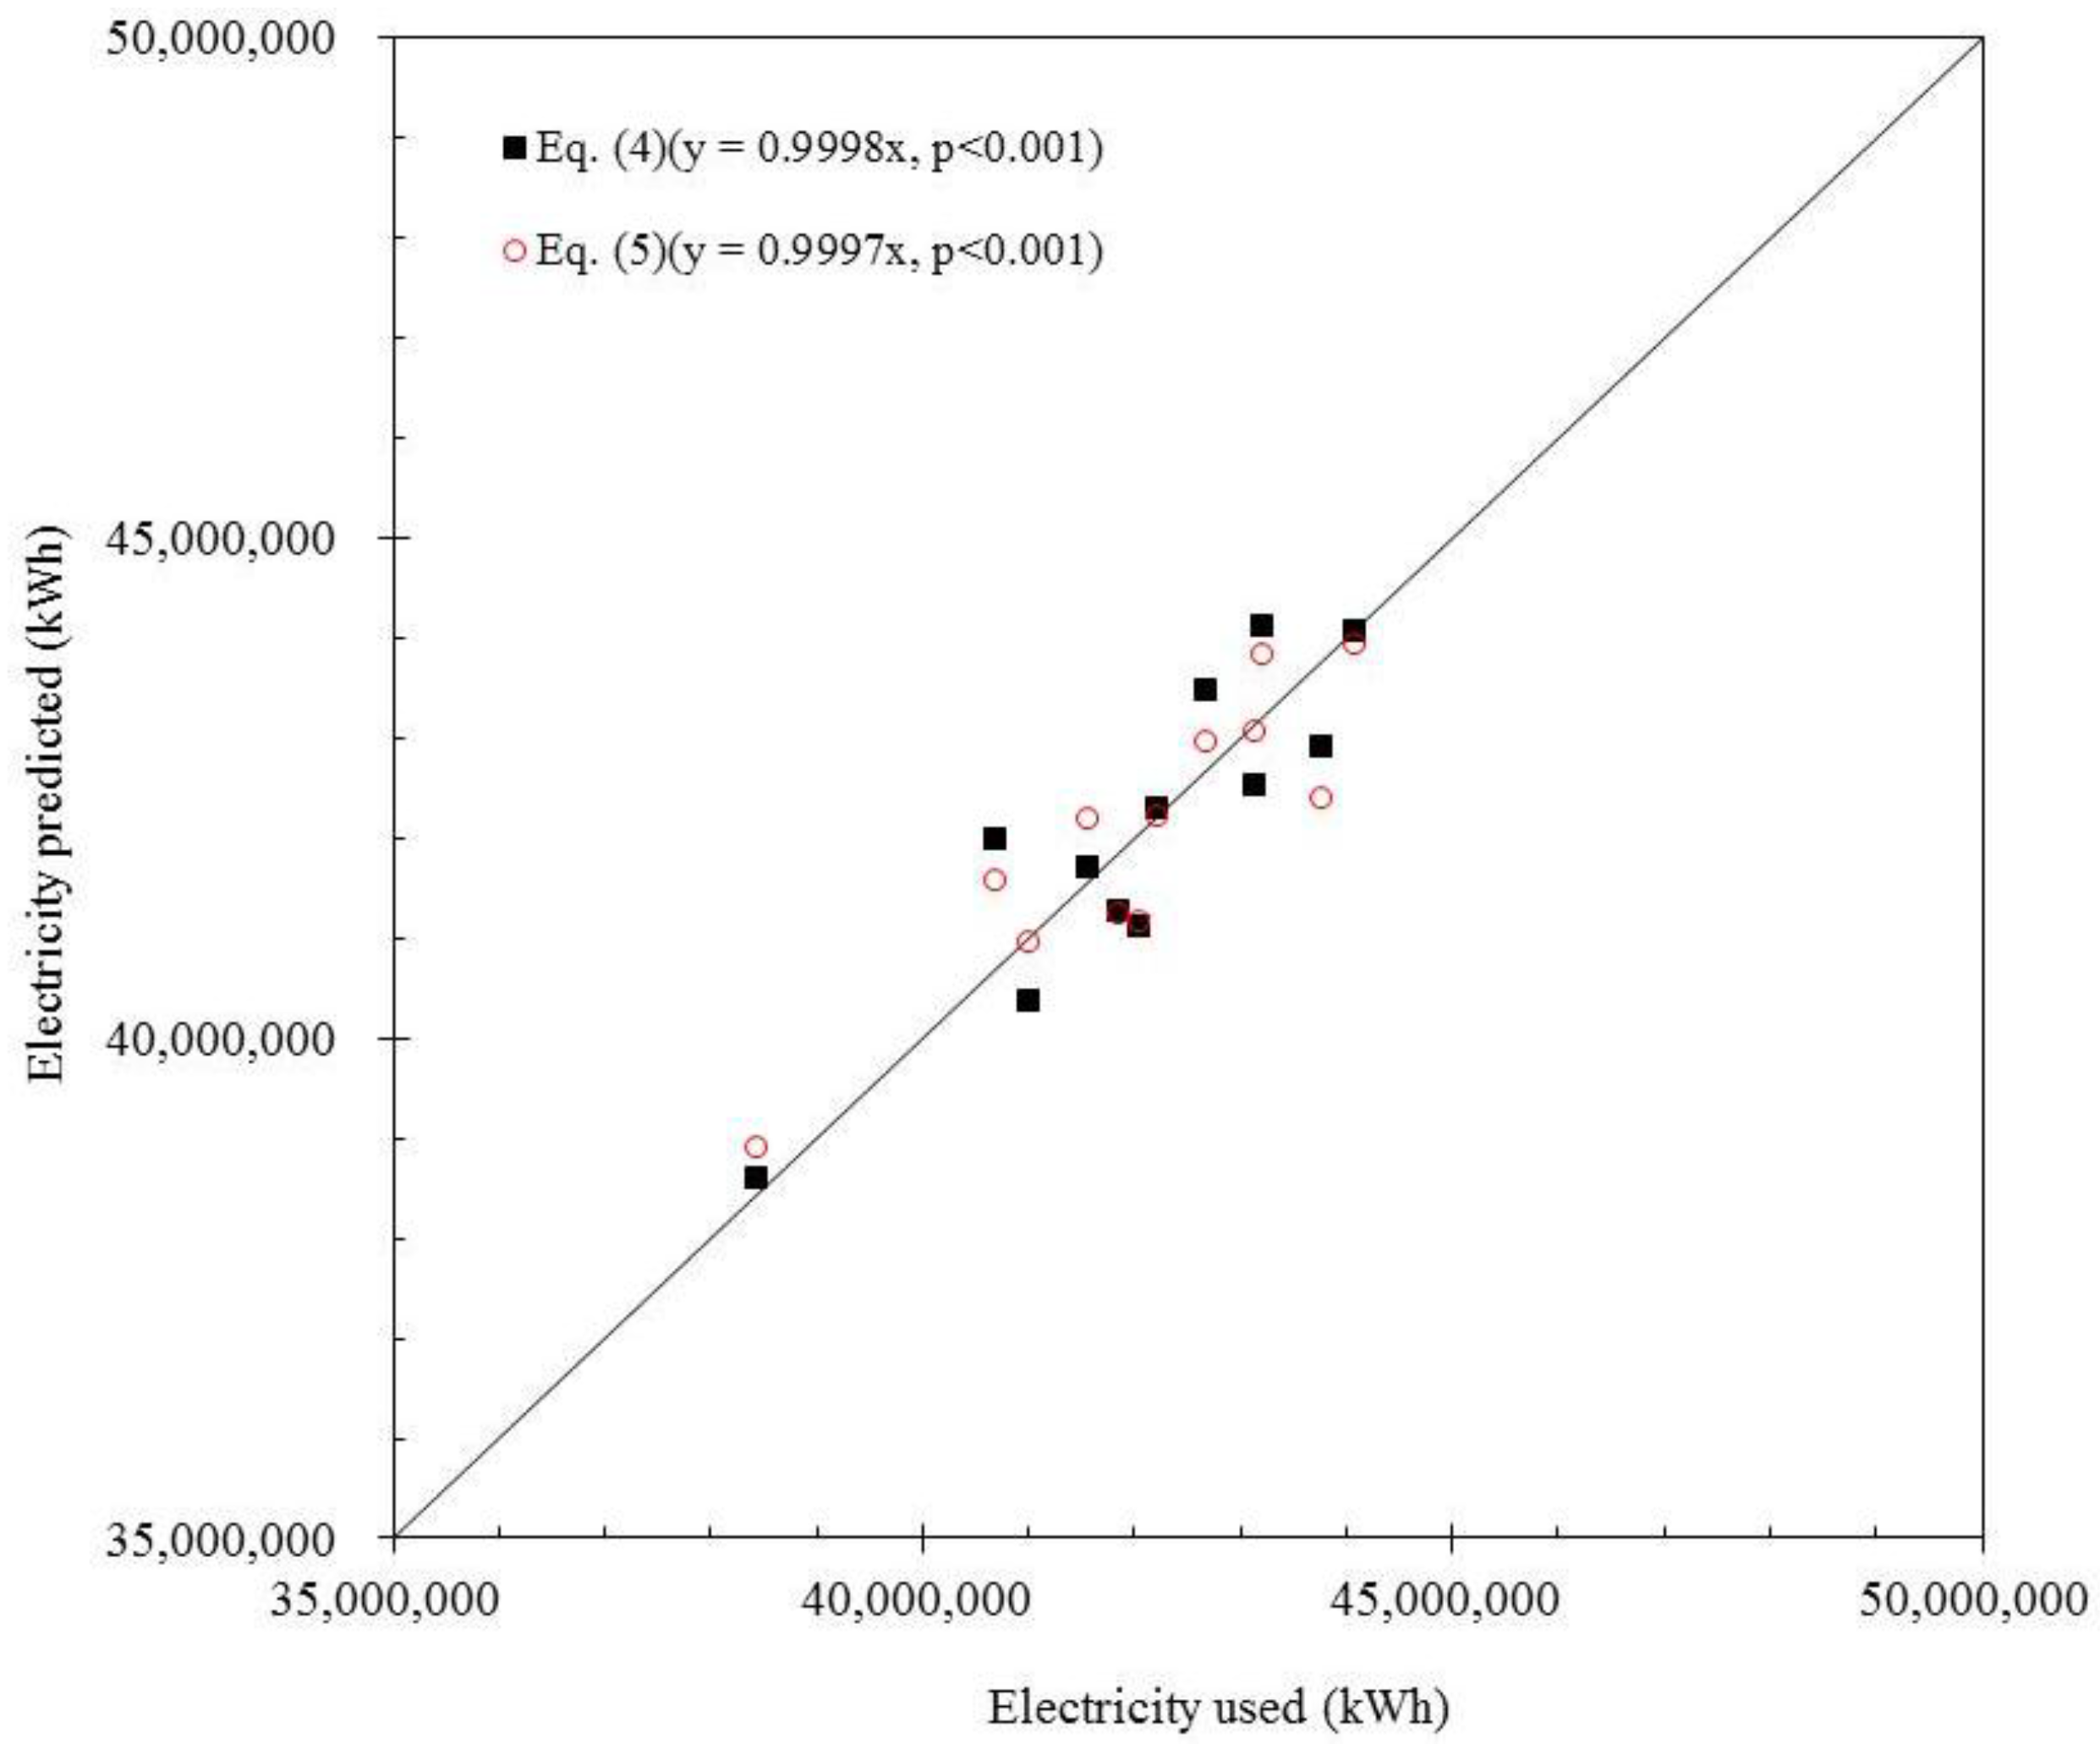
Another approach to determining the baseline model was to directly correlate the monthly electricity consumption to the wet-bulb temperature and the yield rate of production. Based on the multiple linear regression analysis, the baseline model can be determined as follows:
E   =   4 , 208 , 265 + 184 , 615   T + 4015   P
Figure 4 presents a comparison of the 2010 electricity consumptions with the predicted values using Equations (4) and (5), respectively. The data of the monthly electricity consumption were very close to the 1:1 line, implying a good agreement between the measured values and the models of Equations (4) and (5). As shown in Table 1, the mean bias error (MBE) was as low as 0.01% and 0.02% for the models of Equations (4) and (5), respectively. Their CV-RMSE values of 1.68% and 1.52% indicated the high predictive power of the models. However, the square of the correlation coefficient of Equation (4) of 0.784 was a little higher than 0.77 of Equation (5). The monthly electricity consumption savings were estimated using the weather- and production-dependent baseline model of Equation (4).
The baseline models of Equations (4) and (5) indicate that the monthly electricity consumption for the entire plant was proportional to the outdoor wet-bulb temperature (T) and the yield rate of production (P). The importance of T and P on the baseline model was determined through a comparison of single-parameter model analyses. The yield rate of production had a greater influence on the monthly electricity consumption (p = 0.005) than the outdoor wet-bulb temperature (p = 0.165). This result was expected, since the chillers used only 9.8% of the total electricity in the baseline year. In addition, this may be the reason that the electricity consumption for the whole plant was directly correlated with T and P in the baseline model of Equation (5) with R2 = 0.77.

3.3. Energy Saving Projects

The energy saving projects were cross-sectional correlated. Increasing the efficiency of electricity use is an important issue for energy saving strategies through innovative concepts and inspections in detail with minimum expenses and changes of system [3,18]. The strategies for energy saving are summarized in Table 2. The technical aspects of the energy saving methodologies are described below.
Cooling system: The criteria for selecting a chiller with the suitable load capacity were as defined in the SOPs in order to improve the efficiency of the cooling system. A chiller with a suitable load capacity was installed in the production line and the coolant was regularly replaced to maintain the maximum running efficiency of the production machinery [1]. The equipment was regularly checked and lamps not in use in the cooling system were turned off.
Lighting system: Several lighting system improvements were proposed for the color filter section, which involved introducing a computer-controlled lighting system synchronized with process operations. In the production line, the lights which were on during maintenance or emergency checks were turned off when the machine was in normal operation. Turning off lights when not in use was emphasized in the SOPs and was checked regularly. In addition, metal lamps were replaced by green lamps—in this case, digital fluorescent lamps.
Fan, pump and motor systems: literature has indicated that motors account for a major portion of total industrial-energy usage [12]. In this study, energy savings were achieved by reducing the fan filter unit coverage to the designated rate, installing a controller to modulate the motor on- and off-times in the cooling tower and setting up motor off-times during off-peak hours to reduce idle running. For most high-tech fabrication plants, the MAU consumes nearly half of the power load of the chiller to keep the clean room at 23 °C and 45% relative humidity [1,9]. By designing a return-air ducts moistening system, the cost of installing heat pipes for the MAU was reduced, which in turn reduced electricity consumption of the pumps and fans by reducing their operating time from 24 to 15 h, and thus increasing the efficiency of the water chiller unit. The oven and dry pump operation was synchronized with the production process by installing an electricity-saving idle mode into computer software routines in the driving system to reduce run-times and intermittent periods. In addition, a vacuum generator was installed for the dry pump to maintain a moderate vacuum during idle periods. The preventive maintenance or replacement of old pumps with better efficiency pumps was recognized.
Water recycling: Water used in a process requiring high purity was recycled and fed back into the process for lower purity needs, as in the developer process.
Heat recovery: Heat produced by the dry air compressor was recycled for use in the dry blower process by shortening the transfer lines. The exhaust heat from the oven was recycled for pre-heating on process machinery, which significantly reduced power usage. Heat insulation was improved to prevent heat loss.
Vacuum system: Vacuum pipe lines were regularly checked for leaking and saving the operation time for vacuum to improve efficiency.
Production process: According to the baseline model, the monthly electricity consumption was significantly correlated to the yield rate of production. A proper and adequate production process was evaluated and applied to all production lines by the selective running of electricity-intensive auxiliary equipment based on the operations of the major machinery [19]. Unnecessary process units were shut down to improve efficiency, while the common units essential to the production process, e.g., oven, UV light in the cleaning system and extreme UV heater, UV lamp cooling system and the nitrogen gas supply, were managed to their maximum efficiency. In addition, several methodologies were employed as regards operating temperatures, e.g., finding new chemicals for lower temperature processes, reducing the operating temperature of the stripper process and reducing the glass substrate temperature in the sputtering chamber.
Facility: Installing a variable frequency drive on pumps in the pure water and vacuum systems, reducing the number of blowers in the wastewater treatment tanks by integrating the transfer pipe lines into a combined system and expanding the ultra-fine filter units in the wastewater recycling system were measures proposed by the facility section for the whole plant.
Table 3 indicates that the expected annual electricity savings would be 12,039 MWh with the implementation of the energy saving projects. Based on the emission factor of BOE 2010 [11], the carbon footprint reduction of the electricity consumption is 6440 tons CO2e per year. As compared with the baseline electricity consumption in 2010, the energy saving strategies reduced the total electricity use by 2.4%. The strategies of improving electricity efficiency were the major energy saving potentials weighted up to 49.8% of total savings, while the strategies of reducing electricity consumption weighted 40.7%. Top management called a management review meeting at the end of each year to review the effectiveness of the energy saving projects.

3.4. Verify Performance and Calculate Savings

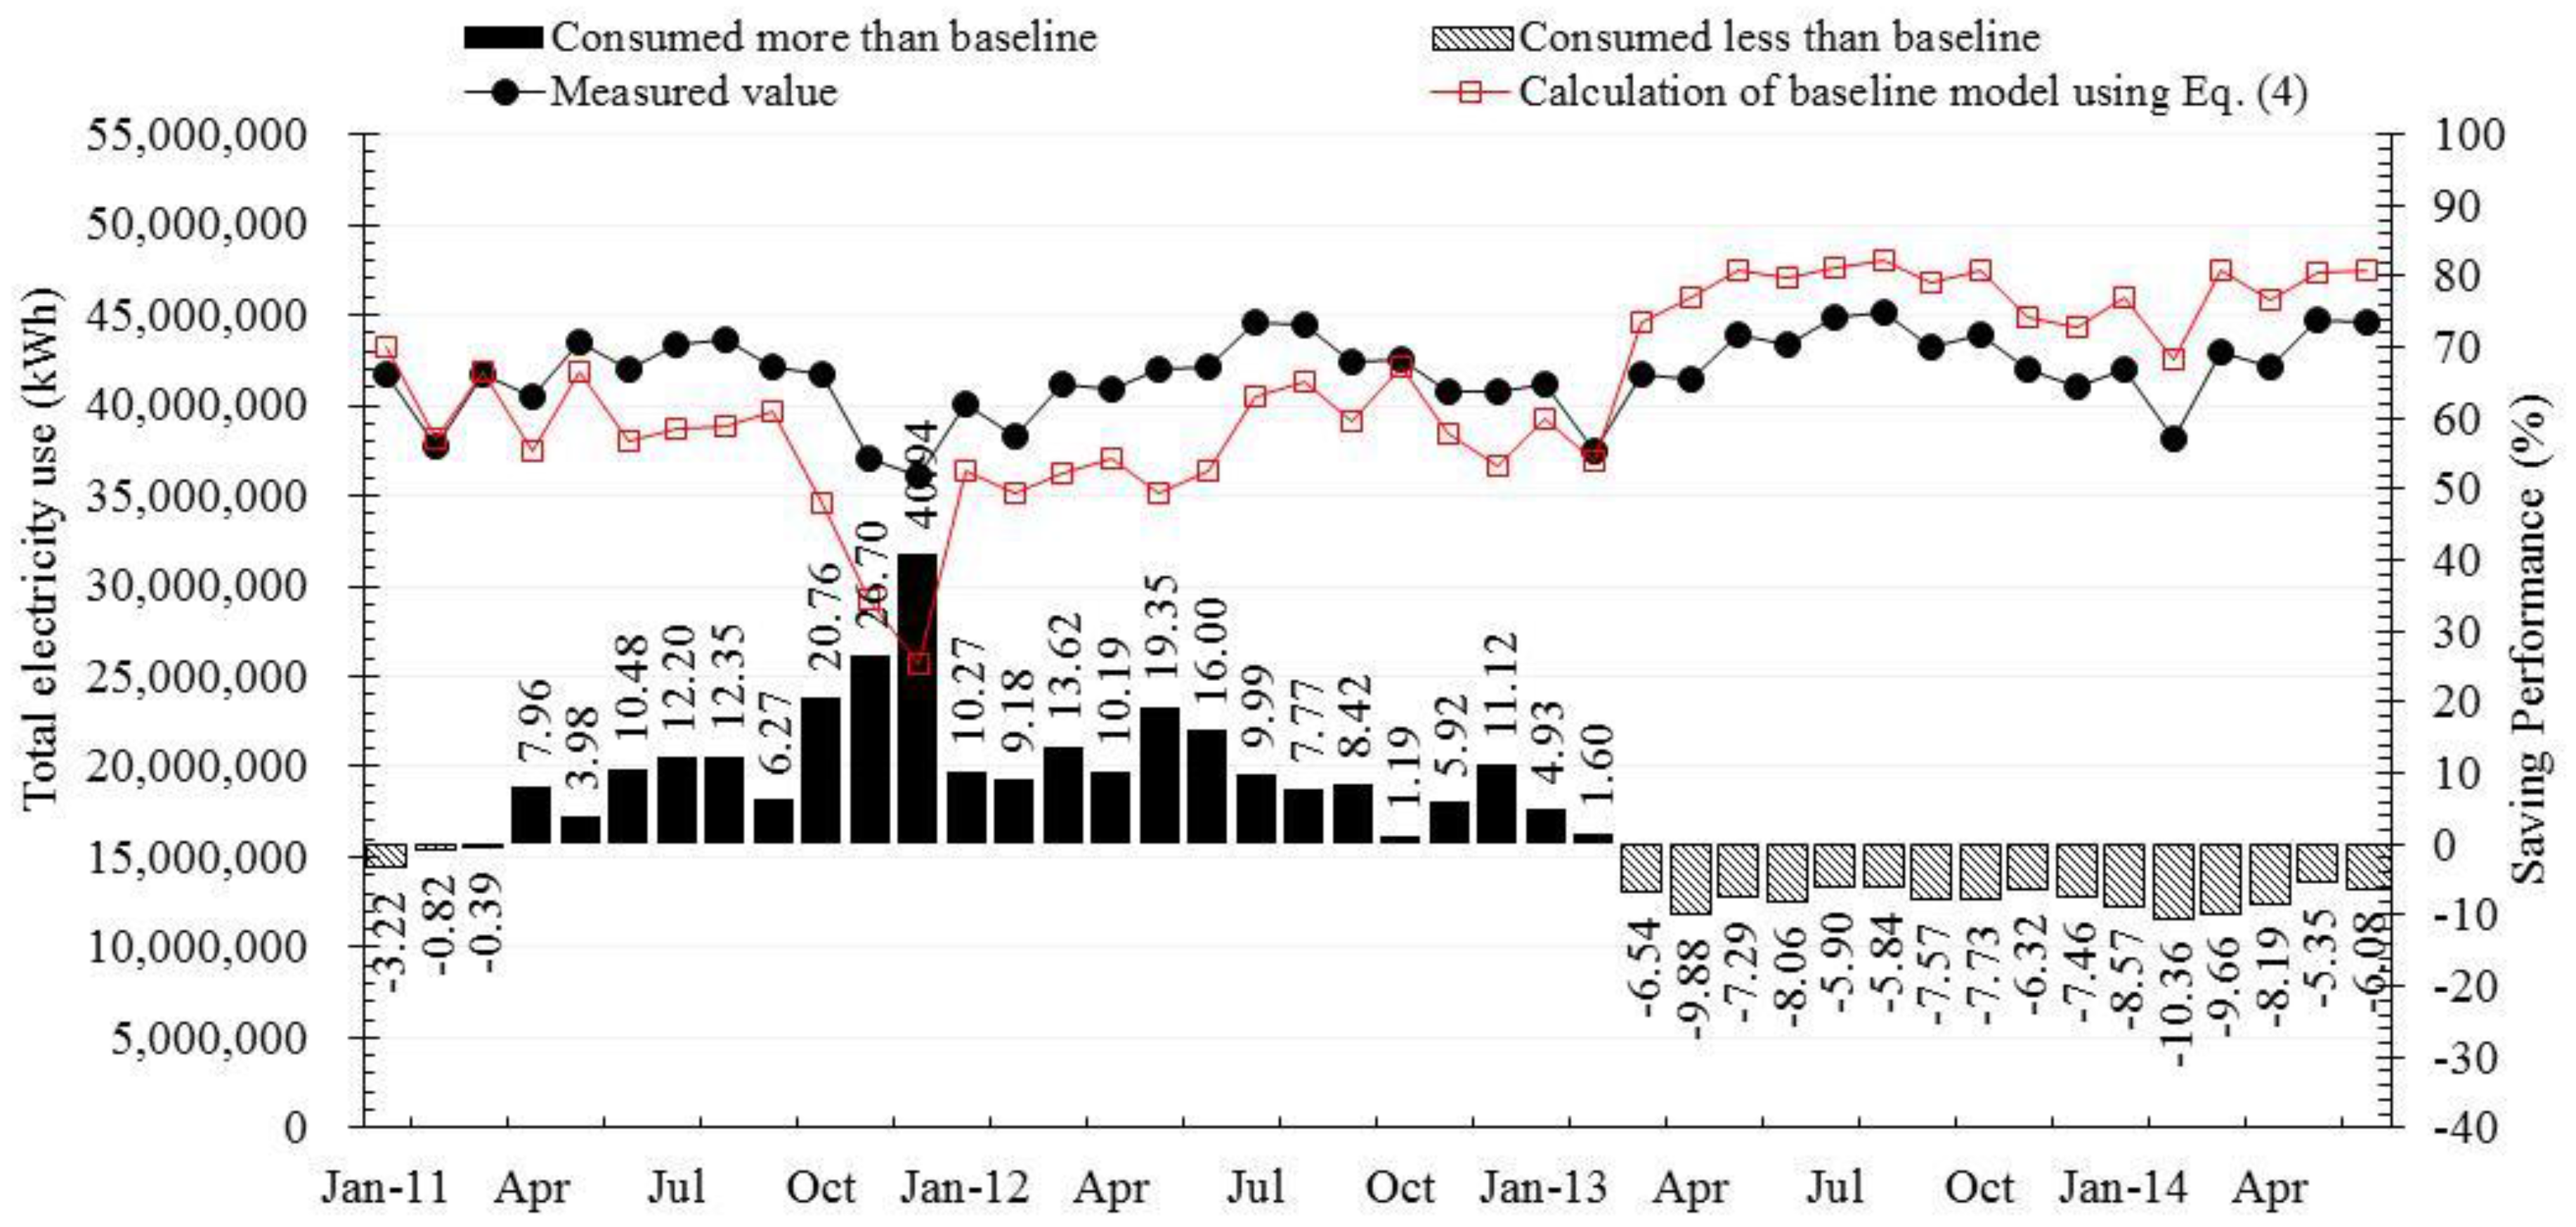
The energy conservation performance was determined by comparing the baseline model of Equation (4) with the measured electricity consumption according to the utility meter readings. Figure 5 shows the monthly electricity consumption and the calculations of the baseline models for the whole panel plant from January 2011 to June 2014. The monthly average wet-bulb temperature of the period was 21.1 ± 4.4 °C, which was similar to the baseline model. It was found that the energy efficiency had actually worsened in the period covering 2011 to 2012. This was because the energy management system was officially introduced in June 2011 and the preliminary work began in December 2011. The improvement strategies had been proposed by then and the performance efficiency should have increased the next year. However, non-routine processes were introduced between January 2012 and January 2013 because the market for TFT-LCD panels was impacted by the 2011 to 2013 global economic depression. As shown in Figure 5, the calculations of Equation (4) resulted in the significant underestimates of the electricity consumption during this period. The number of normal production lines was reduced, some equipment was left standing idle and certain production lines were switched frequently in order to adjust operating parameters or to test the specifications of new products. The factory production output was reduced substantially, which made the overhead utility and base load of equipment consumption the major electricity uses.
After March 2013, the production lines of TFT-LCD panels were back to normal. As compared with the baseline model of Equation (4), the electricity consumption was reduced by 5.35%–10.36%, which was higher than the annual energy saving target of 5%. The energy performance efficiency at that point was on the upswing. The energy saving projects did have a positive effect on the efficiency of the system and the facility performance. In addition, the energy conservation for the entire plant was higher than the total expected savings for the individual energy conservation strategies, i.e., 2.4%. It is plausible that the energy-efficiency improvements for the integrated systems could be superior to the potential energy saving of individual components.

4. Conclusions

For the Gen 6 TFT-LCD panel plant of this study, the fraction of electricity consumption for the production lines was in the decreasing order of the array system (21.8%), the color filter and cell section (16.2%), as well as the module unit (3.6%). The order of electricity consumption for the facility systems was compressed dry air (19.8%), cleanroom ventilation (16.4%), process water treatment (10.8%), chillers (9.8%), and public utility (1.6%). The estimated potential savings for the implementation of energy conservation plan was 2.4% of the baseline electricity consumption, resulting in the reduction of 6,440 tons CO2e emissions per year. Based on a weather- and production-dependent regression model, the energy performance was 5.35%–10.36% reduction of the monthly electricity consumption. The implementation of an energy management system for electricity savings was made possible through the commitment of top management, together with periodical electricity audits, and resulted in energy conservation becoming an integral part of the production process at the plant. The baseline regression models developed herein can serve as an appropriate approach to measure the electricity consumption for other photoelectricity industries.

Acknowledgments

The publish of this paper in open access was financially supported by China Medical University.

Author Contributions

Ven-Shing Wang was responsible for the original idea and wrote the manuscript of the study. Keh-Ping Chao developed the study design, and wrote the manuscript and final version of the illustrations. Cheng-Fong Sie collected and analyzed the data. Ta-Yuan Chang performed the statistical analyses. All authors read and approved the final manuscript.

Conflicts of Interest

The authors declare no conflict of interest.

References

  1. Chang, D.S.; Liao, C.C. Identifying the key factors for chiller system collaborative service design. Energy Build. 2012, 49, 286–293. [Google Scholar] [CrossRef]
  2. Rudberg, M.; Waldemarsson, M.; Lidestam, H. Strategic perspectives on energy management: A case study in the process industry. Appl. Energy 2013, 104, 487–496. [Google Scholar] [CrossRef]
  3. Gordić, D.; Babić, M.; Jovičić, N.; Šušteršič, V.; Končalović, D.; Jelić, D. Development of energy management system—Case study of Serbian car manufacturer. Energy Convers. Manag. 2010, 51, 2783–2790. [Google Scholar] [CrossRef]
  4. Information Handling Services (HIS). Monthly TFT LCD Shipment Database. Available online: http://www.displaysearch.com/cps/rde/xchg/displaysearch/hs.xsl/quarterly_large_area_tft_lcd_production_strategy_report_gaparse.asp (accessed on 15 July 2015).
  5. Bureau of Energy, Ministry of Economic Affairs, R.O.C. Energy Statistics, Annual Data, Energy Statistical Annual Reports: Energy Supply and Demand Situation of Taiwan in 2012. Available online: http://web3.moeaboe.gov.tw/ECW/english/content/ContentLink.aspx?menu_id=1540 (accessed on 10 July 2015).
  6. Yan, M.R.; Chien, K.M. Evaluating the Economic Performance of High-Technology Industry and Energy Efficiency: A Case Study of Science Parks in Taiwan. Energies 2013, 6, 973–987. [Google Scholar] [CrossRef]
  7. Bureau of Energy, Ministry of Economic Affairs, Taiwan, R.O.C. Regulations for Implementing the Energy Management Law, Promulgated as Revised Version on 30 April 2014. Available online: http://web3.moeaboe.gov.tw/ECW/english/content/Content.aspx?menu_id=1702 (accessed on 7 March 2016).
  8. Chiu, T.Y.; Lo, S.L.; Tsai, Y.Y. Establishing an Integration-Energy-Practice Model for Improving Energy Performance Indicators in ISO 50001 Energy Management Systems. Energies 2012, 5, 5324–5339. [Google Scholar] [CrossRef]
  9. Tsao, J.M.; Hu, S.C.; Chan, D.Y.L.; Hsu, R.T.C.; Lee, J.C.C. Saving energy in the make-up air unit (MAU) for semiconductor clean rooms in subtropical areas. Energy Build. 2008, 40, 1387–1393. [Google Scholar] [CrossRef]
  10. Song, Y.H.; Akashi, Y.; Yee, J.J. A study on the energy performance of a cooling plant system: Air-conditioning in a semiconductor factory. Energy Build. 2008, 40, 1521–1528. [Google Scholar] [CrossRef]
  11. Bureau of Energy, Ministry of Economic Affairs, R.O.C. CO2 Emission Factors in 2010. Available online: http://verity.erl.itri.org.tw/EIGIC/images/_energy/vendor/co2/co2_103.pdf (accessed on 12 January 2016).
  12. Saidur, R.; Rahim, N.A.; Hasanuzzaman, M. A review on compressed-air energy use and energy savings. Renew. Sustain. Energy Rev. 2010, 14, 1135–1153. [Google Scholar] [CrossRef]
  13. Koch, R. The 80/20 Principle—The Secret of Achieving More with Less, 2nd ed.; Nicholas Brealey Publishing: Boston, MA, USA, 2007. [Google Scholar]
  14. Kissock, J.K.; Eger, C. Measuring industrial energy savings. Appl. Energy 2008, 85, 347–361. [Google Scholar] [CrossRef]
  15. Reddy, T.; Ruch, D.; Kissock, J. Uncertainty in baseline regression modeling and in determination of retrofit savings. ASME J. Solar Energy Eng. 1998, 120, 185–192. [Google Scholar] [CrossRef]
  16. Kissock, J.K.; Reddy, A.; Claridge, D. Ambient-temperature regression analysis for estimating retrofit savings in commercial buildings. ASME J. Solar Energy Eng. 1998, 120, 168–176. [Google Scholar] [CrossRef]
  17. M&V Guidelines: Measurement and Verification for Federal Energy Projects, Version 4.0. 2015. Available online: http://energy.gov/sites/prod/files/2016/01/f28/mv_guide_4_0.pdf (accessed on 7 March 2016).
  18. Chua, K.J.; Chou, S.K.; Yang, W.M.; Yan, J. Achieving better energy-efficient air conditioning—A review of technologies and strategies. Appl. Energy 2013, 104, 87–104. [Google Scholar] [CrossRef]
  19. Huang, Y.J. The Impact of Climate Change on the Energy Use of the U.S. Residential and Commercial Building Sectors; LBNL-60754; Lawrence Berkeley National Laboratory: Berkeley, CA, USA, 2006. [Google Scholar]
  20. May, G.; Barletta, I.; Stahl, B.; Taisch, M. Energy management in production: A novel method to develop key performance indicators for improving energy efficiency. Appl. Energy 2015, 149, 46–61. [Google Scholar]
Figure 1. Energy management structure of the factory.
Energies 09 00206 g001
Figure 2. Distribution of electricity utilization in 2010.
Energies 09 00206 g002
Figure 3. Correlation between chillers electricity usage and wet-bulb temperature. (a) Linear correlation model; (b) Three-parameter change-point model.
Energies 09 00206 g003
Figure 4. Comparisons of measured and predicted values of electricity consumption in 2010.
Energies 09 00206 g004
Figure 5. Monthly electricity consumptions and calculations using Equation (4) from January 2011 to June 2014.
Energies 09 00206 g005
Table 1. Statistical indices of the baseline models.
IndexAcceptable Value Equation (2)Equation (4)Equation (5)
R20.750.960.780.77
MBE (%)±5−0.40.010.02
CV-RMSE (%)15%5.171.681.52
M&V Guidelines: Measurement and Verification for Federal Energy Projects, Version 4.0, 2015 [17].
Table 2. Proposed strategies for energy savings.
Production line
  • Synchronize vacuum pump and oven operations with process by installing an electricity-saving idle mode into computer software routines.
  • Conserve electricity in the lighting system by turning off unused UV lights and replacing metal lamps with green lamps in the exposure process.
  • Shut down lamp cooling system in the exposure process.
  • Shut down heater and N2 gas in the clean process.
  • Recycle the oven heat.
  • Recycle the clean water.
  • Reduce the glass substrate temperature in the sputtering process.
  • Reduce the operating temperature in the stripper process.
  • Introduce new chemicals for a lower operating temperature in the developer process.
  • Conduct regular preventive maintenance and replace old pumps with more efficient ones.
  • Turn off unused conveyer.
  • Shorten running time of hot plate/cold plate.
  • Insulate chemical vapor deposition equipment.
  • Start-up vacuum generator to maintain moderate vacuum during idle time.
  • Reduce film thickness.
Facility
  • Lower fan filter unit coverage.
  • Apply timer to modulate motor on- and off- times in cooling tower.
  • Install variable frequency drive in pure water system.
  • Reduce number of wastewater treatment blowers and shorten transfer lines.
  • Recycle waste heat.
  • Expand ultra-fine filter units in wastewater recycling system.
Table 3. Saving potential of energy conservation strategies.
Energy Saving StrategySaving Potential (MWh/year)
Reducing consumption (%)40.7
Lower fan filter unit coverage263
Install more variable frequency drives and timers1386
Shut down unused processing units1287
Shorten transfer lines and reduce wastewater treatment blowers657
Install electricity idle mode in computer software routines826
Reduce process operation temperature and/or time481
Improving efficiency (%)49.8
Set regular equipment maintenance14
Prevent vacuum pipe leaks116
Replace metal lamps with green lamps5435
Prevent heat loss and recycle exhaust heat431
Improving process (%)9.5
Introduce new chemicals506
Reduce film thickness637

