1. Introduction
Generating electricity from renewable sources is a key way in which nations plan to lower carbon emissions. Renewable generators can be deployed at multiple scales and at different voltage levels within the electricity network, from multi-MW wind and solar farms connected directly to the high voltage network, to rooftop PV systems of just a few kW capacity connected to the low voltage domestic supply. In the 21st century, several countries have introduced incentive schemes to encourage the widespread adoption of small and micro-scale renewable generators, including feed-in tariffs. The research presented in this paper has at its core a data analysis of the UK feed-in tariff database to characterise the observed spatial and temporal patterns of adoption in response to the policy instrument. The reasons for the observed patterns are investigated, including social effects that may lead to the clustered spatial nature of adoption and policy events and associated media coverage that coincided with clear events in the temporal pattern of adoption. This data analysis is then combined with insight from complex systems and transitions literature to explore the implications of the observed patterns for visions of the future electricity supply system, with particular reference to smart grids.
With the incorporation of more renewable generation into the electricity supply, the dispatchability of generation is lessened: electricity is generated when the wind blows or sun shines, in contrast to the current system where generation is dispatched to meet whatever demand is presented by consumers. Non-dispatchable supply presents a challenge to the traditional operating mode of the electricity network where net load on the network is largely predictable, power supply is controlled and electricity flows uni-directionally from large generators to consumers. One solution that has been proposed is the development of a smart grid, which has been described as:
“Electricity networks that can intelligently integrate the behaviour and actions of all users connected to it—generators, consumers and those that do both—in order to efficiently deliver sustainable, economic and secure electricity supplies.”
Visions of future electricity grids often refer to the expected prevalence of embedded microgenerators in the distribution network. Such visions often also refer to transition in, or transformation of, the electricity supply system, with reference to bottom-up actions on the part of citizens putting pressure on the system to change. Example visions set out for the UK are the
“Thousand Flowers” scenario [
2] and, with reference to smart grids in particular, the
“Groundswell” vision, which emerged from the UK Energy Research Centre (UKERC) smart grid scenarios research project [
3]. Both of these visions outline a future electricity network where domestic consumers
en masse become
prosumers and change the nature of the electricity supply system by using locally-generated electricity from renewable sources to supply a large fraction of their needs and balancing supply and demand locally.
These future visions of highly distributed smart grids require widespread adoption of technology and practice on the part of electricity supply system users, including domestic consumers. The research presented here analyses data on adoption patterns of one particular technology (PV) and uses that analysis towards an understanding of the various drivers for adoption, from technological through economic to psychological and social. There is undoubtedly innovation in the technology to generate and use renewable energy at the household or community scale; technology exists that can achieve those goals. However, the practice of adopting and using that technology is subject to other influences, social, cultural and geographical inter alia. It is not yet clear whether this adoption will take place readily or the roles that policy and human behaviour will play in encouraging the adoption. One example of technology adoption that has taken place in the UK is the adoption of domestic microgeneration under the UK feed-in tariff incentive.
The patterns observed indicate that influences on adoption are multi-faceted, including psychological, social and technological factors, which highlight the need for a multi-disciplinary perspective on studies of potential transition to a smart grid. In this paper, the analysis of observed spatio-temporal patterns is combined with observations of social influences on those patterns in addition to economic drivers. The implications of the findings for future policy toward smart grids is discussed, with conclusions.
2. Literature Review
At the inception of the feed-in tariff scheme (April 2010), domestic PV ownership was innovative, with less than 5000 installations distributed among the UK’s 23 million households. This is no longer the case; PV ownership is relatively commonplace with more than 700,000 domestic installations. This paper investigates the complex evolution of such ownership over space and time to gain insight into factors influencing that adoption and implications for potential future incentivisation mechanisms. Three streams of literature form the antecedents of this study: that concerning technology adoption, that concerning smart grid scenario building and policy and that concerning UK feed-in tariff policy design and economics specifically.
2.1. Technology Adoption
Modern study of technology adoption can be traced back to the 1960s, with Rogers’ diffusion of innovation [
4] (read in 4th edition, 2010) and Hägerstrand’s work on the spatial nature of diffusion [
5]. Diffusion of innovation theory introduced five categories of adopters:
innovators,
early adopters,
early majority,
late majority and
laggards. The innovation-decision process is discussed explicitly as passing from the first knowledge of an innovation, through forming an attitude about it to making the decision to adopt or reject. After this process, the decision is implemented and then evaluated [
4]. Following the development of this theory, the ideas of diffusion of innovation were developed and given explicit mathematical formulation, particularly from the perspective of the study of economics. in particular, the Bass model [
6] is a mathematical formulation of innovation diffusion, which will produce the “S-curve” often observed in the total number of adopters of a given technology. This model parameterises influences on the adoption decision for a product as
p, the coefficient of innovation, and
q, the coefficient of imitation. The formulation has been used and extended extensively, with notable extensions to account for repeated adoption (e.g., products that will be renewed) [
7] and generalisation to time-varying price [
8].
Diffusion of innovation theory and the Bass model have been found to be applicable over a range of technological innovations and remain a mainstay of studies on innovation diffusion, with empirical evidence being collected and used to determine the parameters for specific cases. Meta analyses have shown the model to be generalisable and to have descriptive power [
9]. However, the theory and models have been shown to be incomplete in describing adoption patterns in the presence of highly heterogeneous populations, in particular where the coefficient of imitation (
q) is highly heterogeneous. The lack of consideration of consumer heterogeneity, spatial dissimilarity and social factors in Bass models and their derivatives has been found to be a limitation [
10], particularly where a model is required to answer “what-if” questions, as this is not the purpose for which the Bass formulation was designed. Despite this, these models of innovation diffusion are commonly assumed (whether implicitly or explicitly) in policy design and impact assessment.
Despite their identified shortcomings, diffusion of innovation models have been used to analyse renewable energy technology diffusion, deriving
p and
q from empirical data to predict diffusion [
11]. In the impact assessment produced as part of the UK feed-in tariff policy design, an S-curve model is used to predict adoption due to the incentives proposed [
12, Figure 4]. That model appeared to be flawed in the early days of the feed-in tariff deployment, and rates in excess of those predicted triggered the fast-track review of the policy, which in itself caused significant disruption to adoption rates, as discussed in
Section 3.1.
Empirical social studies have investigated the barriers and drivers to diffusion, finding low awareness of the technology, unwillingness or inability to pay capital costs, lack of understanding and long payback periods to be barriers [
13], whilst measures to help with cost of installation [
13], contribution to a better natural environment, independence from the supplier [
14] and demonstrating environmental commitment [
15] have all been found to be drivers for installation. These factors are effectively “rolled up” into the parameters of an S-curve model. If such a model is found not to adequately describe adoption of a given product (as in the case of PV diffusion under the feed-in tariff incentive), it is likely that the individual factors affecting diffusion should be examined in a disaggregated fashion.
2.2. Smart Grid Scenarios and Policy
The UKERC smart grid scenarios project shows
Groundswell to have a heavy reliance on decentralised renewables (for instance, in contrast to
Smart2050, which relies more heavily on large-scale renewables in preference) [
3, Table 3]. The report highlights the need for strong policy intervention in order to achieve the scenarios envisaged. In the UK, the spatial variation in PV adoption and its implications for smart grid scenarios has been touched upon in the literature, but has yet to be fully explored [
3,
16,
17,
18]. In particular, analyses have usually focused on the spatial distribution at a particular snapshot in time, whereas this research looks at the evolution of the spatial distribution in time and uses that to gain insight into the various determinants of that evolution.
Work has been commissioned by both the Department of Energy and Climate Change (DECC) and Ofgem to examine the paths to an electricity generation with vastly reduced carbon intensity. The Long-Term Electricity Network Scenarios (LENS) report [
19] details five scenarios, which range from a highly centralised view of a decarbonised network (
Big Transmission and Distribution) to a much more decentralised view where large proportions of electricity are generated by small and micro-renewable generators (
microgrids). The former approach would be driven by investment in nuclear power stations and large-scale renewables (such as onshore and offshore wind farms, often cited as
Big Wind) while the latter envisages, for instance, householders investing in domestic generation, such as PV, potentially owning storage devices and using electricity more efficiently.
The LENS report sets out some of the necessary actions to bring about a transition to the scenarios it describes; however, detail is still lacking. Some efforts have been made to flesh out some of this detail. In 2010, the Electricity Network Strategy Group (ENSG) produced the Smart Grid Routemap, a report setting out potential paths toward a smart grid [
20]. This sets out some necessary steps toward a smart grid future and highlights the need for pilot projects, outlining some potential sample projects. However, this routemap is still unclear on how the necessary adoption of devices to facilitate a smart grid will occur. In a section on distributed energy resources, it is noted that:
“A particular challenge exists around the customer value proposition linked into technical control and automation and DER commercial frameworks and incentives”
[
20] (p. 15, Challenges to DER)
In other words, it is not clear that consumers gain value from adopting the distributed resources. However, a key component of the smart grid vision is the widespread adoption of distributed renewable generation. The Renewable Energy Roadmap produced by DECC [
21] describes the way that the UK wishes to introduce renewables into the fuel mix. The feed-in tariff, introduced in the Energy Act and coming into force in April 2010 [
22], has encouraged the adoption of distributed renewable generators, particularly domestic (mainly rooftop) photovoltaics.
2.3. UK Feed-in Tariff Policy Design
The impact assessment prepared as the feed-in tariff policy being designed [
12] sets out the basis for calculating the tariff offered and the methods used in modelling predicted uptake. The impact assessment considers four scenarios using an economic cost-benefit model to provide data on their likely consequences. Three of the scenarios considered supported domestic microgeneration (
lead,
8% ROI and
community), while the fourth (
non-microgeneration) assessed a tariff supporting only larger installations. In outlining the motivation for the feed-in tariff, the first objective is stated as follows:
“The objective of FITs is to contribute to the UK’s 2020 renewable energy target through greater take-up of electricity generation at the small scale and to achieve a level of public engagement that will engender widespread behavioural change.”
The tariff eventually implemented for retrofit PV (≤4 kWp) was 41.3 p/kWh, between the level suggested by the
8% ROI scenario (59 p/kWh) and the
lead (and recommended) scenario (36.5p/kWh), which assessed deliberately reduced PV tariffs due to the ease of PV deployment compared to other technologies. The projected impact of the
lead scenario was:
“The scenario is projected to deliver 870,000 renewable installations by 2020, generating approximately 6 TWh of additional (to the baseline) 9 This means that domestic PV installations do not require planning consent. 11 electricity in 2020 at a resource cost of £600 m in 2020 (annual), £8.7 bn cumulative to 2030”
This was further broken down by investor type, with the Lead scenario projected to incentivise around 50,000 domestic installations over all technologies by mid-2011, with adoption following an “S-curve” to the 2020 target.
The policy was undoubtedly successful in encouraging the adoption of domestic (rooftop) solar photovoltaic generators. In fact, the policy was deemed so successful by the government in early 2011 (at which time, some 70,000 installations were registered compared to the projected 50,000 or so), that an extraordinary review (the Fast Track Review [
23]) of the policy was ordered and a subsequent reduction in tariff mandated, despite the fact that the first review was originally planned to make changes for implementation in 2013. Although the decision to reduce the tariff was successfully challenged in court [
24] and Parliament [
25], the net effect of that challenge was simply to delay the reduction, which was enacted in March 2012. Since 2012, there have been several rounds of tariff cuts, including a change to the mechanism by which degression was implemented, eventually resulting in a process of a three monthly tariff review.
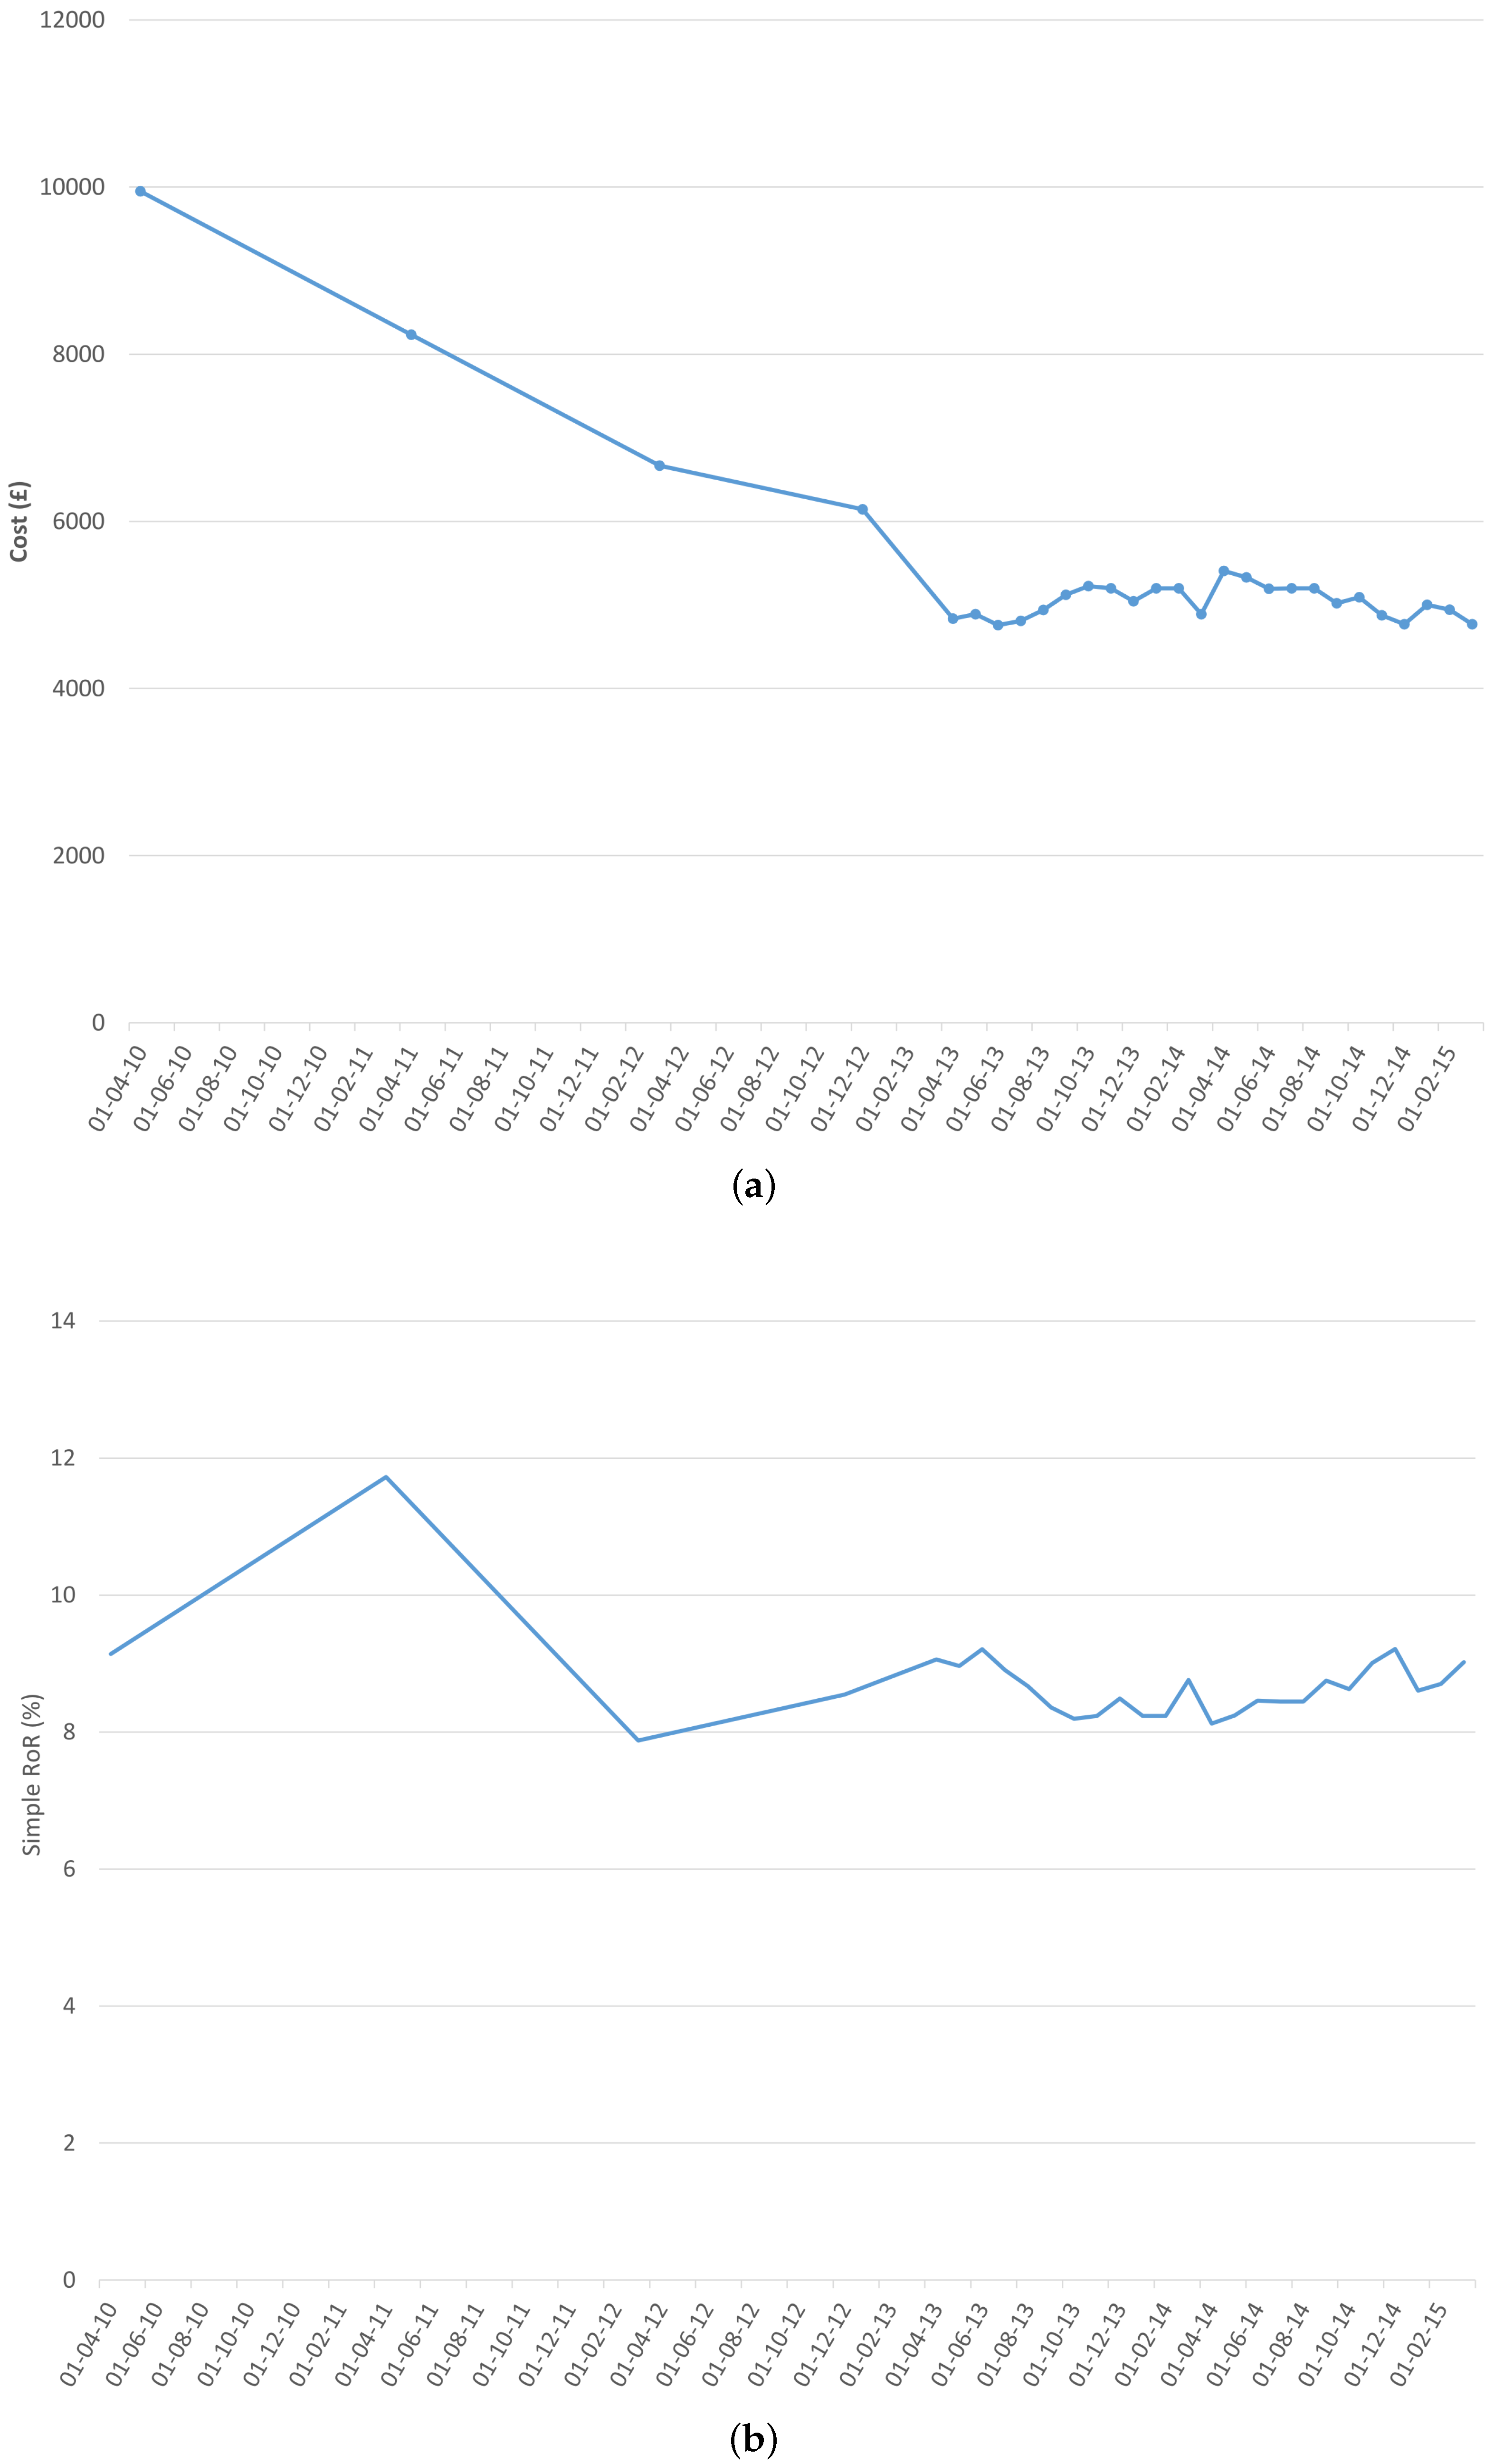
The economics of PV installation for a household are presented below. The costs of installed systems in the UK over the lifetime of the FiT are not readily available under a consistent monitoring method; however, there is consensus between data sources that the costs of installed units fell during 2010 as the scheme opened and continued to decline until around 2013, when prices stabilised. The reasons for these changes may be linked to the policy itself, as installers benefit from economies of scale and learning by doing, as well as global trends in the cost of wholesale PV, which declined rapidly as demand volume increased. The cost of an installed system given is for a reference case 2.6 kWp domestic installation retrofitted to an existing house. Data points are sparse in the early years of the FiT [
26,
27], but are more plentiful latterly, where the cost of an average system has been monitored consistently [
28] (
Figure 1a). These costs are combined with income to generate an indicative rate of return (
Figure 1b). The income is based on feed-in tariff levels over the lifetime of the scheme [
29], typical generation (kWh/kWp) and an assumed 50% export and 50% avoided electricity costs at contemporary prices to calculate a rate of return for a typical installation as per the spreadsheet provided in the supplementary materials. Typical generation is based on an average generation per installed kW; this aggregates factors influencing the per household rate of return, such as building orientation/shading and regional insolation, which is higher in the southwest of the UK and becomes progressively lower moving across the UK in a northeasterly direction.
Figure 1 should be read as indicative for a typical reference installation, taking note of the fact that early installation costs exhibited wide variation (particularly for 2010, estimates vary from £9950–13,000), and the measurement methodology for these was not consistent. It should be further noted that at the time of feed-in tariff design (2009), a reference 2.6 kWp system capital cost was estimated at £13,700, indicating a very significant price drop, even before feed-in tariff implementation.
It can be seen from the data that the rate of return in 2011 was particularly attractive as the installation costs of PV systems fell, whilst the generation tariff peaked at 43.3 p/kWh. Both before and since then, the rate of return has been fairly constant between 8% and 10%. Toward the end of the research presented here, another consultation commenced [
30], with the policy under discussion being to cut the rate for rooftop PV to 1.3 p/kWh, a large change from the rate implemented in April 2010 (43 p/kWh in today’s terms allowing for inflation). The effect of the feed-in tariff and changes to it on patterns of adoption form the core of the research presented here.
3. Results
In this section, data from the UK feed-in tariff registration database [
31] are used in the analysis of the pattern of adoption for domestic PV. Firstly, the aggregate spatial and temporal pattern of adoption to date is presented, followed by an analysis of the evolution of those patterns to date being undertaken. The implications of those characteristics on the grid as a whole and pathways to a smart grid are discussed in
Section 4. The method of analysis was to import the data to an SQL database and then to group the data by spatial unit (the code used to perform this data manipulation is available from the URL specified in
Appendix A). In the analysis presented, postcode districts (PCDs) were used as the unit of spatial disaggregation. For each PCD, the pattern of adoption over time was calculated in terms of: (A) Number of systems adopted. (B) Capacity of systems adopted. (C) Number of adoptions per 1000 households. (D) Capacity per 1000 households. (E) Percentage of households with rooftop PV.
Visualisations in the paper explicitly state which variable is being presented, where appropriate video representations and code used to generate visualisations are available (URLs provided in
Appendix A). Note that analyses for the number and capacity of systems exhibit almost identical patterns, as the vast majority of domestic consumers install very similarly-sized systems.
3.1. Aggregate Spatial and Temporal Patterns of Adoption to October 2015
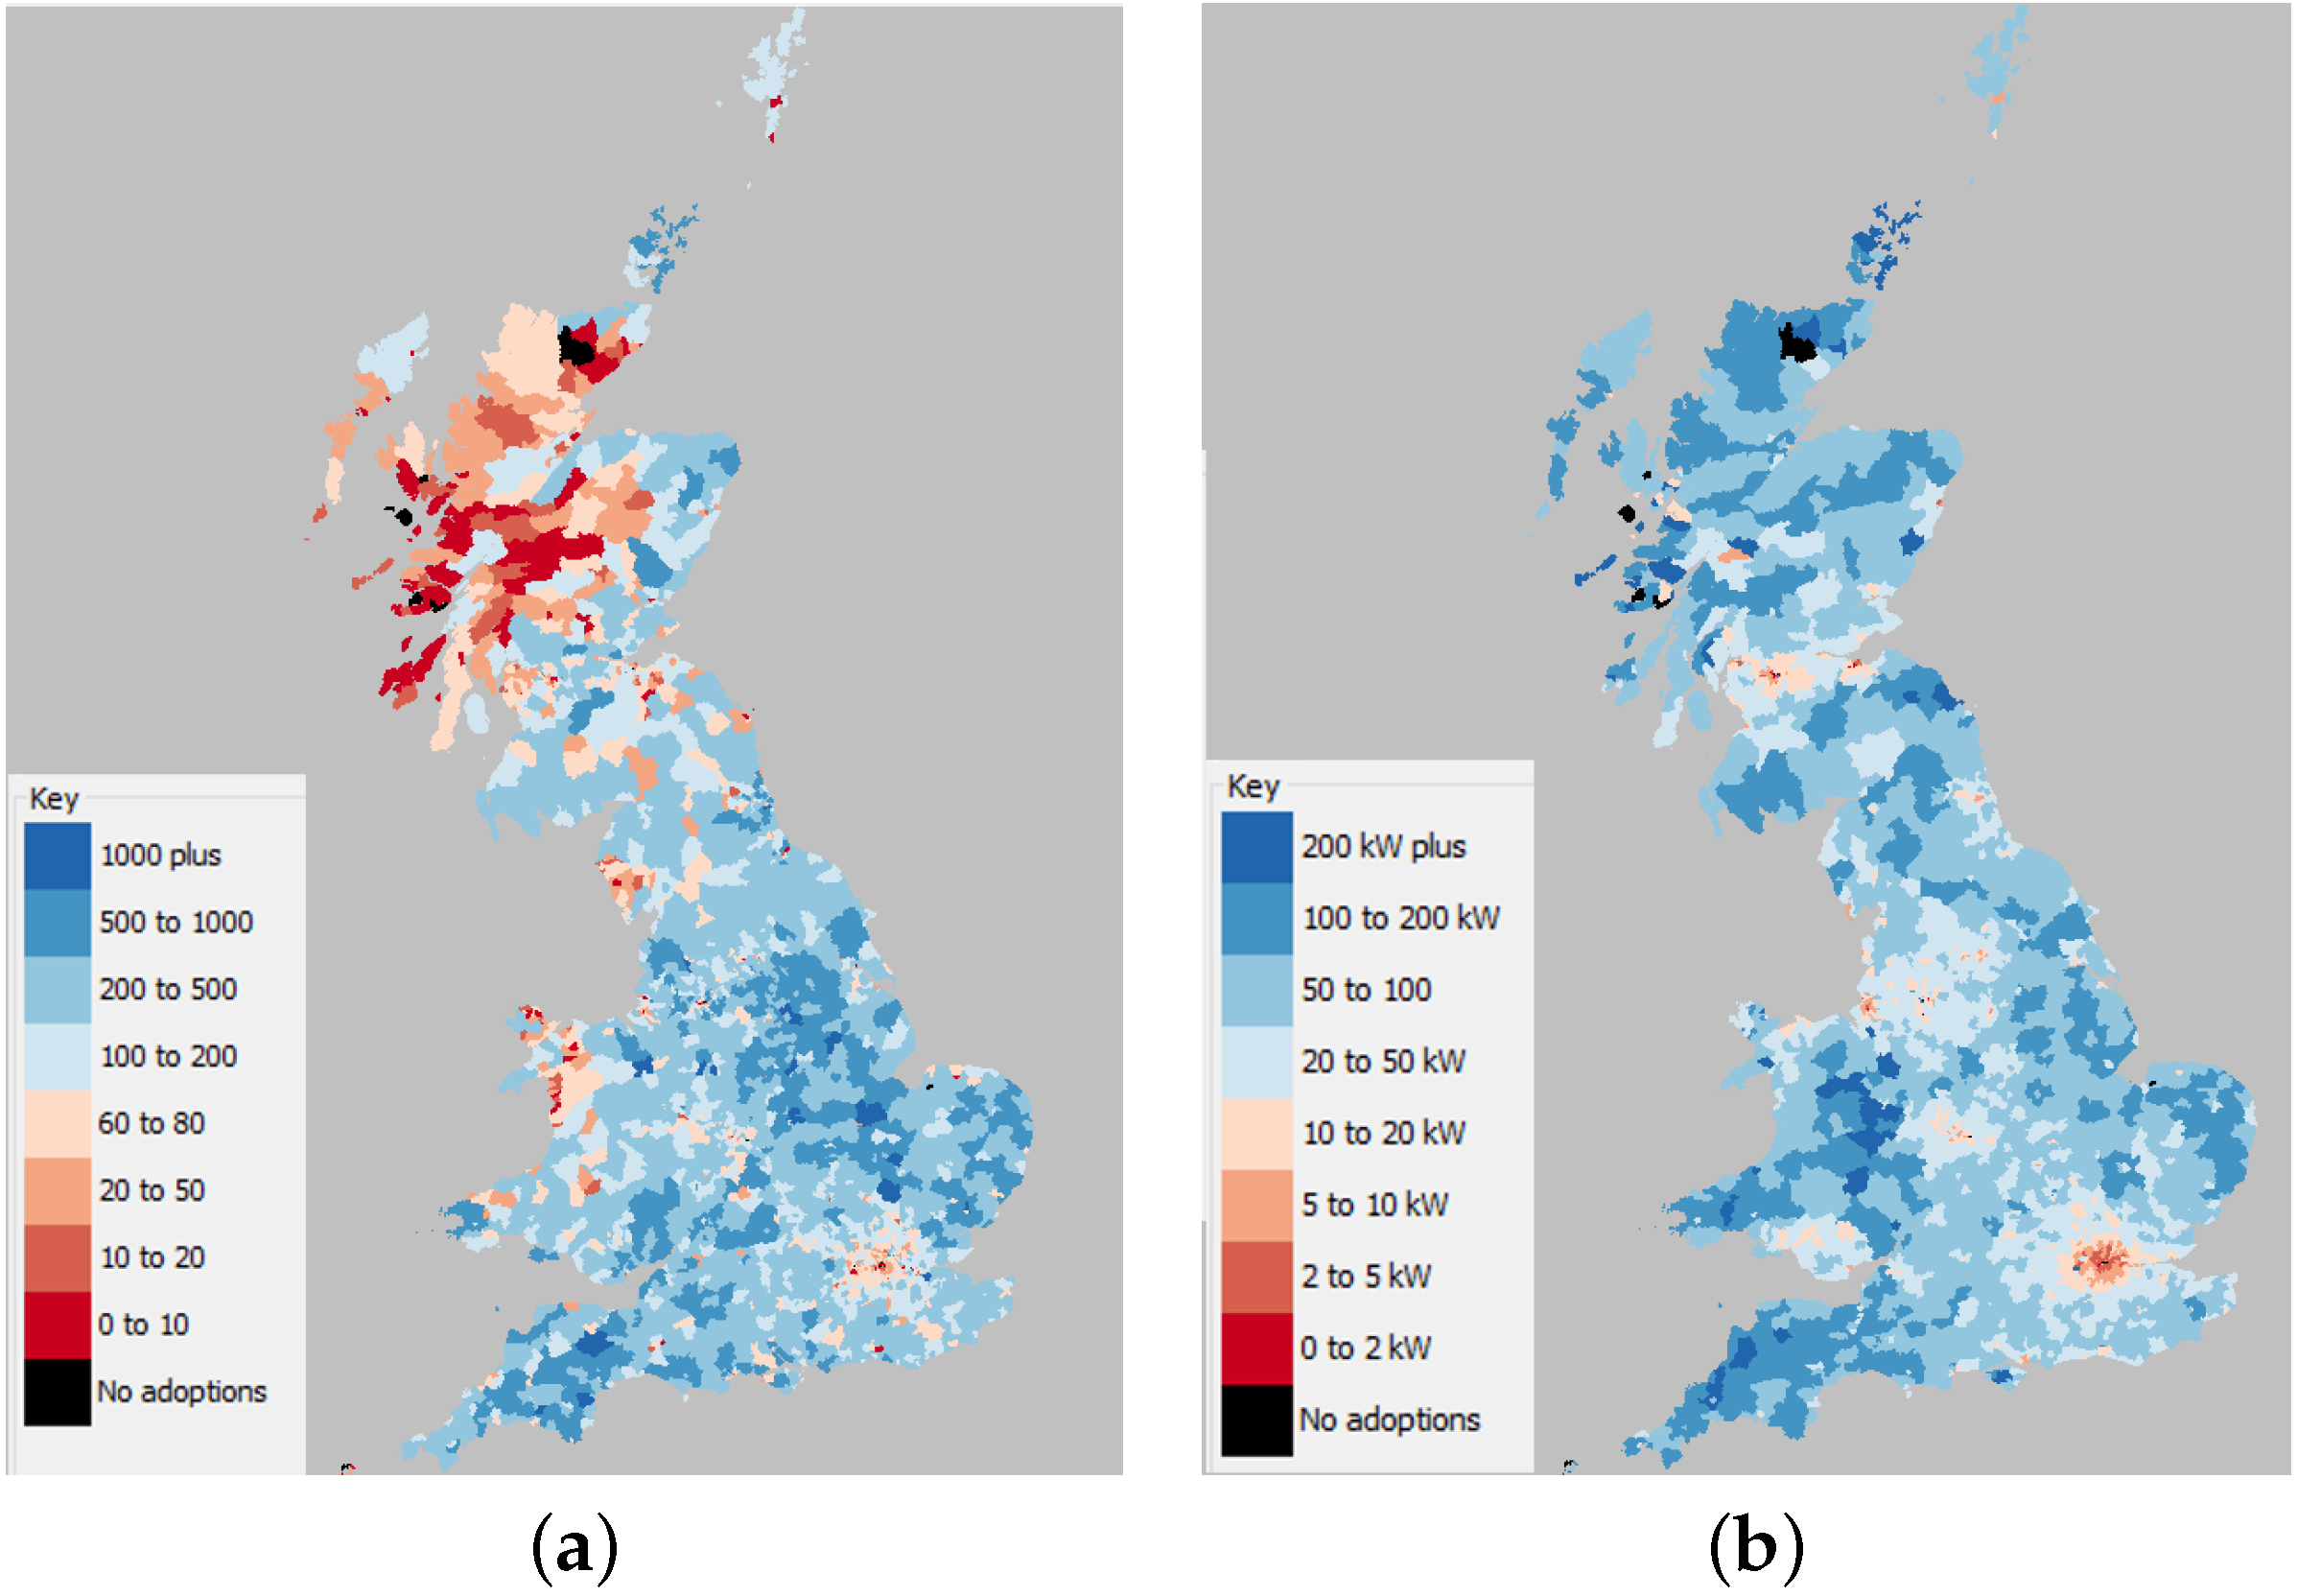
The spatial distribution of both the number of domestic PV installations (
Figure 2a) and the capacity density (
Figure 2b) illustrates a lack of adoption in urban centres, particularly around large cities, such as London, Birmingham, Manchester and Liverpool. This might be expected, as rooftop areas for installation are at a premium, in combination with a high population density, leading to high instances of multiple households within one physical building. The distribution also highlights the high number of installations in the southwest of England, and the capacity density plot (
Figure 2b) shows the relatively higher capacity density in very rural areas with low population density, again including the southwest of England, but also showing high capacity per person in mid-Wales, some parts of rural Scotland and East Anglia.
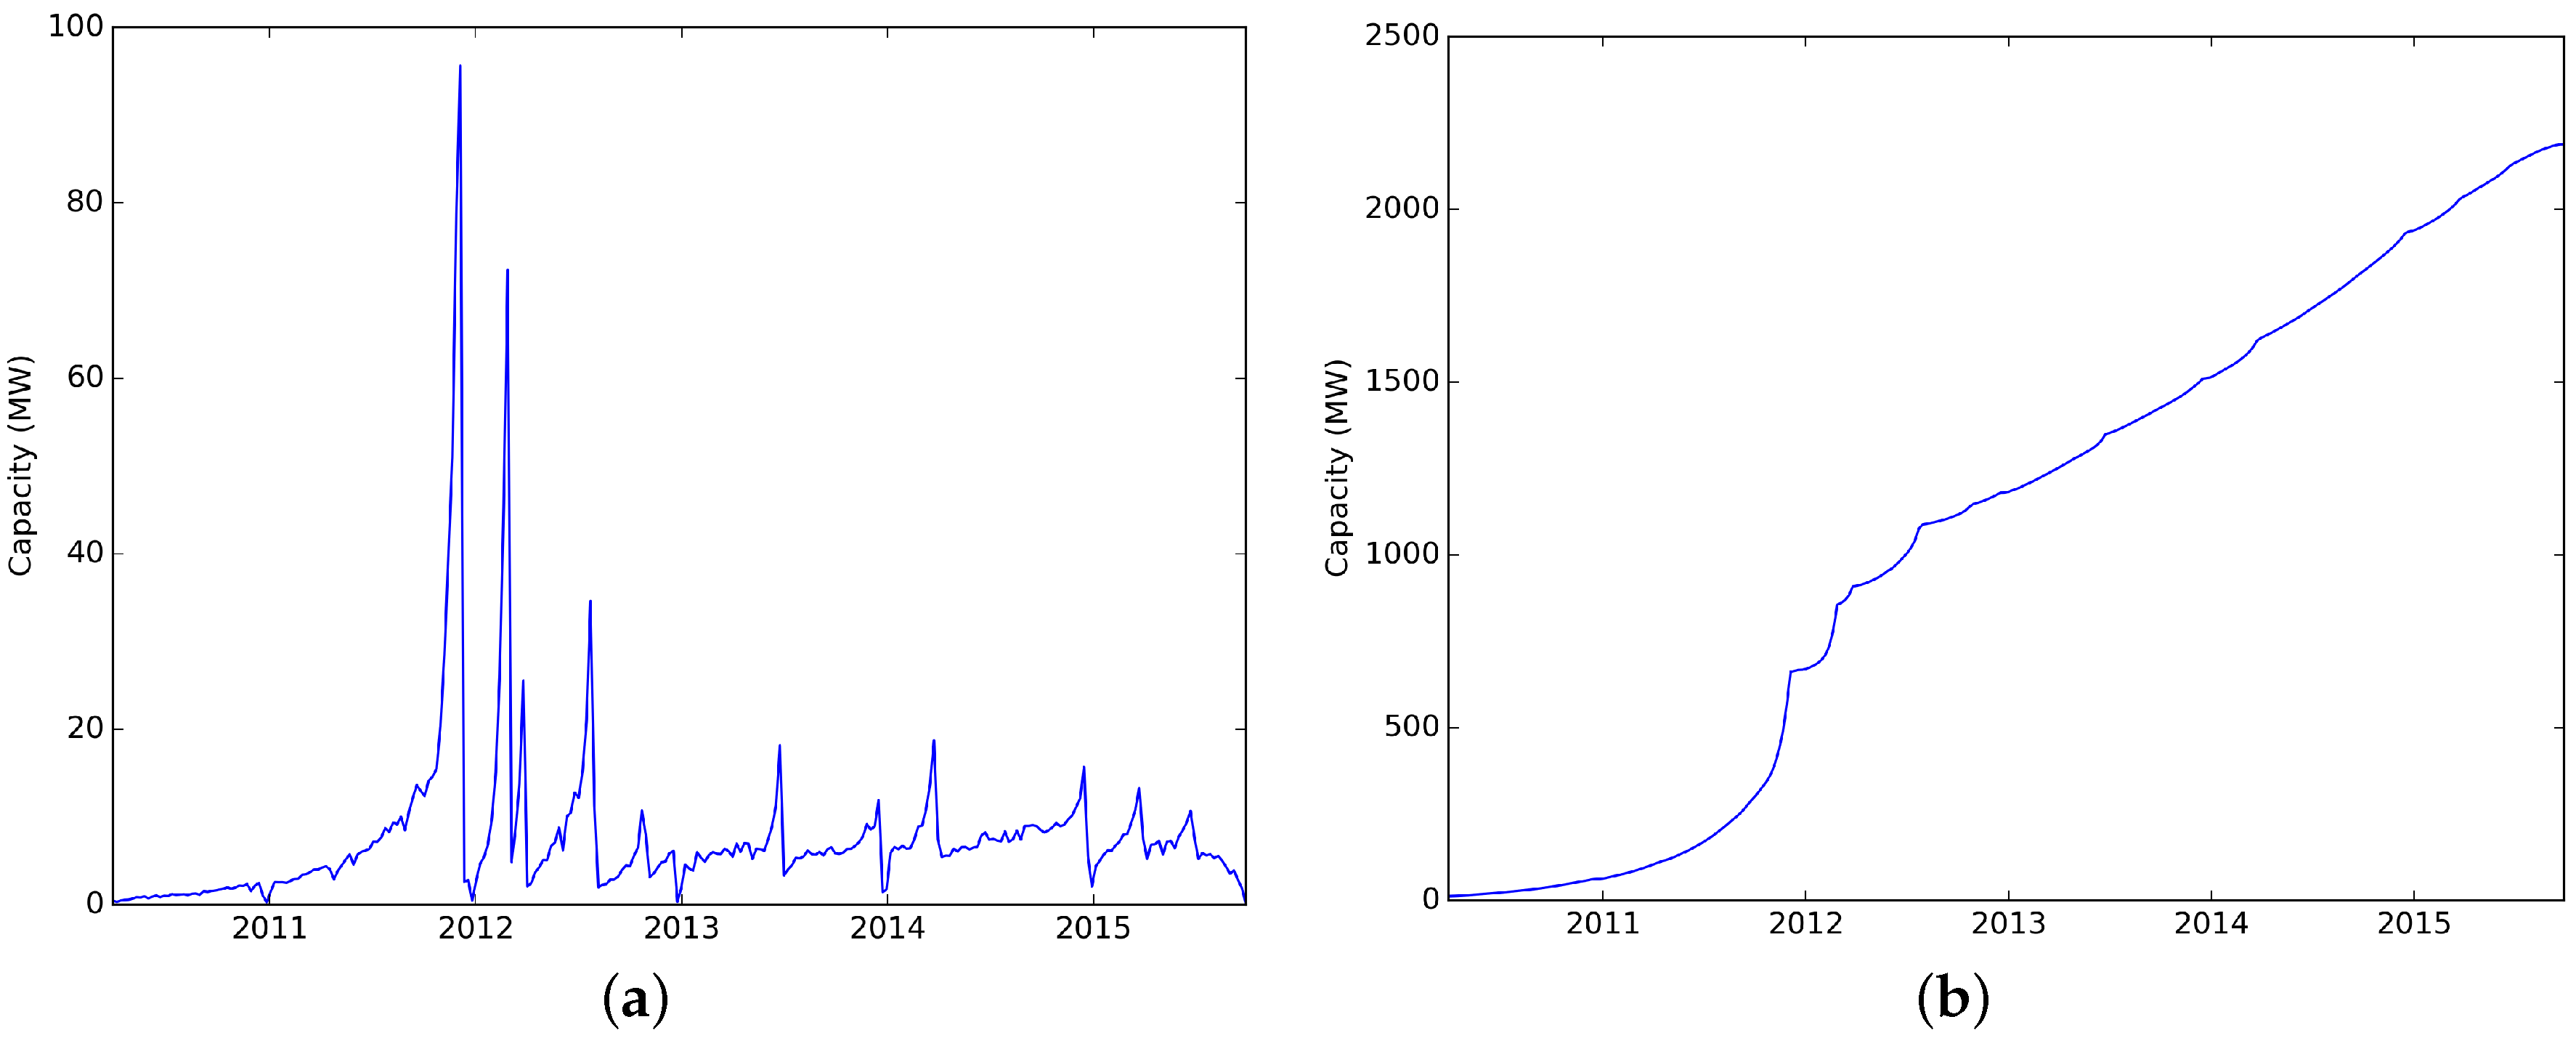
The temporal distribution of installations shows large spikes in the installed capacity of domestic PV in the early years of the feed in tariff policy (
Figure 3a), followed by a period of roughly linear growth between 2013 and October 2015 (
Figure 3b).
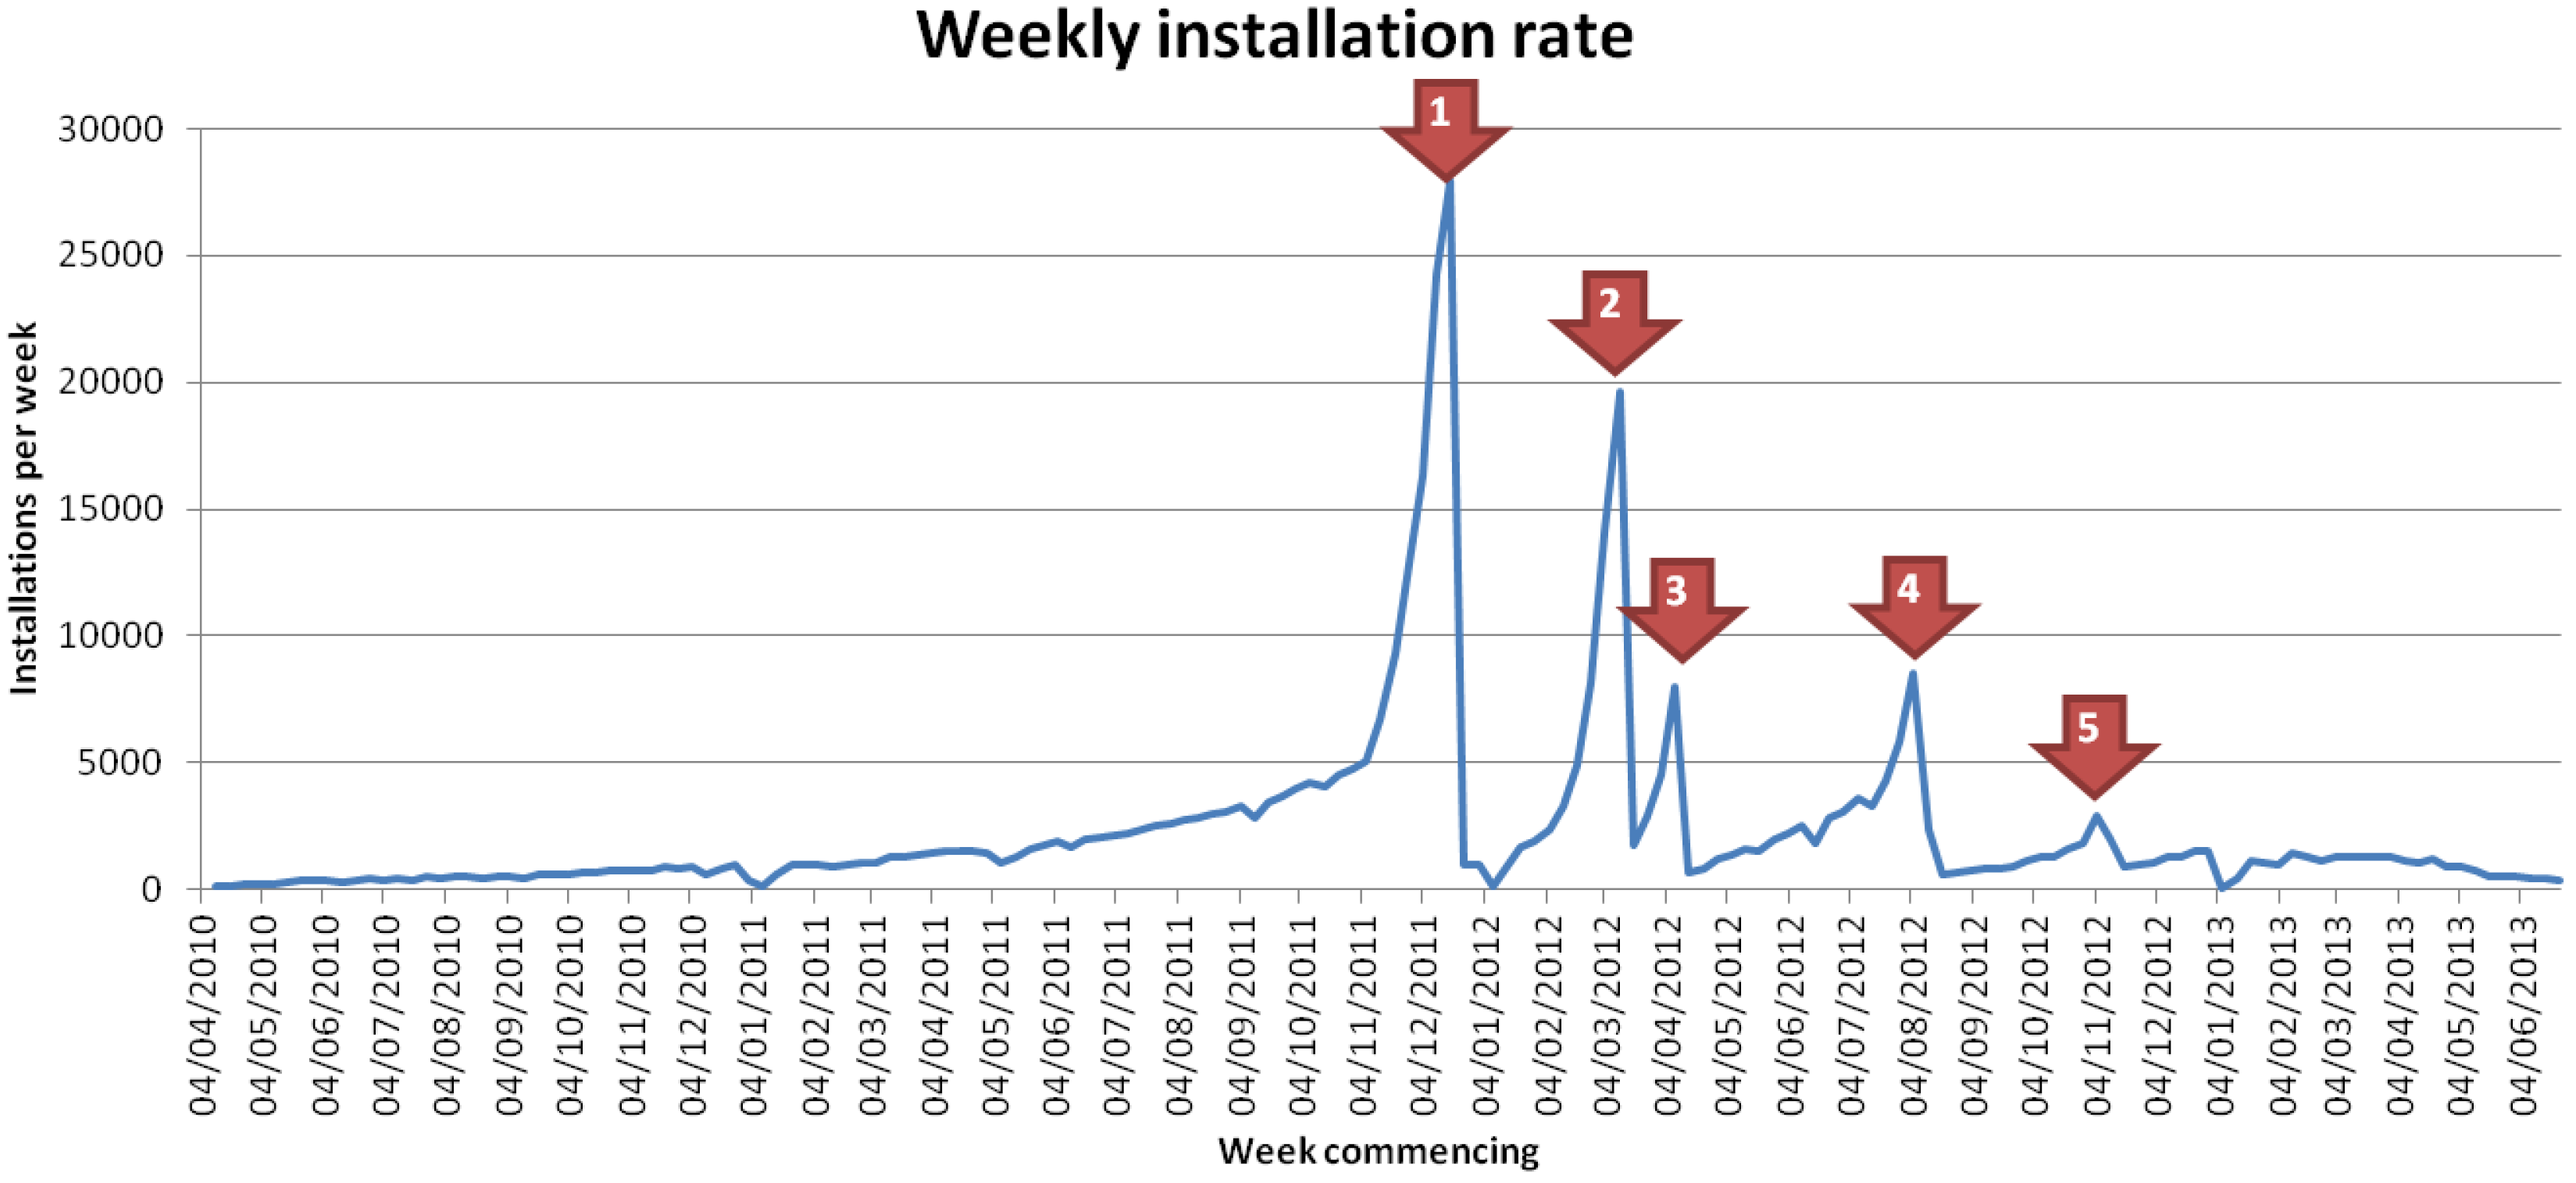
An analysis of the dates of the spikes in adoption reveal that the first (and largest) spike in the rate adoption started in the week commencing 6 November 2011 and reached its peak in the week commencing 11 December 2011 before collapsing in the week commencing 18 December 2011. This was followed by a similar pattern (albeit smaller scale) repeated four times (
Figure 4 and
Table 1).
This pronounced pattern was found to coincide with the announcements of policy changes in the feed-in tariffs (
Table 2). Rates of adoption were slightly higher than predicted by January 2011, likely due to the very attractive rate of return at that time (
Figure 1b), and concern about the take-up triggered the announcement of the Fast Track Review of feed-in tariff levels [
23]. Although this higher than expected adoption existed prior to the announcement of feed-in tariff review, it is notable that the largest spike (1 in
Figure 4) was generated by the announcement of changes following the Fast Track Review and perceived rather than actual loss of benefit, as the actual change to feed-in tariff rate did not occur on the announced date, 12 December 2011, due to a challenge to the legality of retrospective changes to tariffs [
24]. This highlights the fact that, despite the strong economic rationale behind trying to install a system before detrimental changes were made to the tariff rates, the spikes cannot easily be modelled using classical rational economics techniques, as on the face of it, nothing has changed in the rational evaluation of the case for installing PV prior to December 2012. This also highlights the influence of the mass media on adoption rates, as the prospective changes to tariff rates were highlighted by the mass media (e.g., [
32]).
3.2. Spatial Data over Time
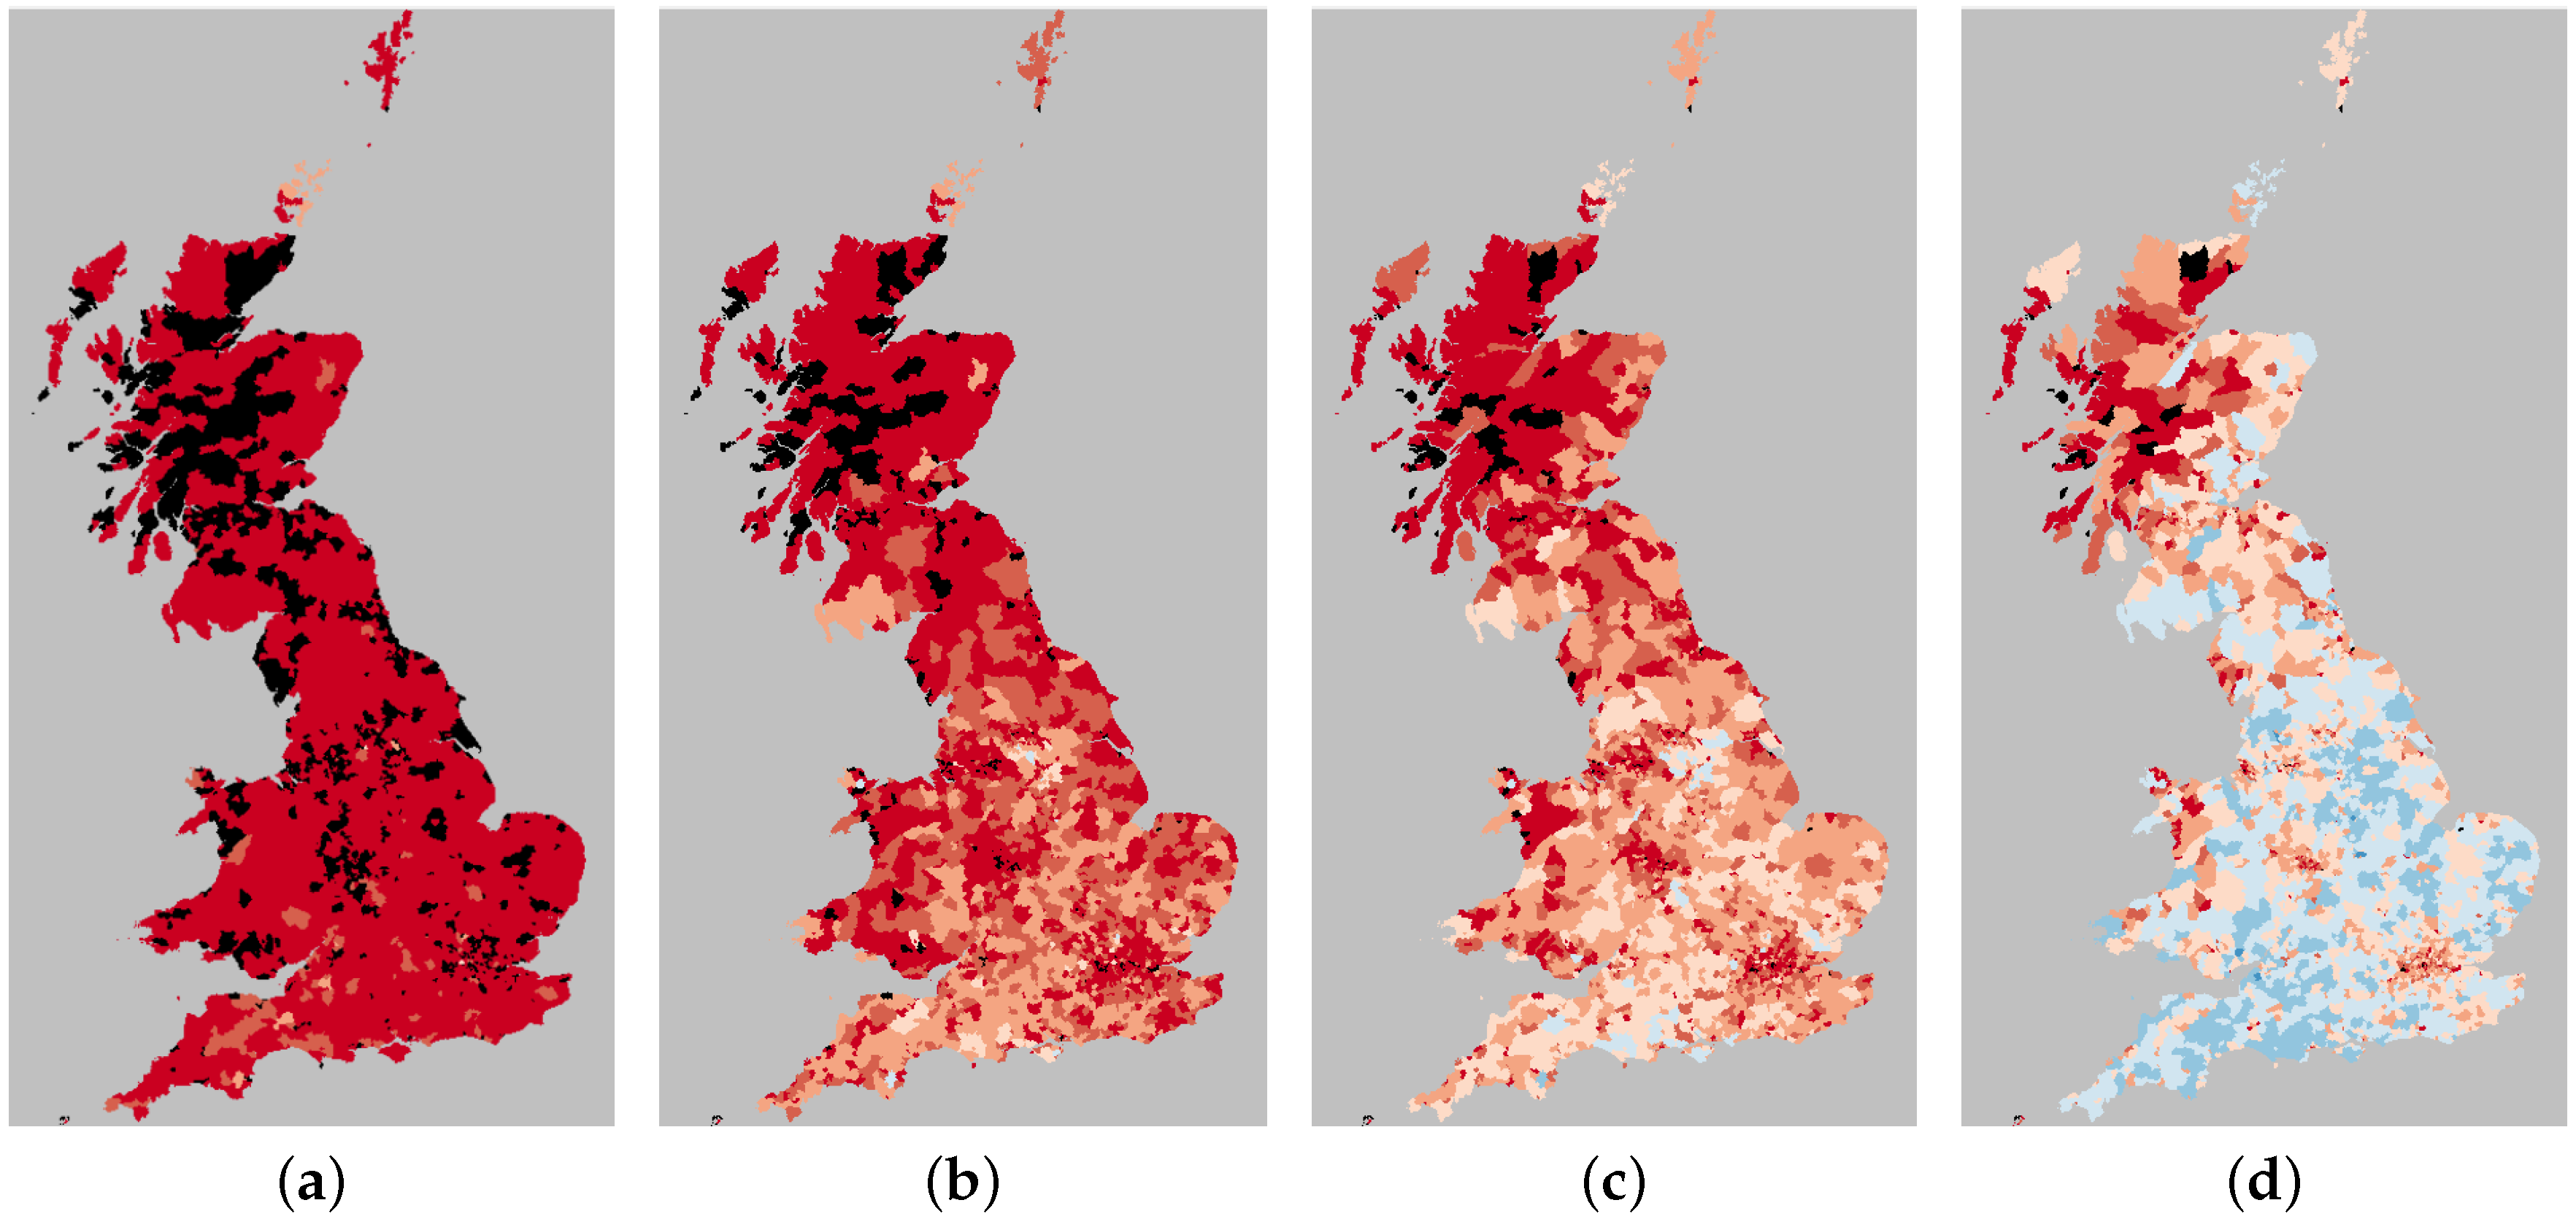
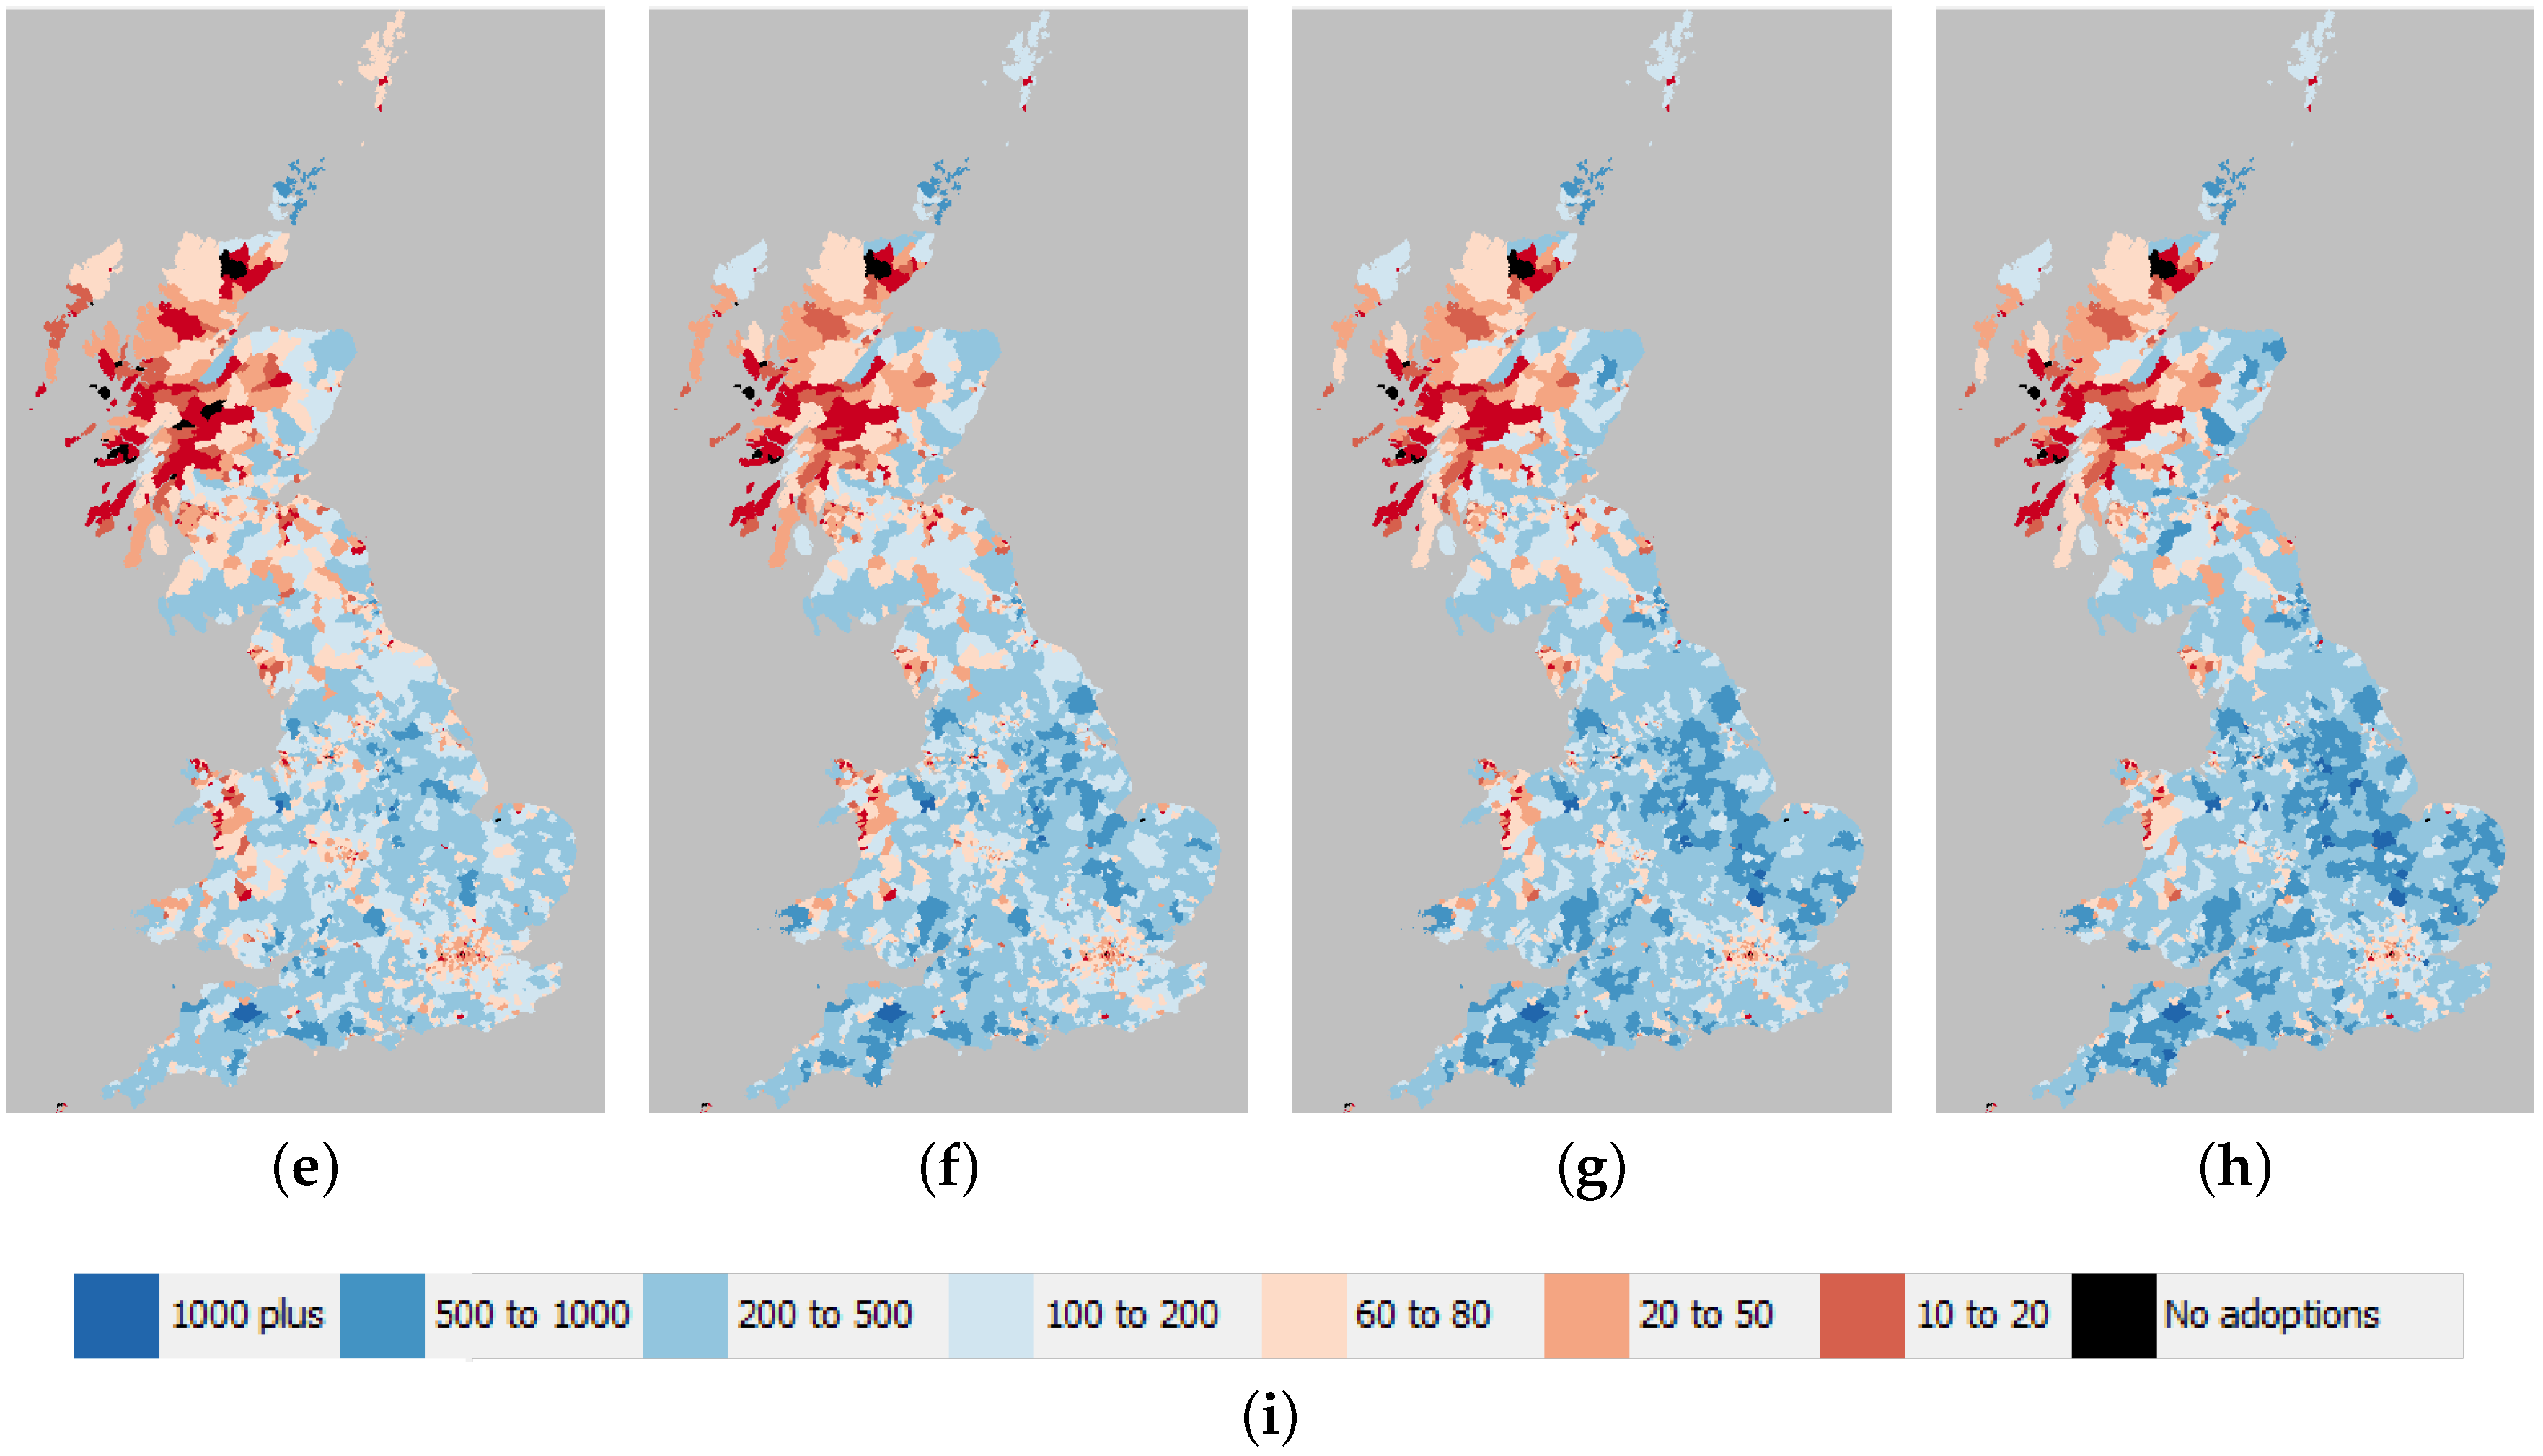
A spatial analysis tool was developed that could plot the quantities (A)–(E) for every spatial unit for each day between 1 January 2010 and 1 October 2015 on a map of the UK This tool provides visual information about the evolution of the spatial distribution of installed PV, which may be intuitively interpreted (
Figure 5a–h). The tool can also construct video to run this distribution over time, providing a speeded up view of the evolution of the spatial distribution over time. These videos are available for download, and the code and data to generate them are made available as open source (see
Appendix A). Such visualisations are an invaluable tool in communicating complex information, such as the evolution of a spatial distribution over time across multiple disciplines.
The evolving spatial distribution of installed capacity shows that early clusters of installations in the southwest of England (lighter shades in
Figure 5a) continue to have high installed capacity throughout; they are amongst the first PCDs to have over 100 installations per PCD (blue regions in
Figure 5c) and some of the few PCDs with more than 1000 installations at the time of writing (
Figure 5h).
3.3. Temporal Data by Spatial Unit
As well as the variation of the spatial distribution of PV capacity over time, the temporal distribution of adoption in each smaller spatial unit was determined. The technique used for evaluating the similarity between adoption patterns in different areas was ordinal pattern analysis (OPA) [
33]. OPA is based on the principle that what matters when matching longitudinal (time series) data is whether the
ordinal rather than
cardinal characteristics of the series are in some statistical sense similar. In other words, it in concerned with how similar the shapes of two time series are, rather than comparing the absolute magnitudes of their differences.
Using OPA, the time series of adoptions per week for each PCD were compared to time series of adoptions per week across the whole of the UK until June 2013. This analysis revealed that 2545 of the 2678 PCDs with any PV installed were similar to the overall trend with p < 0.05. This means that less than 5% of the PCDs in the dataset appear to have a significantly different ordinal pattern to the pattern observed at the national level. From this, we can say that 95% of PCDs are significantly similar to scaled down versions of the national pattern, although the absolute magnitude of the capacity installed is, of course, different.
3.4. Spatio-Temporal Characteristics
The snapshots of the spatial visualisations provide visual information about how domestic PV capacity is distributed around the UK and how that has evolved, in a format that can be intuitively interpreted. It is clear that in general terms, embedded distributed generation in a domestic setting is located away from centres of high electricity consumption (the major conurbations). To formalise the analysis of this observation requires statistical methods to examine the degree to which clustering exists and how that clustering is distributed across the country and to analyse the evolution of these over the snapshots in time presented above. Such an analysis allows for hypothesis testing against the null hypothesis that no clustering exists and testing for a change in the nature of the spatial distribution over time. Moran’s
I [
34] is a statistic describing spatial autocorrelation and gives an indication of whether spatial clustering exists. Negative values indicate negative spatial autocorrelation and the inverse for positive values. Values range from −1 (indicating perfect dispersion) to +1 (perfect correlation)
Local indicators of spatial autocorrelation (LISAs), proposed by Anselin [
35], take the analysis of spatial clustering a step further by establishing what type of clusters exist and how strong of a spatial correlation exists at each local geographical area. The spatial statistics used in the following analysis were generated by the GeoDA software [
36]. To perform clustering analysis, neighbours for each region must be defined. These are defined as spatial weights, and in this analysis, only directly adjacent neighbours were used (order of contiguity = 1), while neighbours touching only at a single point were included (Queen contiguity). The weights were generated using the GeoDA software.
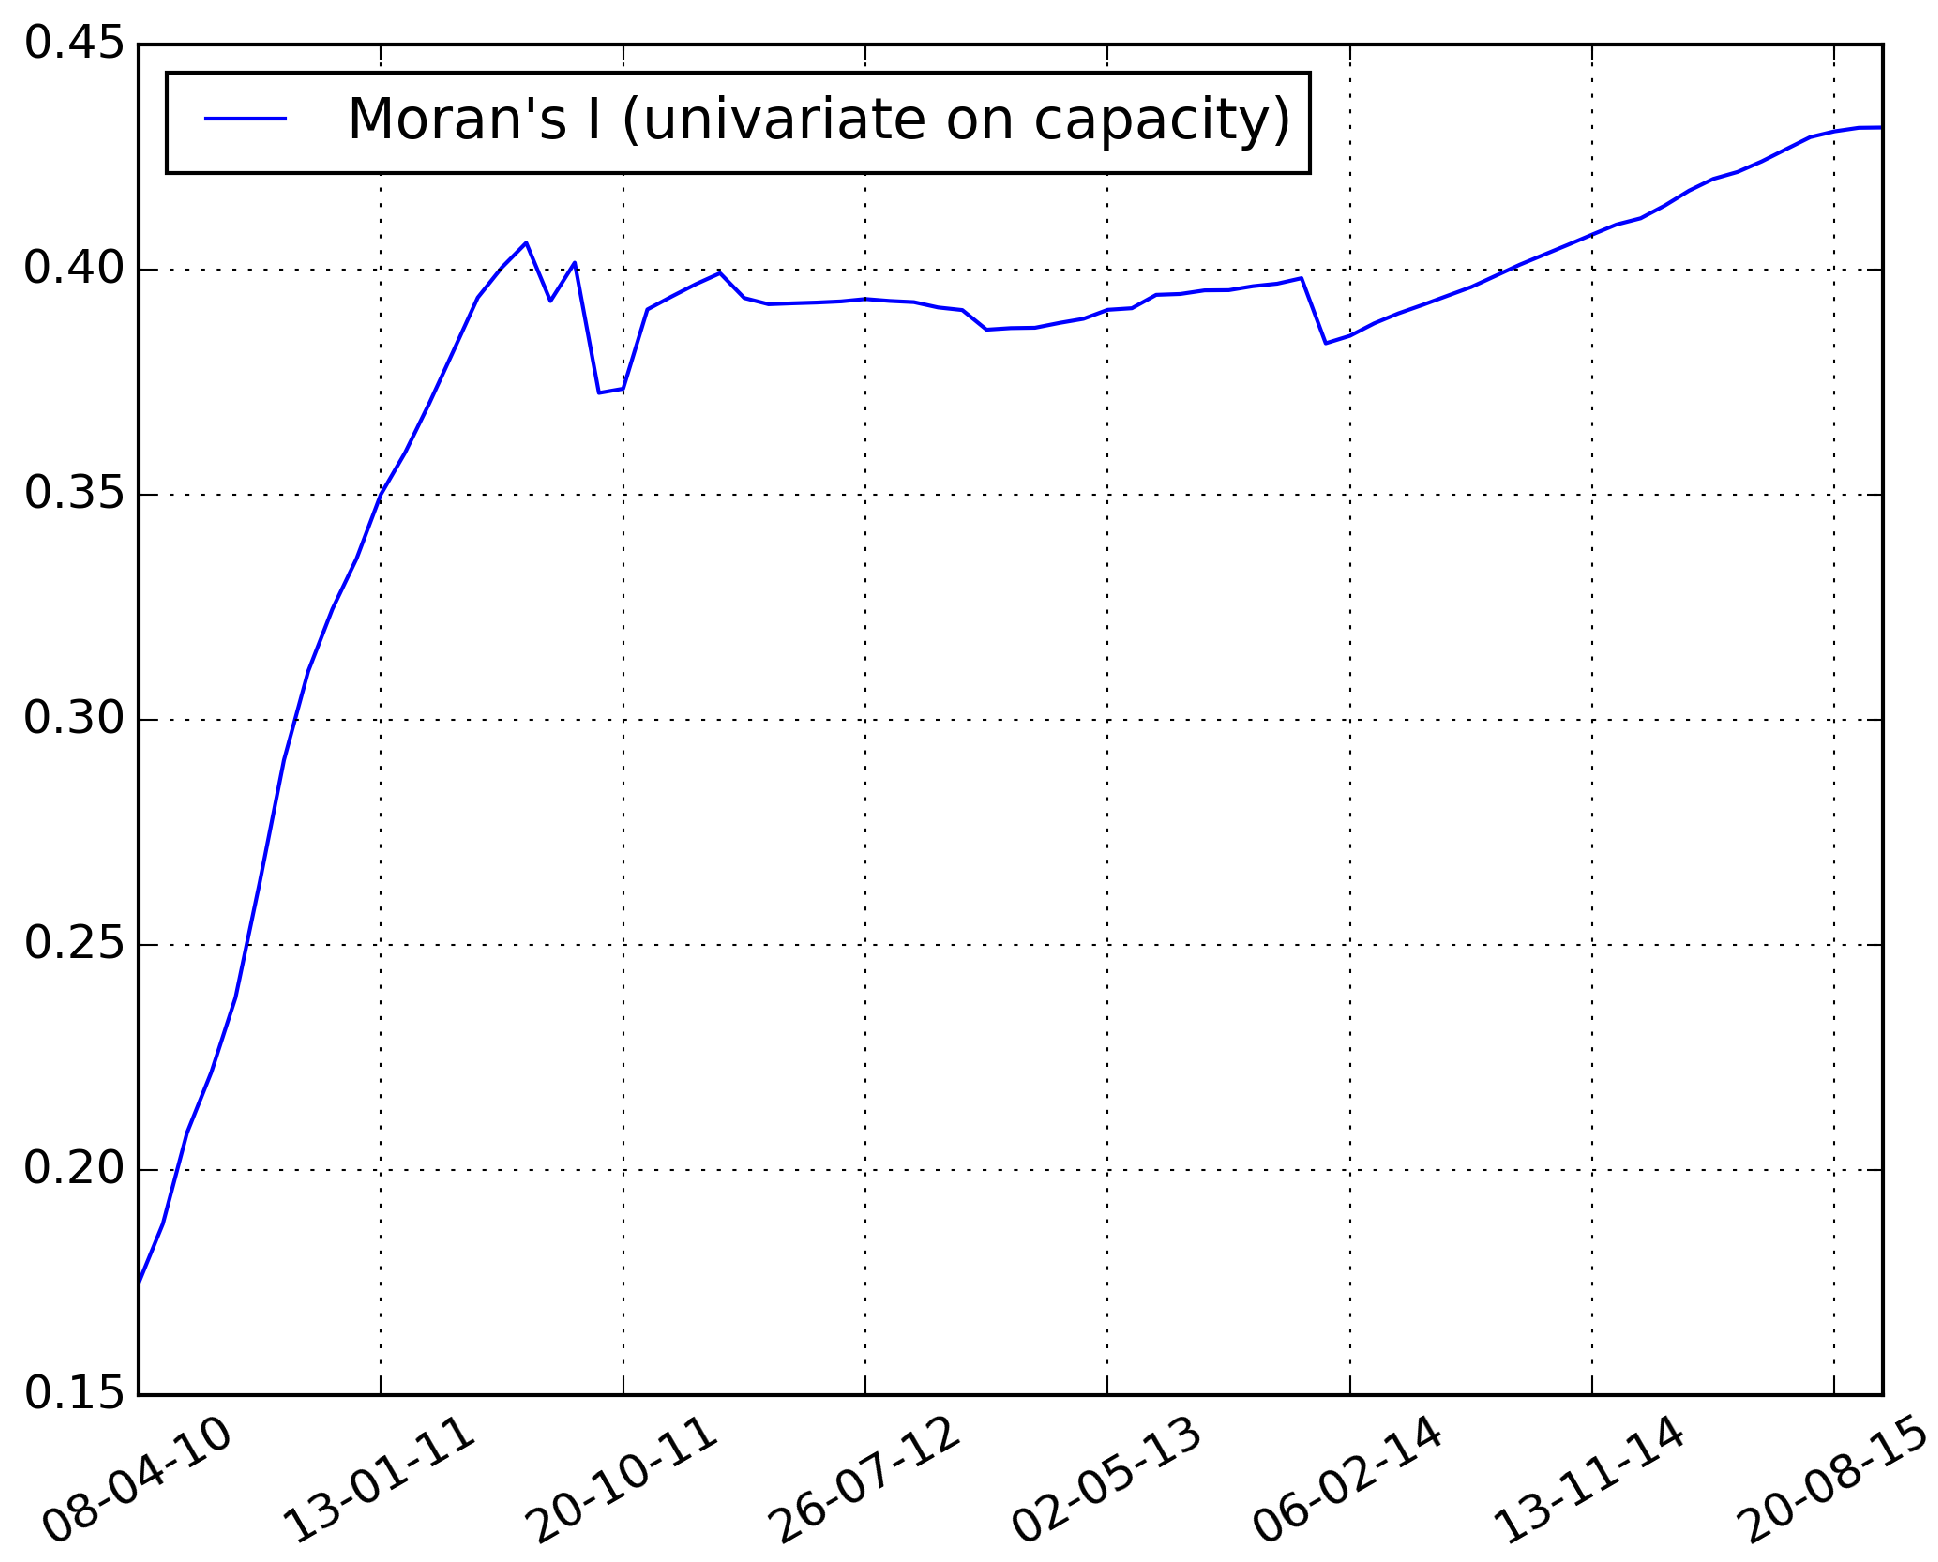
Firstly, Moran’s
I was calculated based on the capacity of domestic PV installations in each PCD at four weekly intervals between 1 April 2010 and 1 October 2015 (
Figure 6). This result indicates that the positive autocorrelation of the spatial distribution of PV installations at the PCD level has been significant throughout the life of the feed-in tariff and that the clustering effects increased over time.
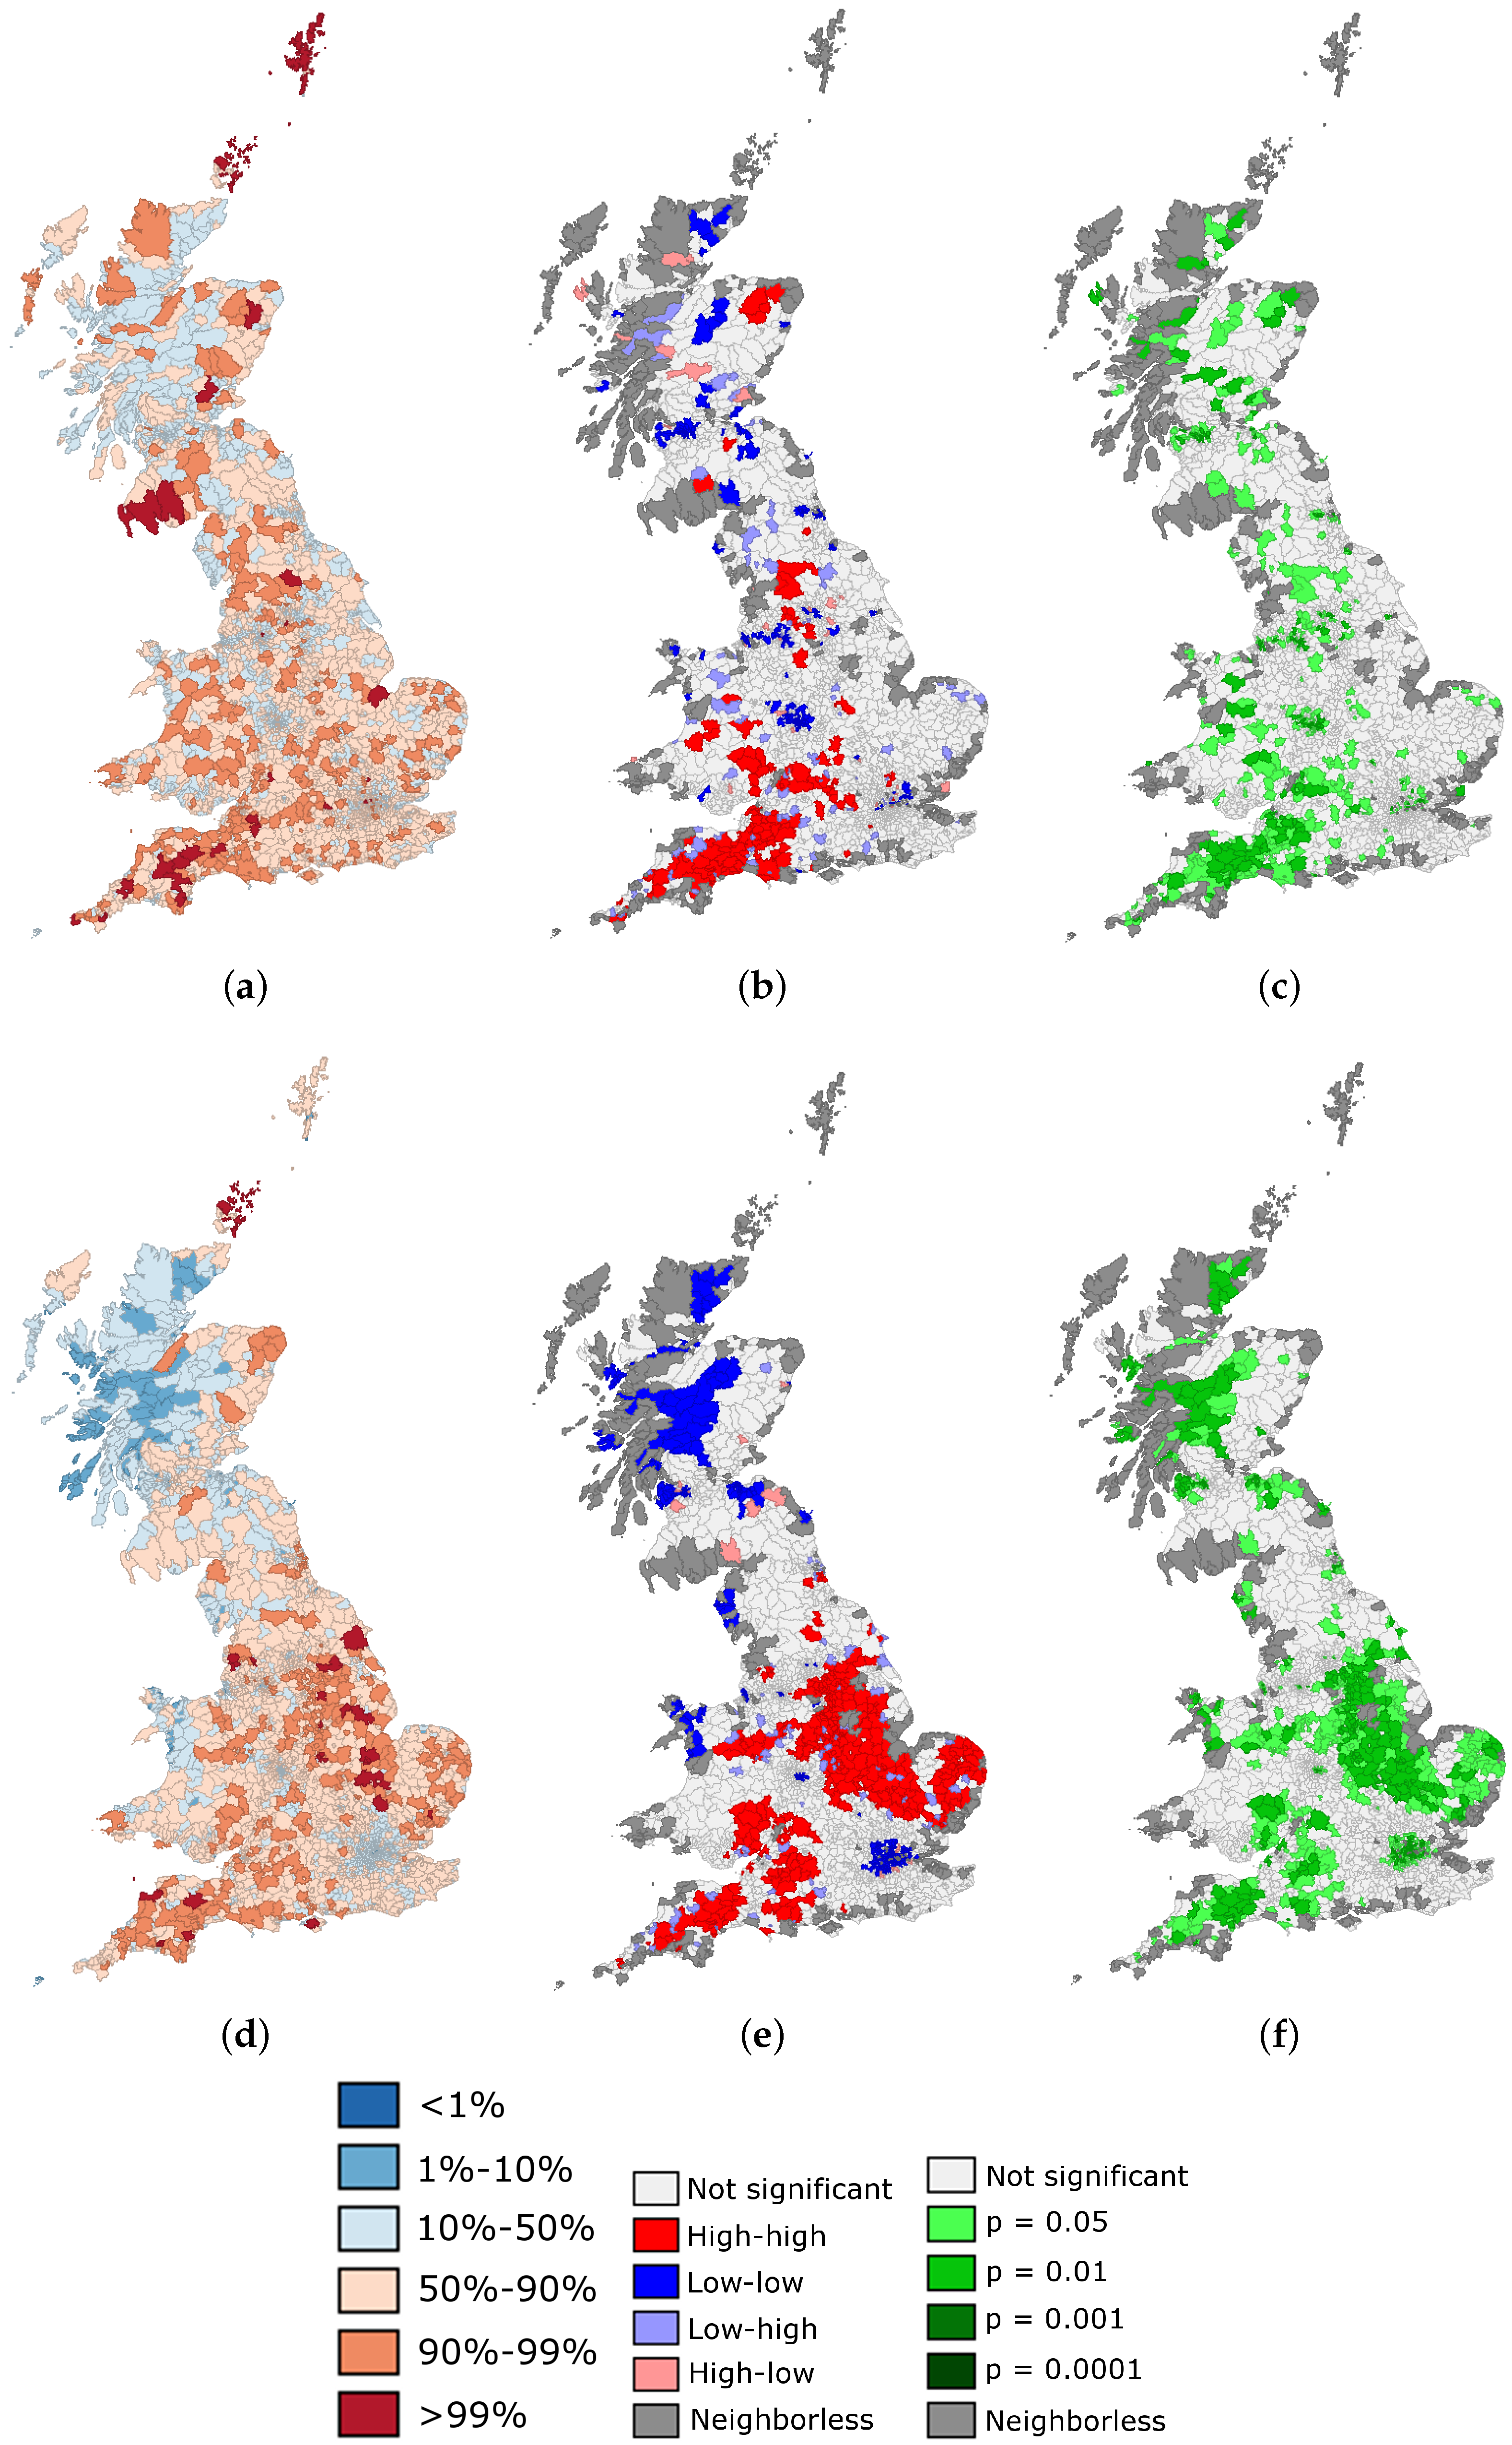
To further investigate the clustering, percentile plots of capacity per PCD were produced at the start of the feed-in tariff scheme (
Figure 7a) and at the time of writing (
Figure 7d). These plots give a normalised view of the distribution of PV across the UK, showing that the southwest of England remains an area of high installed capacity and indicating that a further area of high installed capacity has emerged in the east of England. LISAs were produced to illustrate and describe statistically the geographical position and strength of the clusters over time. Firstly, these show the locations of clusters and the type of cluster (
Figure 7b,e).
Secondly, the pseudo
p-value (
i.e., how likely it is that local spatial autocorrelation does not exist) is produced (
Figure 7c,f). These confirm that the areas of high-high clustering in the southwest and east of England and the area of low-low clustering around London, Birmingham, Manchester and Liverpool have high significance.
The combination of LISA analysis plots shows that there are clusters of low capacity in and around London and (to a lesser extent) around the other large conurbations. They also demonstrate that there has been a consistent cluster of high capacity in the southwest over time, with clusters of high capacity in the east mid-lands and South Yorkshire emerging over time.
4. Discussion
The data analysis shows that there is spatial autocorrelation (clustering) in the adoption of solar PV under the feed-in tariff and that this effect increases over time (
Figure 6). The pattern in absolute numbers and capacity of adopted PV over time shows spikes in adoption, followed by a steady rate of adoption from 2013 to date (
Figure 3a). While the rate of return (
Figure 1b) provides some explanation of the rate of adoption, the changes in the rate of return alone are not sufficient to explain the very sharp spikes in adoption, which clearly correspond to policy changes designed to lower the tariff available for PV installations.
The position of clusters of low PV uptake (both in terms of number and capacity) is centred on large conurbations. This again indicates that factors other than the calculation of rates of return by households are present; such calculations would be expected to lead to a rather even distribution of installations, perhaps with a bias toward the southwest, where higher expected levels of insolation would lead to a better localised rate of return.
4.1. Energy Balancing Implications
The large increase in PV capacity has implications for load balancing on the distribution network, as well as other technical considerations, where surges of generation could potentially alter the apparent power factor, disrupt voltage regulation or, in the extreme, reverse power flows on rural feeders with larger installed generation capacity. Dynamic tariff schemes that take into account the benefit (or disbenefit) of embedded generation at particular times, particular locations on the grid or in particular loading conditions could be envisaged, where local balancing services for real or reactive power could be rewarded. A detailed discussion of these technical factors is beyond the scope of this paper; however, they must be considered in any visions of smart grids that rely upon local energy balancing with embedded generation for feasibility.
In terms of larger scale technical disruption, the transmission system operator (National Grid) has stated that:
“Up to a penetration of around 10% of households or 10GW of generation, solar PV can be accommodated on the system without making the operation of the transmission system significantly more difficult.”
As yet, the increase is within those limits, and the transmission system operation is not affected. However, in local areas of high capacity, voltage regulation effects have been observed by distribution network operators (DNOs), and DNOs are increasingly concerned with understanding local installed renewable capacity and increased loads that could be imposed by further low carbon technology adoption, such as heat pumps or electric vehicles.
The spatial distribution of capacity density (
Figure 2b) demonstrates most clearly that in densely-populated areas, where demand is concentrated, there is a lack of feed-in tariff incentivised micro-renewable generation. This implies that technically, visions of locally-balanced supply and demand may be feasible in rural areas, but for micro-generation to be used to offset demand in urban areas with high population density, large infrastructure investment would still be needed to transmit electricity from (rural and suburban) areas with high PV capacity to urban centres with high demand. This presents a challenge for visions of a highly decentralised smart future electricity network.
At the larger scale, if the spatial distributions found in this research are characteristic of other low carbon technologies and local balancing is not possible, then renewable generation from one part of the country will need to be used to offset demand in another. In the presence of, for instance, large electrical heating loads or electric vehicle charging, the full extent of transmission network costs that a smart grid hopes to avoid may not be realised, even if adoption of smart technology and embedded generation is high.
4.2. Socio-Psychological Factors
The analysis of temporal patterns of adoption suggests that the perceived urgency of the decision to adopt has a marked effect on the likelihood of adoption when a household considers adopting PV. This factor is observable in the time series analysis conducted as part of this research as peaks in adoption rates clearly coincide with imminent tariff rate changes and associated mass media coverage. This has implications for future policy design aimed at incentivising the adoption of technology necessary to enable a smart grid as a key component of a future low carbon sustainable electricity network. In particular, models of impact that take into account observation factors, perceived hassle of installation and effects of policy change explicitly may be beneficial to understanding the full range of adoption scenarios and their impacts at the policy design stage.
In addition, the clustering of areas of high adoption and the increase of that clustering over time suggest that observation of peers’ adoption and the perceived social norm concerning ownership of PV have a significant effect on adoption. With PV, this could be a strong reinforcing factor for adoption, as PV is an easily observable technology. The potential importance of this factor could have implications for the adoption of less easily observable technology necessary to implement a smart grid, for instance electrical heating or smart controllers. As a consequence, as adoption continues, the increase in the number of PV systems deployed alters the context for prospective adopters as the perceived social norm of adoption becomes stronger. This reciprocity can produce the accelerations in adoption observed in the time series analysis.
4.3. Implications for Policy and Smart Grid Visions
Policy impact analysis for the feed-in tariff relied on a combination of neo-classical economic models and (somewhat implicitly) theories of diffusion of innovation (
Section 2.1) in order to predict the likely uptake of PV under the feed-in tariff. This is the usual approach to impact assessment, but in this case, it was not applicable (see
Figure 3b). When adoption beyond that predicted by the impact assessment was detected, policy change in the form of incentive reduction was enacted, which had the unintended effect of stimulating rapid adoption.
The importance of socio-psychological factors in the household decision making process with respect to smart grid-related technology has implications for policy design. In particular, policy design could benefit from impact modelling that takes explicit account of the factors highlighted in
Section 4.2. As it is the stated intent of policy and strategy to move toward smart grids as a component of the transition to a low carbon, sustainable electricity network (
Section 2), it is important that policies designed to implement such a transition treat the electricity supply system as a socio-technical system and consider the context and social constraints for potential adopters alongside the hard economic benefits of adoption.
In terms of the electricity transition and smart grid visions reviewed in
Section 2, widespread domestic PV adoption fits most easily into the
Thousand Flowers view of transition, which is itself congruent with the
Groundswell vision of a smart grid. Both of these visions focus on a bottom-up transition to the smart grid, with local balancing of supply and demand, a focus on local infrastructure and adoption of embedded microgeneration. While this research finds that the last is happening to a degree, the models runs also show that adoption is potentially subject to wide variation, even under similar assumptions about adopter behaviour. The data analysed also provide some support to the view that there is a strong relationship between the adoption and observability of the technology. For PV, this was a spur to adoption; however, it does not bode well for less observable technologies, such as smart controllers or heat pumps. Finally, the spatial data analysis suggests that areas of high adoption are far removed from areas of high consumption, suggesting problems for visions of future scenarios that avoid grid reinforcement costs by balancing supply and demand locally.
5. Conclusions
The data clearly show that adoption of domestic PV in the UK has occurred at a rapid rate following the introduction of the feed-in tariff, indeed at a rate faster than intended at the policy design stage. While some of this unexpectedly high adoption can be explained by falling prices of installed PV systems resulting from technical innovation in PV, the growing market and increased competition in the installation market (
Figure 1a), other factors affecting the speed and spatial distribution of adoption have been identified by this research.
The analysis presented offers insight into the evolution of the spatial distribution of micro-renewable capacity over time and, therefore, the current and potential contribution of micro-renewables to visions of a future smart electricity network. The distribution of embedded micro-scale renewable generation is clustered, and the concentration of domestic renewable capacity is spatially opposite the concentrations of domestic demand. Local indicators of spatial autocorrelation indicate this to be a robust trend over time. This clustering of adoption suggests that local conditions are important in determining expected adoption rates. The fact that clusters of high early adoption persist over time indicates that observation influences the adoption rate for PV under feed-in tariff incentivisation.
The time series analysis of PV adoption reveals the influence of both economic and non-economic factors on the adoption rate, as policy changes and ensuing media coverage triggered rapid rates of adoption before potential rate changes. The time series shows a pattern of adoption that is not adequately modelled either by neo-classical economic models, nor the S-curves of adoption typically seen when considering adoption under Rogers’ diffusion of innovation theory and its successors.
Taken in combination, the multiple factors affecting micro-scale renewable adoption suggest that policy design based purely on economic calculations and forecasting will be unlikely to consider the range of outcomes that may occur. This was the case with the feed-in tariff in the UK and triggered rapid re-evaluation of policy and the ensuing volatility in the adoption rate. From a commercial perspective, this volatility resulted in a large expansion of the domestic PV installation market and subsequent contraction with the loss of a number of major installation firms. This finding of course presents challenges for policy modelling, as the variety of influencing factors is hard to measure or predict. A model that accounts for a multiplicity of influencing factors is needed to understand the patterns of adoption for PV, and this suggests that similar models will be needed to understand the potential impact of policies designed to incentivise the adoption of other technologies necessary in visions of a future smart, sustainable grid. As these factors span social, psychological, economic and technical disciplines, it is very likely that any such model will require a multi-disciplinary approach to its design.
The fact that the concentration of micro-renewable capacity is located (in general) some distance from centres of concentrated demand suggests that visions of the future electricity grid based on highly localised balancing of supply and demand (either within the house or within small communities) will be likely to be viable only in rural or semi-rural areas, where demand is relatively spread and renewable capacity is high. In urban centres, where demand is high and micro-renewable concentration is low, it is likely that other scenarios, including business as usual network reinforcement, will be more likely to flourish. If over capacity from renewables in rural areas is to be used to balance demand from urban centres, the need to reinforce parts of the distribution or, potentially, the transmission network remain. Thus, the patterns of PV adoption observed to date do not support visions of the smart grid that rely on avoiding grid reinforcement costs by local balancing.
Further work is needed to explore options for the design of policies to incentivise the adoption of microgeneration (e.g., PV) or other smart grid technologies without some of the issues found in this research. Such further work will likely need to cross disciplinary boundaries. For example, from a techno-economic point of view, incentive policies based on the local marginal value of installed microgeneration, incentives based on the value of deferred investment in the system at large, dynamic time-varying tariffs or some combination of these could be investigated. In addition to these considerations, qualitative issues, such as the social effect of frequent policy change or the effect of observation among social contacts, should be incorporated into scenarios considered at the policy design stage.
Finally, the method and tools developed to conduct the research presented here can be used to examine the distribution of other indicators over space and time. This opens an interesting line of enquiry towards an understanding of the viability of future smart grid scenarios, which rely on spatial co-location of renewables with demand or a specific phasing of different technology adoption over time. Examples of data that might be investigated using these techniques include electric vehicle, electrical heating and smart home controller adoption; research into these areas is ongoing.


