Article

Evaluation of a Mixed Method Approach for Studying User Interaction with Novel Building Control Technology

by
Birgit Painter
1,*,
Katherine N. Irvine
2,
Ruth Kelly Waskett
1 and
John Mardaljevic
3
1
Institute of Energy and Sustainable Development, De Montfort University, Leicester LE1 9BH, UK
2
Social, Economic and Geographical Sciences, James Hutton Institute, Craigiebuckler, Aberdeen AB15 8QH, UK
3
School of Civil and Building Engineering, Loughborough University, Loughborough LE11 3TU, UK
*
Author to whom correspondence should be addressed.
Submission received: 8 February 2016 / Revised: 8 February 2016 / Accepted: 4 March 2016 / Published: 17 March 2016
(This article belongs to the Special Issue Multi-Disciplinary Perspectives on Energy and Sustainable Development)

Abstract

:
Energy-efficient building performance requires sophisticated control systems that are based on realistic occupant behaviour models. To provide robust data for the development of these models, research studies in real-world settings are needed. Yet, such studies are challenging and necessitate careful design in terms of data collection methods and procedures. This paper describes and critiques the design of a mixed methods approach for occupant behaviour research. It reviews the methodology developed for a longitudinal study in a real-world office environment where occupants’ experience with a novel facade technology (electrochromic glazing) was investigated. The methodology integrates objective physical measurements, observational data and self-reported experience data. Using data from one day of the study, this paper illustrates how the different sources can be combined in order to derive an in-depth understanding of the interplay between external daylight conditions, characteristics of the facade technology, occupant interaction with the technology and the resulting occupant experience. It was found that whilst the individual methods may be affected by practical limitations, these can be partially offset by combining physical measurements and observations with self-reported data. The paper critically evaluates the individual techniques, as well as the benefits of their integration and makes recommendations for the design of future occupant behaviour studies in real-world settings.

1. Introduction

Modern building design strives to provide comfortable indoor environments whilst minimising energy consumption and carbon emissions. One important aspect is the utilisation of daylight, a free source of lighting that has been linked to health, wellbeing, comfort and productivity of building occupants. However, it is a variable resource that needs to be coupled with artificial lighting and shading control in order to provide comfortable conditions at all times. Sophisticated control systems and strategies are therefore needed in order to fully utilise daylight in buildings. This requires knowledge of occupant preferences and behaviour. However, it is widely acknowledged that there remains a lack of understanding, particularly in daylit spaces, regarding the relationships between building occupant comfort, experience and preference and observable behaviour, which makes it difficult to accurately account for occupant behaviour in the design of control systems [1]. This can result in significant energy wastage where daylight control systems are not used as anticipated [2,3]. Numerous approaches have been presented for modelling occupant behaviour and incorporating such models into building simulations, but model uncertainty and robustness are common challenges, and researchers consistently highlight the need for reliable occupant behaviour data specific to the control system to be modelled (e.g., [2,3,4,5]).

1.1. Background

To study building occupants’ perception of or interaction with their visual environment, with the aim to inform occupant behaviour models, it is necessary to collect both physical data (e.g., measurement of the luminous environment) and human factor data (e.g., task/productivity scores, comfort ratings). Visual environment research, as with other comfort-focussed research, has traditionally relied on laboratory studies to capture such data [6]. Studies are often conducted in test rooms where the physical conditions can be controlled, or at least thoroughly measured, and employ human participants to provide the observed or self-reported data regarding perception, preferences, etc.
However, the applicability of findings from laboratory studies (e.g., models, metrics) to real-world settings is limited [7,8]. Reasons include: physical aspects of the test conditions do not match those of real-world environments; participant activities are not sufficiently similar to real-world working procedures; short-term exposure to test conditions does not capture the issues arising from long-term day-to-day experience; and importantly, the large range of adaptive behaviour of occupants is unlikely to be captured in laboratory settings [2,9]. This mismatch between laboratory findings and real-world experiences is particularly challenging for daylit environments, i.e., settings that have inherent benefits, yet can be problematic due to their dynamic nature, which is linked to seasonal, diurnal and random variability of sunlight. For example, real-world glare studies have shown that occupants will make small adjustments to their position to reduce exposure to glare [10], and computer users will adjust their screens to avoid veiling reflections [11], which makes glare limits identified in lab settings questionable at best, inapplicable at worst. Moreover, occupants appear to be more tolerant of high illuminance conditions in daylit spaces than might be predicted by a model, in part because they value the view, the connection with the outside and the dynamic nature of the conditions [12]. Whilst guidance exists for measures related to the luminous environment [13], most studies acknowledge that current metrics have limitations that restrict their applicability in many working environments and recommend that further real-world research be undertaken [8,9,14].
Large differences between the theoretical models and real-world user behaviour have also been reported for the interaction of building occupants with shading devices. For example, O’Brien et al. [3] note that these differences can be partly due to the wide range in conditions, which can be difficult to capture with simplified or laboratory setups, and partly due to differences in human behaviour, such as preferences or adaptation behaviour specific to the occupants and spaces. In their review of building occupant behaviour modelling for building performance simulation, Yan et al. [2] highlight the need for comprehensive datasets of occupant interaction with building technologies from real-world settings.
Research in real-world settings can usefully provide a more thorough understanding of the range of conditions and experiences that inform occupants’ perception and interaction with their environment. In addition to the measurable physical conditions, contextual factors can be captured. These include practical considerations (e.g., related to the work flow), human factors, such as attitudes towards technology, emotional issues (e.g., individual preferences, group dynamics), as well as factors related to the working environment itself, such as room layout or the availability of automation systems [3].

1.2. Methodologies for Visual Environment Research in Real-World Settings

Real-world studies often incorporate case study characteristics, i.e., they aim to investigate a phenomenon in depth within its wider context [15]. For this purpose, multiple data sources can facilitate an investigation of the issue from different perspectives, so as to triangulate data for a more holistic understanding of underlying relationships. Here, an approach based on pragmatism, i.e., on one that incorporates aspects of both the positivist and constructivist paradigms, is particularly appropriate, as it embraces the mixing of methods. This means that some data are collected and analysed in order to understand a measurable and objective reality alongside data that are understood to be subjective and contextually dependent [16]. Information is thus gathered from physical measurements, observations (objective) and self-reported human perceptions (subjective), resulting in a mixed method approach that is characteristic for real-world research studies [15].
To facilitate the development of models of adaptive occupant behaviour (i.e., an understanding regarding the interaction of building occupants with their environment), one requires both observational data regarding actual behaviour and measurements of the physical environment. To ensure that such models are robust, they must be underpinned by knowledge regarding the perceptions and motivations of building occupants [2]. Questionnaires and interviews are useful tools for collecting such self-reported data. However, self-reported data can have limitations in terms of reliability and validity, e.g., participants may knowingly or unknowingly misrepresent their behaviour. It is thus desirable to corroborate self-reported data with observed behaviour data where possible [2].
The practical constraints associated with real-world studies, such as choice of spaces to study, placement of equipment and timing of the data collection (e.g., to fit with participants’ work patterns) place limitations on the data being collected. Therefore, developing an appropriate methodology for such a study typically requires balancing multiple aspects, such as the level of detail and type of data to collect, as well as the number of data sources and collection frequency. Additionally, real-world studies may have small numbers of participants. This particular challenge can be counteracted to some extent by using a longitudinal approach, i.e., following a small number of participants over a longer period of time. Whilst this can be a useful design for visual comfort research in that it facilitates capturing of seasonal changes, it can lead to participant fatigue, which could impact participant engagement and the quality of data collected [17]. The careful choice of data collection methods is therefore crucial.
The following provides an overview of common data collection tools used in real-world studies from research areas, such as glare assessment, lighting controls, interaction with shading and advanced glazing systems. They are summarised in Table 1 under the headings measured, observed and self-reported.
An early study by Rubin et al. [21] investigated the interaction of occupants with manual Venetian blinds in an office building by using photographs of the building facades. This technique was also applied by Inoue et al. [25], who monitored the window blind positions of a number of buildings to inform the development of a control protocol for automated shading. The latter study also investigated user acceptance of such a system using questionnaires. A study by Meerbeek et al. [22], which investigated user interaction with a motorised external blind system in small offices, included recording of blind positions and subjective data using diaries, questionnaires and interviews. Sutter et al. [11] studied occupant interaction with manually-controlled Venetian blinds by using illuminance data logging and recording the blind position. The study had a small number of participants, but was conducted longitudinally over a period of 30 weeks.
In their study of occupant perception of daylight glare conditions, Painter et al. [18] used a mixed method approach that incorporated physical measurements, as well as user perception data. Their study also had a small sample size and longitudinal setup. In order to minimise participant burden, they developed an approach that allowed the simultaneous capture of physical measurements (luminance images) and participant feedback through a custom online report tool [26]. Similarly, Hirning et al. [19] surveyed occupants about their visual comfort in open plan office buildings simultaneously with physical measurements (luminance images), with the aim of linking occupant perception to glare metrics derived from the physical measurements. Konis [7] also used luminance images in their post-occupancy study in a new office building and developed a custom-built desktop polling station to record occupants’ visual comfort perception simultaneously with the physical measurements. Observations regarding the positions of window blinds were also extracted from the luminance images. A similar mixed method approach was used by Moosmann [20] in a study of occupant preferences and tolerance towards adverse conditions in daylit workspaces. They collected occupant feedback (questionnaires) together with measurements of lighting and indoor environmental conditions. The data were supplemented by observed data of occupant behaviour, which were derived from the physical measurement data.
Correia Da Silva et al. [23] studied occupant interaction with electric lighting and window shading systems in offices. Luminance images were used to capture data for several luminous environment parameters, as well as blind use. The methodology also included questionnaires, but these could not be successfully implemented due to a lack of participant engagement. In their study of occupant interaction with electrochromic glazing, Lee et al. [24] found that systematic subjective data collection was not possible, as the occupants of the study spaces changed and the space was not occupied at regular intervals. Their methodology thus relied on capturing behaviour data from observational sources, such as manual override logging and window blind use monitoring.
In addition to the tools that form part of the planned data collection, it can also be useful to include informal data collection from participants, such as verbal feedback collected on an ad hoc basis when researchers have contact with the participants, e.g., when researchers enter buildings to set up equipment. This feedback, sometimes collected in field log-books, can provide further information regarding occupants’ actions, perceptions and motivations.
As this overview illustrates, there are a number of common methodological elements across real-world visual environment studies. Considering that the limitations are also often similar (small sample size, limitations on physical environment, risk of participant fatigue), there is considerable opportunity to learn from the process of conducting real-world studies to inform future work, such as gaining an improved understanding of the practical issues or benefits and limitations of different data collection methods. Unfortunately, these issues are generally only briefly discussed in published work. Current literature on real-world visual environment research thus suffers from a lack of insight into the data collection process itself. In particular, a critique of the process and comments on the efficacy of the available tools is largely missing.
In this paper, we specifically provide such insight by reporting on the process and experience of conducting a case study of occupant interaction with electrochromic (EC) glazing in offices. First, the data collection methodology is described, followed by an exploratory analysis of data from one specific day of the study. The discussion then critically examines how well the different aspects of the longitudinal mixed method approach worked in terms of allowing triangulation of the complex issues that underlie occupants’ perception and experience with EC glazing technology. Finally, recommendations are provided for future studies of occupant experience in real-world settings.

2. Methodology

2.1. Case Study Context and Focus

Electrochromic (EC) glazing is an advanced facade technology that has the potential to control glare from direct sun or bright patches of sky without the use of window blinds. The glazing has a coating that allows the visible transmittance to be changed through the application of a small voltage. Building occupants can thus benefit from having access to daylight, with all its inherent benefits, as well as a view through the window, even when the glass is fully tinted [27]. As solar gain and visual discomfort can be controlled without the use of internal or external shading devices, EC glazing has great potential in architecture and is particularly suitable for retrofit applications.
However, as EC glazing is a relatively new technology, there is currently a lack of knowledge regarding its performance in real-world settings. A number of studies based on scale models, computer simulations and full-scale test rooms has shown the technology’s theoretical potential, but real-world studies are rare [24,28]. Additionally, whilst occupant behaviour models and an understanding of the wider contextual issues exist for the use of other building control technologies, such as blinds, windows and heating controls [2], little is currently known about occupant perception, acceptance and interaction with EC glazing technology. If the technology is to be used in commercial applications, more research is needed to assess its suitability for working environments.
To address this lack of data, this study utilised the first commercial installation of EC glazing in the U.K.: two offices at De Montfort University, Leicester. The study focused on gaining an understanding of key questions, such as:
  • How effectively does the EC glazing system control the internal luminous environment?
  • What luminous environment conditions are perceived as comfortable or uncomfortable by building occupants?
  • What visual comfort actions (VCAs) do occupants take to control/maintain comfort?
  • Which contextual parameters affect occupants’ use of the EC glazing system?
A detailed overview of the case study setup and glazing characteristics is provided in [29]; the main points are summarised below.

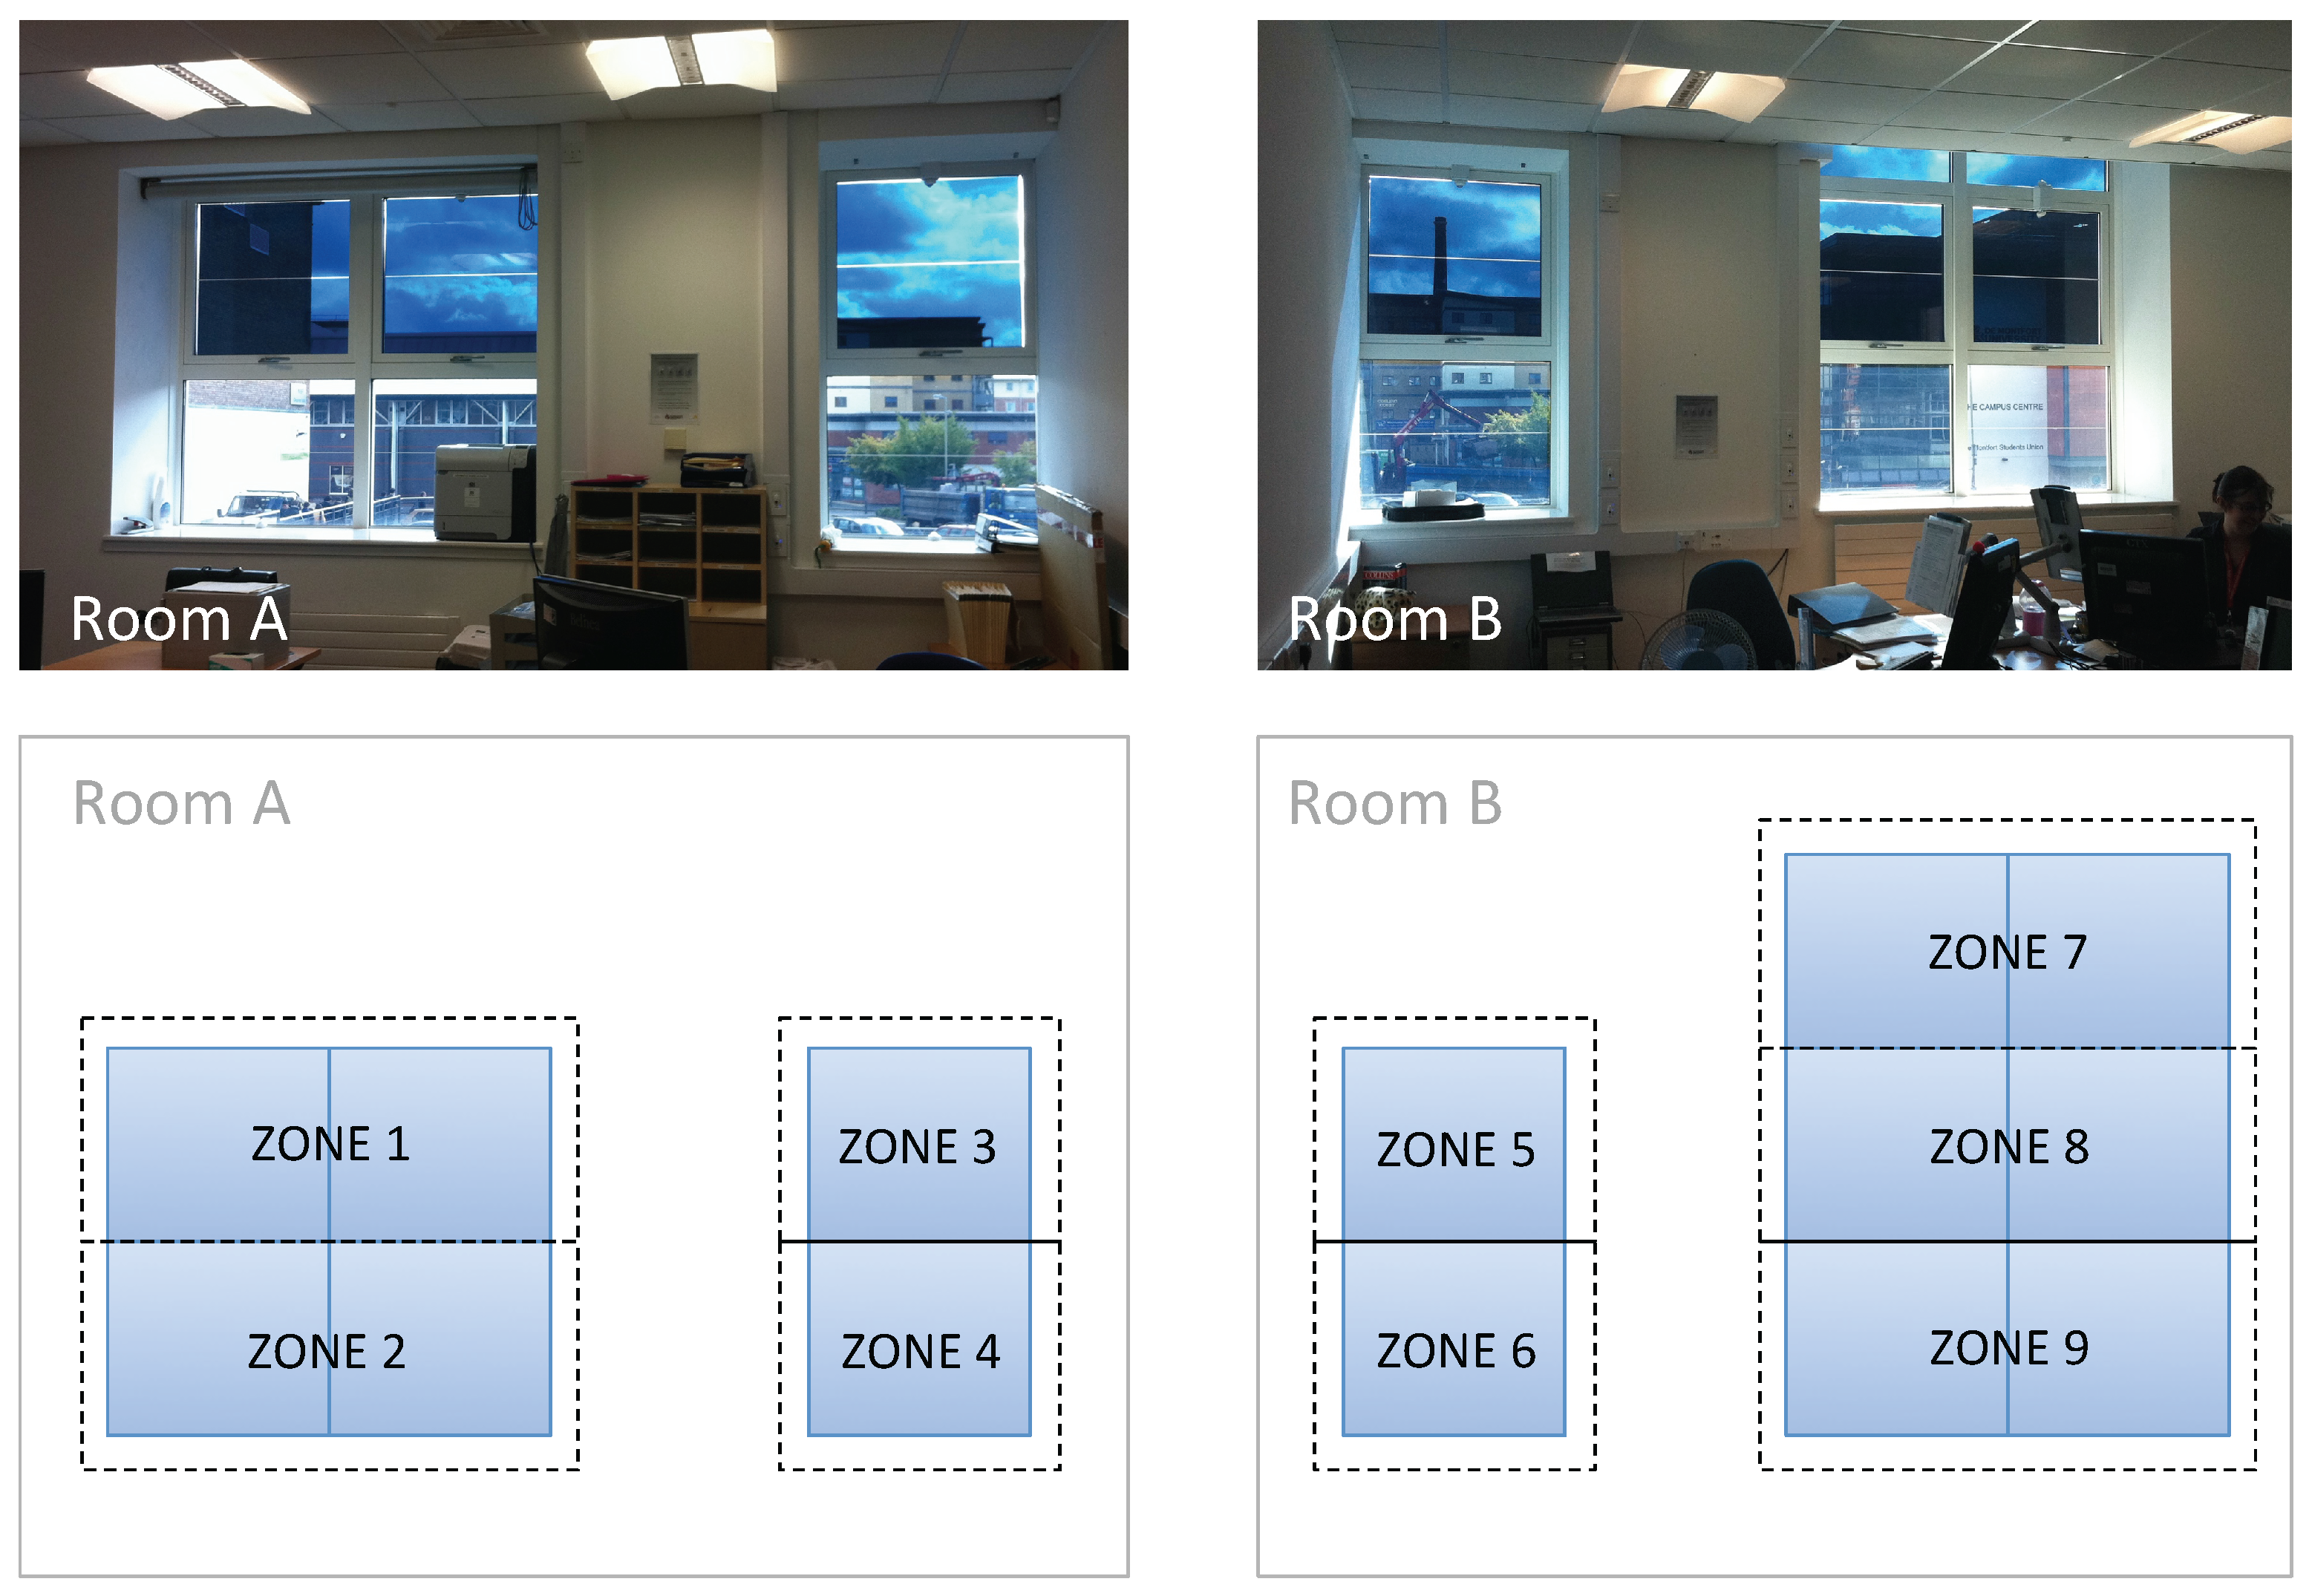
2.1.1. Window Arrangements and EC Glazing Controls

The study area consists of two offices in a converted former industrial building, which have been retrofitted with EC glazing. Each office has one wide and one narrow window, as shown in Figure 1. Variability in the number of panes in the wide window (4–6 panes) is due to partial obstruction by the false ceiling. The windows are split into several control zones (see Figure 1).
The visible transmittance of the glass is 62% in its clear state and 2% in its fully-tinted state, with two intermediate states at 20% and 6% visible transmittance. The speed of transition between the tint stages is limited by the nature of the chemical reactions that occur within the coating during the transition from one state to another. The glazing can take up to 10 min to complete the change in transmittance state. The transition time increases with lower ambient temperature and the size of the glazing area being switched.
In automatic control mode (“Auto”), the control parameter is the output of an illuminance sensor that is mounted on the facade directly below the windows. Each zone is controlled based on an upper and lower illuminance threshold, as set in the control system. In-built delays (“dead-bands”) are included to avoid control system switching during periods of varying illuminance (e.g., fast-moving clouds). The lowest glazing zones are generally left untinted, as glare rarely occurs due to daylight through those zones; keeping some panes clear maintains the natural feel of the room [29]. When a user presses a wall switch for a specific zone, the system overrides the “Auto” mode, tinting the zone to the user-selected tint level. The system settings for the manual override remain active for a period of two hours.
At the same time as the window replacement, the electric lighting in both rooms was upgraded with a daylight-linked lighting control system. The new light fittings are recessed rectangular luminaires, fitted with digitally-addressable (DALI) and electronically-dimmable fluorescent lamps. The control system has ceiling-mounted sensors for absence detection and dimming control. Each row of light fittings parallel to the window wall can be controlled individually, with manual control and pre-set scene programming facilitated through a control panel.
Before the window retrofit, the rooms had been equipped with window blinds. The purpose of the retrofit with EC glazing was to provide daylight control without the need for blinds. However, considering that the performance and effectiveness of EC glazing in this setting was as yet unknown, it was not certain that the technology would be able to provide comfortable conditions at all times. As the ability of occupants to carry out their work tasks and ensuring their health and safety were key determinants in the study design, it was considered prudent to ensure that window blinds were still available for occupants after the retrofit. Roller blinds were installed on all windows, but participants were asked to avoid using them unless necessary and, if applicable, retract them at the end of each day.

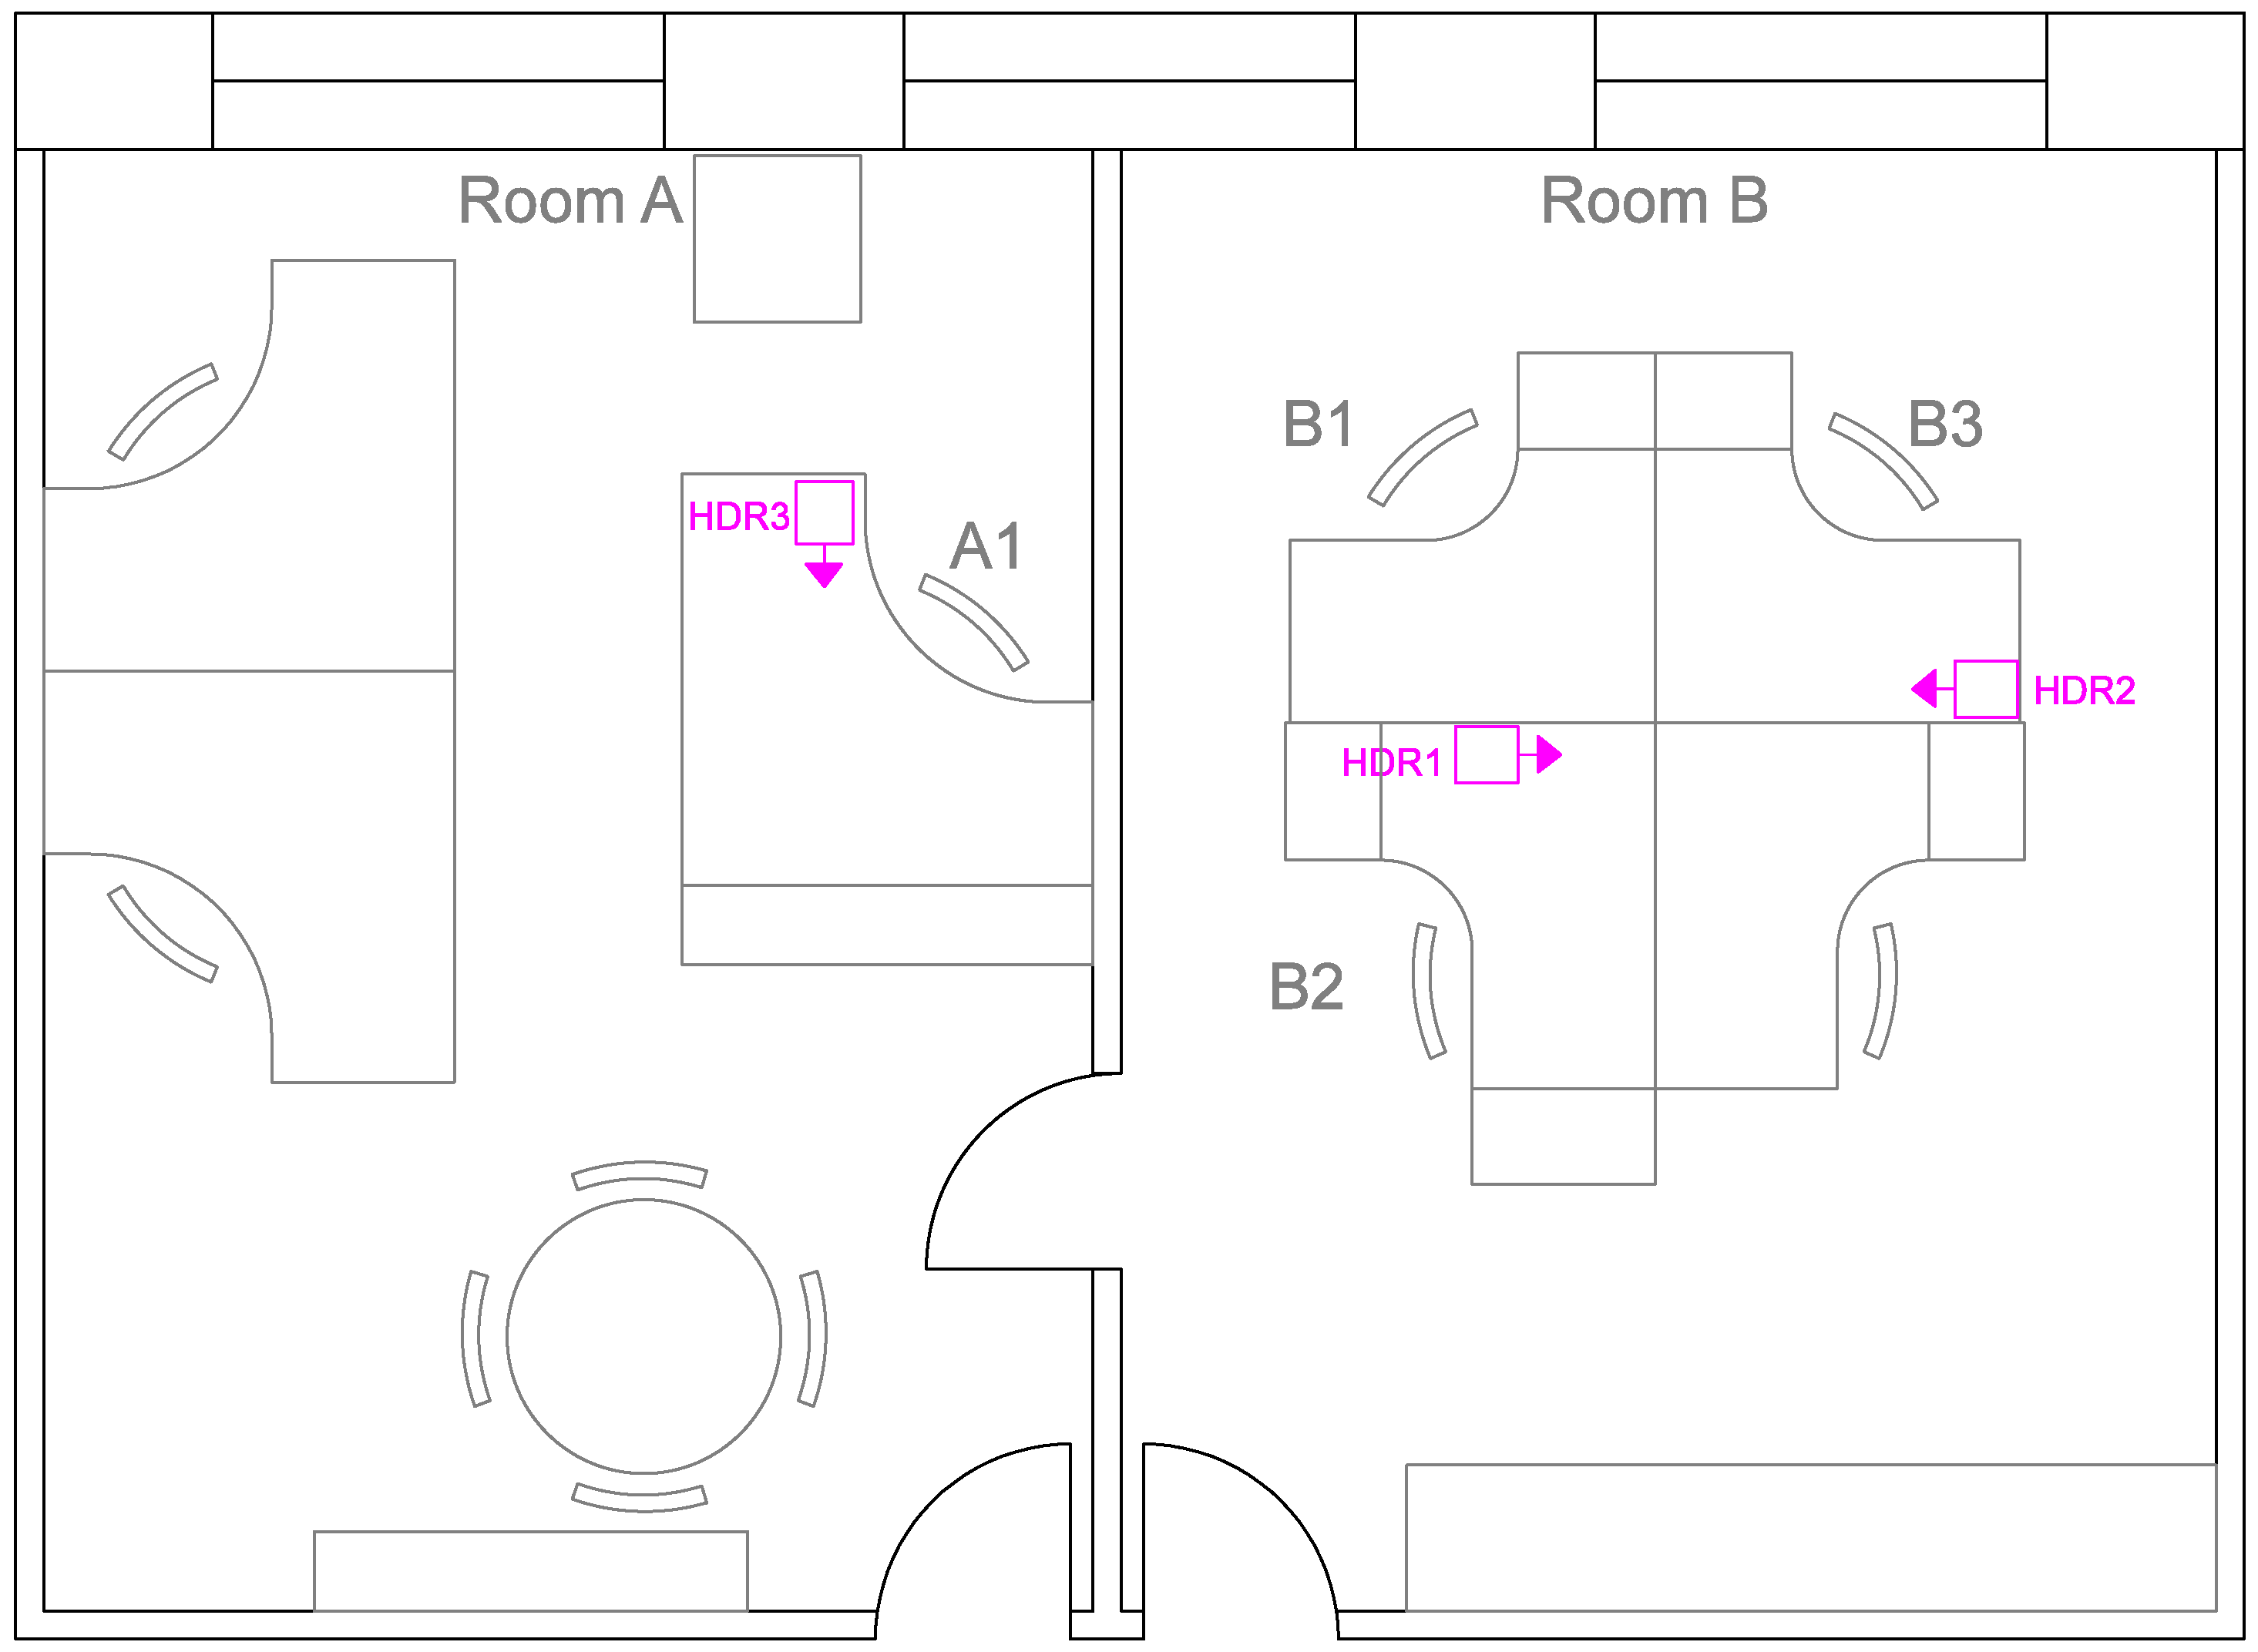
2.1.2. Office Layout and Participants

Room A contains three desks, and Room B has four (see Figure 2); some desks are shared by part-time staff. Of the total eight occupants between the two offices, four agreed to fully participate in the study. The other occupants provided informal feedback during the study and agreed to be interviewed about their experience at the end of the data collection period.
All four participants were female and between 30 and 59 years old. Three participants worked full-time and one part-time. All participants worked between 8 and 10 h per day, primarily seated at their desks, focussed on computer-based tasks. One participant (B2) reported a visual condition, which affects her vision at times and increases her sensitivity to light. The same participant had a direct view of the window; all others had either a side view of or their back to the windows.

2.2. Case Study Methodology

To explore EC glazing system performance and the interaction of the office occupants with the technology, we applied a pragmatism approach [16]. A bespoke longitudinal, mixed methods design was developed that incorporated measured, observed and self-reported data collection techniques (Table 2). The techniques were selected with the overarching aim to collect appropriate data to answer the research questions, within the constraints imposed by the real-world setting. There were three key practical limitations. Firstly, given the limited number of offices receiving retrofit glazing, i.e., two, there was no choice of study location. Secondly, four of the eight office occupants agreed to take part in the study, which further limited the sample size. Thirdly, room layout, seating arrangements and staff allocation to desks where pre-determined, as the study area was an existing office.
A longitudinal study approach with a data collection period of 12 months was utilised for two reasons. Firstly, occupant interactions with facade technology are likely to be related to the seasonal variability of sun position and weather conditions. Secondly, occupant interaction with control technology tends to be relatively infrequent. Thus 15–60 minutes sampling intervals and a study duration of at least one year are appropriate [2]. The longitudinal design did however pose challenges in terms of participant engagement. Given our reliance on the participation of a small number of individuals in their usual working environments, minimising participant burden was crucial so as to maintain cooperation throughout the study period [17]. These considerations informed the frequency and delivery of the self-report data collection tools, as well as the installation and operation of monitoring equipment [30]. They also prompted the development of simple additional tools that allowed continued collection of observational data and occupant feedback with minimum time investment from researchers and participants.
An initial design included measurements of visual environment data (luminance images and desk illuminance), EC glazing control logs, questionnaires and semi-structured interviews. Data collection was set to occur at regular intervals of varying length, depending on the measure. This was trialled and refined in a three-month period immediately prior to the main data collection effort. Refinements included the addition of several simple tools (daily experience sheet, blinds diary, facade photos, ad hoc feedback) and an alteration in the questionnaire timing, from twice monthly to monthly. Due to equipment problems, the measurement of desk illuminance was discontinued. The main data collection period lasted from May 2013–April 2014. The study underwent ethics approval, and all participants signed a consent form.

2.2.1. Data Collection Tools

Table 2 gives an overview of the study tools, including timing and frequency. Here, we provide a detailed description of each. (See Figure 3, Figure 4, Figure 5 and Figure 6 for examples of data collected with these tools.)
EC glazing control logs: The EC glazing control system automatically logs changes to the glazing tint. Furthermore, switching events, both those triggered by the automated control strategy and any manual overrides, were recorded for each glazing zone. Control log data were included in the methodology to facilitate the analysis of automatic tinting dynamics and the capture of occupants’ visual comfort actions (VCAs).
Luminance images: High dynamic range (HDR) imaging is a proven method for assessment of the luminous environment, in which fish-eye cameras are used to capture luminance images of the field of view of building occupants [18]. This requires computer-controlled cameras to be installed as closely as possible to their viewing position (see Figure 2 for camera locations). The purpose of these data was to quantify the luminous environment and to infer which conditions occupants find uncomfortable or comfortable by comparing measurements from before VCAs occurred with those captured afterwards [20].
Blinds diary: The blinds diary was developed in order to provide a record of when blinds were lowered, i.e., occupants’ VCAs. The diary sheet was mounted on the window wall between the two windows, and occupants were asked to complete it whenever they lowered the blinds, noting the time, the source of visual discomfort and the initials of the person who was most affected.
Facade photos: To complement data collected with the blinds diary, a series of photos of the building facade were taken throughout the data collection period, which captured the position of the blinds in both offices.
Daily experience sheet: This tool was developed in order to capture a broad overview of the occupants’ experience on a daily basis. Participants were asked to complete the sheet once a day by marking one of three “mood faces” (happy, neutral, unhappy) to indicate their satisfaction with the EC glazing. The sheet was designed to be a low-burden exercise that would provide continuous occupant feedback throughout the study.
Questionnaires: The online questionnaire was designed to capture participants’ experiences in relation to specific research themes, such as visual comfort, alertness, wellbeing, clarity of view through the window, thermal comfort and overall satisfaction. Questions were either modelled on previous studies (e.g., Clear et al. [14]) or developed for this study. Response options were primarily closed-ended, formatted as multiple choice (select one choice only), 5-point bipolar scale (e.g., “too dark” to “too light”) or dichotomous (yes/no); a few non-mandatory free text response options were also included. This generated a dataset containing mostly quantitative data with some qualitative information.
Most questions regarded the visual environment perception at the exact time of completing the questionnaire, although a few also referred to the preceding two weeks. The time of completion was recorded, with the intention to use this time stamp to link the questionnaire responses with the physical measurements and window control data. Participants were prompted once a month to complete the questionnaire, but were free to choose the actual time of completion. The questionnaires were administered via SurveyMonkey, facilitating collection of participant responses in an electronic format without the need for researcher contact. For a detailed description of the questionnaire design, see Kelly et al. [30].
Interviews: Interviews were semi-structured and designed to explore the themes from the questionnaire in more detail, as well as to provide an opportunity for participants to discuss their experiences in a less constrained way. One set of interviews was carried out before the glazing was installed, followed by regular interviews during the main data collection period, and one set at the end of the study period.
Ad hoc feedback: During informal visits of researchers to the study area, all office occupants were happy to provide ad hoc feedback about their experience outside the more formal questionnaires and interviews. This feedback was collated by researchers in a field study journal.
The described methodological approach has been successful in collecting data from all participants at all time points throughout the 12-month study period. This attests to the approach fulfilling its purpose in terms of maintaining engagement and collaboration from the participants over an extended period of time. In the Results and Discussion sections, we specifically explore how well the approach has worked in terms of gathering reliable and useful data for answering our research questions.

2.2.2. Data Analysis

The mixed method approach resulted in a variety of data types, each of which underwent some form of initial data processing, such as manual transcribing (e.g., of interviews) or the application of custom-written processing routines (e.g., EC glazing logs, luminance images). This generated subsets of data that provide visual representations of intermediate results, where appropriate, and are suitable for further processing/analysis. A key aim of the analysis is to make links between data from the different sources in order to identify underlying relationships and to derive a better understanding of the different factors that contribute to occupant experience and behaviour.
For this paper, we undertake an exploratory analysis for a single day of the study. The intention is to illustrate what the data from the different data sources look like and how they can be combined in the analysis of EC glazing system performance and occupant behaviour.

3. Results: Data from One Day

The main dataset includes records for the complete 12-month monitoring period. For the purpose of this paper, a subset of data was extracted for an example day, 23 January 2014. These are shown in Figure 3, Figure 4, Figure 5 and Figure 6 (some examples from the wider dataset are included for comparison where appropriate) and described in Section 3.1Section 3.6. First, observed and measured data are presented, which show the external illuminance conditions on the day, as well as occupant interaction with the technology. This is followed by further measured data and self-reported data that give insight into why that interaction occurred. The findings from all sources are then drawn together in Section 3.7.

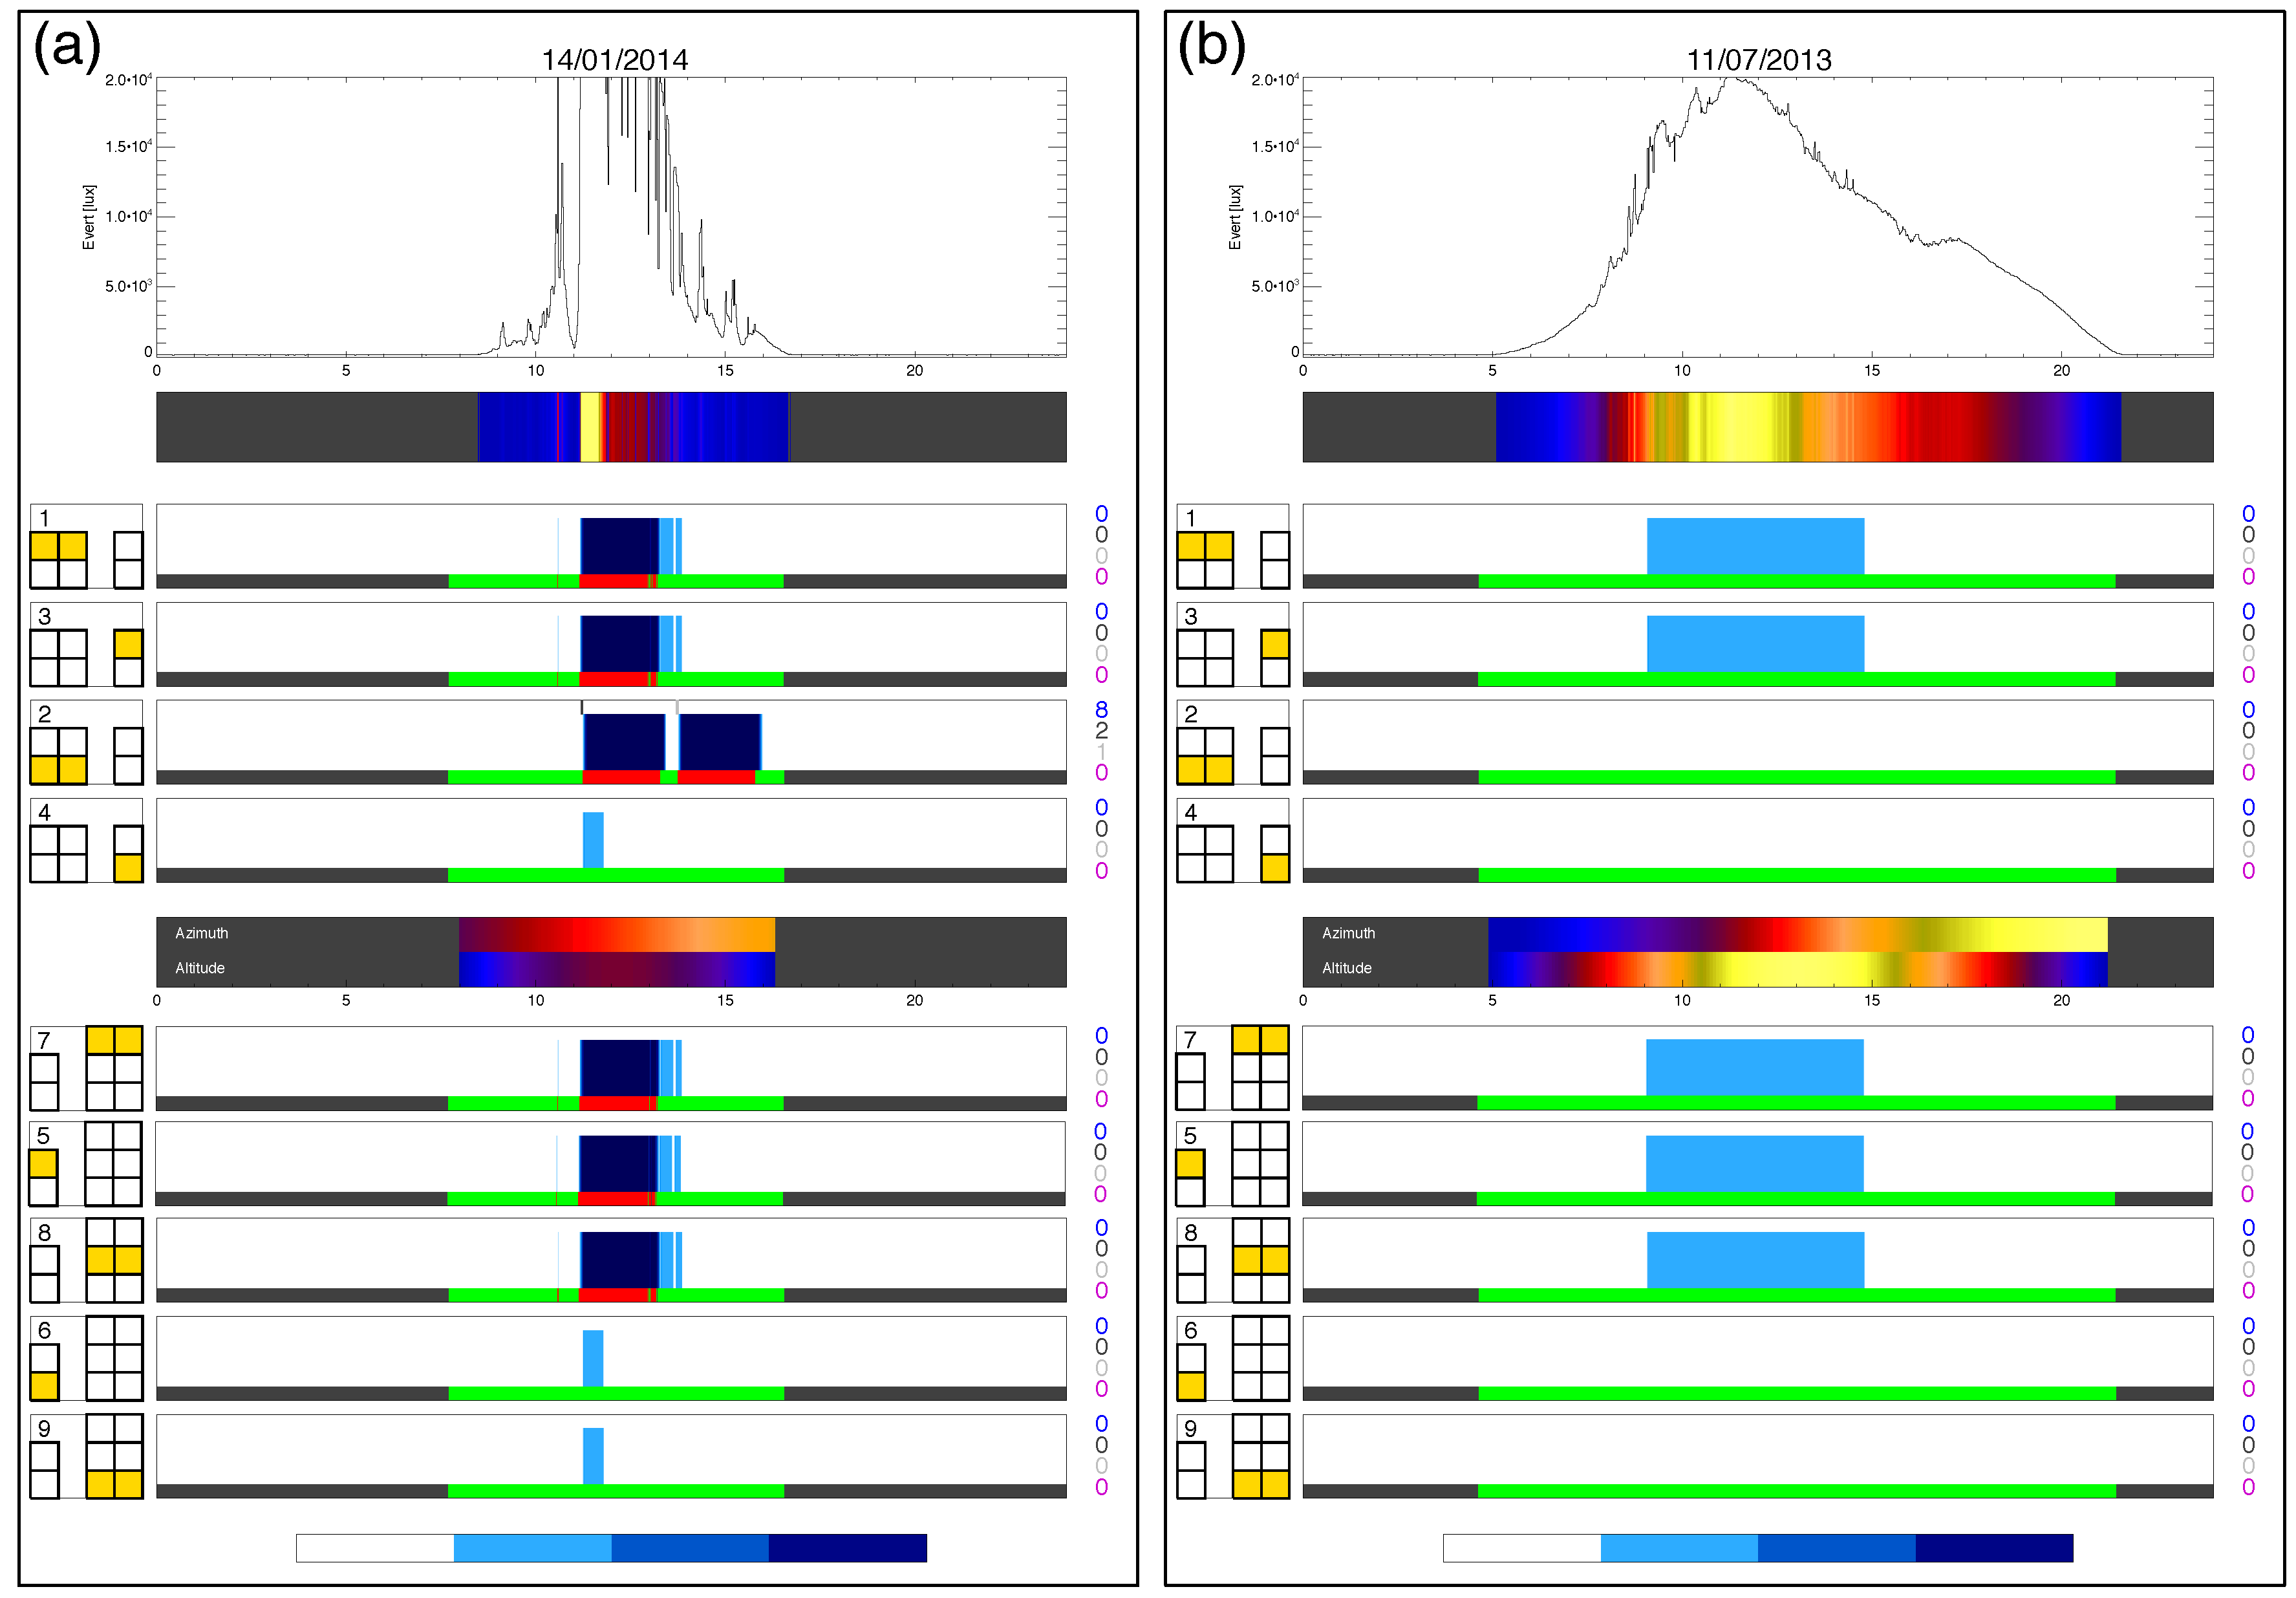
3.1. EC Glazing Control Log

The EC glazing control system provides a detailed log of control sensor readings and every control change. To visualise the data for the example day, all records for that day were assembled on a summary sheet (Figure 3a), using custom-written processing routines. Data for a different day are provided for comparison in Figure 3b. The summary sheets show time series plots of external illuminance values at the top, once against a y-scale and once in a colour visualisation (brighter colours represent higher values). Below these, the tint settings for the different zones are shown, also against time of day, with darker tints shown as darker blue lines/areas. The squares on the left-hand side indicate to which zone the data apply: Zones 1–4 refer to the glazing zones in Room A and Zones 5–9 refer to Room B (Figure 1).
The manual override time strip is shaded grey when there is no daylight and the control system is in “sleep mode” and green when in automatic mode, i.e., when the glazing state may be altered on the basis of a sensor reading or a manual override. Red can indicate either or both of the following: (i) an (automatic) switch into “glare mode” for all/some of the zones where the glazing transitions to full tint; (ii) a manual override initiated by a user for a particular zone. The column of numbers on the right-hand side of the “time strips” indicates the number of times that the manual override switch was pressed to achieve one of the four states of tint (full tint at the top, clear (magenta) at the bottom). These numbers are purely a guide and need to be judged alongside the other data, since the overrides are logged at 1-s intervals and so may report several presses of the override switch to achieve a single transition event. The time taken for the glazing to transition is another factor here: occupants may press the switch several times not realising that the glazing has already begun to change state. Each distinct manual override event is marked with a small grey line just above the tint settings bar. Azimuth and altitude are also shown to give an indication of the sun position throughout the day (with lighter colours indicating higher values).
The following observations can be made for the example day, 23 January 2014 (Figure 3a). External illuminance values varied significantly and rapidly throughout the day, reaching highs well above 20,000 lux, but also periods with values below 1000 lux. This is characteristic for a day on which clouds moved quickly across the sun, causing “spikes” in facade illuminance. Additionally, solar altitude is low, which would have resulted in direct sun penetrating deep into the room in the morning and in the afternoon. In contrast, a far smoother profile can be observed for the comparison day, 11 July 2013 (Figure 3b), a day with clear sky conditions. It is also apparent that the sun exposure is very different under summer conditions; low sun angles (altitude) occur in the very early morning and late evening, i.e., outside occupancy hours, at azimuths that do not result in direct sun on the facade.
The window control data in Figure 3a show that throughout the example day, the automatic controls tint the glazing zones to the same levels in both rooms, but at certain times, manual overrides occurred:
  • There is an early peak in the illuminance values, at approximately 10:30; the upper glazing zones (1, 3, 5, 7 and 8) were automatically tinted to the intermediate level and then untinted again. There were no manual overrides at that time.
  • The external illuminance peaked again, shortly after 11:00; the upper zones were tinted in both rooms to the darkest level and low zones to the intermediate level. At this time, a manual override was used in Room A to additionally tint part of the lower zone to the darkest level (Zone 2). No manual overrides were recorded in Room B.
  • The manual override for Zone 2 remained active until the default time of 2 h had expired. All other zones were controlled automatically in response to the varying illuminance values.
  • A peak in external illuminance values can be observed in the afternoon that can be linked to a further manual override in Room A (13:43). The manual controls were used to tint some of the lower panes (Zone 2) to the darkest level. No manual override was recorded in Room B at that time, and no further automatic control action occurred in either room.
In contrast, on the comparison day (Figure 3b), the control actions are simpler: the top and middle zones get tinted by the control system to the first intermediate level (20% transmittance) for part of the day, and no manual overrides occur. This comparison usefully illustrates the difference between days with changeable and stable external luminous conditions.

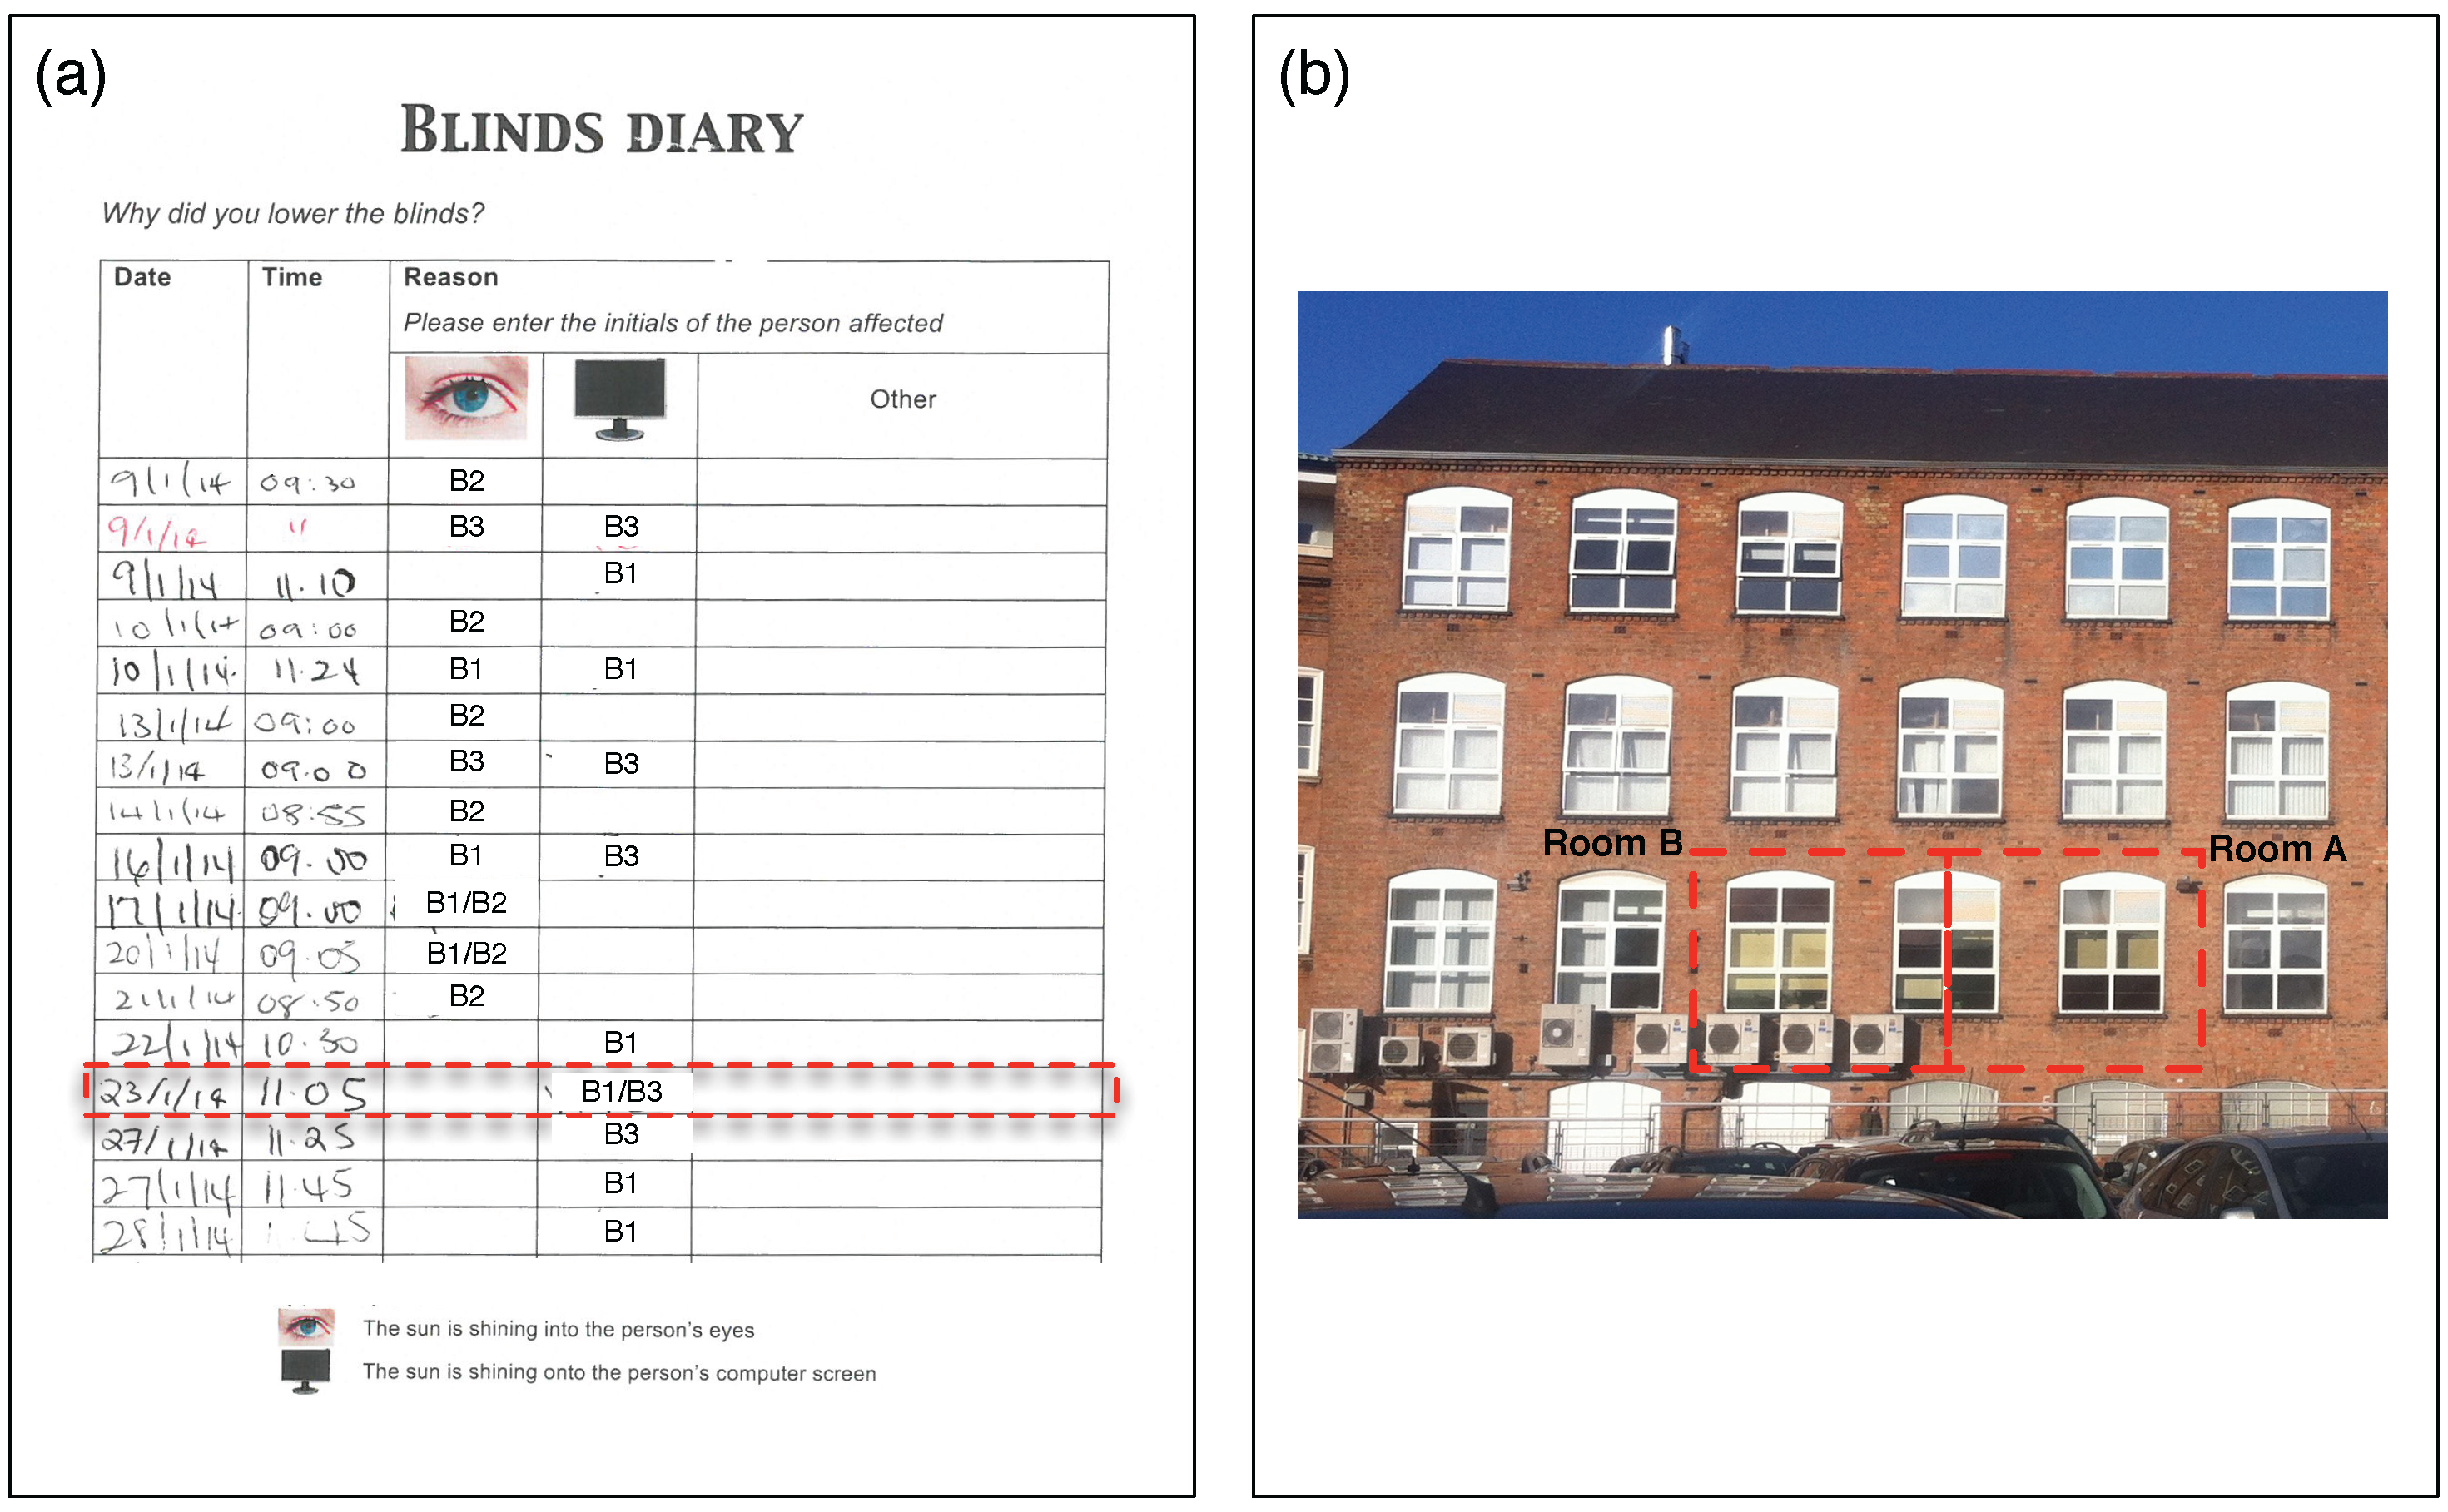
3.2. Blinds Diary and Facade Photo

Figure 4a shows the blinds diary from Room B for January 2014. Some general observations can be made for that month. All three participants indicate visual discomfort issues that led to the blinds being lowered. Participant B3 notes glare on the computer screen as the most common problem; Participant B2 was uncomfortable due to sun shining in her eyes; whilst Participant B1 seems to have been affected at different times by direct sun in her eyes or on her computer screen. On the example day, one blind pull event was recorded at 11:05. The reason given is glare on the computer screens for both Participants B1 and B3. The facade photo, taken at 12:32 on the example day (Figure 4b), shows that the blinds remain almost fully lowered in Room B, whilst they appear also partially drawn in Room A.

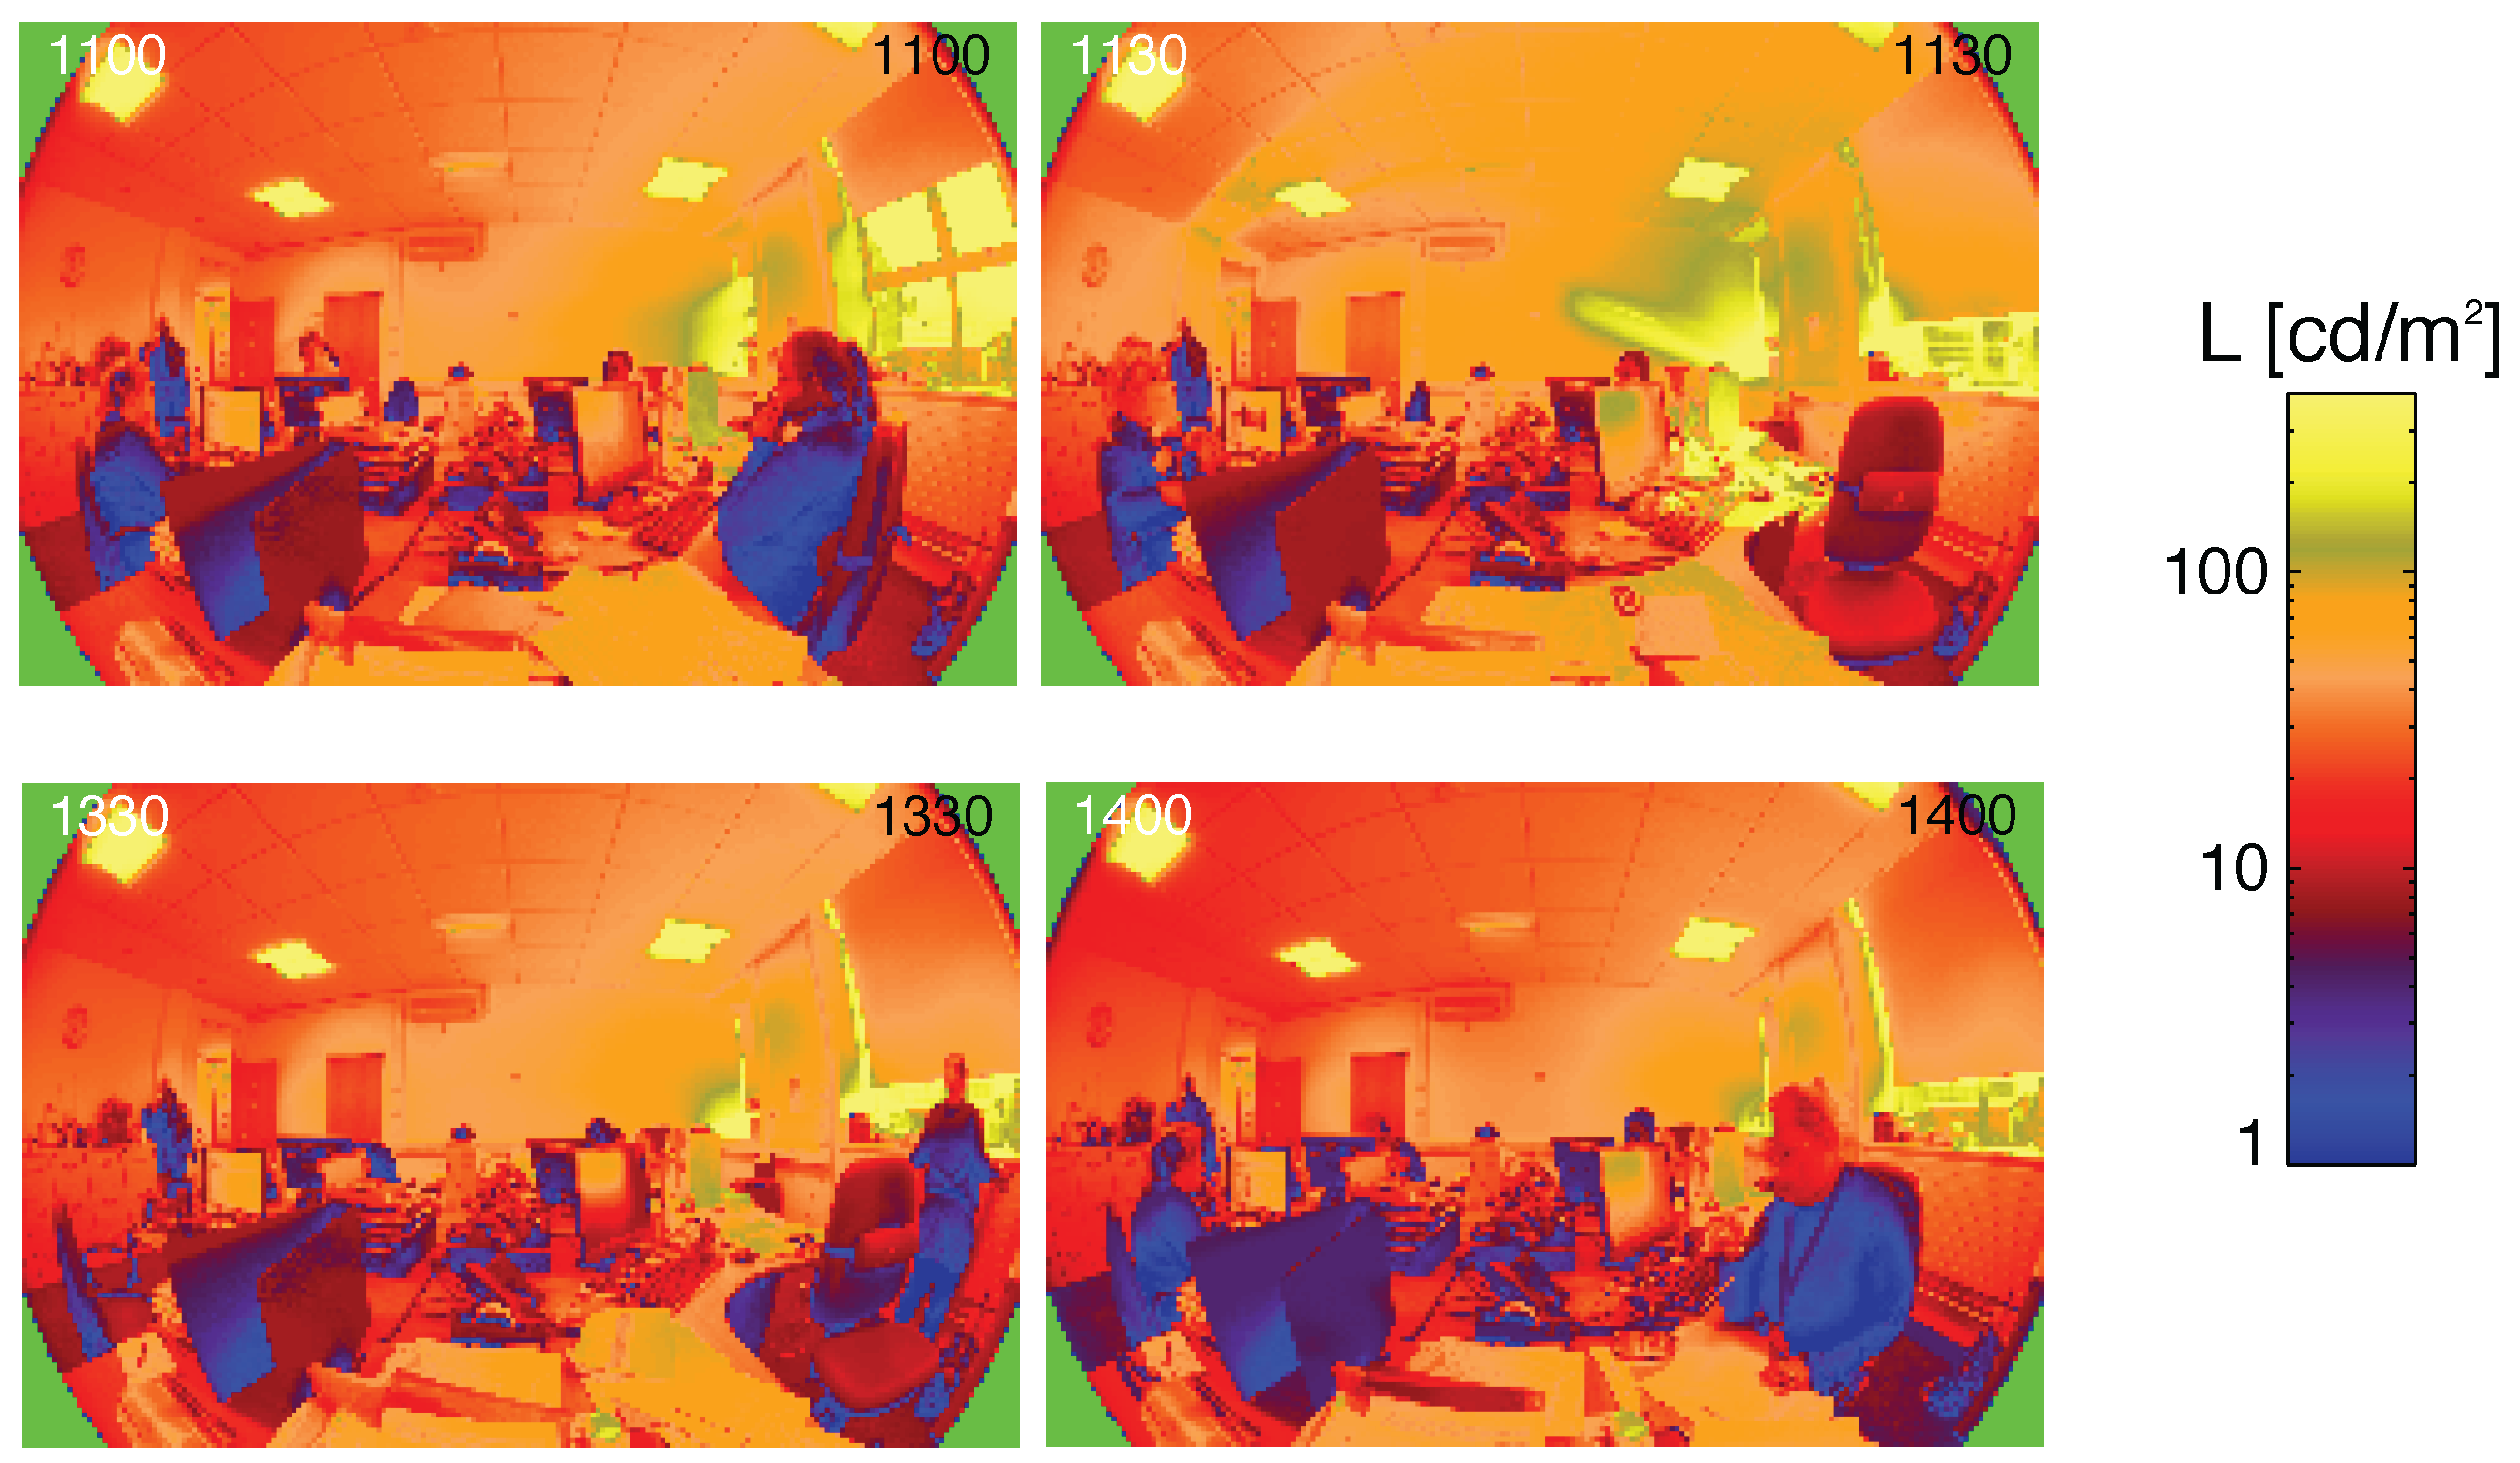
3.3. Luminance Images

Luminance maps were captured throughout the day in Room B, at an interval of 30 min, from two viewing positions (compare camera positions in Figure 2). No luminance data are available for Room A for the example day. Figure 5 shows examples of the images captured from viewing position HDR1 close to the time of the two identified VCAs, i.e., for the morning between 11:00 and 11:30 and in the afternoon between 13:30 and 14:00.
Individual images can be inspected to confirm blind position. For example, comparison of the images for 11:00 and 11:30 shows that the main blind has been drawn (right-hand side of image), confirming the blind diary entry at around 11:05. Looking at the images for 13:30 and 14:00, i.e., around the second manual override in Room A, there appears to be little change as the blinds remained down.
The main advantage of the HDR luminance maps is that they allow a detailed investigation of the luminance distribution within the room. Examination of the data from two consecutively-captured maps provides an indication of how conditions changed in the 30 minutes time interval. In all four images, the values range from very high at the windows to low at the back wall, which suggests problems with the uniformity of the daylight distribution. Interestingly, a more even distribution of brightness is achieved across the ceiling when the blinds are drawn; this could be due to the daylight-linked artificial lighting system reacting to the change in daylight ingress.
In addition to this visual inspection, summary metrics can be extracted from the images for the whole field of view or, indeed, selected parts of it, e.g., the area nearer the windows or the area towards the back of the room. Descriptive statistics (mean, median and range) confirmed a small difference in conditions before and after both VCAs. Further detailed analysis of the data showed that this difference is indeed due to an increase in output of the artificial lighting. (This is the first analysis approach for utilising data from the luminance images. It has been included here as an illustration of the uses of physical measurement data; work is in progress to identify suitable metrics for further analysis.)

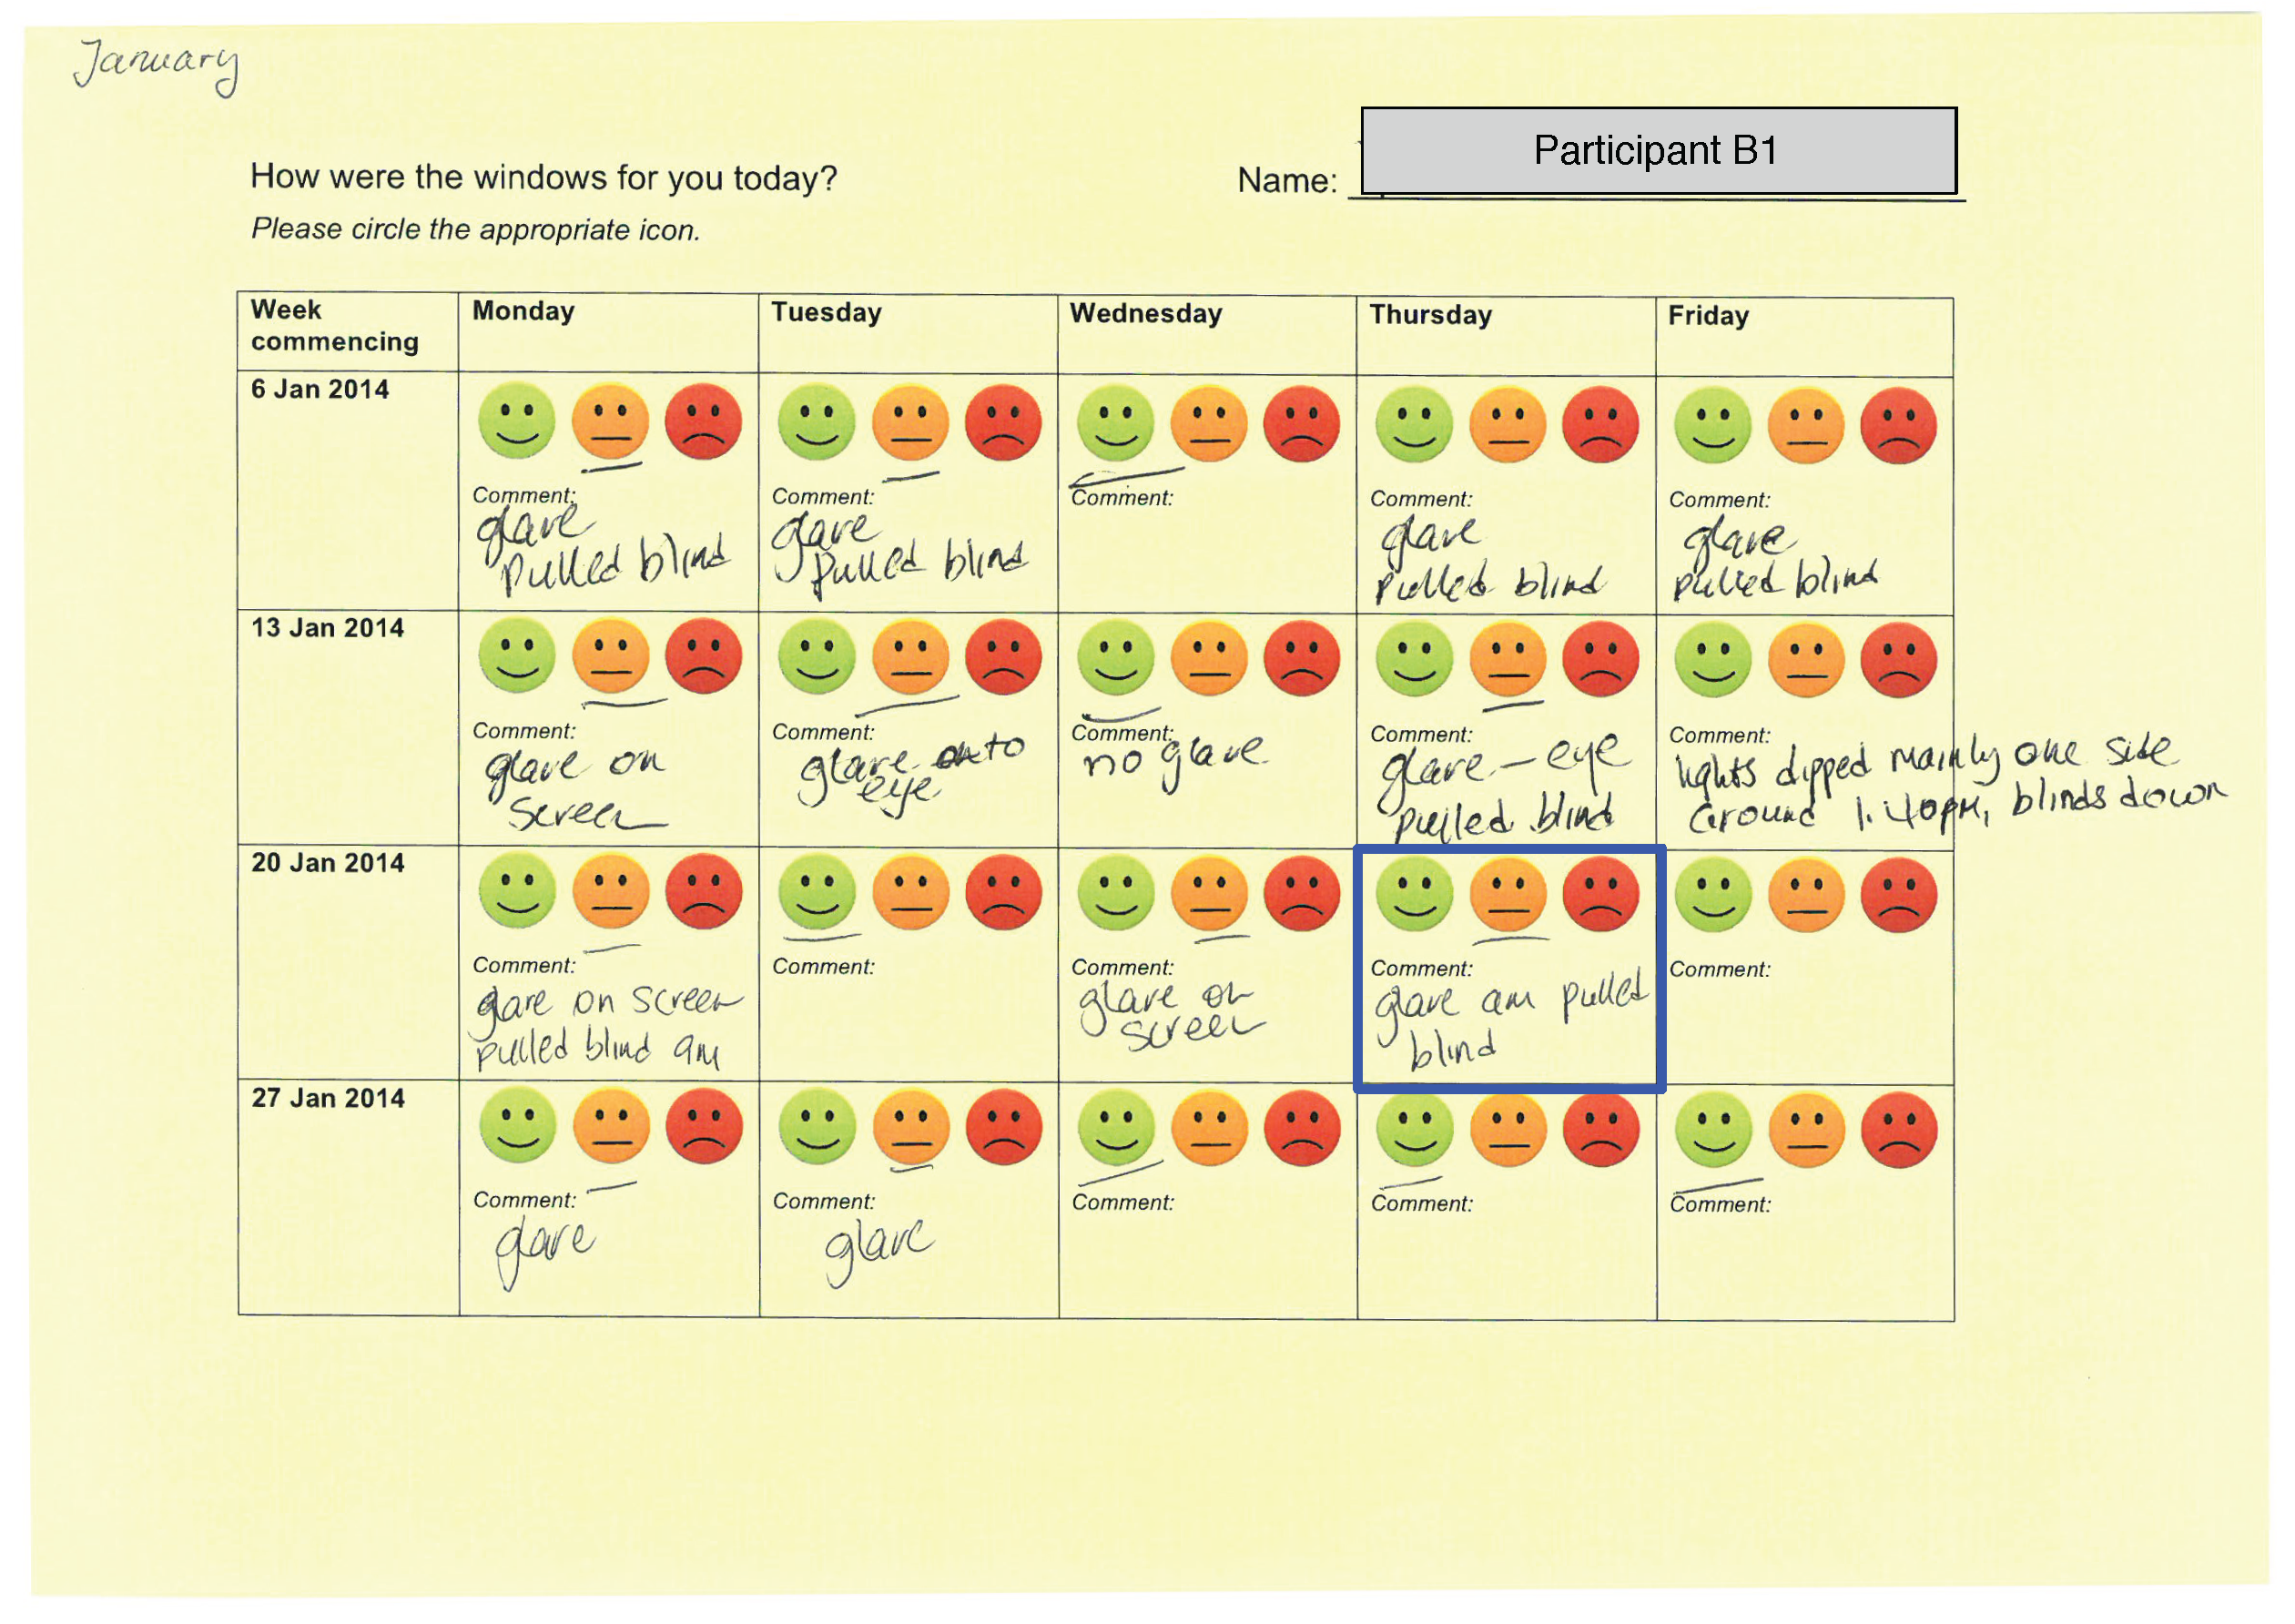
3.4. Daily Experience Sheet

The daily experience sheet for Participant B1 (Figure 6) shows that this individual was not entirely satisfied with the window performance on the example day. The comment on the sheet for that day indicates that blinds were used to control the visual environment. Looking across Participant B1’s daily experience sheet for the entire month, the variability in experience is evident, with blind use and “neutral” occurring on many days, interspersed with days marked as “happy”. Sheets from other participants (not shown here) generally show an agreement in terms of blind use comments, but there is a variability in satisfaction responses. It would be interesting to investigate how the varied experiences and perceptions contribute to the group decision that is made regarding the VCAs.

3.5. Questionnaire Responses

Questionnaire responses from two participants are available for the example day; Participants B1 and B2 responded to the questionnaire at approximately the same time of day (12:25 and 12:43). Data for several relevant close-ended questions are provided in Table 3. The following summarises the responses, utilising additional free-text comments where they were provided:
Light levels (Q3, Q4): Participant B2 indicated that the lighting level in the room was sufficient and commented: “We have the combination of the blinds down three quarters so there is sufficient light coming into the room together with the overhead lighting.” Participant B1 found the conditions slightly too bright. In responding to a question about the distribution of light in the room (Q4), Participant B1 added the comment: “quite sunny so have had to pull the blinds”.
Reflections (Q7): Participant B1 reported reflections on the computer screen due to daylight through windows. Participant B2 did not experience such problems.
View (Q14) and connection to outside (Q15): Participant B1 indicated that she was very satisfied with the view through the windows and found it easy to gauge the weather outside. Participant B2 was not satisfied and added a comment that the “windows were dirty (inside and out)”.
Tiredness (Q12): Participant B1 felt alert at the time of completing the questionnaire. Participant B2 reported quite a high level of sleepiness and indicated in the free-text entry that her health condition was particularly affecting her on that day.
Direct sun in the preceding two weeks (Q20): Participant B1 indicated that she felt her work had been hindered quite a lot by direct sun on her desk and reflections on her screen. Participant B2 indicated that she felt her work had not been hindered by direct sun on her desk or reflections on her screen.

3.6. Interview Data

Participants B1, B2 and B3 were interviewed on 23 January 2014. As Participant A1 was not available for interview in January 2014, responses from other interview dates are used here to illustrate the perceptions of occupants in Room A.
The three participants in Room B all spoke about the need to use the blinds every day, and in some cases that they needed to be pulled all the way down. The qualitative data suggest that the window controls were being ignored in favour of the blinds. The blinds were seen as a more instantaneous and familiar solution to the problem of low angle sun. For example, Participant B1, in discussing her use of all switches, noted: “To be honest we haven’t. I think it’s just quicker to pull the blinds, because the sun suddenly comes out, and you’re typing away, so it’s just a natural reaction, you just pull the blind and it blocks the sun. I did say I’ll try and use the controls to dim the windows and see if it works. We haven’t been using them to be honest. We just pull the blind and I think we forget about the controls.”
This sentiment is consistent with Participant B1’s questionnaire responses about light levels in the room (Q3, Table 3), where she had commented that it was quite sunny and that she had pulled the blinds as result. There was no mention of whether she had tried to tint the window first.
In contrast, Participant A1, when asked about how often she used the manual controls for the EC windows commented: “I don’t use them at all. I don’t need to. What I find strange is that, prior to the new windows, I was always having to adjust the blinds, but since we have had the new windows, I don’t have to use the switch. So the windows, they do work.” Another occupant of Room A (not a participant) commented in the end-of-study interview that she used the manual overrides frequently and successfully to adjust the light ingress through the windows.

3.7. Observations from Combined Data

The data from the daily experience sheets suggest that the EC glazing system performed to the satisfaction of the participants on some days, but not on others. The EC glazing control summary sheets show that days with large variations in solar irradiation, such as the example day, are particularly challenging for the control system. In an ideal scenario, the control system would temper this external variability, so that comfortable internal conditions are achieved. Examination of several data sources illustrates that VCAs by the occupants were required. Observed data from the EC glazing control logs show that the windows were manually tinted in Room A. The blinds diary shows that, although the occupants in Room B did not use the window controls, they engaged in VCAs at a similar time, i.e., they lowered the blinds. Qualitative data from questionnaires and interviews confirm that occupants experienced discomfort due to reflections, bright conditions and glare. The luminance images confirmed that there was some variability in internal conditions around the time of the observed VCAs. As it was not feasible in this study to trigger luminance capture just before and after VCAs, the data cannot be used to determine differences between comfortable/uncomfortable conditions, as was initially intended.
In addition to observing occupant behaviour, it is crucial to understand why occupants felt the need to change the internal conditions. Questionnaire responses indicate that physical factors are important, i.e., specific to room layout and viewing position; Participant B1, who is facing away from the windows, suffered from reflections on the computer screen and high light levels. In contrast, Participant B2, who faces the window, was happy with the lighting levels, but reports dissatisfaction with the view through the window. She does not report any problems with reflections. Data from luminance images confirm that there is indeed some variation between different areas of the room, with the area near the window being brighter and less uniform. It remains unclear whether or not the two occupants are reporting differently having experienced largely the same conditions or if positional factors (e.g., distance from the window and orientation) result in significantly different thermal and luminous “microclimates” within the office space. Moreover, the data suggest that physiological parameters are at play: Participant B2 reported thermal comfort issues and reduced alertness, which she links to her visual health condition.
The questionnaire and interview data also allow exploration of the reasons underlying a preference for use of EC glazing overrides or blinds. Responses from occupants of Room A (where more manual overrides are recorded) generally show a positive attitude to the EC glazing technology, whilst participants in Room B (where blind use is common) are more sceptical and prefer to use the more familiar/traditional control action. This suggests that users’ perception of the EC glazing technology may inform their preparedness to use it instead of the more familiar window blinds. It would have been instructive to compare this behaviour with what would have occurred in an EC-only scenario where there was no recourse to manual blinds, but the study setting did not allow for that.
Whilst the example data presented here are limited, the behaviour and comments from some occupants suggest that EC glazing can work well for daylight control in offices. The observations from combined data support the notion that, in addition to parameters related to the luminous conditions, contextual factors such as room layout, social constraints, as well as physiological and psychological factors, inform occupant perception and behaviour [3]. It is worth noting that the example data shown here come from a day with particularly challenging conditions, i.e., variable sunlight and low sun angles; across the full dataset, there were many days where the EC glazing system performed well without the need for any VCAs. Further analysis of the whole dataset will explore in detail how physical conditions, glazing performance and associated occupant perceptions and behaviour varied over the entire study period. Whilst it is acknowledged that the small dataset from this study will not allow us to capture the full range of occupancy behaviour, the analysis is expected to identify which contextual parameters should be considered in EC glazing behaviour models and whether and how they differ from those used in other models, such as blind use.

4. Discussion

The study presented here was designed to investigate occupant interaction with EC glazing technology in a real-world setting. A longitudinal mixed methods case study approach was developed in order to gather data to answer a set of research questions. Table 4 provides an overview of the research questions and data collection tools.
This section focusses on an assessment and critique of the study approach. It explores how well the various data types and collection methods worked in terms of achieving the desired research outcomes and provides suggestions for modifications and improvements. A final section outlines areas of further work in regards to the EC glazing case study.

4.1. Critique of Data Sources and Tools

The data from one study day illustrate the scope of data that was collected through the mixed methods approach and provide an example of how the different individual data sources can be combined. As identified in Section 3.7, input from more than one data source is required to answer the four research questions. Observed and measured data can provide quantitative information regarding the physical conditions, window tint states and occurrence of VCAs, but qualitative data (including interviews, ad hoc data and free-text comments in questionnaires) are needed to interpret their meaning for the occupants. Table 4 summarises how the different data sources can complement each other in answering the research questions (the number of tick marks denotes the weight of contribution). It can be seen from the table that there are a high number of matches, i.e., where data from one source can add value to another. It is instructive to see that even the more basic tools can contribute to the overall picture.
As illustrated in Table 4, the interviews were found to be the most useful; they contributed detailed data for all of the research questions. The EC glazing control log, the blinds diary and facade photos where crucial for logging occupants’ VCAs, but also provided data for two further questions. Luminance images were included in the methodology in order to provide measured data for characterising the visual environment and thus had the potential to contribute to three research questions. However, due to practical limitations, they could not be deployed effectively. As a result, the usefulness of the questionnaire data was also affected, because quantitative perception data could not be linked with physical measurements, as was initially intended. The following sections discuss the limitations of the different data sources in detail.

4.1.1. Measured Data

Measured data included external sensor data from the EC glazing control system and field-of-view luminance images. The former is logged at a short interval and thus provides a large set of high resolution time series data that can be linked to events recorded from other sources, such as blinds diary and luminance captures. As the format of the raw data was not conducive for analysis purposes, custom-written analysis tools had to be developed that allowed an extraction of relevant subsets of data, e.g., the summary sheets shown in Figure 3.
Luminance images were captured with an automated system that, once installed, required little researcher engagement. Data from such images can be useful for characterising the visual environment, and by comparing two subsequent images, we can examine how conditions changed between two instances. If the capture happens close to a VCA, the data may give insight into which conditions were perceived as not acceptable, i.e., triggered the VCA, and which conditions were achieved with VCA, i.e., conditions after the VCA. Thus, ideally, image capture should be triggered just before the VCA, either by the system (e.g., manual override triggers the camera before initiating the window tint) or by the participants (e.g., they trigger the camera before lowering blinds or pressing the override button) and directly afterwards. As development of such a system was outside the scope of this study, automated half-hourly capture of images was the best compromise in terms of data coverage and participant disruption. However, this meant that opportunities for linking measurements with VCAs were limited.

4.1.2. Observed Data

The main body of observed data came from the EC glazing control log, which provided time-stamped manual override data alongside other detailed data regarding glazing system performance. Some effort was required to set up the remote access to the control system log, and the method resulted in a large dataset that required the development of custom data processing routines.
To record the use of blinds, two simple data capture tools were utilised, specifically the blinds diary and the facade photos. These tools required minimal effort on behalf of the participants or the researcher, respectively. The use of an automated approach for capturing facade photos more frequently was considered, but, although such automated facade view capture is feasible with modern camera technology [31], it was not practical to implement in our study. Alternatively, blind use data may be extracted from luminance images [7,23]; this requires either time-intensive visual assessment of images by a researcher or the development of image analysis routines. In any case, it is certainly worth considering extracting observational data (e.g., occupant actions) from measured data where practicable, as they can provide data captured at short time intervals without requiring active participant engagement [20].

4.1.3. Self-Reported Data

It is generally acknowledged that self-reported data have limitations in occupant comfort studies in that participants’ responses may not be directly related to specific physical parameters [3]. For example, participants may be influenced by a wide range of factors, such as general attitude towards the technology, positive or negative previous experience and the wider social environment (e.g., group dynamics). Nevertheless, as such data can usefully complement the observed and measured data by providing valuable insights into occupant perception, experience and motivation, both questionnaires and interviews were included in our methodology.
The questionnaire had been designed to capture occupant perception data that could be linked to the physical measurements. However, to ensure that participants’ work was not unduly disrupted, participants were free to complete the questionnaire at any time within a two-week window. It was thus not possible to target questionnaire data collection to coincide with physical measurements. This limits the scope for identifying and quantifying the relationships between person-level data (e.g., perceptions of the visual environment) and actual visual environment conditions. To more fully utilise the potential of these tools to generate data that can be linked, they should be deployed simultaneously. This could be achieved by allowing participant-controlled capture, i.e., participants trigger measurements when they complete the questionnaire, similar to the approaches adopted by Painter et al. [18] or Konis et al. [7]. It is also advisable to consider focussing the questionnaire to a small number of parameters that can be directly linked to physical measurements and to allow participants to trigger data capture when they experience certain conditions [7,26]. Despite the limitations, the questionnaire data provided valuable repeated feedback from the occupants throughout the study period. The free-text entries were particularly useful, as they added important qualitative detail for the interpretation of quantitative data and, on occasion, led to follow-up questions in the subsequent interviews.
Interviews offered a surprisingly flexible mechanism through which issues arising during the study from observed or other self-reported data could be explored. This facilitated in-depth investigation of parameters additional to those originally identified and incorporated into the questionnaire. Data from the semi-structured interviews provided detailed qualitative information for the interpretation of findings from observed and measured data, which justified the significant time and effort that was required from participants and researchers, in the use of this method.
The daily experience sheet proved useful for continuously gathering feedback regarding the EC glazing system with minimal time investment by the participants. As this feedback could be easily accessed by the researchers without incurring time delays for data processing or analysis, it provided an advantage in terms of understanding and resolving issues with control system performance. Whilst there may be limitations in using such data for detailed analysis, the daily experience sheet could be a valuable tool in practical applications, such as commissioning of newly-installed EC glazing, e.g., when adjusting automatic control settings, such as set points and tint levels.

4.2. Recommendations for Methodology Design in Future Studies

The discussion so far illustrates that, although data collection tools were designed to fulfil specific roles within the methodology, not all functioned as intended due to limitations imposed by the study setting. Here, we provide guidance drawn from our experience of conducting this study.

4.2.1. Design for Participant Engagement

A crucial dimension of real-world research is engagement with participants, especially in studies with a small sample size. In this study, there was a high risk of not obtaining data of sufficient detail and quality if participants were dissatisfied with the data collection procedures. The research team thus spent considerable time and effort tailoring the tools and methods so as to minimise the disturbance of the participants’ work tasks while still maintaining regular contact throughout the study period. For example, data capture was automated as much as possible, and several simple tools were deployed that required minimal time investment from participants, yet still provided relevant feedback. As a result, we were able to monitor occupant satisfaction, with regard to both EC glazing and to participation in the study itself. It was thus possible to identify problems as they arose and address them in a timely manner. Participants appreciated that their feedback was acted upon quickly; our observation is that this helped to reduce participant burden and facilitated engagement throughout the monitoring period.

4.2.2. The Research Team

In the development of this multi-tool methodology, it was crucial to work within a multidisciplinary research team that combined the expertise of individuals with varied backgrounds, including lighting design, social science research, building and daylight modelling and real-world comfort research. As all team members had had previous experience of working in multidisciplinary teams, everyone appreciated that there are differences between research domains (e.g., language, philosophical approaches) that can potentially be barriers, and care was taken to ensure that, instead, the project benefited from the variety in experience.

4.2.3. Choosing and Adapting Data Collection Methods

In this case study, we applied a pragmatism mixed method approach that utilised a combination of data collection tools. Overall, the methodology worked well, albeit with some limitations, as outlined in Section 4.1, and several recommendations can be made with regard to the selection of tools for use in future real-world studies of occupants and their visual environment:
  • The most useful tool was the interview. This facilitated a detailed exploration of occupants’ perception and experience. If used in combination with tools that can log VCAs (e.g., EC glazing log, blinds diary), a valuable and complementary dataset can be derived that captures both actual occupant behaviour, as well as qualitative insight that helps to interpret the observed behaviour.
  • To extend the dataset, e.g., to investigate the physical conditions and occupants’ perception of those conditions in more detail, luminance maps and questionnaire data can be useful additional tools. Adapting their design and deployment (i.e., to ensure simultaneous capture) is recommended in order to increase their effectiveness as data collection tools for visual comfort research. Significant effort may be required to achieve automated data collection and processing of the derived dataset.
  • A potentially useful intermediate step could be to occasionally collect physical measurements simultaneously with specific ad hoc qualitative data from occupants. This could be targeted at certain seasons, weather conditions, etc., in order to capture the range of conditions that occupants experience, but would not require the automated monitoring and frequent deployment of questionnaires of the advanced approach outlined in Point 2.
  • Using an interview approach allows a deeper exploration of the participants’ experiences and motivations than questionnaires; thus, it may be preferable in studies with small sample sizes where statistical analysis is limited. It may be helpful to occasionally use a short questionnaire to capture current or emerging issues to feed into the interview questions in order to ensure that the interview effort achieves its full potential.
Several recommendations can also be drawn with respect to the actual design and deployment of the individual tools. These include:
  • To facilitate investigation of uncomfortable vs. comfortable conditions, physical measurements should be taken as closely as possible in time to VCAs, i.e., to be able to compare “before” and “after” conditions.
  • Observational data may be derived from measured data (e.g., control logs) and self-reported data (e.g., blinds diary), which can reduce the need for active participant engagement. However, custom processing procedures may be required to extract relevant data.
  • Self-reported data collection tools demand careful design in order to justify the time that can be involved for both participants (to complete) and researchers (to analyse). For questionnaire design, a strict focus on the most important aspects is crucial in order to manage participant burden.
  • It is useful to allow participants to enter free-text comments for selected parameters in questionnaires, as this can provide useful qualitative data that can help to interpret the quantitative responses.
  • To be able to link self-reported data to physical measurements, ensure simultaneous capture of both data sources, and focus the questionnaire on a very small number of parameters.
  • Ad hoc data from opportunistic interaction with the participants can provide additional information during the periods between interviews; this may be one way to reduce participant burden, for example if it is used instead of questionnaires.
  • Simple tools, such as a daily experience sheet and a blinds diary, are useful for gathering coarse data. Whilst they may have limitations in terms of completeness and detail, they can provide continuous feedback whilst requiring small time investment from participants.

4.3. Further Work in Regards to EC Glazing Research

The longitudinal data collection effort resulted in a large and heterogeneous dataset. Building on the exploratory analysis presented here, linkages between data subsets will be examined for trends and patterns of occupant interaction with EC glazing technology over the longer term.
In this paper, we extracted simple summary statistics from the luminance images, but the images contain far more information regarding the visual environment and its variability. Work is in progress to identify parameters that may be more informative and more strongly linked to occupant perception [8].
The importance of seating position and orientation of office occupants is well established in the literature. For example, from glare studies, it is understood that distance from window and viewing angle are crucial (e.g., [6,7]). Jakubiec and Reinhart [10] showed that humans will re-orientate themselves to reduce the discomfort caused by glare. Work by Aries et al. [32] suggests that the distance from the window combined with the perception of environmental conditions is an important predictor of comfort. More work is required to investigate to what extent these findings apply to offices with EC glazing.
Further analysis of the self-report data (particularly sources of qualitative information) will help to understand whether the contextual factors for other building control technologies, e.g., as identified by O’Brien et al. [3], are directly applicable to EC glazing offices. Whilst early findings indicate that factors, such as group interaction, ability to reposition and ease of use of the controls, are indeed applicable, other aspects need to be investigated specifically for this new technology, due to its specific characteristics: (i) EC glazing allows the control of daylight ingress, but does not restrict the view (unlike other shading devices, such as blinds); (ii) there is a time delay between control action and noticeable system response (this is similar to a thermal comfort control system, but arguably, visual discomfort is harder to ignore than thermal discomfort, so the delay may not be as easily accommodated).
The observations described in this paper suggest that user perception and acceptance of the technology are important for its use. There are multiple factors that can help build and maintain trust in a new technology, including reliability, validity, predictability and dependability of the technology and early experience of the users [33,34], and in our study, we can identify some of these issues. For example, problems with the retrofit may have affected trust development in the early stages. Furthermore, the delay in tint level transition after a manual control action could appear to users as a malfunction and affect their trust in the technology as it reduces “predictability” and “dependability” [34]. As a result, users may be less likely to use the new technology, particularly if a more familiar alternative (i.e., blinds) exists. These issues are further complicated in open-plan offices, where group dynamics and social constraints can affect the attitude towards a technology, as well as the choice and frequency of VCAs [3].
Whilst our study can provide insight into these aspects and can highlight their importance to manufacturers and installers of EC glazing, a more detailed investigation of the links between perception, attitude and trust would be valuable in order to support successful implementation of the technology. Concepts from the field of diffusion of innovation and the technology acceptance model may be useful here (e.g., [35,36]), although careful assessment of the applicability of these approaches to occupant interaction with building control technology will be necessary.

5. Conclusions

This paper reports the experiences from a real-world case study of user interaction with electrochromic (EC) glazing technology in an office setting. Whilst occupant behaviour models have been developed for most common building control technologies (e.g., windows, blinds, heating/cooling) [2], this work is currently in the early stages for EC glazing technology. It is yet to be established to what extent existing knowledge regarding occupant behaviour is applicable to this new technology. Our small case study of the first commercial installation of EC glazing in the U.K. represents a first step in that regard.
The specific focus of this paper is on the process of conducting occupant behaviour research in a real-world setting. The case study utilised a longitudinal mixed methods approach that incorporated a range of tools for the collection of measured, observed and self-reported data, with the aim to answer a set of research questions regarding occupants’ experience with EC glazing. Using data from a small part of the data collection period (one day out of one year), the benefits of combining different data are illustrated, and the efficacy of the data collection methods is explored.
Based on the experience of implementing this real-world case study, specific recommendations have been identified for the choice and combination of data collection methods for use in future occupant behaviour studies. These range from a relatively simple approach that uses a combination of interviews and occupant action logging to an advanced approach that additionally incorporates frequent automated capture of physical measurements together with further self-reported data. Recommendations for the design and deployment of individual data collection tools are also provided, including specific advice on timing of data capture and the design of self-reported data tools.
The example data and discussion illustrate that, whilst real-world studies may be subject to practical limitations, such as small sample size and limited choice of room layouts, a carefully-designed data collection methodology can provide a valuable dataset for the investigation of occupant behaviour and motivations. The paper is intended to supplement other occupant behaviour studies, which tend to focus on the technical findings, by providing examples of multi-method data and a discussion of the different data collection tools used. It is hoped that it will be useful for other researchers who are developing methodologies for the study of occupant behaviour in real-world settings.
In terms of progressing behaviour models for EC glazing research, the case study presented here has the potential to make a valuable contribution, as it addresses the physical performance of the system, observed occupant behaviour and the contextual factors affecting occupant interaction with the technology. Whilst it may not be possible to draw generalisable conclusions regarding occupant behaviour from this initial exploratory analysis, the data nevertheless illustrate the variability in experiences and highlight the wide range of contextual factors that inform user interaction with EC glazing control. Knowledge regarding these issues is crucial for developing robust occupant behaviour models and can thus help the technology to achieve its potential, e.g., increased occupant wellbeing and building energy efficiency due to better control of daylight.

Acknowledgments

Painter and Kelly Waskett acknowledge the support of De Montfort University and Mardaljevic the support of Loughborough University. Irvine was supported by the Scottish Government’s Rural and Environment Science and Analytical Services Division (RESAS). EC windows and associated technical support were provided by SAGE Electrochromics, Inc., and Saint-Gobain Recherche. We thank the reviewers who provided critical and constructive feedback on an earlier version.

Author Contributions

All authors were involved in the development of the methodology. Kelly Waskett carried out the data collection and analysis under the guidance of Painter, Mardaljevic and Irvine. Painter took the lead in writing the paper. Irvine contributed substantially to the development and improvement of the manuscript. Kelly Waskett provided the example data, as well as material on study background and methods. Mardaljevic developed the custom processing routines for data visualisation. All authors contributed to the editing and reviewing of the document.

Conflicts of Interest

The authors declare no conflict of interest. The funding sponsors had no role in the design of the study nor in the collection, analyses and interpretation of data.

References

  1. Galasiu, A.D.; Veitch, J.A. Occupant preferences and satisfaction with the luminous environment and control systems in daylit offices: A literature review. Energy Build. 2006, 38, 728–742. [Google Scholar] [CrossRef]
  2. Yan, D.; O’Brien, W.; Hong, T.; Feng, X.; Gunay, H.B.; Tahmasebi, F.; Mahdavi, A. Occupant behavior modeling for building performance simulation: Current state and future challenges. Energy Build. 2015, 107, 264–278. [Google Scholar] [CrossRef]
  3. O’Brien, W.; Gunay, H.B. The contextual factors contributing to occupants’ adaptive comfort behaviors in offices—A review and proposed modeling framework. Build. Environ. 2014, 77, 77–87. [Google Scholar] [CrossRef]
  4. Hoes, P.; Hensen, J.; Loomans, M.; de Vries, B.; Bourgeois, D. User behavior in whole building simulation. Energy Build. 2009, 41, 295–302. [Google Scholar] [CrossRef]
  5. O’Brien, W.; Gunay, H. Mitigating office performance uncertainty of occupant use of window blinds and lighting using robust design. Build. Simul. 2015, 8, 621–636. [Google Scholar] [CrossRef]
  6. Wienold, J.; Christoffersen, J. Evaluation methods and development of a new glare prediction model for daylight environments with the use of CCD cameras. Energy Build. 2006, 38, 743–757. [Google Scholar] [CrossRef]
  7. Konis, K. Evaluating daylighting effectiveness and occupant visual comfort in a side-lit open-plan office building in San Francisco, California. Build. Environ. 2013, 59, 662–677. [Google Scholar] [CrossRef]
  8. Van Den Wymelenberg, K.; Inanici, M. A Critical Investigation of Common Lighting Design Metrics for Predicting Human Visual Comfort in Offices with Daylight. Leukos 2014, 10, 145–164. [Google Scholar] [CrossRef]
  9. Konis, K. Predicting visual comfort in side-lit open-plan core zones: Results of a field study pairing high dynamic range images with subjective responses. Energy Build. 2014, 77, 67–79. [Google Scholar] [CrossRef]
  10. Jakubiec, J.A.; Reinhart, C.F. The “adaptive zone”—A concept for assessing discomfort glare throughout daylit spaces. Light. Res. Technol. 2012, 44, 149–170. [Google Scholar] [CrossRef]
  11. Sutter, Y.; Dumortier, D.; Fontoynont, M. The use of shading systems in VDU task offices: A pilot study. Energy Build. 2006, 38, 780–789. [Google Scholar] [CrossRef]
  12. Heschong, L. Daylight Metrics: PIER Daylighting Plus Research Program. In Final project report for Public Interest Research (PIER) Program; California Energy Commission: Sacramento, CA, USA, 2012. [Google Scholar]
  13. Mardaljevic, J.; Heschong, L.; Lee, E. Daylight metrics and energy savings. Light. Res. Technol. 2009, 41, 261–283. [Google Scholar] [CrossRef]
  14. Clear, R.D.; Inkarojrit, V.; Lee, E.S. Subject responses to electrochromic windows. Energy Build. 2006, 38, 758–779. [Google Scholar] [CrossRef]
  15. Robson, C. Real World Research; John Wiley & Sons, Inc.: Chichester, UK, 2011. [Google Scholar]
  16. Creswell, J.; Clark, V. Designing and Conducting Mixed Methods Research; SAGE Publications: Los Angeles, CA, USA, 2011. [Google Scholar]
  17. Krosnick, J.A. Survey research. Annu. Rev. Psychol. 1999, 50, 537–567. [Google Scholar] [CrossRef] [PubMed]
  18. Painter, B.; Fan, D.; Mardaljevic, J. Evidence-Based Daylight Research: Development of a New Visual Comfort Monitoring Method; Lux Europa: Istanbul, Turkey, 2009; pp. 953–960. [Google Scholar]
  19. Hirning, M.; Isoardi, G.; Coyne, S.; Hansen, V.G.; Cowling, I. Post occupancy evaluations relating to discomfort glare: A study of green buildings in Brisbane. Build. Environ. 2013, 59, 349–357. [Google Scholar] [CrossRef] [Green Version]
  20. Moosmann, C. Visual Comfort and Daylight in Offices (Visueller Komfort und Tageslicht am Büroarbeitsplatz. Eine Felduntersuchung in Neun Gebäuden). Ph.D. Thesis, Karlsruher Institut für Technologie (KIT), Karlsruhe, Germany, 2014. [Google Scholar]
  21. Rubin, A.I.; Collins, B.L.; Tibbott, R.L. Window blinds as a potential energy saver—A case study. In NSB Building Science Series 112; National Bureau of Standards: Washington, DC, USA, 1978. [Google Scholar]
  22. Meerbeek, B.; te Kulve, M.; Gritti, T.; Aarts, M.; van Loenen, E.; Aarts, E. Building automation and perceived control: A field study on motorized exterior blinds in Dutch offices. Build. Environ. 2014, 79, 66–77. [Google Scholar] [CrossRef]
  23. Correia da Silva, P.; Leal, V.; Andersen, M. Occupants interaction with electric lighting and shading systems in real single-occupied offices: Results from a monitoring campaign. Build. Environ. 2013, 64, 152–168. [Google Scholar] [CrossRef]
  24. Lee, E.S.; Claybaugh, E.S.; LaFrance, M. End user impacts of automated electrochromic windows in a pilot retrofit application. Energy Build. 2012, 47, 267–284. [Google Scholar] [CrossRef]
  25. Inoue, T.; Kawase, T.; Ibamoto, T.; Takakusa, S.; Matsuo, Y. The development of an optimal control system for window shading devices based on investigations in office buildings. ASHRAE Trans. 1988, 104, 1034–1049. [Google Scholar]
  26. Painter, B.; Mardaljevic, J.; Fan, D. Monitoring daylight provision and glare perception in office environments. In Proceedings of the CIB World Congress 2010, Manchester, UK, 11–13 May 2010.
  27. Fernandes, L.; Lee, E.; Ward, G. Lighting energy savings potential of split-pane electrochromic windows controlled for daylighting with visual comfort. Energy Build. 2013, 61, 8–20. [Google Scholar] [CrossRef]
  28. Piccolo, A.; Pennisi, A.; Simone, F. Daylighting performance of an electrochromic window in a small scale test-cell. Sol. Energy 2009, 83, 832–844. [Google Scholar] [CrossRef]
  29. Mardaljevic, J.; Kelly Waskett, R.; Painter, B. Neutral Daylight Illumination with Variable Transmission Glass: Theory and Validation. Light. Res. Technol. 2015. [Google Scholar] [CrossRef] [Green Version]
  30. Kelly, R.; Painter, B.; Mardaljevic, J.; Irvine, K. Capturing the User Experience of Electrochromic Glazing in an Open Plan Office. In Proceedings of the CIE Midterm Conference—Towards a New Century of Light, Paris, France, 12–19 April 2013.
  31. Brown, N. Image processing for overnight lighting quantification in buildings. In Proceedings of IEECB 2010, Improving Energy Efficiency in Commercial Buildings, Frankfurt, Germany, 13–14 April 2010.
  32. Aries, M.B.; Veitch, J.A.; Newsham, G.R. Windows, view, and office characteristics predict physical and psychological discomfort. J. Environ. Psychol. 2010, 30, 533–541. [Google Scholar] [CrossRef]
  33. Xu, J.; Le, K.; Deitermann, A.; Montague, E. How different types of users develop trust in technology: A qualitative analysis of the antecedents of active and passive user trust in a shared technology. Appl. Ergon. 2014, 45, 1495–1503. [Google Scholar] [CrossRef] [PubMed]
  34. Hoff, K.; Bashir, M. Trust in automation: Integrating empirical evidence on factors that influence trust. Hum. Factors 2015, 57, 407–434. [Google Scholar] [CrossRef] [PubMed]
  35. Rogers, E.M. Diffusion of Innovations; Simon and Schuster: New York, NY, USA, 2010. [Google Scholar]
  36. Venkatesh, V.; Morris, M.G.; Davis, G.B.; Davis, F.D. User Acceptance of Information Technology: Toward a Unified View. MIS Q. 2003, 27, 425–478. [Google Scholar]
Figure 1. Photographs of the electrochromic (EC) windows in the two offices with corresponding schematics showing the control zones.
Energies 09 00215 g001
Figure 2. Room layout showing desks, participant seating positions (A1, B1, B2 and B3) and luminance cameras (HDR1–HDR3; HDR, high dynamic range).
Energies 09 00215 g002
Figure 3. Control system summary sheet showing selected data extracted from the EC glazing control log for (a) 23 January 2014 and, for comparison; (b) 11 July 2013, including illuminance data from external sensor, window tint states and manual overrides. Compare Figure 1 for window/zone arrangements. Note, sun azimuth and altitude are not part of the log, but were calculated separately.
Energies 09 00215 g003
Figure 4. (a) Blinds diary sheet for January 2014 (the example day is highlighted, and the original entries of participant initials have been replaced with their study IDs); (b) Facade photo showing both case study offices from the outside on the example day at 12:32.
Energies 09 00215 g004
Figure 5. Selected false-colour luminance images from around the time of visual comfort actions (VCAs), morning (top two images) and afternoon (lower two images). Note, the scale of luminance (cd/m 2 ) and time stamps are in the corner of each image.
Energies 09 00215 g005
Figure 6. Example of a daily experience sheet, showing responses from Participant B1 in January 2014 (example day highlighted with a blue border).
Energies 09 00215 g006
Table 1. Common data types and collection methods used for real-world visual environment research, including examples of published studies.
Data TypeData Collection MethodExamples of Real-World Studies
MeasuredVisual environment measurements, e.g., illuminance, luminance images[7,11,18,19,20]
ObservedOccupant actions and behaviour logging, e.g., blind use, manual overrides of control system, control settings and switch events, system behaviour[7,11,20,21,22,23,24]
Self-reportedQuestionnaire, interview, ad hoc feedback[7,18,19,20,21,23]
Table 2. Overview of the data collection methods used in the case study, showing the types of tools used and the timing and frequency of their application (* the blinds diary is considered both “observed” and “self-reported”; although the action is self-reported by participants, the diary records an action, thereby providing information on occupant behaviour).
TypeMethod Used in Our StudyCollection Interval
MeasuredExternal illuminanceContinuous (1/min; part of control system log)
Luminance images30 min
(Desk illuminance)(Equipment was error prone, thus disregarded)
ObservedBlinds diary *When applicable (can be more than once a day)
Facade photoOpportunistic, approximately twice weekly
EC glazing control log (tint settingsContinuous (1/min)
and manual overrides)
Self-reportedBlinds diary *When applicable (can be more than once a day)
Daily experience sheetOnce per day
QuestionnaireMonthly (initially twice weekly until July 2013)
InterviewEvery 3 months (+ pre- and post-installation)
Ad hoc feedbackOpportunistic (varying from weekly to monthly)
Table 3. Questionnaire responses from Participants B1 and B2 for the example day (response scales all 5-point bi-polar unless stated otherwise; Q3: too dark–too bright; Q4: poorly distributed–nicely distributed; Q7: yes/no (if yes, identify source); Q12: Karolinska Sleepiness Scale (9-point; 1 = extremely alert, 9 = extremely sleepy); Q14: very dissatisfied–very satisfied; Q15: very difficult–very easy; Q20: not at all–very much).
QuestionParticipant B1 ResponseParticipant B2 Response
Q3: How would you describe the total light level (from the windows and overhead lighting together) in your office at the moment?Slightly too brightJust right
Q4: How would you describe the distribution of light in your office at the moment?Quite nicely distributedNicely distributed
Q7: At the moment, are you experiencing any reflections on your computer screen? If yes, whatdo you think is the source of the reflections?Yes—windowsNo
Q12: Please indicate how tired or alert you currently feel.AlertSleepy, but no difficulty staying awake
Q14: How satisfied are you with the clarity of the view through the windows at the moment?Very satisfiedVery dissatisfied
Q15: At this moment, how easy is it to gauge the weather outside by looking through the window?Quite easyVery difficult
Q20: During the past two weeks, please indicate to what extent your work was hindered by (i)direct sunlight on your desk, (ii)reflectionsonyourscreen.(i) Quite a lot(ii) Quite a lot
(i) Not at all(ii) Not at all
Table 4. Mapping data sources with research questions. Number of ✓ indicates weight of contribution; * Denotes indirect contribution: occurrence of visual comfort actions (VCAs); ** Denotes indirect contribution: internal conditions before and after VCAs.
EC Glazing Control LogLuminance Maps (HDR)Daily Experience SheetBlinds Diary and Facade PhotosQuestionnaireInterviews and Ad-Hoc Data
How effectively does the EC glazing system control the internal luminous environment?✓**✓✓✓✓✓
Which luminous environment conditions are perceived as comfortable or uncomfortable?✓*✓*✓*✓✓
Which visual comfort actions (VCAs) do occupants take to control/maintain comfort?✓✓✓✓✓✓✓✓✓
Which contextual parameters inform occupants’ use of the EC glazing system?✓✓✓✓✓

