Phase Transformation of Doped LiCoPO4 during Galvanostatic Cycling
by
 ,
,
Wen Zhu
1,* ,
,
Dongqiang Liu
1,
Catherine Gagnon
1,
Vincent Gariépy
1,
Michel L. Trudeau
1,*, 
Ashok Vijh
1 and
Karim Zaghib
2 
1
Center of Excellence in Transportation Electrification and Energy Storage Hydro Québec, 1800 Boulevard Lionel-Boulet, Varennes, QC J3X1S1, Canada
2
Department of Mining and Materials Engineering, McGill University, 845 Sherbrooke Street West, Montréal, QC H3A0G4, Canada
*
Authors to whom correspondence should be addressed.
Materials 2020, 13(17), 3810; https://0-doi-org.brum.beds.ac.uk/10.3390/ma13173810
Submission received: 12 August 2020
/
Revised: 25 August 2020
/
Accepted: 26 August 2020
/
Published: 28 August 2020
(This article belongs to the Special Issue Electrochemical Materials in Batteries)
Abstract
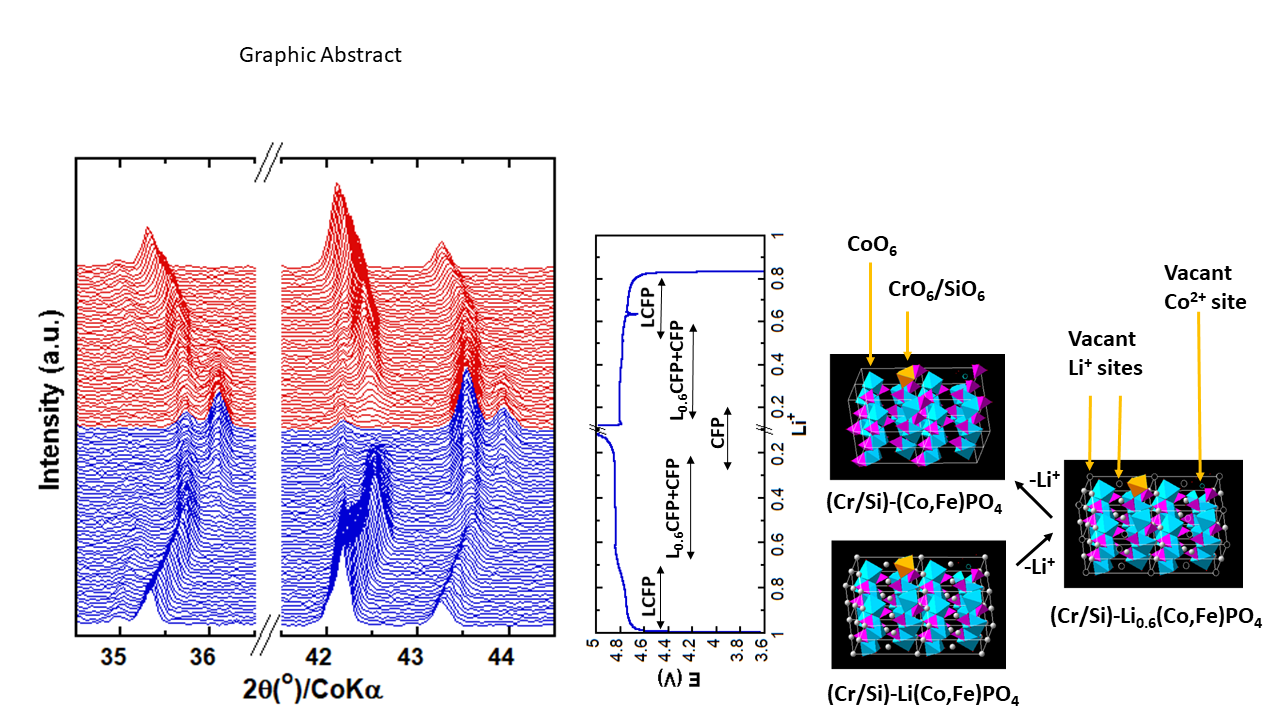
:In situ X-ray diffraction was employed to investigate the crystal structure changes in Cr/Si co-doped Li(Co,Fe)PO4 cathode material during a galvanostatic charge/discharge process at a slow rate of C/30. The evolution of the X-ray patterns revealed that the phase transformation between the Cr/Si-Li(Co,Fe)PO4 and Cr/Si-(Co,Fe)PO4 is a two-step process, which involves the formation of an intermediate compound of Cr/Si-Li0.62(Co,Fe)PO4 upon the extraction of Li ions from the pristine phase. Different from the previously reported two biphasic transition steps, the phase transformation of the Cr/Si-Li(Co,Fe)PO4 followed a solid solution and a biphasic reaction pathway at different stages of the delithiation/lithiation process, respectively.

1. Introduction
LiFePO4 (LFP) is a cathode material characterized by structural and thermal stability, low cost, and high safety, as well as a low operating voltage (3.5 V) and low conductivity [1,2,3]. To overcome the shortcomings deriving from the low operating voltage of LFP, the application of other members of the olivine family (LMPs), containing the transition metal M=Mn, Co, Ni, or a combination of them, has been explored [4,5,6,7]. Among them, LiCoPO4 (LCP) is of great interest, owing to its large theoretical specific capacity (167 mAh g−1) and high operating voltage 4.8 V (vs. Li/Li+). These properties result in a specific energy of ∼800 Wh kg−1 (i.e., ~25% higher than that of conventional cathodes in Li-ion batteries [5]).
LMPs and their charging end products, MPO4 (MP), have an olivine structure, with an orthorhombic unit cell and a Pnma space group (SG). Li ion intercalation/deintercalation processes occur in a one-dimensional channel along the [010] direction [8,9,10]. A two-phase reaction mechanism was first proposed for LFP, owing to the narrow single-phase ranges near the stoichiometry compositions of LFP and FePO4 (FP). Detailed studies have demonstrated that the LFP-to-FP reaction mechanism depends not only on the material’s intrinsic properties, but also on the size and orientation of the particles [11,12,13], the cycling rate [14,15], temperature [16], and the strains [17,18].
While the working mechanisms of LFP are well studied, it is likely to assume that the operation mechanisms of the LMP family members are the same. But previous studies on Li(Mn,Fe)PO4 and LCP have demonstrated different situations in these two cases. Perea et al. [19] examined the phase transformation process in the LiMnyFe1−yPO4 system in relation to the Mn contents. They proposed a three-step phase change process for LiMnyFe1−yPO4 (0.25 ≤ y < 0.75), which, in fact, showed five regions in the phase diagram, including two narrow solid solution (ss) regions near the two end products, plus three main regions. The phase regions are in the order of: (1) ss-Li1−xMnyFe1−yPO4; (2) biphasic domain related to Fe3+/Fe2+; (3) ss-intermediate phase; (4) biphasic domain of Mn3+/Mn2+; (5) ss-MnyFe1−yPO4 as the Li+ content decreased from 1 to 0. In addition, the phase transitions of Mn- and Fe-rich compositions (i.e., LiMnyFe1−yPO4 with 0.75 ≤ y < 1 and 0 < y < 0.25) follow a pathway that pass through three regions in the phase diagram, i.e,—a solid solution, a biphasic, and another solid solution regions. The main difference between the mechanisms of Mn- and Fe-rich compositions lies in the biphasic region, which is attributed to the Mn3+/Mn2+ redox couple in the former and to the Fe3+/Fe2+ in the latter case. On the other hand, different phase evolution mechanisms have been proposed for LCP. Initially, a two-phase mechanism was suggested based on the ex situ X-ray diffraction (XRD) results—i.e., the phase transformation follows the reaction: LiCoPO4 ↔ CoPO4 + Li+ + e− [4]. Later studies [7,20,21,22] introduced a stepwise phase separation mechanism by monitoring the phase evolution during cycling via the in situ synchrotron and in situ neutron diffraction techniques. This mechanism involved an intermediate phase of Li0.6–0.7CoPO4, and the transformation went through two biphasic regions: (1) LiCoPO4 ↔ Li0.6CoPO4 + 0.4Li+ + 0.4 e−; (2) Li0.6CoPO4 ↔ CoPO4 + 0.6Li+ + 0.6e− (assume the intermediate phase is Li0.6CoPO4). In addition, an intermediate phase with a relatively low Li content (Li0.2–0.45CoPO4) was derived from the electrochemical experimental results [23]. In the present work, we investigated the working mechanism of a high-capacity Cr/Si co-doped LiCo0.82Fe0.1PO4 cathode via in situ XRD. The results confirmed the appearance of an intermediate phase, Cr/Si-Li0.62(Co,Fe)PO4, and revealed the concurrence of the solid solution and two-phase pathways during the charge/discharge process, for the first time.
2. Experimental
The electrochemical cell consisted of a Cr/Si co-doped LiCo0.82Fe0.1PO4 (simply called ‘LCFP’ hereafter)cathode, a Li anode, and a Celgard polypropylene separator, which were dried at 120 °C overnight under a vacuum. The electrolyte was composed of a 1.2 M LiPF6 solution in a 3:7 (wt.%) mixture of ethylene carbonate and ethyl methyl carbonate electrolyte, and 2 wt.% tris (trimethylsilyl) phosphite. The electrochemical measurements were carried out using a Biologic SP300 potentiostat (BioLogic Science Instrument, Seyssinet-Pariset, France), controlled by EC-Lab (V10.19, BioLogic Science Instrument, Seyssinet-Pariset, France). The experimental coin cell was cycled between 3.6 and 5 V at a rate of C/30 for three cycles. The first cycle was considered as a formation cycle, during which the cathode material was activated and the solid electrolyte interface (SEI) layer was formed, while the following cycles were considered more relevant to the electrochemical performance of the battery; therefore, the XRD patterns were only collected after the first cycle.
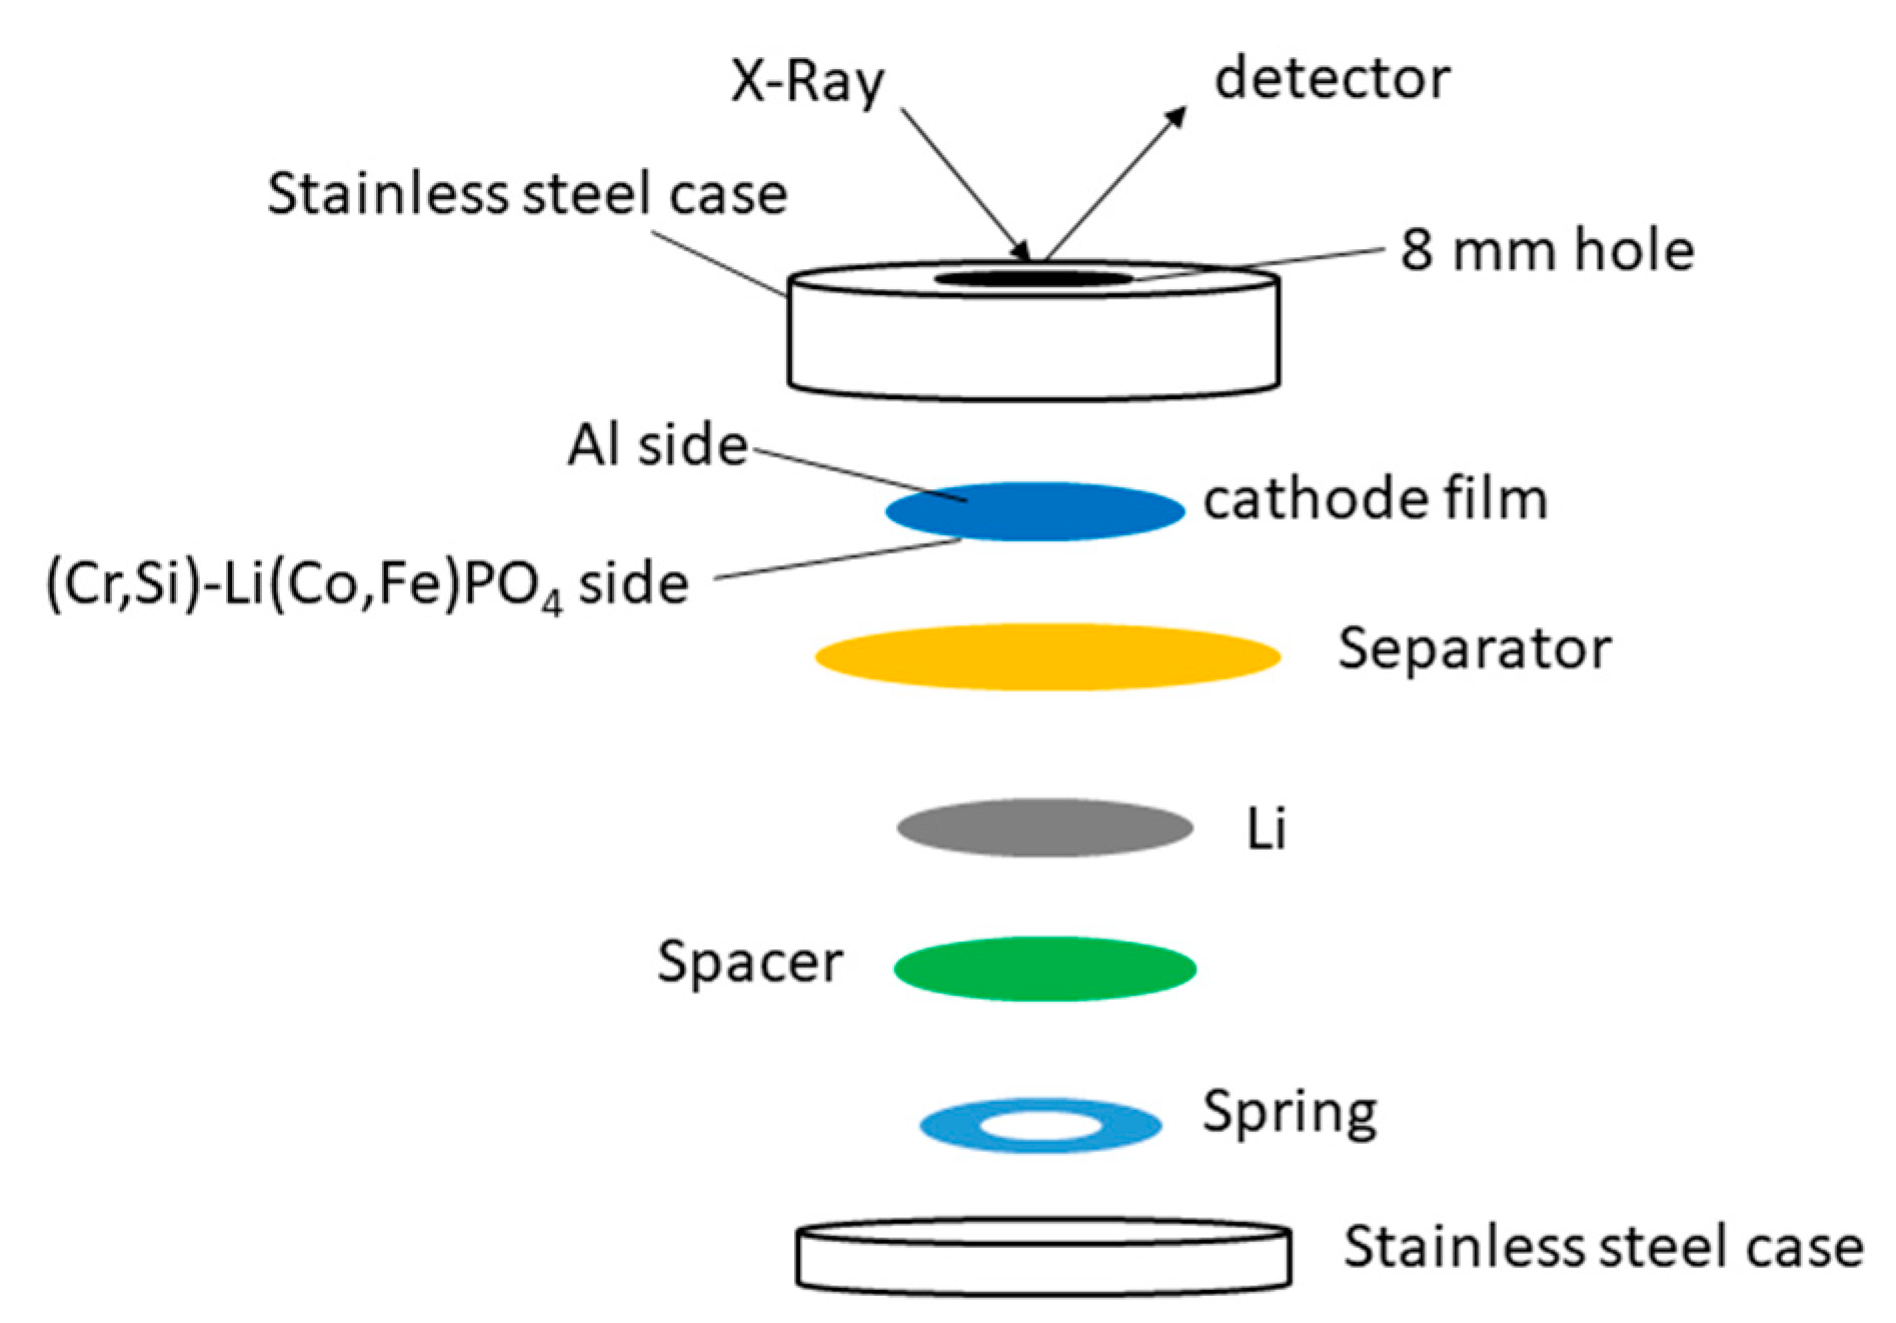
Cr/Si co-doped LiCo0.82Fe0.1PO4 was prepared via a high-energy ball milling of the raw materials, followed by a solid-state reaction. A slurry with 85 wt.% of LCFP active material was tape casted on a 15 µm thick Al foil. Detailed information about the preparation of the powder and cathode can be found in one of our previous works [24]. The in situ XRD patterns were collected from a standard 2032-coin cell with an 8 mm hole drilled on the top case. The Al current collector from the cathode film also acted as an X-ray window, and a silver paste was used to seal the Al window and the top part of the stainless-steel cell case. Figure 1 is a schematic diagram of the in situ cell. The in situ X-ray measurements were performed with a Smartlab diffractometer (Rigaku, Tokyo, Japan) using Co-Kα radiation at a step size of 0.04° and scan rate of 2.219°/min—i.e., 30 min/scan. The sample displacements were corrected by taking the Al diffraction peak as reference.
3. Results and Discussion
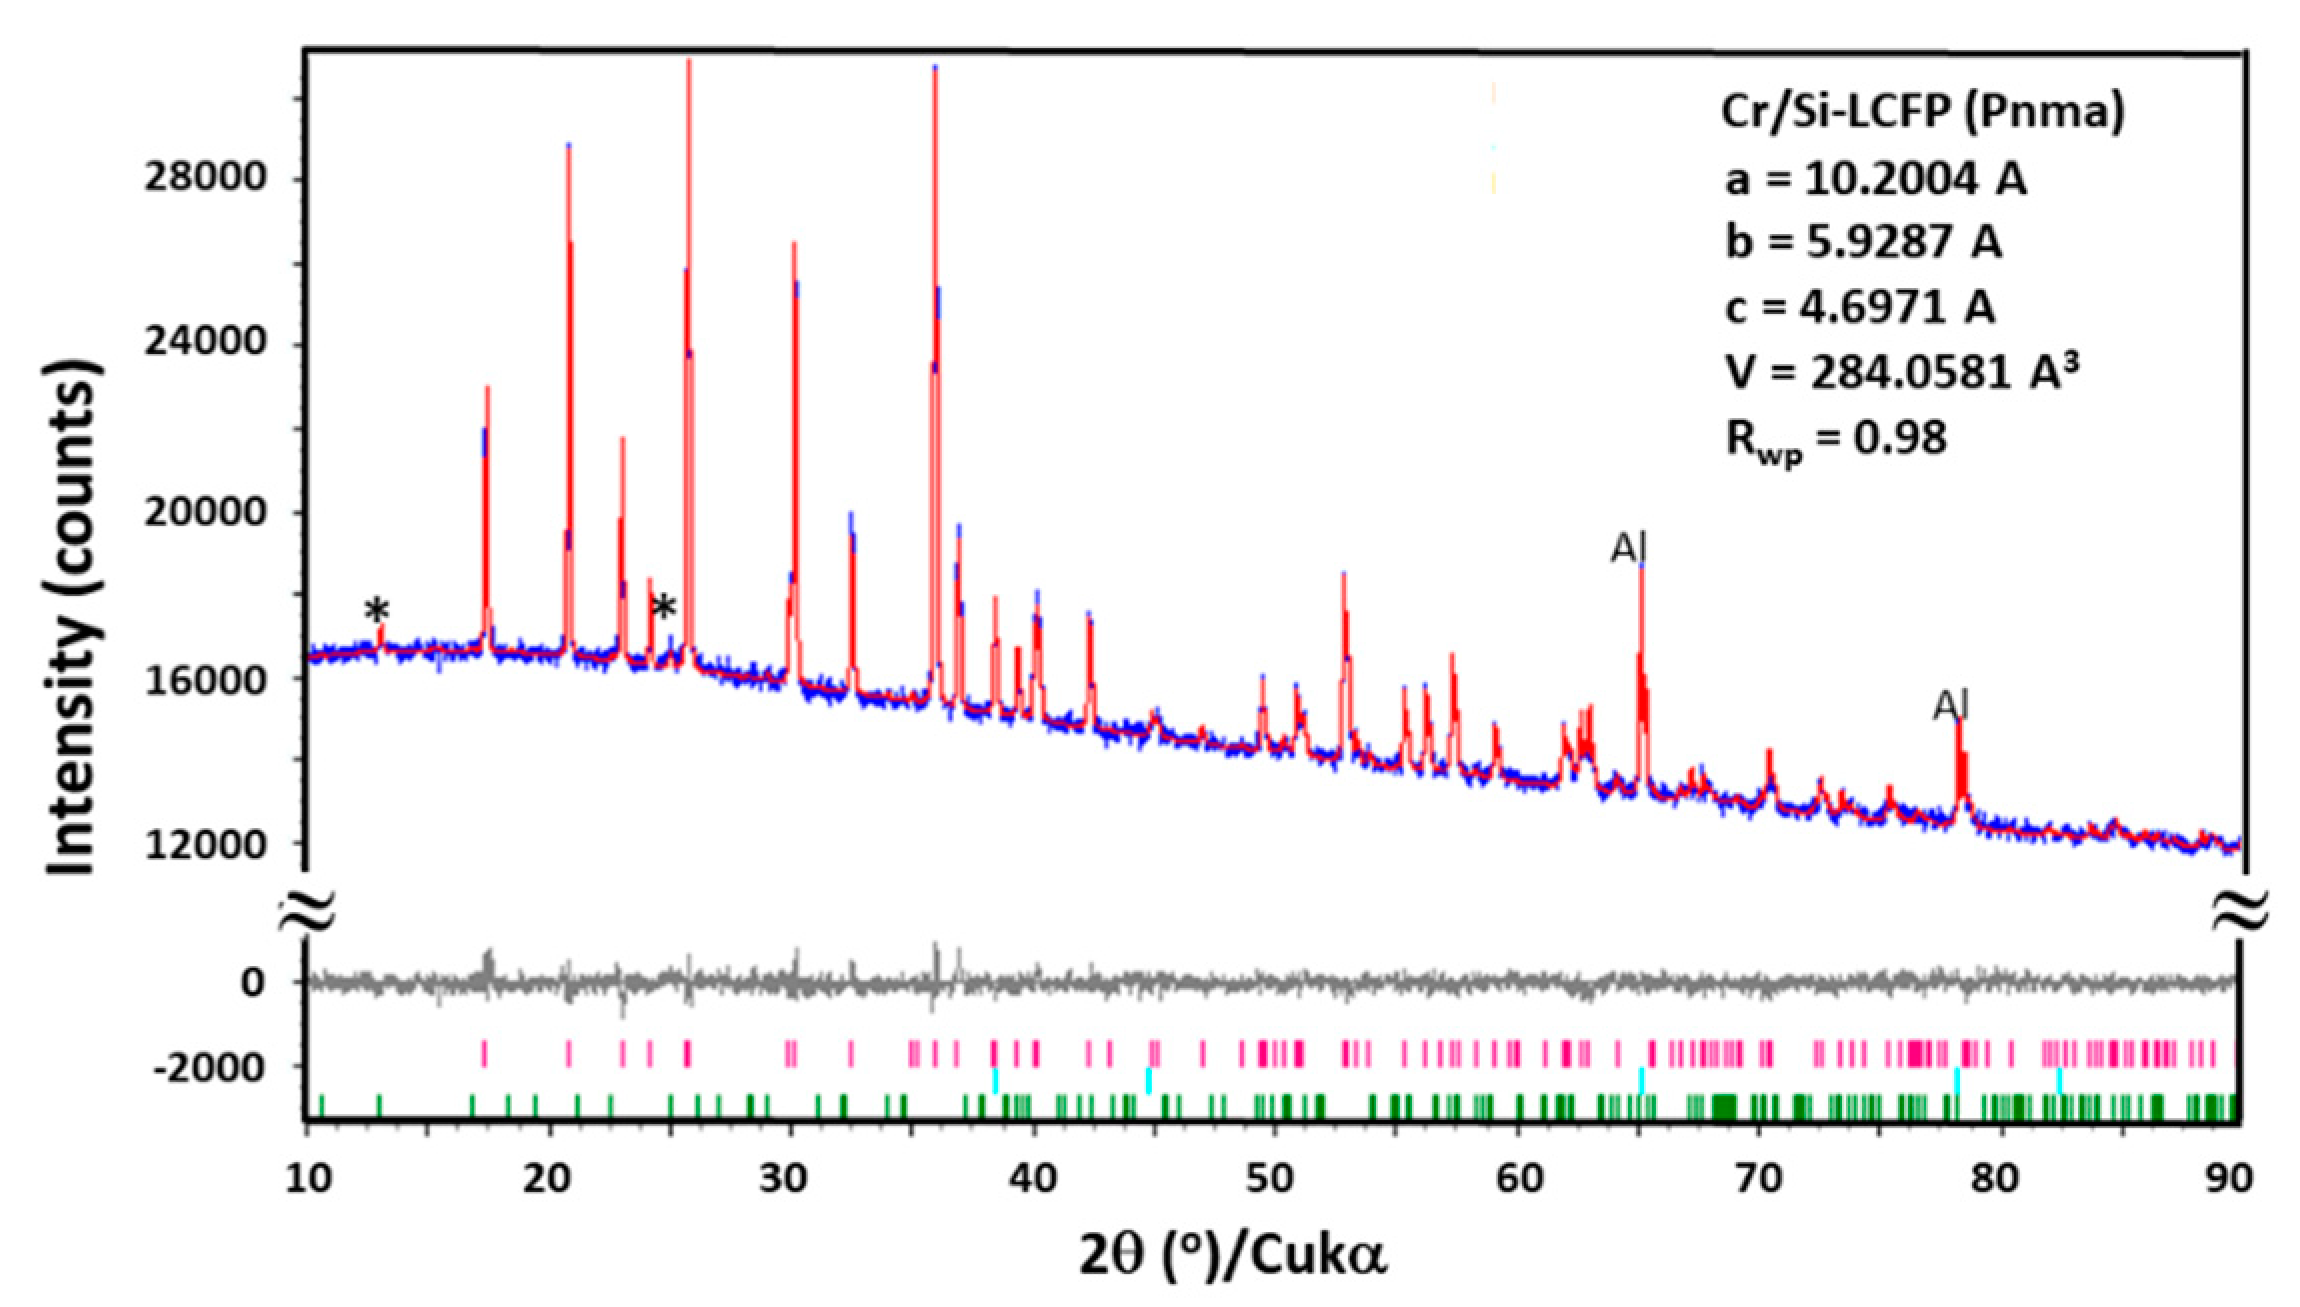
The XRD pattern of the as-made electrode was indexed to two phases: a major phase of LCFP (PDF: 04-007-4779) and a minor phase of Li9Cr3(PO4)2(P2O7)3 (PDF: 04-014-4369). No carbon peaks were observed, possibly owing to itsnanosize and overlapping with the LCFP peaks. The Al peaks were derived from the current collector. The XRD pattern was refined (using the Rietveld method) with an orthorhombic unit cell and a Pnma SG using the TOPAS software (Bruker, Billerica, MA, USA). The Fe, Cr, and Si dopants were assumed to occupy the Co sites with total occupancy fixed at 1. The peak shape, scale factor, lattice parameters, Lorentzian size and strain, as well as atomic positions and isotropic thermal parameters (Beq) were refined, see Figure 2. The refined lattice parameters were a = 10.2003(6), b = 5.9287(2), and c = 4.6971(1) Å. The crystal structure parameters are listed in Table 1. The refined LCFP was 98(1) wt.%, and the balance was Li9Cr3(PO4)2(P2O7)3, which was proven to be electrochemically inactive in our post-mortem analysis.
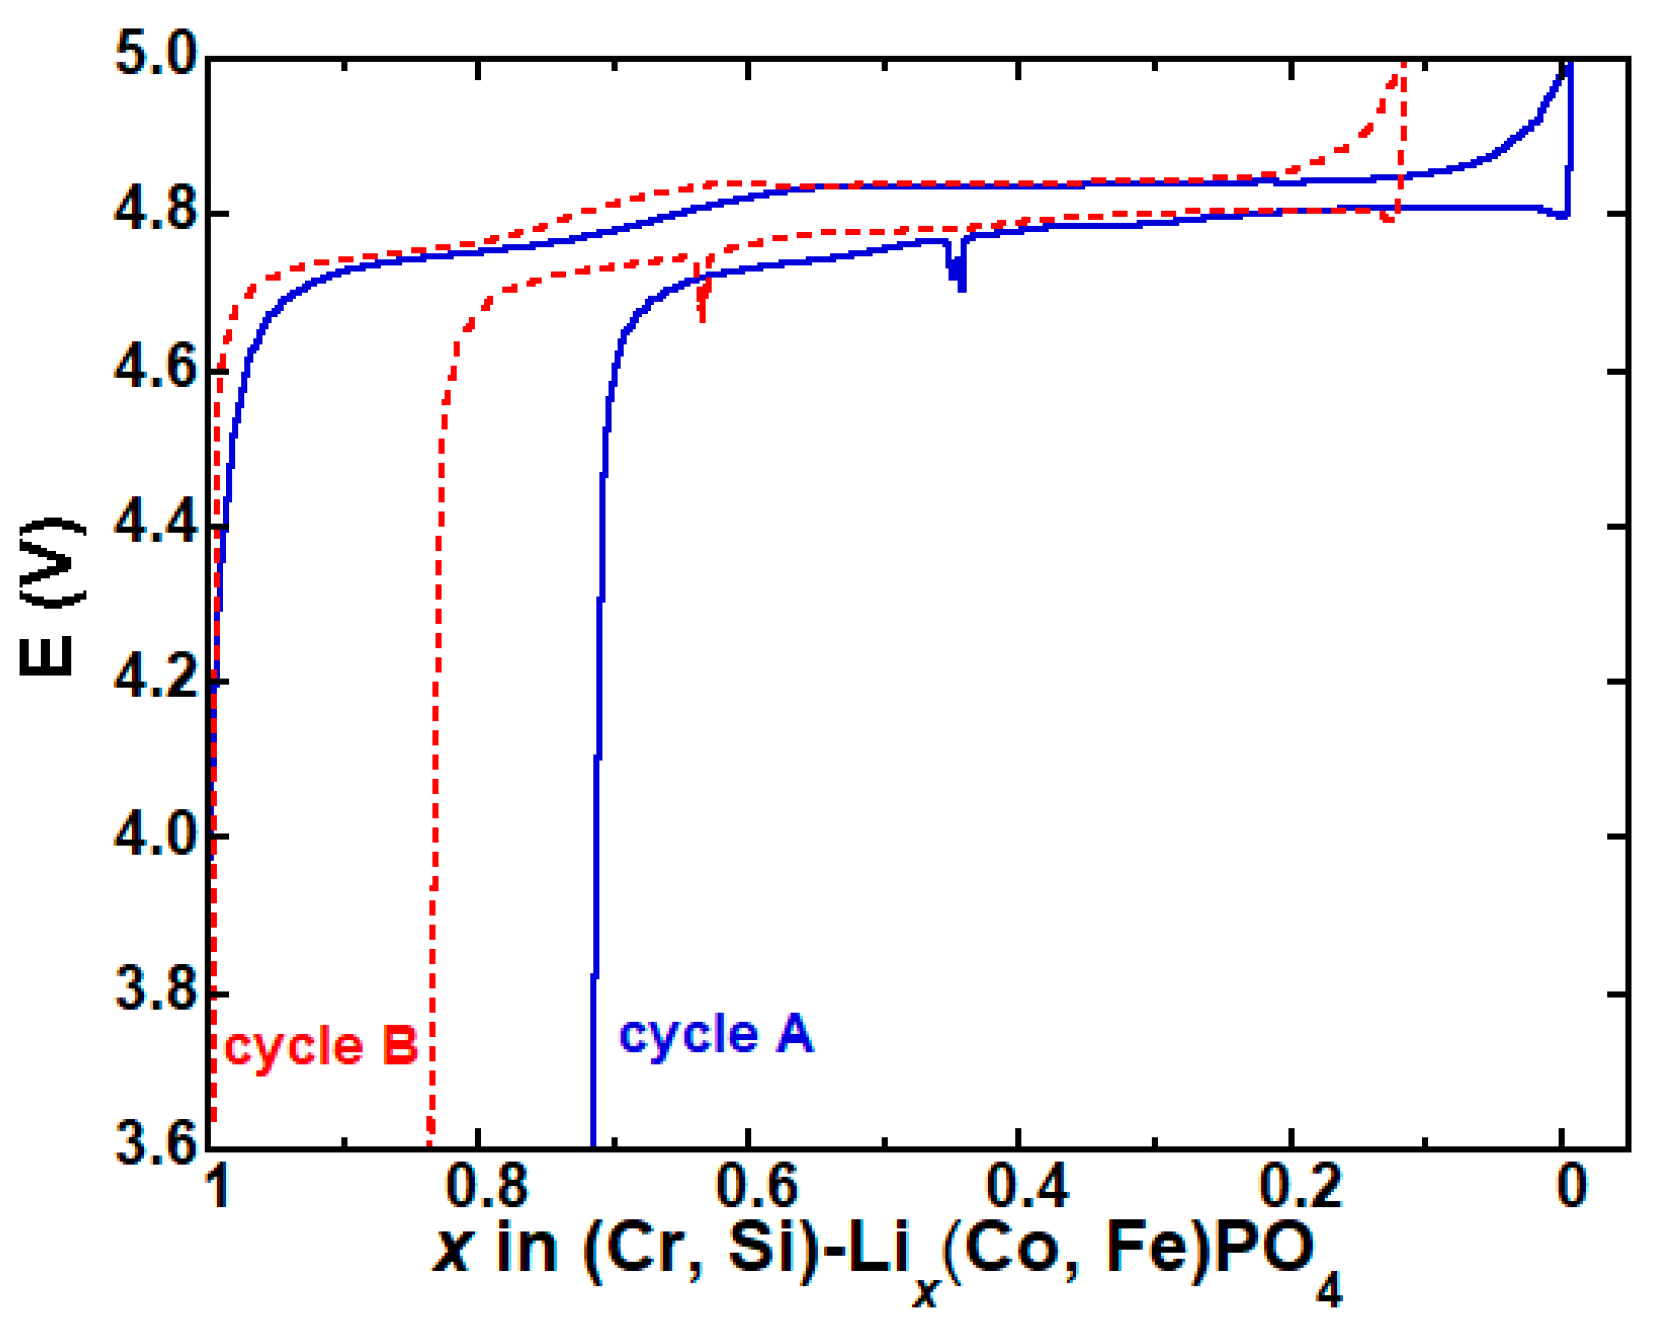
Figure 3 shows the voltage variation as a function of the Li concentration in a Li/LCFP half-cell cycled at a slow C/30 rate between 3.6 and 5 V. The blue curve (cycle A) represents the first cycle (after one formation cycle), for which the charge curve was considered to start at a Li concentration (x) of 1. As part of the applied current was consumed during the formation of the SEI and the related side reactions, rather than the removal of the Li ions, the x, calculated electrochemically, was smaller than the real value at the end of the charge, and consequently, the smaller x value at the end of discharge. As a result, the starting lithium content of the following cycle (cycle B) inherited the value at the end of the previous discharge, was smaller than the real value, and eventually led to the x < 0 at the end of charge, which is meaningless. Hence, the starting value of x was shifted to 1 for cycle B as the cell was fully discharged (Figure 3). The voltage curve in Figure 3 is asymmetric and with two distinct plateaus at ∼4.75 and ∼4.85 V during the charge; the plateaus, however, were much less distinctive during the discharge. The appearance of the two plateaus in the voltage profile was attributed to the two two-phase regions during the charge/discharge [7], but may also be related to the carbon content [23]. The charge and discharge capacities derived from the electrochemical data of cycle A were 168 and 121 mAh g−1, respectively. The charge capacity was slightly higher than the theoretical value of 167 mAh g−1, confirming that some side reactions occurred, such as the formation of SEI and the decomposition of the electrolyte at high voltage. During cycle B, the charge and discharge capacities were 147 and 120 mAh g−1, respectively. The decrease in charge capacity suggested a decrease in the side reactions as the cycling proceeded.
The small “blips” in the voltage–time plot in the discharge could have arisen from gaseous bubbles emanating during the slight decomposition of the SEI. This phenomenon is easily conceivable for carbonate electrolytes, in which the formation/decomposition of SEI can lead to the production of either CO2 or O2 from the carbonates/oxides in the SEI (typically having a complex composition). It is believed that these blips do not indicate a “bad” contact, because these usually show random and more persistent oscillations.
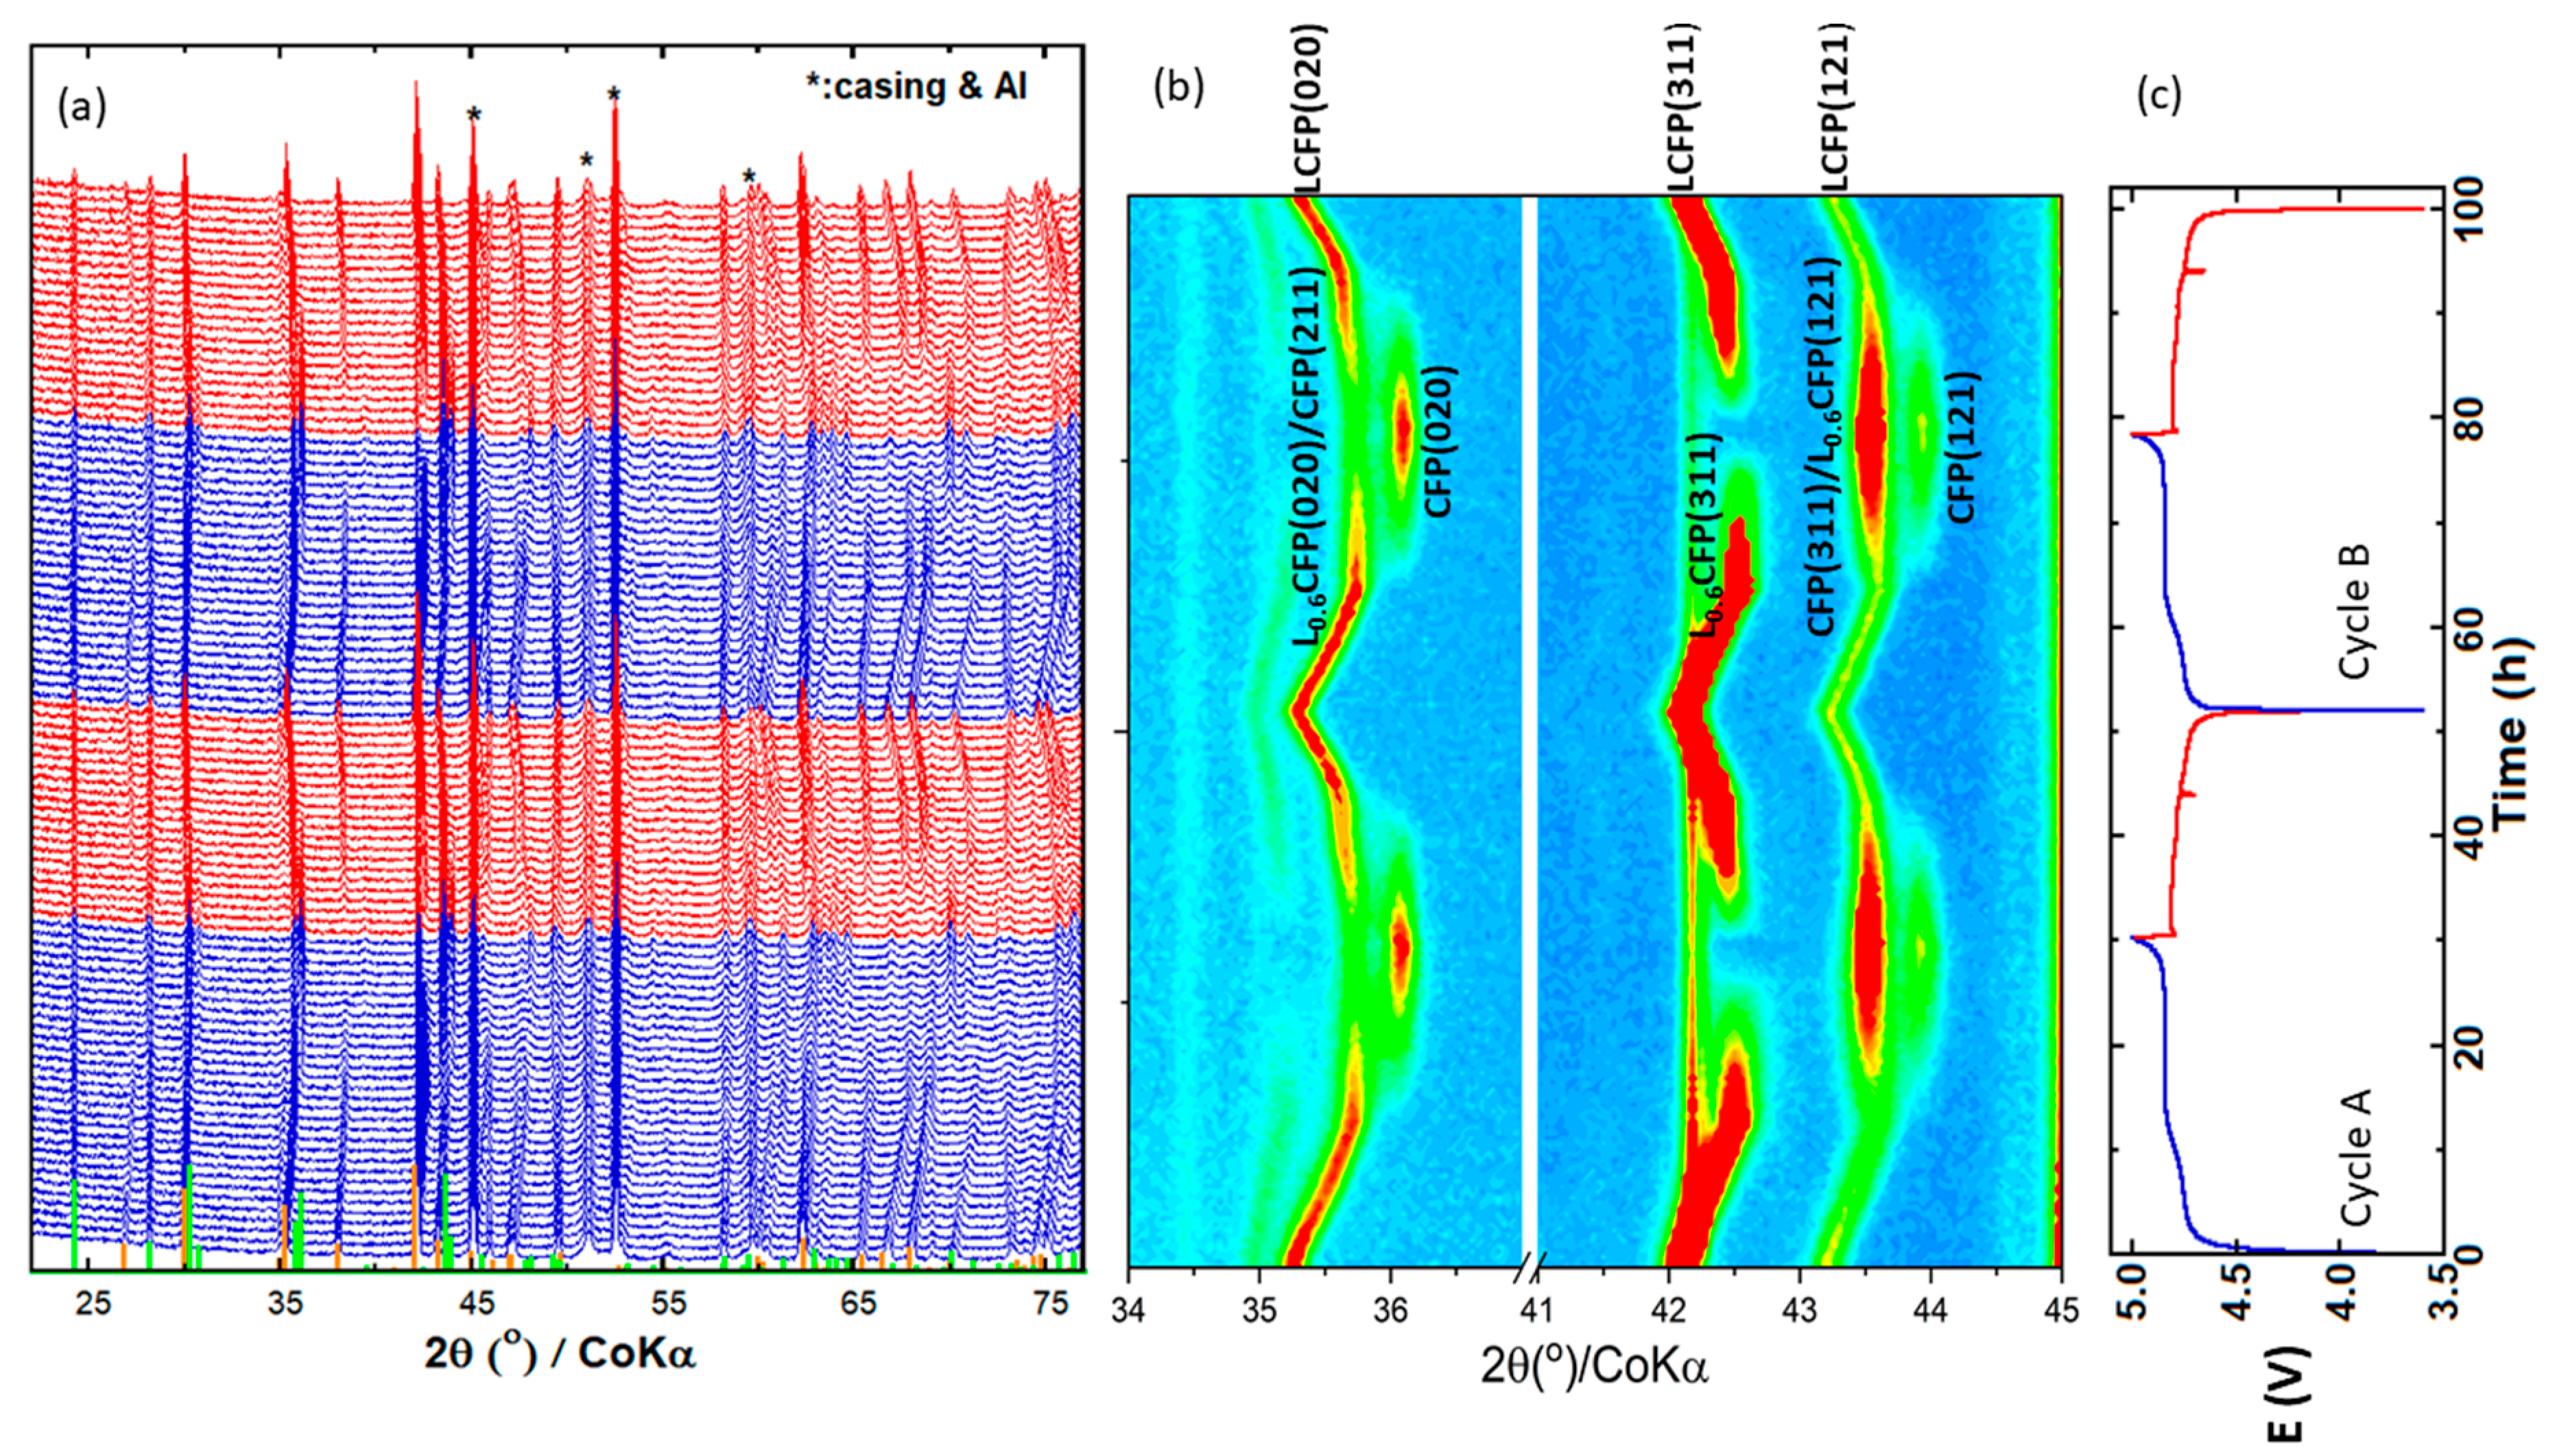
Figure 4 displays the evolution of the XRD patterns during two cycles and the corresponding voltage–time curve. In Figure 4a, all the unlabeled diffraction peaks belong to either LCFP or Cr/Si-(Co,Fe)PO4 (called CFP hereafter), or the intermediate phase. The peaks labelled with “*” were attributed to the stainless steel casing, the silver paste, and the Al window. The peak bars of LCFP and CFP are plotted at the bottom of the graph; the initial phase (LCFP) corresponds to the orange peak bars. Some of the LCFP peaks were noticeably upshifted during the charge and downshifted during the discharge. This indicates the contraction and expansion of the LCFP unit cell volume, which was caused by the extraction and insertion of the Li ions. Figure 4b shows the contour plot of the (020), (311), and (121) lines of the initial, the intermediate, and the final phases. In cycle A, at the end of the charge, the strongest line of LCFP, (311) was clearly seen in the plot, which indicated that a certain amount of LCFP was left in the electrode. The intensity of LCFP (311) was greatly reduced at the end of the charge in cycle B, suggesting a more complete phase transition. Thus, we decided to analyze the phase transformation of cycle B in detail. At the beginning of cycle B, the (020), (311), and (121) lines of LCFP were located at 2θ~ 35.3°, 42.1°, and 43.2°, respectively. As the charge proceeded, the three peaks shifted continuously toward high angles until reaching 4.831 V (Li+ = 0.657). Between 4.840 (Li+ = 0.624) and 4.851 V (Li+ = 0.224), the positions of the three peaks remained almost unchanged (they were located at 2θ∼ 35.7°, 42.5°, and 43.6°), suggesting the presence of a new phase and the depletion of LCFP. This new phase was formed through the delithiation of LCFP and assigned to Cr/Si-Li0.62(Co,Fe)PO4 (called L0.6CFP hereafter; PDF: 04-014-7340), which inherited the crystal structure of LCFP but possessed different lattice parameters. After the formation of the L0.6CFP phase, two peaks appeared at ~36.1° and 43.9°; they were ascribed to the (020) and (121) lines of the Cr/Si-(Co,Fe)PO4 phase. In addition, the (311) peak of the CFP phase was located at ~43.6°, overlapping with the (121) peak of L0.6CFP. The further charging of the cell resulted in a continuous increase in CFP peaks accompanied by the decrease in the strongest peak of L0.6CFP ((311)/42.5°), which eventually vanished at 4.862 V (Li+ = 0.190). This suggests that all of the L0.6CFP was transformed into CFP at Li+ = 0.190. This phase also has an orthorhombic unit cell with a Pnma SG. After the initial formation of the CFP, the phase grew monotonically until the end of the charge at 5 V (Li+ = 0.116), with its peak positions nearly unmoved. The phase change process occurring during the discharge was reversible. The CFP phase disappeared first, followed by L0.6CFP. Eventually, the diffraction peaks of the single-phase LCFP shifted continuously toward low 2θ, until returning to their original positions, which suggested the end of the discharge. The development of the in situ XRD patterns indicates that three phases are involved in the charge/discharge and the process is described with three regions in phase diagram, as indicated in Figure 5d. Region I contains the ss-LCFP and corresponds to a continuous shift in the LCFP peaks (Figure 4a,b), which is an indication of a solid solution mechanism between LCFP and L0.6CFP phase transition. L0.6CFP and CFP coexisted in region II: the peak positions of the two phases remained almost unchanged, whereas the quantities of the two phases varied in opposite ways (Figure 5c). Finally, region III contains the single-phase CFP.
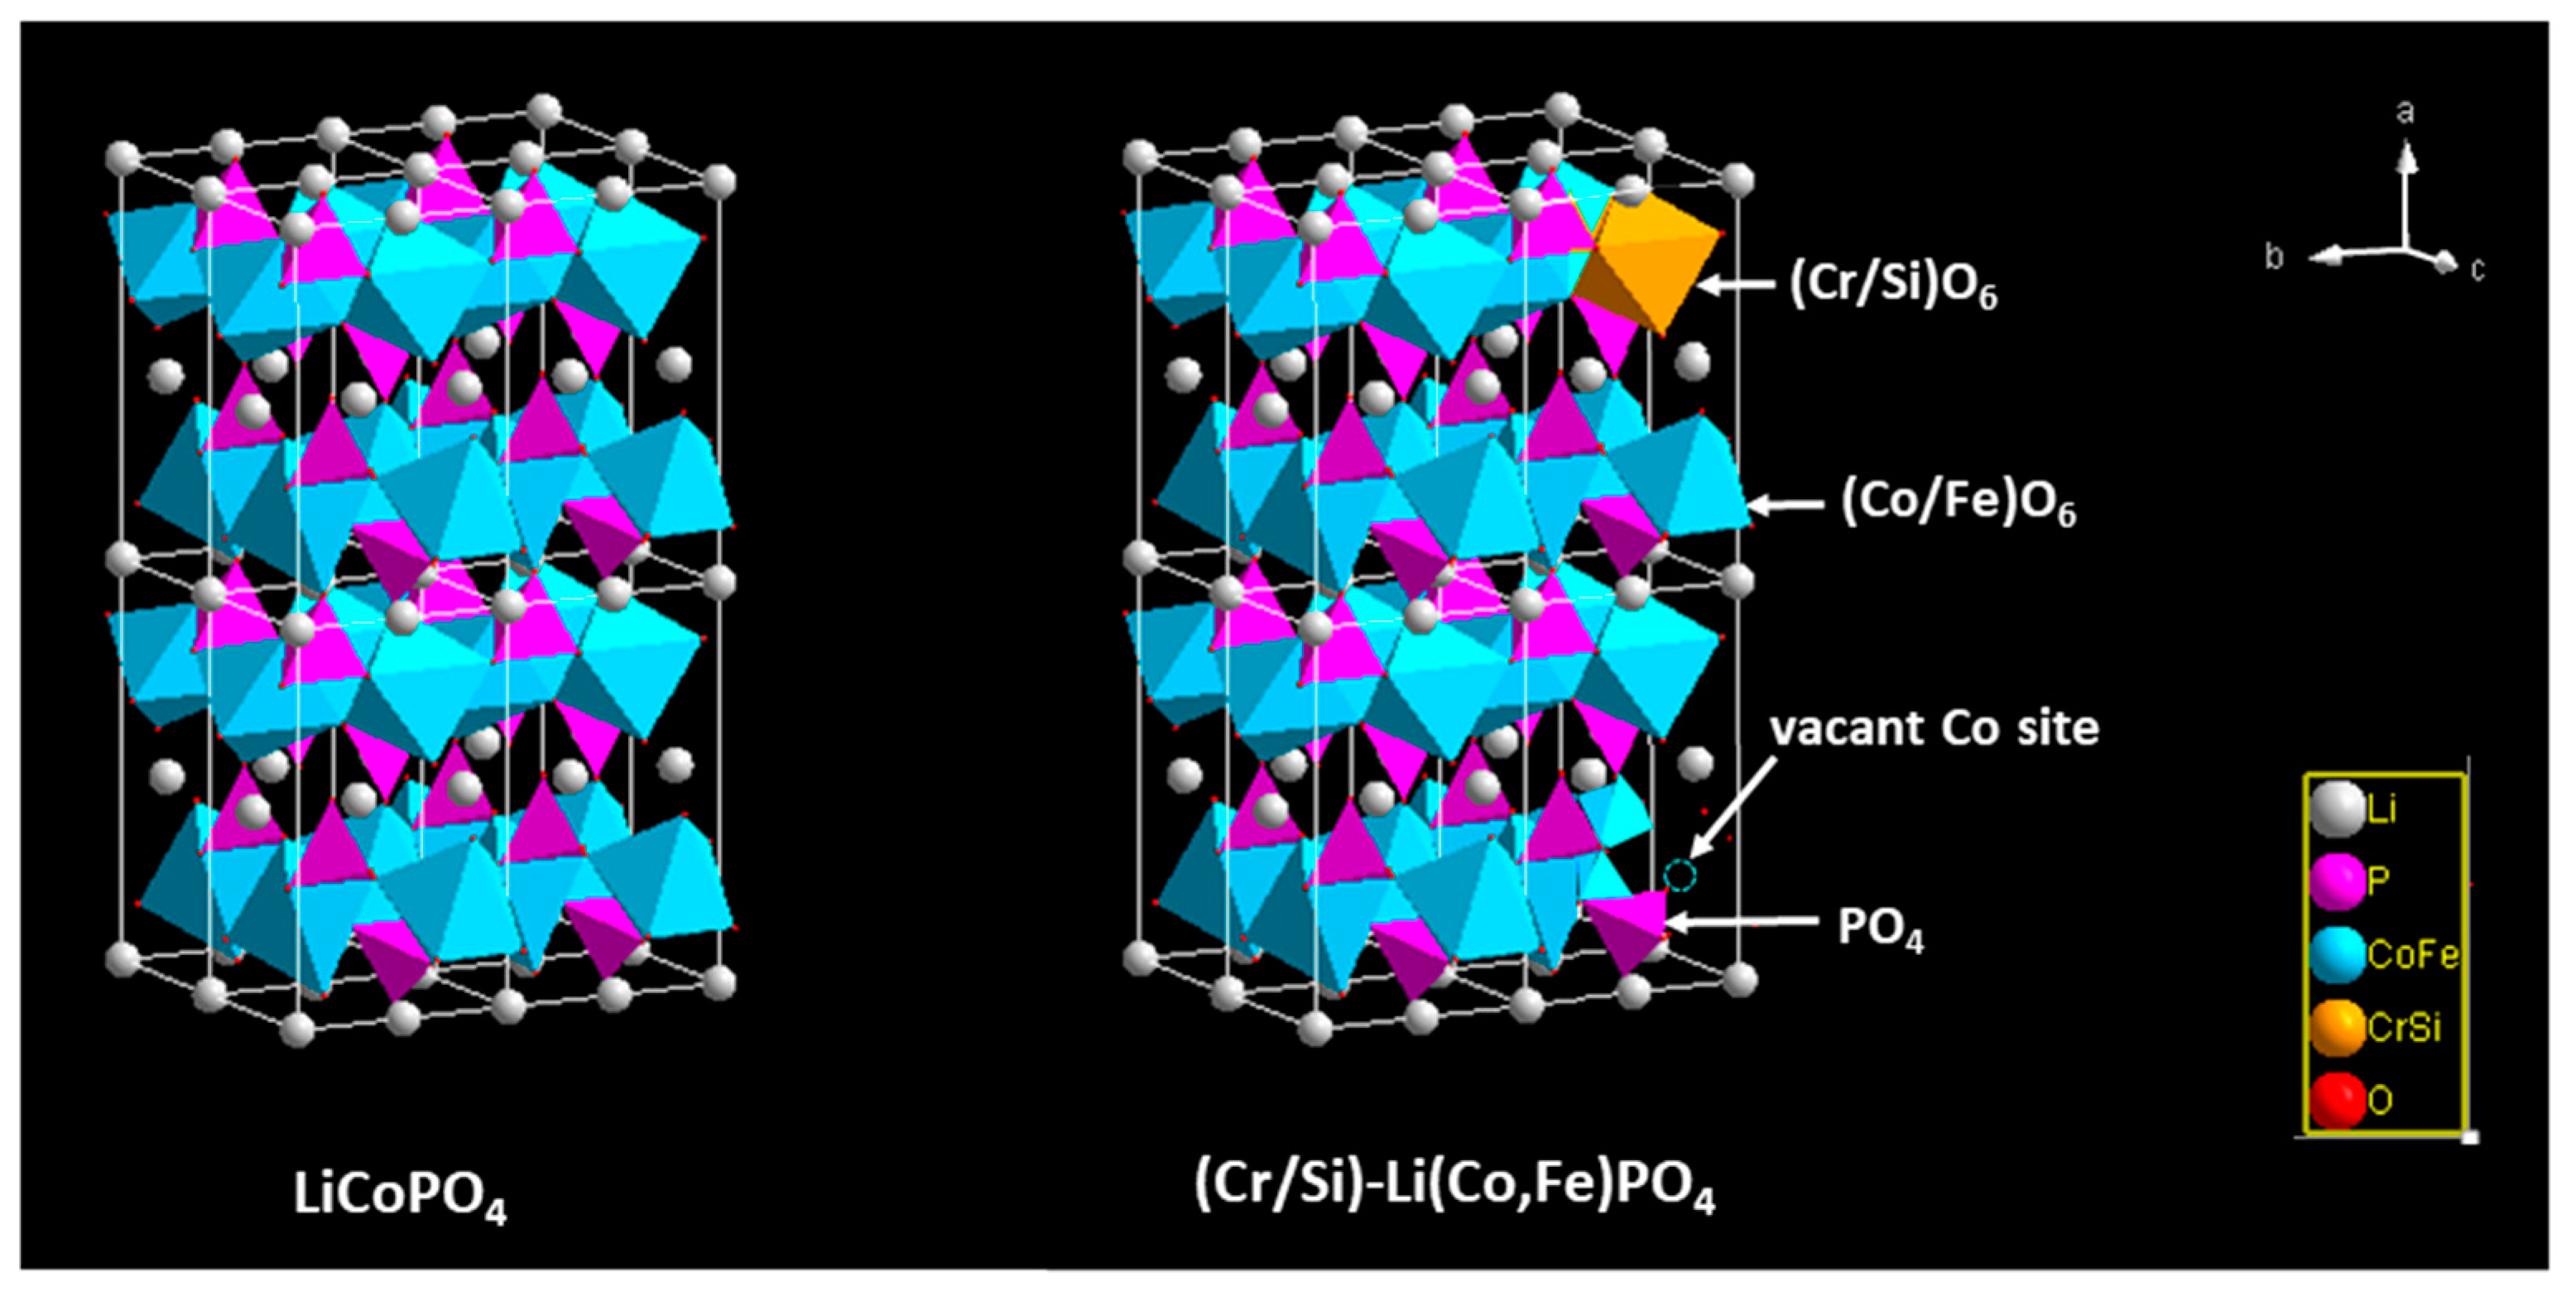
The intermediate phase (with Li+ ~ 0.62) was similar to the Li0.6-0.7CoPO4 phase determined by in situ XRD [7,21], but considerably different from the Li0.45–0.2CoPO4 phase derived from the electrochemical measurement [23]. Despite the intermediate phase composition being consistent with those obtained from diffraction techniques reported in the literature, the phase change mechanisms did not coincide. Several researchers have reported the appearance of two biphasic regions during the charge/discharge process, indicating that the stepwise phase transformations follow a two-phase reaction route at every step. Our in situ XRD analyses revealed the existence of three regions in the phase diagram during cycling (Figure 5d). The evolution of the XRD patterns indicated that the phase transition from LCFP to L0.6CFP followed the solid solution pathway, and that the transformation from L0.6CFP to CFP underwent a two-phase reaction route. In fact, the phase transformation mechanism does not only depend on the intrinsic properties of the olivine structured materials, but also on other factors (e.g., the particle size, temperature, cycling rate, and coherent stain). Studies on the LFP have demonstrated that the variation in these extrinsic factors may modify or change the phase transition thermodynamics by reducing the miscibility gap in the LFP-FP system. For example, Li et al. [12] investigated the influence of particle orientation on the phase transition and miscibility gap in L1−xFP during nonequilibrium battery cycling. Their results showed that the phase transformation routes were not strictly single- or two-phase reactions but were orientation-dependent, even at low currents. They examined samples with dimensions in the [100] direction varying from 46 to 12 nm, and concluded that decreasing the dimension in the [100] direction can remarkably improve the solid solubility of both end solid solutions (LiαFePO4 and Li1−βFePO4) and decrease the lithium miscibility gap of LFP. The effects of size on solubility and on the miscibility gap have been previously discussed in the literature [25,26]. In a nano-size regime, the solubility limits of Li in two end phases (L1−xFP and LyFP) increased, while the miscibility gap in Li1−xFePO4 contracted systematically as the size of particles decreased. Liu et al. [15] focused on the influence of the cycling rate on the phase transformation of micro-sized particles. They revealed the development of a continuous solid solution, which extended from the two end-member phases into the thermodynamic miscibility gap. Consequently, the working mechanism of LFP under exceptional high cycling rates was considered to follow a facile nonequilibrium single-phase transformation pathway instead of the commonly recognized two-phase path. Meanwhile, Cogswell et al. [17] studied the effects of the coherency strain on the solubility and galvanostatic discharge of LFP nanoparticles through a reaction-limited phase-field model. Their calculations indicated that the coherency strain can strongly suppress phase separation during the discharge process. Islam et al. [8] explored the doping and defects in the LFP through atomistic modeling, showing that aliovalent dopants are not favored energetically. With the replacement of Fe2+ ions by various trivalent and divalent cations, they found that the energies of LFP with trivalent dopants are several electron volts higher than those with divalent dopants. In the case of our (Cr/Si)-LCFP, its crystal structure is shown in Figure 6, together with that of LCP. It is evident that the LCP structure is uniform; the octahedra are all CoO6, and there are no vacancies in the transitional metal layer. In contrast to LCP, the structure of (Cr/Si)-LCFP is not uniform; most of the octahedra are CoO6 or FeO6, whereas the rest are CrO6 or SiO6. Since the oxidation state of Fe2+ and Co2+ is the same, and the ionic radii difference is small, the substitution of Fe2+ to Co2+ induced very small local distortion, and no vacancy was involved. On the other hand, the replacement of Co2+ by the smaller trivalent/tetravalent Cr3+/Si4+ led to the formation of smaller CrO6/SiO6 octahedra as well as vacancies on transition metal sites, and all these nonuniform areas resulted in greater local distortion and strain energy. This strain energy could have played a similar role to the coherent strain during the phase transformation of LCFP into L0.6CFP (i.e., the suppressed phase separation) and changed the phase transition pathway from two-phase reaction to one-phase. In the case of the transformation of L0.6CFP into CFP, it is possible that the strain energy induced by the dopants was not enough to suppress the phase separation; thus, the phase transformation would have still followed the nucleation and growth route.
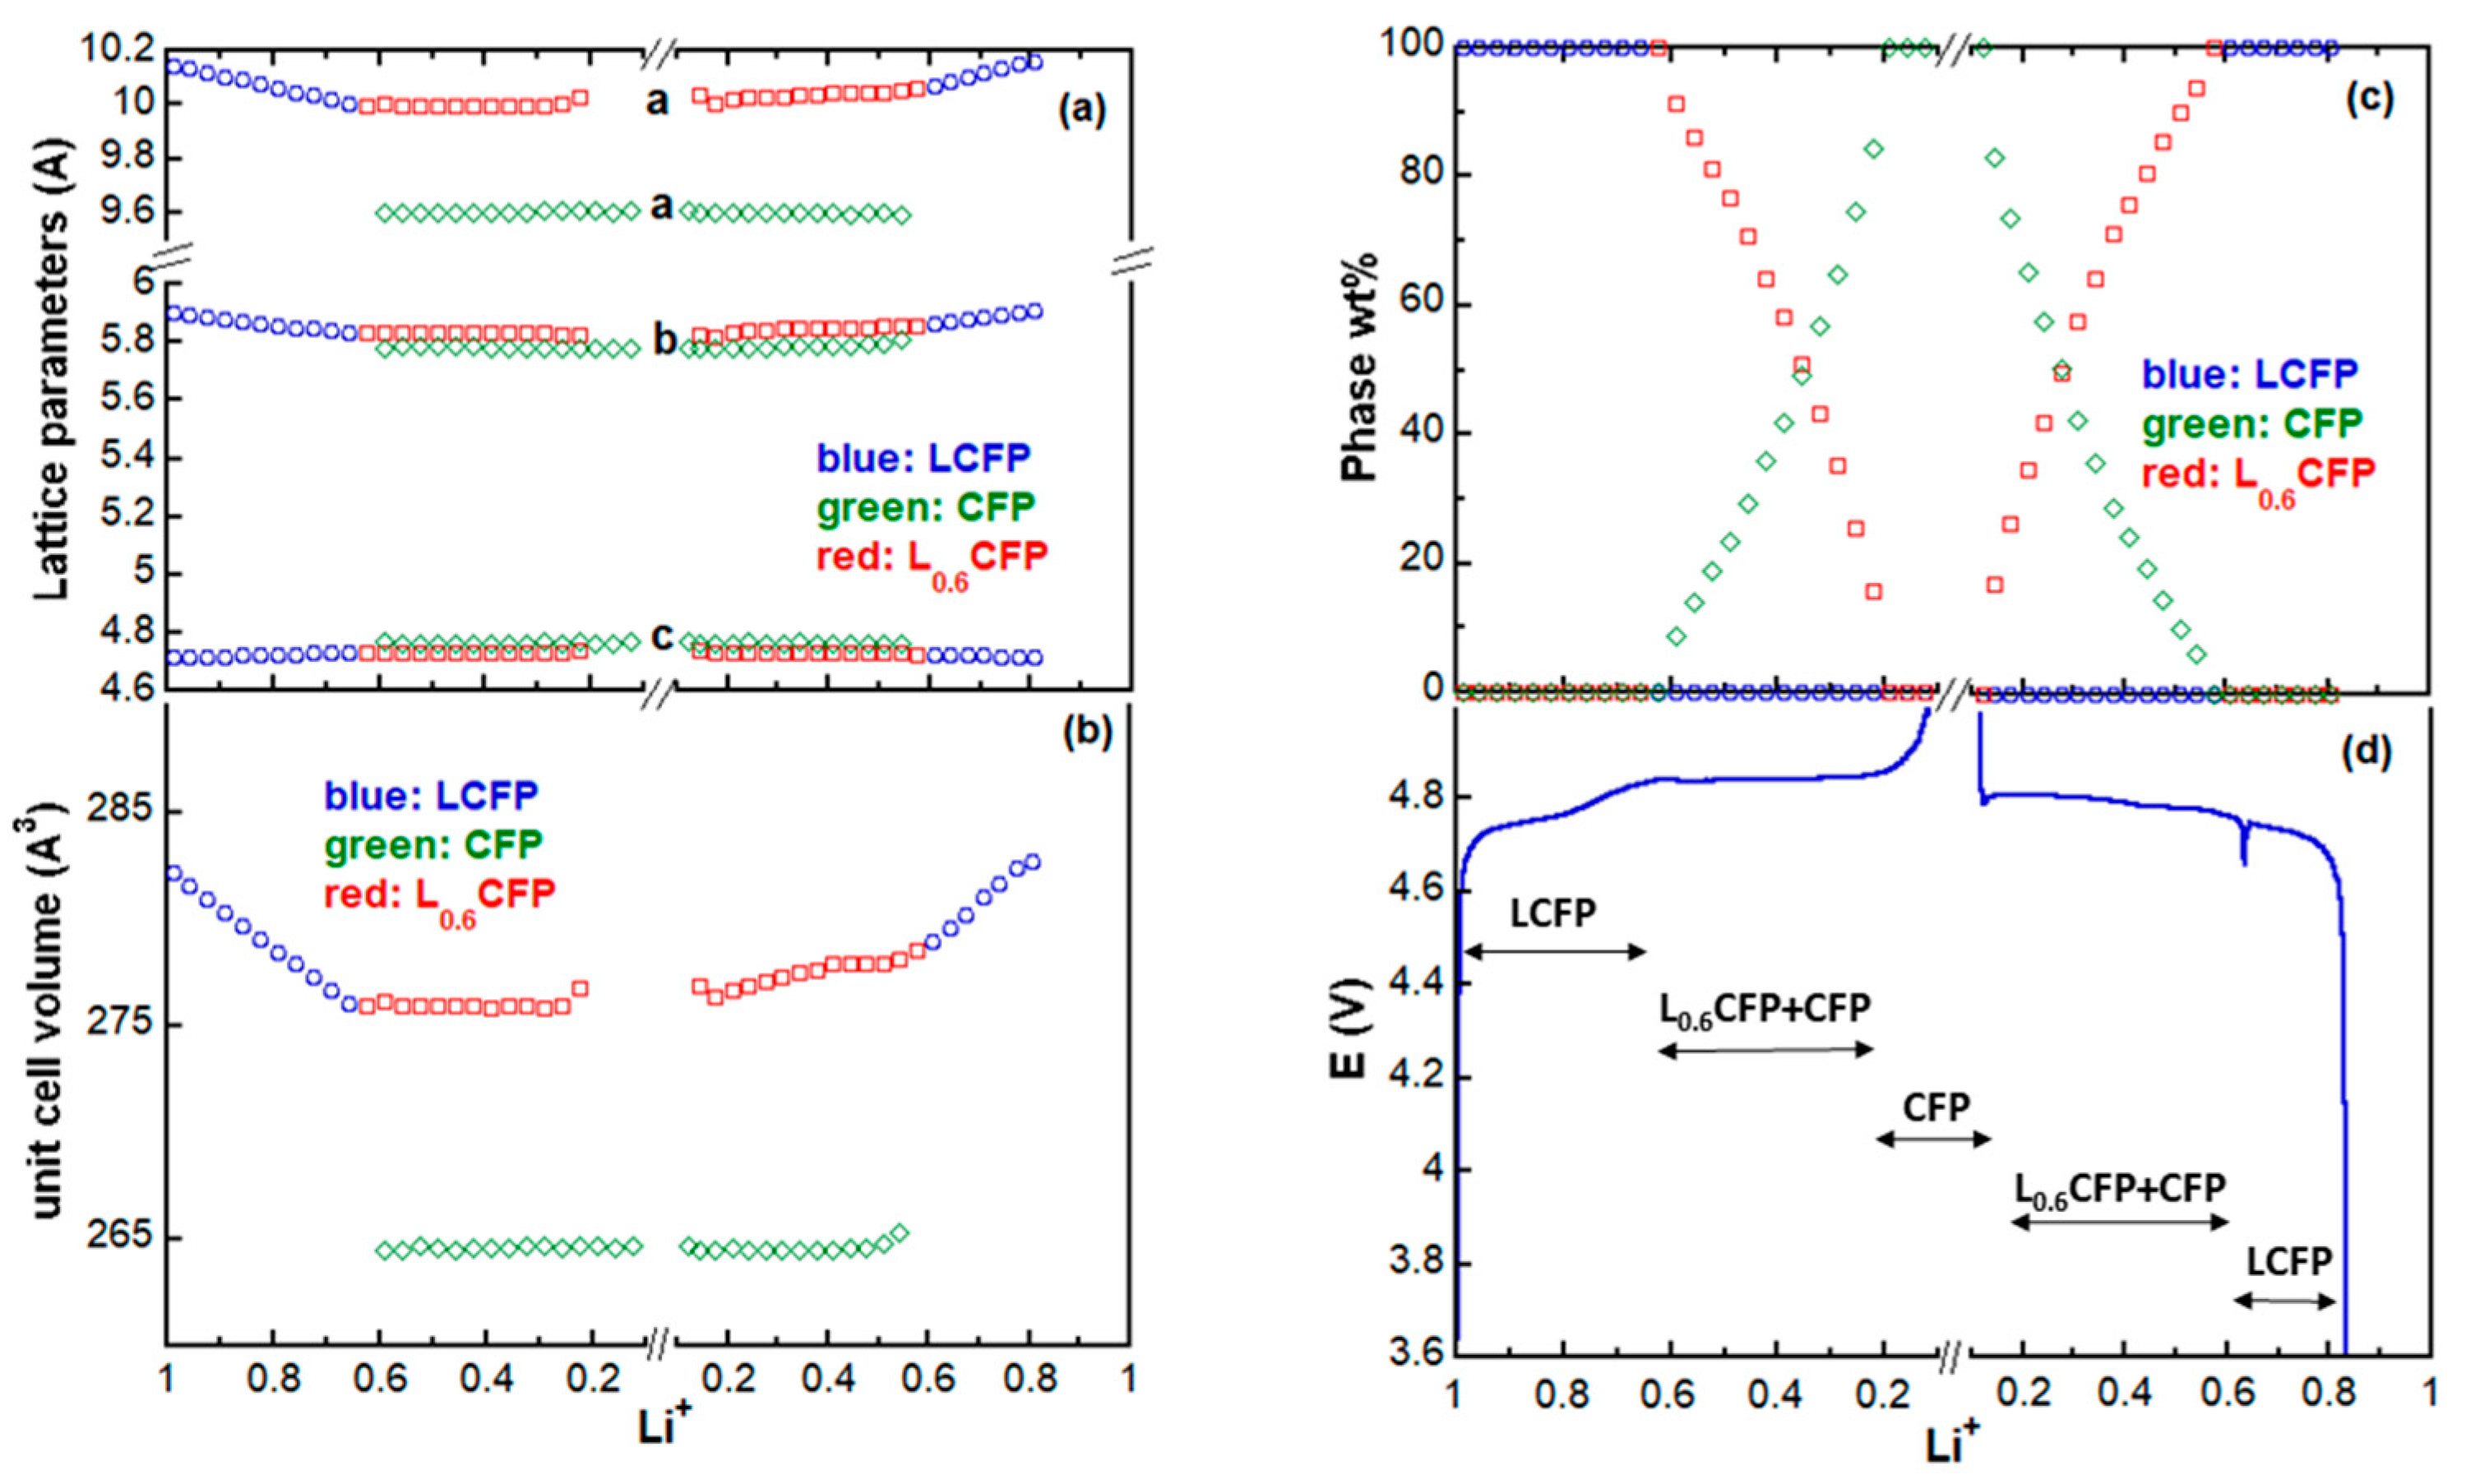
The in situ XRD dataset is also refined using the Rietveld method with crystal structure parameters (atomic positions, thermal parameters) fixed, and the Rwp of the refinements ranged from 6.1 to 9.0. Figure 5a,b display the lattice parameter variations vs. the Li content during cycle B. The differences between the b and c values of the three phases were small, whereas the differences between the a values of the CFP and the other two phases were large. Table 2 lists the lattice parameters of the pristine LCFP phase, the average values of L0.6CFP and CFP, and differences between them. The lattice parameters of L0.6CFP and CFP remained nearly constant during the charge and discharge, owing to their approximately constant compositions, whereas the lattice parameters of LCFP changed continuously during cycling because of its solid solution nature. It is clear that the lattice parameter changes are anisotropic, and so are the stresses induced. The differences in volume were mainly caused by the changes in the a-axis. The volumes contracted by 2.57% from LCFP to L0.6CFP, and by 4.39% from L0.6CFP to CFP, a total of ~6.85% from LCFP to CFP (similar to the volume change from LFP to FP (6.81%)) [27]. This relatively large volume contraction/expansion is likely to crack the cathode material during cycling, especially in the all solid-state battery, thus deteriorating the material and leading to its eventual failure.
4. Conclusions
In situ XRD was used to monitor the structural changes in Cr/Si-LiCo0.82Fe0.1PO4 during the charge–discharge process. Its phase evolution revealed the presence of single-phase and two-phase reaction stages upon the lithiation/delithiation process of this Cr/Si-LCFP. The characteristics of the intermediate phase of L0.62CFP were in good agreement with published data; however, the combined solid solution and biphasic reaction mechanism is different from the previously reported two biphasic reaction mechanism. The difference may be caused by the substitution of Co/Fe by aliovalent ions of Cr3+ and Si4+, which could have introduced strain in the structure and, hence, partially changed the phase transformation route during cycling.
Author Contributions
W.Z. designed/performed the in situ XRD experiment and refinement; D.L. prepared the material and electrode; C.G. and V.G. performed the electrochemical measurements; W.Z., D.L., M.L.T., A.V. and K.Z. wrote the manuscript. All authors have read and agreed to the published version of the manuscript.
Funding
This research received no external funding.
Acknowledgments
We are grateful to Hydro-Québec (Canada) and the US Army Research Lab for their support.
Conflicts of Interest
The authors declare no conflict of interest.
References
- Sarkar, S.; Mitra, S. Carbon Coated Submicron sized-LiFePO4: Improved High Rate Performance Lithium Battery Cathode. Energy Procedia 2014, 54, 718–724. [Google Scholar] [CrossRef] [Green Version]
- Zhao, N.; Li, Y.; Zhi, X.; Wang, L.; Zhao, X.; Wang, Y.; Liang, G. Effect of Ce3+ doping on the properties of LiFePO4 cathode material. J. Rare Earths 2016, 34, 174–180. [Google Scholar] [CrossRef]
- MacNeil, D.D.; Lu, Z.; Chen, Z.; Dahn, J.R. A comparison of the electrode/electrolyte reaction at elevated temperatures for various Li-ion battery cathodes. J. Power Sources 2002, 108, 8–14. [Google Scholar] [CrossRef]
- Amine, K.; Yasuda, H.; Yamachi, M. Olivine LiCoPO4 as 4.8 V Electrode Material for Lithium Batteries. Electrochem. Solid-State Lett. 2000, 3, 178–179. [Google Scholar] [CrossRef]
- Liu, D.; Zhu, W.; Kim, C.; Cho, M.; Guerfi, A.; Delp, S.A.; Allen, J.L.; Jow, T.R.; Zaghib, K. High-energy lithium-ion battery using substituted LiCoPO4: From coin type to 1 Ah cell. J. Power Sources 2018, 388, 52–56. [Google Scholar] [CrossRef]
- Dimesso, L.; Forster, C.; Jaegermann, W.; Khanderi, J.P.; Tempel, H.; Popp, A.; Engstler, J.; Schneider, J.J.; Sarapulova, A.; Mikhailova, D.; et al. Developments in nanostructured LiMPO4 (M = Fe, Co, Ni, Mn) composites based on three dimensional carbon architecture. Chem. Soc. Rev. 2012, 41, 5068–5080. [Google Scholar] [CrossRef]
- Bramnik, N.N.; Nikolowski, K.; Baehtz, C.; Bramnik, K.G.; Ehrenberg, H. Phase Transitions Occurring upon Lithium Insertion-Extraction of LiCoPO4. Chem. Mater. 2007, 19, 908–915. [Google Scholar] [CrossRef] [Green Version]
- Islam, M.S.; Driscoll, D.J.; Fisher, C.A.J.; Slater, P.R. Atomic-Scale Investigation of Defects, Dopants, and Lithium Transport in the LiFePO4 Olivine-Type Battery Material. Chem. Mater. 2005, 17, 5085–5092. [Google Scholar] [CrossRef]
- Allen, J.L.; Jow, T.R.; Wolfenstine, J. Kinetic Study of the Electrochemical FePO4 to LiFePO4 Phase Transition. Chem. Mater. 2007, 19, 2108–2111. [Google Scholar] [CrossRef]
- Zhu, Y.; Wang, J.W.; Liu, Y.; Liu, X.; Kushima, A.; Liu, Y.; Xu, Y.; Mao, S.X.; Li, J.; Wang, C.; et al. In Situ Atomic-Scale Imaging of Phase Boundary Migration in FePO4 Microparticles During Electrochemical Lithiation. Adv. Mater. 2013, 25, 5461–5466. [Google Scholar] [CrossRef]
- Tan, H.J.; Dodd, J.L.; Fultz, B. Thermodynamic and Kinetic Stability of the Solid Solution Phase in Nanocrystalline LixFePO4. J. Phys. Chem. C 2009, 113, 20527–20530. [Google Scholar] [CrossRef]
- Li, Z.; Yang, J.; Li, C.; Wang, S.; Zhang, L.; Zhu, K.; Wang, X. Orientation-Dependent Lithium Miscibility Gap in LiFePO4. Chem. Mater. 2018, 30, 874–878. [Google Scholar] [CrossRef]
- Li, D.; Zhou, H. Two-phase transition of Li-intercalation compounds in Li-ion batteries. Mater. Today 2014, 17, 451–463. [Google Scholar] [CrossRef]
- Takahashi, I.; Mori, T.; Yoshinari, T.; Orikasa, Y.; Koyama, Y.; Murayama, H.; Fukuda, K.; Hatano, M.; Arai, H.; Uchimoto, Y.; et al. Irreversible phase transition between LiFePO4 and FePO4 during high-rate charge-discharge reaction by operando X-ray diffraction. J. Power Sources 2016, 309, 122–126. [Google Scholar] [CrossRef]
- Liu, H.; Strobridge, F.C.; Borkiewicz, O.J.; Wiaderek, K.M.; Chapman, K.W.; Chupas, P.J.; Grey, C.P. Capturing metastable structures during high-rate cycling of LiFePO4 nanoparticle electrodes. Science 2014, 344, 1252817. [Google Scholar] [CrossRef]
- Yan, M.; Zhang, G.; Wei, Q.; Tian, X.; Zhao, K.; An, Q.; Zhou, L.; Zhao, Y.; Niu, C.; Ren, W.; et al. In operando observation of temperature-dependent phase evolution in lithium-incorporation olivine cathode. Nano Energy 2016, 22, 406–413. [Google Scholar] [CrossRef]
- Cogswell, D.A.; Bazant, M.Z. Coherency Strain and the Kinetics of Phase Separation in LiFePO4 Nanoparticles. ACS Nano 2012, 6, 2215–2225. [Google Scholar] [CrossRef]
- Van der Ven, A.; Garikipati, K.; Kim, S.; Wagemaker, M. The Role of Coherency Strains on Phase Stability in LixFePO4: Needle Crystallites Minimize Coherency Strain and Overpotential. J. Electrochem. Soc. 2009, 156, A949–A957. [Google Scholar] [CrossRef]
- Perea, A.; Sougrati, M.T.; Ionica-Bousquet, C.M.; Fraisse, B.; Tessier, C.; Aldon, L.; Jumas, J.-C. Operando57Fe Mössbauer and XRD investigation of LixMnyFe1-yPO4/C composites (y = 0.50; 0.75). RSC Adv. 2012, 2, 9517. [Google Scholar] [CrossRef] [Green Version]
- Kaus, M.; Issac, I.; Heinzmann, R.; Doyle, S.; Mangold, S.; Hahn, H.; Chakravadhanula, V.S.K.; Kübel, C.; Ehrenberg, H.; Indris, S. Electrochemical Delithiation/Relithiation of LiCoPO4: A Two-Step Reaction Mechanism Investigated by in Situ X-ray Diffraction, in Situ X-ray Absorption Spectroscopy, and ex Situ 7Li/31P NMR Spectroscopy. J. Phys. Chem. 2014, 118, 17279–17290. [Google Scholar] [CrossRef]
- Palmer, M.G.; Frith, J.T.; Hector, L.; Lodge, A.L.; Owen, J.R.; Nicklinb, C.; Rawle, J. In situ phase behaviour of a high capacity LiCoPO4 electrode during constant or pulsed charge of a lithium cell. Chem. Commun. 2016, 52, 14169. [Google Scholar] [CrossRef] [PubMed] [Green Version]
- Ehrenberg, H.; Bramnik, N.N.; Senyshyn, A.; Fuess, H. Crystal and magnetic structures of electrochemically delithiated Li1-xCoPO4 phases. Solid State Sci. 2009, 11, 18–23. [Google Scholar] [CrossRef]
- Ju, H.; Wu, J.; Xu, Y. Lithium ion intercalation mechanism for LiCoPO4 electrode. Int. J. Energy Environ. Eng. 2013, 4, 22. [Google Scholar] [CrossRef] [Green Version]
- Allen, J.L.; Allen, J.L.; Thompson, T.; Delp, S.A.; Wolfenstine, J.; Jow, T.R. Cr and Si Substituted-LiCo0.9Fe0.1PO4: Structure, full and half Li-ion cell performance. J. Power Sources 2016, 327, 229–234. [Google Scholar] [CrossRef]
- Wagemaker, M.; Singh, D.P.; Borghols, W.J.H.; Lafont, U.; Haverkate, L.; Peterson, V.K.; Mulder, F.M. Dynamic Solubility Limits in Nanosized Olivine LiFePO4. J. Am. Chem. Soc. 2011, 133, 10222–10228. [Google Scholar] [CrossRef]
- Meethong, N.; Huang, H.-Y.S.; Carter, W.C.; Chiang, Y.-M. Size-Dependent Lithium Miscibility Gap in Nanoscale Li1−x FePO4. Electrochem. Solid-State Lett. 2007, 10, A134–A138. [Google Scholar] [CrossRef]
- Yamada, A.; Chung, S.C.; Hinokuma, K. Optimized LiFePO[sub 4] for Lithium Battery Cathodes. J. Electrochem. Soc. 2001, 148, A224. [Google Scholar] [CrossRef]
Figure 1.
A schematic diagram of in situ XRD cell.

Figure 2.
Measured and refined XRD patterns of the as-made Cr/Si-LCFP electrode. Blue = observed; red = calculated; grey = difference; magenta = LCFP; turquoise = Al; green/* = Li9Cr3(PO4)2(P2O7)3.
Figure 2.
Measured and refined XRD patterns of the as-made Cr/Si-LCFP electrode. Blue = observed; red = calculated; grey = difference; magenta = LCFP; turquoise = Al; green/* = Li9Cr3(PO4)2(P2O7)3.

Figure 3.
Variation in cell voltage vs. Li concentration during cycling.

Figure 4.
Evolution of the XRD patterns of a Li/LCFP half-cell cycled at a rate of C/30. (a) Full 2θ range; (b) contour plot of the (020), (311), and (121) lines; (c) corresponding voltage–time profile (the displayed cycles correspond to the 2nd and 3rd cycles of the cell, while the 1st formation cycle is not plotted). Blue = charge; red = discharge. Peak bars at the bottom of (a): orange = LiCoPO4/PDF-04-007-4779; green = CoPO4/PDF-04-014-7341.

Figure 5.
Variation of lattice parameters in cycle B: (a) lattice parameters; (b) unit cell volumes; (c) phase wt.% and (d) cell potential vs. the Li content during the charge/discharge process.
Figure 5.
Variation of lattice parameters in cycle B: (a) lattice parameters; (b) unit cell volumes; (c) phase wt.% and (d) cell potential vs. the Li content during the charge/discharge process.

Figure 6.
Schematic crystal structure diagrams of LiCoPO4 and (Cr/Si)-Li(Co,Fe)PO4.


Table 1.
Refined crystal structure parameters.
| Atoms | Wyckoff Sites | x | y | z | Occupancy | Beq |
|---|---|---|---|---|---|---|
| Li | 4a | 1/2 | 1/2 | 1/2 | 1 | 1.883(0) |
| P | 4c | 0.0925(8) | 1/4 | 0.4133(7) | 1 | 0.682(9) |
| Co/Fe/Cr/Si | 4c | 0.2785(4) | 1/4 | 0.9762(3) | 1 | 1.142(0) |
| O | 4c | 0.0953(9) | 1/4 | 0.7473(2) | 1 | 1.226(0) |
| O | 4c | 0.4532(0) | 1/4 | 0.2176(5) | 1 | 1.226(0) |
| O | 8d | 0.1640(9) | 0.0413(8) | 0.277491) | 1 | 1.226(0) |
Rwp = 0.98; GOF (goodness of fit) = 1.18.
Table 2.
Average lattice parameters and their differences between the three phases.
| a (A) | b (A) | c (A) | V (A3) | Δa% | Δb% | Δc% | ΔV% | |
|---|---|---|---|---|---|---|---|---|
| LCFP (Li = 1) | 10.2003(6) | 5.9287(2) | 4.6971(1) | 284.058(1) | ||||
| L0.62CFPave | 10.0191(5) | 5.8387(0) | 4.7306(3) | 276.767(3) | ||||
| CFPave | 9.6004(0) | 5.7852(2) | 4.7642(4) | 264.608(1) | ||||
| LCFP–L0.62CFPave | −1.77(7) | −1.51(8) | 0.71(4) | −2.56(7) | ||||
| L0.62CFPave–CFPave | −4.17(9) | −0.91(6) | 0.71(0) | −4.39(3) | ||||
| LCFP–CFPave | −5.88(2) | −2.42(0) | 1.42(9) | −6.84(7) |
© 2020 by the authors. Licensee MDPI, Basel, Switzerland. This article is an open access article distributed under the terms and conditions of the Creative Commons Attribution (CC BY) license (http://creativecommons.org/licenses/by/4.0/).
Share and Cite
MDPI and ACS Style
Zhu, W.; Liu, D.; Gagnon, C.; Gariépy, V.; Trudeau, M.L.; Vijh, A.; Zaghib, K. Phase Transformation of Doped LiCoPO4 during Galvanostatic Cycling. Materials 2020, 13, 3810. https://0-doi-org.brum.beds.ac.uk/10.3390/ma13173810
AMA Style
Zhu W, Liu D, Gagnon C, Gariépy V, Trudeau ML, Vijh A, Zaghib K. Phase Transformation of Doped LiCoPO4 during Galvanostatic Cycling. Materials. 2020; 13(17):3810. https://0-doi-org.brum.beds.ac.uk/10.3390/ma13173810
Chicago/Turabian StyleZhu, Wen, Dongqiang Liu, Catherine Gagnon, Vincent Gariépy, Michel L. Trudeau, Ashok Vijh, and Karim Zaghib. 2020. "Phase Transformation of Doped LiCoPO4 during Galvanostatic Cycling" Materials 13, no. 17: 3810. https://0-doi-org.brum.beds.ac.uk/10.3390/ma13173810
Note that from the first issue of 2016, this journal uses article numbers instead of page numbers. See further details here.