Stimuli-Responsive Rifampicin-Based Macromolecules


1
Department of Physical Chemistry, Faculty of Chemistry, Rzeszow University of Technology, al. Powstańców Warszawy 6, 35-959 Rzeszów, Poland
2
School of Engineering and Technical Sciences, Rzeszow University of Technology, al. Powstańców Warszawy 8, 35-959 Rzeszów, Poland
*
Author to whom correspondence should be addressed.
Materials 2020, 13(17), 3843; https://0-doi-org.brum.beds.ac.uk/10.3390/ma13173843
Submission received: 3 July 2020
/
Revised: 25 August 2020
/
Accepted: 28 August 2020
/
Published: 31 August 2020
(This article belongs to the Special Issue Atom Transfer Radical Polymerization (ATRP) in Synthesis of Precisely Defined Polymers)
Abstract
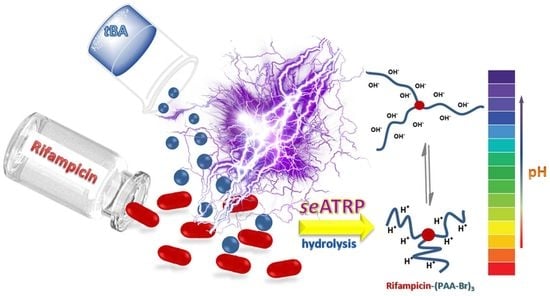
:This paper presents the modification of the antibiotic rifampicin by an anionic polyelectrolyte using a simplified electrochemically mediated atom transfer radical polymerization (seATRP) technique to receive stimuli-responsive polymer materials. Initially, a supramolecular ATRP initiator was prepared by an esterification reaction of rifampicin hydroxyl groups with α-bromoisobutyryl bromide (BriBBr). The structure of the initiator was successfully proved by nuclear magnetic resonance (1H and 13C NMR), Fourier-transform infrared (FT-IR) and ultraviolet–visible (UV-vis) spectroscopy. The prepared rifampicin-based macroinitiator was electrochemically investigated among various ATRP catalytic complexes, by a series of cyclic voltammetry (CV) measurements, determining the rate constants of electrochemical catalytic (EC’) process. Macromolecules with rifampicin core and hydrophobic poly (n-butyl acrylate) (PnBA) and poly(tert-butyl acrylate) (PtBA) side chains were synthesized in a controlled manner, receiving polymers with narrow molecular weight distribution (Mw/Mn = 1.29 and 1.58, respectively). “Smart” polymer materials sensitive to pH changes were provided by transformation of tBA into acrylic acid (AA) moieties in a facile route by acidic hydrolysis. The pH-dependent behavior of prepared macromolecules was investigated by dynamic light scattering (DLS) determining a hydrodynamic radius of polymers upon pH changes, followed by a control release of quercetin as a model active substance upon pH changes.
1. Introduction
Polymers as multifunctional structures are intensively studied in drug formulation and drug delivery systems [1,2,3,4]. It is directly connected with unique properties of polymers to respond to external stimuli, i.e., thermoresponsive macromolecules, such as a widely known poly(N-isopropylacrylamide) [5] or recently studied poly(2-isopropenyl-2-oxazoline) [6], and polyelectrolytes with positively or negatively charged groups, sensitive to pH changes, e.g., anionic poly(acrylic acid) (PAA) [7] or cationic poly(2-(dimethylamino)ethyl methacrylate) [8], making them “smart” materials and promising candidates to control encapsulate and release of drugs, and cell-specific targeting [1,9,10]. There is a wide range of nontoxic, biocompatible, and biodegradable polymeric materials, successfully implemented in the controlled release of different substances upon pH changes. This subject is especially privileged among antibiotics delivery systems. Polymers are usually used as separate structures, that encapsulate and release drugs upon external stimulus changes [8,10,11]. In this work, the incorporation of polymer chains into a rifampicin structure is proposed to incorporate polymer chains into the structure of rifampicin. Direct modification of drugs by an appropriate polymer provides additional benefits beyond the possibility for extended-release delivery systems, namely, improves the property of drugs [12] and can avoid the resistance of antibiotics for bacteria [13].
Rifampicin is a powerful heterocyclic antibiotic, used as a first-line drug for the treatment of tuberculosis, due to easy diffusion into tissue, living cells, and bacteria [14,15]. Rifampicin is classified to ansamycins because of its heterocyclic structure consisting of an aromatic chromophore (naphthoquinone core) that is responsible for its characteristic red-orange crystalline color, spanned by an aliphatic ansa chain [16]. Due to the presence of hydroxyl groups in its structure, it is an excellent candidate for modification by atom transfer radical polymerization (ATRP) methods [17,18,19,20]. ATRP belongs to the reversible deactivation radical polymerization (RDRP) technique, based on the use of a transition metal complex as a catalyst that participates in redox reactions and thus controls polymerization [21,22,23]. Among other RDRP techniques, it is recently the most influential approach in the preparation of precisely-defined polymer materials with complex architecture [24,25]. It was successfully applied for the synthesis of a wide range of branched architectures by modification of naturally-derived and bioactive structures, e.g., vitamins [17,26,27], sugars [28,29], tannins [30,31], drugs [32], and biopolymers [33,34,35], according to the “grafting from” approach, providing materials with predetermined structure for potential use in biomedical applications. The use of ATRP for drug modification is beneficial from several reasons, i.e., control of the polymer chain structure during polymerization resulting in materials with precise functionality, ability to receive ultra-pure products using “clean” techniques controlled by external stimulus e.g., electric current [36,37,38], ultrasound [39,40,41] and light [42,43,44,45], removing additional chemical reducing agents from reaction media; externally control methods allow for temporal control during polymerization, beneficial in the preparation of predetermined structures [17,27,36]; low ppm ATRP approaches use only ppm level of catalyst, easily removed from final products, without contamination of the product [46,47]. Up to now, electrochemically-mediated ATRP (eATRP) is the most controlled technique among externally controlled ATRP methods. The precise control of the ratio between CuI and CuII during polymerization is established by constant current (I) or potential (E) at the working electrode surface [17,48,49,50]. It provides precisely-defined branched polymeric materials by avoiding an undesirable termination reaction and gelation with the increase of molecular weight [51,52,53]. Reaction setup in preparative electrolysis consists of a three-electrode system. It can be simplified by replacing a platinum electrode constituting a counter electrode by an aluminum immersed directly in reaction media, making this technique simplified electrochemically-mediated ATRP (seATRP) [36,54]. Another simplification is an application of constant current (galvanostatic) conditions, that removes a reference electrode from the electrochemical cell [27,55]. Additionally, seATRP as an external control approach was successfully temporally controlled in the preparation of both well-defined linear and branched architectures [18,27,56].
In this study, the synthetic route for the modification of rifampicin using seATRP method was investigated. The first step of the “grafting from” approach covers the preparation of rifampicin-based multifunctional ATRP macroinitiator by esterification of rifampicin with α-bromoisobutyryl bromide (BriBBr). The prepared supramolecular structure was electrochemically investigated for the use as an ATRP initiator in the presence of different catalyst complexes, determining rate constant of the electrochemical catalytic process (kEC’)—characteristics of ATRP polymerization. The polymer brushes with rifampicin core and hydrophobic poly(n-butyl acrylate) (PnBA) and poly(tert-butyl acrylate) (PtBA) side chains were synthesized. pH-responsive “smart” rifampicin-based materials were received by the transformation of tBA units into acrylic acid (AA) moieties. PAA has anionic functional groups that become ionized in response to pH changes, resulting in control release properties.
2. Materials and Methods
2.1. Chemicals
Rifampicin (Rif, Mn = 922.94, 95%, Acros Organics, Morris Plains, NJ, USA), 2-bromoisobutyryl bromide (BriBBr, 98%, Sigma-Aldrich, St. Louis, MO, USA), N-methyl-2-pyrrolidone (NMP, >99%, Sigma-Aldrich), dichloromethane (DCM, >99.9%, Sigma-Aldrich), tetrabutylammonium perchlorate (TBAP, >98%, Sigma-Aldrich), N,N-dimethylformamide (DMF, >99.9%, Honeywell Riedel-de Haen, Muskegon, MI, USA), copper(II) bromide (CuIIBr2, 99.9%, Sigma-Aldrich), N,N,N’,N”,N”-pentamethyldiethylenetriamine (PMDETA, >98%, Sigma-Aldrich), 2,2,6,6-tetramethylpiperidine 1-oxyl (TEMPO, 98%, Sigma-Aldrich), methanol (MeOH, >99.8%, Sigma-Aldrich), water (ACS Reagent, Honeywell Riedel-de Haen), trifluoroacetic acid (TFA, >99%, Sigma-Aldrich), tetrahydrofuran (THF, >99.9%, Sigma Aldrich), n-butanol (>99.7%, Sigma-Aldrich), sulfuric acid (>95%, Sigma-Aldrich), sodium bicarbonate (NaHCO3, >99.7%, Sigma-Aldrich), diiodomethane (99%, Sigma-Aldrich), sodium hydroxide (NaOH, >98%, Honeywell Riedel-de Haen), hydrochloric acid (HCl, 35–38%, Chempur, Piekary Śląskie, Poland), and buffer solutions (pH 1 and pH 9, POCH, Gliwice, Poland) were not subjected to further purification. Tris (2-pyridylmethyl)amine (TPMA), bis (4-methoxy-3, 5-dimethyl-pyridin-2-ylmethyl)-pyridin-2-ylmethyl-amine (TPMA*2) [57,58], and CuIIBr2/TPMA catalyst complex were prepared as previously reported [26,59]. n-Butyl acrylate (BA, >99% Sigma-Aldrich) and tert-butyl acrylate (tBA, >99%, Sigma-Aldrich) were passed through a column filled with basic alumina before use in order to remove inhibitor. Pt gauze (99.9% metals basis), Pt mesh, Al wire, and Pt disk (3 mm diameter, Gamry Instruments, Warminster, PA, USA) were purchased from Alfa Aesar (Ward Hill, MA, USA).
2.2. Analysis
Subsequently, 1H and 13C NMR analysis was carried out in CDCl3 using Bruker Avance 500 MHz spectrometer (Bruker, Karlsruhe, Germany) in 25 °C. Gel permeation chromatography (GPC) was performed to determine Molecular weights (MWs) and molecular weight distributions (MWD, Mw/Mn, Ð) using Viscotek, T60A detector (Houston, TX, USA) equipped with polymer standards services (PSS) columns (guard 103 and 102 Å). The eluent was HPLC grade THF, and the flow rate was 1 mL/min. Calibration curve was generated on the basis of monodispersed polystyrene (PS) standards using TRISEC software from Viscotec Corporation (version 3.0). Volume mean diameter (dvolume) of polymer sample (1 mg/mL in THF) was measured by Dynamic Light Scattering (DLS, Zetasizer Nano ZS, Malvern Panalytical, Worcestershire, UK) at 20 °C. FT-IR spectra were taken with the spectrophotometer Nicolet 6700 FT-IR (Thermo Scientific, Waltham, MA, USA), within 500–4000 cm–1, with the use of attenuated total reflectance (ATR) technique. The UV–vis spectra were obtained on a Hewlett-Packard (Waldbronn, Germany) Model HP-8453 diode array rapid scan spectrophotometer using a quartz cell with optical length of 1 cm. Cyclic voltammetry (CV) measurements and preparative electrolysis were performed using an Autolab model AUT84337 potentiostat (Metrohm, Utrecht, The Netherlands) running with a GPES software in a five-neck electrochemical cell equipped electrodes as follows: working electrode (WE)—Pt disk (A = 0.071 cm2, carefully polished with 0.05 μm alumina suspension (Buehler) before every single measurement) for CV and Pt mesh for preparative electrolysis (A = ~6 cm2), reference electrode (RE)—saturated calomel electrode (SCE), equipped with a saturated salt bridge and a Vycor tip, immersed inside a Luggin capillary, counter electrode (CE)—an Al wire (l = 10 cm, d = 1 mm) immersed directly in the reaction mixture. During preparative electrolysis a condenser was connected to the reaction cell kit and the temperature was maintained at 50 °C (thermostat ESM-3711-H, Laboplay, Bytom, Poland).
2.3. Synthesis of Rifampicin-Based ATRP Macroinitiator (Rif-Br3)
Rifampicin (0.8 g, 0.97 mmol) was dissolved in NMP (20 mL) under Ar atmosphere in a 100 mL round bottom flask. A solution of BriBBr (2.40 mL, 19.4 mmol) in NMP (5.6 mL) was added dropwise over a period of 1 h at 0 °C (ice bath). Then the solution was removed from the ice bath and stirred in a sealed flask for 7 days at room temperature. Upon completion, the reaction mixture was diluted with DCM (30 mL), washed with water (100 mL × 15), and the organic phase was placed in dialysis tubing (Spectra/Por dialysis membrane, MWCO 1000) and dialyzed against deionized water for 10 cycles over 7 days. Subsequently, the product concentrated under reduced pressure. The resulting dark red solid product was dried under vacuum (0.81 g, yield 66%). The final ATRP macroinitiator was characterized by NMR, GPC, FT-IR, and UV-vis analysis (Supplementary Figures S1–S4, respectively).
2.4. Electrochemical Characterization
Electrochemical characterization of Rif-Br3 in the presence of three different catalytic complexes (CuIIBr2/PMDETA, CuIIBr2/TPMA, CuIIBr2/TPMA*2) was performed. The Pt disc, Al wire, and SCE were prepared and located in the electrochemical cell. Rif-Br3, CuIIBr2/L (0.05 M in DMF) and TEMPO were dissolved in DMF in the ratio [Rif-Br3]/[CuIIBr2/L]/[TEMPO] = 1:0.08:4. The mixture was Ar purged. The first series of CV measurements in different scan rates were carried out after addition of catalytic complex. The next series of CV measurements were conducted after the Rif-Br3 and TEMPO were introduced to the electrochemical cell.
2.5. The Synthesis of Rif-(PnBA-Br)3 by seATRP under Constant Potential Conditions with CuIIBr2/TPMA*2 Catalytic Complex
The Pt disc, Al wire, and SCE were prepared and located in the five-neck jacked electrochemical cell equipped with condenser. 1.71 g of TBAP (5.0 mmol), 3.8 mL of BA (27.4 mmol), 20.0 mL of DMF and 219 μl of CuIIBr2/TPMA*2 stock solution (0.05 M in DMF) were introduced into the cell at 50 °C under a slow Ar purge. CV of catalytic complex was recorded to determine the appropriate applied potential (Eapp = −0.400 V; Supplementary Figure S8a) during seATRP. Then, 43.0 mg of Rif-Br3 (33.9 µmol) in 1 mL of DMF was added and the CV of catalytic complex in the presence of ATRP initiator was recorded. The Pt disc was replaced by Pt mesh and after degassing the preparative electrolysis was conducted. Samples were withdrawn periodically to follow the monomer conversion by 1H NMR, and determine Mn and Mw/Mn by GPC. Before GPC analysis, the sample was dissolved in methanol, precipitated in water, dried under vacuum for 1 day, dissolved in THF, passed through a neutral alumina column with 0.22 µm filter.
2.6. The Synthesis of Rif-(PnBA-Br)3 by seATRP under Constant Potential Conditions with CuIIBr2/TPMA Catalytic Complex
The Pt disc, Al wire, and SCE were prepared and located in the five-neck jacked electrochemical cell equipped with condenser. 1.09 g of TBAP (3.2 mmol), 4.8 mL of nBA (35.1 mmol), 9.92 mL of DMF and 281 μL of CuIIBr2/TPMA stock solution (0.05 M in DMF) were introduced into the cell at 50 °C under a slow Ar purge. CV of catalytic complex was recorded to determine the appropriate applied potential (Eapp = −0.320 V; Supplementary Figure S9a) during seATRP. Then, 55 mg of Rif-Br3 (43.3 µmol) in 1 mL of DMF was added and the CV of catalytic complex in the presence of ATRP initiator was recorded. The Pt disc was replaced by Pt mesh and after degassing the preparative electrolysis was conducted. Samples were withdrawn periodically to follow the monomer conversion by 1H NMR, and determine Mn and Mw/Mn by GPC. Before GPC analysis, the sample was dissolved in methanol, precipitated in water, dried under vacuum for 1 day, dissolved in THF, and passed through a neutral alumina column with a 0.22 µm filter.
2.7. The Synthesis of Rif-(PnBA-Br)3 by Temporally-Controlled seATRP under Constant Current Conditions with CuIIBr2/TPMA Catalytic Complex
The Pt mesh and Al wire were prepared and located in the five-neck jacked electrochemical cell equipped with condenser. 1.09 g of TBAP (3.2 mmol), 4.8 mL of nBA (35.1 mmol), 9.92 mL of DMF, 281 μL of CuIIBr2/TPMA stock solution (0.05 M in DMF) and 55 mg of Rif-Br3 (43.3 µmol) in 1 mL of DMF were introduced into the cell at 50 °C under a slow Ar purge. After degassing the preparative electrolysis was conducted. Samples were withdrawn periodically to follow the monomer conversion by 1H NMR, and determine Mn and Mw/Mn by GPC. Before GPC analysis, the sample was dissolved in methanol, precipitated in water, dried under vacuum for 1 day, dissolved in THF, passed through a neutral alumina column with a 0.22 µm filter. The final purified polymer product was characterized by 1H NMR (Supplementary Figure S13).
2.8. The Synthesis of Rif-(PtBA-Br)3 by seATRP under Constant Potential Conditions with CuIIBr2/TPMA Catalytic Complex
The Pt disc, Al wire, and SCE were prepared and located in the five-neck jacked electrochemical cell equipped with condenser. Then, 1.09 g of TBAP (3.2 mmol), 4.8 mL of tBA (35.1 mmol), 9.94 mL of DMF, and 262 μL of CuIIBr2/TPMA stock solution (0.05 M in DMF) were introduced into the cell at 50 °C under a slow Ar purge. CV of catalytic complex was recorded to determine the appropriate applied potential (Eapp = −0.322 V; Supplementary Figure S11a) during seATRP. Then, 137 mg of Rif-Br3 (0.11 mmol) in 1 mL of DMF was added and the CV of catalytic complex in the presence of ATRP initiator was recorded. The Pt disc was replaced by Pt mesh and after degassing the preparative electrolysis was conducted. Samples were withdrawn periodically to follow the monomer conversion by 1H NMR, and determine Mn and Mw/Mn by GPC. Before GPC analysis, the sample was dissolved in methanol, precipitated in water, dried under vacuum for 1 day, dissolved in THF, passed through a neutral alumina column with a 0.22 µm filter. The final purified polymer product was characterized by 1H NMR (Supplementary Figure S14).
2.9. The Synthesis of Rif-(PtBA-b-PtBA-Br)3 by seATRP under Constant Potential Conditions with CuIIBr2/TPMA Catalytic Complex
The Pt disc, Al wire, and SCE were prepared and located in the five-neck jacked electrochemical cell equipped with condenser. 0.96 g of TBAP (2.8 mmol), 2.2 mL of tBA (14.9 mmol), 7.69 mL of DMF. and 119 μl of CuIIBr2/TPMA stock solution (0.05 M in DMF) were introduced into the cell at 50 °C under a slow Ar purge. CV of catalytic complex was recorded to determine the appropriate applied potential (Eapp = −0.320 V; Supplementary Figure S12a) during seATRP. Then, 844 mg of Rif-(PtBA-Br)3 (22.1 µmol) in 4 mL of DMF was added and the CV of catalytic complex in the presence of ATRP initiator was recorded. The Pt disc was replaced by Pt mesh and after degassing the preparative electrolysis was conducted. Samples were withdrawn periodically to follow the monomer conversion by 1H NMR, and determine Mn and Mw/Mn by GPC. Before GPC analysis, the sample was dissolved in methanol, precipitated in water, dried under vacuum for 1 day, dissolved in THF, and passed through a neutral alumina column with a 0.22 µm filter. The final purified polymer product was characterized by 1H NMR (Supplementary Figure S15).
2.10. Detaching Polymer Side Chains from Rifampicin-Based Macromolecules
The detachment of the polyacrylates side chains was conducted by acid solvolysis according to the previously described procedure [60].
2.11. Transformation of PtBA to PAA Side Chains
The PtBA blocks of rifampicin-based macromolecules were hydrolysed to PAA blocks (Supplementary Figure S7). The Rif-(PtBA-Br)3 (0.17 g, 4.5 µmol) was dissolved in DCM (10 mL) and a 5-fold molar excess of TFA with respect to the ester groups (0.4 mL, 5.2 mmol) was added. The Rif-(PtBA-b-PtBA-Br)3 (0.42 g, 5.9 µmol) was dissolved in DCM (15 mL) and a 5-fold molar excess of TFA with respect to the ester groups (0.7 mL, 9.4 mmol) was added. The mixtures was stirred at room temperature for 72 h. When PtBA moieties were hydrolyzed, the PAA-based macromolecules precipitate in DCM. They were separated by filtration, washed with DCM, and the solvent and TFA were removed by rotating evaporation. The final sample was dried under vacuum at 50 °C for 1 day and characterized by 1H NMR (Supplementary Figures S17 and S18), and FT-IR analysis (Supplementary Figures S19 and S20).
2.12. Confirmation of PtBA Hydrolysis to PAA Moieties by Contact Angle Measurements
The character of the wetting PAA-based and corresponding PtBA-based polymer film was measured by the determination of contact angles values (θ). Silicon wafers were coated by the solution of a polymer in water (PAA, 5 mg/mL) and THF (PtBA, 5 mg/mL). After evaporation of solvents, (10 µL) of water (polar) and diiodomethane (non-polar) liquid was put on the prepared polymer films. Pictures of the droplets were taken (Camera 13 MP, f/2.2, PDAF) each time three droplets of the individual liquids were analyzed. The geometric analysis of pictures was conducted by Kropla software, receiving the values of contact angles, followed by the calculation of free surface energy (FSE, γS) values for polymer coatings according to Owens–Wendt methods by software Energia [31].
2.13. Determination of pH-Sensitivity of PAA-Based Polymers
The behavior of the rifampicin-based macromolecules with PAA side chains against pH changes was investigated by potentiometric titration, determining hydrodynamic radius of polymers by DLS measurements of the solutions in different pH values. Potentiometric titration was performed using a digital pH meter (CPC-551, ELMETRON, Zabrze, Poland), equipped with a combined glass/reference electrode (HYDROMET, ERH-13-6). The polymer was dissolved in 0.1 M NaOH (1 mg/mL solution). pH value was adjusted by titration with aqueous 0.1 M HCl under intensive stirring, at a constant temperature (25 °C). pH readings were registered after each portion of titrant added to polymer solution, when the equilibrium state was established.
2.14. Loading of Quercetin (QC) into the PAA-Based Polymer and Its Release Behavior upon pH Changes
Quercetin loaded micelles were prepared by the dialysis method as fallow. Initially, 20 mg of Rif-(PtBA-b-PtBA-Br)3 polymer and 8 mg of QC was dissolved in DMF, and stirred for half an hour. The mixed solution was added dropwise into 20 mL water, stirred for 1.5 h, placed in dialysis tubing (Spectra/Por dialysis membrane, MWCO 1000) and dialyzed against deionized water for 2 cycles over 16 hours. The received QC loaded micelles solution was adjusted to 70 mL by DMF, and the total mass of QC loaded in PAA-based micelles was estimated on the basis of calibration curve of the absorption intensity at λ = 374 nm as a function of QC concentration in DMF. The loading efficiency (EL) was calculated as follows [61]:
where wp and wt are the mas of QC in micelles and total QC used in the preparation of micelles, respectively.
Release of QC loaded in polymer micelles was investigated as follows: 4 mL of QC loaded micelle solution was placed into a dialysis membrane (Spectra/Por dialysis membrane, MWCO 1000) and immersed into 70 mL of buffer solution (pH 1 and pH 9). The solutions were incubated at 37 °C. The samples were withdrawn periodically (1 mL) and replaced by 1 mL of fresh buffer solution. The concentration of released QC was investigated on the basis of UV-vis spectra.
3. Results and Discussion
3.1. Synthesis and Characterization of Rifampicin-Based ATRP Macroinitiator
The synthetic route for the modification of rifampicin by introduction of polymer chains in its structure included two steps. Initially, a supramolecular ATRP macroinitiator was synthesized, followed by polymerization of acrylates from the rifampicin-based initiator, forming functional polymer chains. A rifampicin-based macromolecular initiator with bromine atoms (Rif-Br3, Mn = 1269.94, Ð = 1.19) was prepared by an esterification reaction of rifampicin with BriBBr, as shown in Figure 1.
The chemical structure of Rif-Br3 was confirmed using 1H NMR (Supplementary Figure S1b) analysis by assignment of the signals on the basis of 1H NMR spectra of rifampicin before modification (Supplementary Figure S1a) [62]. 1H NMR assignment of Rif-Br3: δ (ppm) = 0.23–0.07 (3H, CH3–, 1), 0.79–0.86 (3H, CH3–, 2), 0.95–1.14 (6H, CH3–, 3 + 4), 1.30–1.35 (1H, –CH–, 5), 1.65–1.70 (2H, –CH–, 6 + 7), 1.81–2.03 (27H, CH3–, 8 + 9 + 10 + –C(CH3)2), 2.19–2.40 (7H, CH3–, >N(CH3)–, –CH–, 11 + 12 + 13), 2.41–2.62 (4H, –CH2–, 14), 2.92–3.10 (7H, CH3–, –CH2–, 16 + 17), 3.10–3.22 (1H, –CH–, 15), 3.35–3.45 (1H, –CH–, 19), 4.08–4.26 (1H, –CH–, 21), 4.96–5.03 (1H, =CH–, 22), 5.05–5.27 (1H, –CH–, 23), 5.90–6.03 (1H, =CH–, 24), 6.17–6.23 (1H, =CH–, 25), 6.48–6.64 (1H, =CH–, 26), 6.65–6.78 (1H, =CH–, 27), 7.94–8.21 (1H, –N=CH–, 28), 12.90–13.86 (3H, –NH–, –OH, 30 + 31 + 32). After incorporation of bromine structure into rifampicin, new chemical shifts appear at δ = 1.81–2.03 (27H, 8 + 9 + 10 + –C(CH3)2), arising from the methyl protons adjacent to the bromine atom. The number of the brominated initiation sites in rifampicin-based ATRP macroinitiator was determined by the ratio between the integration areas of the proton localized in the imine group of rifampicin at the regions of δ = 7.94–8.21 ppm (1H) and the protons characteristic for methyl groups of incorporated bromine. Additionally, after modification of rifampicin by esterification reaction, 1H NMR spectra signals from three hydroxyl groups protons disapperared, which were at the regions of δ = 3.43–3.46 ppm, 3.58–3.64 ppm and 11.99–12.04 ppm in 1H NMR spectra of the substrate [63] (Supplementary Figure S1a). Chemical structure of Rif-Br3 was also confirmed by 13C NMR analysis as follows: δ (ppm) = 10.93 (C1), 13.57 (C2), 14.01 (C3), 19.62 (C4), 22.14 (C5), 22.94 (C6), 23.39 (C7), 23.91 (C8),27.80 (C9), 28.89 (C10), 29.15 (C11), 33.12 (C12), 38.70 (C13), 58.71 (C14), 67.33 (C15), 67.42 (C16), 67.66 (C17), 68.15 (C18), 68.60 (C19), 98.36 (C20), 100.81 (C21), 100.85 (C22), 101.61 (C23), 101.70 (C24), 101.71 (C25), 103.76 (C26), 103.79 (C27), 106.33 (C28), 107.28 (C29), 107.31 (C30), 107.37 (C31), 107.58 (C32), 107.81 (C33), 107.91 (C34), 128.78 (C35), 130.90 (C36), 132.39 (C37), 161.06 (C38), 161.17 (C39), 161.39 (C40), 167.70 (C41), 167.80 (C41), 171.04 (C43), 177.99 (C44) (Supplementary Figure S1c) [62]. The characteristic signals of the carbons in incorporated bromine structure were assigned (C11, C20 and C43). NMR spectra show residual impurities in the final product derived from solvents used in the synthesis and purification (H2O, NMP, acetone), however polar both parotic and aprotic solvents do not interfere with ATRP process [64,65] and such an inconsiderable amount does not affect the course of the reaction.
The structure of the brominated macromolecule was also analyzed by FT-IR analysis (Supplementary Figure S3). Significant differences in comparison to FT-IR spectra of unmodified rifampicin were observed. A new signal within 1700–1800 cm−1 and 1000–1150 cm−1 was identified, which are associated with C=O and C-O-C stretching vibrations in ester groups of incorporated bromine structure, respectively. Additionally, the bands at about 1220–1350 cm−1 related to C–H bending vibrations –CH3 groups of brominated molecules were noticed. There is a band in the 3100–3700 cm−1 region which is related to two unmodified –OH groups. The band is significantly less intense compared to the spectrum of the rifampicin substrate.
Additionally, UV-vis spectrophotometric measurements were recorded for unmodified and brominated rifampicin (Supplementary Figure S4). For rifampicin in THF, the UV-vis spectrum shows bands at 345 nm, 400 nm, and 465 nm. These bands decreased significantly in the spectrum after modification of a substrate with BriBBr molecules, proving successful incorporation of brominated initiation sites in rifampicin-based ATRP macroinitiator. Spectral changes and absorbance decrease are the results of the perturbation of the chromophore electrons of the rifampicin after incorporation of bromine molecules in its structure.
The initiation characteristics of rifampicin-inspired ATRP macroinitiator and the selection of an appropriate catalyst for polymerization was checked by an electrochemical investigation of different catalytic complexes (CuIIBr2/PMDETA, CuIIBr2/TPMA, CuIIBr2/TPMA*2) in the presence of the brominated structure. A series of CV measurements were carried out. As expected, CV of copper catalyst complexes demonstrated redox processes as a reduction of CuII to CuI and vice versa, evidenced by quasi-reversible peak couples with formal reduction potential E° ≈ (Epc + Epa)/2 = −0.174 V vs. SCE, −0.237 V vs. SCE and −0.328 V vs. SCE, respectively, where Epc is a cathodic peak potential and Epa is an anodic peak potential (Supplementary Figure S5). More negative value of E° indicates a more active ATRP copper complex [58]. The addition of the brominated rifampicin to the reaction media resulted in the disappearance of the anodic peak and a significant decrease of the cathodic peak current. This phenomenon is described as the electrochemical catalytic process (EC’), where the catalyst electrochemically reduced to an active form (CuI) rapidly reacts with alkyl halide macroinitiator (Rif-Br3). In consequence, CuI is oxidized back not electrochemically but by chemical reaction, and the reverse scan corresponding to oxidation of CuI to CuII does not occur [29,36,60]. The observation confirms the ability of the prepared rifampicin-based molecule to initiate the ATRP process.
For precise determination of the initiation functionality of the bromide structure, the rate constant of the EC’ (kEC’) with different catalyst complexes was determined. Activation reaction in ATRP process consists of a reversible electron transfer within the redox species followed by an irreversible reaction regenerating the starting form of catalyst, thus the foot-of-the-wave (FOWA) analysis developed by Savéant and co-workers [29,60,66,67] was used for determination of kEC’. TEMPO as a radical scavenge was used to make the overall process irreversible. The principle of this method is the normalization of the catalytic current (i) with respect to the peak current of the reversible one-electron reduction of the transition metal catalyst in the absence of the brominated structure (Rif-Br3) at the same scan rate, ip0 [66,67]. It results in the Equation:
where is initial concentration of Rif-Br3, F is the Faraday constant, R is the universal gas constant, T = 298 K, is the half wave potential of the CuIIBr2/L catalyst complex, where the slope (a) of the plot (Equation (2)) give the value of kEC’.
An average rate constant of EC’ is kEC’ = (2.73 ± 0.47) × 102 M−1 s−1, kEC’ = (5.65 ± 0.97) × 103 M−1 s−1, and kEC’ = (1.82 ± 0.20) × 104 M−1 s−1, for CuIIBr2/PMDETA, CuIIBr2/TPMA and CuIIBr2/TPMA*2, respectively. The results indicate CuIIBr2/TPMA*2 as the most efficient catalyst in the reaction setup with Rif-Br3 as a supramolecular ATRP macroinitiator.
3.2. Synthesis of Rifmapicin-Based Macromolecules
Considering an electrochemical investigation of brominated rifampicin as an ATRP initiator with different catalytic complexes, CuIIBr2/TPMA*2, as the most active catalyst, was used for the synthesis of branched polymers, polymerizing n-butyl acrylate from rifampicin core (Table 1, entry 1, Supplementary Figure S7). Simplified electrochemically-mediated ATRP under constant potential conditions (applied potential, Eapp = Epc − 80 mV, Supplementary Figure S8a) was applied. As expected, initially a rapid decay of the cathodic current was observed, associated with the presence of CuII rapidly reduced to activator form (CuI) at the working electrode surface upon the applied potential. Then, the current approaches constant value due to the adjustment of an equilibrium of the ratio between deactivator and activator form of the catalyst by the selected Eapp (Supplementary Figure S8b) [36,68]. Initially, a linear first-order kinetics plot is observed, however, the polymerization slowed down considerably after 4.5 h of the process, reaching monomer conversion of 48% (Supplementary Figure S8c). Despite the stopping of the polymerization in the last hour, the last kinetics point of Mn vs. monomer conversion plot deviates from linearity towards higher molecular masses, indicating inter- and intramolecular coupling reaction, thus the formation of uncontrolled high molecular weight polymer structures (Supplementary Figure S8d). It results in a broad molecular weight distribution of the final product (Mw/Mn = 1.63, Supplementary Figure S8e).
Polymerization with the use of unsubstituted TPMA as a ligand was conducted (Table 1, entry 2, Supplementary Figure S9a,b). Similarly, as with CuIIBr2/TPMA*2 catalyst complex, the first-order kinetics plot deviates from linearity, indicating for gradual stopping of the polymerization process, receiving comparable monomer conversion (conv = 51%, Figure 2a). However, the received rifampicin-based macromolecules were characterized by lower dispersity (Mw/Mn = 1.29), and the Mn vs. monomer conversion plot does not indicate the coupling reaction by inter- and intramolecular reaction (Figure 2b). The molecular weight of the two last kinetics samples insignificantly changes, proving the formation of the new homopolymer chains in the reaction setup, suggesting transfer to solvent, monomer, or more attributed to preparative electrolysis – to an electrolyte. A low molecular weight shoulder is observed in the GPC trace of polymerization product (Figure 2c). Despite the lower activity comparing to CuIIBr2/TPMA*2, catalyst complex with TPMA provided more controlled polymerization of rifampicin-based macromolecules. The additional electron-donating groups in TPMA*2 structures increase the reduction properties of the corresponding activator complexes (CuI), shifted the equilibrium toward stabilization of the oxidized catalyst form, as proved by calculation of CuI/CuII ratio (0.02 vs. 31.06, compare [CuI]/[CuII], Supplementary Table S1, entries 1 and 2) [58]. It results in faster polymerization (kpapp = 0.133 vs. 0.109, compare kpapp, Table 1, entries 1 and 2). Although the use of CuIIBr2/TPMA*2 provided a synthesis of more controlled linear structure comparing to CuIIBr2/TPMA ligand [58], substituted with electron-donating groups pyridine ligand is too active for the preparation of architecture macromolecules presented in this paper, losing control during synthesis, resulting in coupling reactions, and thus in high dispersity and a higher theoretical dead chain fraction value (DCFtheo = 0.26 vs. 0.12, compare DCFtheo, Supplementary Table S3, entries 1 and 2).
To simplify an electrochemical cell, the current constant conditions were applied to conduct the polymerization of rifampicin-based polymers (Table 1, entry 3). Electrolysis under galvanostatic conditions is privileged from both, laboratory and potential scaling the reaction setup to industrial scale. An electrochemical cell is simplified by the elimination of RE, and a potentiostat/galvanostat can be replaced by a simple direct-current power supply [27,36,52,55]. The current profile was established on the basis of potentiostatic electrolysis as I = Q/t (Q–electric charge, t–polymerization time) (Table 1, entry 2), and consisted of 4 current stages (applied current, Iapp = 1.22 mA, 0.75 mA, 0.39 mA and 0.14 mA, respectively) to appropriately adjust the chronoamperometric curve (Supplementary Figure S10a). Additionally, temporal control over the polymerization was implemented, stopping and restarting the polymerization by switching between ON (Iapp) and OFF (Iapp = 0 A) stages, respectively. This procedure verifies the livingness of the electrochemical-mediated process and provides control over the molecular weight of polymer chains. The observed trend of the first-order kinetics plot (Figure 3a), Mn vs. monomer conversion (Figure 3b) and GPC traces of the samples withdrawn periodically during synthesis, clearly proved the living characteristics of preparative electrolysis, namely while the current value dropped to 0 mA, the polymerization of the monomer and thus an increase of polymer molecular weight was stopped. The temporally control galvanostatic electrolysis provided the final product with broader molecular weight distribution (Mw/Mn = 1.29 vs. 1.59, compare Mw/Mn, Table 1, entries 2 and 3, respectively). Despite the DCFtheo value below 1%, after restarting the polymerization, the chain-and functionality of growing polymers was slightly lost, resulting in the product with higher dispersity comparing to the macromolecules received in the electrolysis under potentiostatic conditions without temporal control stages.
Motivated by better control during the polymerization catalyzed by CuIIBr2/TPMA, tBA as a precursor of polyelectrolytes, was polymerized from rifampicin-based ATRP macroinitiator via seATRP under potentiostatic conditions (Table 1, entry 4, Supplementary Figure S11a,b). Linear characteristics of both first-order kinetics plot (Figure 4a) and an increase of polymer molecular weight as a function of monomer conversion (Figure 4b,c) was observed. However, the final product is characterized by broader molecular weight distribution comparing to Rif-(PnBA-Br)3 (Mw/Mn = 1.71 vs. 1.29, compare Mw/Mn, Table 1, entries 2 and 4, respectively). It is directly connected with the higher macroinitiator concentration in the polymerization of tBA. According to the equation describing the dispersity Mw/Mn = 1 + (kp[P-X]/kda[CuII])(2/p − 1) (where kp is rate constant of propagation, [P-X]–macroinitiator concentration, kda–rate constant of deactivation, [CuII]–copper (II) concentration and p–monomer conversion) [69,70], higher [P-X] provides macromolecules with higher dispersity.
Chain extension experiment was conducted to examine chain-end functionality of Rif-(PtBA-Br)3 (Table 1, entry 5, Supplementary Figure S11a,b). Additional PtBA polymer block was incorporated into the side chains of rifampicin-based macromolecules applied as an ATRP macromolecular initiator (Mn,theo = 30100, Mw/Mn = 1.71). The polymerization process was characterized by a linear semi-logarithmic kinetics plot (Figure 5a) and an increase in polymers MW during polymerization (Figure 5b,c) was observed. It results in a final polymer product with lower dispersity compared to the first PtBA block Mw/Mn = 1.58 vs. 1.71, compare Mw/Mn, Table 1, entries 4 and 5, respectively). The experiment proved the preservation of chain-end fidelity of the Rif-(PtBA-Br)3 macroinitiator and affirmed the validity of theoretical DCF value calculations (DCFtheo < 1%).
The characteristic element of seATRP equipment is aluminum as a counter electrode, which simplifies the electrochemical cell by direct immersion of the electrode into the reaction mixture, it is simple to prepare and scale, cost-effective and energy-efficient (minimizes the ohmic drop) process [54]. Despite the negative standard potential value (E0 = 1.66 V vs. SHE in water) of aluminum [71] and the potential for reduction of CuII to CuI, it does not participate in the redox processes of the catalyst due to a passivation process (covering by stable oxidized layers). As CE is directly immersed in a reaction medium, both reaction mixture and final polymer contain an insignificant amount of aluminum (Supplementary Table S2). The content of aluminum in the reaction mixture is 48.9–128.0 ppm, increasing with the higher value of Q, while the final polymer samples are contaminated with 11.7–48.9 ppm of the aluminum, due to the purification procedures (through a neutral alumina column and precipitation into methanol/water solution).
The structure of formed acrylates-based polymers was confirmed by 1H NMR analysis (Supplementary Figures S13–S15). 1H NMR spectrum, shown in Figure S13 proved the polymerization of nBA from the rifampicin-based macromolecule by preparative electrolysis under potentiostatic conditions (Table 1, entry 3). The chemical shifts characteristic for PnBA chains were assigned: δ (ppm) = 0.88–1.00 (3H, CH3–, d), 1.30–1.98 (6H, –CH2–CH2–, –CH2–, b, d and β, respectively), 2.19–2.47 (1H, –CH–, α) and 3.85–4.21 (2H, –OCH2–, a) [72]. Meanwhile, Supplementary Figure S14 and S15 show the 1H NMR spectrum for rifampicin-based polymers with PtBA side chains (Table 1, entry 4). The chemical shifts for tBA units were assigned: δ (ppm) = 1.35–1.95 (11H, CH3–, –CH2–, a + β, respectively) and 2.10–2.38 (1H, –CH–, α) [73]. The identified chemical shifts attributed to the characteristic groups of the nBA and tBA units indicate the presence of polymer chains.
Rifampicin-based macromolecules with PtBA side chains were subjected to acid solvolysis to detached the homopolymer chains (Supplementary Table S4, Figure S16), and therefore the apparent molecular weights of cleaved chains and initiation efficiency (ƒi) were determined. PtBA arms were characterized by low molecular weight and narrow molecular weight distribution (Mw/Mn = 1.20 for PtBA, and Mw/Mn = 1.42 for PtBA-b-PtBA polymer chains), however the low initiation efficiency was received (ƒi = 42–53%), suggesting disruption of the deactivation process followed by the loss of control as the reaction proceeded.
3.3. Preparation of pH-Responsive Rifampicin-Based “Smart” Materials
Stimuli-responsive polymer materials with rifampicin core and poly(acrylic acid) side chains were received by selective hydrolysis of the PtBA block (final samples synthesized according to Table 1, entries 4 and 5). The successfully received PAA structures were confirmed by 1H NMR analysis, comparing the spectra before and after hydrolysis (Supplementary Figures S14 and S15–PtBA side chains, and Figures S17 and S18–PAA side chains, respectively). After modification, the disappearance of the characteristic strong peak for methyl groups protons of tBA units at ~1.44 ppm is visible. Therefore, the chemical shift at ~12.00 ppm attributed to hydroxyl groups of prepared AA moieties occurs [74], proving the successfully conducted hydrolysis of PtBA polymer chains.
FT-IR analysis additionally confirmed the presence of acidic groups in the samples after hydrolysis. In Supplementary Figures S19a and S20a, the characteristic bands for PtBA are clearly visible. Stretching C–H vibrations from the ubiquitous –CH3 groups in polyacrylates give a significant band in the 2950–3050 cm−1 region. Stretching C=O and C–O–C vibrations in ester groups give the bands in 1700–1800 cm−1 and 1050–1200 cm−1, respectively. Typical absorption bands for PtBA is also located within 1380–1450 cm−1 region, corresponding to C–H bending vibrations from –CH3 groups of tBA. After the transformation of tBA moieties into AA groups, significant differences in the 3000–3700 cm−1 region is visible (Supplementary Figures S19b and S20b). A strong absorption between 2500 and 3600 cm−1 of carboxyl groups appeared. Additionally, the bands located in 1050–1200 cm−1 characteristic for stretching C–O–C vibrations in ester groups diapered.
The hydrophilicity, and thus an additional confirmation of tBA to AA unit hydrolysis, was provided by contact angles for polar (water) and non-polar (diiodomethane) liquid measurements. The results were subsequently applied for calculation of free surface energy values according to the Owens–Wendt method, considering the disruption of intermolecular bonds of a prepared surface (Supplementary Figure S21, Table S5) [31,75,76]. Considering initial studies covering contact angles examination, the decrease of θ for water as a polar liquid is observed, indicating PAA-based coatings as more hydrophilic. Hydrolysis of hydrophobic PtBA segments results in a significant increase in both dispersive and polar part values, and consequently, the total FSE parameter was higher for PAA-based coating materials. This phenomenon is strongly connected with ubiquitous hydroxyl groups of AA units. The results clearly indicate the hydrophilic properties of smart materials composed of AA moieties.
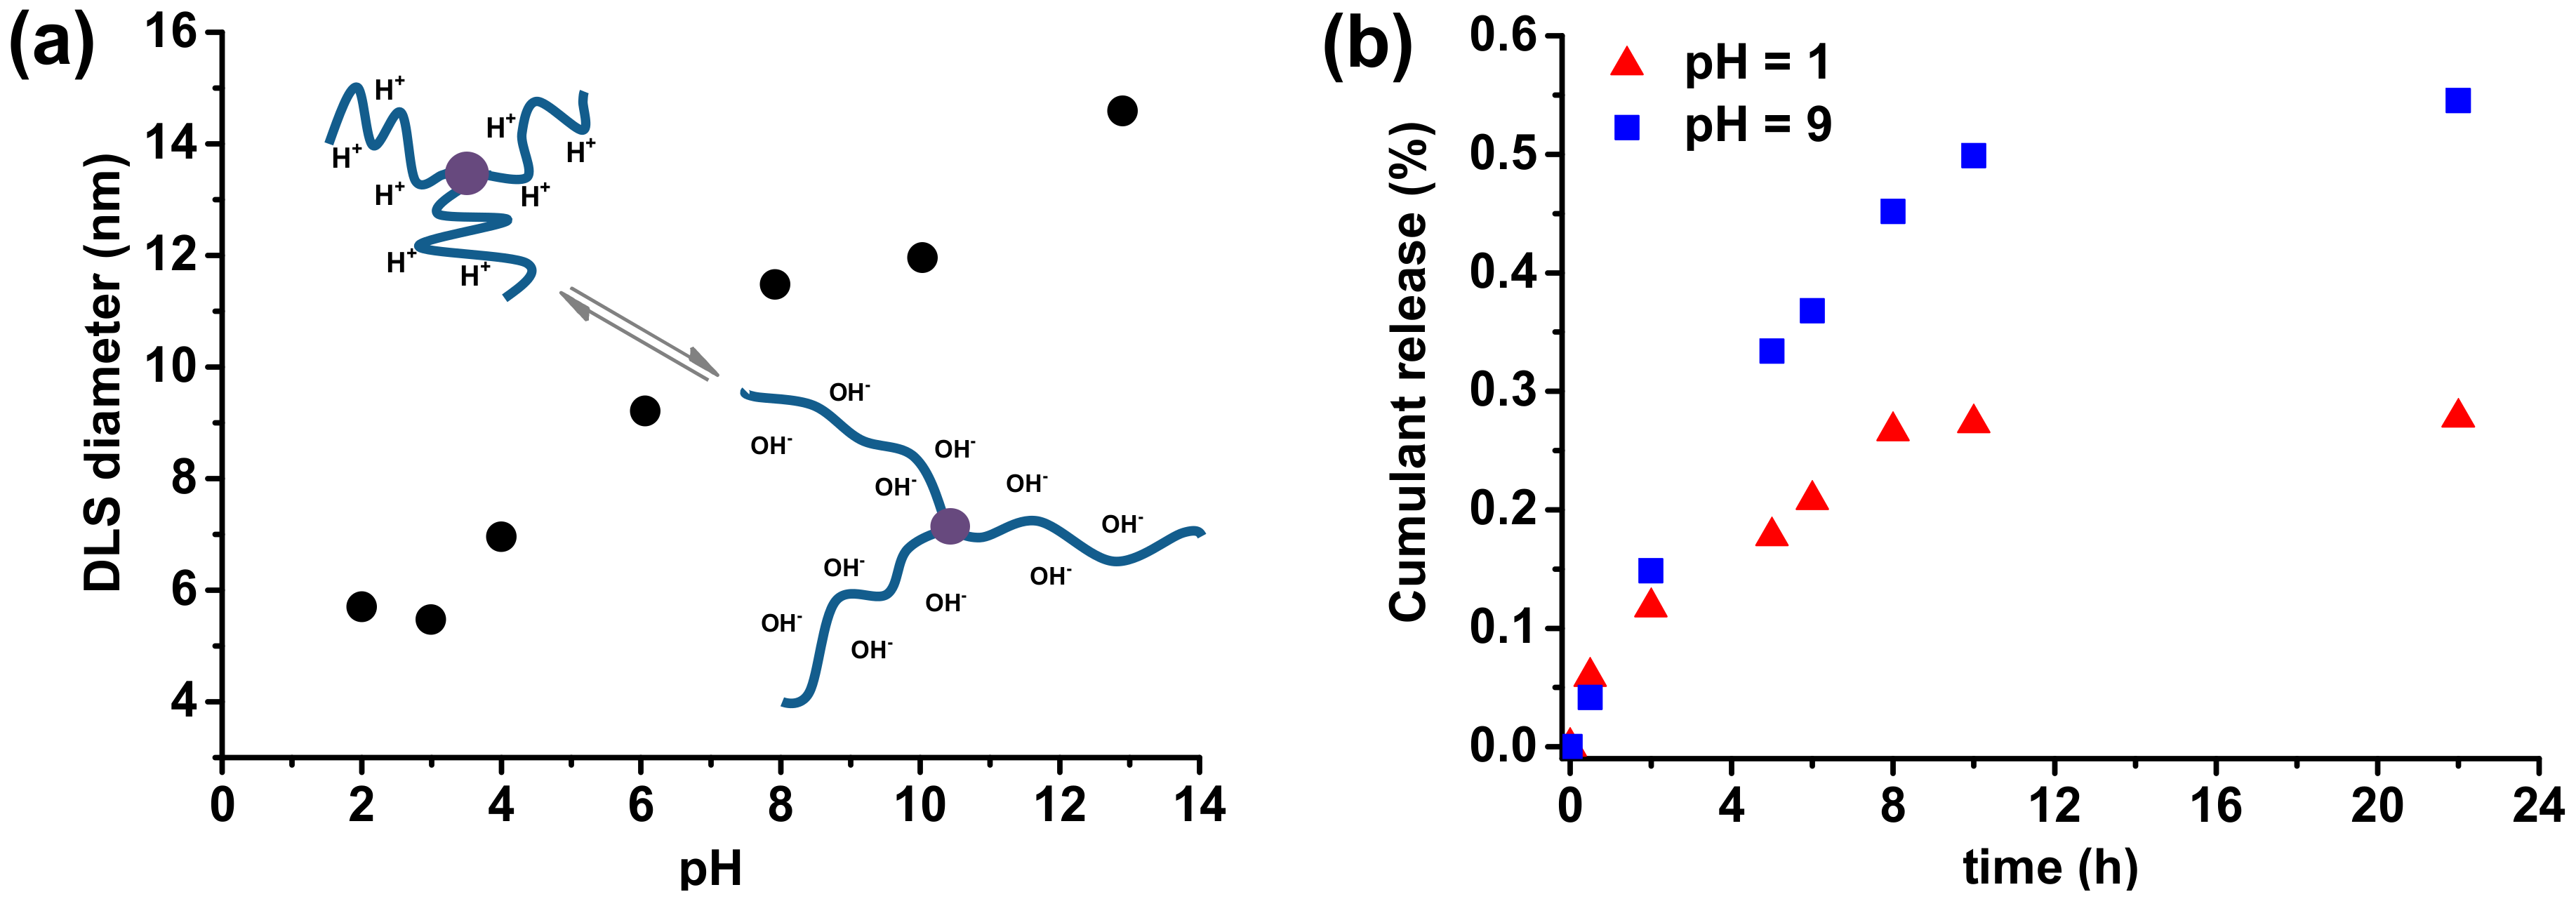
Poly(acrylic acid) is a weak polyelectrolyte with a substantial portion of the negatively charged units at basic conditions when the carboxylic group loses a proton. Dynamic light scattering was performed to analyze the pH-responsiveness of the rifampicin-based macromolecules with PAA side chains, by determination of the hydrodynamic diameter at different degrees of ionization, adjusted by variation in pH value (Supplementary Figure S22). The response of PAA side chains for pH changes is shown in Figure 6a (Supplementary Table S6). An initial rifampicin-based polymer solution was prepared at strongly alkaline conditions (pH = 12.9), and then it was gradually decreased to pH = 2.
At highly alkaline pH values, when the solution contains high hydroxyl ions concentration, the acid segments of AA units are completely negatively charged. It results in the stretched side chains of rifampicin-based polymers, which shows a maximum in hydrodynamic diameter of 14.59 nm. With the decrease in pH value, the degree of ionization also decreased, causing the coiled conformation of PAA side chains, and hence a smaller DLS diameter is observed. Considering pH responsiveness of prepared rifampicin-based macromolecules with PAA side chains, they could be used as a carrier of active substances to achieve control release in different pH values. Quercetin, a flavonoid with many therapeutic activities, was encapsulated into the rifampicin-based micelles (loading efficiency, EL = 60%) in aqueous solution by a dialysis method, followed by a pH-dependent release process of QC from micelles was investigated by UV-vis spectrometry (Figure 6b). At highly acidic conditions (pH = 1), when PAA segments are coiled, and thus encapsulate the substances, the micelles showed relatively low release level, only reaching 28% of released QC after 22 hours. Meanwhile, in the buffer solution at pH 9, the release rate of QC rapidly increases and finally reached 55% of the QC released from the micelles.
4. Conclusions
Rifampicin was successfully modified to receive stimuli-responsive polymer materials, using a two-step synthetic route according to “grafting from” strategy. Initially, the supramolecular initiator was prepared by an esterification reaction of rifampicin and BriBBr, receiving ATRP macroinitiator with three bromide initiation sites, proved by 1H NMR analysis, FT-IR spectrum. Electrochemical characterization of rifampicin-based macroinitiator provided by a series of CV measurements proved the initiation characteristics of the prepared molecule and enabled the selection of an appropriate catalytic complex for polymerization, determining rate constants of the electrochemical catalytic process (kEC’) for each catalyst in the presence of the rifampicin-based initiator (kEC’ = (2.73 ± 0.47) × 102 M−1 s−1, kEC’ = (5.65 ± 0.97) × 103 M−1 s−1, and kEC’ = (1.82 ± 0.20) × 104 M−1 s−1, for CuIIBr2/PMDETA, CuIIBr2/TPMA and CuIIBr2/TPMA*2, respectively). Preparative electrolysis under constant potential conditions and temporally controlled galvanostatic conditions was performed to receive polymer materials with rifampicin core and acrylates side chains (PnBA and PtBA). Despite the lower activity of CuIIBr2/TPMA in comparison to CuIIBr2/TPMA*2, catalyst complex with unsubstituted pyridine provided a more controlled polymerization of rifampicin-based macromolecules (Mw/Mn = 1.29). Substituted with electron-donating groups pyridine ligand is too active for the preparation of architecture macromolecules presented in this paper, losing control during synthesis, resulting in coupling reactions, and thus in high dispersity. Stimuli-responsive polymer materials sensitive to pH changes were prepared by the transformation of tBA into AA moieties by acidic hydrolysis, proved by 1H NMR, FT-IR and contact angles, followed by free surface energy analysis of prepared coatings. The pH-mediated behavior of PAA-based macromolecules was investigated by dynamic light scattering (DLS), determining a hydrodynamic radius of polymers upon pH changes. The PAA side chains were stretched (maximum in hydrodynamic diameter) at highly alkaline pH values, thus potentially released a substance, and the coiled conformation of PAA side chains (significant decrease in hydrodynamic diameter) in the acidic conditions was observed, potentially encapsulation of the drug. The loading followed by the controlled release of quercetin as a model active substance in the rifampicin-based micelles proved the pH-dependent behavior of the prepared polymer material. Encapsulation of QC in a buffer solution with highly acidic conditions and release in basic solution was observed.
Supplementary Materials
The following are available online at https://0-www-mdpi-com.brum.beds.ac.uk/1996-1944/13/17/3843/s1, Figure S1: 1H NMR of (a) rifampicin (CDCl3); (b) 1H NMR and (c) 13C NMR of Rif-Br3 supramolecular initiator (Mn = 1269.94, Ð = 1.19) after purification (CDCl3), Figure S2: GPC trace of Rif-Br3 macroinitiator; Figure S3: FT-IR characterization of (a) rifampicin and (b) Rif-Br3 macroinitiator, Figure S4: UV-vis spectrum of rifampicin and Rif-Br3 macroinitiator in THF, Figure S5: Cyclic voltammogram of 0.8 mM CuIIBr2/L in DMF containing 0.2 M TBAP in the absence (black line) and in the presence of 9.8 mM Rif-Br3 (red line) recorded at v = 0.1 V⋅s−1, where L (ligand) is (a) PMDETA, (b) TPMA and (c) TPMA*2 Figure S6: Cyclic voltammograms of 0.8 mM CuIIBr2/L in DMF recorded at a different scan rates (given next to the curves) in the presence of 9.8 mM Rif-Br3 (3 Br molecules) and 39.9 mM TEMPO; the current was normalized with respect to the peak current (ip0) recorded in the absence of Rif-Br3, where L (ligand) is (a) PMDETA, (c) TPMA and (e) TPMA*2; Foot-of-the-wave analysis of the catalytic peak to determine ka, the slope of the plots of i/ip0 vs. exp[-F(E − ECu(II)/Cu(I)0)/RT]: , where i—catalytic current, ip0—reversible one-electron reduction of the copper catalyst complex in the absence of Rif-Br3, CA0—initial Rif-(PnBA-Br)3 concentration, F—Faraday constant, R—gas constant, T = 298 K, is the half wave potential of the CuIIBr2/L, using (b) PMDETA, (d) TPMA and (e) TPMA*2 as a ligand, Figure S7: Synthetic route for the preparation of rifampicin-based macromolecules with acrylates (PnBA and PtBA) and poly(acrylic acid) (PAA) side chains, Figure S8: (a) Cyclic voltammogram of 0.44 mM CuIIBr2/TPMA*2 in 15% (v/v) nBA/DMF ([nBA]0 = 1.10 M) containing 0.2 M TBAP in the absence (black line) and in the presence of 1.35 mM Rif-Br3 (red line) recorded at v = 0.1 V⋅s−1, (b) current profile vs. time for the polymerization of nBA from Rif-Br3, (c) First-order kinetic plot of monomer conversion vs. time, (d) Mn and Mw/Mn vs. monomer conversion, (e) GPC traces of nBA polymerization and their evolution over reaction time, (f) DLS hydrodynamic size distributions by volumeof Rif-(PnBA-Br)3. Table 1, entry 1, Figure S9: (a) Cyclic voltammogram of 0.88 mM CuIIBr2/TPMA in 30% (v/v) nBA/DMF ([nBA]0 = 2.19 M) containing 0.2 M TBAP in the absence (black line) and in the presence of 2.71 mM Rif-Br3 (red line) recorded at v = 0.1 V⋅s−1, (b) current profile vs. time for the polymerization of nBA from Rif-Br3, (c) DLS hydrodynamic size distributions by volume of Rif-(PnBA-Br)3. Table 1, entry 2, Figure S10: (a) Current profile vs. time for the polymerization of nBA from Rif-Br3 under constant potential conditions and the determined current steps for constant current electrolysis (c) DLS hydrodynamic size distributions by volume of Rif-(PnBA-Br)3. Table 1, entry 3, Figure S11: (a) Cyclic voltammogram of 0.82 mM CuIIBr2/TPMA in 30% (v/v) tBA/DMF ([tBA]0 = 2.05 M) containing 0.2 M TBAP in the absence (black line) and in the presence of 6.74 mM Rif-Br3 (red line) recorded at v = 0.1 V⋅s−1, (b) current profile vs. time for the polymerization of tBA from Rif-Br3, (c) DLS hydrodynamic size distributions by volume of Rif-(PtBA-Br)3. Table 1, entry 4, Figure S12: (a) Cyclic voltammogram of 0.43 mM CuIIBr2/TPMA in 16% (v/v) tBA/DMF ([tBA]0 = 1.07 M) containing 0.2 M TBAP in the absence (black line) and in the presence of 1.95 mM Rif-(PtBA-Br)3 (red line) recorded at v = 0.1 V⋅s−1, (b) current profile vs. time for the polymerization of tBA from Rif-(PtBA-Br)3, (c) DLS hydrodynamic size distributions by volume of Rif-(PtBA-b-PtBA-Br)3. Table 1, entry 5, Figure S13: 1H NMR spectrum of Rif-(PnBA-Br)3 polymers (Mn = 56100, Ð = 1.59) after purification (in CDCl3). Table 1, entry 3, Figure S14: 1H NMR spectrum of Rif-(PtBA-Br)3 polymers (Mn = 30100, Ð = 1.71) after purification (in CDCl3). Table 1, entry 4, Figure S15: 1H NMR spectrum of Rif-(PtBA-b-PtBA-Br)3 polymers (Mn = 72100, Ð = 1.58) after purification (in CDCl3). Table 1, entry 5, Figure S16: GPC traces of (a) Rif-(PtBA-Br)3 (Table 1, entry 4) and the corresponding cleaved PtBA arms, and (b) Rif-(PtBA-b-PtBA-Br)3 (Table 1, entry 5) and the corresponding cleaved PtBA-b-PtBA arms, Figure S17: 1H NMR spectrum of Rif-(PAA-Br)3 polymers after purification (in DMSO-d6). Table 1, entry 4, Figure S18: 1H NMR spectrum of Rif-(PAA-b-PAA-Br)3 polymers after purification (in DMSO-d6). Table 1, entry 5; Figure S19: FT-IR characterization of (a) Rif-(PtBA-Br)3 (Table 1, entry 4) and (b) Rif-(PAA-Br)3, Figure S20: FT-IR characterization of (a) Rif-(PtBA-b-PtBA-Br)3 (Table 1, entry 5) and (b) Rif-(PAA b-PAA-Br)3, Figure S21: Water contact angle images of (a) Rif-(PtBA-Br)3 (Table 1, entry 4) and (b) corresponding Rif-(PAA-Br)3, and diiodomethane contact angle images of (c) Rif-(PtBA-Br)3 (Table 1, entry 4) and (d) corresponding Rif-(PAA-Br)3, Figure S22: DLS hydrodynamic size distributions by volume of Rif-(PtBA-b-PtBA-Br)3 in different pH, Table S1: Calculation of CuI/CuII ratio for the preparation of rifampicin-based macromolecules, Table S2: Theoretical Al3+ concentration in solution and polymer by monomer conversion, Table S3: Calculation of theoretical Dead Chain Fraction (DCFtheo) for polymerization of acrylates at low copper catalyst loading, Table S4: Results of the detaching of polymer arms from rifampicin-based macromolecules, Table S5: Experimental values of contact angles, parameters of free surface energy (FSE) as calculated by Owens-Wendt method for rifampicin-based polymer coatings, Table S6: Volume mean diameter of rifampicin-based macromolecules at varying pH.
Author Contributions
Conceptualization, P.C.; data curation, I.Z. and P.C.; formal analysis, P.C.; funding acquisition, P.C.; investigation, I.Z. and A.M.; methodology, P.C.; project administration, P.C.; resources, P.C.; supervision, P.C.; validation, I.Z., A.M., and P.C.; visualization, I.Z. and P.C.; writing—original draft, I.Z. and P.C.; writing—review & editing, I.Z. and P.C. All authors have read and agreed to the published version of the manuscript.
Funding
Financial support from UPB.CF.20.001.01 and BK/RDKN/2020/01 is gratefully acknowledged. P.C. acknowledges Minister of Science and Higher Education scholarship for outstanding young scientists (0001/E-363/STYP/13/2018). NMR spectra were recorded in the Laboratory of Spectrometry, Faculty of Chemistry, Rzeszow University of Technology and were financed from budget of statutory activities.
Conflicts of Interest
The authors declare no conflict of interest.
References
- Kost, J.; Langer, R. Responsive polymeric delivery systems. Adv. Drug Deliv. Rev. 2012, 64, 327–341. [Google Scholar] [CrossRef]
- Kamaly, N.; Yameen, B.; Wu, J.; Farokhzad, O.C. Degradable controlled-release polymers and polymeric nanoparticles: Mechanisms of controlling drug release. Chem. Rev. 2016, 116, 2602–2663. [Google Scholar] [CrossRef] [Green Version]
- Han, J.Y.; Zhao, D.D.; Li, D.; Wang, X.H.; Jin, Z.; Zhao, K. Polymer-based nanomaterials and applications for vaccines and drugs. Polymers 2018, 10, 31. [Google Scholar] [CrossRef] [PubMed] [Green Version]
- Aoki, K.; Saito, N. Biodegradable polymers as drug delivery systems for bone regeneration. Pharmaceutics 2020, 12, 20. [Google Scholar] [CrossRef] [Green Version]
- Xu, X.; Liu, Y.; Fu, W.; Yao, M.; Ding, Z.; Xuan, J.; Li, D.; Wang, S.; Xia, Y.; Cao, M. Poly (N-isopropylacrylamide)-based thermoresponsive composite hydrogels for biomedical applications. Polymers 2020, 12, 580. [Google Scholar] [CrossRef] [Green Version]
- Jerca, F.A.; Jerca, V.V.; Anghelache, A.M.; Vuluga, D.M.; Hoogenboom, R. Poly(2-isopropenyl-2-oxazoline) as a versatile platform towards thermoresponsive copolymers. Polym. Chem. 2018, 9, 3473–3478. [Google Scholar] [CrossRef]
- Swift, T.; Swanson, L.; Geoghegan, M.; Rimmer, S. The pH-responsive behaviour of poly(acrylic acid) in aqueous solution is dependent on molar mass. Soft Matter 2016, 12, 2542–2549. [Google Scholar] [CrossRef] [Green Version]
- Zhou, H.; Wang, X.; Tang, J.; Yang, Y.W. Surface immobilization of pH-responsive polymer brushes on mesoporous silica nanoparticles by enzyme mimetic catalytic ATRP for controlled cargo release. Polymers 2016, 8, 11. [Google Scholar] [CrossRef] [Green Version]
- Lale, S.V.; Aswathy, R.G.; Aravind, A.; Kumar, D.S.; Koul, V. AS1411 aptamer and folic acid functionalized pH-responsive ATRP fabricated pPEGMA–PCL–pPEGMA polymeric nanoparticles for targeted drug delivery in cancer therapy. Biomacromolecules 2014, 15, 1737–1752. [Google Scholar] [CrossRef]
- Huo, M.; Yuan, J.; Tao, L.; Wei, Y. Redox-responsive polymers for drug delivery: From molecular design to applications. Polym. Chem. 2014, 5, 1519–1528. [Google Scholar] [CrossRef]
- Hu, W.Y.; Wu, Z.M.; Yang, Q.Q.; Liu, Y.J.; Li, J.; Zhang, C.Y. Smart pH-responsive polymeric micelles for programmed oral delivery of insulin. Colloids Surf. B 2019, 183, 110443. [Google Scholar] [CrossRef] [PubMed]
- Nassar, A.-E.F.; Kamel, A.M.; Clarimont, C. Improving the decision-making process in the structural modification of drug candidates: Enhancing metabolic stability. Drug Discov. Today 2004, 9, 1020–1028. [Google Scholar] [CrossRef]
- Capita, R.; Alonso-Calleja, C. Antibiotic-resistant bacteria: A challenge for the food industry. Crit. Rev. Food Sci. Nutr. 2013, 53, 11–48. [Google Scholar] [CrossRef] [PubMed]
- Campbell, E.A.; Korzheva, N.; Mustaev, A.; Murakami, K.; Nair, S.; Goldfarb, A.; Darst, S.A. Structural mechanism for rifampicin inhibition of bacterial RNA polymerase. Cell 2001, 104, 901–912. [Google Scholar] [CrossRef]
- Labuschagne, P.W.; Adami, R.; Liparoti, S.; Naidoo, S.; Swai, H.; Reverchon, E. Preparation of rifampicin/poly(D,L-lactice) nanoparticles for sustained release by supercritical assisted atomization technique. J. Supercrit. Fluids 2014, 95, 106–117. [Google Scholar] [CrossRef]
- Bury-Moné, S. Antibacterial therapeutic agents: Antibiotics and bacteriophages. In Reference Module in Biomedical Sciences; Elsevier: Amsterdam, The Netherlands, 2014. [Google Scholar]
- Chmielarz, P.; Yan, J.; Krys, P.; Wang, Y.; Wang, Z.; Bockstaller, M.R.; Matyjaszewski, K. Synthesis of nanoparticle copolymer brushes via surface-initiated seATRP. Macromolecules 2017, 50, 4151–4159. [Google Scholar] [CrossRef]
- Chmielarz, P.; Pacześniak, T.; Rydel-Ciszek, K.; Zaborniak, I.; Biedka, P.; Sobkowiak, A. Synthesis of naturally-derived macromolecules through simplified electrochemically mediated ATRP. Beilstein J. Org. Chem. 2017, 13, 2466–2472. [Google Scholar] [CrossRef] [Green Version]
- Chmielarz, P. Synthesis of cationic star polymers by simplified electrochemically mediated ATRP. Express Polym. Lett. 2016, 10, 810–821. [Google Scholar] [CrossRef]
- Yin, X.; Wang, L.; Zhang, X.; Zhao, H.; Cui, Z.; Fu, P.; Liu, M.; Pang, X.; Qiao, X. Synthesis of amphiphilic star-shaped block copolymers through photo-induced metal free atom transfer radical polymerization. Eur. Polym. J. 2020, 126, 109557. [Google Scholar] [CrossRef]
- Matyjaszewski, K. Atom transfer radical polymerization: From mechanisms to applications. Isr. J. Chem. 2012, 52, 206–220. [Google Scholar] [CrossRef]
- Krys, P.; Matyjaszewski, K. Kinetics of atom transfer radical polymerization. Eur. Polym. J. 2017, 89, 482–523. [Google Scholar] [CrossRef] [Green Version]
- Fang, C.; Fantin, M.; Pan, X.; de Fiebre, K.; Coote, M.L.; Matyjaszewski, K.; Liu, P. Mechanistically guided predictive models for ligand and initiator effects in copper-catalyzed atom transfer radical polymerization (Cu-ATRP). J. Am. Chem. Soc. 2019, 141, 7486–7497. [Google Scholar] [CrossRef] [PubMed]
- Matyjaszewski, K. Advanced materials by atom transfer radical polymerization. Adv. Mater. 2018, 30, 1706441. [Google Scholar] [CrossRef] [PubMed]
- Gonçalves, S.d.Á.; Vieira, R.P. Current status of ATRP-based materials for gene therapy. React. Funct. Polym. 2020, 147, 104453. [Google Scholar] [CrossRef]
- Chmielarz, P. Synthesis of pyridoxine-based eagle-shaped asymmetric star polymers through seATRP. Polym. Adv. Technol. 2017, 28, 1787–1793. [Google Scholar] [CrossRef]
- Zaborniak, I.; Chmielarz, P. Dually-functional riboflavin macromolecule as a supramolecular initiator and reducing agent in temporally-controlled low ppm ATRP. Express Polym. Lett. 2020, 14, 235–247. [Google Scholar] [CrossRef]
- Zhang, Y.; Chan, J.W.; Moretti, A.; Uhrich, K.E. Designing polymers with sugar-based advantages for bioactive delivery applications. J. Control Release 2015, 219, 355–368. [Google Scholar] [CrossRef] [Green Version]
- Zaborniak, I.; Surmacz, K.; Chmielarz, P. Synthesis of sugar-based macromolecules via sono-ATRP in miniemulsion. Polym. Adv. Technol. 2020, 31, 1972–1979. [Google Scholar] [CrossRef]
- Cuthbert, J.; Yerneni, S.S.; Sun, M.K.; Fu, T.; Matyjaszewski, K. Degradable polymer stars based on tannic acid cores by ATRP. Polymers 2019, 11, 752. [Google Scholar] [CrossRef] [Green Version]
- Zaborniak, I.; Chmielarz, P.; Flejszar, M.; Surmacz, K.; Ostatek, R. Preparation of hydrophobic tannins-inspired polymer materials via low-ppm ATRP methods. Polym. Adv. Technol. 2019, 19, 913–921. [Google Scholar] [CrossRef]
- Zaborniak, I.; Chmielarz, P. Miniemulsion switchable electrolysis under constant current conditions. Polym. Adv. Technol. 2020, 1–10. [Google Scholar] [CrossRef]
- Yin, Y.; Tian, X.; Jiang, X.; Wang, H.; Gao, W. Modification of cellulose nanocrystal via SI-ATRP of styrene and the mechanism of its reinforcement of polymethylmethacrylate. Carbohydr. Polym. 2016, 142, 206–212. [Google Scholar] [CrossRef] [PubMed]
- Cummings, C.S.; Fein, K.; Murata, H.; Ball, R.L.; Russell, A.J.; Whitehead, K.A. ATRP-grown protein-polymer conjugates containing phenylpiperazine selectively enhance transepithelial protein transport. J. Control Release 2017, 255, 270–278. [Google Scholar] [CrossRef] [PubMed]
- Zaborniak, I.; Chmielarz, P.; Matyjaszewski, K. Modification of wood-based materials by atom transfer radical polymerization methods. Eur. Polym. J. 2019, 120, 109253. [Google Scholar] [CrossRef]
- Chmielarz, P.; Fantin, M.; Park, S.; Isse, A.A.; Gennaro, A.; Magenau, A.J.D.; Sobkowiak, A.; Matyjaszewski, K. Electrochemically mediated atom transfer radical polymerization (eATRP). Prog. Polym. Sci. 2017, 69, 47–78. [Google Scholar] [CrossRef]
- Lorandi, F.; Fantin, M.; Isse, A.A.; Gennaro, A. Electrochemical triggering and control of atom transfer radical polymerization. Curr. Opin. Electrochem. 2018, 8, 1–7. [Google Scholar] [CrossRef]
- Chmielarz, P. Synthesis of α-D-glucose-based star polymers through simplified electrochemically mediated ATRP. Polymer 2016, 102, 192–198. [Google Scholar] [CrossRef]
- Mohapatra, H.; Kleiman, M.; Esser-Kahn, A.P. Mechanically controlled radical polymerization initiated by ultrasound. Nat. Chem. 2016, 9, 135–139. [Google Scholar] [CrossRef]
- Qu, S.W.; Wang, K.; Khan, H.; Xiong, W.F.; Zhang, W.Q. Synthesis of block copolymer nano-assemblies via ICAR ATRP and RAFT dispersion polymerization: How ATRP and RAFT lead to differences. Polym. Chem. 2019, 10, 1150–1157. [Google Scholar] [CrossRef]
- Zaborniak, I.; Chmielarz, P. Ultrasound-mediated atom transfer radical polymerization (ATRP). Materials 2019, 12, 3600. [Google Scholar] [CrossRef] [Green Version]
- Treat, N.J.; Sprafke, H.; Kramer, J.W.; Clark, P.G.; Barton, B.E.; Read de Alaniz, J.; Fors, B.P.; Hawker, C.J. Metal-free atom transfer radical polymerization. J. Am. Chem. Soc. 2014, 136, 16096–16101. [Google Scholar] [CrossRef] [PubMed] [Green Version]
- Perkowski, A.J.; You, W.; Nicewicz, D.A. Visible light photoinitiated metal-free living cationic polymerization of 4-methoxystyrene. J. Am. Chem. Soc. 2015, 137, 7580–7583. [Google Scholar] [CrossRef] [PubMed]
- Discekici, E.H.; Anastasaki, A.; Read de Alaniz, J.; Hawker, C.J. Evolution and future directions of metal-free atom transfer radical polymerization. Macromolecules 2018, 51, 7421–7434. [Google Scholar] [CrossRef] [Green Version]
- Hong, B.M.; Park, S.A.; Park, W.H. Effect of photoinitiator on chain degradation of hyaluronic acid. Biomater. Res. 2019, 23, 21. [Google Scholar] [CrossRef] [PubMed] [Green Version]
- Ding, M.; Jiang, X.; Zhang, L.; Cheng, Z.; Zhu, X. Recent progress on transition metal catalyst separation and recycling in ATRP. Macromol. Rapid. Commun. 2015, 36, 1702–1721. [Google Scholar] [CrossRef]
- Kütahya, C.; Schmitz, C.; Strehmel, V.; Yagci, Y.; Strehmel, B. Near-infrared sensitized photoinduced atom-transfer radical polymerization (ATRP) with a copper(II) catalyst concentration in the ppm range. Angew. Chem. Int. Ed. 2018, 57, 7898–7902. [Google Scholar] [CrossRef]
- Trevisanello, E.; De Bon, F.; Daniel, G.; Lorandi, F.; Durante, C.; Isse, A.A.; Gennaro, A. Electrochemically mediated atom transfer radical polymerization of acrylonitrile and poly(acrylonitrile-b-butyl acrylate) copolymer as a precursor for N-doped mesoporous carbons. Electrochim. Acta 2018, 285, 344–354. [Google Scholar] [CrossRef]
- Wang, J.; Tian, M.; Li, S.; Wang, R.; Du, F.; Xue, Z. Ligand-free iron-based electrochemically mediated atom transfer radical polymerization of methyl methacrylate. Polym. Chem. 2018, 9, 4386–4394. [Google Scholar] [CrossRef]
- Michieletto, A.; Lorandi, F.; De Bon, F.; Isse, A.A.; Gennaro, A. Biocompatible polymers via aqueous electrochemically mediated atom transfer radical polymerization. J. Polym. Sci. 2020, 58, 114–123. [Google Scholar] [CrossRef]
- De Bon, F.; Isse, A.A.; Gennaro, A. Electrochemically mediated atom transfer radical polymerization of methyl methacrylate: The importance of catalytic halogen exchange. ChemElectroChem 2019, 6, 4257–4265. [Google Scholar] [CrossRef]
- De Bon, F.; Isse, A.A.; Gennaro, A. Towards scale-up of electrochemically-mediated atom transfer radical polymerization: Use of a stainless-steel reactor as both cathode and reaction vessel. Electrochim. Acta 2019, 304, 505–512. [Google Scholar] [CrossRef]
- Sun, Y.; Feng, X.W.; Hu, J.; Bo, S.; Zhang, J.M.; Wang, W.; Li, S.Y.; Yang, Y.F. Preparation of hemoglobin (Hb)-imprinted poly(ionic liquid)s via Hb-catalyzed eATRP on gold nanodendrites. Anal. Bioanal. Chem. 2020, 412, 983–991. [Google Scholar] [CrossRef] [PubMed]
- Park, S.; Chmielarz, P.; Gennaro, A.; Matyjaszewski, K. Simplified electrochemically mediated atom transfer radical polymerization using a sacrificial anode. Angew. Chem. Int. Ed. 2015, 54, 2388–2392. [Google Scholar] [CrossRef] [PubMed]
- Fantin, M.; Lorandi, F.; Isse, A.A.; Gennaro, A. Sustainable electrochemically-mediated atom transfer radical polymerization with inexpensive non-platinum electrodes. Macromol. Rapid. Commun. 2016, 37, 1318–1322. [Google Scholar] [CrossRef] [PubMed]
- De Bon, F.; Fantin, M.; Isse, A.A.; Gennaro, A. Electrochemically mediated ATRP in ionic liquids: Controlled polymerization of methyl acrylate in [BMIm][OTf]. Polym. Chem. 2018, 9, 646–655. [Google Scholar] [CrossRef]
- Xia, J.H.; Matyjaszewski, K. Controlled/“living” radical polymerization. Atom transfer radical polymerization catalyzed by copper(I) and picolylamine complexes. Macromolecules 1999, 32, 2434–2437. [Google Scholar] [CrossRef]
- Kaur, A.; Ribelli, T.G.; Schröder, K.; Matyjaszewski, K.; Pintauer, T. Properties and ATRP activity of copper complexes with substituted tris(2-pyridylmethyl)amine-based ligands. Inorg. Chem. 2015, 54, 1474–1486. [Google Scholar] [CrossRef]
- Wang, Y.; Lorandi, F.; Fantin, M.; Chmielarz, P.; Isse, A.A.; Gennaro, A.; Matyjaszewski, K. Miniemulsion ARGET ATRP via interfacial and ion-pair catalysis: From ppm to ppb of residual copper. Macromolecules 2017, 50, 8417–8425. [Google Scholar] [CrossRef]
- Zaborniak, I.; Chmielarz, P.; Wolski, K.; Grześ, G.; Isse, A.A.; Gennaro, A.; Zapotoczny, S.; Sobkowiak, A. Tannic acid-inspired star-like macromolecules via temporally controlled multi-step potential electrolysis. Macromol. Chem. Phys. 2019, 220, 1900073. [Google Scholar] [CrossRef]
- Wang, D.; Tan, J.; Kang, H.; Ma, L.; Jin, X.; Liu, R.; Huang, Y. Synthesis, self-assembly and drug release behaviors of pH-responsive copolymers ethyl cellulose-graft-PDEAEMA through ATRP. Carbohydr. Polym. 2011, 84, 195–202. [Google Scholar] [CrossRef]
- Taguchi, M.; Yamane, Y.; Aikawa, N.; Tsukamoto, G. SV 1H-and 13C-Nuclear Magnetic Resonance Spectra of Rifampicin and 3-[(Dimethylhydrazono) methyl] rifamycin SV. Chem. Pharm. Bull. 1988, 36, 4157–4161. [Google Scholar] [CrossRef] [PubMed] [Green Version]
- Chmielarz, P. Cellulose-based graft copolymers prepared by simplified electrochemically mediated ATRP. Express Polym. Lett. 2017, 11, 140–151. [Google Scholar] [CrossRef]
- Horn, M.; Matyjaszewski, K. Solvent Effects on the Activation rate constant in atom transfer radical polymerization. Macromolecules 2013, 46, 3350–3357. [Google Scholar] [CrossRef]
- Wang, J.; Han, J.; He, D.; Peng, H.; Xue, Z.; Xie, X. Active, effective, and “green” iron(III)/polar solvent catalysts for AGET ATRP of methyl methacrylate with various morphologies of elemental silver as a reducing agent. RSC Adv. 2016, 6, 88490–88497. [Google Scholar] [CrossRef]
- Costentin, C.; Robert, M.; Savéant, J.-M. Catalysis of the electrochemical reduction of carbon dioxide. Chem. Soc. Rev. 2013, 42, 2423–2436. [Google Scholar] [CrossRef]
- Costentin, C.; Savéant, J.-M. Multielectron, multistep molecular catalysis of electrochemical reactions: Benchmarking of homogeneous catalysts. ChemElectroChem 2014, 1, 1226–1236. [Google Scholar] [CrossRef]
- Magenau, A.J.D.; Bortolamei, N.; Frick, E.; Park, S.; Gennaro, A.; Matyjaszewski, K. Investigation of electrochemically mediated atom transfer radical polymerization. Macromolecules 2013, 46, 4346–4353. [Google Scholar] [CrossRef]
- Tang, W.; Matyjaszewski, K. Kinetic modeling of normal ATRP, normal ATRP with [CuII]0, reverse ATRP and SR&NI ATRP. Macromol. Theory Simul. 2008, 17, 359–375. [Google Scholar] [CrossRef]
- Mastan, E.; Zhu, S. A molecular weight distribution polydispersity equation for the ATRP system: Quantifying the effect of radical termination. Macromolecules 2015, 48, 6440–6449. [Google Scholar] [CrossRef]
- Vidal, J.; Villegas, L.; Peralta-Hernández, J.M.; Salazar González, R. Removal of Acid Black 194 dye from water by electrocoagulation with aluminum anode. J. Environ. Sci. Health A 2016, 51, 289–296. [Google Scholar] [CrossRef]
- Shanti, R.; Bella, F.; Salim, Y.S.; Chee, S.Y.; Ramesh, S.; Ramesh, K. Poly(methyl methacrylate-co-butyl acrylate-co-acrylic acid): Physico-chemical characterization and targeted dye sensitized solar cell application. Mater. Des. 2016, 108, 560–569. [Google Scholar] [CrossRef]
- Xie, Y.; Moreno, N.; Calo, V.M.; Cheng, H.; Hong, P.-Y.; Sougrat, R.; Behzad, A.R.; Tayouo, R.; Nunes, S.P. Synthesis of highly porous poly(tert-butyl acrylate)-b-polysulfone-b-poly(tert-butyl acrylate) asymmetric membranes. Polym. Chem. 2016, 7, 3076–3089. [Google Scholar] [CrossRef] [Green Version]
- Das, D.; Ghosh, P.; Dhara, S.; Panda, A.B.; Pal, S. Dextrin and poly(acrylic acid)-based biodegradable, non-cytotoxic, chemically cross-linked hydrogel for sustained release of ornidazole and ciprofloxacin. ACS Appl. Mater. Interfaces 2015, 7, 4791–4803. [Google Scholar] [CrossRef] [PubMed]
- Ozcan, C.; Hasirci, N. Evaluation of surface free energy for PMMA films. J. Appl. Polym. Sci. 2008, 108, 438–446. [Google Scholar] [CrossRef]
- Król, P.; Chmielarz, P. Synthesis of polystyrene-b-polyurethane-b-polystyrene copolymers through ARGET ATRP polymerization method. Part II. Chemical structure, thermal and surface properties. Polimery 2015, 60, 377–384. [Google Scholar] [CrossRef]
Figure 1.
Synthetic route for the preparation of rifampicin-based ATRP macroinitiator (Mn = 1269.94, Ð = 1.19).
Figure 1.
Synthetic route for the preparation of rifampicin-based ATRP macroinitiator (Mn = 1269.94, Ð = 1.19).

Figure 2.
(a) First-order kinetic plot of monomer conversion vs. polymerization time for constant potential electrolysis in the preparation of Rif-(PnBA-Br)3 macromolecules, (b) Mn and Mw/Mn vs. monomer conversion and (c) GPC traces of nBA polymerization and their evolution over reaction time. Table 1, entry 2.

Figure 3.
(a) First-order kinetic plot of monomer conversion vs. polymerization time for temporally control constant current electrolysis in the preparation of Rif-(PnBA-Br)3 macromolecules, (b) Mn and Mw/Mn vs. monomer conversion and (c) GPC traces of nBA polymerization and their evolution over reaction time. Table 1, entry 3.

Figure 4.
(a) First-order kinetic plot of monomer conversion vs. polymerization time for constant potential electrolysis in the preparation of Rif-(PtBA-Br)3 macromolecules, (b) Mn and Mw/Mn vs. monomer conversion and (c) GPC traces of tBA polymerization and their evolution over reaction time. Table 1, entry 4.

Figure 5.
(a) First-order kinetic plot of monomer conversion vs. polymerization time for constant potential electrolysis in the preparation of Rif-(PtBA-b-PtBA-Br)3 macromolecules, (b) Mn and Mw/Mn vs. monomer conversion and (c) GPC traces of tBA polymerization and their evolution over reaction time. Table 1, entry 5.

Figure 6.
(a) DLS diameters of rifampicin-based macromolecules with PAA side chains (Table 1, entry 5 after acidic hydrolysis) at varying pH with a schematic representation of possible polymers configurations, (b) Quercetin release profile from rifampicin-based micelles in different pH buffer solutions at 37 °C.


Table 1.
Polymerization of acrylates from rifampicin-based ATRP macroinitiator via seATRP a.
| Entry | [Monomer]0/[Initiator]0/[CuL] | Ligand | Monomer | Initiator | [CuL] | Conv b (%) | kpapp b (h−1) | DPn,theo b (per arm) | Mn,theoc (×10−3) | Mn,appd (×10−3) | Mw/Mnd | dvolumee (nm) |
|---|---|---|---|---|---|---|---|---|---|---|---|---|
| 1 | 270/1/0.11 | TPMA*2 | nBA | Rif-Br3 | 400 | 48 | 0.133 | 130 | 51.1 | 26.1 | 1.63 | 12 ± 1 |
| 2 | 270/1/0.11 | TPMA | nBA | Rif-Br3 | 400 | 51 | 0.109 | 137 | 54.1 | 36.4 | 1.29 | 16 ± 1 |
| 3 f | 270/1/0.11 | TPMA | nBA | Rif-Br3 | 400 | 53 | 0.095 g | 144 | 56.1 | 26.2 | 1.59 | 15 ± 2 |
| 4 | 101/1/0.04 | TPMA | tBA | Rif-Br3 | 400 | 76 | 0.137 | 77 | 30.1 | 17.6 | 1.71 | 9 ± 1 |
| 5 | 182/1/0.07 | TPMA | tBA | Rif-(PtBA-Br)3 from entry 4 | 400 | 59 | 0.097 | 107 | 72.1 | 25.6 | 1.58 | 14 ± 1 |
General reaction conditions: T = 50 °C; Vtot = 16 mL (except entry 1: Vtot = 25 mL and entry 5: Vtot = 14 mL); entry 1: [nBA]0 = 1.10 M, [Rif-Br3]0 = 1.35 mM calculated per 3 Br initiation sites, [CuIIBr2/TPMA*2]0 = 0.44 mM; entry 2 and 3: [nBA]0 = 2.19 M, [Rif-Br3]0 = 2.71 mM calculated per 3 Br initiation sites, [CuIIBr2/TPMA]0 = 0.88 mM; entry 4: [tBA]0 = 2.05 M, [Rif-Br3]0 = 6.74 mM calculated per 3 Br initiation sites, [CuIIBr2/TPMA]0 = 0.82 mM; entry 5: [tBA]0 = 1.07 M, [Rif-(PtBA-Br)3]0 = 1.95 mM calculated per 3 Br initiation sites, [CuIIBr2/TPMA]0 = 0.43 mM; Constant potential seATRP (WE = Pt, CE = Al, RE = SCE): entry 1, 2, 4 and 5; seATRP under temporally-controlled galvanostatic conditions (WE and CE without RE): entry 3; a Eapp were selected based on CV analysis of CuIIBr2/L catalytic complexes (Figures S8a, S9a, S11a and S12a in SI, respectively); b monomer conversion, apparent rate constant of propagation (kpapp) and apparent theoretical degree of polymerization of monomer unit per arm (DPn,theo) were determined by NMR, kpapp calculated as a slope of the curve ln[M]0/[M] = f(t) illustrated in the Figure 2a, Figure 3a, Figure 4a and Figure 5a, and Supplementary Figure S8c [27,30]; c Mn,th = ([monomer]0/[initiator]0) × conversion × Mmonomer + Minitiator; d apparent Mn and Mw/Mn were determined by GPC; e volume mean diameter (dvolume) of polymer products measured by DLS after purification (Supplementary Figures S8f, S9c, S10b, S11c, S12c); f Iapp = 1.22 mA, 0.75 mA, 0.39 mA and 0.14 mA for each step; g only for the “ON” stages.
© 2020 by the authors. Licensee MDPI, Basel, Switzerland. This article is an open access article distributed under the terms and conditions of the Creative Commons Attribution (CC BY) license (http://creativecommons.org/licenses/by/4.0/).
Share and Cite
MDPI and ACS Style
Zaborniak, I.; Macior, A.; Chmielarz, P. Stimuli-Responsive Rifampicin-Based Macromolecules. Materials 2020, 13, 3843. https://0-doi-org.brum.beds.ac.uk/10.3390/ma13173843
AMA Style
Zaborniak I, Macior A, Chmielarz P. Stimuli-Responsive Rifampicin-Based Macromolecules. Materials. 2020; 13(17):3843. https://0-doi-org.brum.beds.ac.uk/10.3390/ma13173843
Chicago/Turabian StyleZaborniak, Izabela, Angelika Macior, and Paweł Chmielarz. 2020. "Stimuli-Responsive Rifampicin-Based Macromolecules" Materials 13, no. 17: 3843. https://0-doi-org.brum.beds.ac.uk/10.3390/ma13173843
Note that from the first issue of 2016, this journal uses article numbers instead of page numbers. See further details here.