Figure 1.
Schematic representation of the change in the course of strain and temperature over time due to trapezoidal load for a material in the elastic state (blue lines) and in an elastic-plastic state (green lines) (on the basis of [
1]).
Figure 1.
Schematic representation of the change in the course of strain and temperature over time due to trapezoidal load for a material in the elastic state (blue lines) and in an elastic-plastic state (green lines) (on the basis of [
1]).
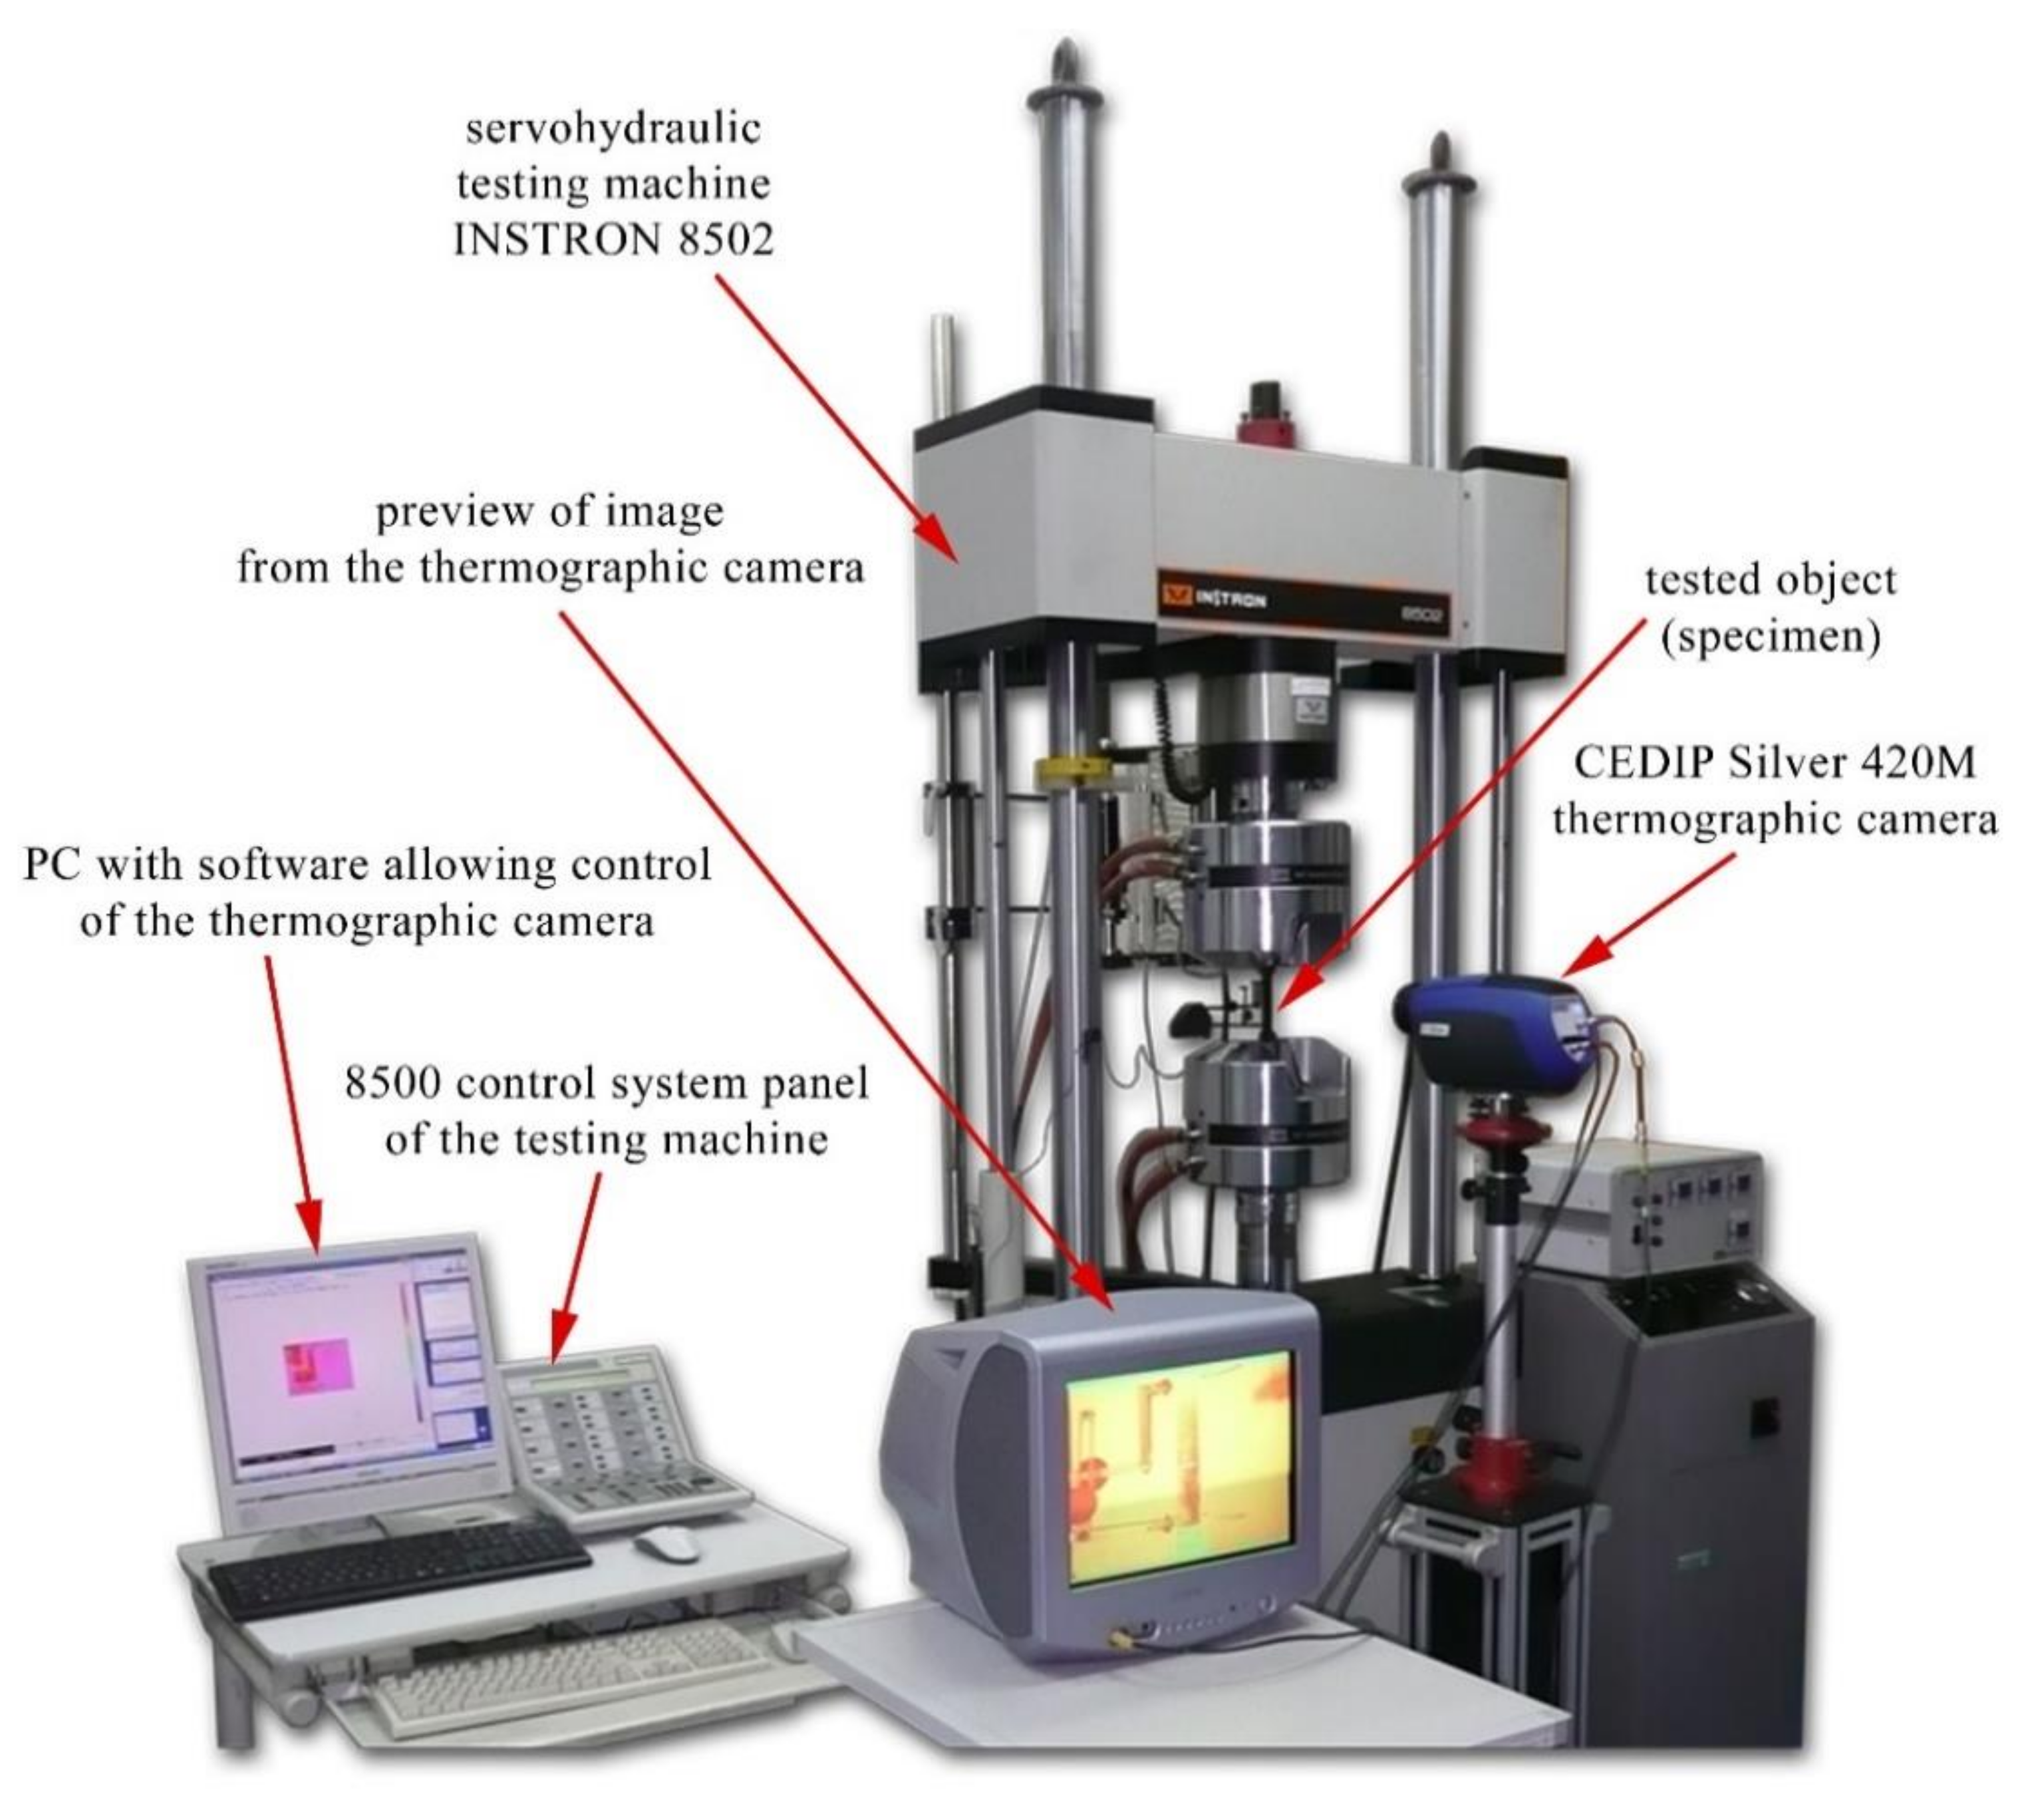
Figure 2.
Test station with the thermographic measurement system.
Figure 2.
Test station with the thermographic measurement system.
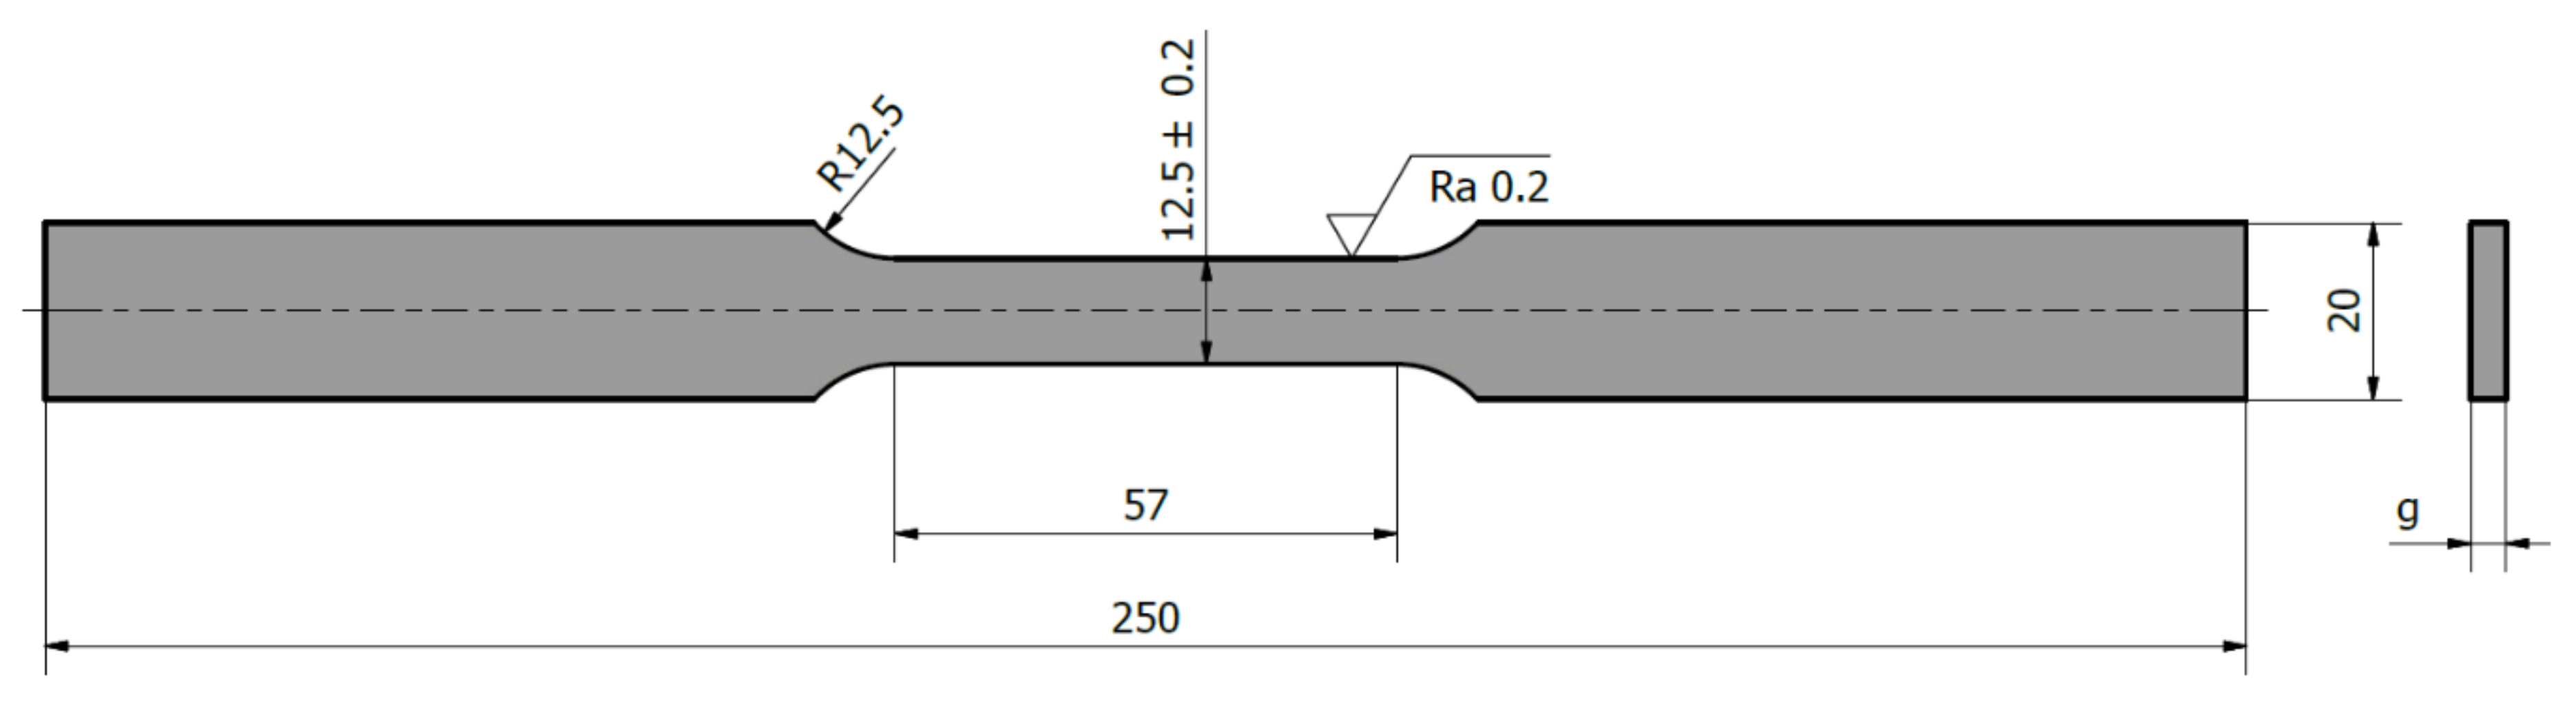
Figure 3.
The geometry of test specimens (g-specimen thickness depending on the sheet plate thickness).
Figure 3.
The geometry of test specimens (g-specimen thickness depending on the sheet plate thickness).
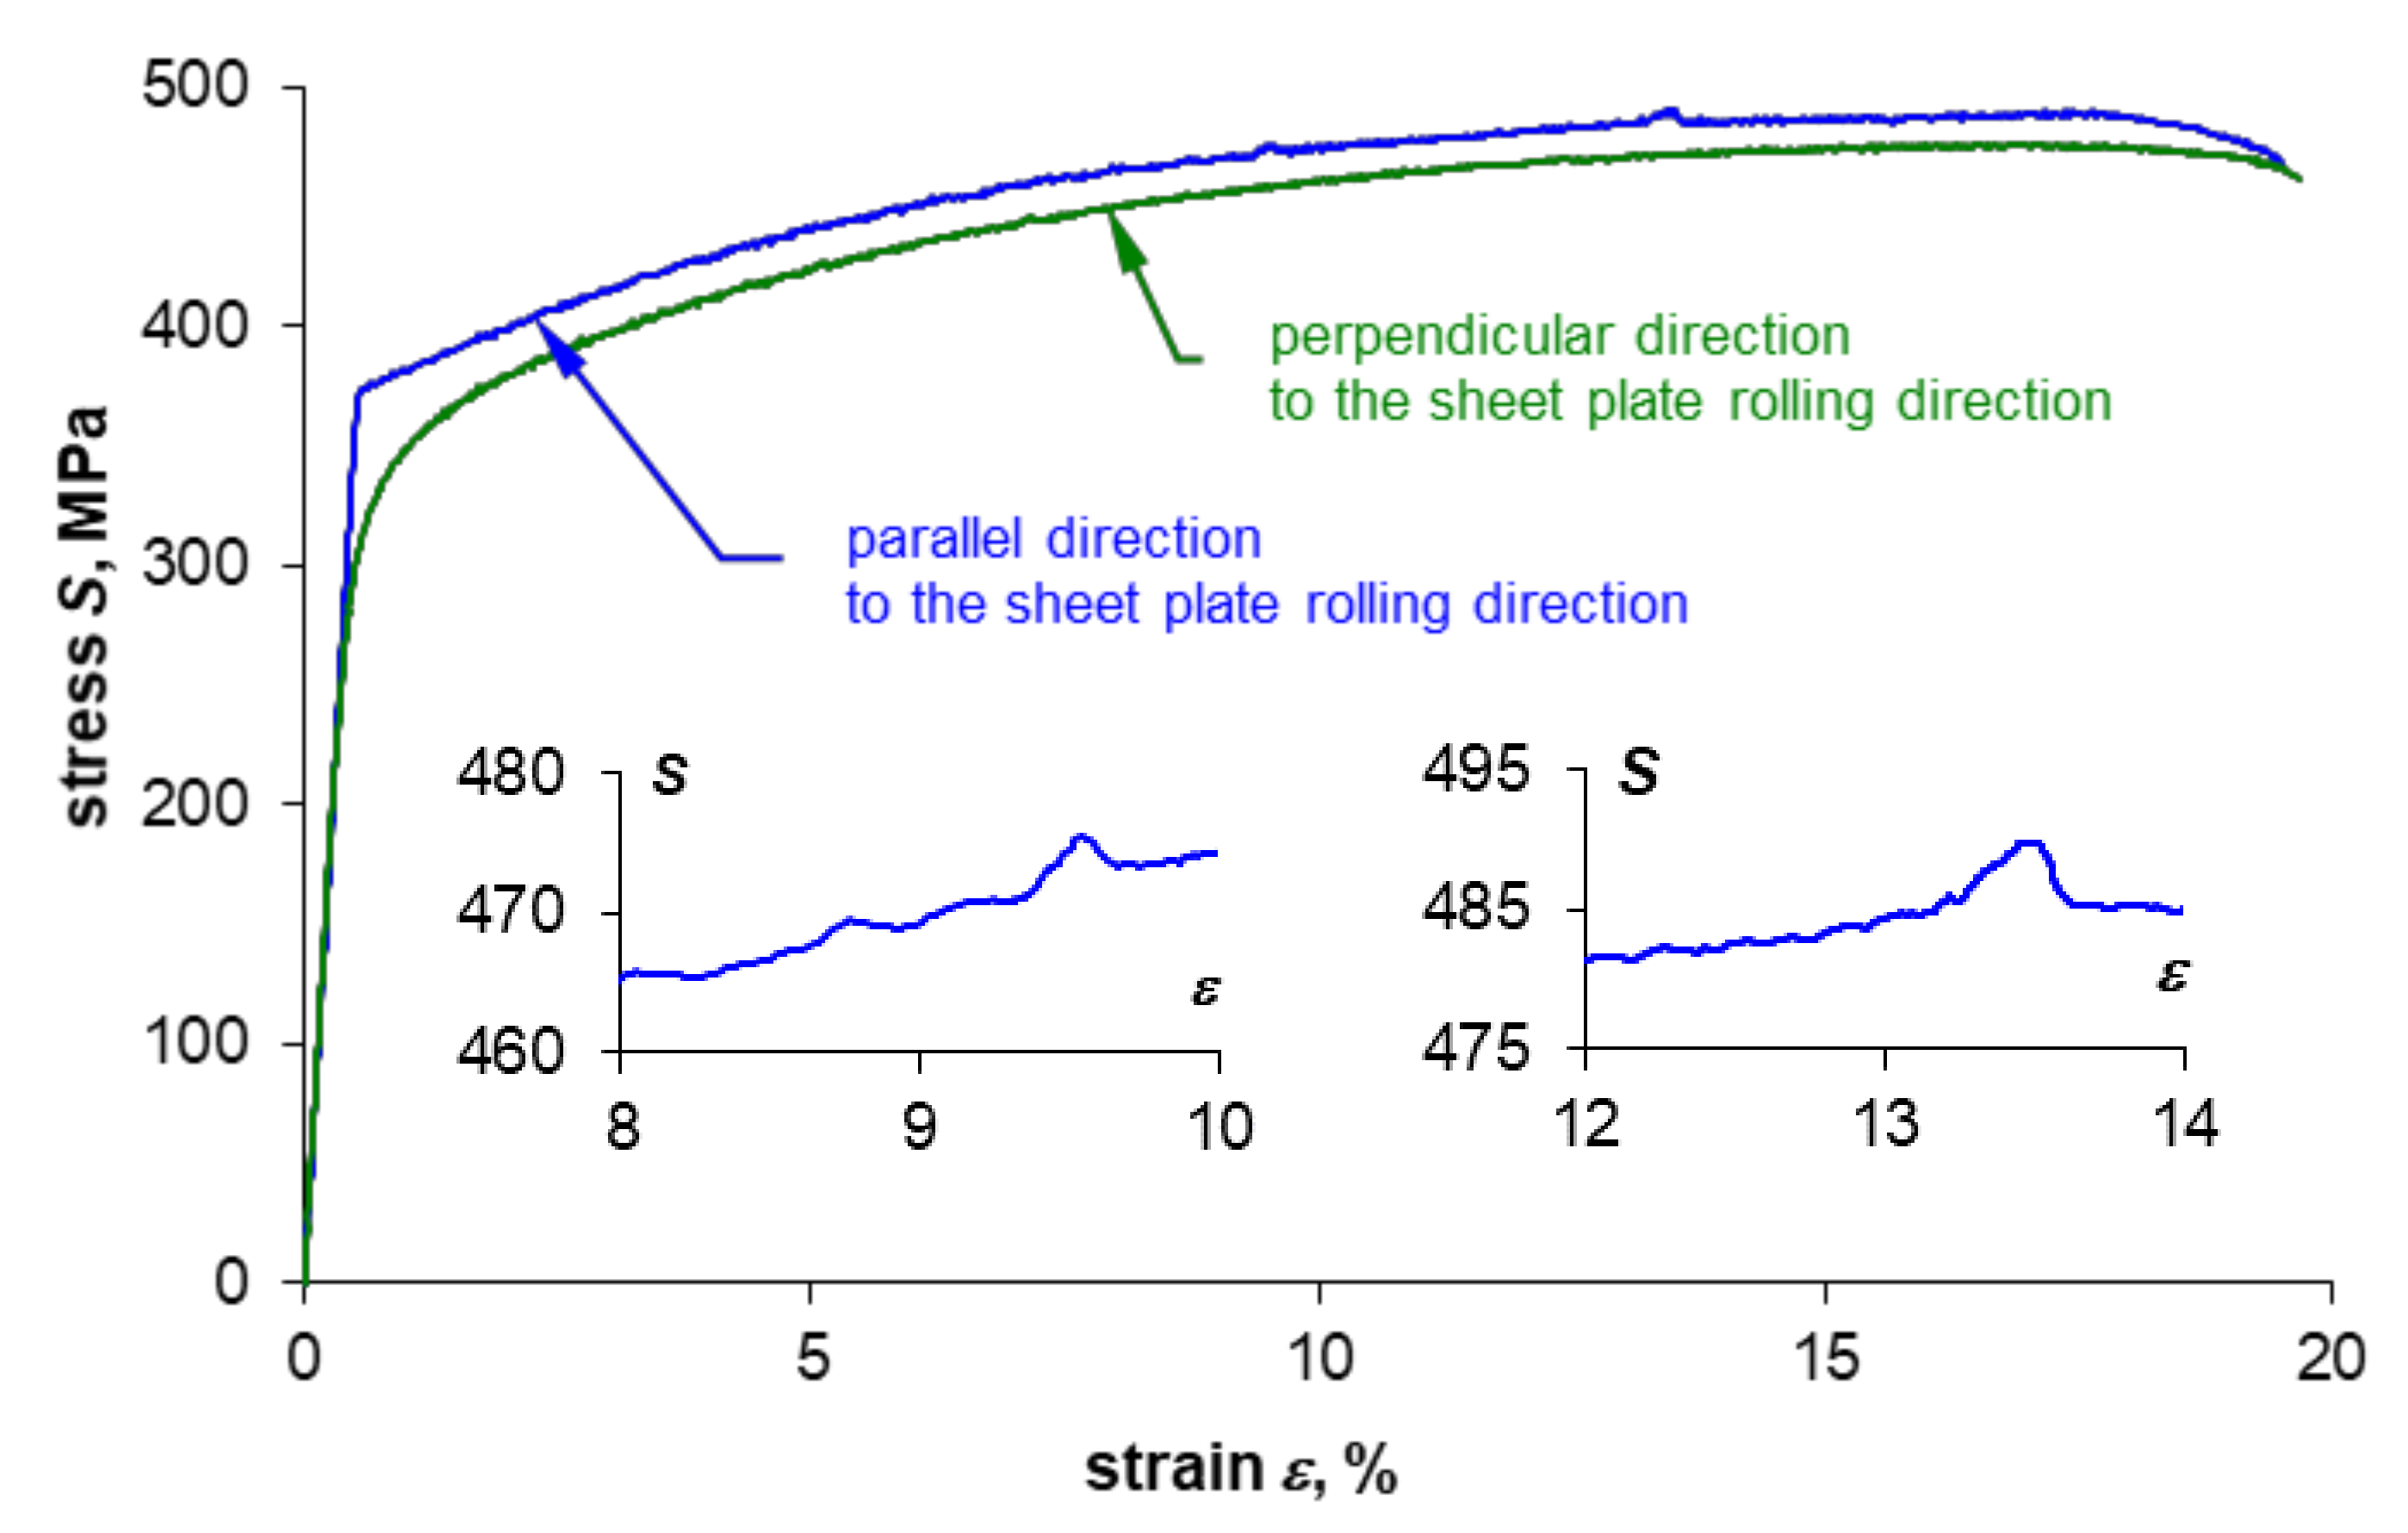
Figure 4.
Tensile test curves for specimens made of 2024-T3 aluminum alloy in the form of 0.16” thick sheet plate.
Figure 4.
Tensile test curves for specimens made of 2024-T3 aluminum alloy in the form of 0.16” thick sheet plate.
Figure 5.
Tensile test curves for specimens made of 2024-T3 aluminum alloy in the form of 0.05” thick sheet plate.
Figure 5.
Tensile test curves for specimens made of 2024-T3 aluminum alloy in the form of 0.05” thick sheet plate.
Figure 6.
Selected specimen surface temperature distributions (a–d) obtained during the monotonic tensile test of 0.05” thick 2024-T3 aluminum alloy sheet plate.
Figure 6.
Selected specimen surface temperature distributions (a–d) obtained during the monotonic tensile test of 0.05” thick 2024-T3 aluminum alloy sheet plate.
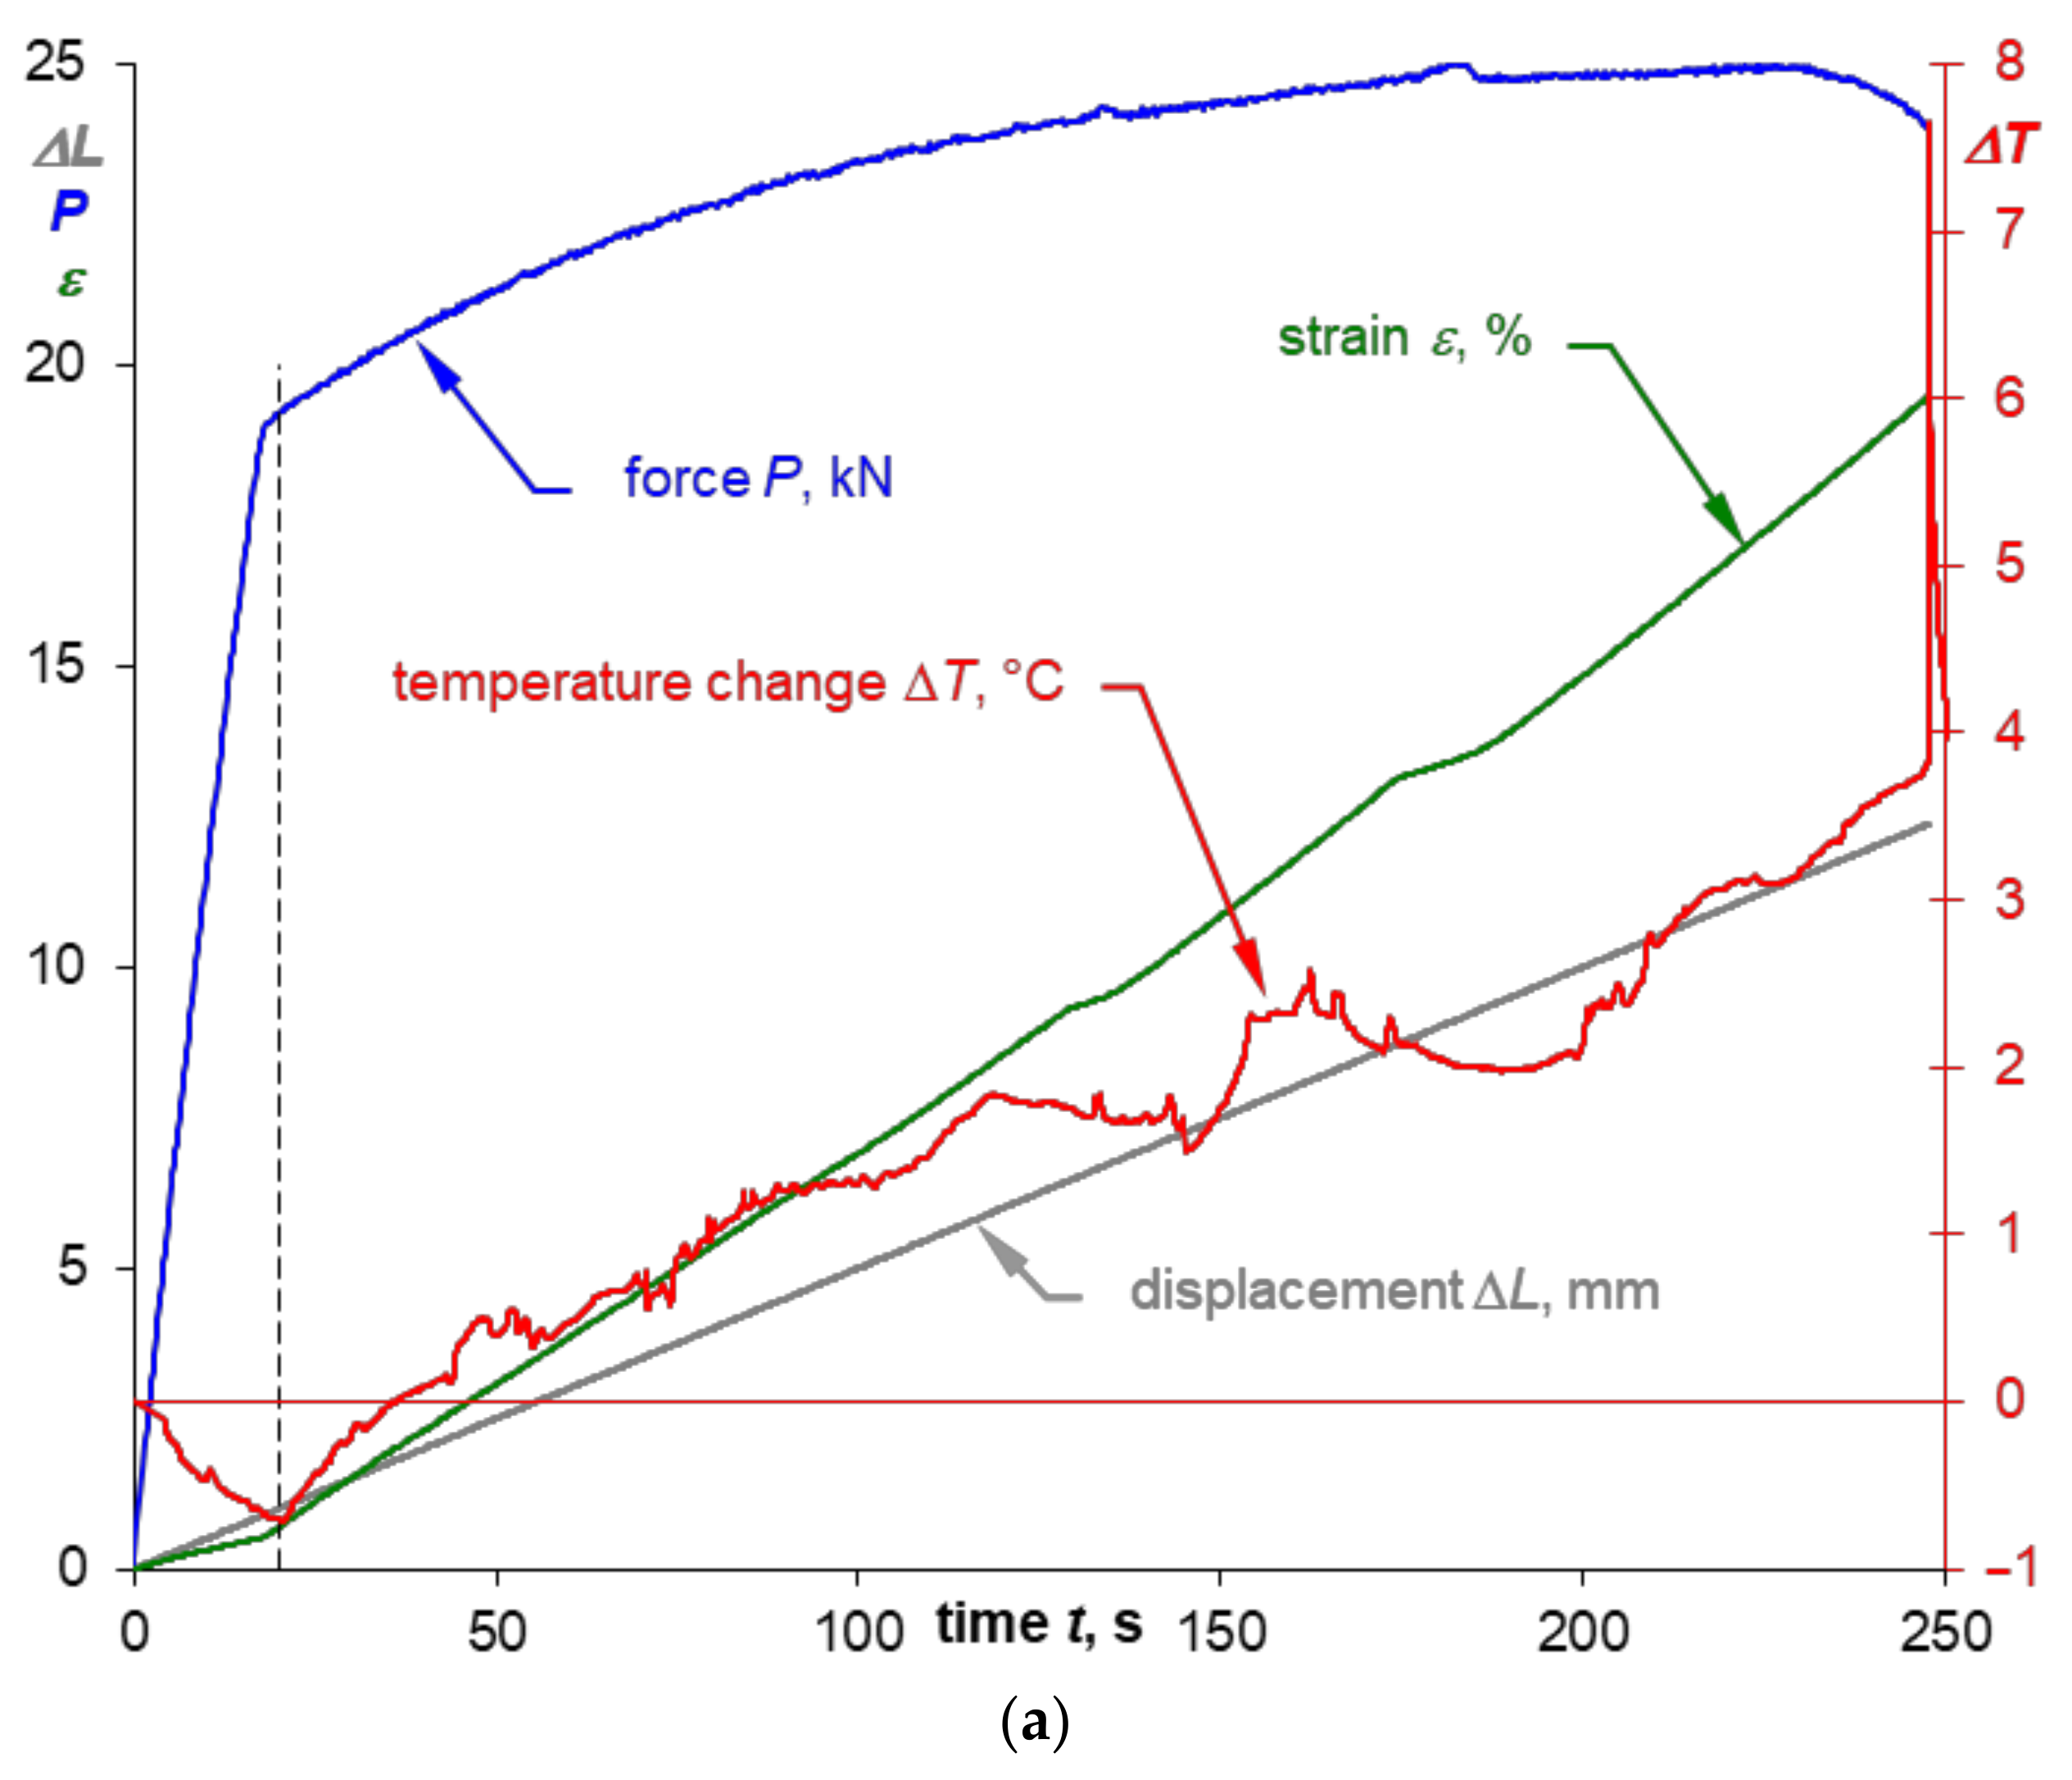
Figure 7.
Sample time courses of the parameters recorded during the monotonic tensile test (a) for a specimen made of 0.16” thick 2024-T3 sheet plate cut parallel to the rolling direction and the temperature-strain relation (b) including the marking of the thermoelasto-plastic limit stress σθ.
Figure 7.
Sample time courses of the parameters recorded during the monotonic tensile test (a) for a specimen made of 0.16” thick 2024-T3 sheet plate cut parallel to the rolling direction and the temperature-strain relation (b) including the marking of the thermoelasto-plastic limit stress σθ.
Figure 8.
Sample time courses of the parameters recorded during the monotonic tensile test (a) for a specimen made of 0.16” thick 2024-T3 sheet plate cut perpendicular to the rolling direction and the temperature-strain relation (b) including the marking of the thermoelasto-plastic limit stress σθ.
Figure 8.
Sample time courses of the parameters recorded during the monotonic tensile test (a) for a specimen made of 0.16” thick 2024-T3 sheet plate cut perpendicular to the rolling direction and the temperature-strain relation (b) including the marking of the thermoelasto-plastic limit stress σθ.
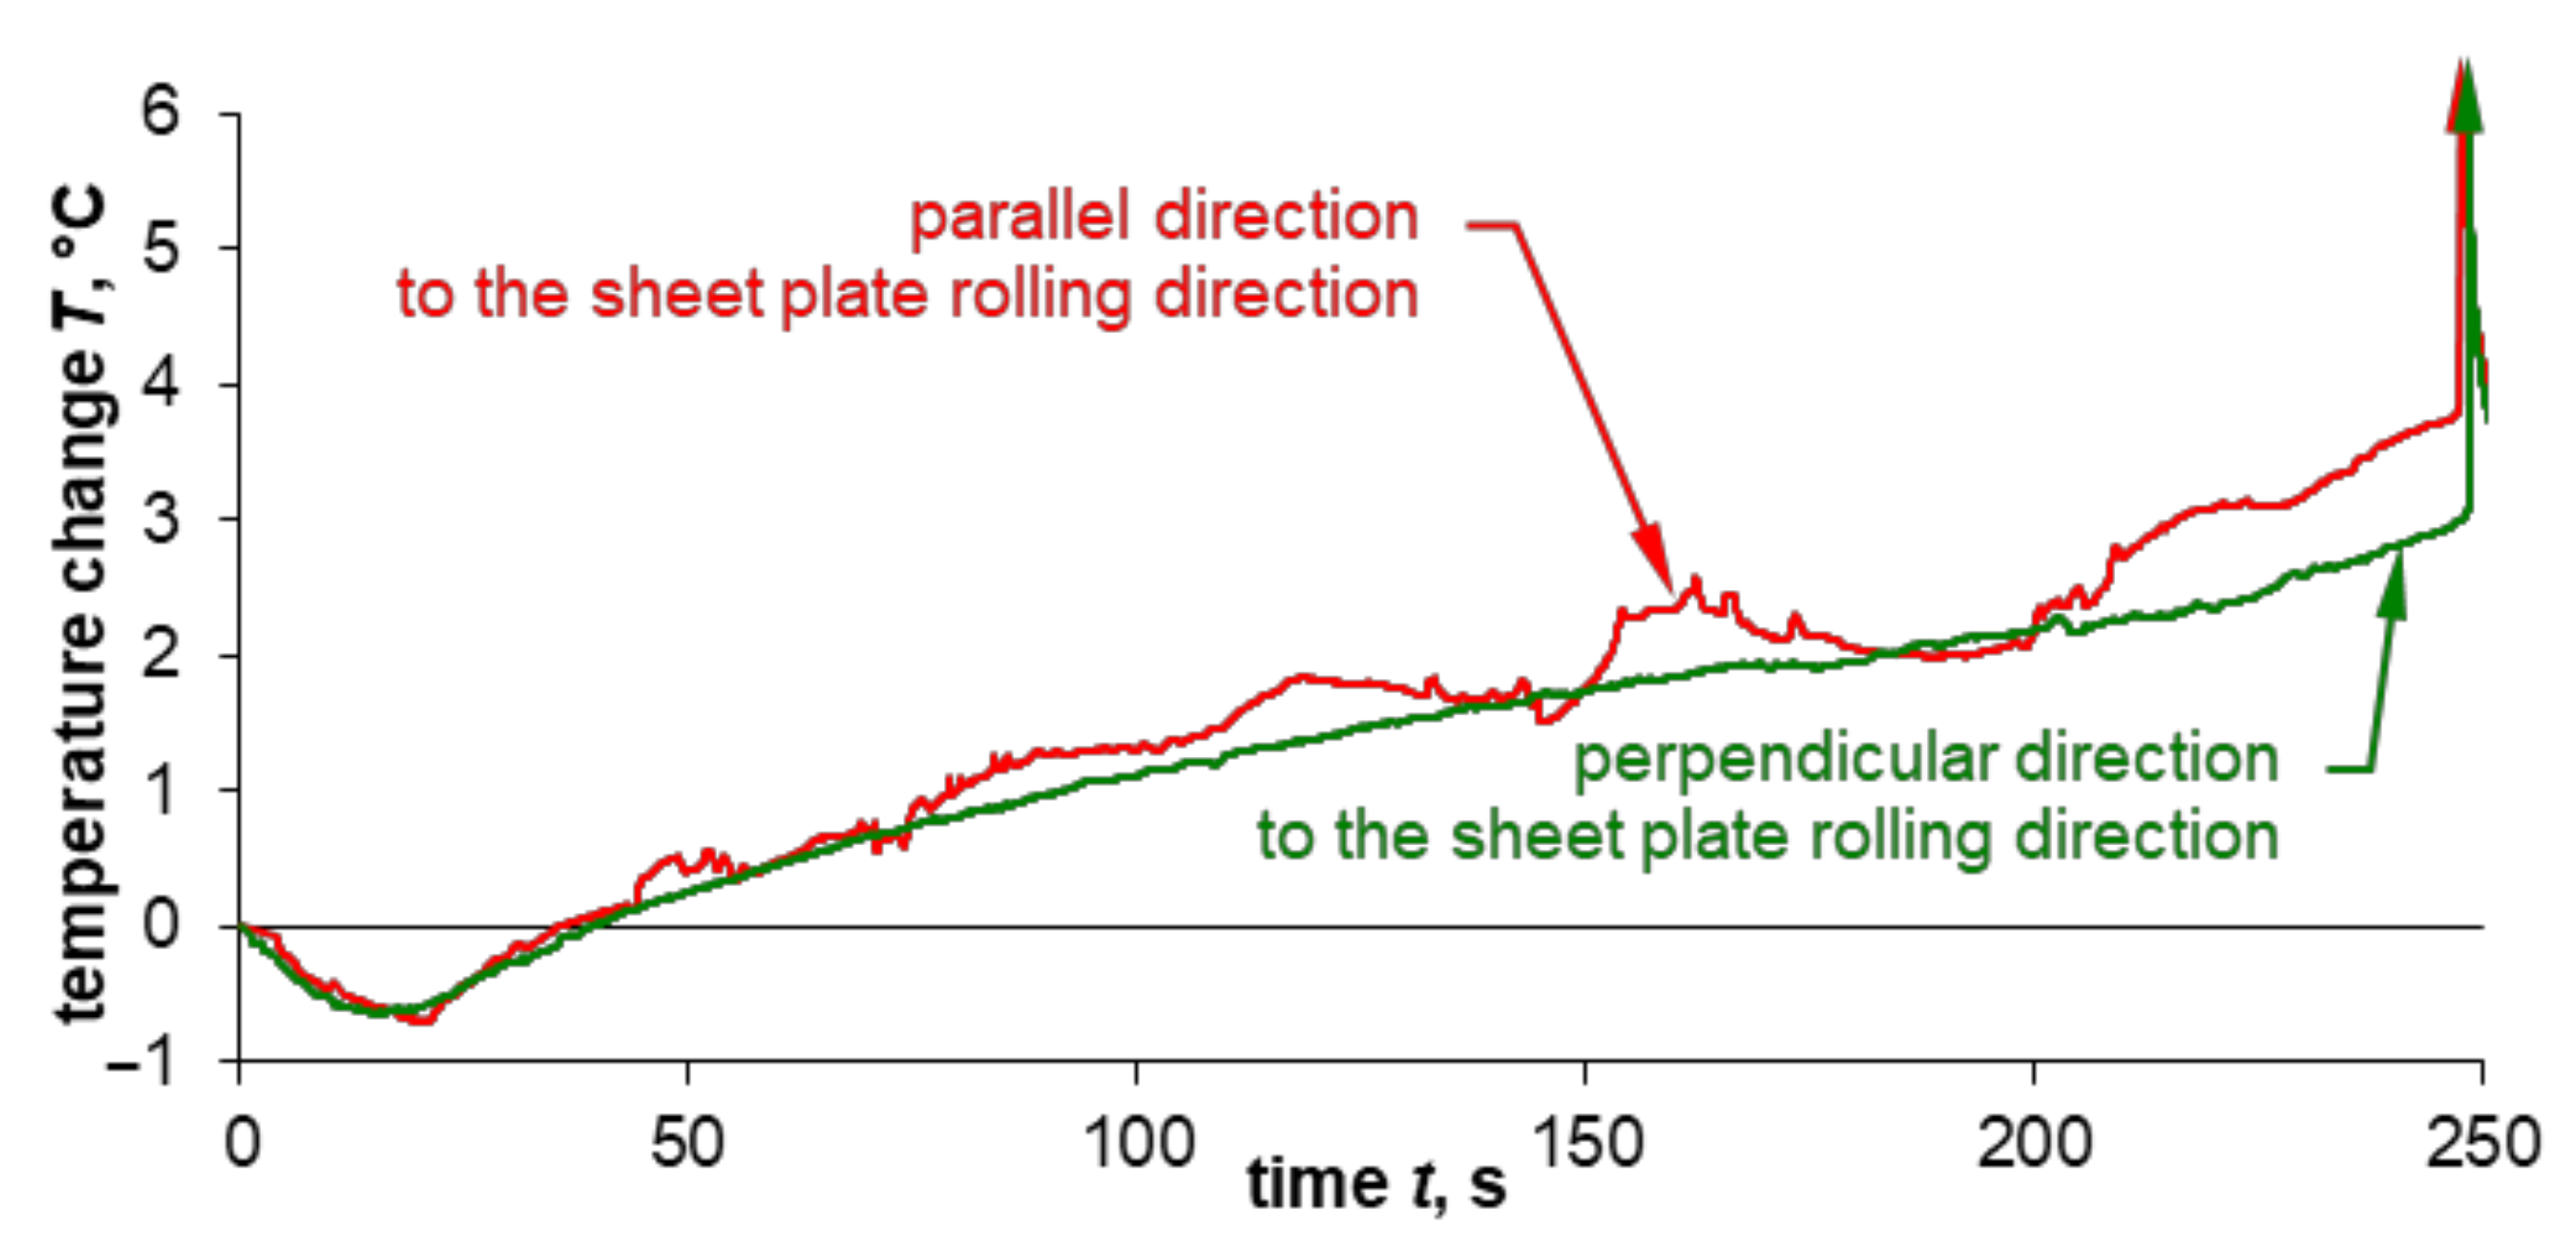
Figure 9.
The summary of the temperature change course for specimens cut out of 0.16” thick 2024-T3 sheet plate parallel and perpendicular to the rolling direction.
Figure 9.
The summary of the temperature change course for specimens cut out of 0.16” thick 2024-T3 sheet plate parallel and perpendicular to the rolling direction.
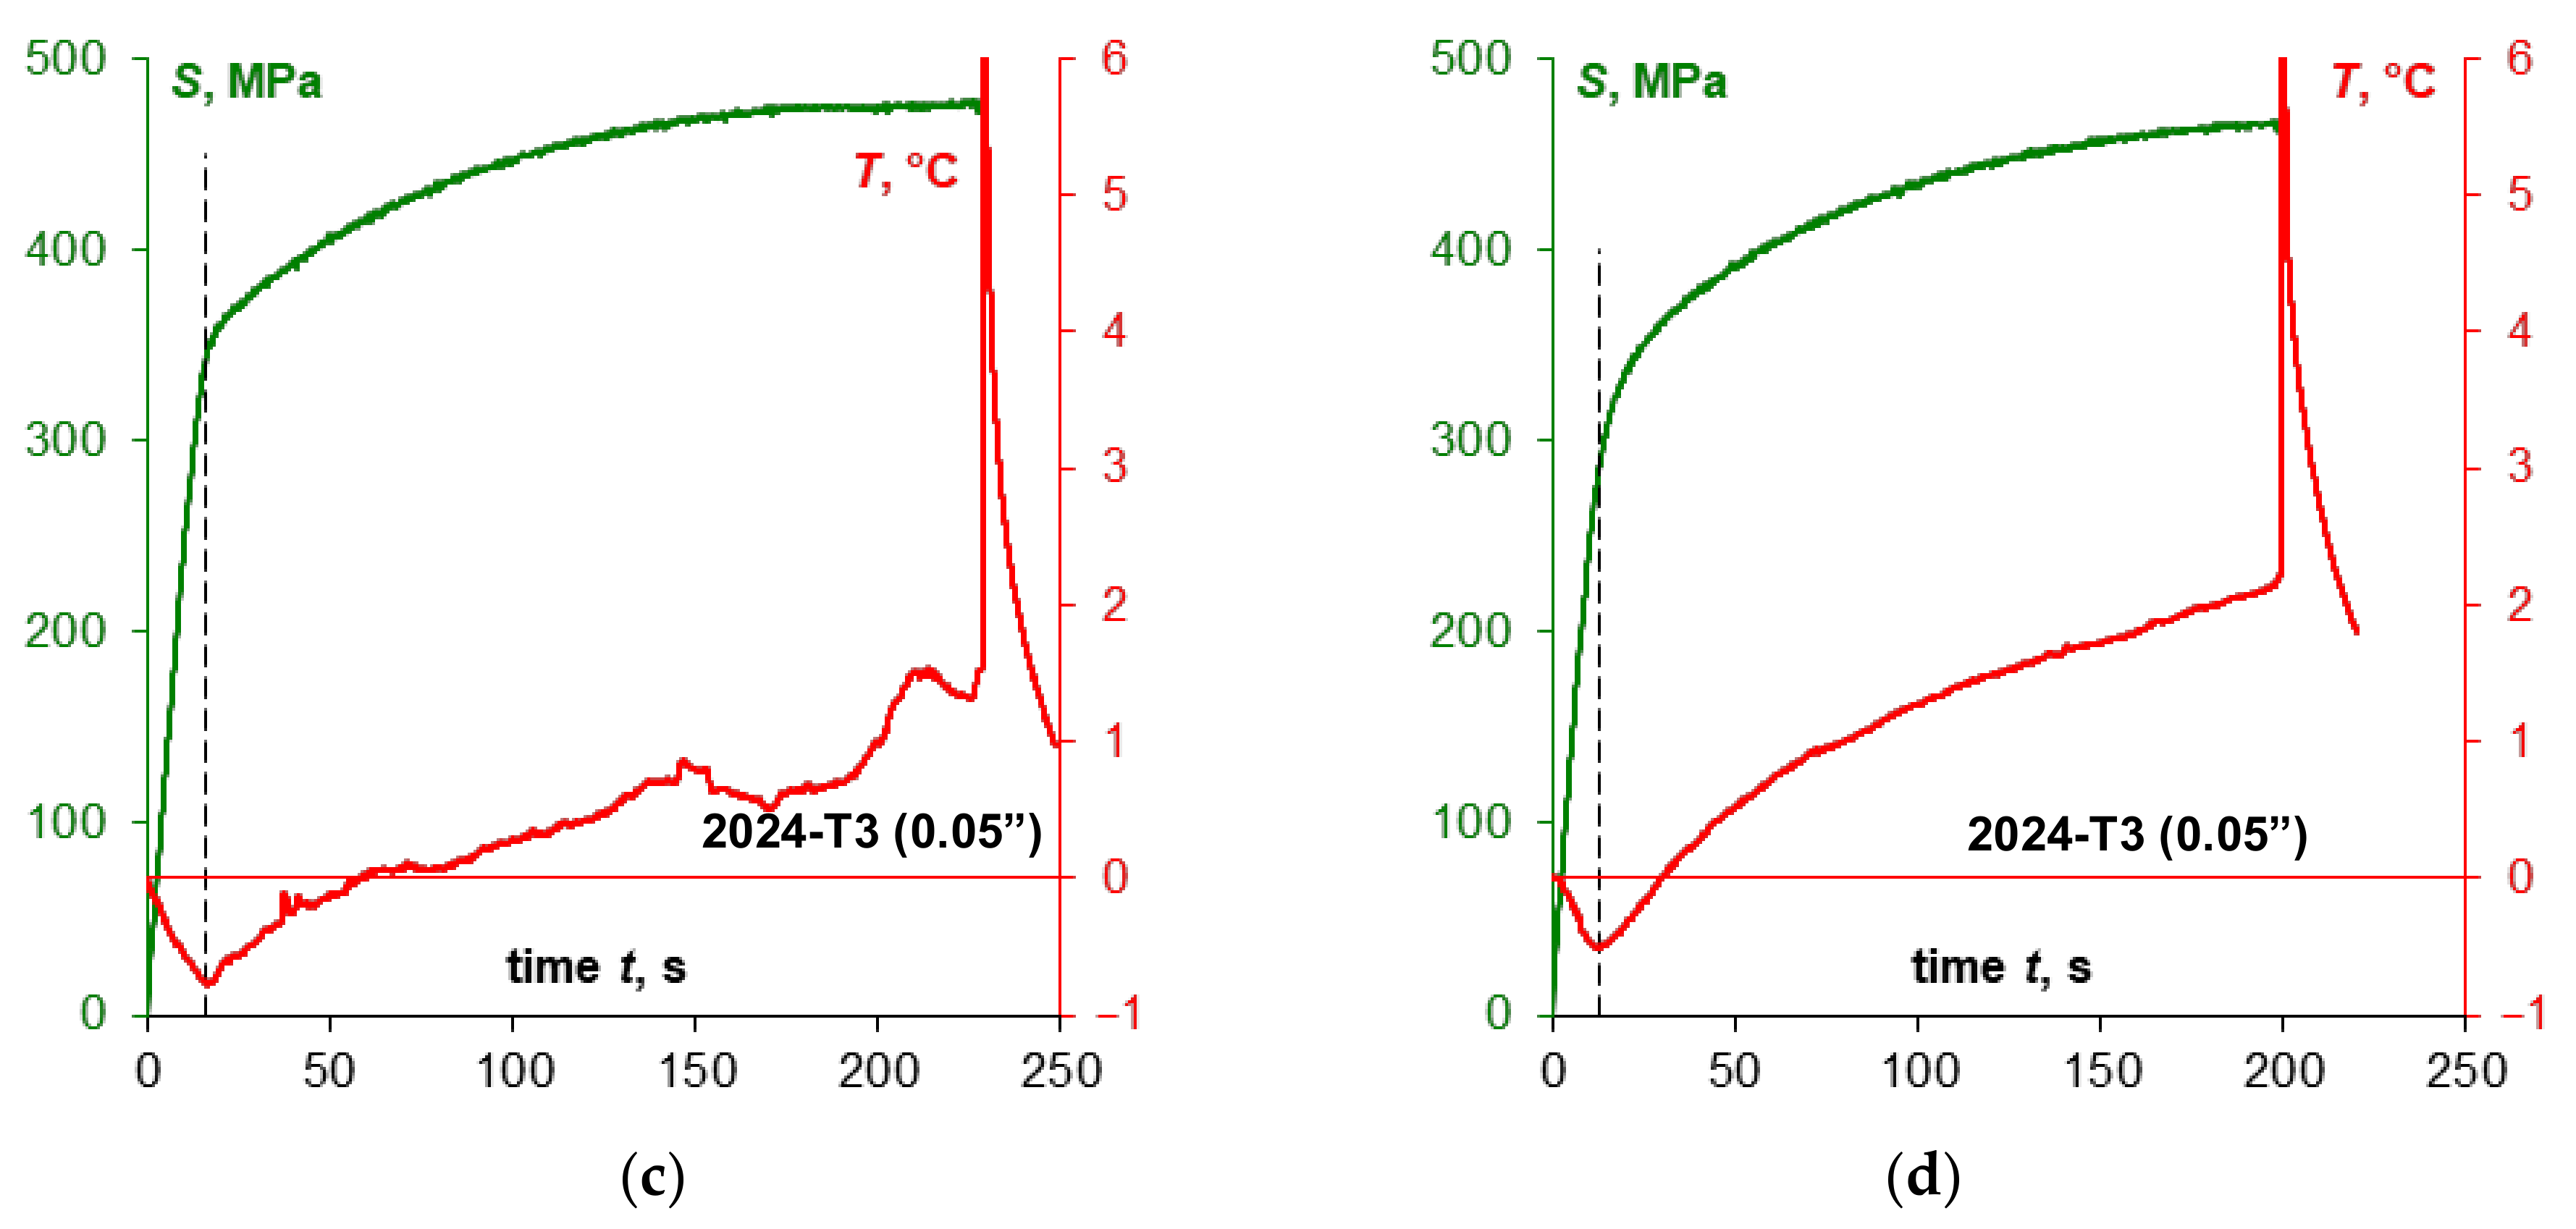
Figure 10.
The summary of stress S and temperature T change curves obtained during monotonic tensile tests of specimens made of 0.16” thick 2024-T3 sheet plate (a,b) and 0.05” thick 2024-T3 sheet plate (c,d) depending on the specimen cutting direction in relation to the sheet plate rolling direction.
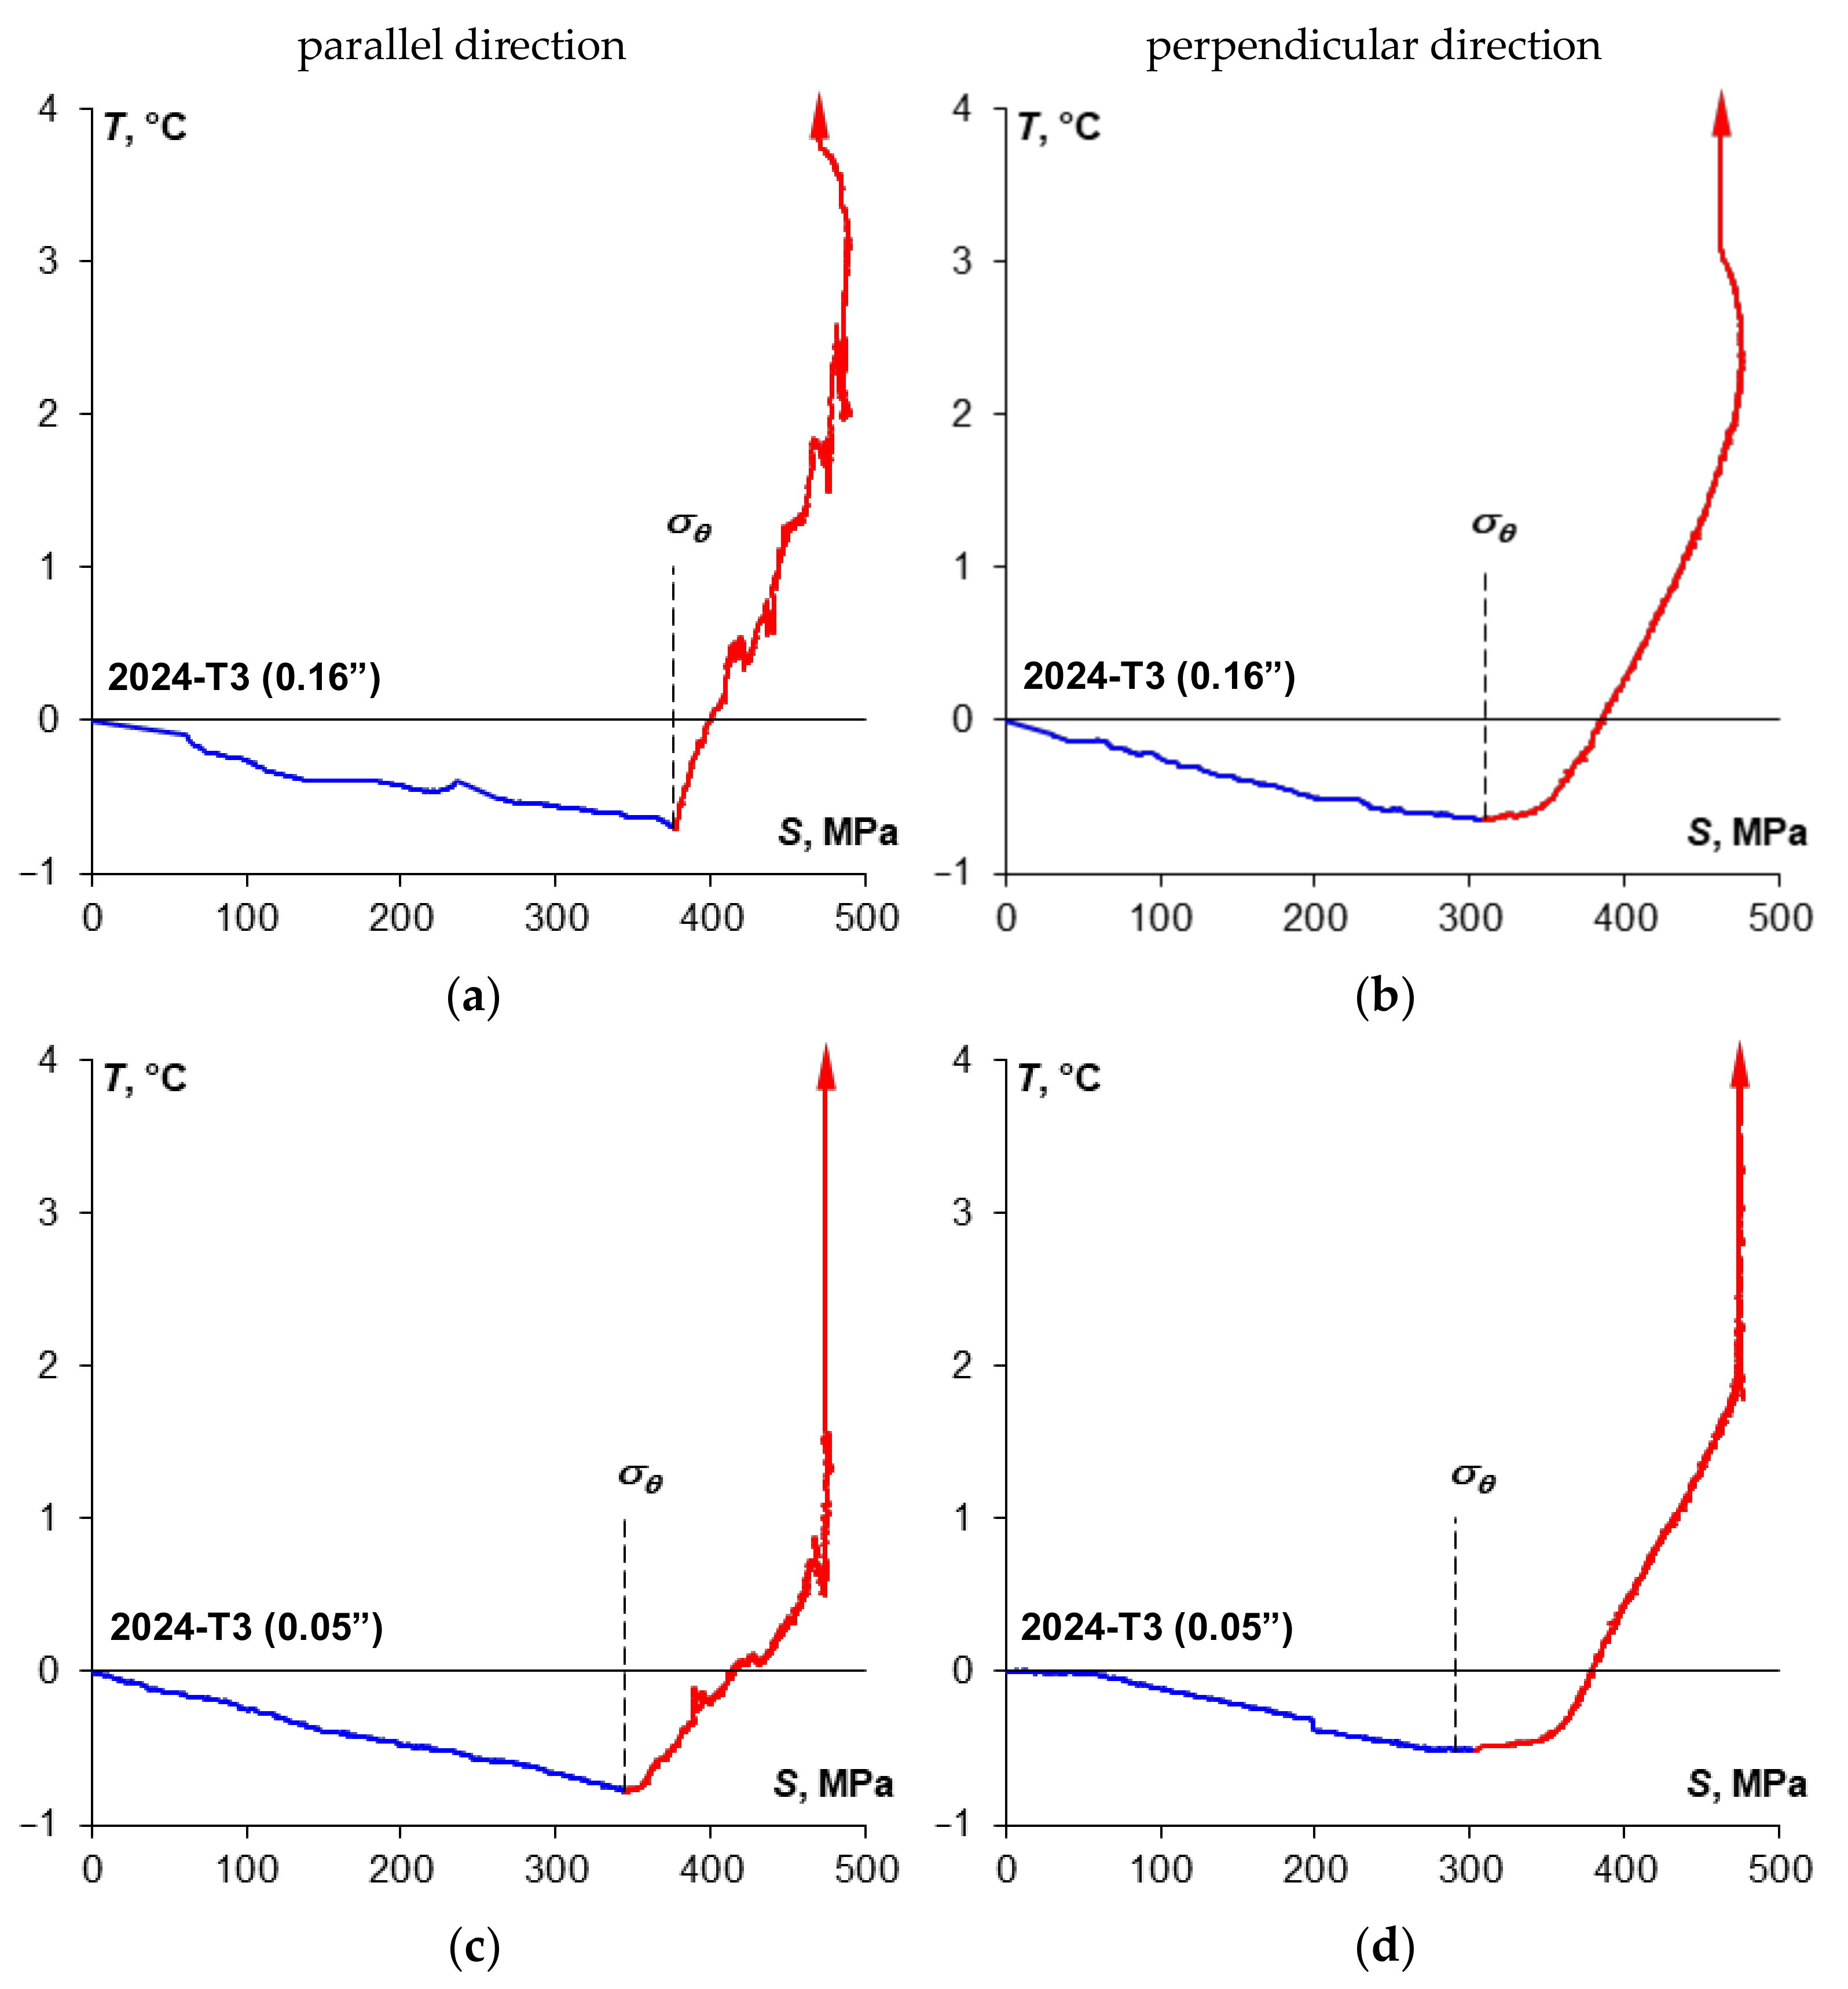
Figure 11.
The summary of the temperature T and stress S change curves obtained during monotonic tensile tests of specimens made of 0.16″ thick 2024-T3 sheet plate (a,b) and 0.05” thick 2024-T3 sheet plate (c,d) depending on the specimen cutting direction in relation to the sheet plate rolling direction.
Figure 12.
The summary of stress S and temperature T change curves obtained during monotonic tensile tests of specimens made of D16ATV sheet plate (a,b), D16CzATV sheet plate (c,d) and D16UTV sheet plate (e,f) depending on the specimen cutting direction in relation to the sheet plate rolling direction.
Figure 13.
The summary of the temperature T and stress S change curves obtained during monotonic tensile tests of specimens made of D16ATV sheet plate (a,b), D16CzATV sheet plate (c,d) and D16UTV sheet plate (e,f) depending on the specimen cutting direction in relation to the sheet plate rolling direction.
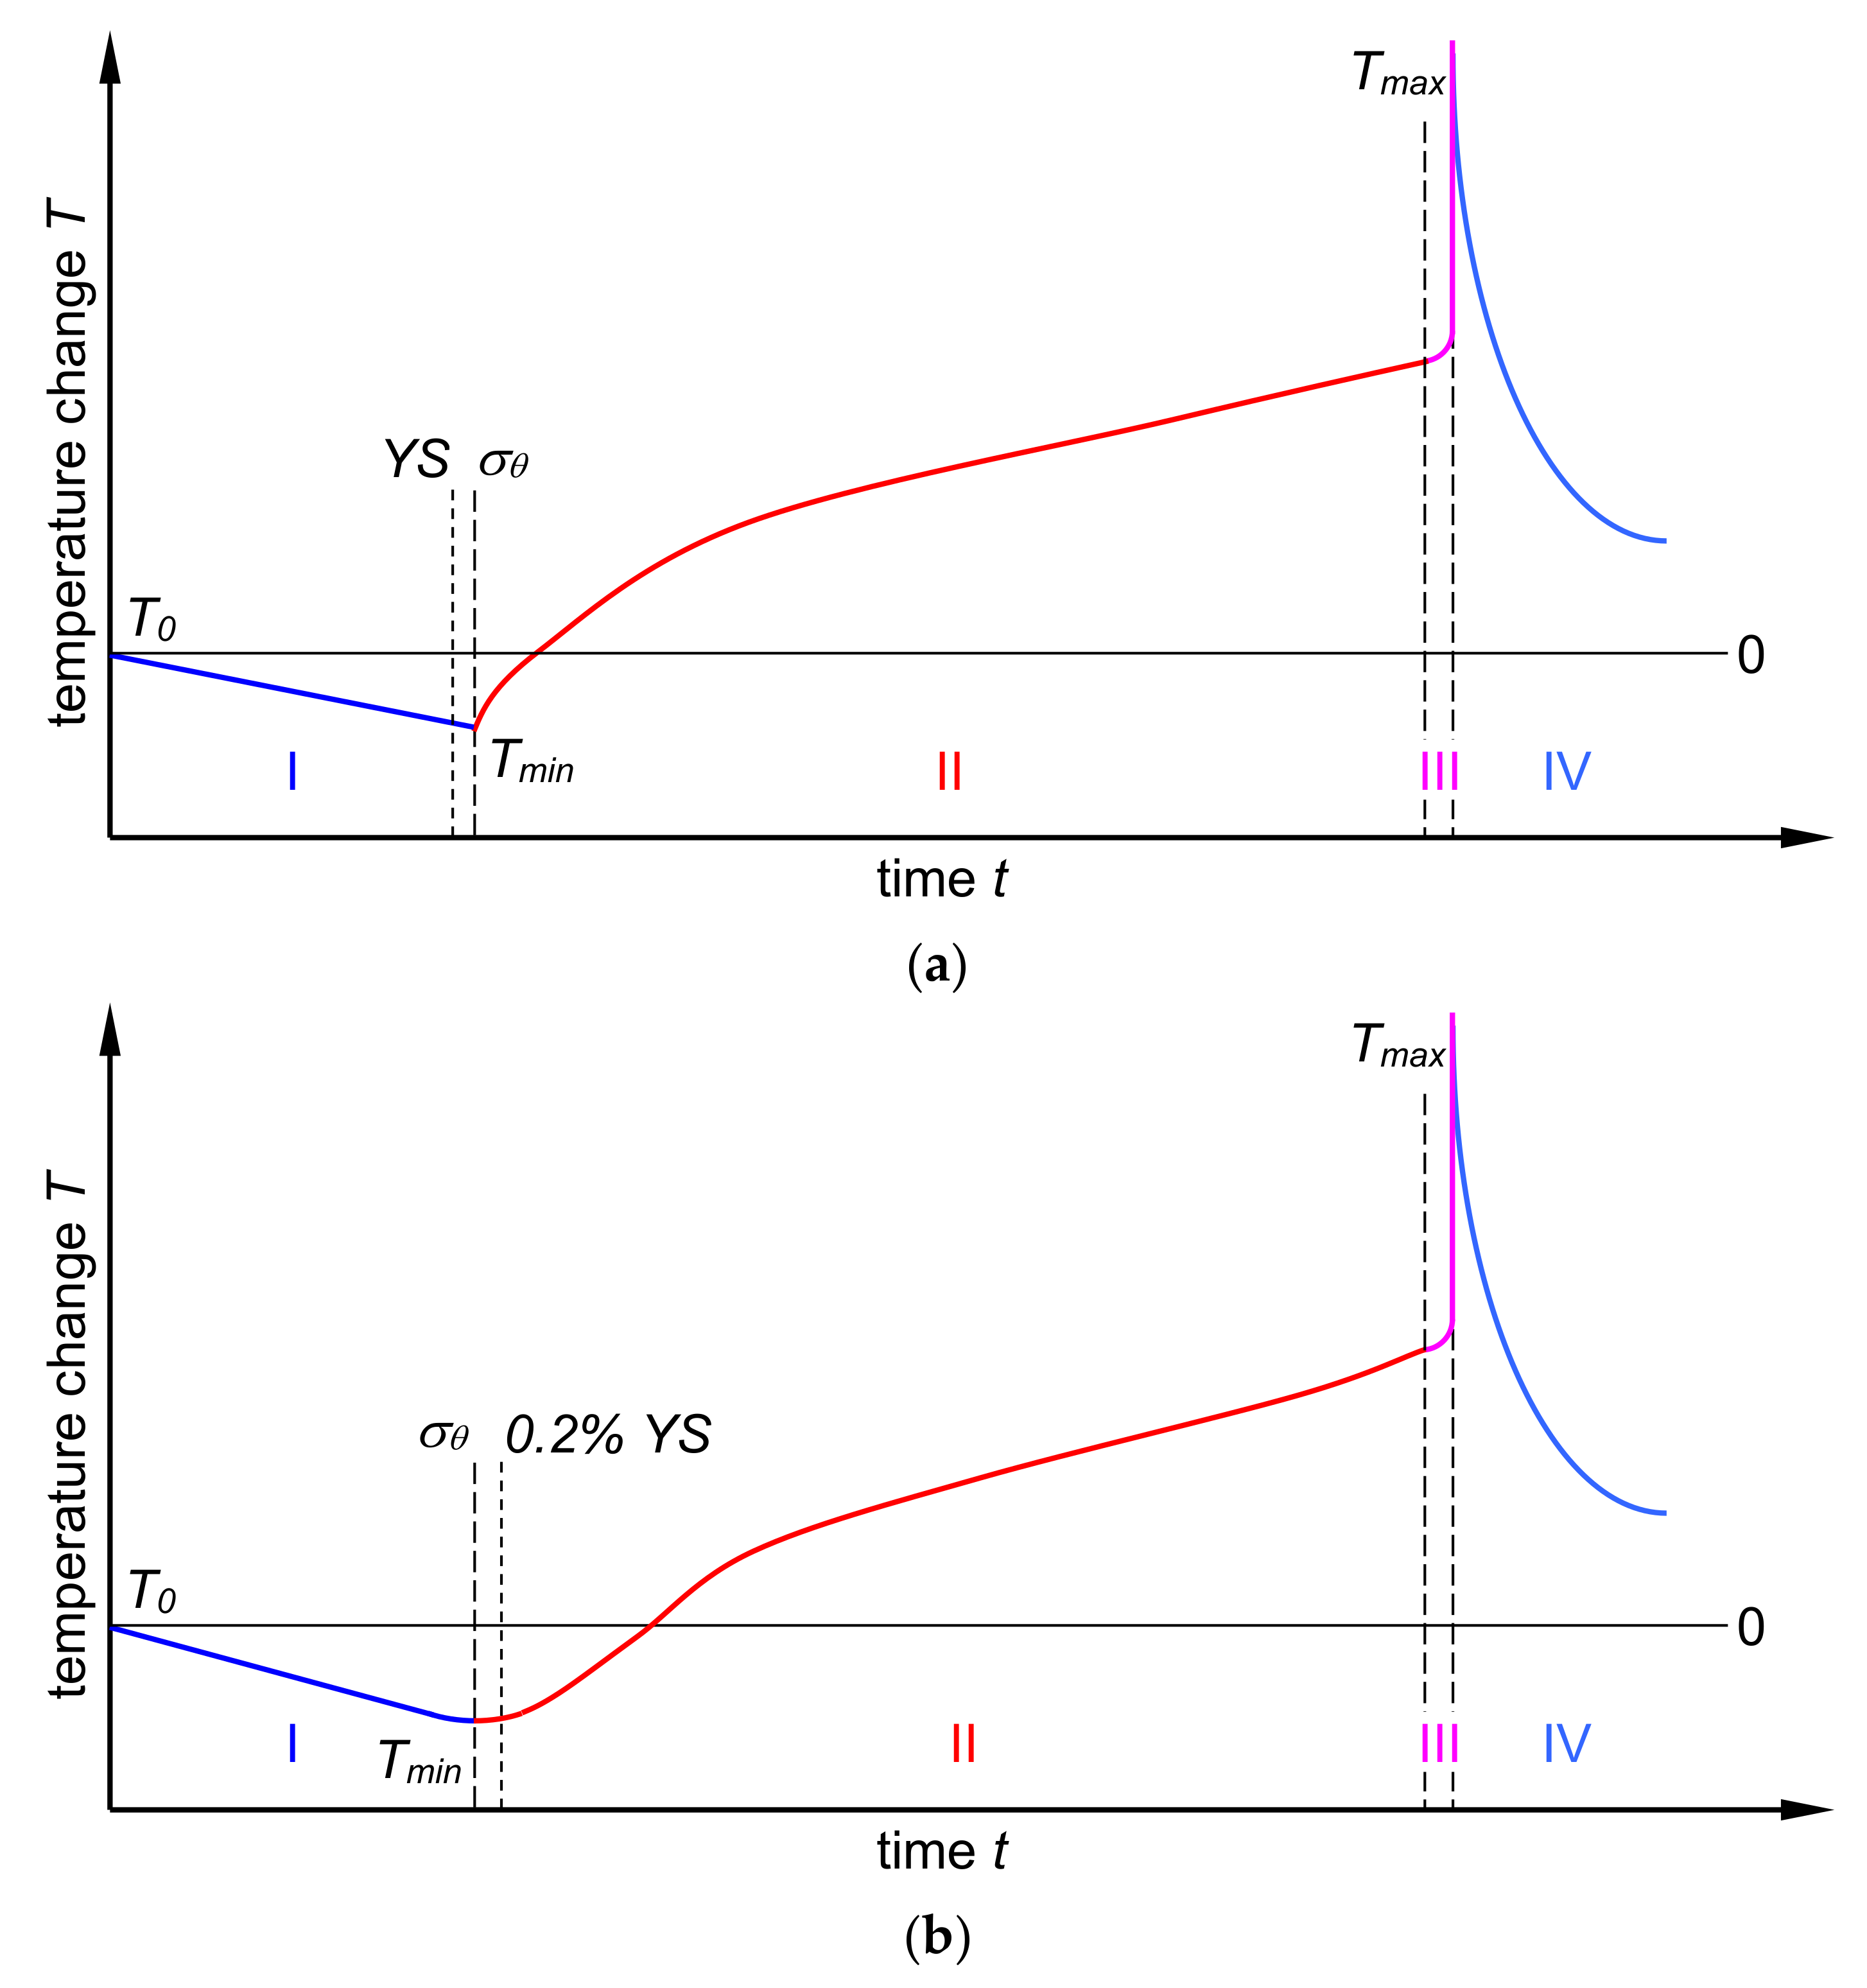
Figure 14.
Schematic representation of the course of temperature change during the monotonic tension test of the material featuring a clear yield strength (a) and no clear yield strength (b).
Figure 14.
Schematic representation of the course of temperature change during the monotonic tension test of the material featuring a clear yield strength (a) and no clear yield strength (b).
Table 1.
The content of main components (apart from aluminum) of 2024-T3 alloy (wt %).
Table 1.
The content of main components (apart from aluminum) of 2024-T3 alloy (wt %).
| | | Si | Fe | Cu | Mn | Mg | Cr | Zn | Ti |
|---|
| according to standard [35] | min | - | - | 3.8% | 0.3% | 1.2% | - | - | - |
| max | 0.50% | 0.50% | 4.9% | 0.9% | 1.8% | 0.1% | 0.25% | 0.15% |
| thickness 0.16” | | 0.07% | 0.16% | 4.7% | 0.65% | 1.5% | 0.00% | 0.10% | 0.03% |
| thickness 0.05” | | 0.06% | 0.16% | 4.7% | 0.63% | 1.5% | 0.01% | 0.16% | 0.03% |
Table 2.
The content of main chemical components (apart from aluminum) of D16ATV and D16UTV alloys (wt %).
Table 2.
The content of main chemical components (apart from aluminum) of D16ATV and D16UTV alloys (wt %).
| | | Si | Fe | Cu | Mn | Mg | Cr | Zn | Ti |
|---|
| according to standard [36] | min | - | - | 3.8% | 0.3% | 1.2% | - | - | - |
| max | 0.50% | 0.50% | 4.9% | 0.9% | 1.8% | 0.1% | 0.25% | 0.15% |
| D16ATV | | 0.23% | 0.26% | 3.88% | 0.38% | 1.38% | 0.01% | 0.01% | 0.03% |
| D16UTV | | 0.25% | 0.26% | 3.93% | 0.43% | 1.41% | 0.01% | 0.01% | 0.03% |
Table 3.
Chemical composition of main components (apart from aluminum) of D16CzATV alloy(wt %).
Table 3.
Chemical composition of main components (apart from aluminum) of D16CzATV alloy(wt %).
| | | Si | Fe | Cu | Mn | Mg | Cr | Zn | Ti |
|---|
| according to standard [36] | min | - | - | 3.8% | 0.3% | 1.2% | - | - | - |
| max | 0.20% | 0.30% | 4.9% | 0.9% | 1.8% | 0.1% | 0.25% | 0.15% |
| D16CzATV | | 0.11% | 0.22% | 3.91% | 0.34% | 1.33% | 0.03% | 0.01% | 0.02% |
Table 4.
Monotonic properties of the 2024-T3 alloy in the form of 0.16” thick sheet plate.
Table 4.
Monotonic properties of the 2024-T3 alloy in the form of 0.16” thick sheet plate.
| Direction of Cut Out Specimens from a Sheet Plate | Young’s Modulus | Yield Strength | 0.2% Yield Strength | Ultimate Tensile Strength | Elongation |
|---|
| GPa | MPa | MPa | MPa | % |
|---|
| parallel to the rolling direction | 67.6 ± 3.3 | 362.3 ± 2.0 | - | 488.3 ± 1.0 | 19.4 ± 0.4 |
| perpendicular to the rolling direction | 69.7 ± 5.0 | - | 324.2 ± 1.3 | 479.0 ± 2.0 | 20.3 ± 0.9 |
Table 5.
Monotonic properties of the 2024-T3 alloy in the form of 0.05” thick sheet plate.
Table 5.
Monotonic properties of the 2024-T3 alloy in the form of 0.05” thick sheet plate.
| Direction of Cut Out Specimens from a Sheet Plate | Young’s Modulus | Yield Strength | 0.2% Yield Strength | Ultimate Tensile Strength | Elongation |
|---|
| GPa | MPa | MPa | MPa | % |
|---|
| parallel to the rolling direction | 68.9 ± 2.3 | 334.0 ± 3.4 | - | 468.7 ± 3.5 | 15.9 ± 1.5 |
| perpendicular to the rolling direction | 70.2 ± 1.4 | - | 311.5 ± 3.4 | 461.0 ± 5.6 | 15.1 ± 0.9 |
Table 6.
Monotonic properties of the D16ATV aluminum alloy in the form of 1.13 mm thick sheet plate.
Table 6.
Monotonic properties of the D16ATV aluminum alloy in the form of 1.13 mm thick sheet plate.
| Direction of Cut Out Specimens from a Sheet Plate | Young’s Modulus | Yield Strength | 0.2% Yield Strength | Ultimate Tensile Strength | Elongation |
|---|
| GPa | MPa | MPa | MPa | % |
|---|
| parallel to the rolling direction | 69.8 ± 3.5 | 339.5 ± 4.8 | - | 463.9 ± 2.7 | 18.5 ± 1.5 |
| perpendicular to the rolling direction | 68.1 ± 0.2 | 303.0 ± 14.4 | - | 443.4 ± 12.9 | 15.0 ± 0.8 |
Table 7.
Monotonic properties of the D16CzATV aluminum alloy in the form of 1.11 mm thick sheet plate.
Table 7.
Monotonic properties of the D16CzATV aluminum alloy in the form of 1.11 mm thick sheet plate.
| Direction of Cut Out Specimens from a Sheet Plate | Young’s Modulus | Yield Strength | 0.2% Yield Strength | Ultimate Tensile Strength | Elongation |
|---|
| GPa | MPa | MPa | MPa | % |
|---|
| parallel to the rolling direction | 66.1 ± 1.3 | 332.1 ± 1.4 | - | 447.6 ± 1.1 | 12.5 ± 0.4 |
| perpendicular to the rolling direction | 69.3 ± 3.0 | - | 319.0 ± 7.4 | 444.4 ± 5.8 | 13.2 ± 0.7 |
Table 8.
Monotonic properties of the D16UTV aluminum alloy in the form of 0.55 mm thick sheet plate.
Table 8.
Monotonic properties of the D16UTV aluminum alloy in the form of 0.55 mm thick sheet plate.
| Direction of Cut Out Specimens from a Sheet Plate | Young’s Modulus | Yield Strength | 0.2% Yield Strength | Ultimate Tensile Strength | Elongation |
|---|
| GPa | MPa | MPa | MPa | % |
|---|
| parallel to the rolling direction | 58.0 ± 1.1 | 288.8 ± 3.6 | - | 404.1 ± 4.9 | 14.4 ± 0.3 |
| perpendicular to the rolling direction | 63.4 ± 1.7 | 266.6 ± 4.5 | - | 406.6 ± 9.4 | 17.0 ± 0.9 |
Table 9.
A summary of the yield strength and the thermoelasto-plastic limit stress values for sheet plates made of the 2024-T3 aluminum alloy depending on the thickness and the rolling direction.
Table 9.
A summary of the yield strength and the thermoelasto-plastic limit stress values for sheet plates made of the 2024-T3 aluminum alloy depending on the thickness and the rolling direction.
Parameter
MPa | Sheet Plate Thickness |
|---|
| 0.16” | 0.05” |
|---|
Sheet Plate Specimen Cutting with Regard
to the Rolling Direction |
|---|
| Parallel | Perpendicular | Parallel | Perpendicular |
|---|
| Yield strength | 362.3 ± 2.0 | - | 334.0 ± 3.4 | - |
| 0.2% yield strength | - | 324.2 ± 1.3 | - | 311.5 ± 3.4 |
| Thermoelasto-plastic limit stress σθ | 373.6 ± 2.2 | 316.0 ± 5.7 | 339.1 ± 5.2 | 295.2 ± 7.4 |
Table 10.
A summary of the thermoelastic material constant Km for sheet plates made of the 2024-T3 aluminum alloy depending on the thickness and the rolling direction.
Table 10.
A summary of the thermoelastic material constant Km for sheet plates made of the 2024-T3 aluminum alloy depending on the thickness and the rolling direction.
Thermoelastic Constant
MPa−1 | Sheet Plate Thickness |
|---|
| 0.16” | 0.05” |
|---|
Sheet Plate Specimen Cutting with Regard
to the Rolling Direction |
|---|
| Parallel | Perpendicular | Parallel | Perpendicular |
|---|
| Km | 6.38 × 10⁻⁶ | 7.40 × 10⁻⁶ | 6.05 × 10⁻⁶ | 7.03 × 10⁻⁶ |
Table 11.
A summary of the yield strength and the thermoelasto-plastic limit stress values for sheet plate made of the D16 aluminum alloy depending on the thickness and the rolling direction.
Table 11.
A summary of the yield strength and the thermoelasto-plastic limit stress values for sheet plate made of the D16 aluminum alloy depending on the thickness and the rolling direction.
Parameter
MPa | D16ATV | D16CzATV | D16UTV |
|---|
| Sheet Plate Specimen Cutting with Regard to the Rolling Direction |
|---|
| Parallel | Perpendicular | Parallel | Perpendicular | Parallel | Perpendicular |
|---|
| Yield strength | 339.5 ± 4.8 | 303.0 ± 14.4 | 332.1 ± 1.4 | - | 266.6 ± 4.5 | 288.8 ± 3.6 |
| 0.2% yield strength | - | - | - | 319.0 ± 7.4 | - | - |
| Thermoelasto-plastic limit stress σθ | 338.1 ± 4.2 | 304.0 ± 8.5 | 338.1 ± 2.2 | 312.0 ± 1.7 | 289.1 ± 1.7 | 306.0 ± 2.2 |
Table 12.
A summary of the thermoelastic material constant Km for sheet plate made of D16 aluminum alloy depending on the thickness and the rolling direction.
Table 12.
A summary of the thermoelastic material constant Km for sheet plate made of D16 aluminum alloy depending on the thickness and the rolling direction.
Thermoelastic Constant
MPa−1 | D16ATV | D16CzATV | D16UTV |
|---|
| Sheet Plate Specimen Cutting with Regard to the Rolling Direction |
|---|
| Parallel | Perpendicular | Parallel | Perpendicular | Parallel | Perpendicular |
|---|
| Km | 3.79 × 10⁻⁶ | 6.92 × 10⁻⁶ | 7.66 × 10⁻⁶ | 6.57 × 10⁻⁶ | 4.41 × 10⁻⁶ | 6.26 × 10⁻⁶ |


