
MDCT-Based Finite Element Analysis for the Prediction of Functional Spine Unit Strength—An In Vitro Study


Abstract
:1. Introduction
- (1)
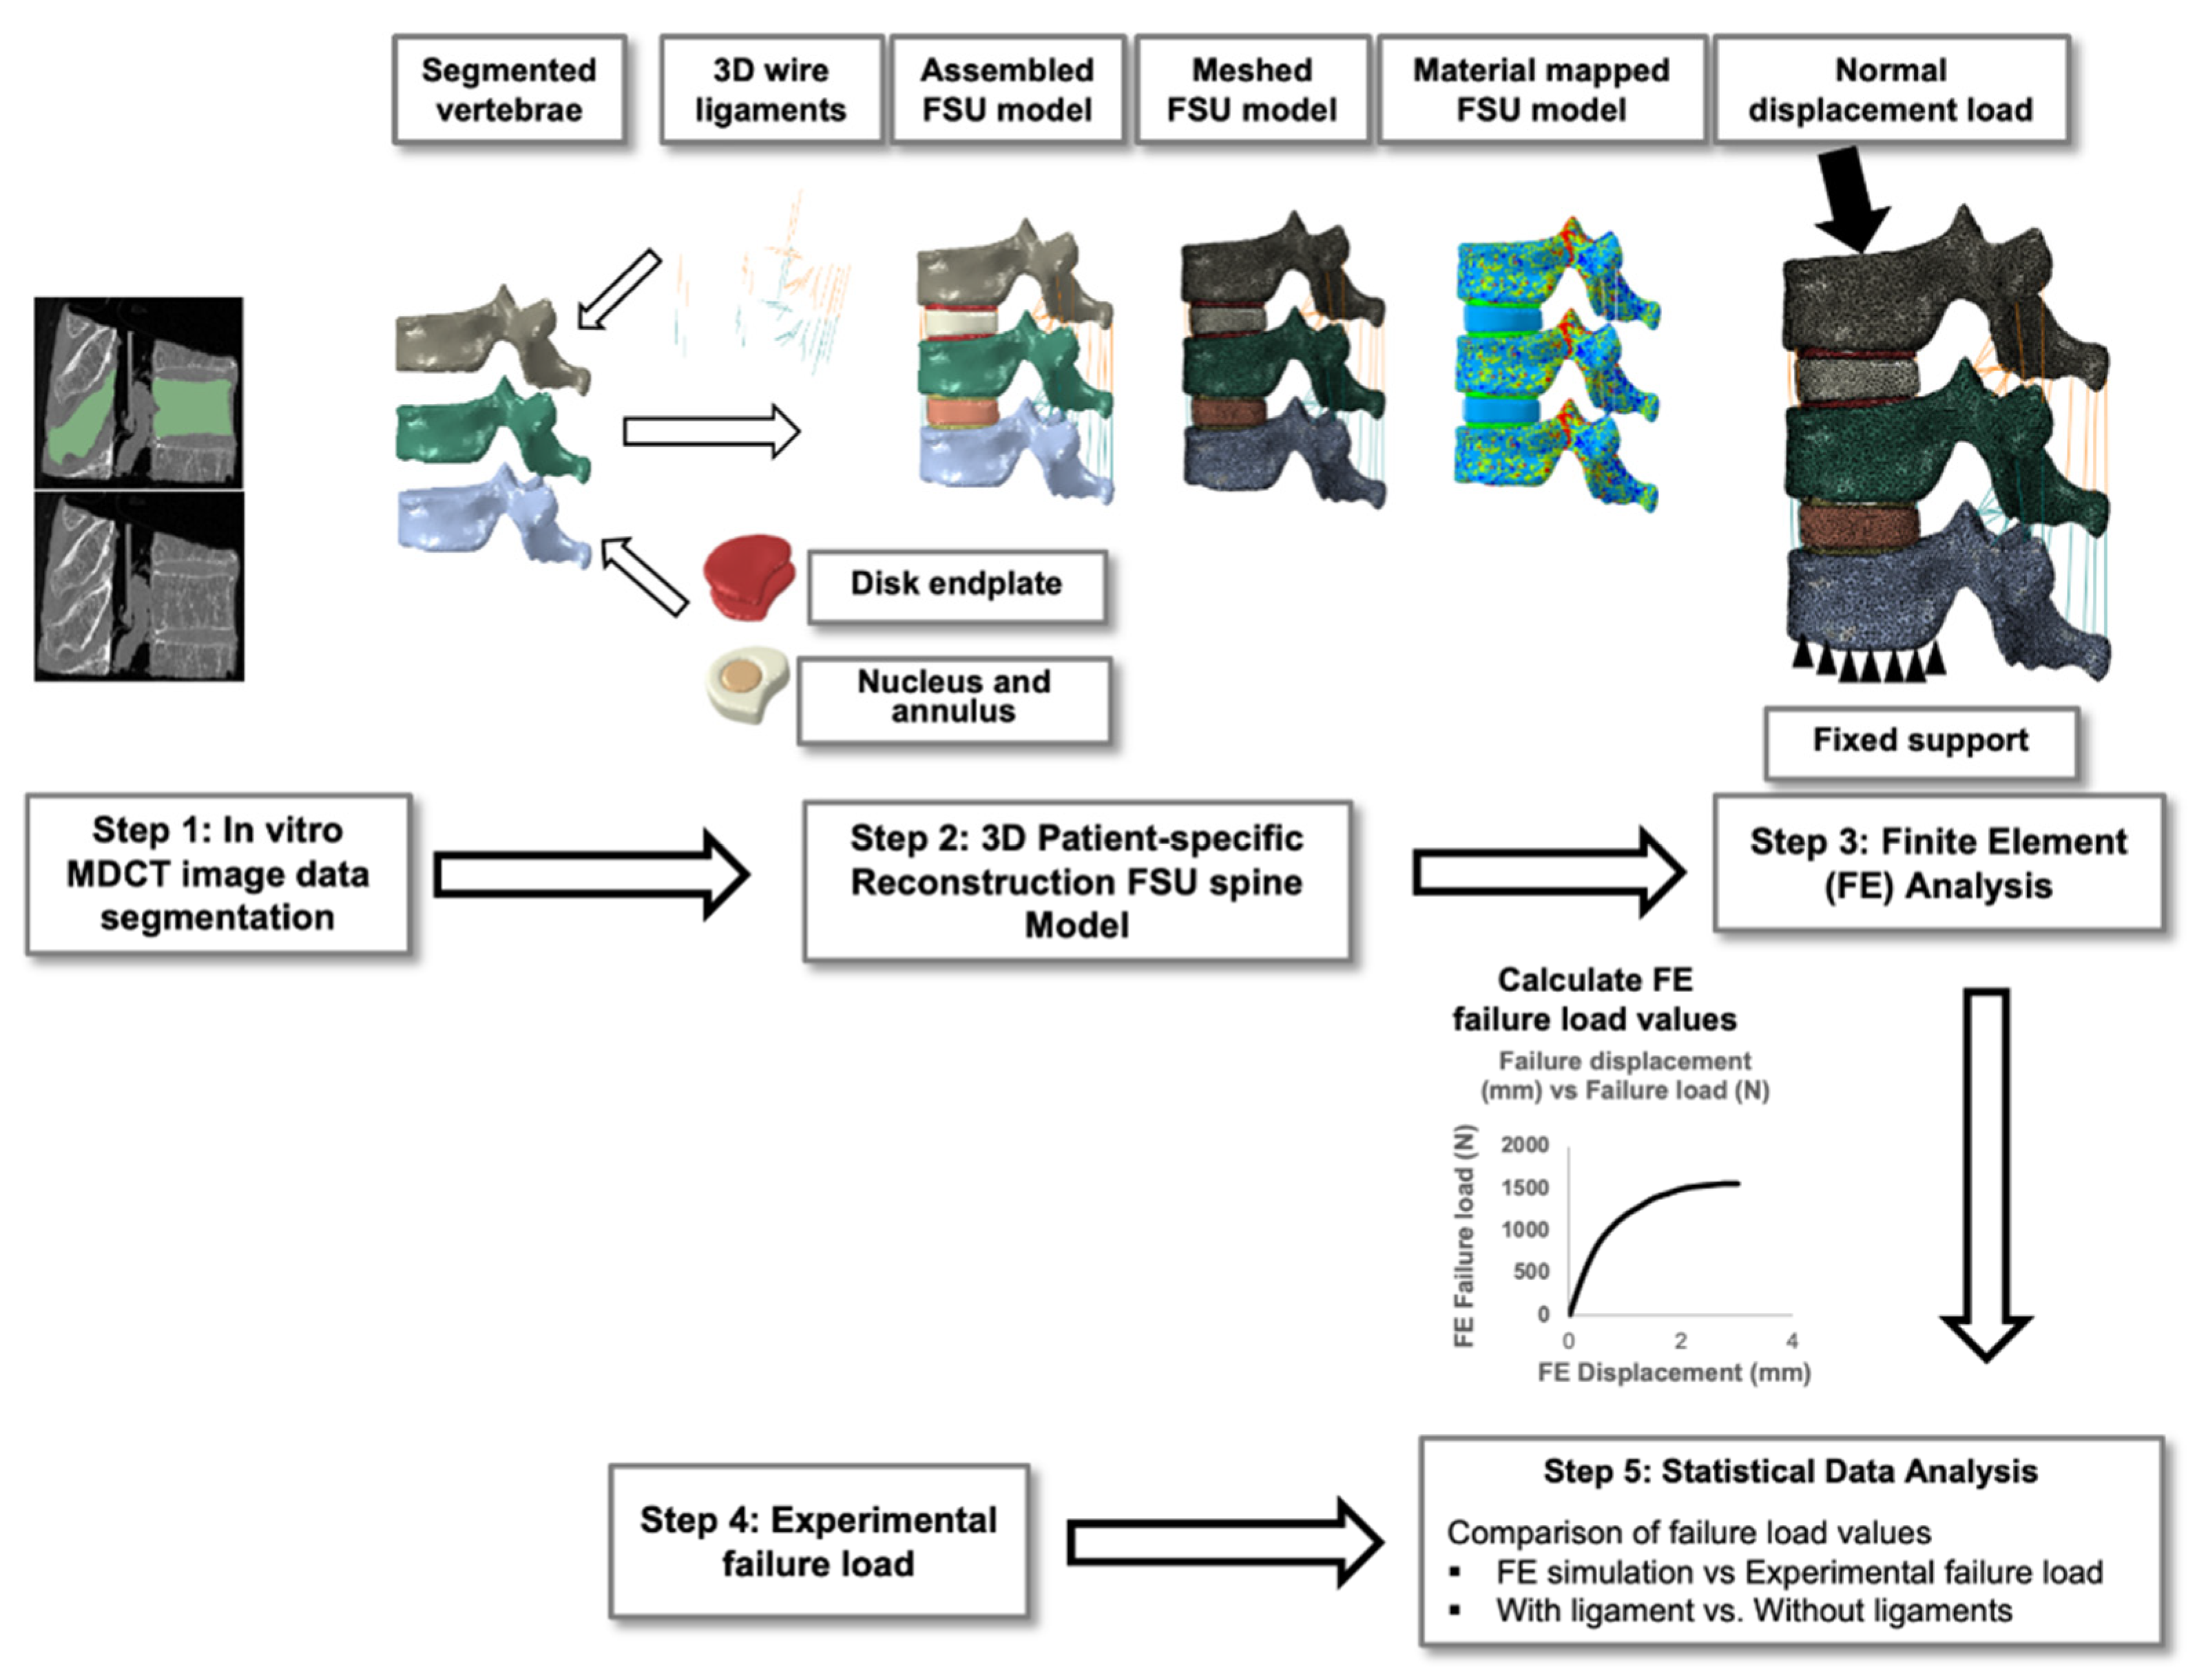
- Compare the failure loads of FE-based FSU models (with and without ligaments) with the experimental loads;
- (2)
- Compare the failure loads between those with and without ligament FSU models.
2. Materials and Methods
2.1. Subject Data
2.2. MDCT Image Acquisition
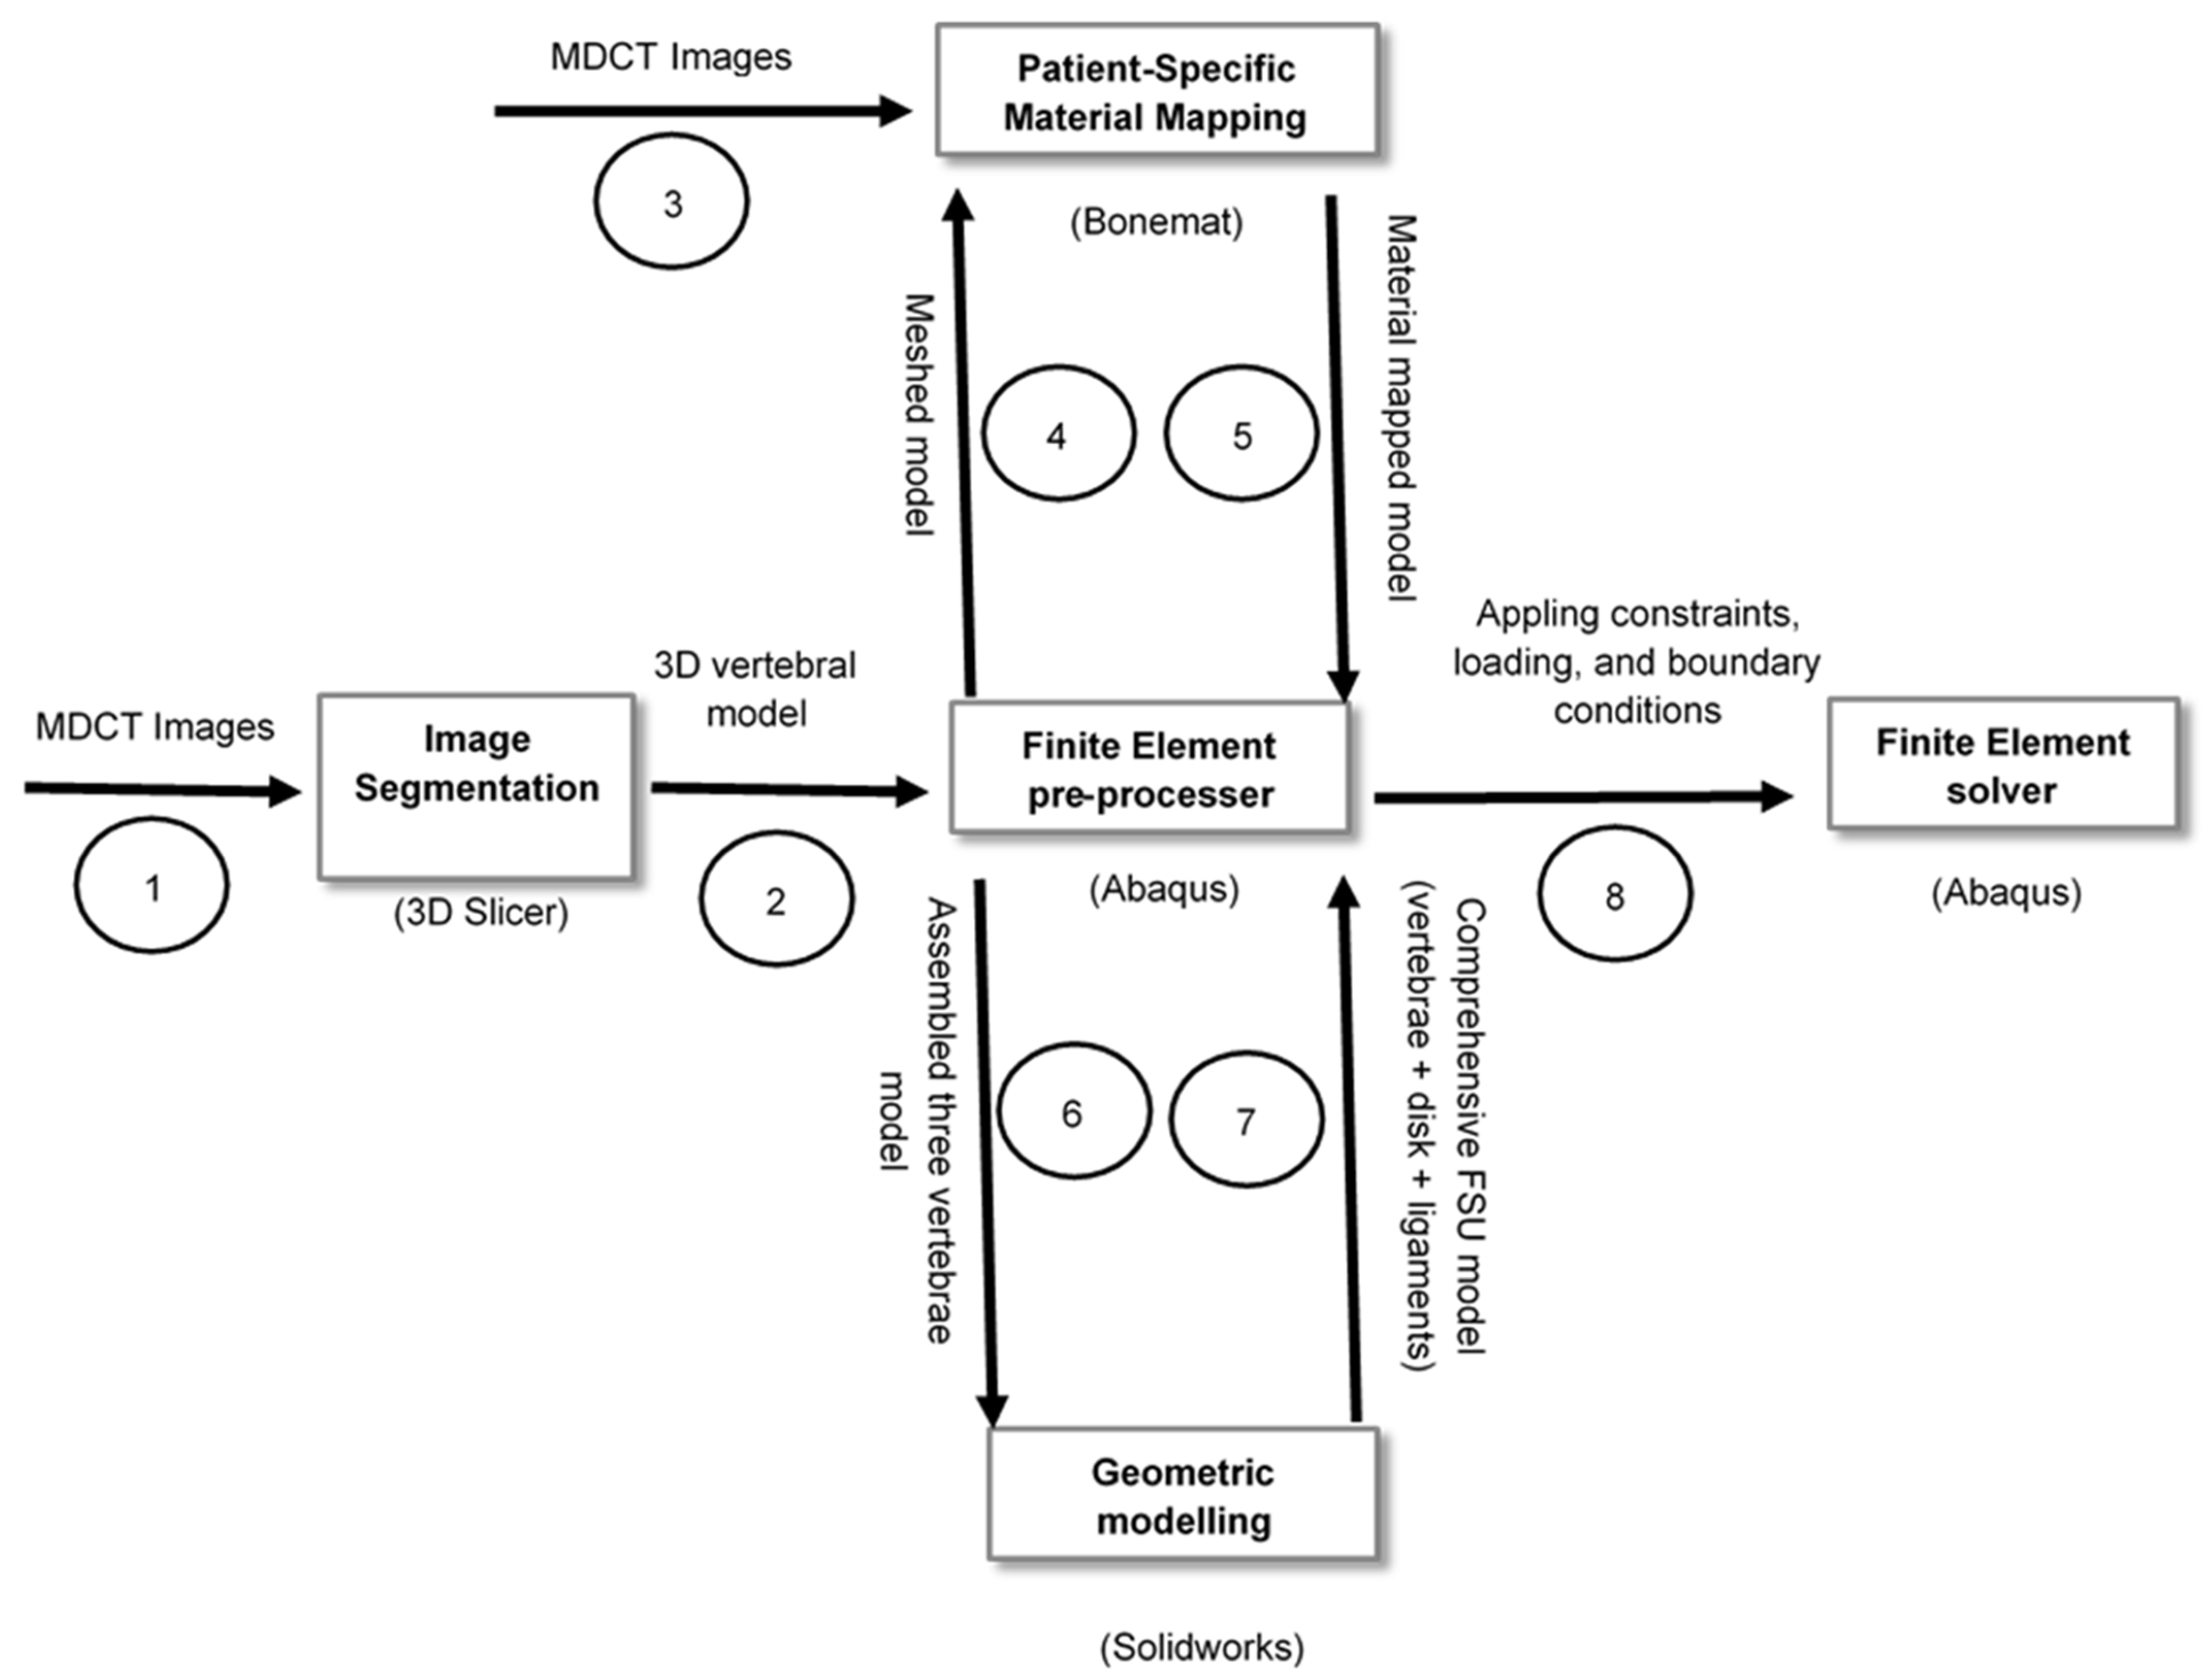
2.3. Image Segmentation and 3D Reconstruction
2.4. Simulation and Modeling
2.5. Experimental Setup
2.6. Statistical Data Analysis
3. Results
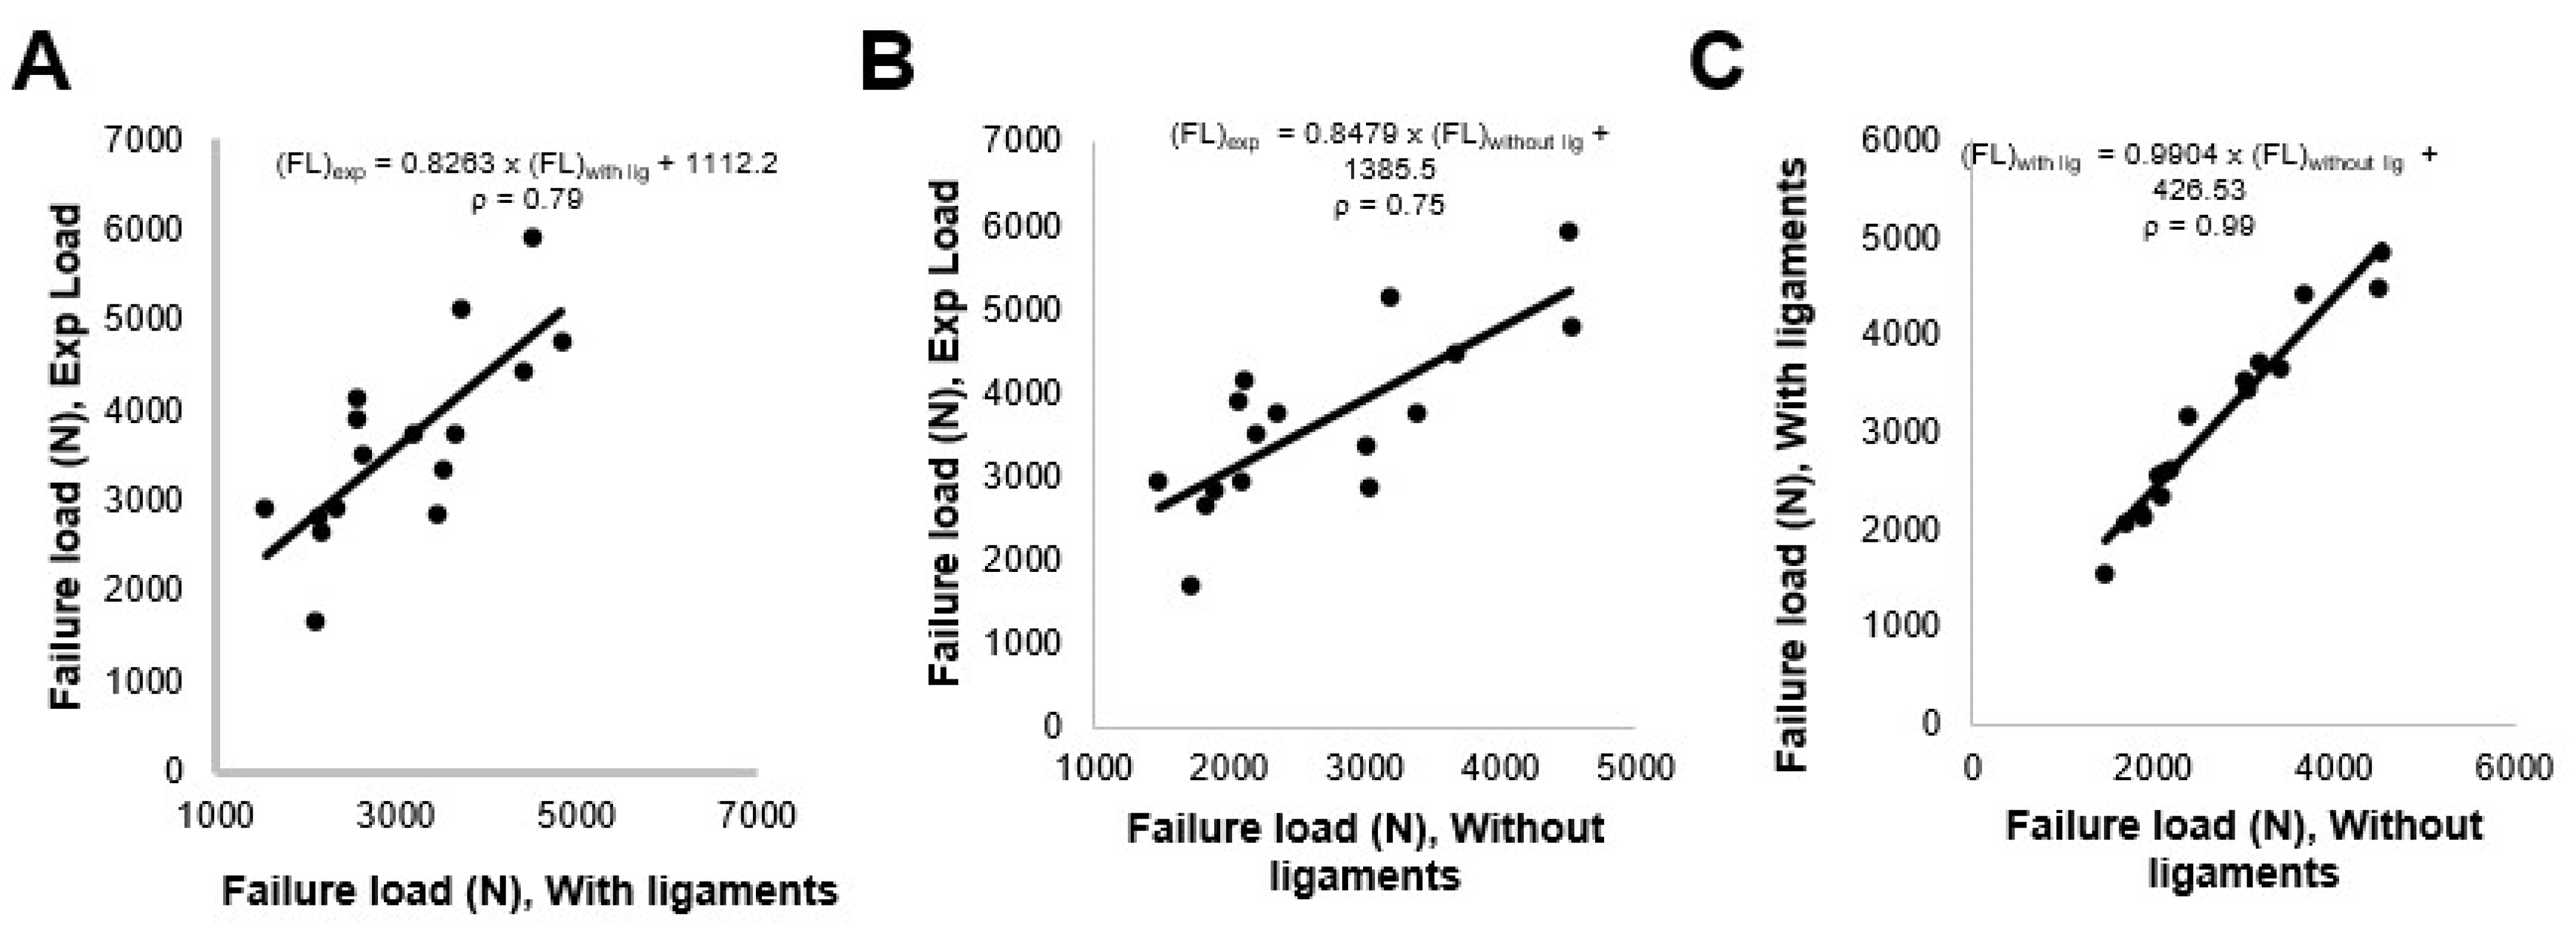
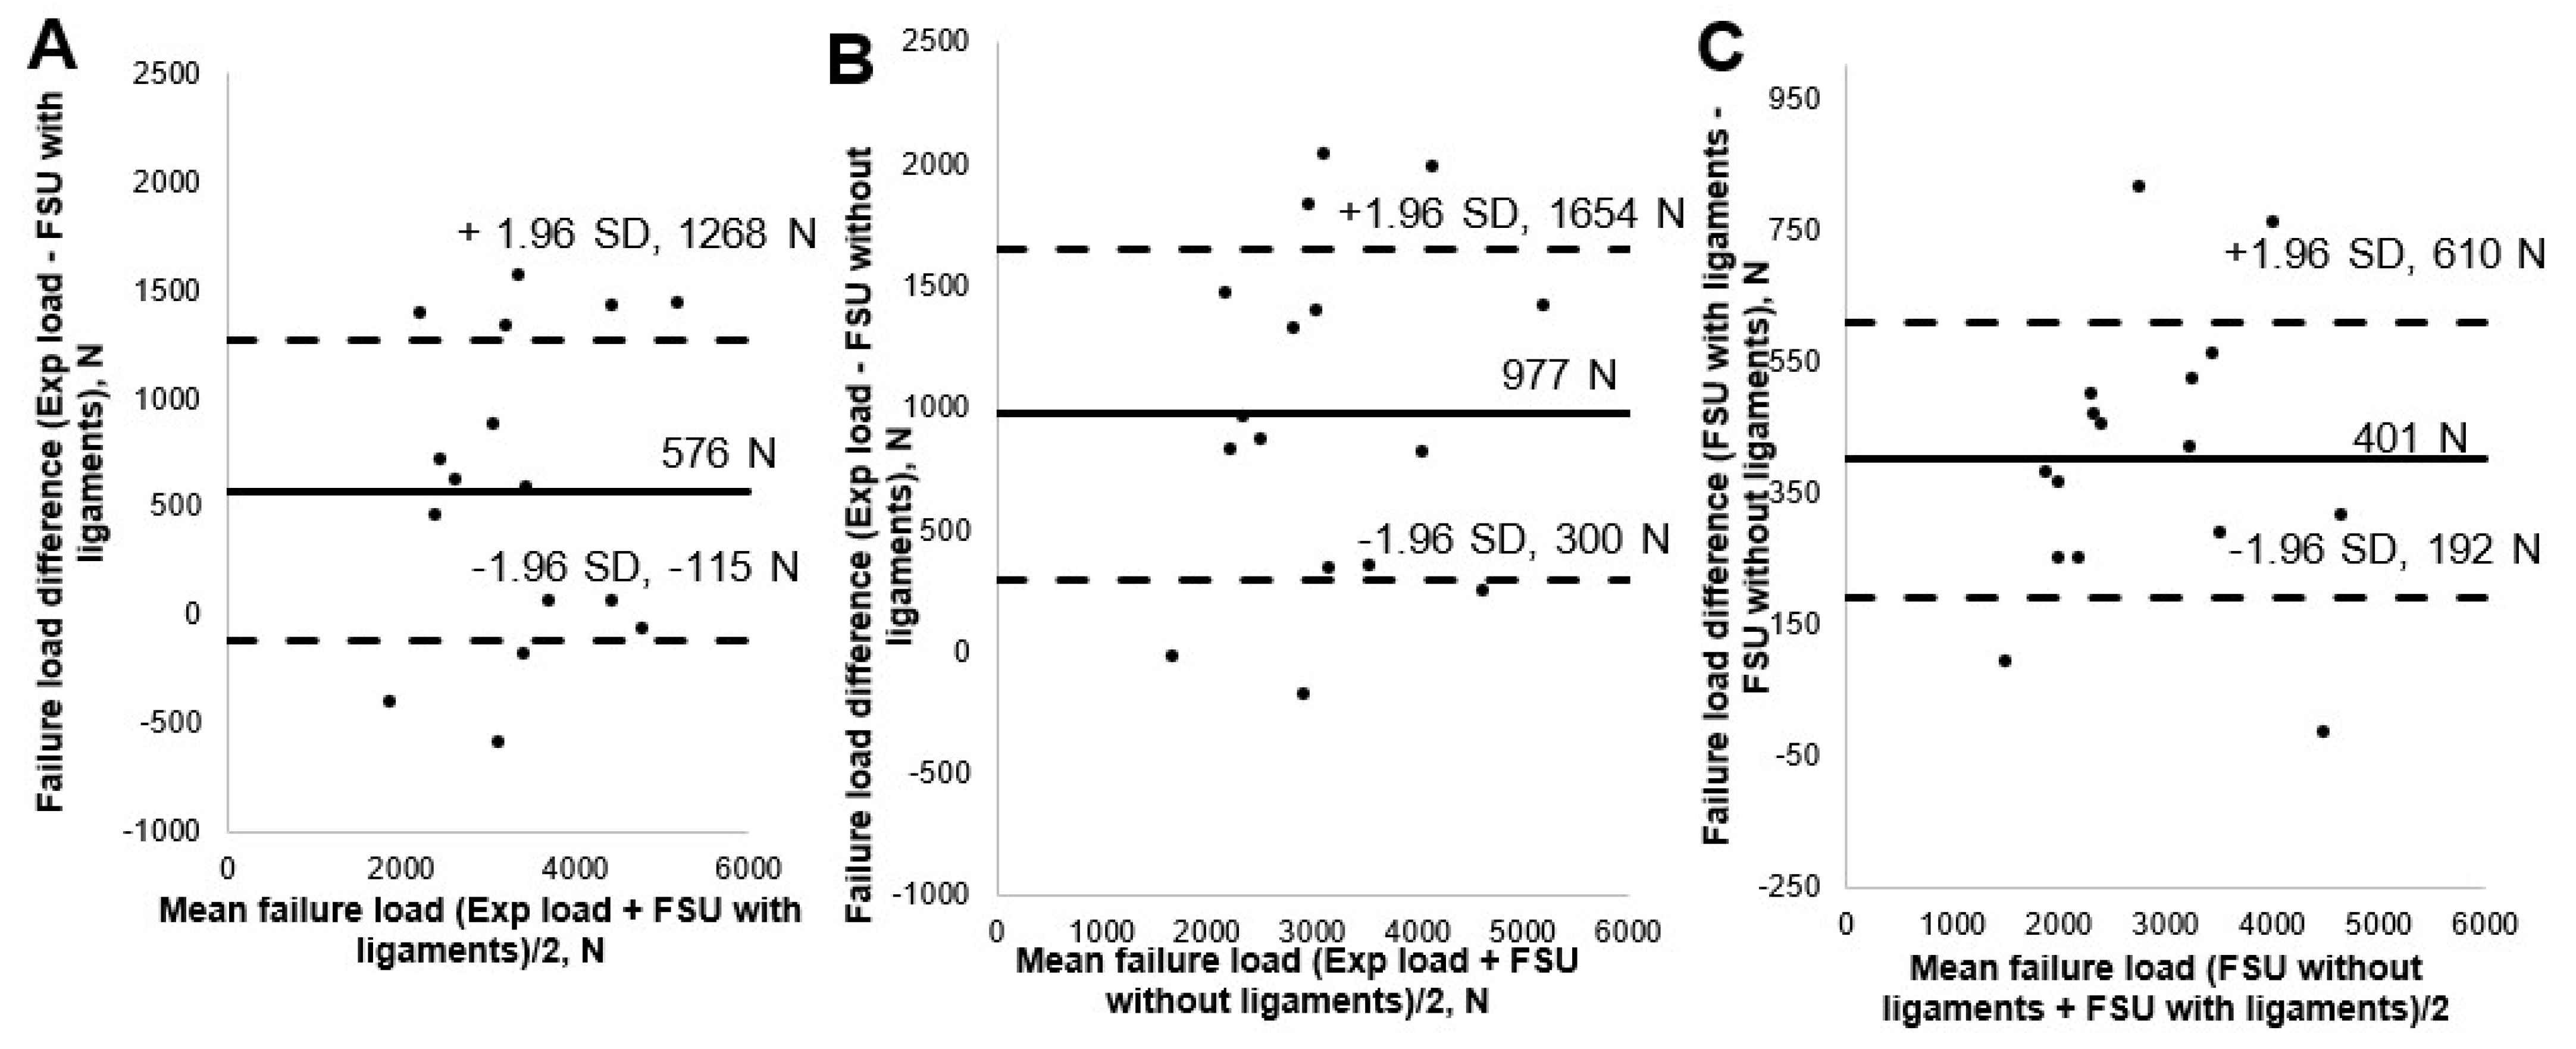
3.1. Comparison of FE-Predicted FSU Failure Load Values with Experimental Results
3.2. Comparison of FE-Predicted FSU Failure Load for Models with and without Ligaments
4. Discussion
5. Conclusions
Author Contributions
Funding
Institutional Review Board Statement
Informed Consent Statement
Data Availability Statement
Conflicts of Interest
Abbreviations
References
- Frost, B.A.; Camarero-Espinosa, S.; Johan Foster, E. Materials for the spine: Anatomy, problems, and solutions. Materials 2019, 12, 253. [Google Scholar] [CrossRef] [Green Version]
- Kulkarni, V.; Akula, M.; Larouche, J. Current Evaluation and Management of Vertebral Compression Fractures. Curr. Geriatr. Rep. 2018, 7, 288–295. [Google Scholar] [CrossRef]
- Adams, M.A.; Pollintine, P.; Tobias, J.H.; Wakley, G.K.; Dolan, P. Intervertebral disc degeneration can predispose to anterior vertebral fractures in the thoracolumbar spine. J. Bone Miner. Res. 2006, 21, 1409–1416. [Google Scholar] [CrossRef] [PubMed]
- Oner, C.; Rajasekaran, S.; Chapman, J.R.; Fehlings, M.G.; Vaccaro, A.R.; Schroeder, G.D.; Sadiqi, S.; Harrop, J. Spine Trauma-What Are the Current Controversies? J. Orthop. Trauma 2017, 31, 1–6. [Google Scholar] [CrossRef] [PubMed]
- Borgström, F.; Karlsson, L.; Ortsäter, G.; Norton, N.; Halbout, P.; Cooper, C.; Lorentzon, M.; McCloskey, E.V.; Harvey, N.C.; Javaid, M.K.; et al. Fragility fractures in Europe: Burden, management and opportunities. Arch. Osteoporos. 2020, 15. [Google Scholar] [CrossRef] [PubMed] [Green Version]
- Hernlund, E.; Svedbom, A.; Ivergård, M.; Compston, J.; Cooper, C.; Stenmark, J.; McCloskey, E.V.; Jönsson, B.; Kanis, J.A. Osteoporosis in the European Union: Medical management, epidemiology and economic burden: A report prepared in collaboration with the International Osteoporosis Foundation (IOF) and the European Federation of Pharmaceutical Industry Associations (EFPIA). Arch. Osteoporos. 2013, 8. [Google Scholar] [CrossRef] [PubMed] [Green Version]
- Faulkner, K.G. The tale of the T-score: Review and perspective. Osteoporos. Int. 2005, 16, 347–352. [Google Scholar] [CrossRef]
- Imai, K. Aging and Disease Analysis of Vertebral Bone Strength, Fracture Pattern, and Fracture Location: A Validation Study Using a Computed Tomography-Based Nonlinear Finite Element Analysis. Aging Dis. 2015, 6, 180–187. [Google Scholar] [CrossRef] [Green Version]
- Löffler, M.T.; Sollmann, N.; Mei, K.; Valentinitsch, A.; Noël, P.B.; Kirschke, J.S.; Baum, T. X-ray-based quantitative osteoporosis imaging at the spine. Osteoporos. Int. 2019, 1–18. [Google Scholar] [CrossRef] [PubMed]
- Schuit, S.C.E.; Van Der Klift, M.; Weel, A.E.A.M.; De Laet, C.E.D.H.; Burger, H.; Seeman, E.; Hofman, A.; Uitterlinden, A.G.; Van Leeuwen, J.P.T.M.; Pols, H.A.P. Fracture incidence and association with bone mineral density in elderly men and women: The Rotterdam Study. Bone 2004, 34, 195–202. [Google Scholar] [CrossRef]
- Kanis, J.A.; Johnell, O.; Oden, A.; Johansson, H.; McCloskey, E. FRAXTM and the assessment of fracture probability in men and women from the UK. Osteoporos. Int. 2008, 19, 385–397. [Google Scholar] [CrossRef] [Green Version]
- Engelke, K. Quantitative Computed Tomography—Current Status and New Developments. J. Clin. Densitom. 2017, 20, 1–13. [Google Scholar] [CrossRef] [PubMed]
- Baum, T.; Muller, D.; Dobritz, M.; Wolf, P.; Rummeny, E.J.; Link, T.M.; Bauer, J.S. Converted Lumbar BMD Values Derived from Sagittal Reformations of Contrast-Enhanced MDCT Predict Incidental Osteoporotic Vertebral Fractures. Calcif. Tissue Int 2012, 90, 481–487. [Google Scholar] [CrossRef] [PubMed]
- Keyak, J.H.; Keller, T.S. Predicting the compressive mechanical behavior of bone. J. Biomech. 1994, 27, 1159–1168. [Google Scholar] [CrossRef]
- Keyak, J.H. Improved prediction of proximal femoral fracture load using nonlinear finite element models. Med. Eng. Phys. 2001, 23, 165–173. [Google Scholar] [CrossRef]
- Lee, C.H.; Landham, P.R.; Eastell, R.; Adams, M.A.; Dolan, P.; Yang, L. Development and validation of a subject-specific finite element model of the functional spinal unit to predict vertebral strength. Proc. Inst. Mech. Eng. Part H J. Eng. Med. 2017, 231, 821–830. [Google Scholar] [CrossRef] [PubMed]
- Imai, K.; Ohnishi, I.; Matsumoto, T.; Yamamoto, S.; Nakamura, K. Assessment of vertebral fracture risk and therapeutic effects of alendronate in postmenopausal women using a quantitative computed tomography-based nonlinear finite element method. Osteoporos. Int. 2009, 20, 801–810. [Google Scholar] [CrossRef]
- Anitha, D.; Subburaj, K.; Kopp, F.K.; Mei, K.; Foehr, P.; Burgkart, R.; Sollmann, N.; Maegerlein, C.; Kirschke, J.S.; Noel, P.B.; et al. Effect of Statistically Iterative Image Reconstruction on Vertebral Bone Strength Prediction Using Bone Mineral Density and Finite Element Modeling: A Preliminary Study. J. Comput. Assist. Tomogr. 2019, 43, 61–65. [Google Scholar] [CrossRef] [PubMed]
- Allaire, B.T.; Lu, D.; Johannesdottir, F.; Kopperdahl, D.; Keaveny, T.M.; Jarraya, M.; Guermazi, A. Prediction of incident vertebral fracture using CT-based finite element analysis. Osteoporos. Int. 2018, 30, 323–331. [Google Scholar] [CrossRef] [PubMed]
- Rayudu, N.M.; Subburaj, K.; Mei, K.; Dieckmeyer, M.; Kirschke, J.S.; Noël, P.B.; Baum, T. Finite Element Analysis-Based Vertebral Bone Strength Prediction Using MDCT Data: How Low Can We Go? Front. Endocrinol. 2020, 11, 1–10. [Google Scholar] [CrossRef]
- Yeung, L.Y.; Rayudu, N.M.; Löffler, M.; Sekuboyina, A.; Burian, E.; Sollmann, N.; Dieckmeyer, M.; Greve, T.; Kirschke, J.S.; Subburaj, K.; et al. Prediction of Incidental Osteoporotic Fractures at Vertebral-Specific Level Using 3D Non-Linear Finite Element Parameters Derived from Routine Abdominal MDCT. Diagnostics 2021, 11, 208. [Google Scholar] [CrossRef] [PubMed]
- Anitha, D.P.; Baum, T.; Kirschke, J.S.; Subburaj, K. Effect of the intervertebral disc on vertebral bone strength prediction: A Finite-Element study. Spine J. 2019, 000, 1–7. [Google Scholar] [CrossRef]
- Groenen, K.H.J.; Bitter, T.; van Veluwen, T.C.G.; van der Linden, Y.M.; Verdonschot, N.; Tanck, E.; Janssen, D. Case-specific non-linear finite element models to predict failure behavior in two functional spinal units. J. Orthop. Res. 2018, 36, 3208–3218. [Google Scholar] [CrossRef] [Green Version]
- Xiao, Z.; Wang, L.; Gong, H.; Zhu, D.; Zhang, X. A non-linear finite element model of human L4-L5 lumbar spinal segment with three-dimensional solid element ligaments. Theor. Appl. Mech. Lett. 2011, 1, 064001. [Google Scholar] [CrossRef] [Green Version]
- Jahng, T.A.; Kim, Y.E.; Moon, K.Y. Comparison of the biomechanical effect of pedicle-based dynamic stabilization: A study using finite element analysis. Spine J. 2013, 13, 85–94. [Google Scholar] [CrossRef]
- Baum, T.; Gräbeldinger, M.; Räth, C.; Grande Garcia, E.; Burgkart, R.; Patsch, J.M.; Rummeny, E.J.; Link, T.M.; Bauer, J.S. Trabecular bone structure analysis of the spine using clinical MDCT: Can it predict vertebral bone strength? J. Bone Miner. Metab. 2014, 32, 56–64. [Google Scholar] [CrossRef]
- Anitha, D.; Thomas, B.; Jan, K.S.; Subburaj, K. Risk of vertebral compression fractures in multiple myeloma patients: A finite-element study. Medicine 2017, 96. [Google Scholar] [CrossRef] [PubMed]
- O’Connell, G.D.; Vresilovic, E.J.; Elliott, D.M. Comparison of animals used in disc research to human lumbar disc geometry. Spine 2007, 32, 328–333. [Google Scholar] [CrossRef] [PubMed]
- Rho, J.Y.; Hobatho, M.C.; Ashman, R.B. Relations of mechanical properties to density and CT numbers in human bone. Med. Eng. Phys. 1995, 17, 347–355. [Google Scholar] [CrossRef]
- Goulet, R.W.; Goldstein, S.A.; Ciarelli, M.J.; Kuhn, J.L.; Brown, M.B.; Feldkamp, L.A. The relationship between the structural and orthogonal compressive properties of trabecular bone. J. Biomech. 1994, 27. [Google Scholar] [CrossRef] [Green Version]
- Morgan, E.F.; Bayraktar, H.H.; Keaveny, T.M. Trabecular bone modulus-density relationships depend on anatomic site. J. Biomech. 2003, 36, 897–904. [Google Scholar] [CrossRef]
- Crawford, R.P.; Cann, C.E.; Keaveny, T.M. Finite element models predict in vitro vertebral body compressive strength better than quantitative computed tomography. Bone 2003, 33, 744–750. [Google Scholar] [CrossRef]
- Sivasankari, S.; Balasubramanian, V. Influence of occupant collision state parameters on the lumbar spinal injury during frontal crash. J. Adv. Res. 2021, 28, 17–26. [Google Scholar] [CrossRef] [PubMed]
- Ayturk, U.M.; Puttlitz, C.M. Parametric convergence sensitivity and validation of a finite element model of the human lumbar spine. Comput. Methods Biomech. Biomed. Engin. 2011, 14, 695–705. [Google Scholar] [CrossRef] [PubMed]
- Lv, Q.B.; Gao, X.; Pan, X.X.; Jin, H.M.; Lou, X.T.; Li, S.M.; Yan, Y.Z.; Wu, C.C.; Lin, Y.; Ni, W.F.; et al. Biomechanical properties of novel transpedicular transdiscal screw fixation with interbody arthrodesis technique in lumbar spine: A finite element study. J. Orthop. Transl. 2018, 15, 50–58. [Google Scholar] [CrossRef] [PubMed]
- Khoz, Z.; Nikkhoo, M.; Cheng, C. Parametric Patient-Specific Finite Element Modeling of Lumbar Spine Based on Anatomical Parameters. Iran. J. Orthop. Surg. 2018, 16, 195–203. [Google Scholar]
- Li, J.; Shang, J.; Zhou, Y.; Li, C.; Liu, H. Finite element analysis of a new pedicle screw-plate system for minimally invasive transforaminal lumbar interbody fusion. PLoS ONE 2015, 10, 1–16. [Google Scholar] [CrossRef] [PubMed]
- Anitha, D.; Mei, K.; Dieckmeyer, M.; Kopp, F.K.; Sollmann, N.; Zimmer, C.; Kirschke, J.S.; Noel, P.B.; Baum, T.; Subburaj, K. MDCT-based Finite Element Analysis of Vertebral Fracture Risk: What Dose is Needed? Clin. Neuroradiol. 2019, 29, 645–651. [Google Scholar] [CrossRef] [PubMed]
- Anitha, D.; Subburaj, K.; Mei, K.; Kopp, F.K.; Foehr, P.; Noel, P.B.; Kirschke, J.S.; Baum, T. Effects of dose reduction on bone strength prediction using finite element analysis. Sci. Rep. 2016, 6, 1–9. [Google Scholar] [CrossRef] [PubMed] [Green Version]
- Dall’Ara, E.; Pahr, D.; Varga, P.; Kainberger, F.; Zysset, P. QCT-based finite element models predict human vertebral strength in vitro significantly better than simulated DEXA. Osteoporos. Int. 2012, 23, 563–572. [Google Scholar] [CrossRef]
- Bland, J.M.; Altman, D.G. Measuring agreement in method comparison studies. Stat. Methods Med. Res. 1999, 8, 135–160. [Google Scholar] [CrossRef] [PubMed]
- Kopperdahl, D.L.; Aspelund, T.; Hoffmann, P.F.; Sigurdsson, S.; Siggeirsdottir, K.; Harris, T.B.; Gudnason, V.; Keaveny, T.M. Assessment of incident spine and hip fractures in women and men using finite element analysis of CT scans. J. Bone Miner. Res. 2014, 29, 570–580. [Google Scholar] [CrossRef] [PubMed]
- Trajkovski, A.; Hribernik, M.; Kunc, R.; Kranjec, M.; Krašna, S. Analysis of the mechanical response of damaged human cervical spine ligaments. Clin. Biomech. 2020, 75. [Google Scholar] [CrossRef] [PubMed]
- Park, W.M.; Kim, C.H.; Kim, Y.H.; Chung, C.K.; Jahng, T.A. The change of sagittal alignment of the lumbar spine after dynesys stabilization and proposal of a refinement. J. Korean Neurosurg. Soc. 2015, 58, 43–49. [Google Scholar] [CrossRef] [PubMed]
- Zhong, Z.C.; Wei, S.H.; Wang, J.P.; Feng, C.K.; Chen, C.S.; Yu, C.H. Finite element analysis of the lumbar spine with a new cage using a topology optimization method. Med. Eng. Phys. 2006, 28, 90–98. [Google Scholar] [CrossRef]


| Property | Mapping Relations |
|---|---|
| Vertebrae Material Properties | |
| Apparent density (ρapp in Kg/m3) [29] | ρapp = 47 + 1.122 * HU |
| Ash density (ρash in Kg/m3) [30] | ρash = 0.6 * ρapp |
| Modulus of elasticity (E in MPa) [29,31] | Ez = 4730 * (ρapp)1.56 Ex = Ey = 0.333 Ez Z- axial direction of the vertebra |
| Shear modulus (G in MPa) [32] | Gxy = 0.121 Ez Gxz = Gyz = 0.157 Ez |
| Poisson ratio (V) [32] | Vxy = 0.381 Vxz = Vyz = 0.104 |
| Maximum principal stress limit (σ in MPa) [14] | σ = 137 * ρash 1.88, ρash < 0.317 σ = 114 * ρash 1.72, ρash > 0.317 |
| Plastic strain (εAB) [15] | εAB = -0.00315 + 0.0728 ρash |
| Minimum principal stress limit (σmin in MPa) [15] | σmin = 65.1 * ρash 1.93 |
| Intervertebral Disc Properties | |
| Annulus | |
| Elastic modulus (E in MPa) [16] | E = 500 |
| Poisson ratio (V) [16] | 0.3 |
| Density (ton/mm3) [33] | 1.2 × 10⁻⁹ |
| Nucleus | |
| Elastic modulus (E in MPa) [34] | E = 1 |
| Poisson ratio (V) [34] | 0.49 |
| Density (ton/mm3) [33] | 1 × 10⁻⁹ |
| Endplate | |
| Elastic modulus (E in MPa) [35] | 1000 |
| Poisson ratio (V) [35] | 0.3 |
| Density (ton/mm3) [33] | 1 × 10⁻⁹ |
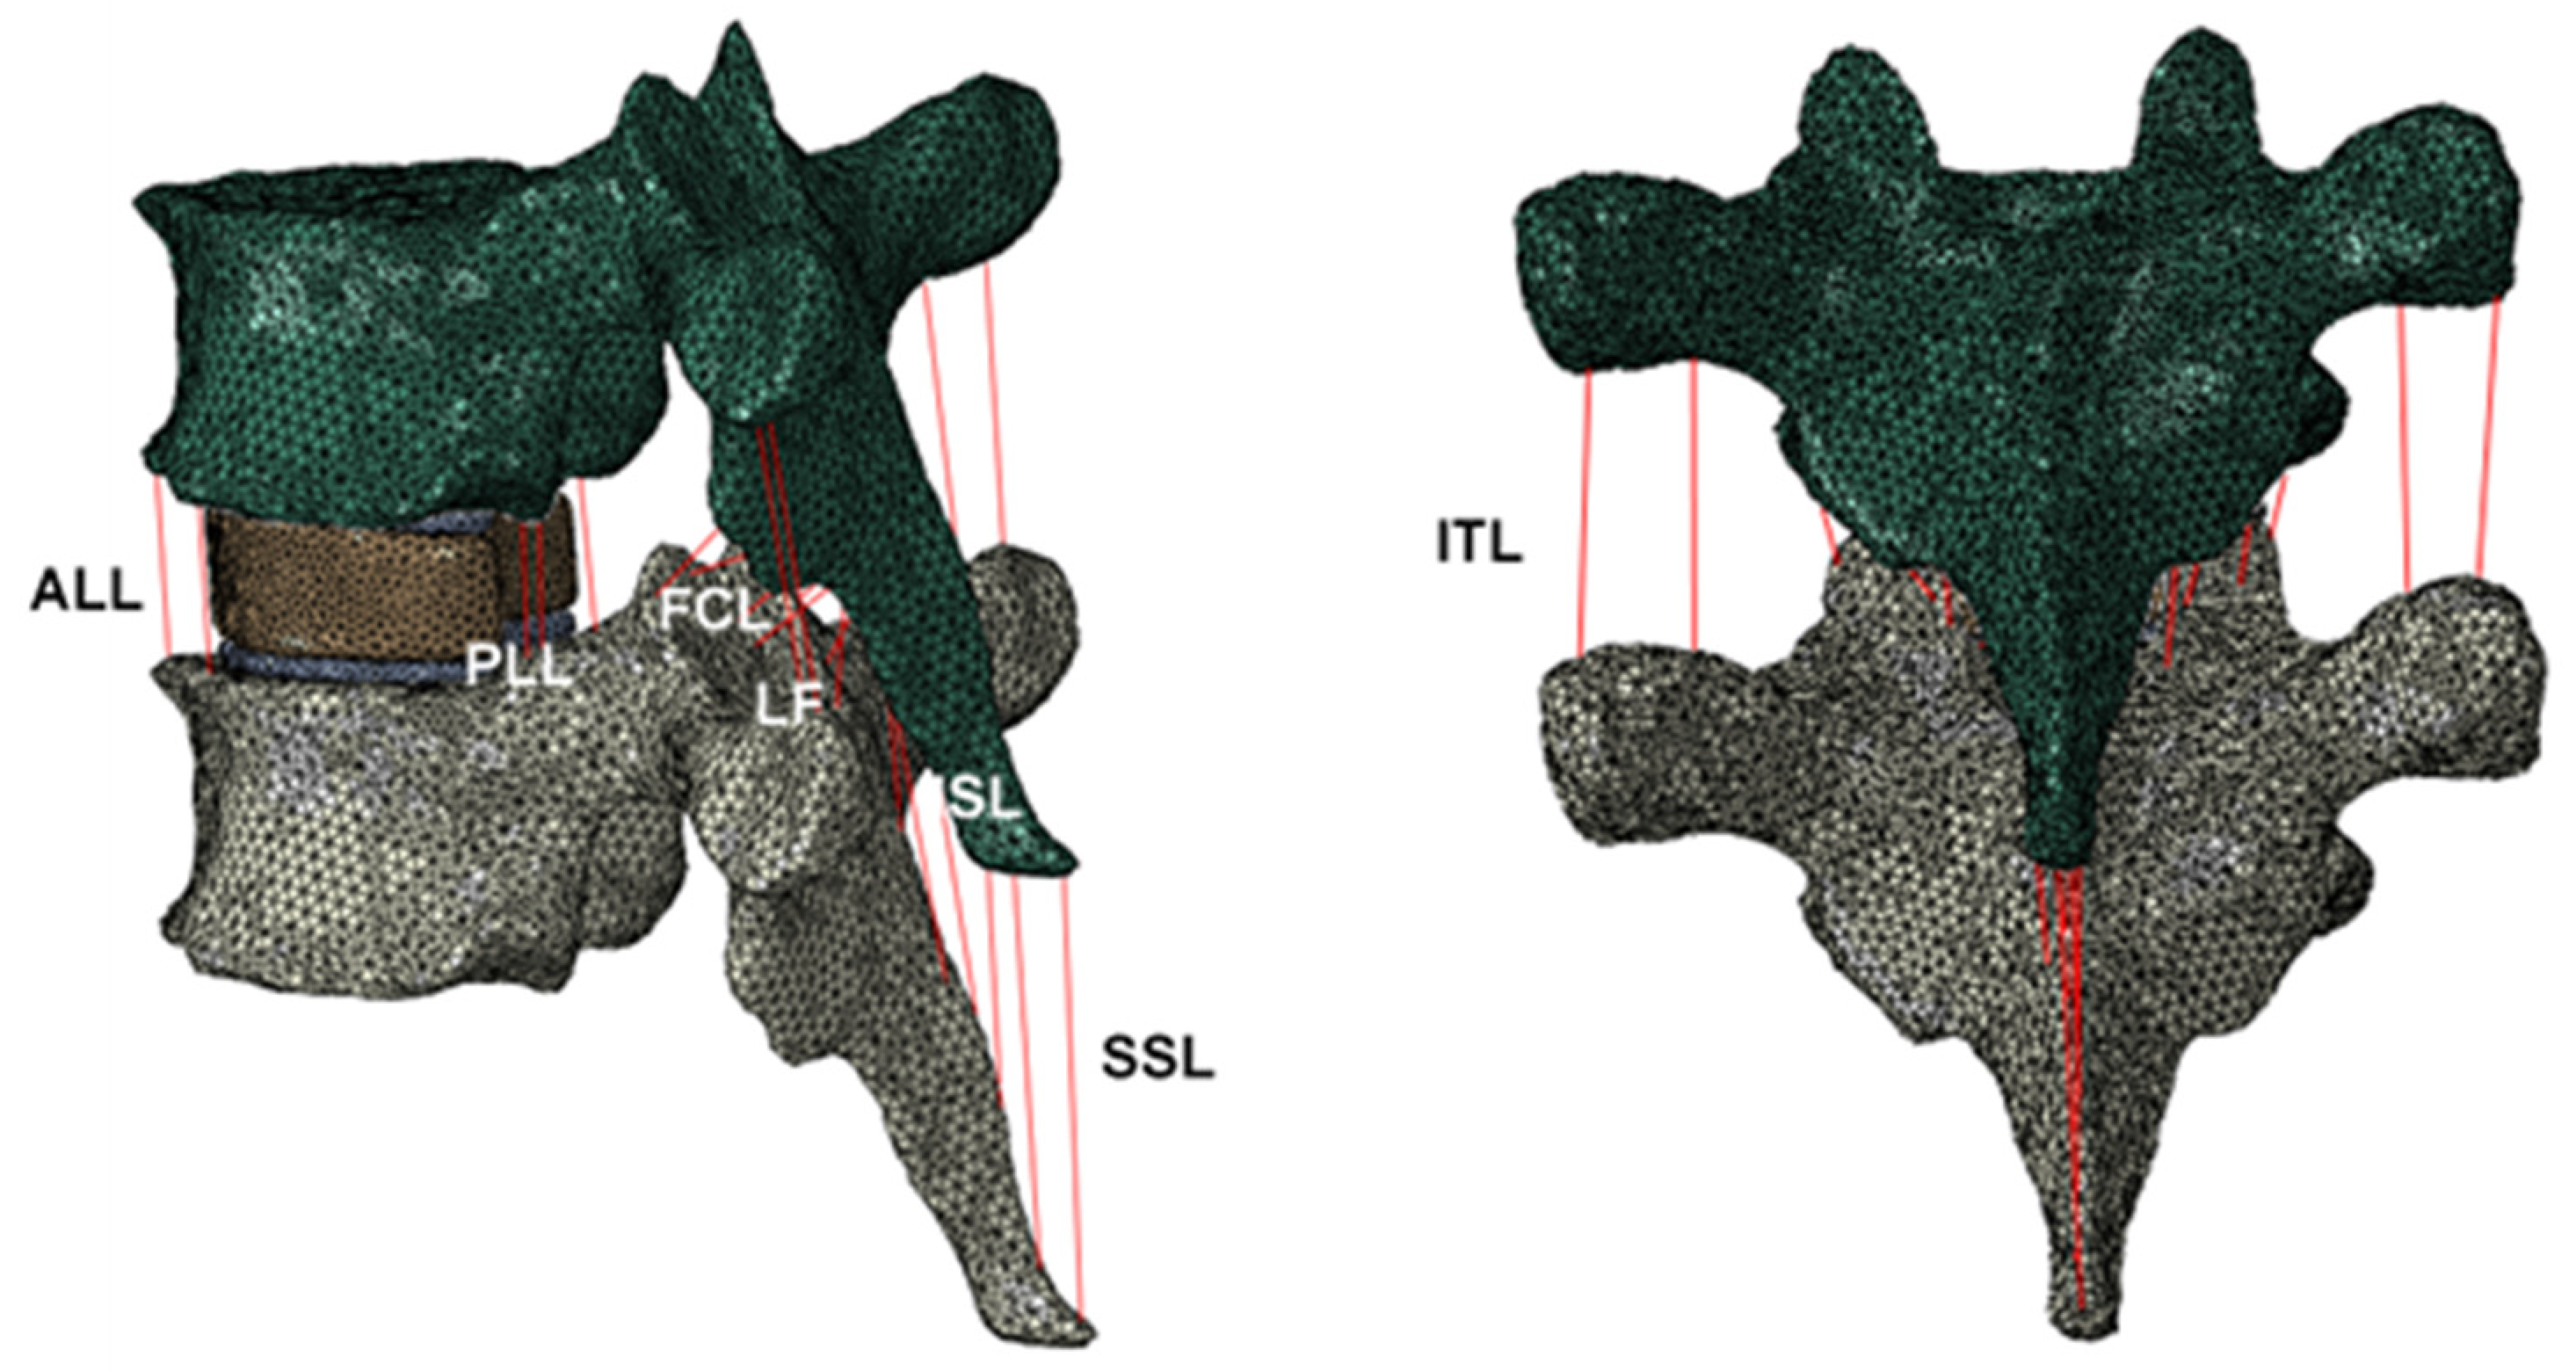
| Name of the Ligament | Density (ton/mm3) | Youngs Modulus (MPa) | Poisson’s Ratio | Cicrcular Cross-Sectional Area (mm2) | Number of Ligaments |
|---|---|---|---|---|---|
| ALL | 1 × 10⁻⁹ | 55.77 | 0.4 | 32.4 | 3 |
| PLL | 1 × 10⁻⁹ | 54.43 | 0.4 | 05.2 | 3 |
| LF | 1 × 10⁻⁹ | 03.25 | 0.4 | 84.2 | 3 |
| ISL | 1 × 10⁻⁹ | 02.23 | 0.4 | 35.1 | 4 |
| SSL | 1 × 10⁻⁹ | 12.80 | 0.4 | 25.2 | 2 |
| ITL | 1 × 10⁻⁹ | 11.50 | 0.4 | 12.0 | 4 |
| FCL | 1 × 10⁻⁹ | 08.69 | 0.4 | 43.8 | 6 |
Publisher’s Note: MDPI stays neutral with regard to jurisdictional claims in published maps and institutional affiliations. |
© 2021 by the authors. Licensee MDPI, Basel, Switzerland. This article is an open access article distributed under the terms and conditions of the Creative Commons Attribution (CC BY) license (https://creativecommons.org/licenses/by/4.0/).
Share and Cite
Rayudu, N.M.; Baum, T.; Kirschke, J.S.; Subburaj, K. MDCT-Based Finite Element Analysis for the Prediction of Functional Spine Unit Strength—An In Vitro Study. Materials 2021, 14, 5791. https://0-doi-org.brum.beds.ac.uk/10.3390/ma14195791
Rayudu NM, Baum T, Kirschke JS, Subburaj K. MDCT-Based Finite Element Analysis for the Prediction of Functional Spine Unit Strength—An In Vitro Study. Materials. 2021; 14(19):5791. https://0-doi-org.brum.beds.ac.uk/10.3390/ma14195791
Chicago/Turabian StyleRayudu, Nithin Manohar, Thomas Baum, Jan S. Kirschke, and Karupppasamy Subburaj. 2021. "MDCT-Based Finite Element Analysis for the Prediction of Functional Spine Unit Strength—An In Vitro Study" Materials 14, no. 19: 5791. https://0-doi-org.brum.beds.ac.uk/10.3390/ma14195791