Removal of Siloxanes from Model Biogas by Means of Deep Eutectic Solvents in Absorption Process


Department of Process Engineering and Chemical Technology, Faculty of Chemistry, Gdansk University of Technology, G. Narutowicza St. 11/12, 80-233 Gdańsk, Poland
*
Author to whom correspondence should be addressed.
Materials 2021, 14(2), 241; https://0-doi-org.brum.beds.ac.uk/10.3390/ma14020241
Submission received: 11 December 2020
/
Revised: 30 December 2020
/
Accepted: 31 December 2020
/
Published: 6 January 2021
(This article belongs to the Special Issue Advances and Applications in Deep Eutectic Solvents Technology)
Abstract
:The paper presents the screening of 20 deep eutectic solvents (DESs) composed of tetrapropylammonium bromide (TPABr) and glycols in various molar ratios, and 6 conventional solvents as absorbents for removal of siloxanes from model biogas stream. The screening was achieved using the conductor-like screening model for real solvents (COSMO-RS) based on the comparison of siloxane solubility in DESs. For the DES which was characterized by the highest solubility of siloxanes, studies of physicochemical properties, i.e., viscosity, density, and melting point, were performed. DES composed of tetrapropylammonium bromide (TPABr) and tetraethylene glycol (TEG) in a 1:3 molar ratio was used as an absorbent in experimental studies in which several parameters were optimized, i.e., the temperature, absorbent volume, and model biogas flow rate. The mechanism of siloxanes removal was evaluated by means of an experimental FT-IR analysis as well as by theoretical studies based on σ-profile and σ-potential. On the basis of the obtained results, it can be concluded that TPABr:TEG (1:3) is a very effective absorption solvent for the removal of siloxanes from model biogas, and the main driving force of the absorption process is the formation of the hydrogen bonds between DES and siloxanes.
1. Introduction
The production of energy from renewable sources is not only a choice resulting from the policy of environmental protection or care of the environment but is also an obligation imposed by the European Union in the form of numerous ordinances and international agreements [1]. Therefore, more and more EU countries are focusing their attention on managing waste materials from various industries for the production of biogas [2,3,4,5]. This approach is consistent with the theory of sustainable development. However, the obtained biogas is usually a multicomponent mixture containing both inorganic and organic substances, i.e., methane (30–60% v/v), carbon dioxide (15–30% v/v), water, ammonia, hydrogen sulfide, organosulfur compounds, siloxanes, and other linear and aromatic volatile organic compounds (VOCs) [6,7].
The chemical composition of the waste biogas changes depending on the type of raw materials used in the dark fermentation process. The presence of gaseous substances other than methane causes many technological and environmental problems. Particularly dangerous pollutants include siloxane compounds, which can appear in the biogas from municipal landfills or wastewater treatment plants [8,9]. During the combustion of such types of biogas, silicone may be released and combined with oxygen. This can lead to the formation of silica deposits. The silica deposits can cause abrasion of engine parts or the formation of layers that inhibit thermal conductivity or lubrication and clogged transmission lines [10]. Therefore, in order to eliminate the failure of engines converting biogas into energy and to meet the quality requirements for fuels, raw biogas must undergo several treatment processes. The oldest and most widely used process for the treatment of gaseous streams is the application of water or amine scrubbers [11,12]. However, most siloxanes are hydrophobic, and only some of them, i.e., trimethylsilanol, can be absorbed with water because of their high solubility therein [13,14]. Amine scrubbers do not show satisfactory efficiency of siloxane removal either. Among the effective absorbents, there are mineral oils, mixtures of glycols, or inorganic acids [15,16,17,18]. Although the abovementioned absorption methods allow for the recovery of solvents, these methods have a significant disadvantage, which is their energy consumption resulting from the large amount of energy needed to regenerate the absorbent. Therefore, in recent years, more and more scientific research has been devoted to the search for new “green solvents” that will have higher purification efficiency of biogas streams with a simultaneous lower energy demand during regeneration [19].
In the last few years, ionic liquids (ILs) have attracted a lot of attention because they belong to the class of new solvents with a high affinity for CO2 and a wide range of VOCs [20,21] In addition, ILs have a lower degradation rate, a lower energy requirement for solvent regeneration, and lower corrosive characteristics compared to conventional amine-based solvents [22]. The main disadvantages of ILs are their high viscosity, very high prices, and toxic character. Therefore, deep eutectic solvents (DESs) are a good alternative to ILs because they are much cheaper, less toxic, and more biodegradable [23]. These advantageous properties have made DESs widely used in various separation processes such as extraction [24,25,26,27], absorption [28,29,30,31,32,33], or adsorption [34]. So far, DES has not been used for the experimental removal of siloxanes from biogas. Only theoretical studies can be found in the literature [35].
The study presents screening of twenty-five deep eutectic solvents composed of tetrapropylammonium bromide (TPABr) as hydrogen bond acceptor (HBA) and glycols as hydrogen bond donors (HBDs) in various molar ratio as absorbents for removal of siloxanes from model biogas stream. For this proposal, the conductor-like screening model for real solvents (COSMO-RS) was used. The selection of DESs with the highest siloxane capacity potential was made on the basis of the calculated solubility. For DES (TPABr:TEG 1:3), which was characterized by the highest solubility of siloxanes, the study of its physicochemical properties, i.e., viscosity, density, and the melting point, was performed. Further on, optimization studies of the main parameters influencing the absorption processes were carried out. The mechanism of siloxane removal was evaluated by means of an experimental FT-IR analysis as well as theoretical studies based on σ-profile and σ-potential. To the best of our knowledge, this is the first study dedicated to the application of DES for experimental removal of siloxanes from the gas steams.
2. Materials and Methods
2.1. Materials
The following pure substances were used in this study: tetrapropylammonium bromide (TPABr) (purity ≥ 99.0%), tetraethylene glycol (TEG) (purity 99%), hexamethyldisiloxane (L2) (purity 98.5%), octamethyltrisiloxane (L3) (purity 98.5%), and octametylocyclotetrasiloxane (D4) (purity 98%) were purchased from Sigma Aldrich (St. Louis, MO, USA).
For the preparation of model biogas, compressed gases such as nitrogen (purity N 5.5) and methane (purity N 5.0) (Linde Gas, Łódź, Poland) were used. Additionally, for the GC analysis, compressed gases such as nitrogen (purity N 5.5), air (purity N 5.0) generated by a DK50 compressor with a membrane dryer (Ekkom, Cracow, Poland), and hydrogen (purity N 5.5) generated by a 9400 Hydrogen Generator (Packard, Detroit, MI, USA) were used.
2.2. Apparatus
The purification process was controlled by gas chromatography (Autosystem XL) (PerkinElmer, Waltham, MA, USA) coupled with a flame ionization detector (FID) (PerkinElmer, Waltham, MA, USA) and an HP-5 (30 m × 0.25 mm × 0.25 μm) capillary column (Agilent Technologies, Santa Clara, CA, USA). In the investigations, the TurboChrom 6.1 software (PerkinElmer, Waltham, MA, USA), was used.
The following apparatus was used to evaluate the physicochemical properties: Bruker Tensor 27 spectrometer (Bruker, Billerica, MA, USA) with an ATR accessory and OPUS software (Bruker); BROOKFIELD LVDV-II + viscometer (Labo-Plus, Warsaw, Poland); DMA 4500 M (Anton Paar, Graz, Austria).
2.3. Procedures
2.3.1. COSMO-RS Studies
The geometry optimization of TPABr:TEG (1:3) was performed by means of the continuum solvation COSMO model at the BVP86/TZVP level of theory. The level of theory was used based on previous studies [35,36]. Multiple starting geometries of TPABr:TEG (1:3) were created and optimized in the gas phase to identify stable conformers. In the next step, the vibrational analysis was conducted to find the DES conformer correspond to the true energy minimum. Full geometry optimization was performed only for the most energetically favorable conformer.
In the studies, the COSMO-RS model was used for the screening of DESs using ADF COSMO-RS software (SCM, Netherlands). The relative solubility of siloxanes (xj) in DESs were calculated using Equation (1):
where: —chemical potential of pure siloxanes (J/mol); —chemical potential of siloxanes at infinite dilution (J/mol); —fusion free energy of siloxanes (J/mol); R—universal gas constant = 8.314 (J/mol·K); T—temperature (K) [37,38,39].
2.3.2. Preparation of DES
The deep eutectic solvent was successfully synthesized by mixing TPABr and TEG in 1:3 molar ratio, on a magnetic stirrer under 800 rpm, at 80 °C. All components were dried in a vacuum oven before mixing. The mixing process was carried out for half an hour. The resulting liquid DES was left cooling to room temperature (RT).
2.3.3. Preparation of Model Impurities and Biogas
The model impurities were prepared by means of the barbotage process. Pure nitrogen was moved through a vial containing 1 mL of each siloxane. The obtained model impurities were diluted with a nitrogen stream to acquire a suitable concentration of siloxanes (50 mg/dm3). This is the upper limit of the range of siloxane concentrations which can be identified in biogas [40].
The model biogas stream was prepared in two options. The first with the use of pure nitrogen, and the second with the use of a mixture of nitrogen and methane gases in the volume ratio of 2:1.
2.3.4. Absorption Process
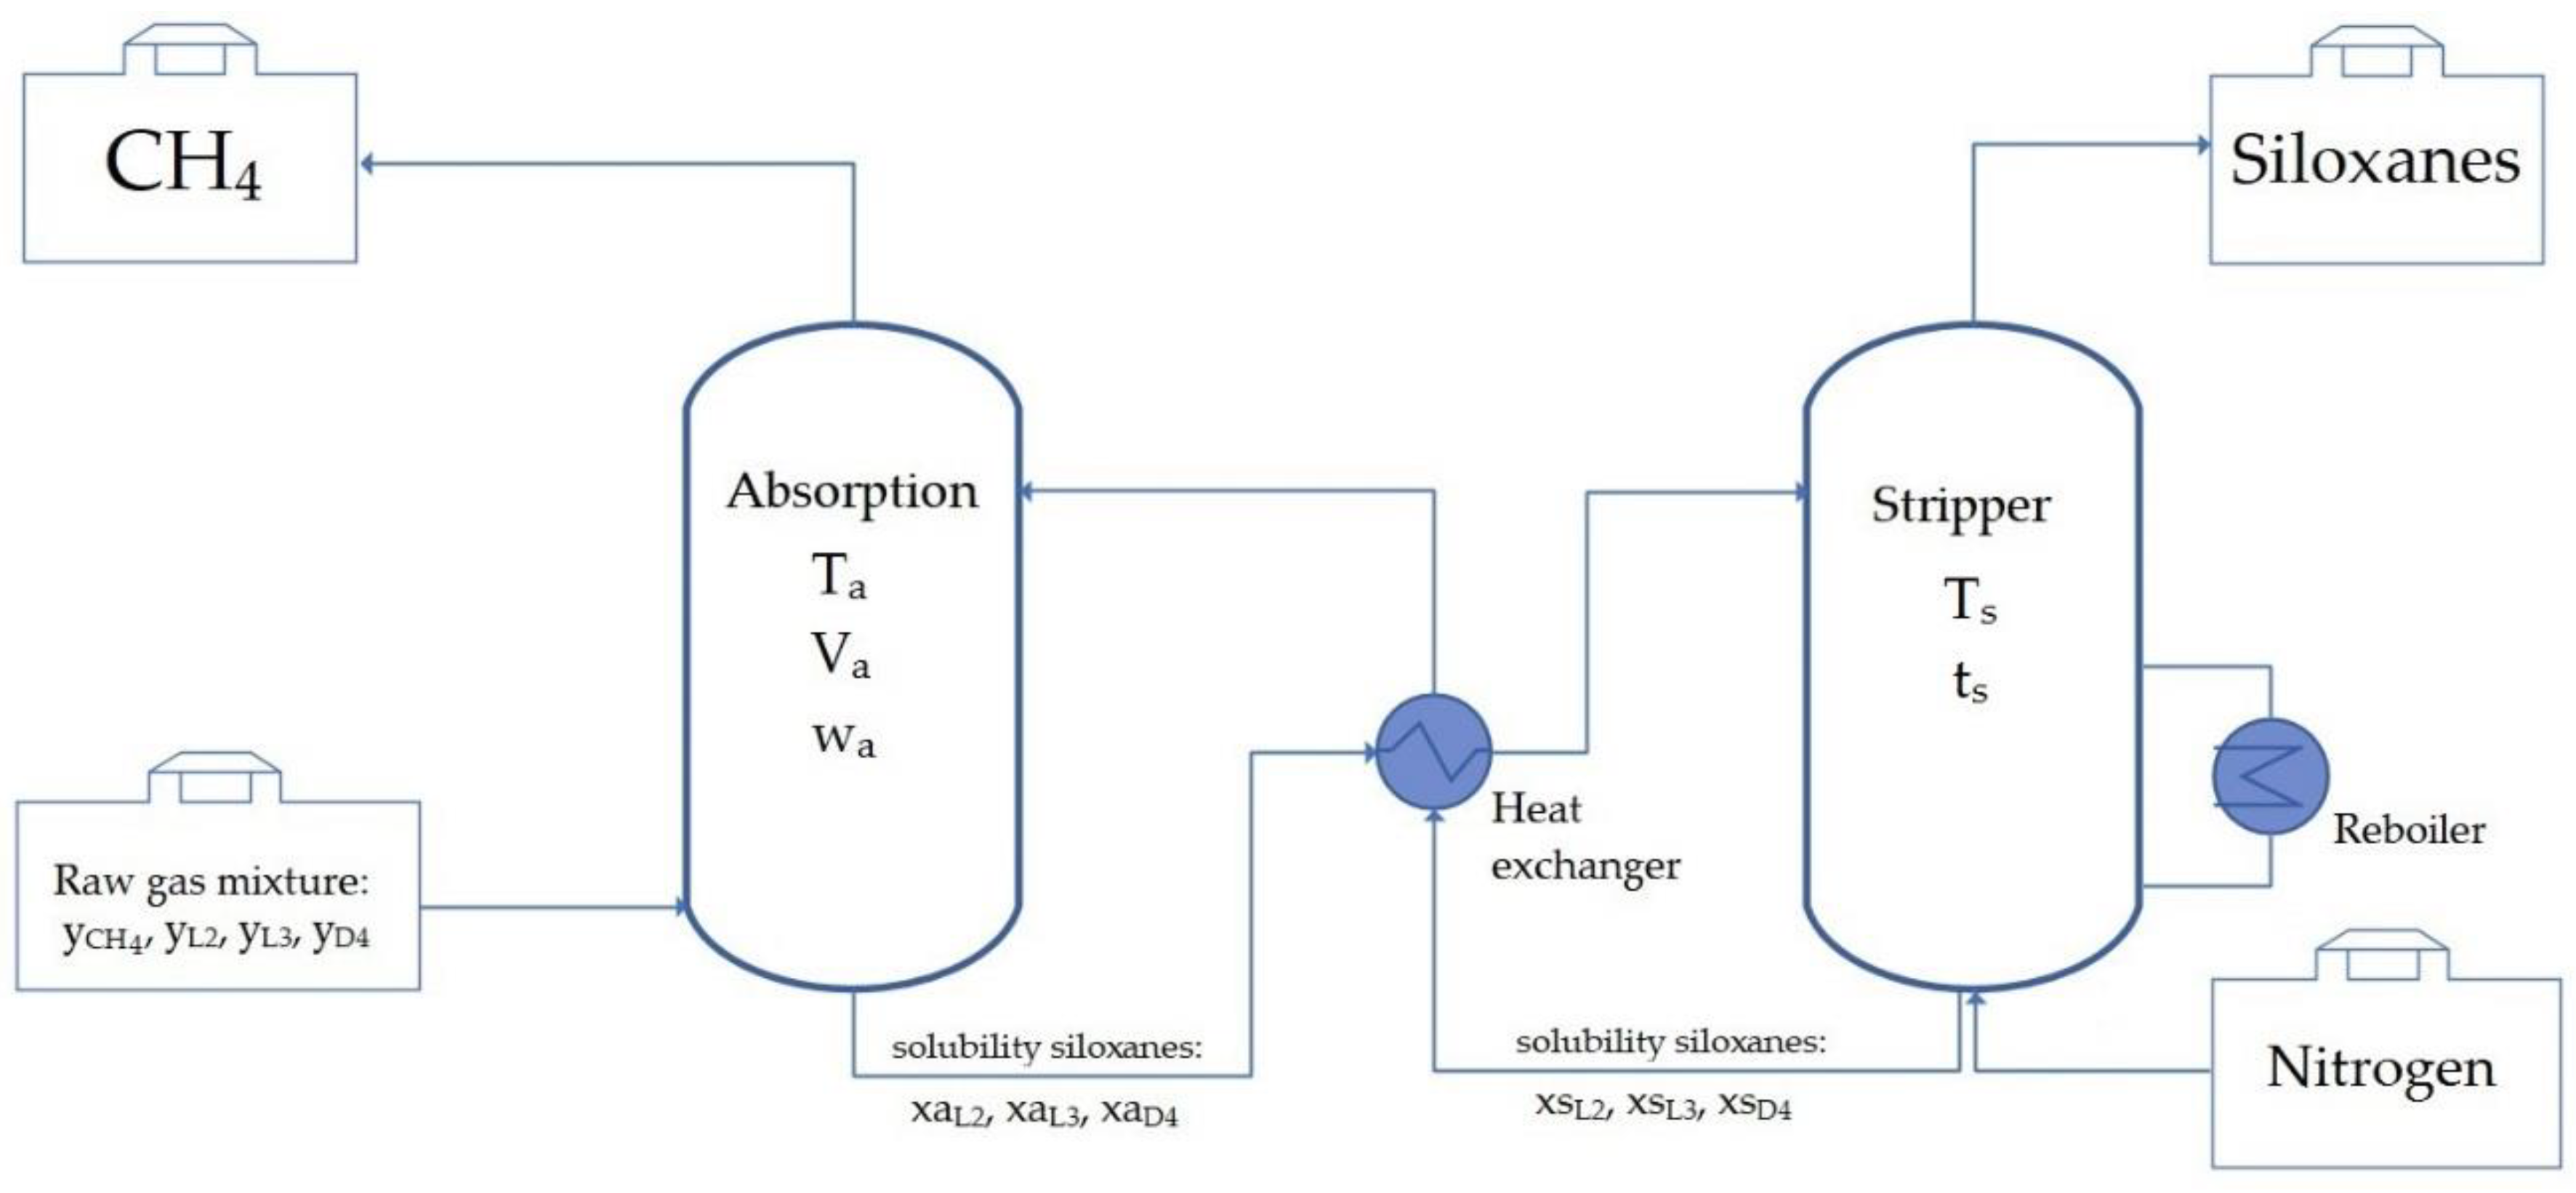
The installation to separate the siloxanes consists of an absorption column, a stripper column, a heat exchanger, and a reboiler. Figure 1 shows the process of the absorption–desorption course of siloxanes using TPABr:TEG (1:3). The model polluted biogas stream containing a certain amount of methane and siloxanes is fed into the absorption column. The absorption process takes place under certain conditions maintained in the column (temperature of the process—Ta, the volume of DES—Va, flow rate of the biogas stream—wa). Pure methane from the top of the absorption column is collected. The next step in the entire process is desorbing the siloxanes from DES. For this purpose, the contaminated DES is directed into the stripper column which works in specific conditions (temperature of the stripper process—Ts, time of the stripper process—ts). Owing to regeneration, it is possible to reuse DES, which has a major impact on the economics of the process.
The absorptivity (A) of siloxanes in the TPABr:TEG (1:3) was calculated using Equation (2):
where —initial siloxanes concentration (mg/dm3), —siloxanes concentration after absorption process (mg/dm3).
2.3.5. Regeneration of DES
Following the selective absorption process of siloxanes, TPABr:TEG (1:3) was regenerated using nitrogen barbotage at an elevated temperature (80–100 °C). The regeneration process was carried out conducted in line with previous studies [24]. The regeneration experiments were conducted at 90 °C with an N2 flow of 50 mL/min. The concentration of L2, L3, and D4 (before and after regeneration) in TPABr:TEG (1:3) was studied by means of gas chromatography.
2.3.6. Chromatographic Analysis
The degree and efficiency of the model biogas treatment were determined by gas chromatography coupled with a flame-ionization detector (GC-FID) (PerkinElmer, Waltham, MA, USA). The temperature of the GC oven was 120 °C, the detector temperature was 300 °C, the injection port temperature was 300 °C, the injection mode was split 5:1, and the carrier gas was nitrogen (2 mL/min).
2.3.7. Physicochemical Properties of DES
FT-IR Analysis
FT-IR spectra were taken using attenuated total reflectance (ATR) with the following operating parameters: number of background scans: 256, number of sample scans: 256; spectral range: 4000–550 cm−1; resolution: 4 cm−1; and slit width: 0.5 cm.
Viscosity and Density Measurements
The viscosity and density of the synthesized TPABr:TEG (1:3) were measured within a temperature range of 25–60 °C. The uncertainty measurement for the temperature was 0.5 °C. Additionally, the relationship between the viscosity and revolutions per minute abbreviated (RPM) in the temperature range 25–60 °C was determined.
Melting Point Measurements
The melting point (MP) was determined visually at atmospheric pressure by cooling DES samples to −50 °C, followed by a temperature increase at 0.1 °C/min. The temperature at which the initiation of the phase transformation was observed was adopted as the melting point.
3. Results and Discussion
3.1. COSMO-RS Molecular Simulation
3.1.1. Solubility of Siloxanes in DESs—Preselection of DES
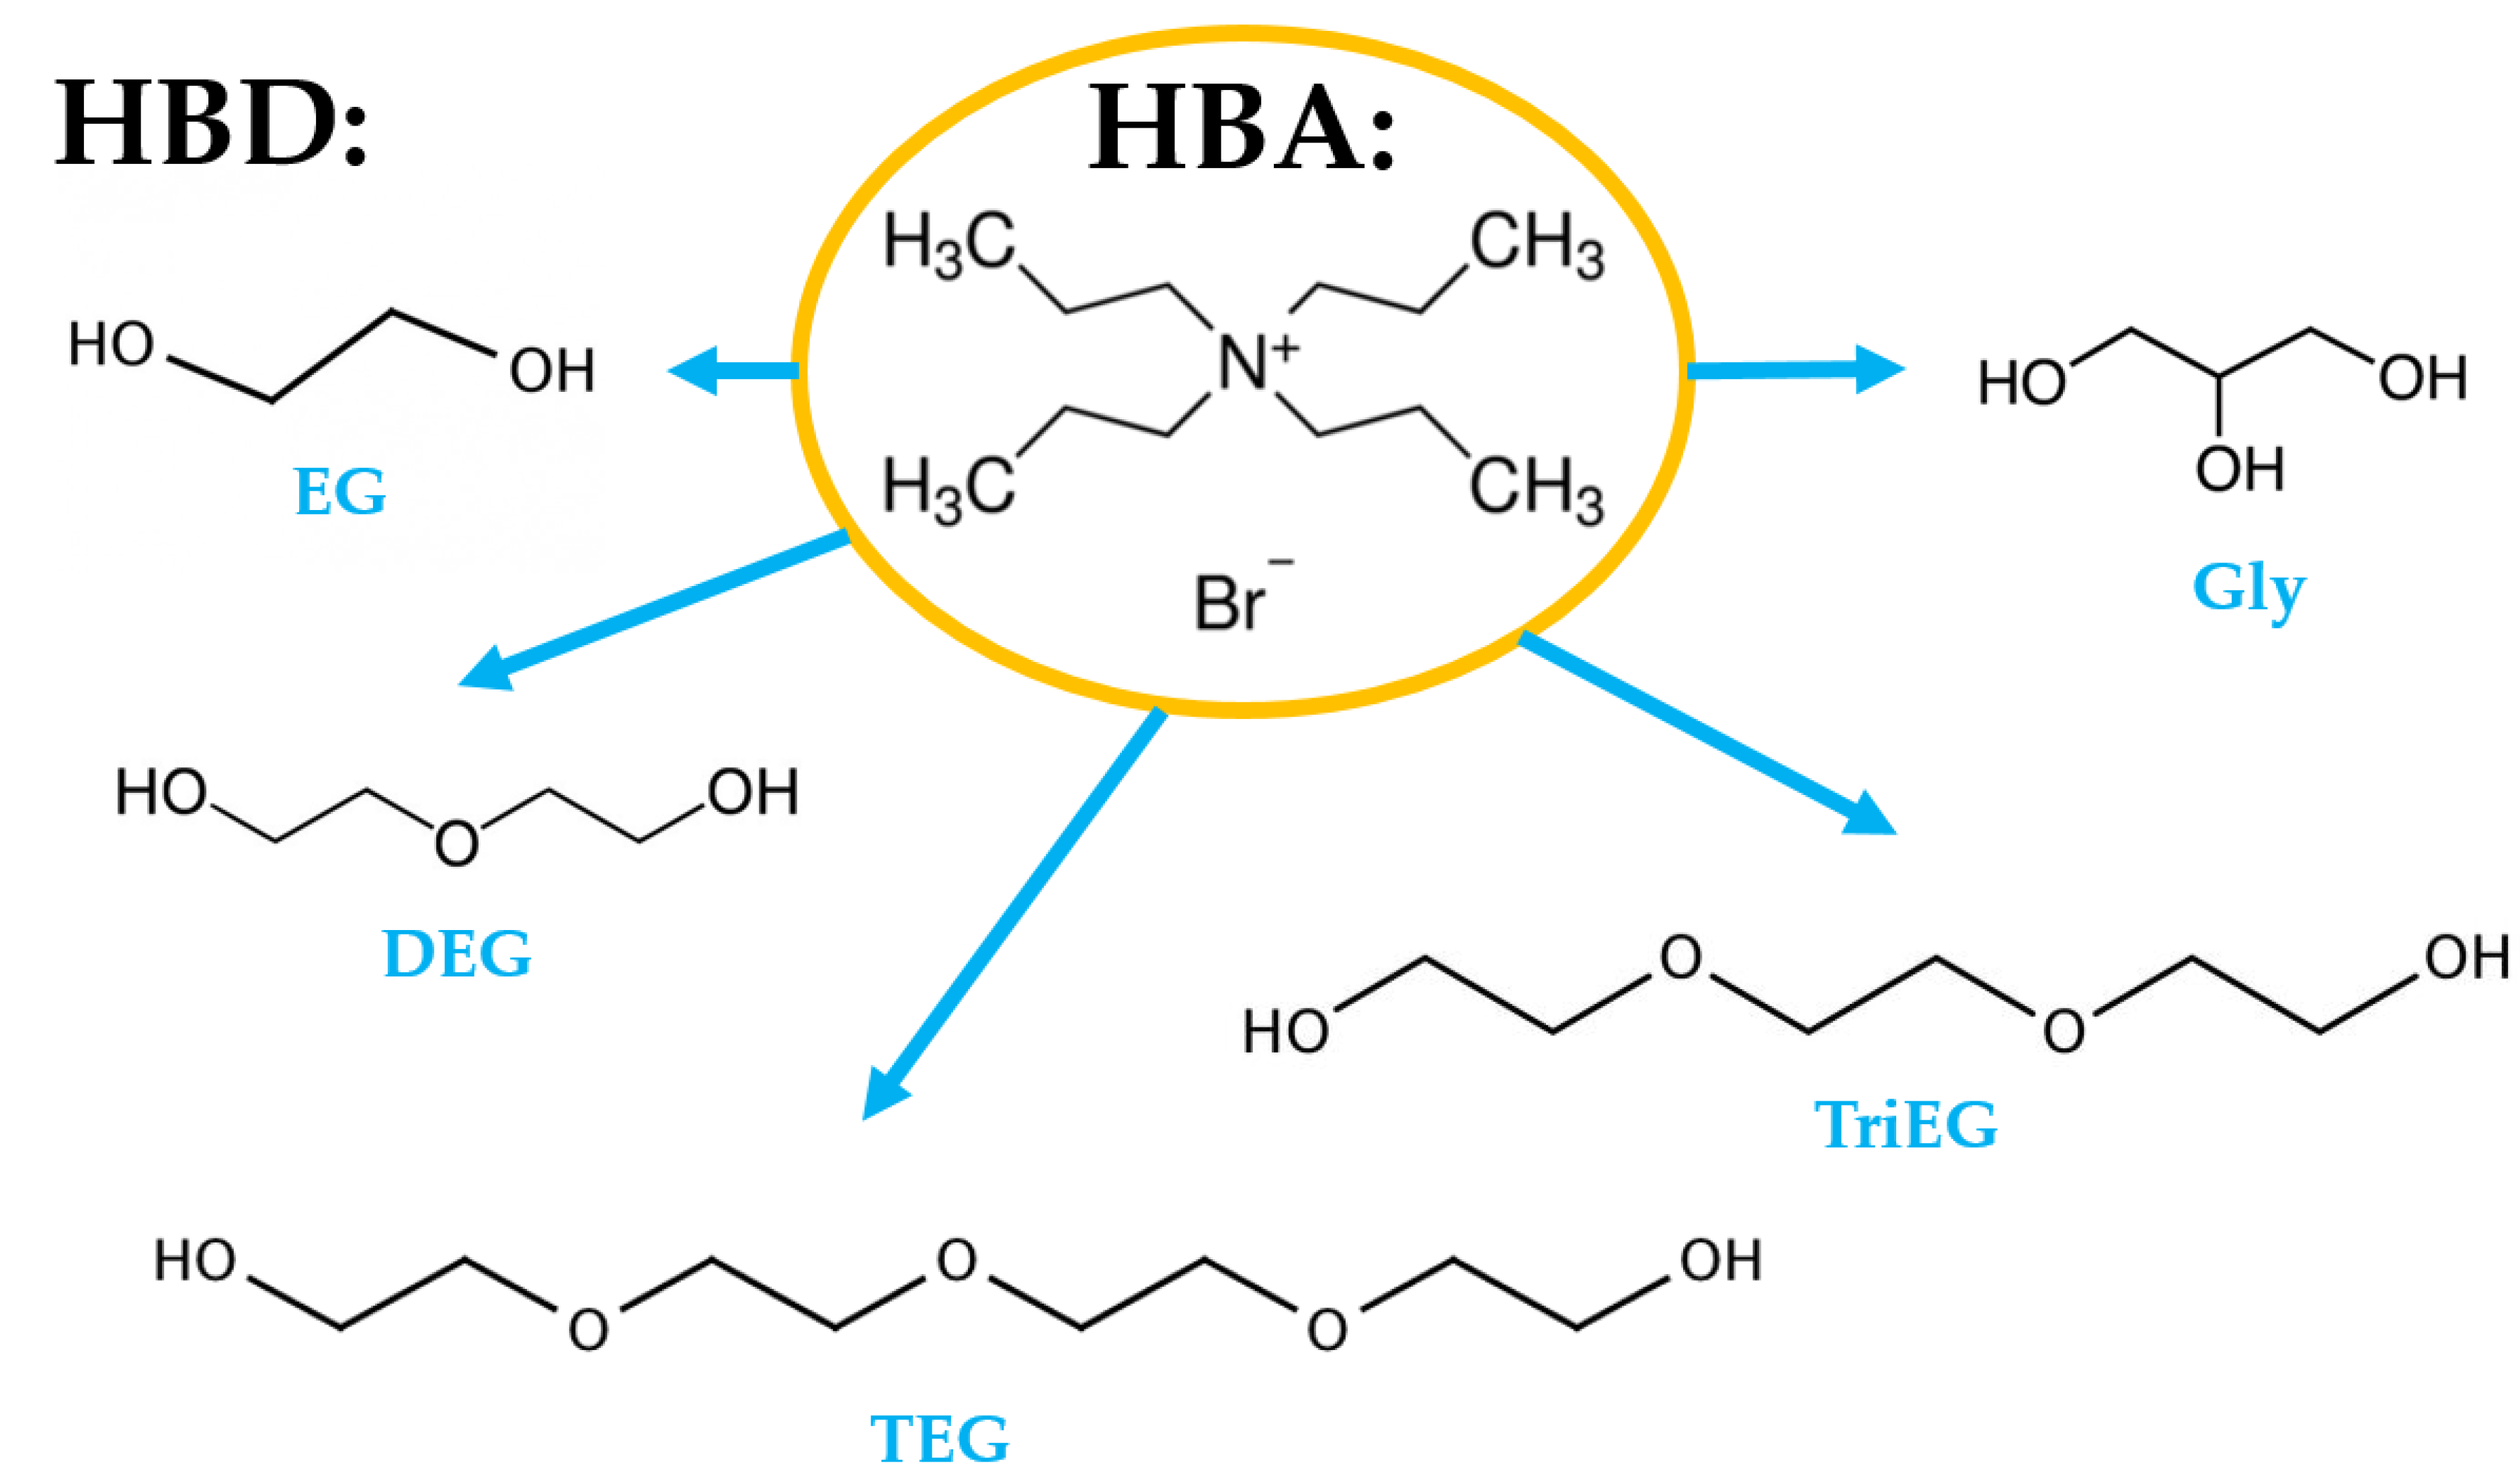
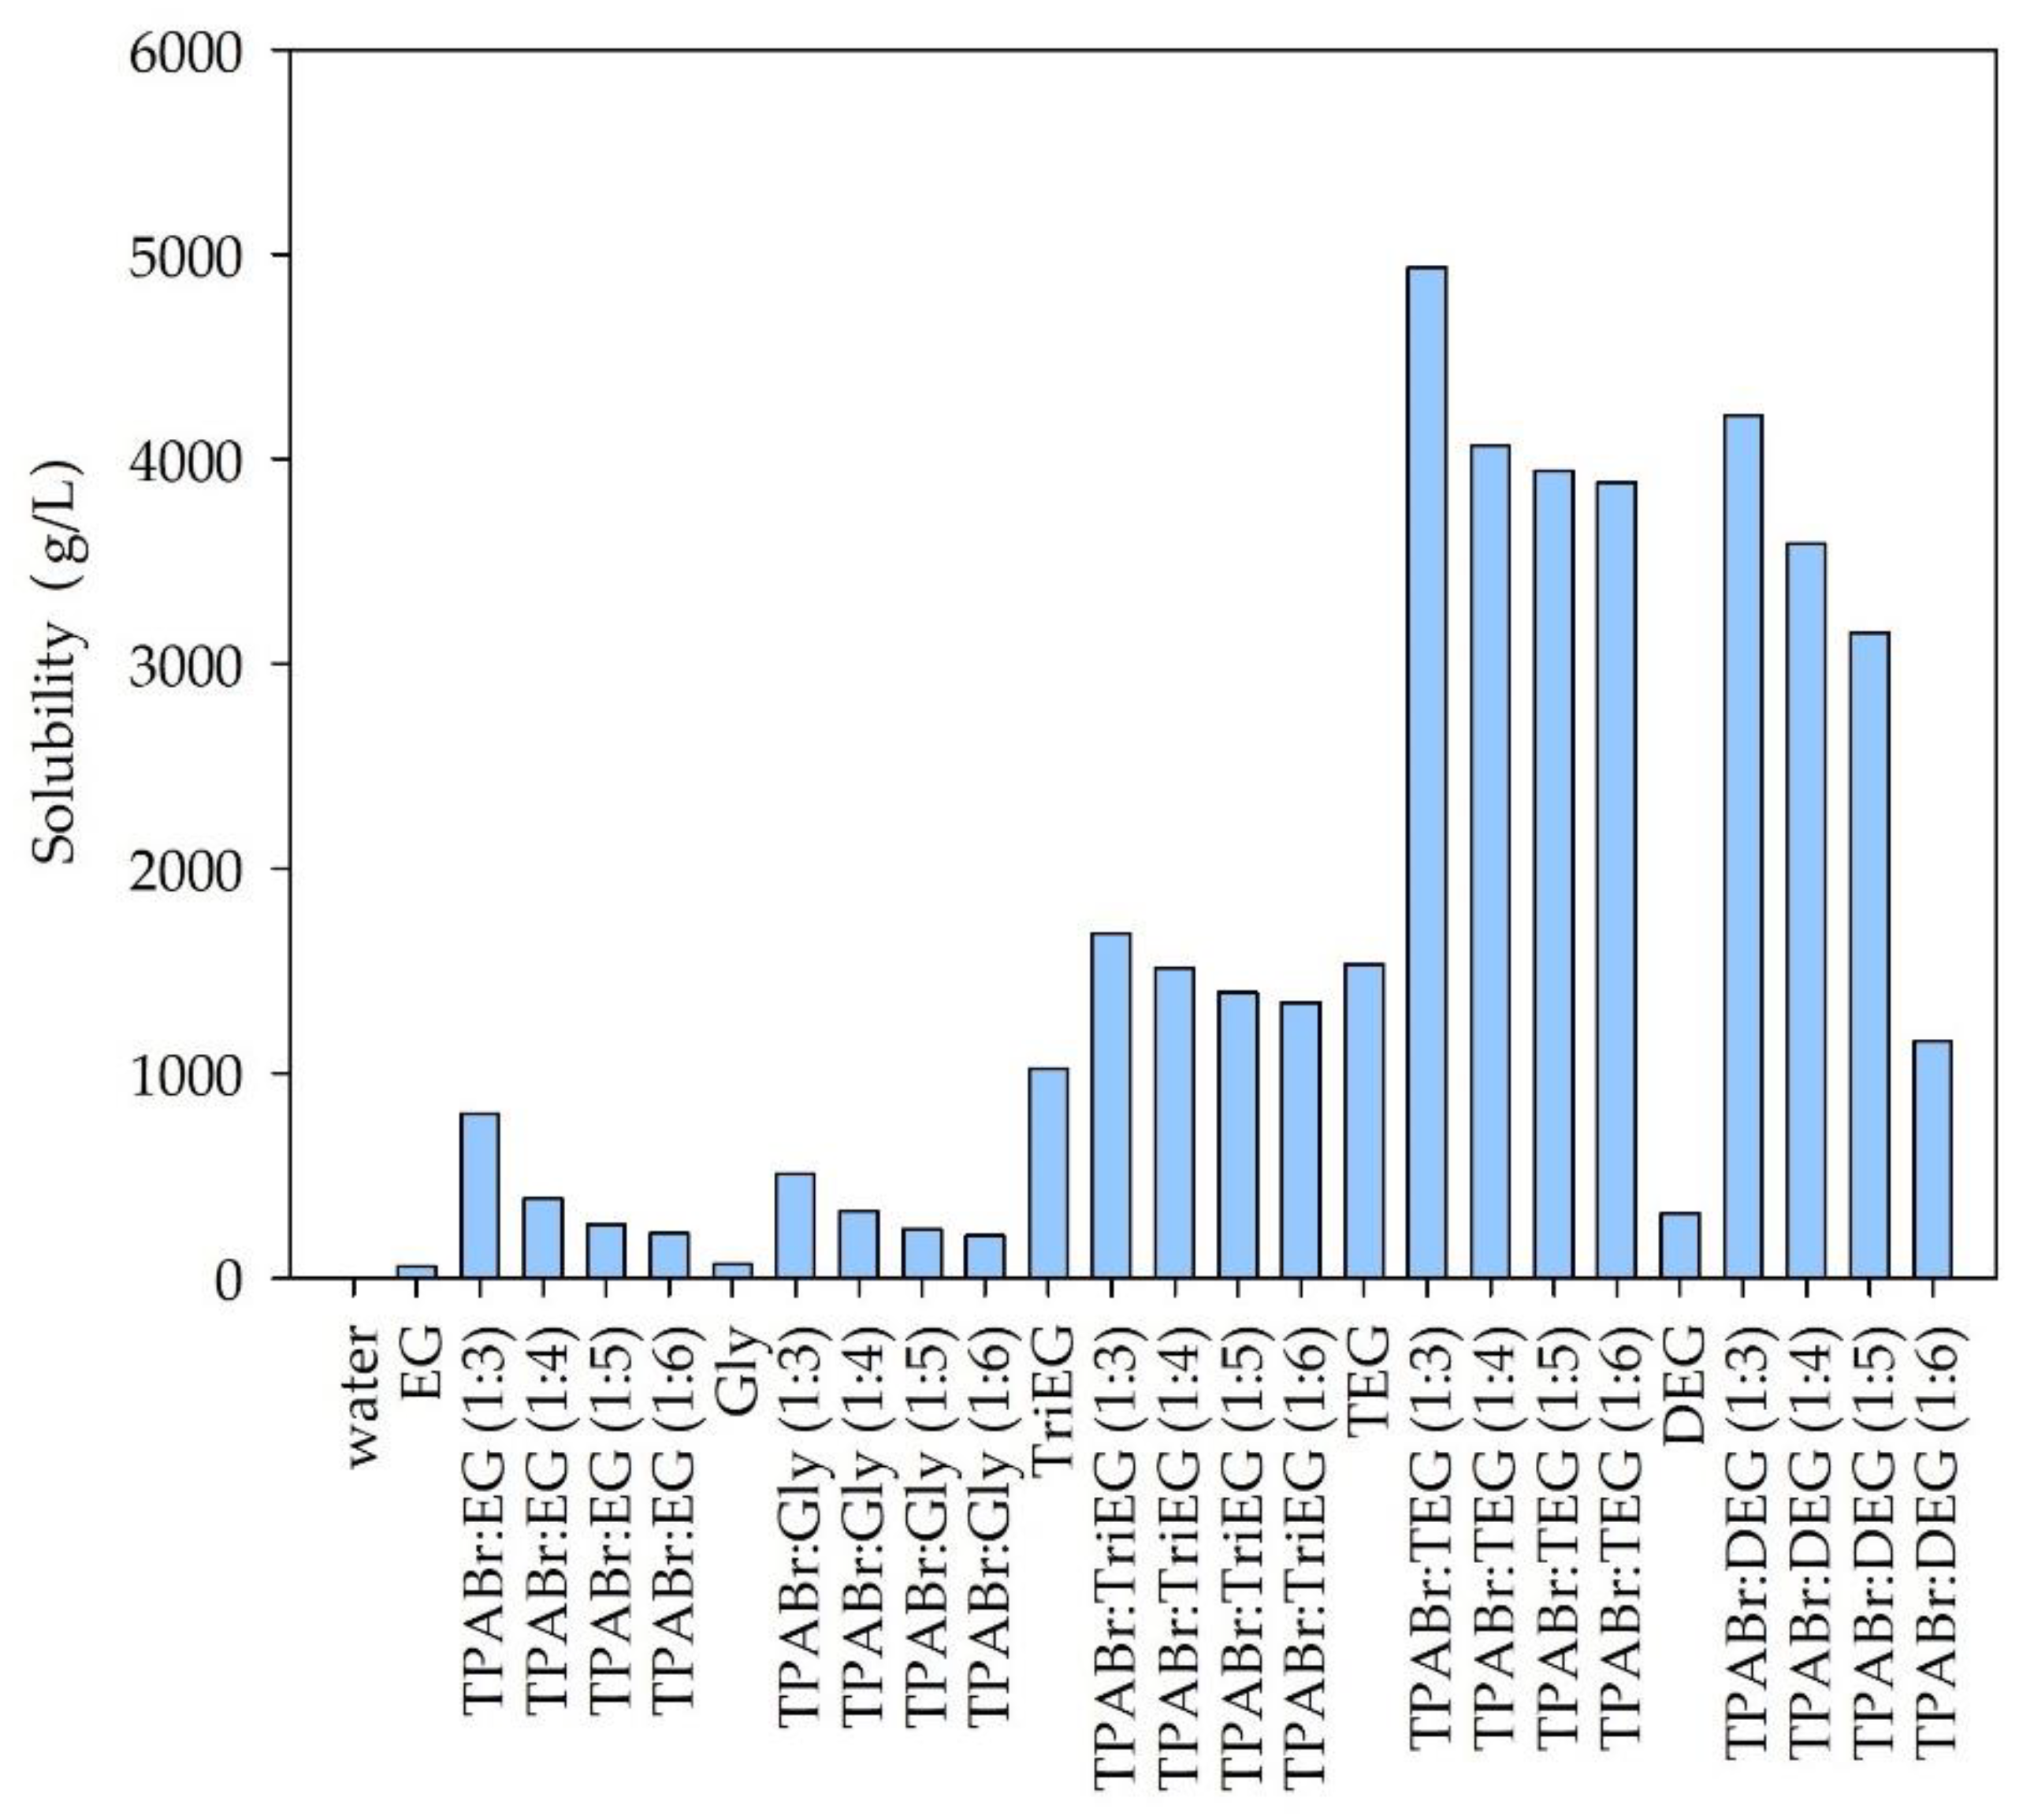
The conductor-like screening model for real solvents (COSMO-RS) was used to calculate the solubility of siloxanes in pure glycols and water and in DESs composed with TPABr and glycols. Based on the previous studies, it can be deduced that COSMO-RS is a useful tool for solvent screening and predicting the impurities’ solubility in conventional as well as non-conventional solvents [35,41,42]. In most of the published works, the selection of solvents is made on certain parameters, i.e., Henry’s constant and activity coefficient. The results are often inconsistent. However, the most important parameter from the industrial point of view, solubility, is rarely reported [35,43]. Therefore, in this study, we calculated the solubility of individual siloxanes (L2, L3, and D4) in various DESs composed of TPABr as HBA and glycols, i.e., ethylene glycol (EG), glycerol (Gly), triethylene glycol (TriEG), tetraethylene glycol (TEG), and diethylene glycol (DEG), as HBD at various molar ratios (1:3; 1:4; 1:5; 1:6, HBA:HBD). These various molar ratios were selected on the basis of other studies which show that the melting point of most TPABr:glycols in 1:1, 1:2 complexes are higher than 20 °C [44,45]. This fact disqualifies the possibility of such DES as absorbents since one of the necessary conditions for absorbents is liquid at room temperature. The structures of HBA and HBDs are presented in Figure 2.
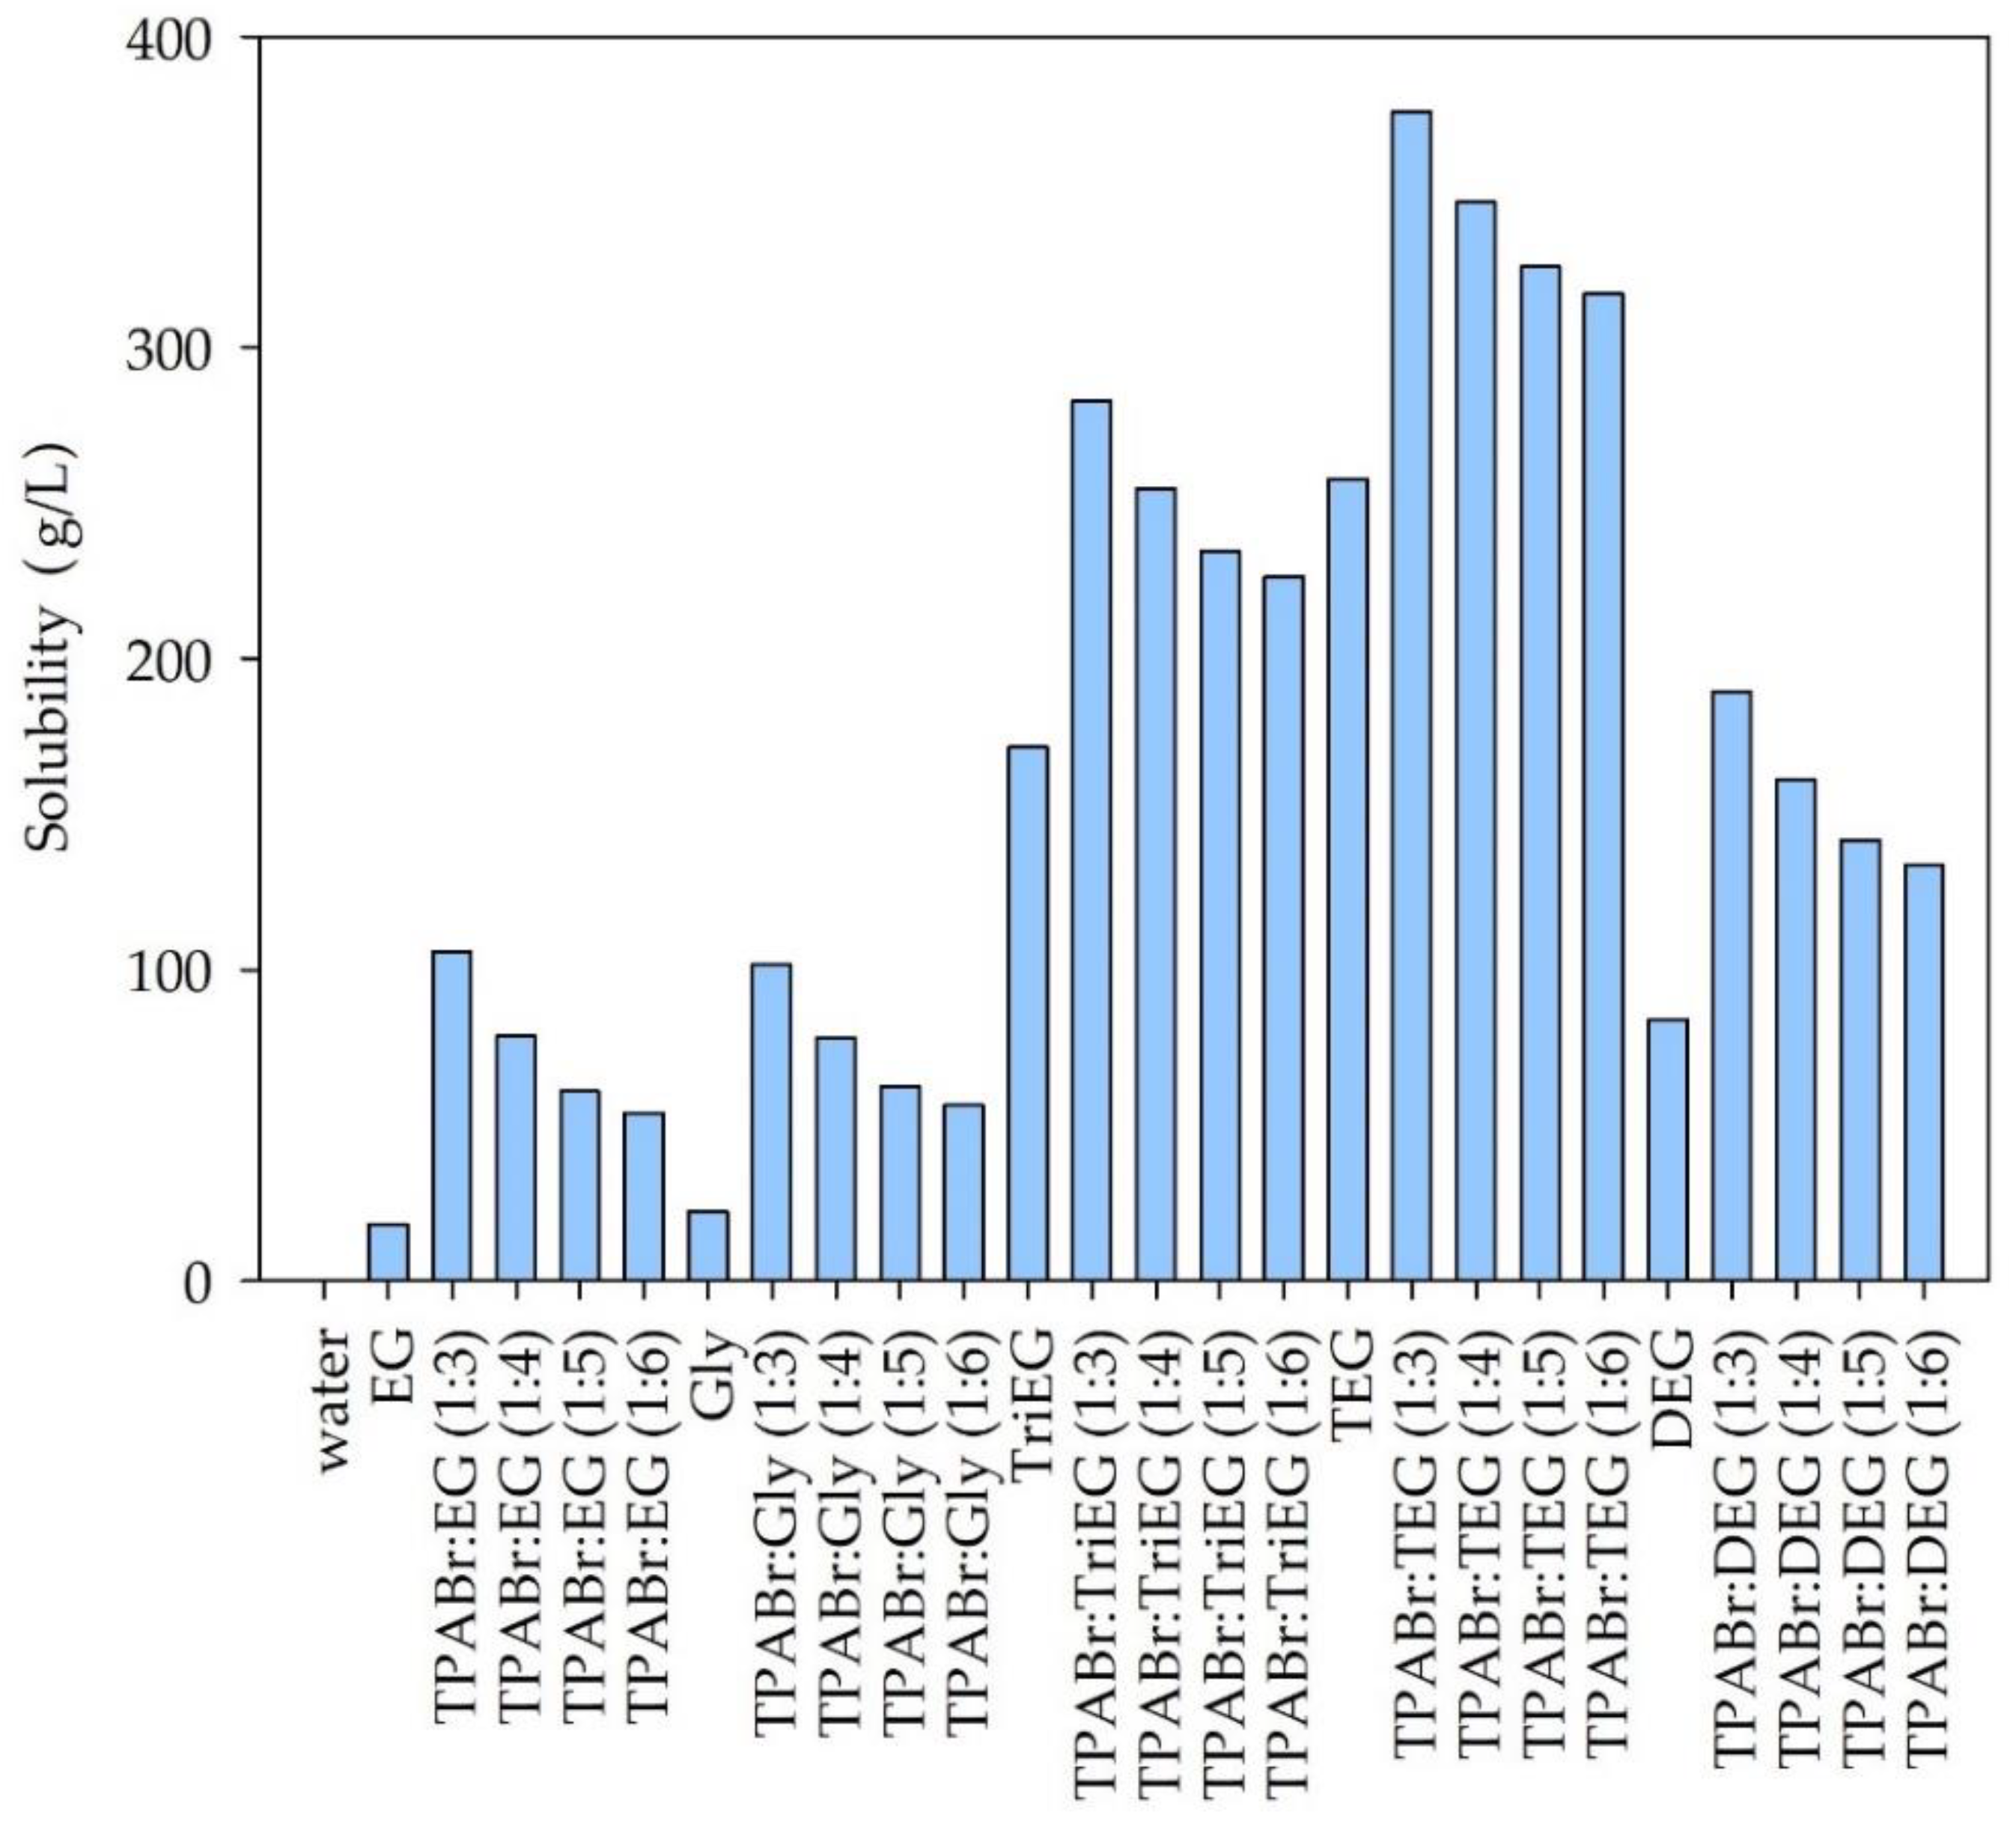
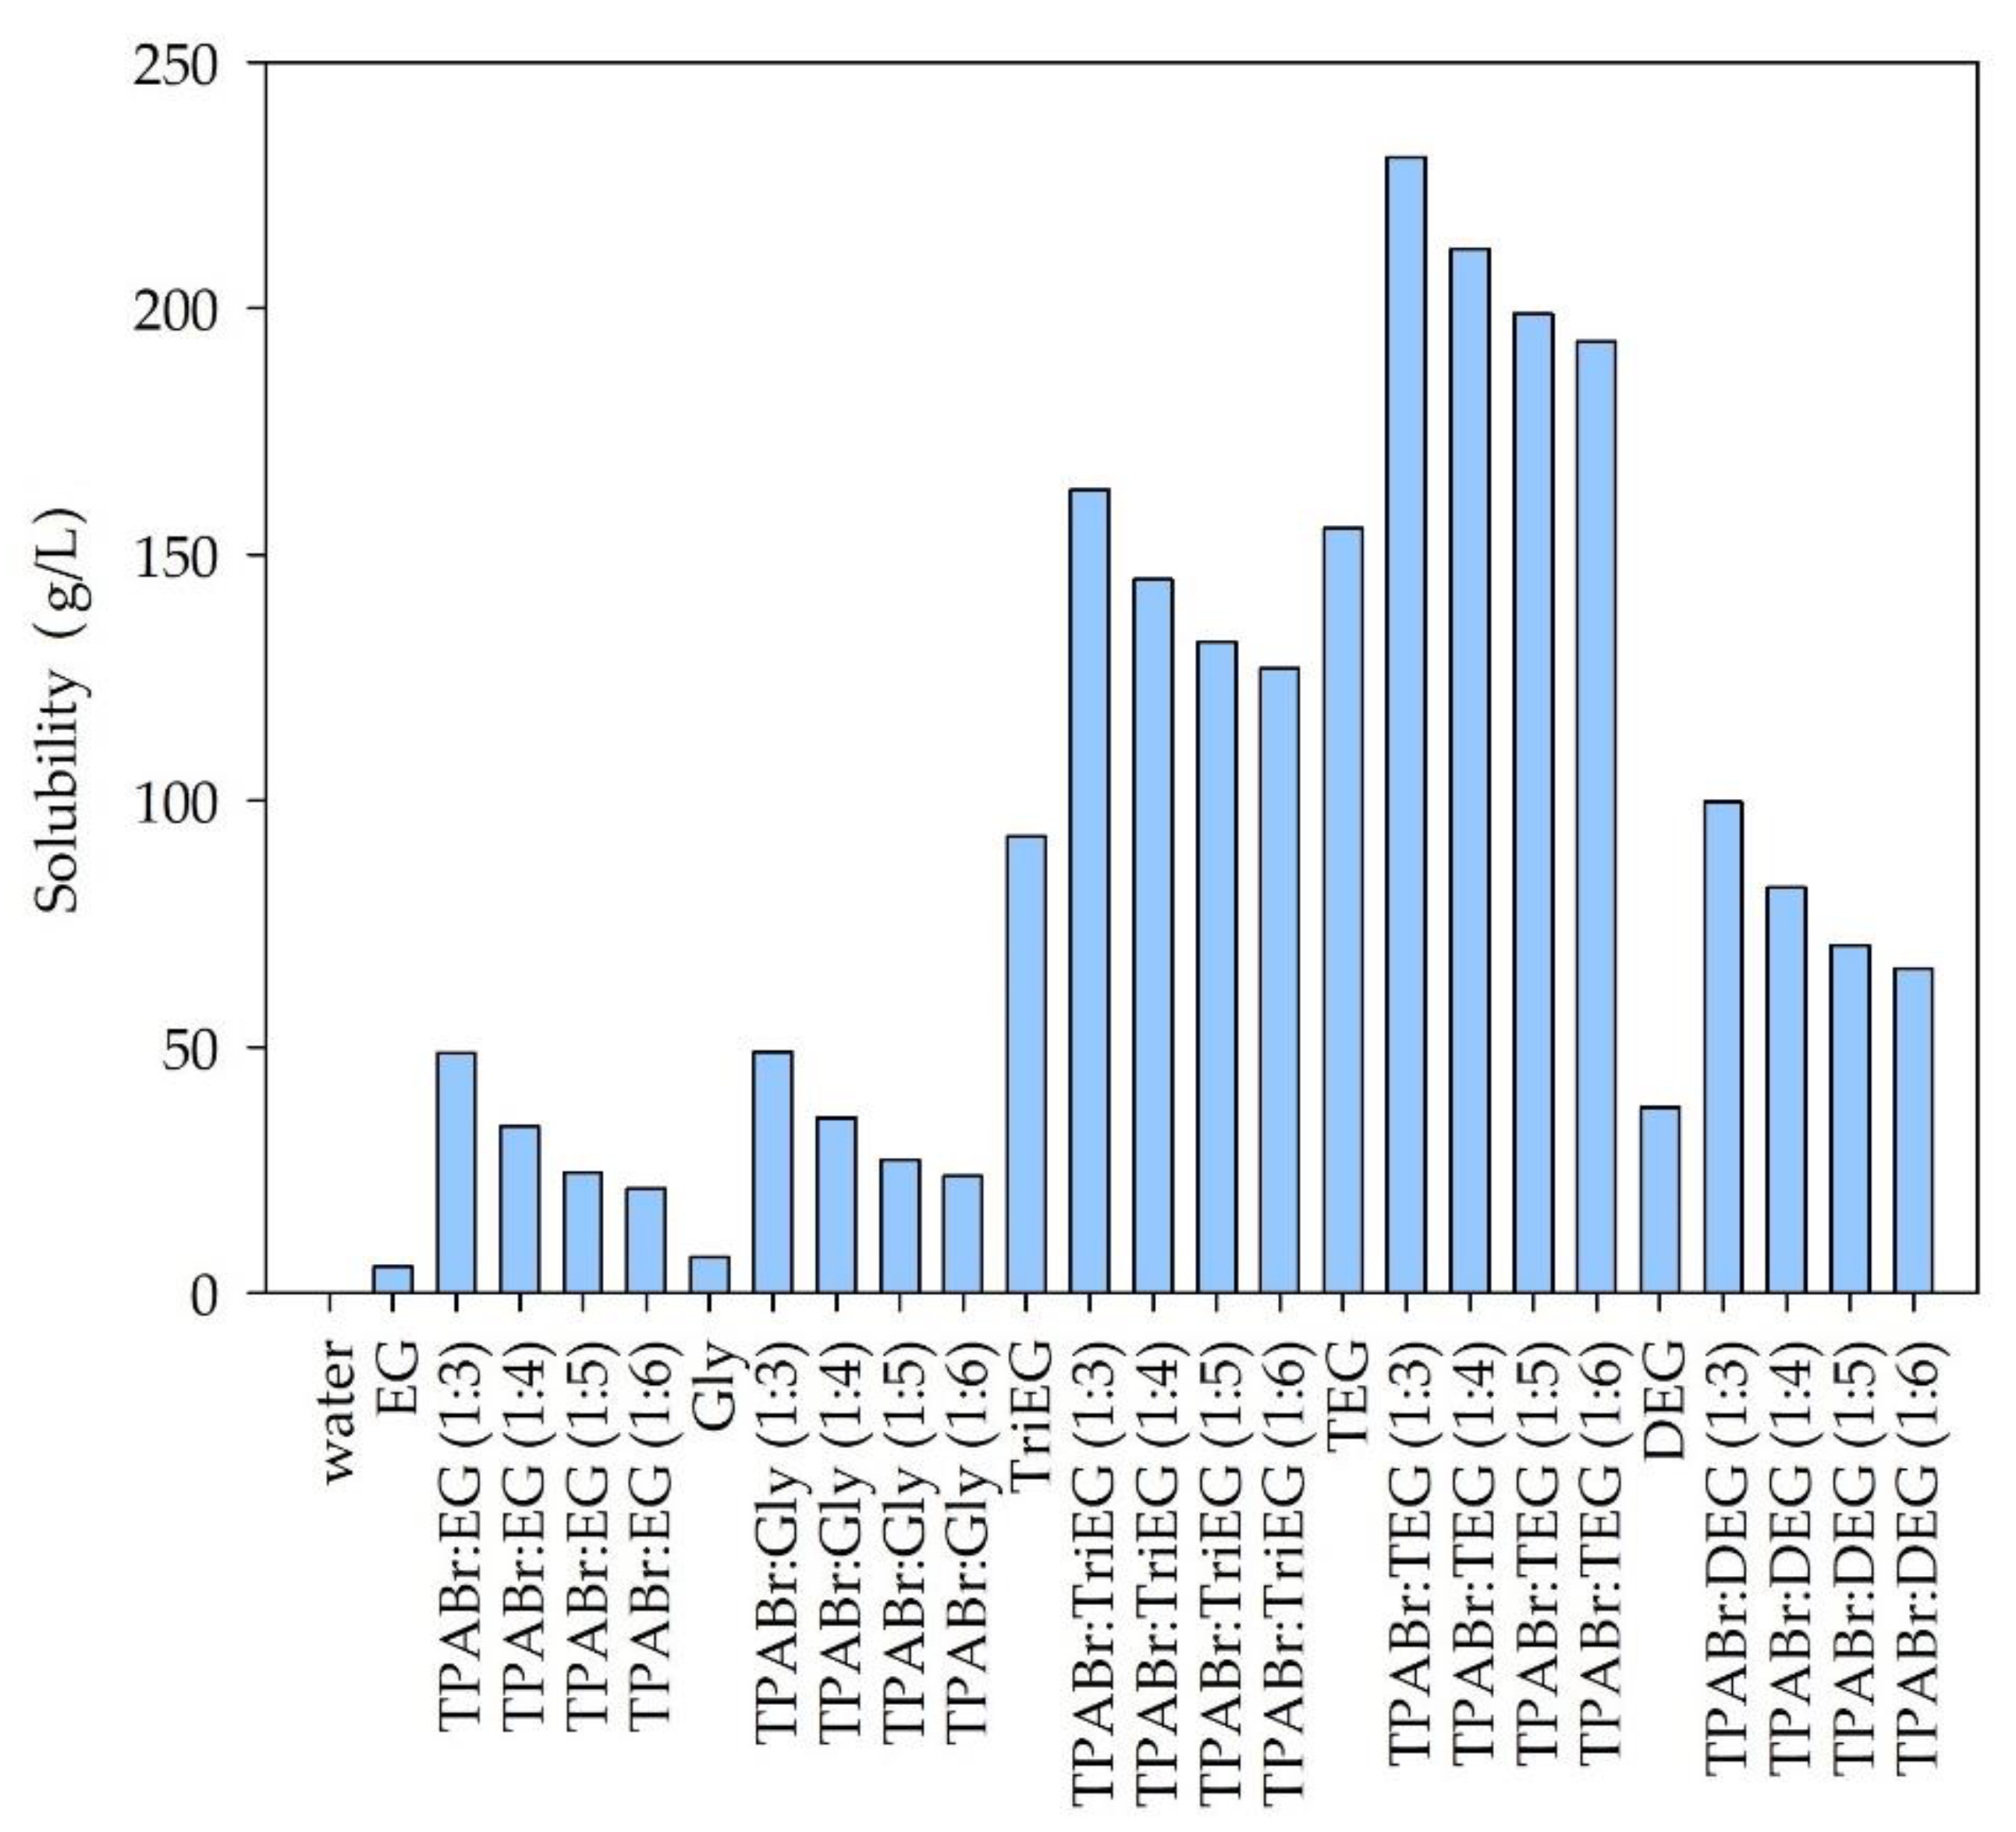
Additionally, the solubility of siloxanes in pure glycols and water were taken into account. The obtained results are presented in Figure 3, Figure 4 and Figure 5.
Among the tested solvents, water is the poorest solvent for siloxanes. The calculated solubility of individual siloxanes in water was 0.0054, 0.00011, and 0.027 g/L for L2, L3, and D4, respectively. This is due to the hydrophobic nature of most siloxanes [13,14]. From the industrial point of view, the ideal absorbents should be cheap and easily accessible. Due to the relatively high price of TPABr in comparison to the price of pure glycols, it would be advantageous to use pure EG, Gly, TriEG, TEG, or DEG to absorb siloxanes from biogas. However, the calculated solubility values are significantly lower for pure glycols compared to DES. The highest solubility can be observed for the DES composed of TPABr and glycols in 1:3 molar ratio. On the other hand, further increasing the amount of glycols in DES structures reduces the solubility of siloxanes. This indicates that both HBA and HBD take an active part in the absorption process by creating hydrogen or electrostatic bonds with siloxanes. COSMO-RS calculations indicate that D4, which represents cyclic siloxanes, shows higher solubility in DESs than linear siloxanes (L2 and L3). Similar results were obtained for ILs in the previous studies [46]. For linear siloxanes, as the length of the molecule decreases, their solubility in DESs increases. These are different results from those obtained for ionic liquids [46]. The highest solubility of both linear and cyclic siloxanes was obtained for DES composed of TPABr and TEG in 1:3 molar ratio. This is probably due to the formation of strong non-bonded interactions between TPABr:TEG (1:3) and siloxanes, i.e., hydrogen bonds between -OH group from TEG molecules, and O—a group from siloxanes. In order to obtain detailed information on the interactions between DES and siloxanes, analyses of σ-profiles and σ-potentials were performed. Due to the best siloxane dissolving ability of TPABr:TEG (1:3), only this DES was further investigated.
3.1.2. σ-Profile
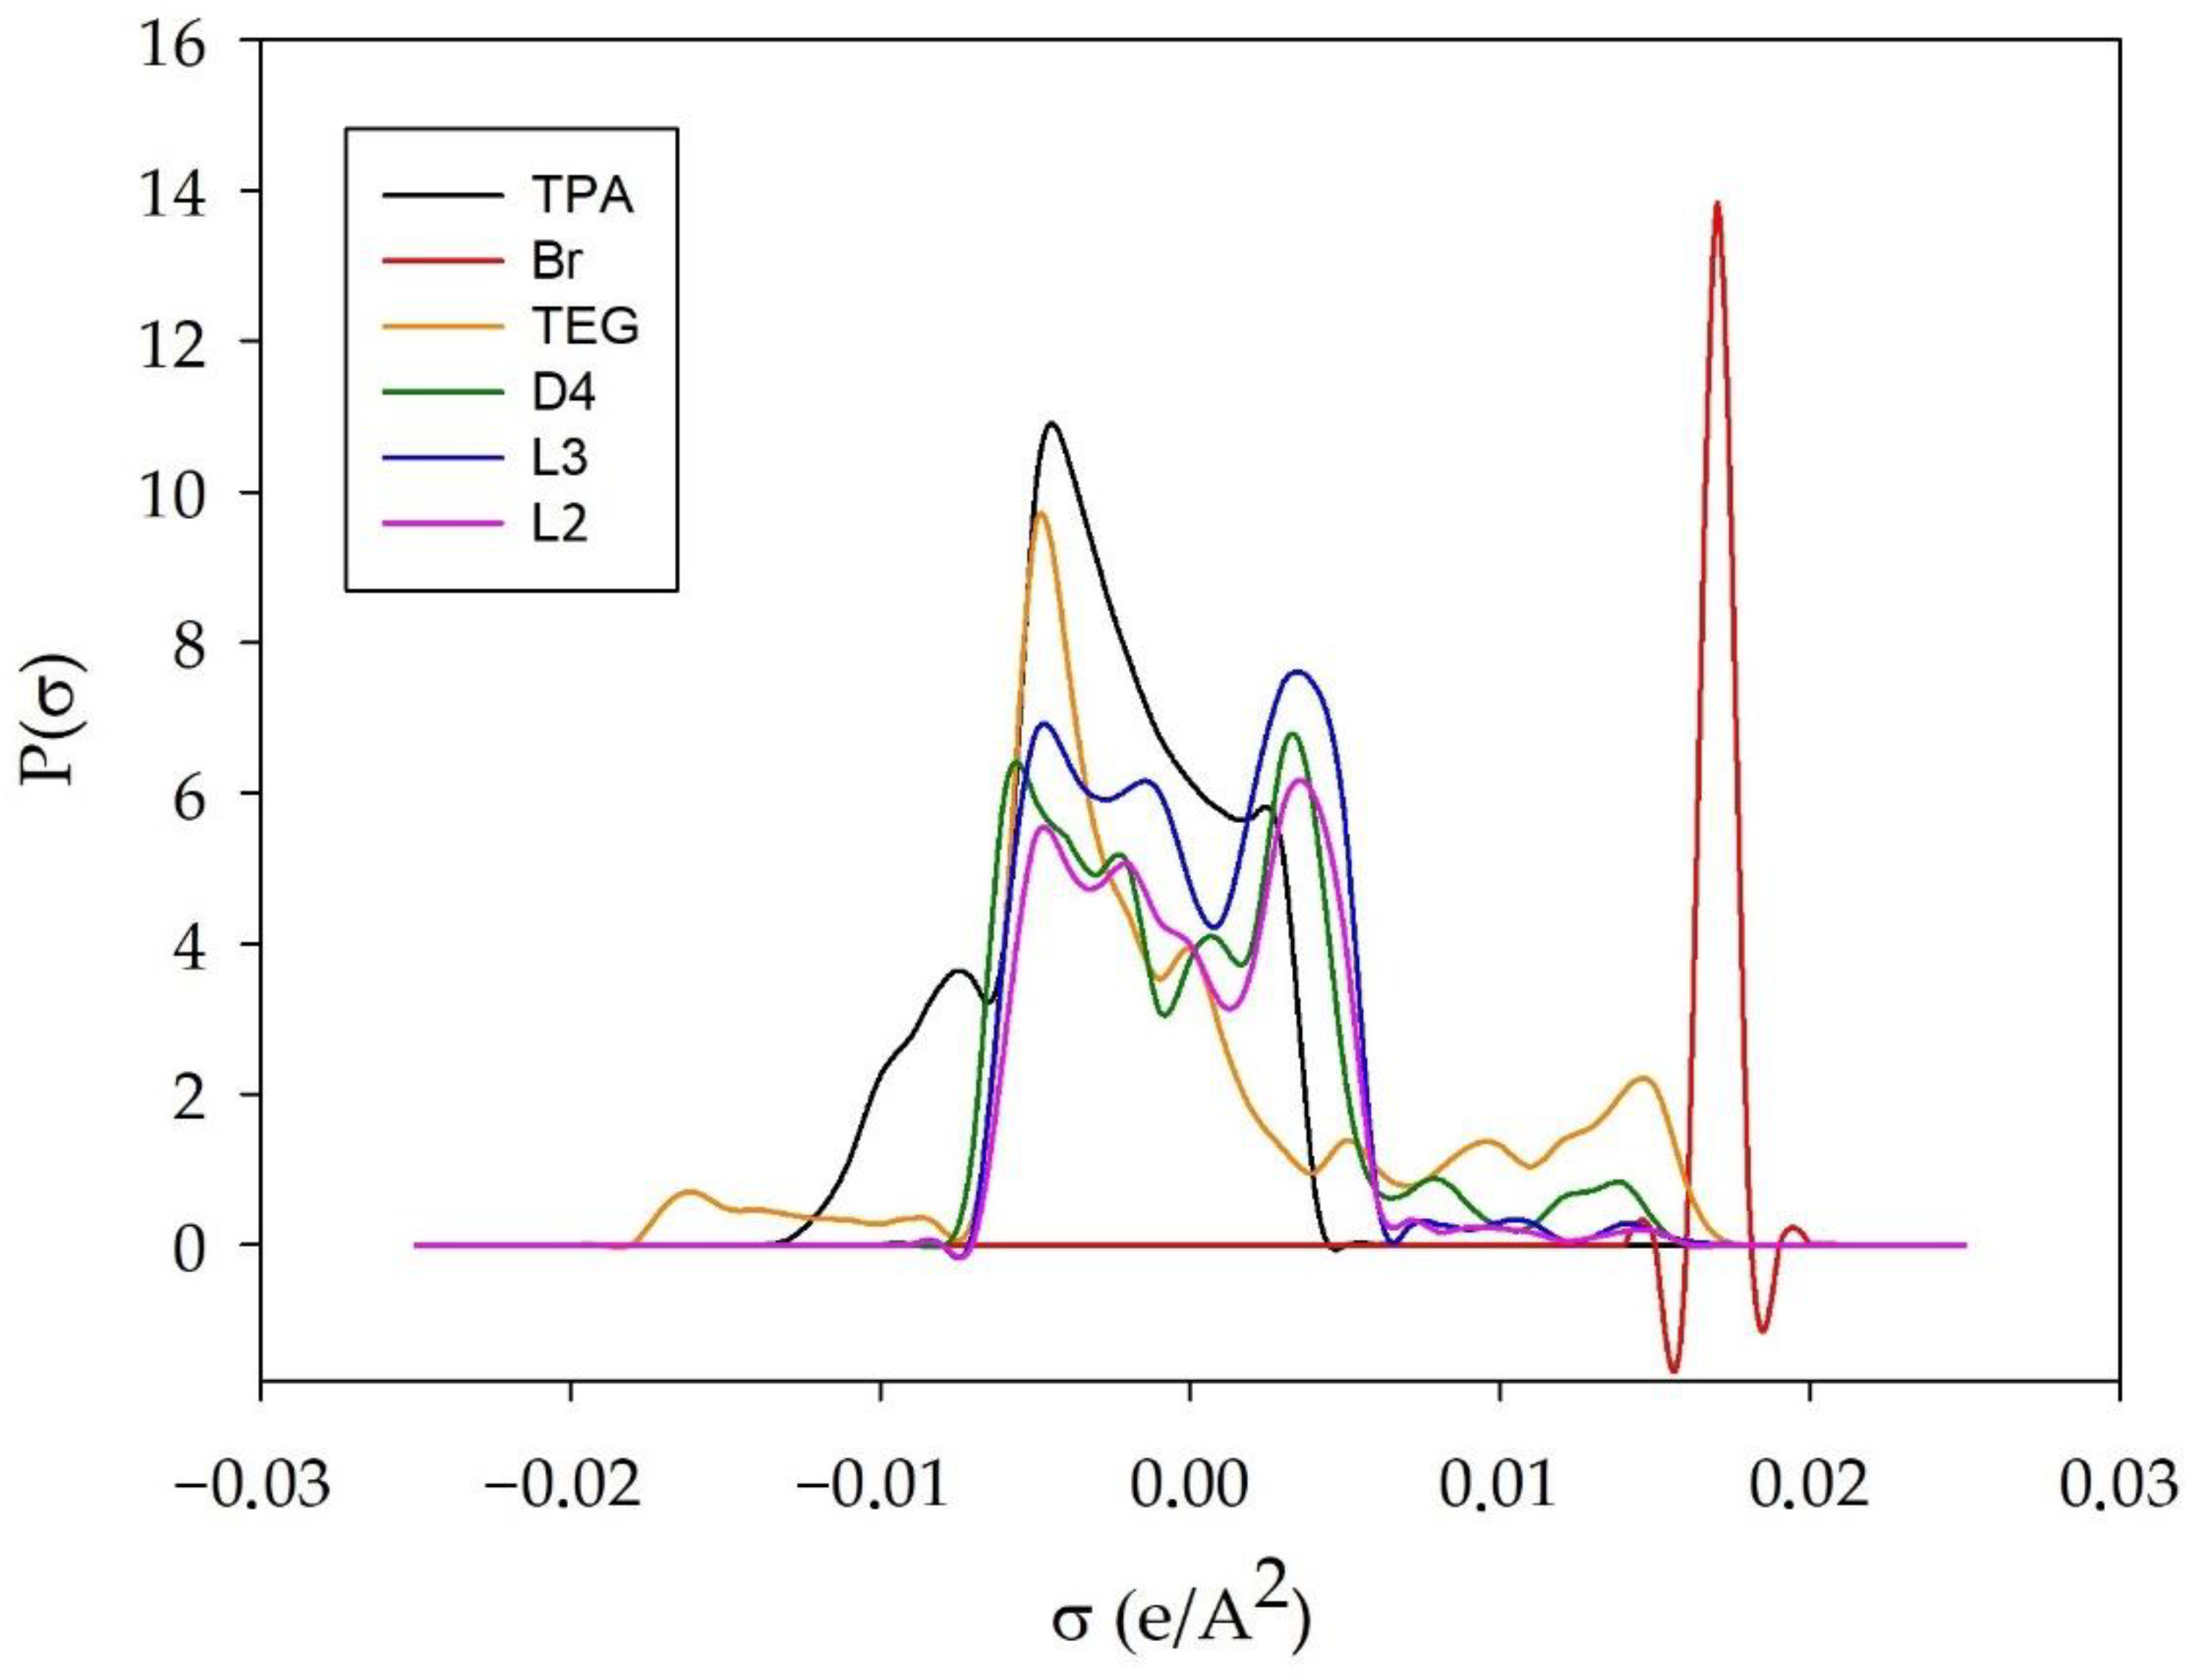
A very important molecule-specific property in the COSMO-RS model is the σ-profile, which is the probability distribution of surface area with charge density (σ). Typically, σ-profile is presented as a histogram which can be divided into three regions i.e., HBA region σ > 0.0084 e/Å2; non-polar region −0.0084 e/Å2 < σ < 0.0084 e/Å2; and HBD region σ < −0.0084 e/Å2 [47]. The σ-profiles of TPA, Br, TEG, L2, L3, and L4 are shown in Figure 6.
The results indicate that the σ-profiles of all siloxanes are distributed within the non-polar and hydrogen bond acceptor region. There is no significant difference between σ-profiles of L2, L3, and D4. The only peak can be observed in the more positive region of the histogram for linear siloxanes. This indicates a slightly stronger hydrogen bond acceptor capacity of L2 and L3. Similar results were observed in other studies [35,46]. The distribution of TPA shows the concentration of the charge density mainly around 0, and a small concentration of the charge below −0.0084, which indicates the role of TPA as a hydrogen bond acceptor in hydrogen bond formation. The distribution of the bromide anion is located around 0.018 in the HBA area, which demonstrates a non-polar character and the possibility of H-bonding formation. On the other hand, the distribution of TEG is observed over the entire range of the σ-profile. This indicates that TEG can be both an acceptor and a hydrogen bond donor.
3.1.3. σ-Potential
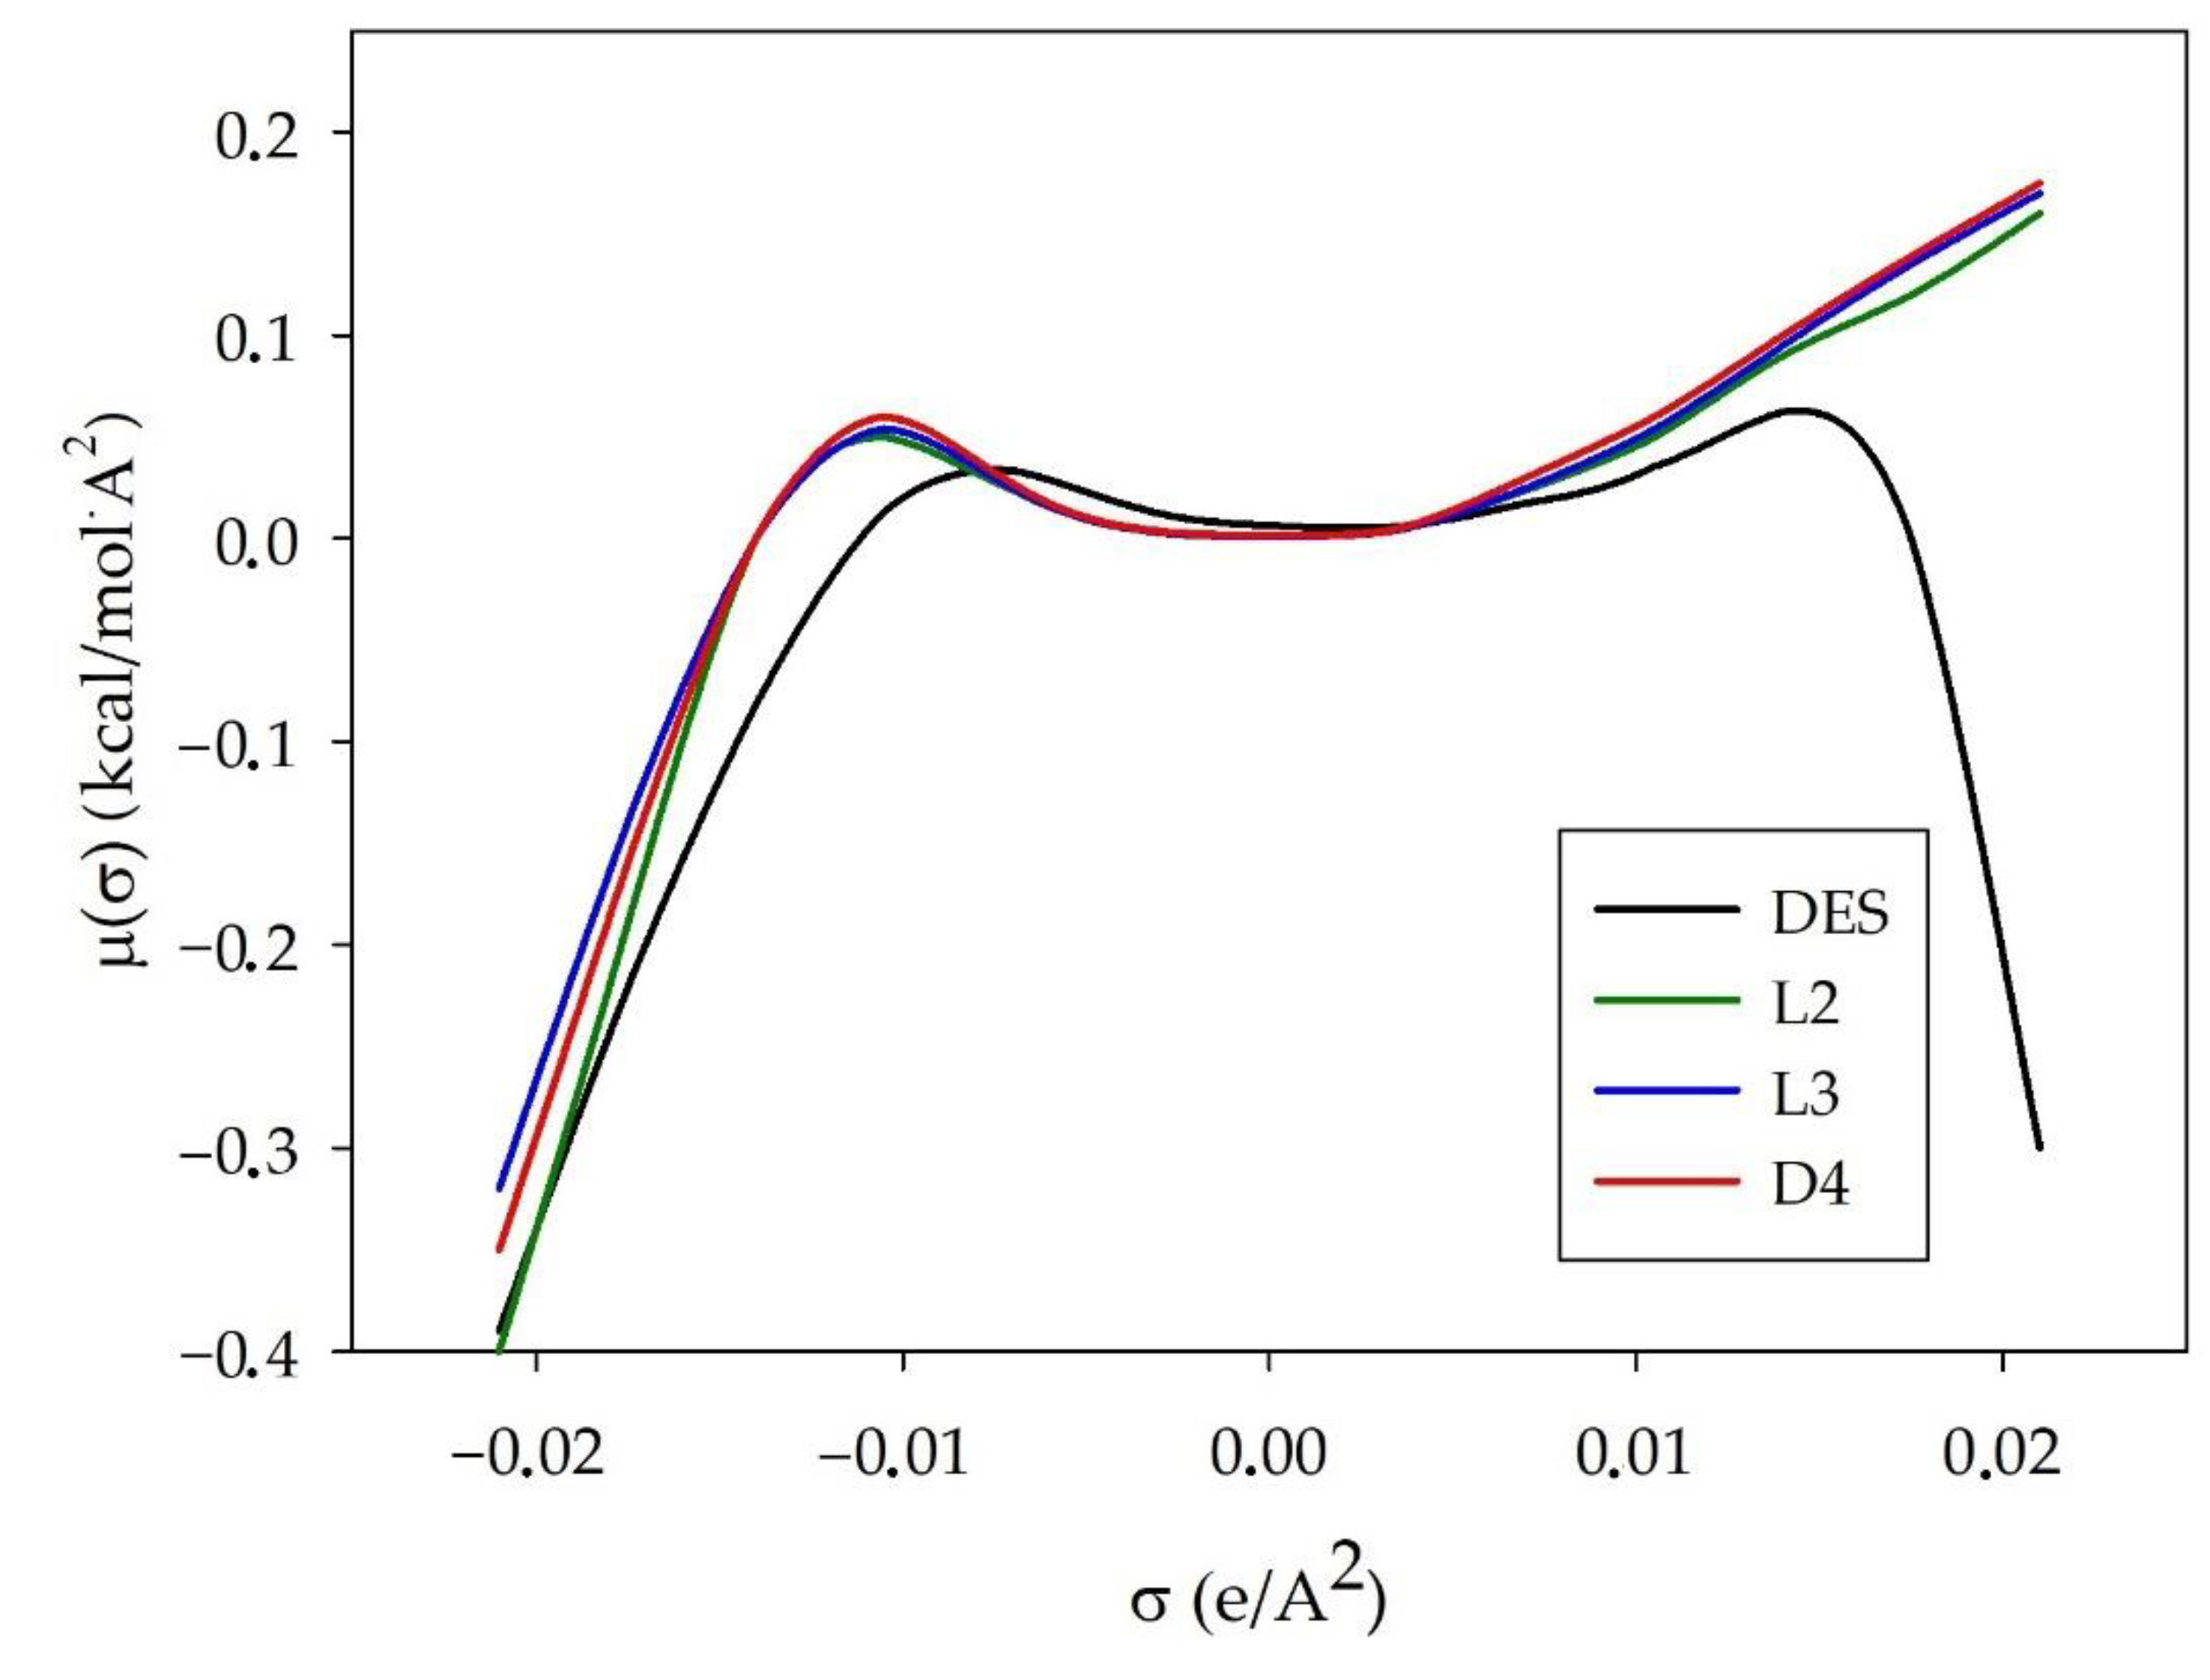
The σ-potential is typically used to indicate the affinity between mixture components. The higher values of the positive μ (σ) suggest an increase in its repulsive behavior, and higher negative values of the μ (σ) indicate a stronger interaction between the molecules. Similarly to the σ-profile plot, the σ-potential plot is divided at the same three regions. The σ-potential for TPABr:TEG (1:3), L2, L3, and D4 are plotted in Figure 7. The obtained results indicate that all siloxanes almost overlap each other, which means that L2, L3, and D4 have similar molecular interaction properties with other molecules and with themselves. The shape of siloxanes σ-potential is negative in the HBA region and positive in the HBD region. This means that L2, L3, and D4 can be acceptors in H-bonding formation. However, the DES shape is negative in both these regions. This indicates that it is both an acceptor and a hydrogen bond donor. Therefore, the formation of hydrogen bonds is the most likely driving force in the process of removing siloxanes from biogas.
3.2. Structural and Physicochemical Properties of DES
3.2.1. FT-IR Analysis
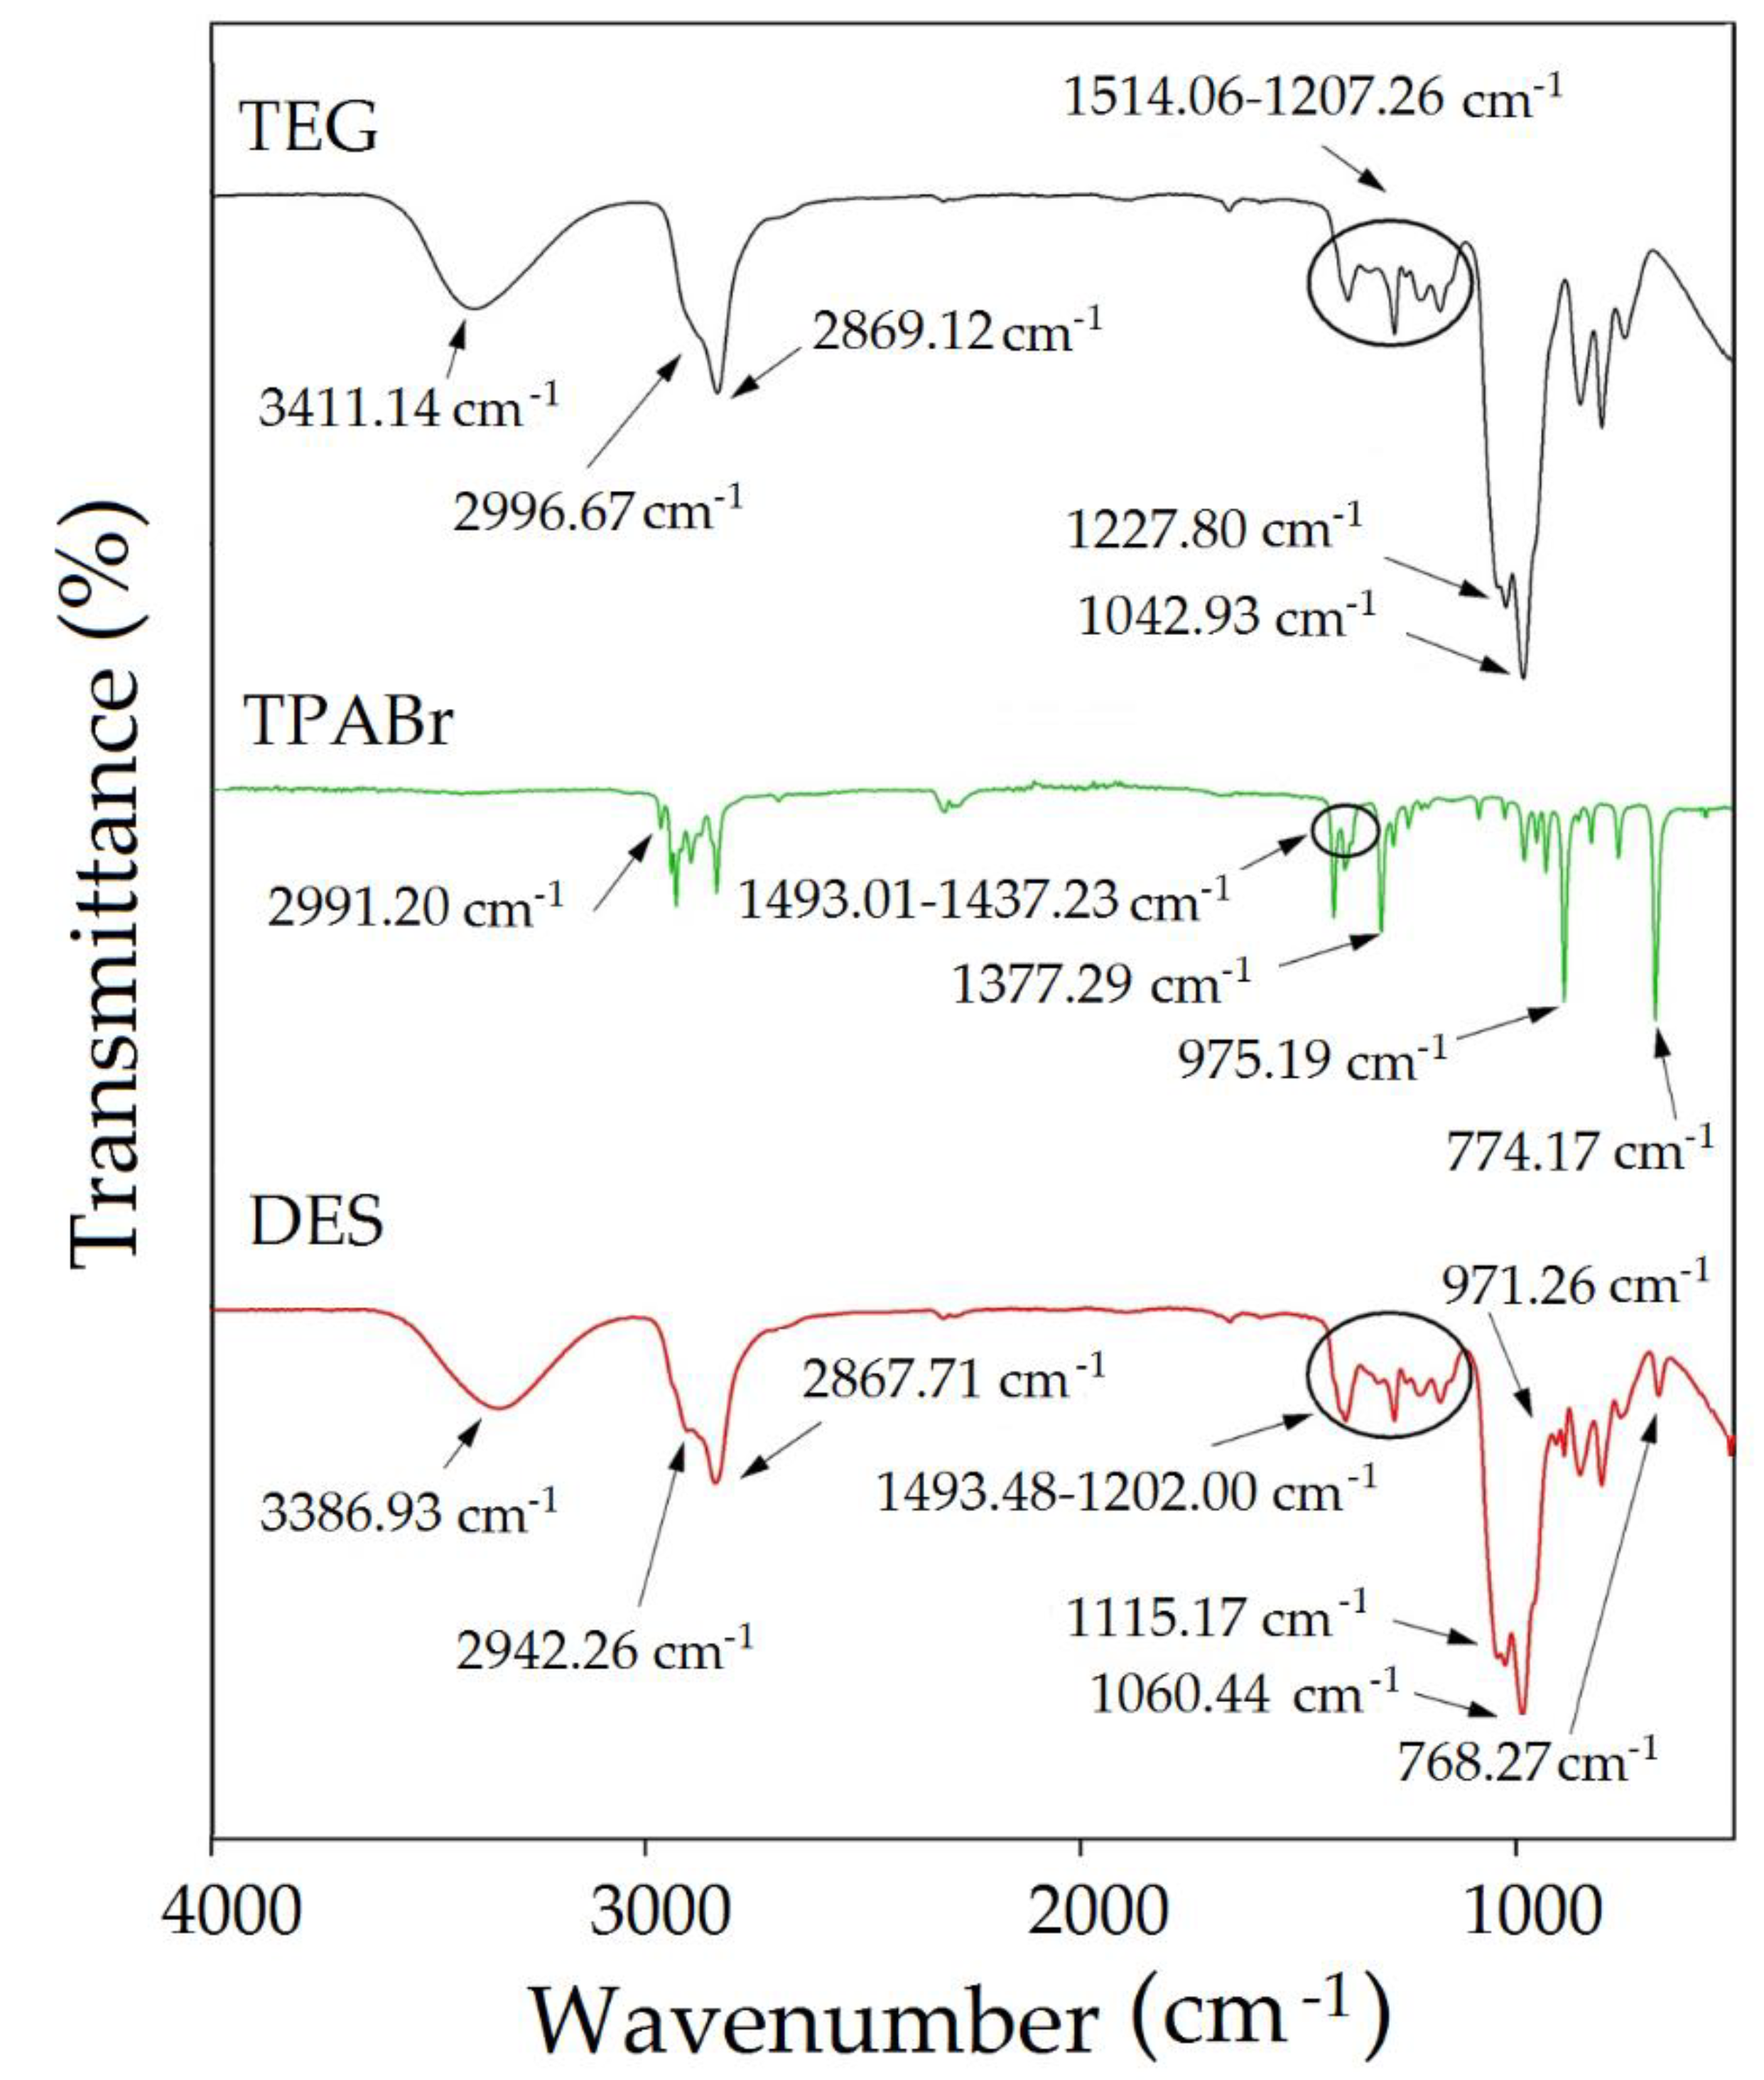
Spectroscopic characterization is a very important aspect to determine the interaction between HBA (TPABr) and HBD (TEG). For this purpose, the FT-IR analysis was used in the study (Figure 8).
Figure 8 shows the mechanism of TBABr:TEG (1:3) formation. In the TPABr:TEG (1:3) spectrum, the shift of -OH group vibration towards lower values compared with pure TEG HBD (from 3411.14 to 3386.93 cm−1) indicates the formation of O-H O or O-H Cl bonds. In addition, the broadening and shifts of the vibration towards lower values of the aliphatic C–H stretching bonds (from 2996.67 and 2869.12 cm−1 to 2942.26 and 2867.71 cm−1) can be observed. The shifts O-H O or O-H Cl, and C-H groups are most likely the consequence of hydrogen bond formation between TPABr and TEG [48,49]. Moreover, shifts of the OH group may result from the presence of C-O-C groups in the TEG. The C-O-C group are considered as the electronegative groups and tend to attract electrons on hydrogen in OH bands. The occurring interactions between TPABr and TEG can be confirmed by the shift of the C-O-C group towards lower values from 1227.80 to 1115.17 cm−1 and increasing the intensity of the OH group [50]. Similar vibration towards lower values can be seen in the peaks in the bands responding with H-bending, CH2 deformation, and N-C-C bending bonds from 1514.06–1207.26 cm−1 to 1493.48–1202.00 cm−1, and C-N bond symmetric stretching vibration from 774.17 to 768.27 cm−1 as well as redshift phenomena O-H and C-O-H stretching bonds from 1042.73 to 1060.44 cm−1. The shifts confirm the interaction between the atoms in TPABr and TEG [51,52,53].
3.2.2. Viscosity and Density Measurements
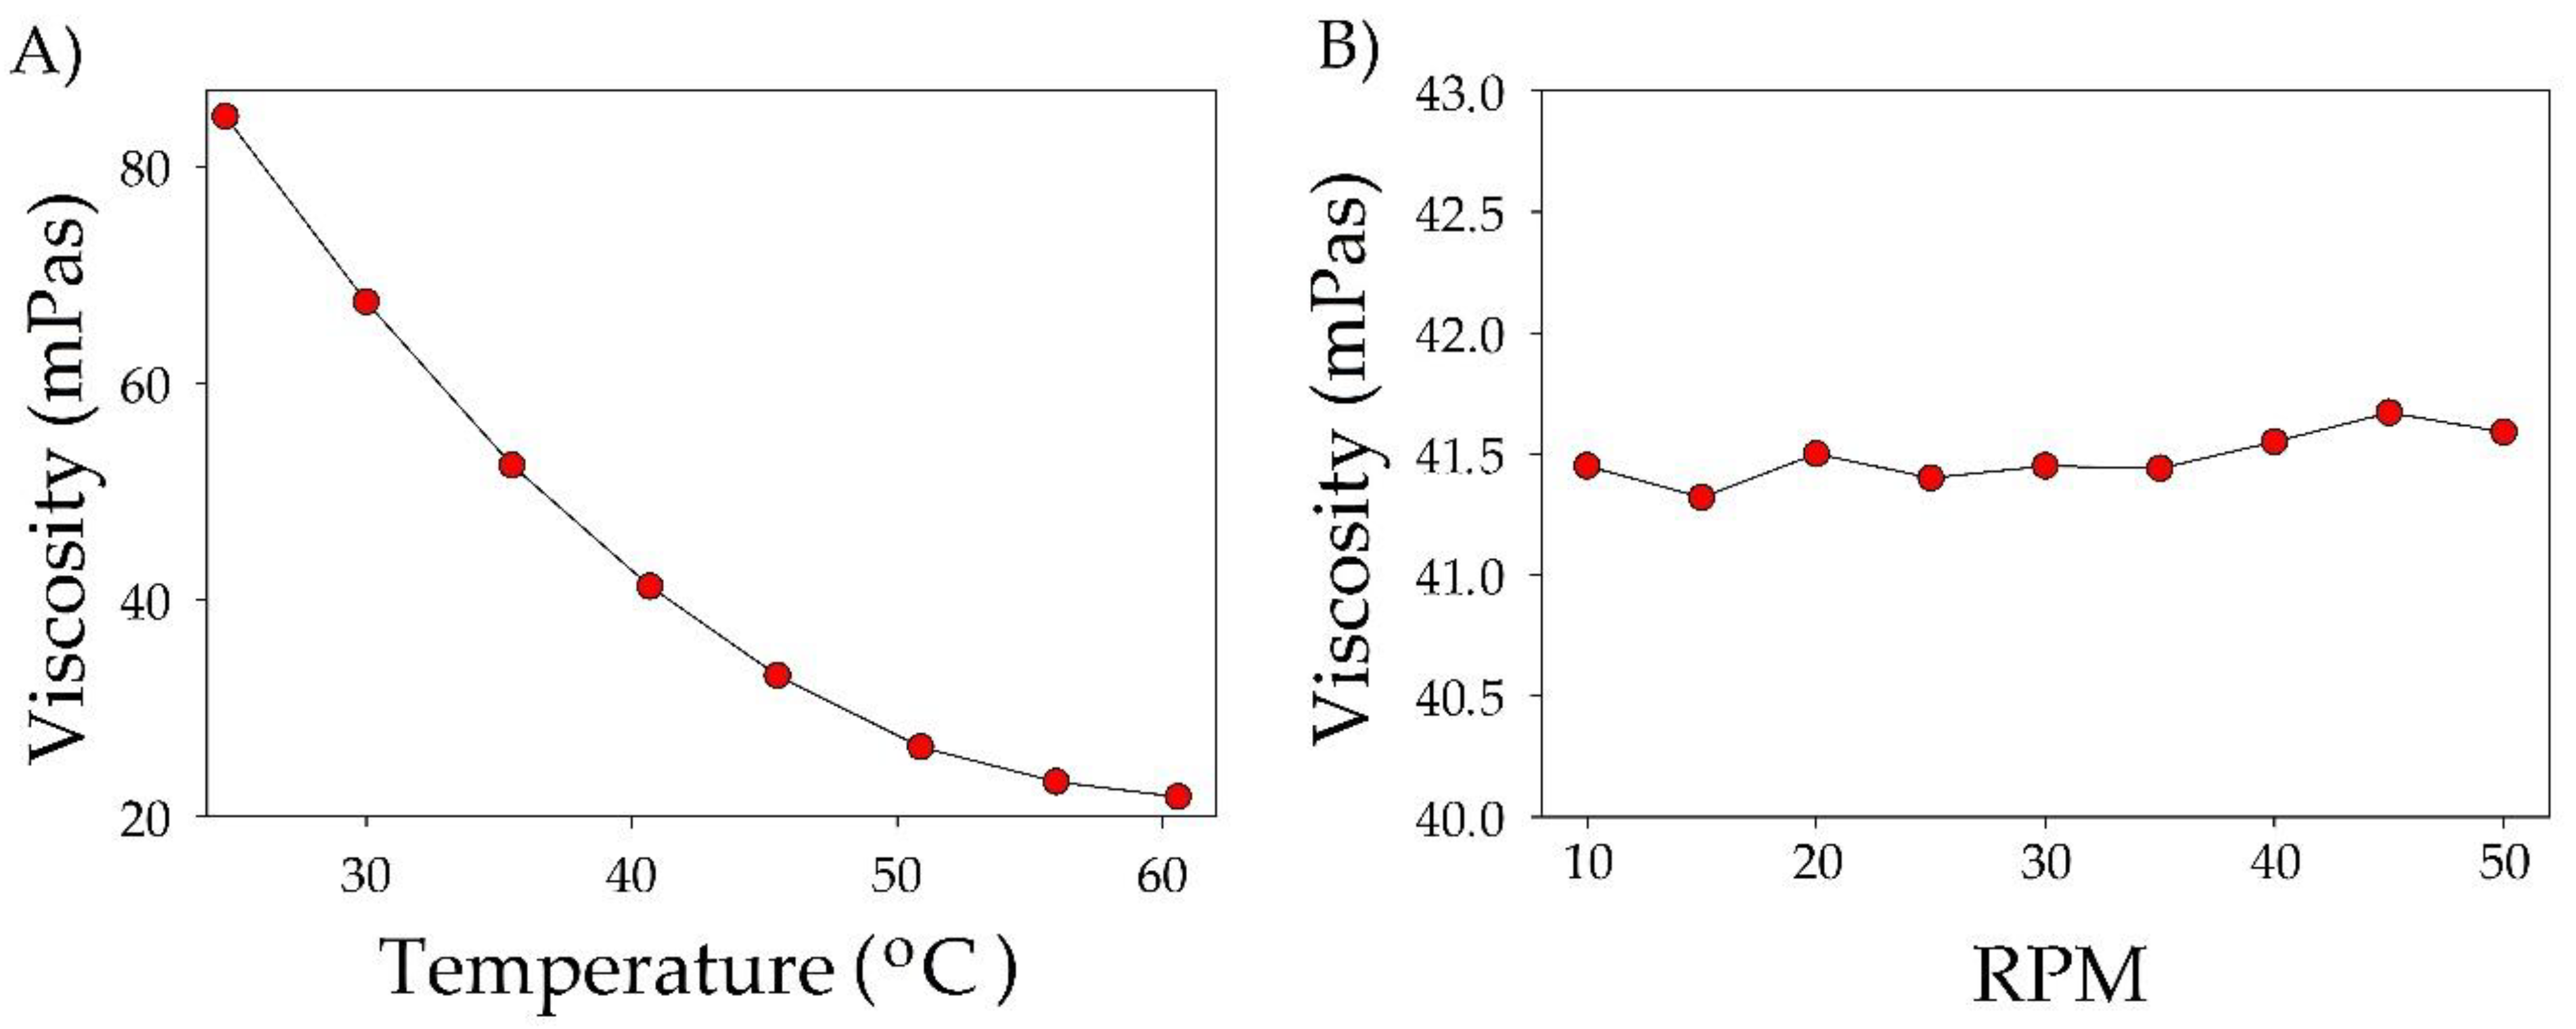
It is well known that DES components and temperature have a dramatic effect on the absorbent density and viscosity. Basic physicochemical parameters of DES strongly influence the ability of the mass transfer capacity, which is of great importance for any changes in the absorption process [54,55]. In order to analyze the flow behavior of synthesized TPABr:TEG (1:3), the viscosity was studied in a function of shear rate ranging 10–50 rpm and temperature range 25–60 °C. The obtained results indicate that the viscosity of TBABr:TEG (1:3) decreases with increasing temperature. The increase in temperature causes the velocity of the particles in the liquid to increase, which reduces the intermolecular forces, resulting in a decrease in the TPABr:TEG (1:3) viscosity (Figure 9A). At room temperature, the viscosity of TPABr:TEG (1:3) is 84.6 mPas; it should be noted that it is much lower compared to the DESs which are presented in the literature. The dynamic viscosity of DES composed of tetrabutylammonium bromide (TBABr) and glycerol (Gly) or ethylene glycol (EG) in a molar ratio of 1:3 were 467.2 and 91.4 mPas, respectively [56]. A decrease in the viscosity value contributes to the increase in the capacity and rate of absorption because it makes the mass transfer easier. Therefore, DESs with lower value viscosities are more desirable for absorption processes.
In Figure 9B, it can be observed that the viscosity of TPABr:TEG (1:3) remains almost constant throughout the range of the applied shear rate ranging. Therefore, it can be concluded that the obtained DES is a Newtonian liquid [57]. The possible shear thinning behavior can be attributed to different strengths of the H-bonding present in TPABr:TEG (1:3) which can start breaking with increasing RPM. However, deeper analysis is required to confirm these assumptions. Similar behavior was also observed for another type of DES [58].
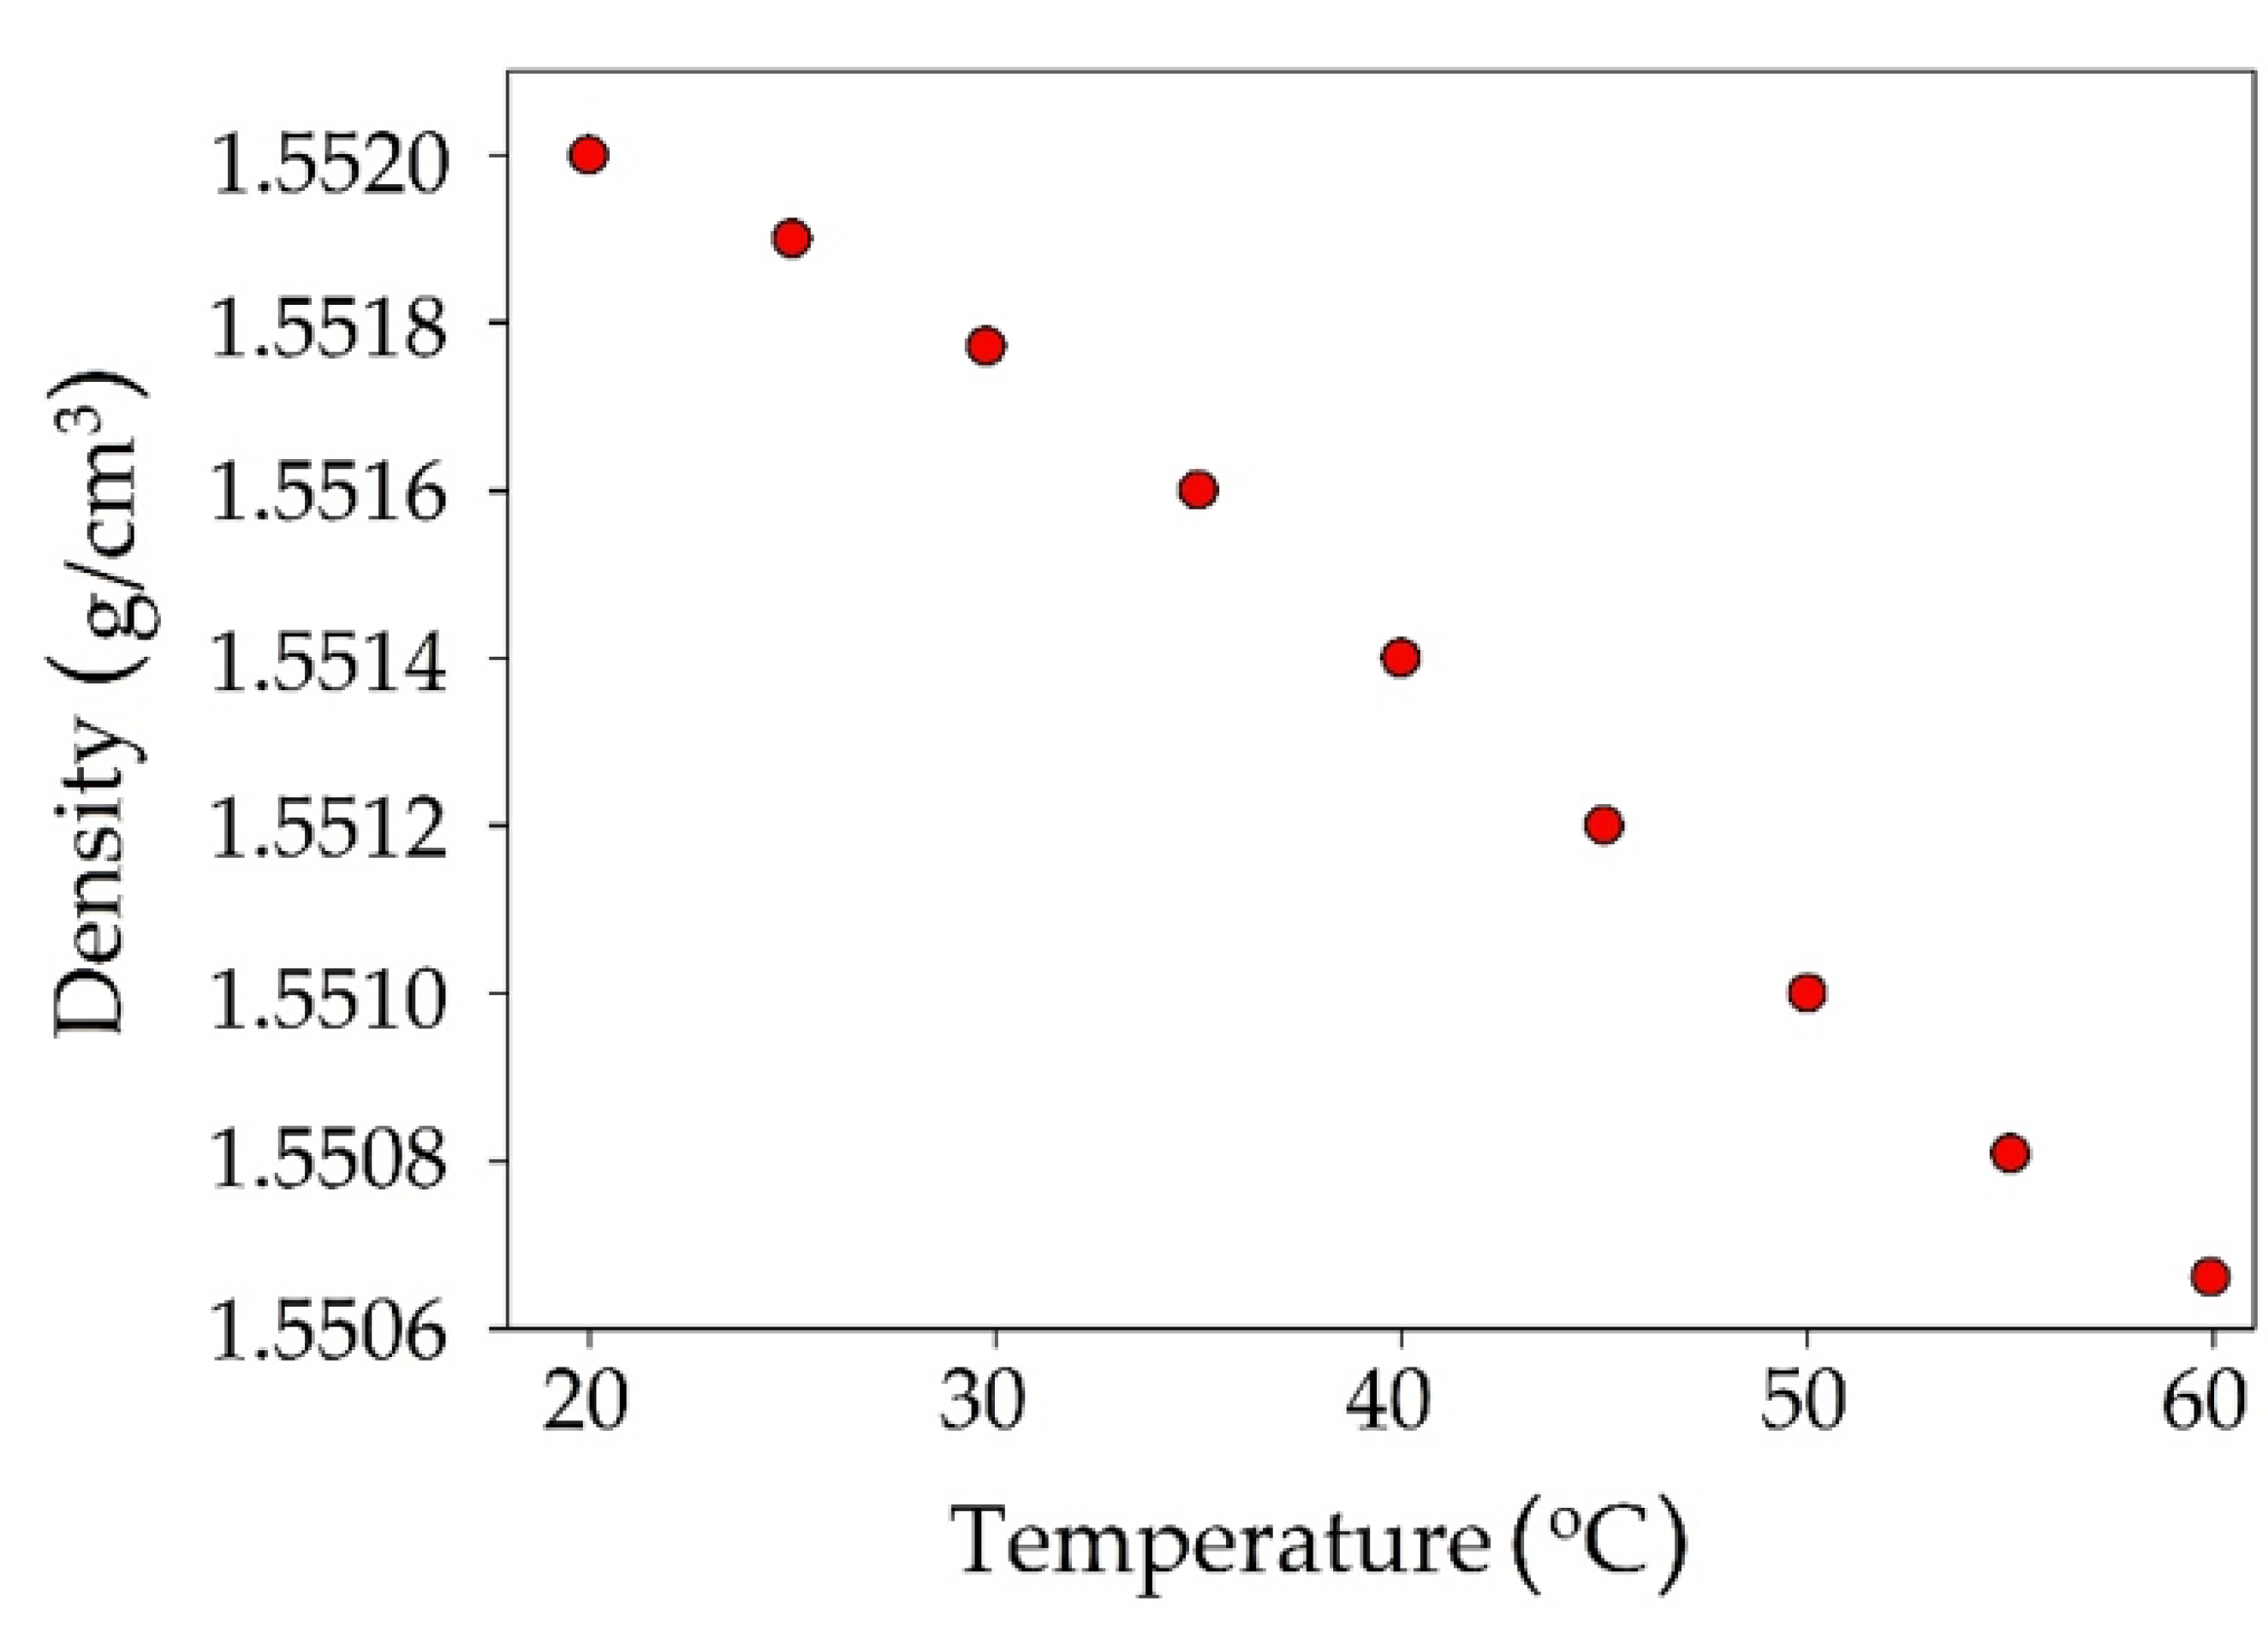
Another tested physicochemical parameter was density. The value of DES density decreases linearly with increasing temperature (Figure 10). At 20 °C, the density TPABr:TEG (1:3) is 1.5520 g/cm3. However, it can be observed that with increased temperature (60 °C), the density value decreases to 1.5508 g/cm3. The lower density values can be due to the fact that during heating, HBA and HBD in DES vibrate harder. These vibrates can cause molecular rearrangements between HBA and HBD, which can contribute to creating weaker interactions in the hydrogen bonding [59]. The obtained density of TPABr:TEG (1:3) is higher compared to the DESs which are composed of quaternary ammonium salts (ChCl or TBABr) [56,60].
3.2.3. Melting Point Measurements
The measured MP of TPABr:TEG (1:3) is −48 °C. As expected, the melting point of TPABr:TEG (1:3) is lower than the MP of pure TEG (−9.4 °C) [61]. The depression in the melting point of the mixture shows the formation of strong intermolecular interactions, i.e., hydrogen bonds between TPABr and TEG [62].
3.3. An Experimental Studies on Absorption of Siloxane Compounds
Optimization of the Absorption Process Conditions
In our research, the processes of absorption using a new DES based on TPABr:TEG (1:3) were carried out for purification of the model biogas stream from L2, L3, and D4 pollutants. The absorption processes were optimized in terms of the volume of TPABr:TEG (1:3), model biogas flow, and temperature.
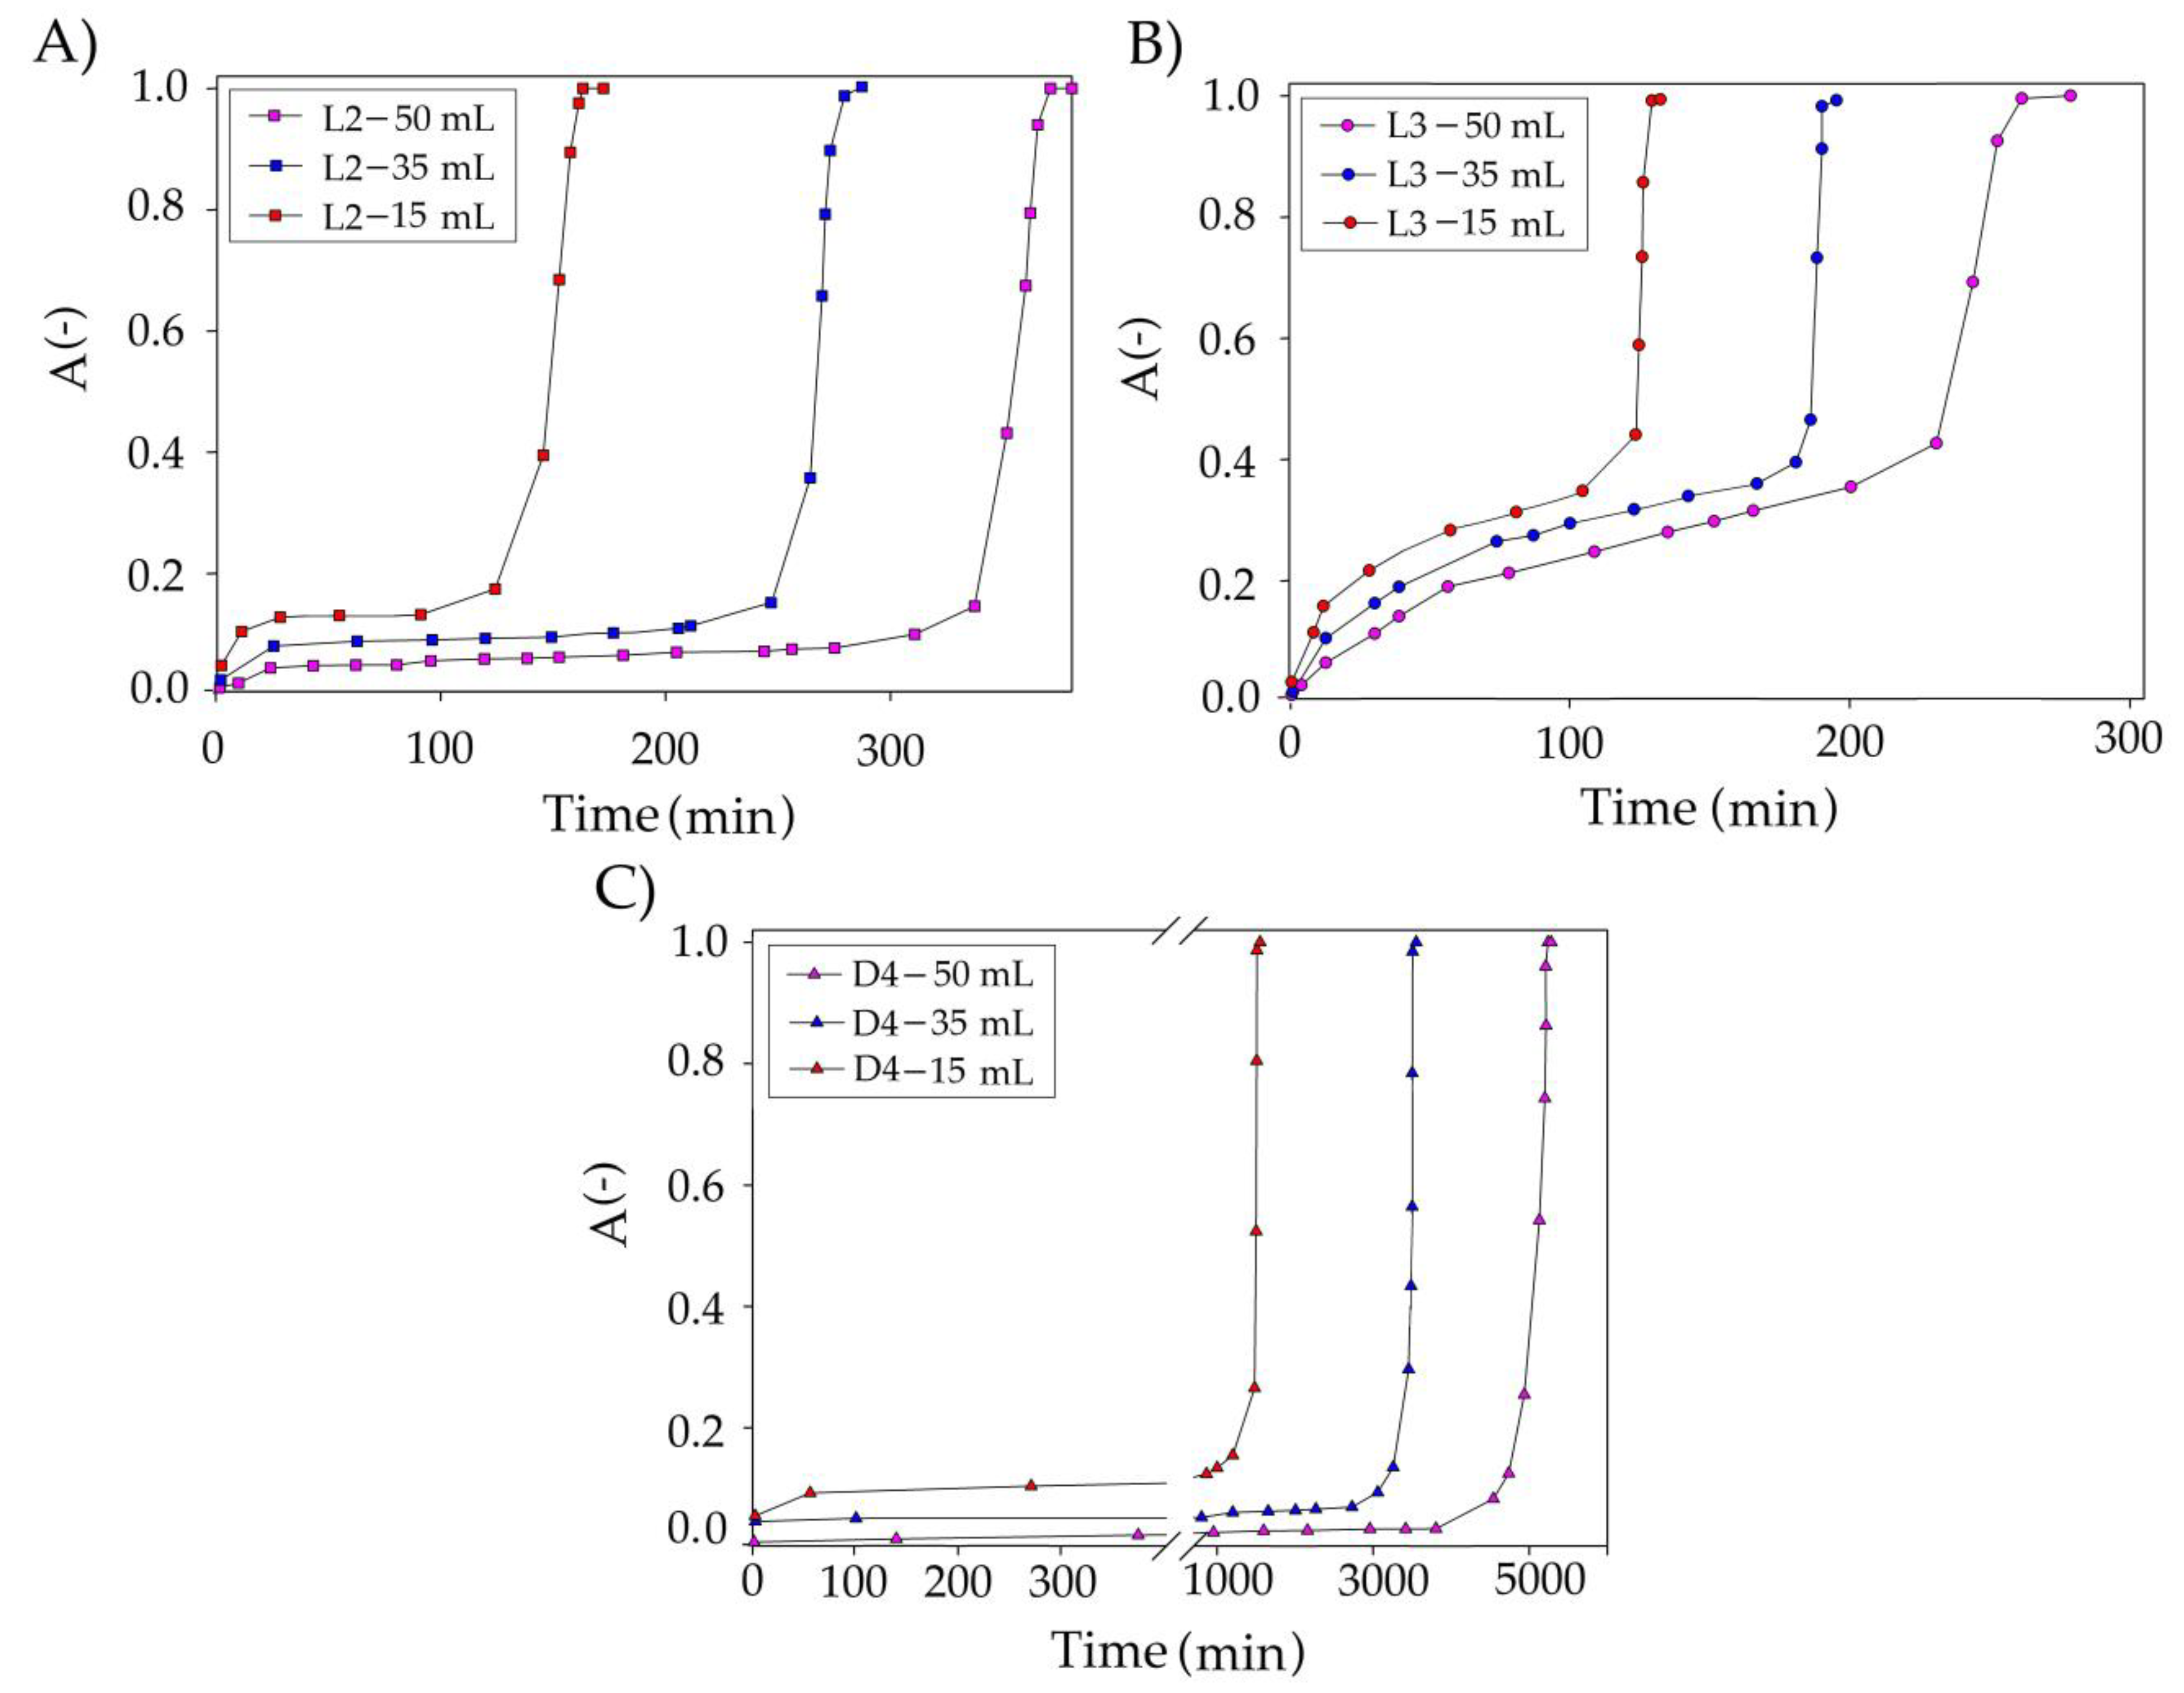
The first optimized parameter was the volume of the TPABr:TEG (1:3) in the range of 15–50 mL/min (Figure 11). The results show that the volume of DES has a significant impact on the overall siloxane capture process. As the volume of DES increases from 15 to 50 mL/min, the DES saturation time increased from 150 to 320 min (L3—Figure 11B), from 140 to 400 min (L2—Figure 11A), and from 1551 to 5281 min (D4—Figure 11C). The increase in saturation time can be explained by increases in the contact time between the siloxane gas phase and the absorbent [63]. Increasing the volume of DES also contributes to an increase in the amount of active substance (TPABr:TEG (1:3)) and an increase in the number of active sites that are responsible for capturing of the siloxanes from DES.
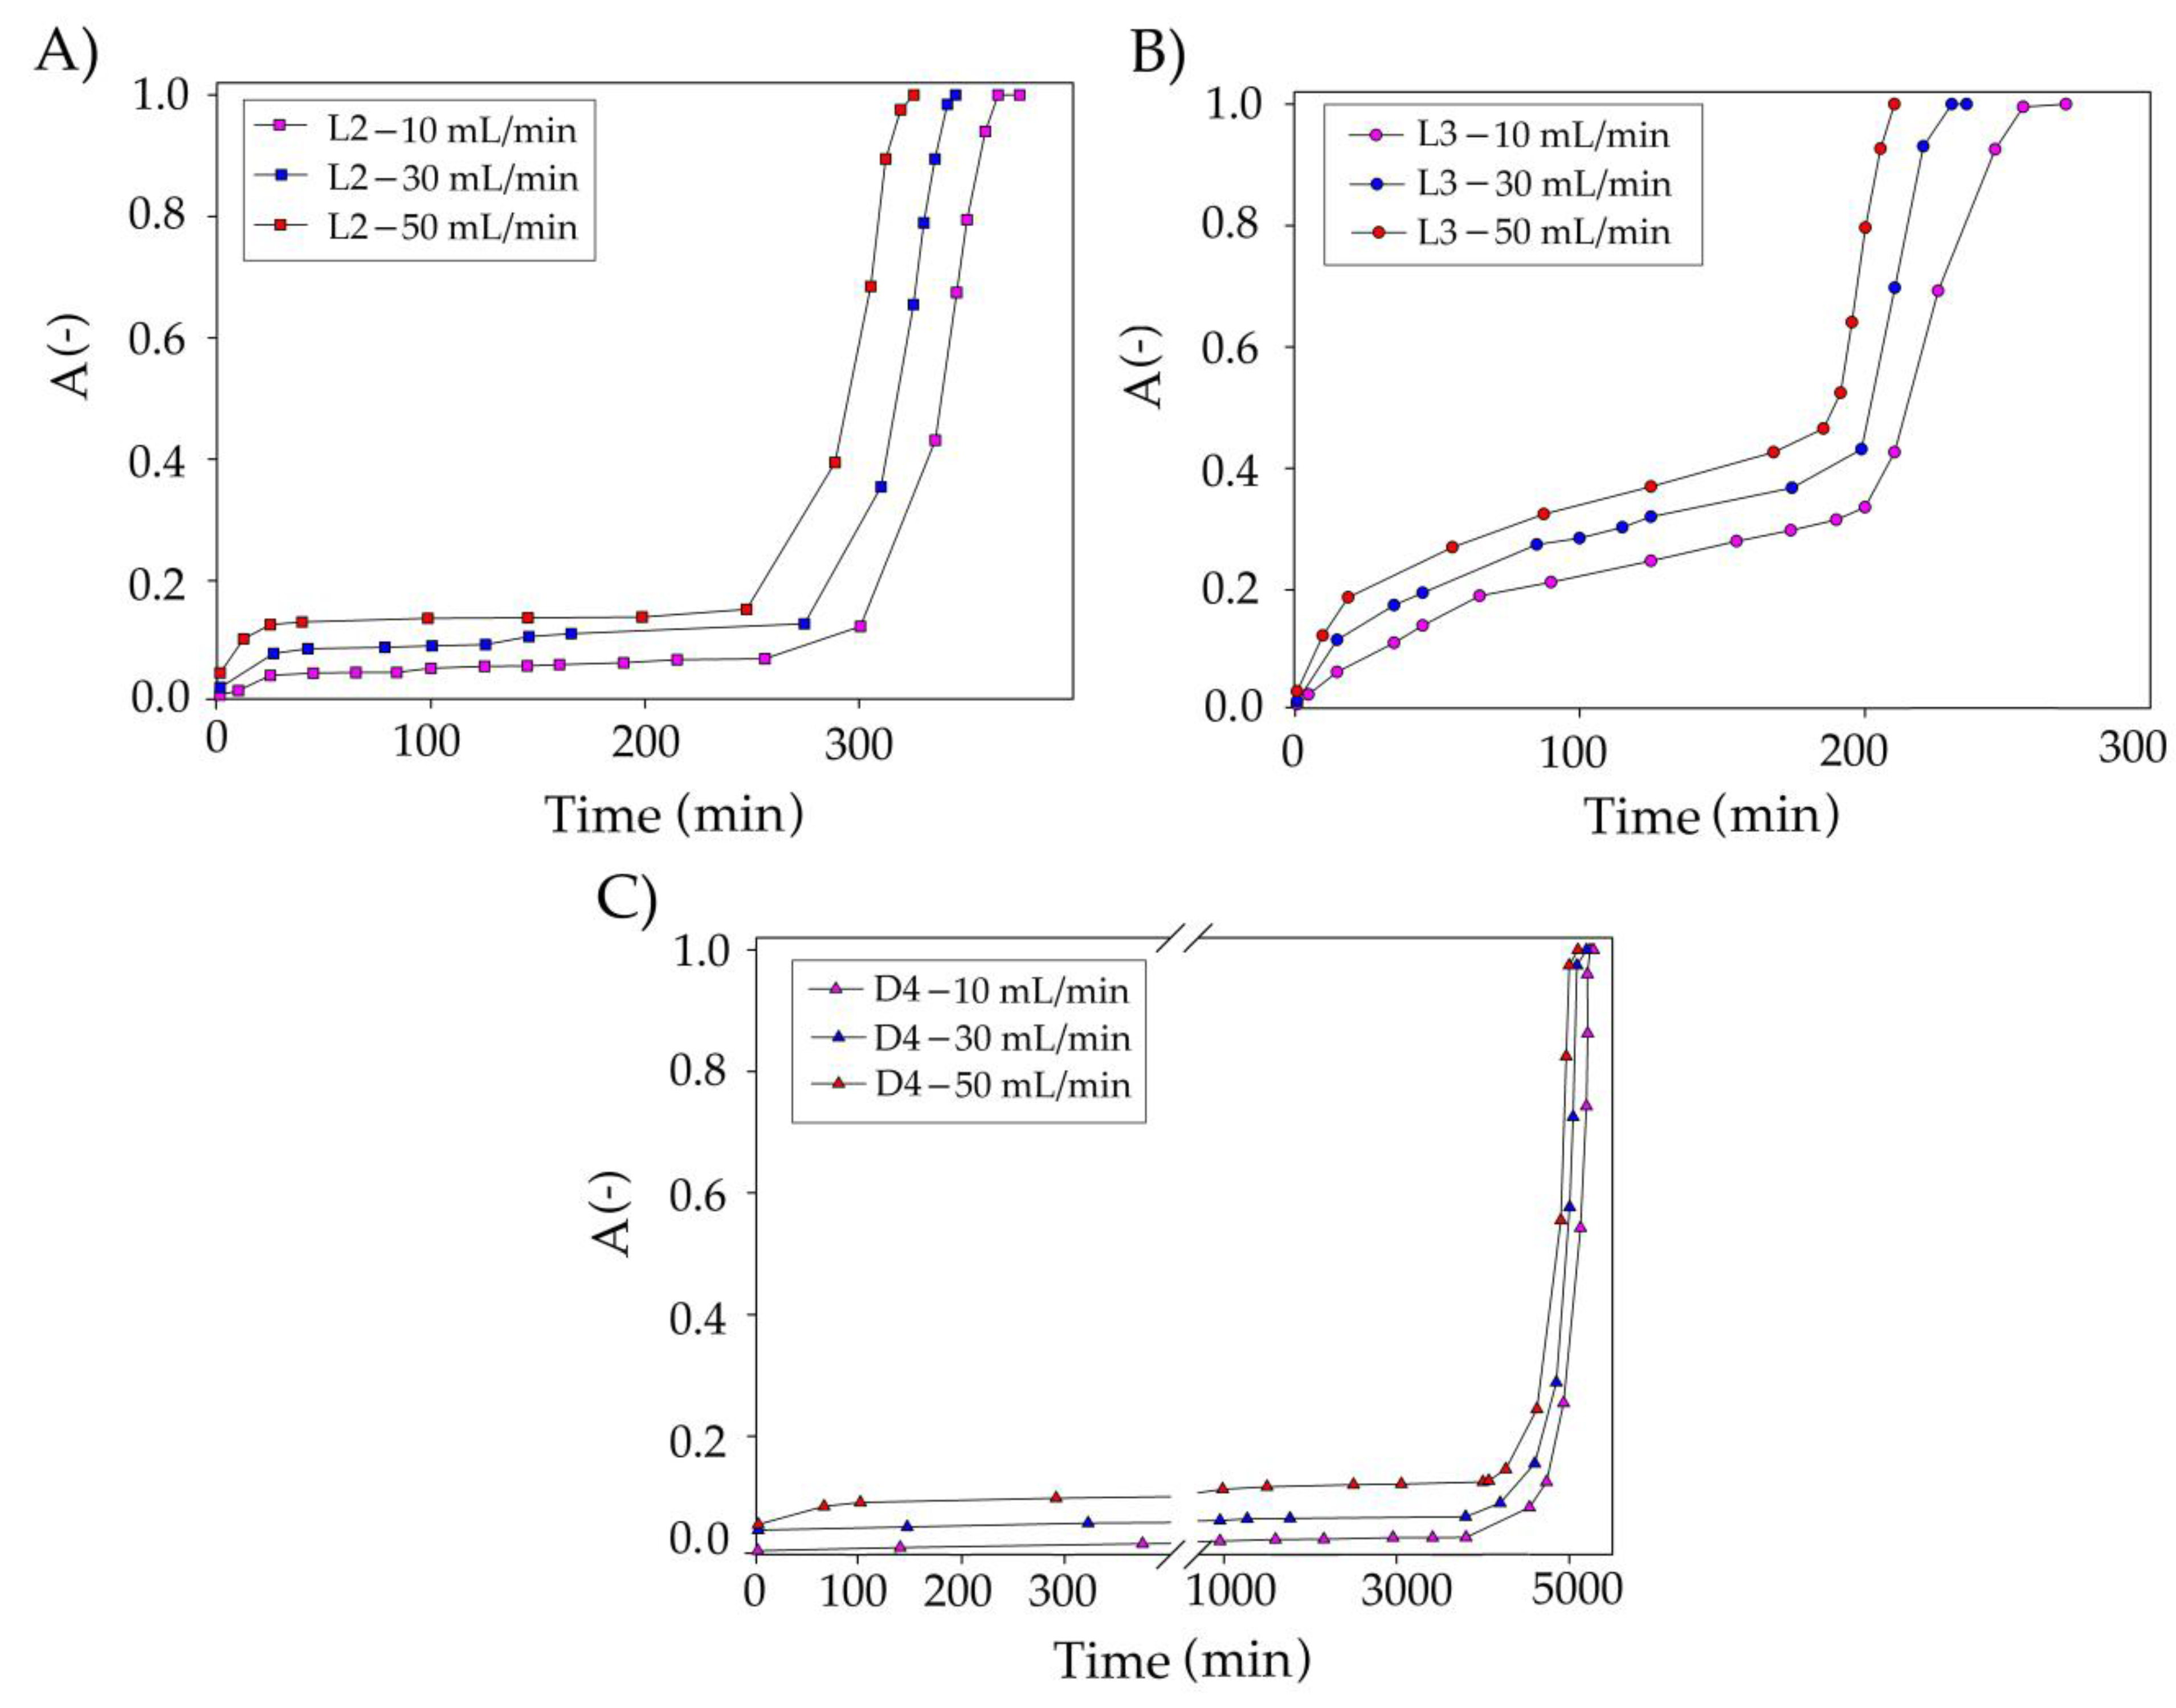
The next studied parameter was model biogas flow rate in the range of 10–50 mL/min (Figure 12). The results indicate that the flow rate has only a minor effect on siloxane uptake compared to DES volume. The conducted research indicates that an increase in the flow rate from 10 to 50 mL/min slightly decreased the effectiveness of siloxane removal from the model biogas stream. Similar results were observed in the previous studies [29,64]. In the industrial technologies used with the use of a water scrubber, a flow of 88 mL/min is used to remove CO2 or H2S [65], whereas when using an amine scrubber, flows of 30 mL/min are used [66]. The reduction in the flow rate may result from the different viscosities of the use of the absorbent. Therefore, the assumed optimal value of 50 mL/min seems to be the rational and comparable value.
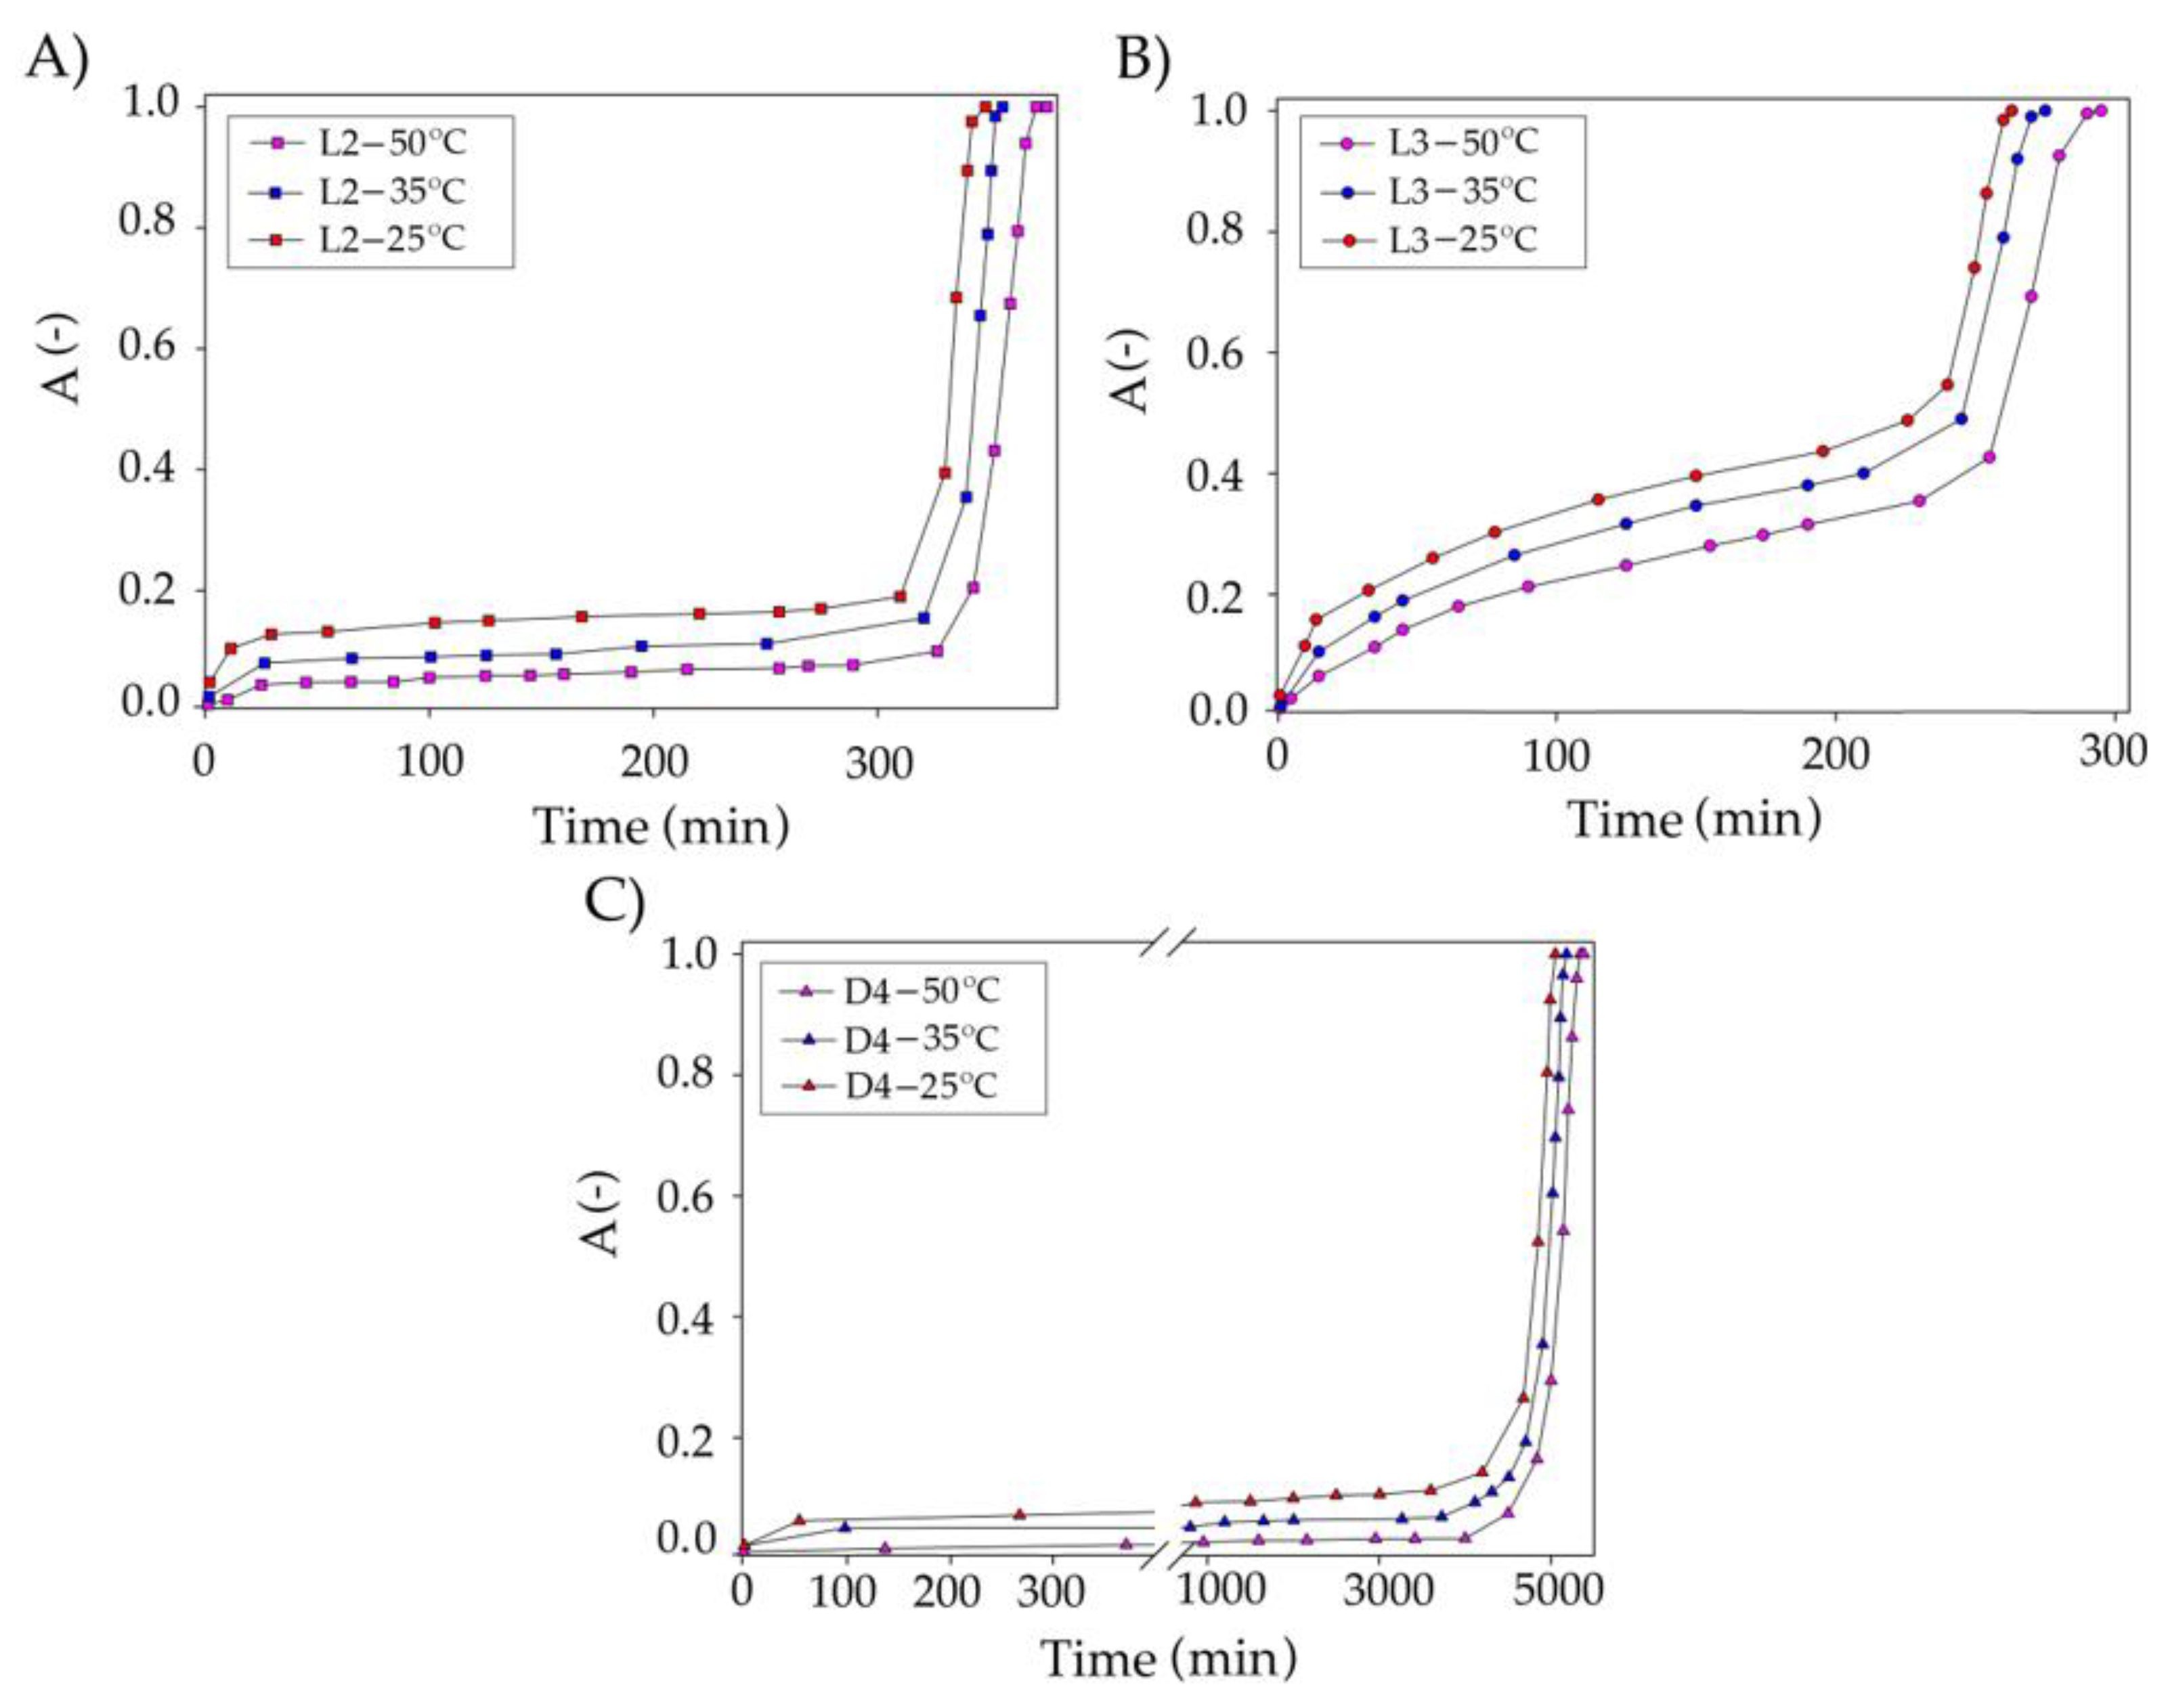
The temperature in the range of 25–50 °C was selected as the last parameter for optimizing the absorption conditions (Figure 13). An increase in temperature causes decreases in TPABr:TEG (1:3) viscosity. The lower viscosity improves the mass transfer efficiency and, hence, the siloxane removal efficiency should be higher. However, increasing the temperature does not extend the absorption process too much. This is likely due to the fact that the absorption process is normally exothermic [67]. Therefore, a temperature of 25 °C was adopted as optimal.
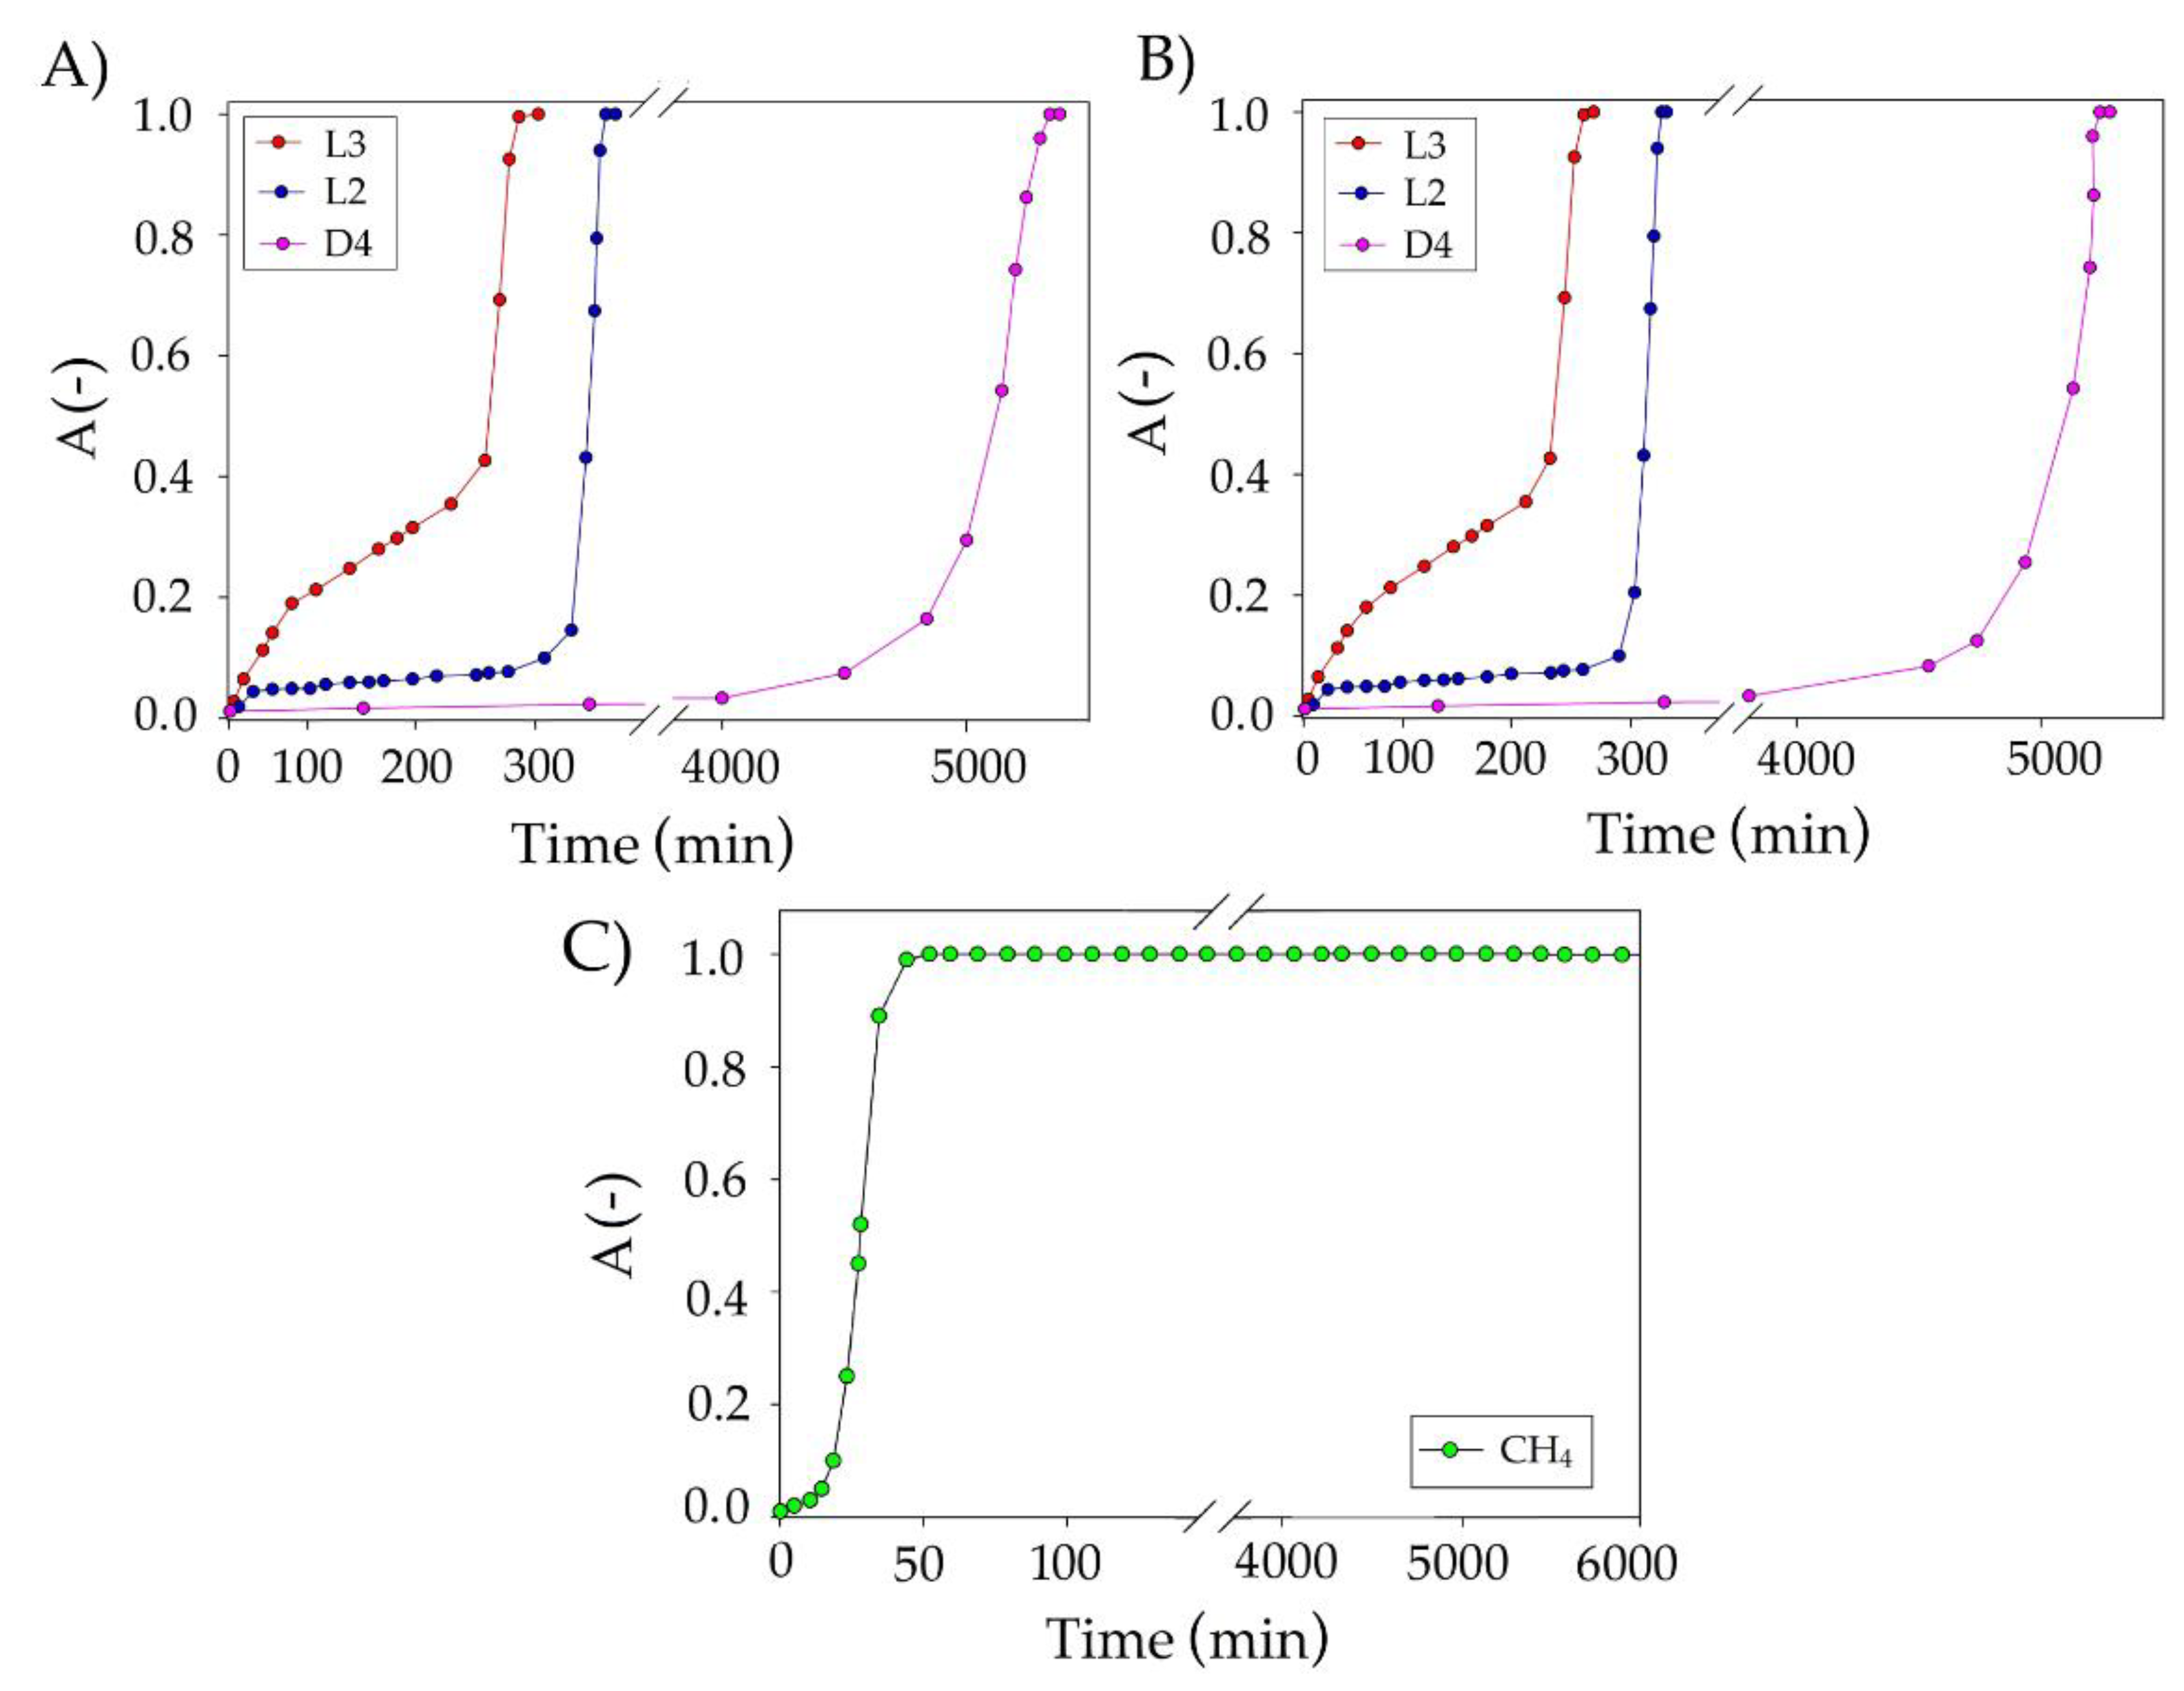
Owing to the conducted research, the optimum conditions for the removal of siloxanes from the model biogas stream were selected as a temperature of 25 °C, a DES volume of 50 mL, and a flow rate of 50 mL/min. The obtained dependence of the absorption efficiency on the duration of the absorption process of individual pollutants is shown in Figure 14A (with the use of pure nitrogen) and Figure 14B (with the use of a mixture of nitrogen and methane gases in the volume ratio 2:1).
For D4 in pure N2, after 5380 min of absorption process, a sharp increase in the supersaturation value was observed. While for D4 in the mixture of nitrogen:methane at 2:1 volume ratio, the saturation time was 5300 min. The oversaturation times of the other two siloxanes in N2 were 400 and 300 min, while in N2:CH4 (2:1), they were 375 and 280 min, respectively, for L2 and L3. In the literature, there are very few works that focus on the capture of siloxanes from biogas. The results obtained in our studies can only be compared to the absorption in which the absorbent consists of amines, acids, or bases. However, it is well known that the strong bases and acids contribute to the cleavage of Si-O bonds and convert siloxanes to other volatile compounds with lower boiling points [68].
Devia and Subrenat [15] proposed L2 and D4 absorption into motor oil, cutting oil, and water-cutting oil. The studies showed the best results were obtained for motor oil for which the breakthrough curves obtained to allow for efficient removal of siloxanes were for 191.4 min (L2) and for 47.1 min (D4). The obtained results show that the proposed new DES-based absorbents show a much higher absorption capacity towards siloxanes than conventional solvents. In the studies, apart from monitoring the siloxane absorption process, the concentration of methane was also monitored (Figure 14C). The results show that complete saturation of TPABr:TEG (1:3) with methane occurs after 50 min of the process. The loss of methane in the entire process of siloxane absorption was within 5%.
3.4. FT-IR Studies on Absorption of Siloxane Compounds
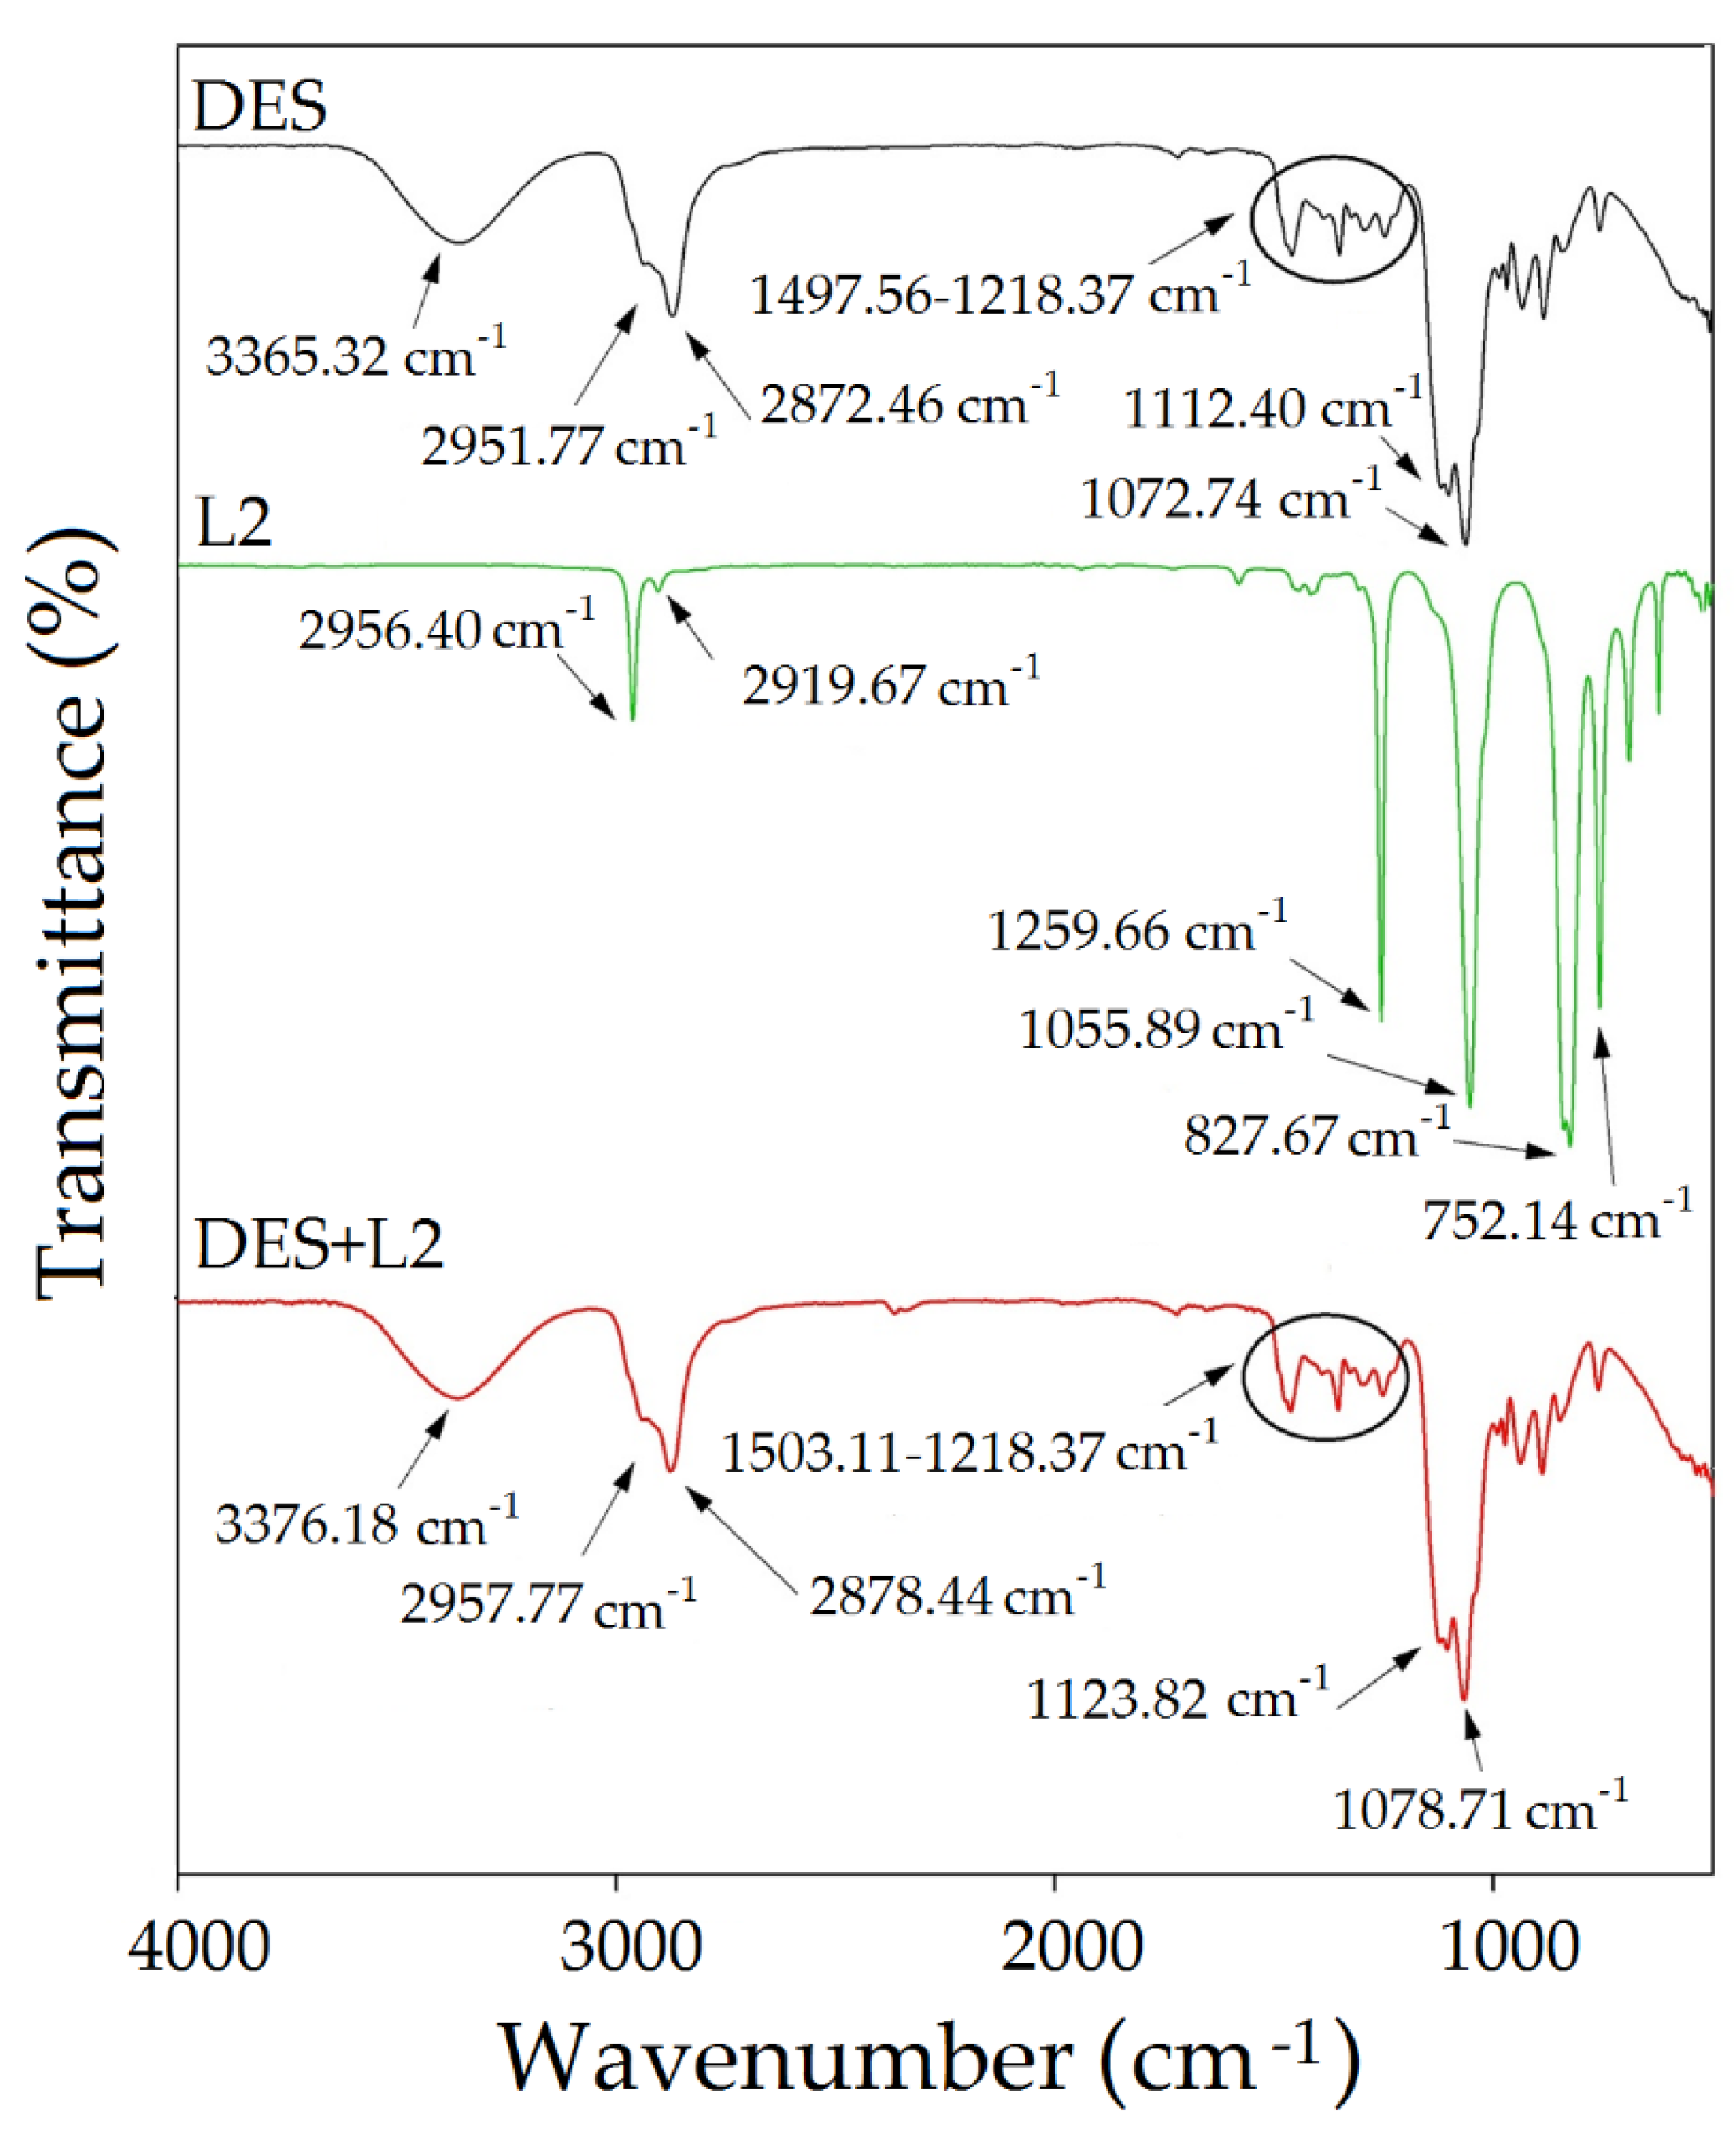
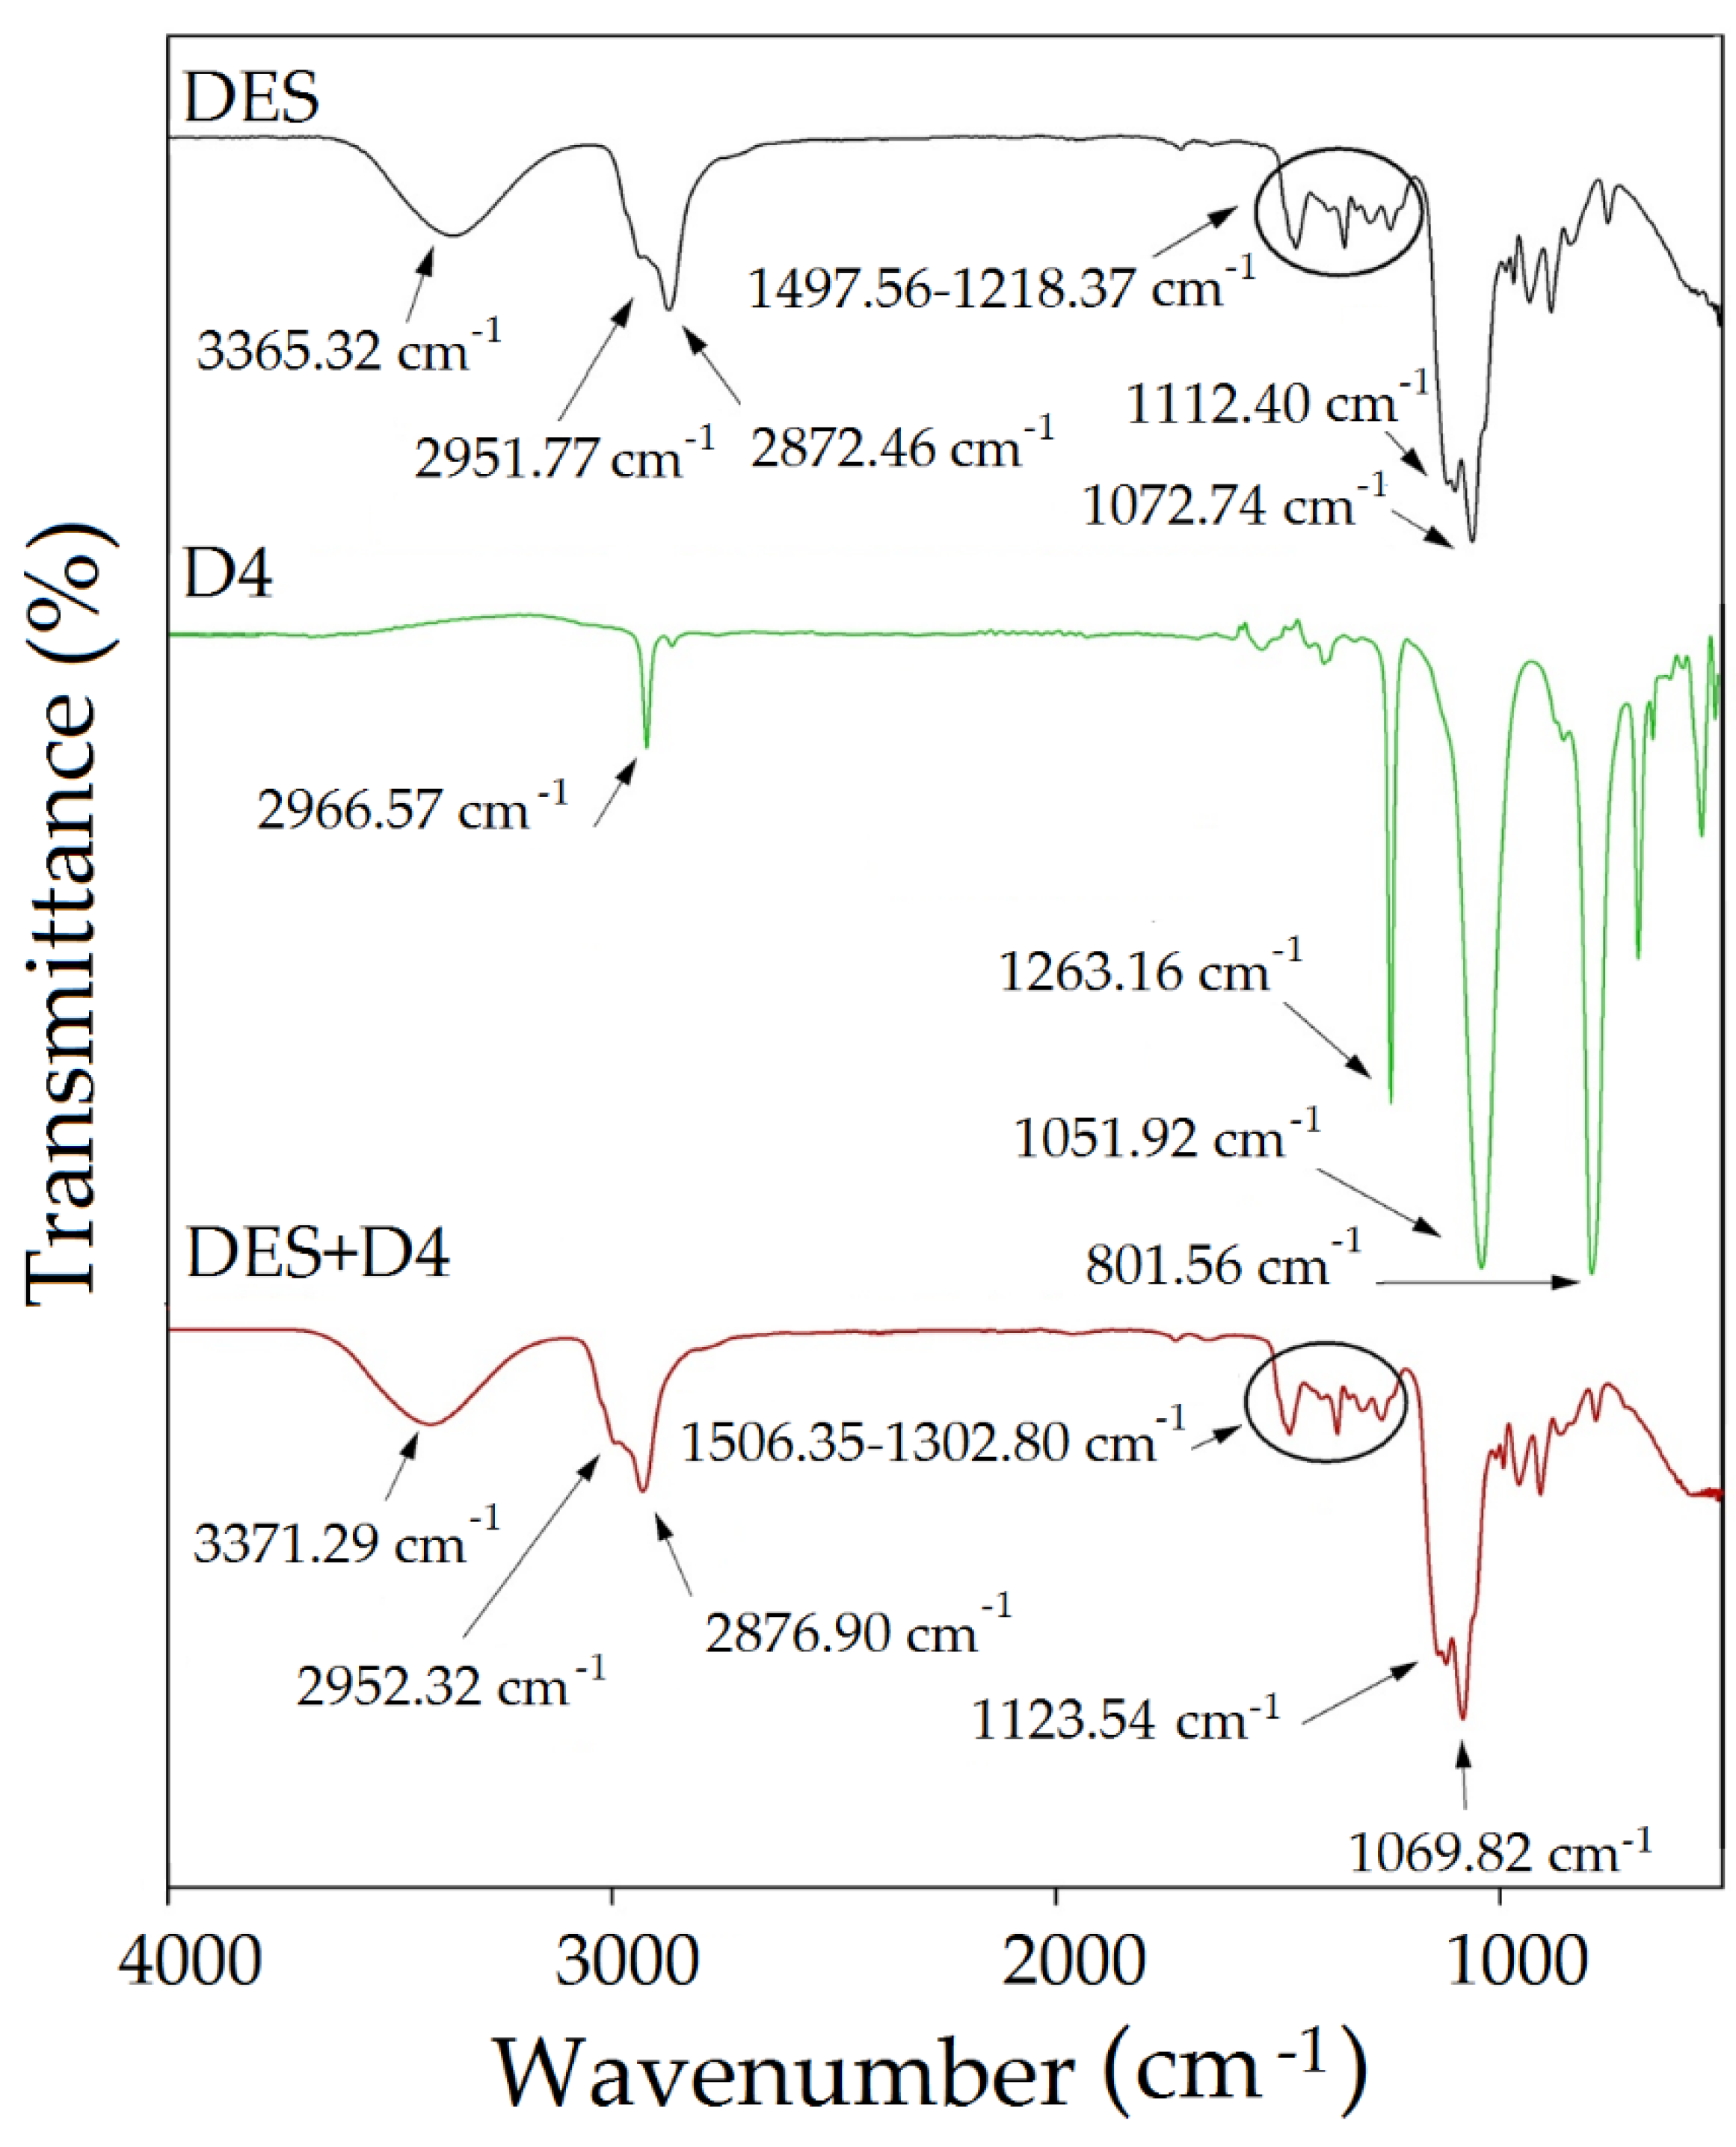
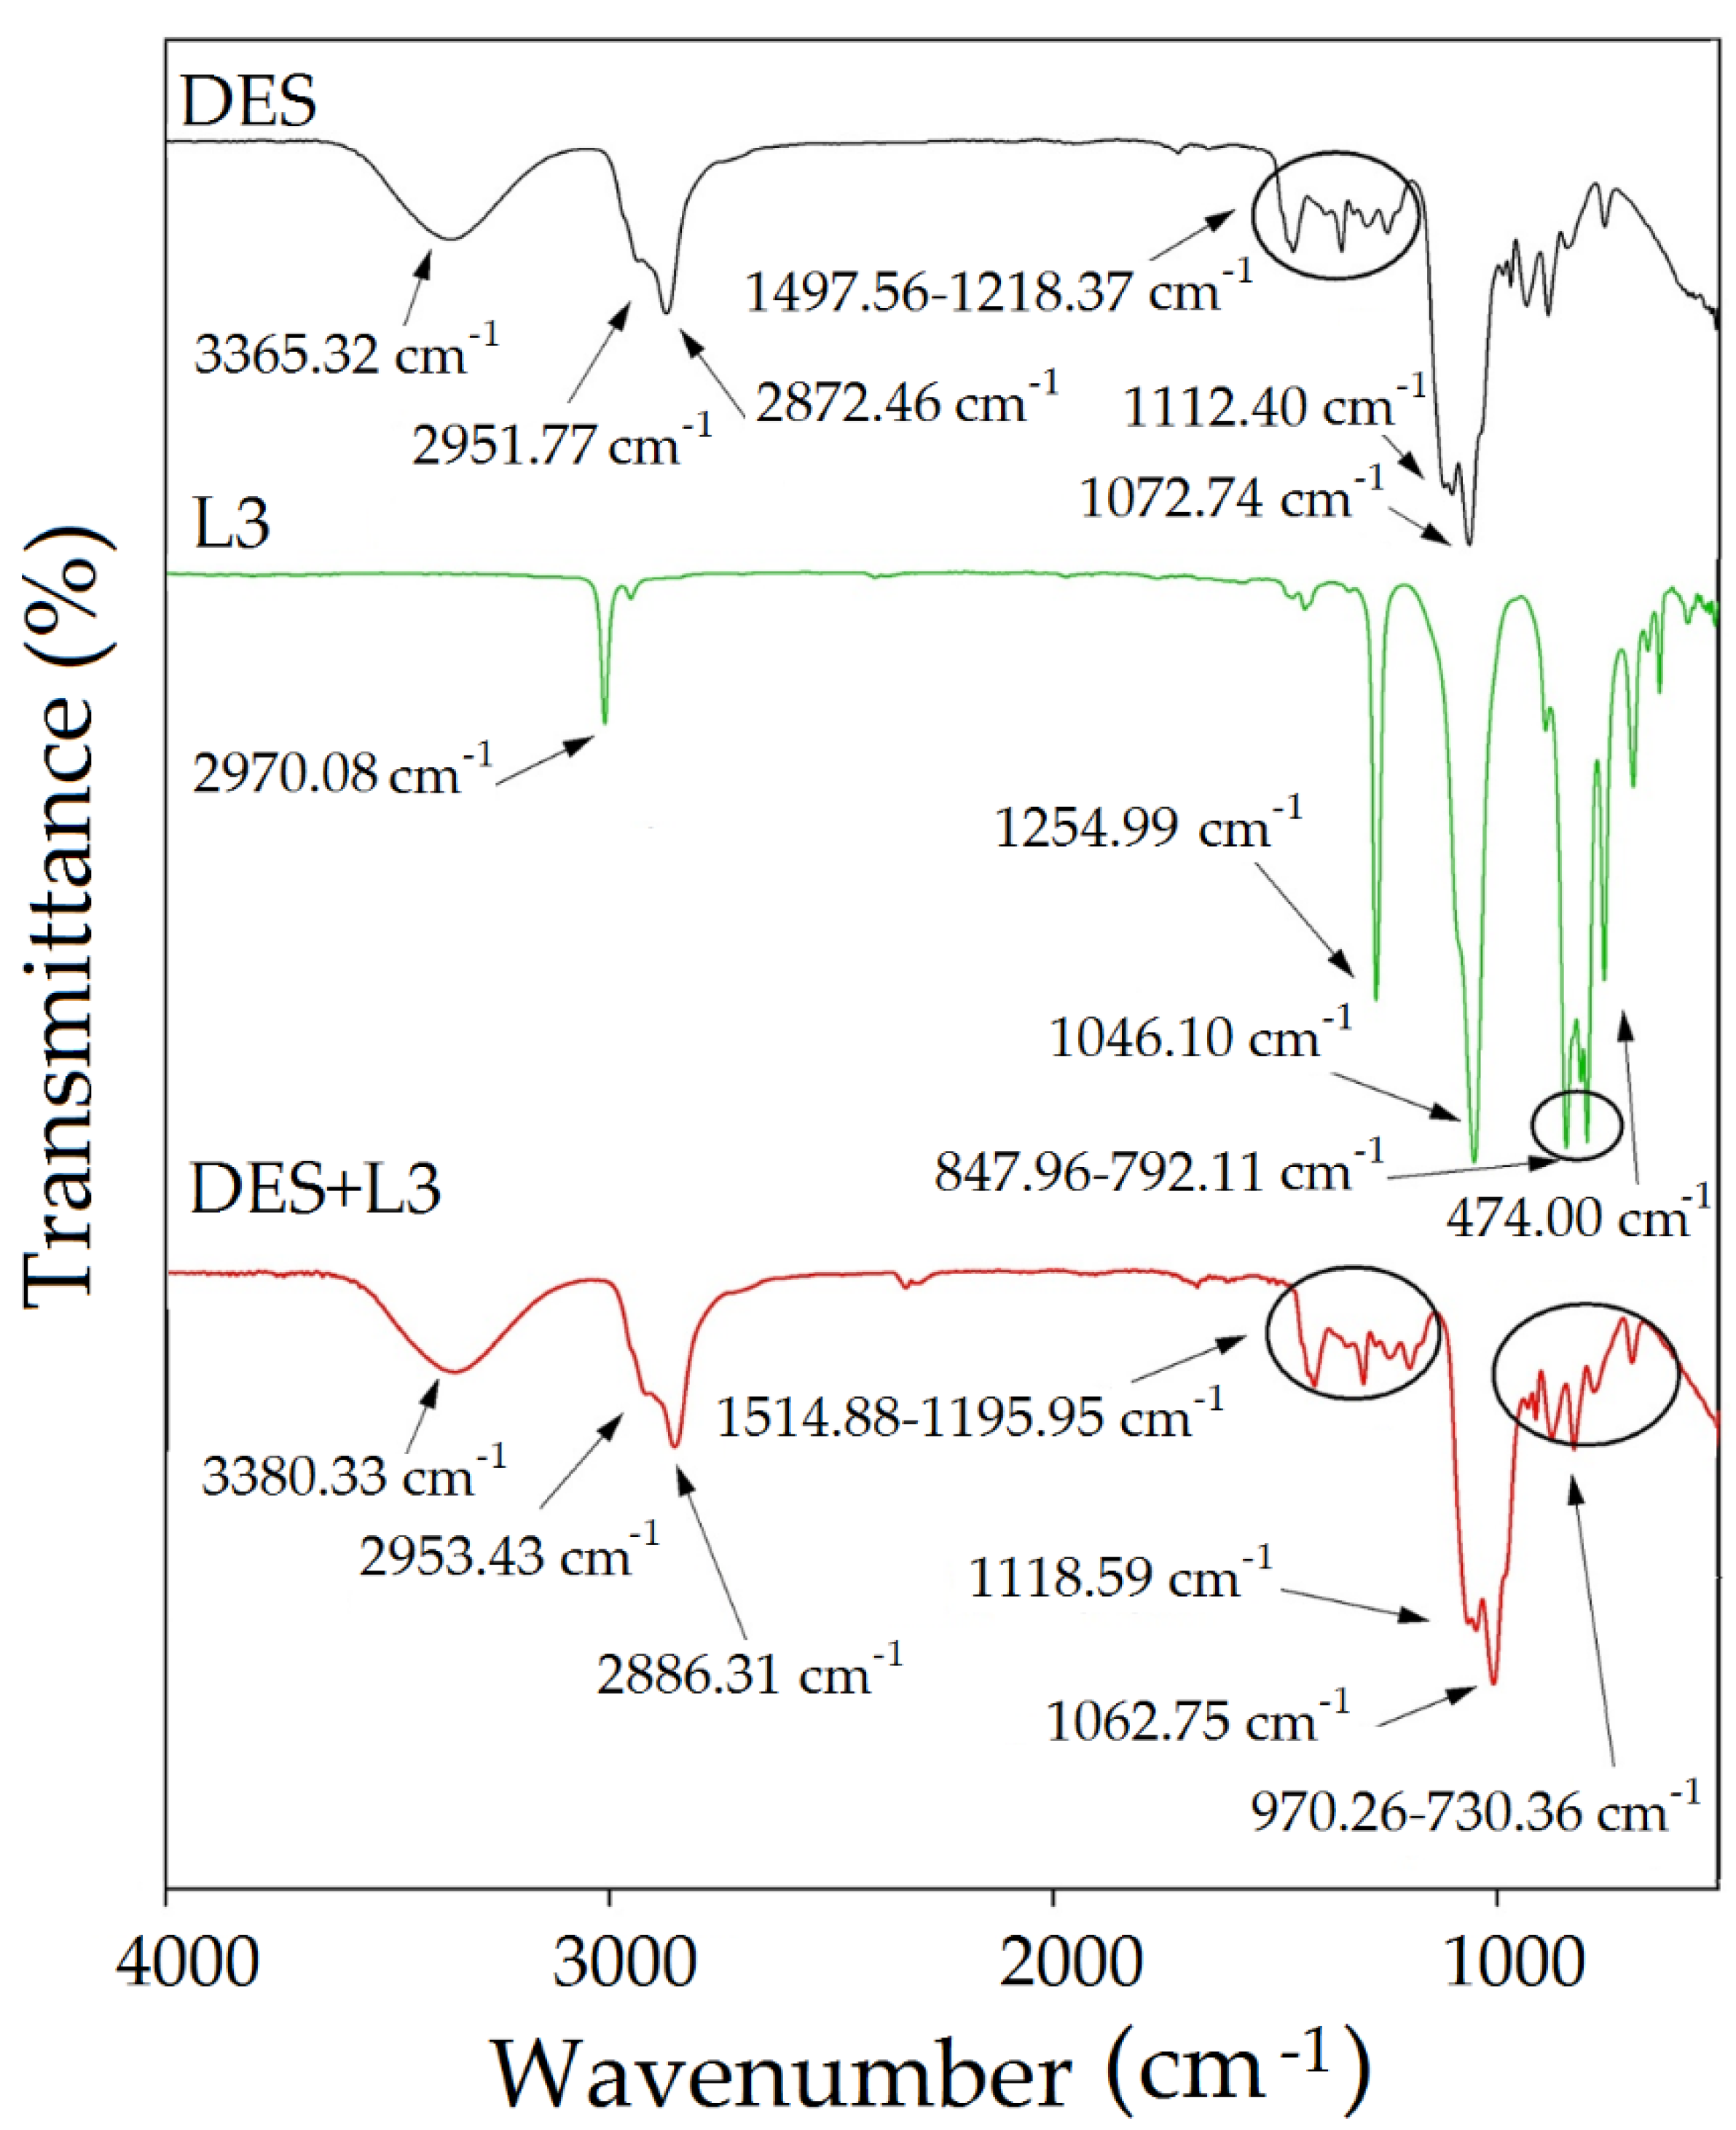
The experimental study on the mechanism of the absorption process of siloxanes was conducted by FT-IR analysis. The obtained spectra of pure TPABr:TEG (1:3) and pure siloxanes were compared with the spectra of TPABr:TEG (1:3) after the absorption process (Figure 15, Figure 16 and Figure 17). All of them identified the bands which can be observed in the FT-IR spectrum for pure siloxanes: Si-O-Si antisymmetric stretch bonds in the range 1000–1100 cm−1 and Si-C symmetric stretch bonds at 800 cm−1 are visible in the spectrum of the TPABr:TEG (1:3) after the absorption process [69]. In the spectrum after the absorption process, new peaks or significant band shifts cannot be observed. Only shifts of the -OH stretching vibration and aliphatic C-H stretching bonds are visible, which confirms the phenomena of physical absorptions. In addition, the shifts of -OH stretching vibration indicate that the hydroxyl group from TPABr:TEG (1:3) may interact with the oxygen atoms from siloxanes by forming hydrogen bonds, which is in accordance with the siloxane absorption [70]. Additionally, a shift of the bands originating from group C-O-C towards higher values from 1112.40 to 1123.83 cm−1 (Figure 15), 1123.54 cm−1 (Figure 16), and 1118.59 cm−1 (Figure 17) are observed. These shifts indicate that siloxane absorption can also occur through the interaction of silicon atom (Si-OH—827.67 cm−1 and SiO—752.14 cm−1 (Figure 15), Si-O—801.56 cm−1 (Figure 16), Si-OH and Si-O in the range 847.96–792.11 cm−1 (Figure 17)) with the oxygen atoms with C-O-C in the DES (1:3) [50].
3.5. Regeneration of DES
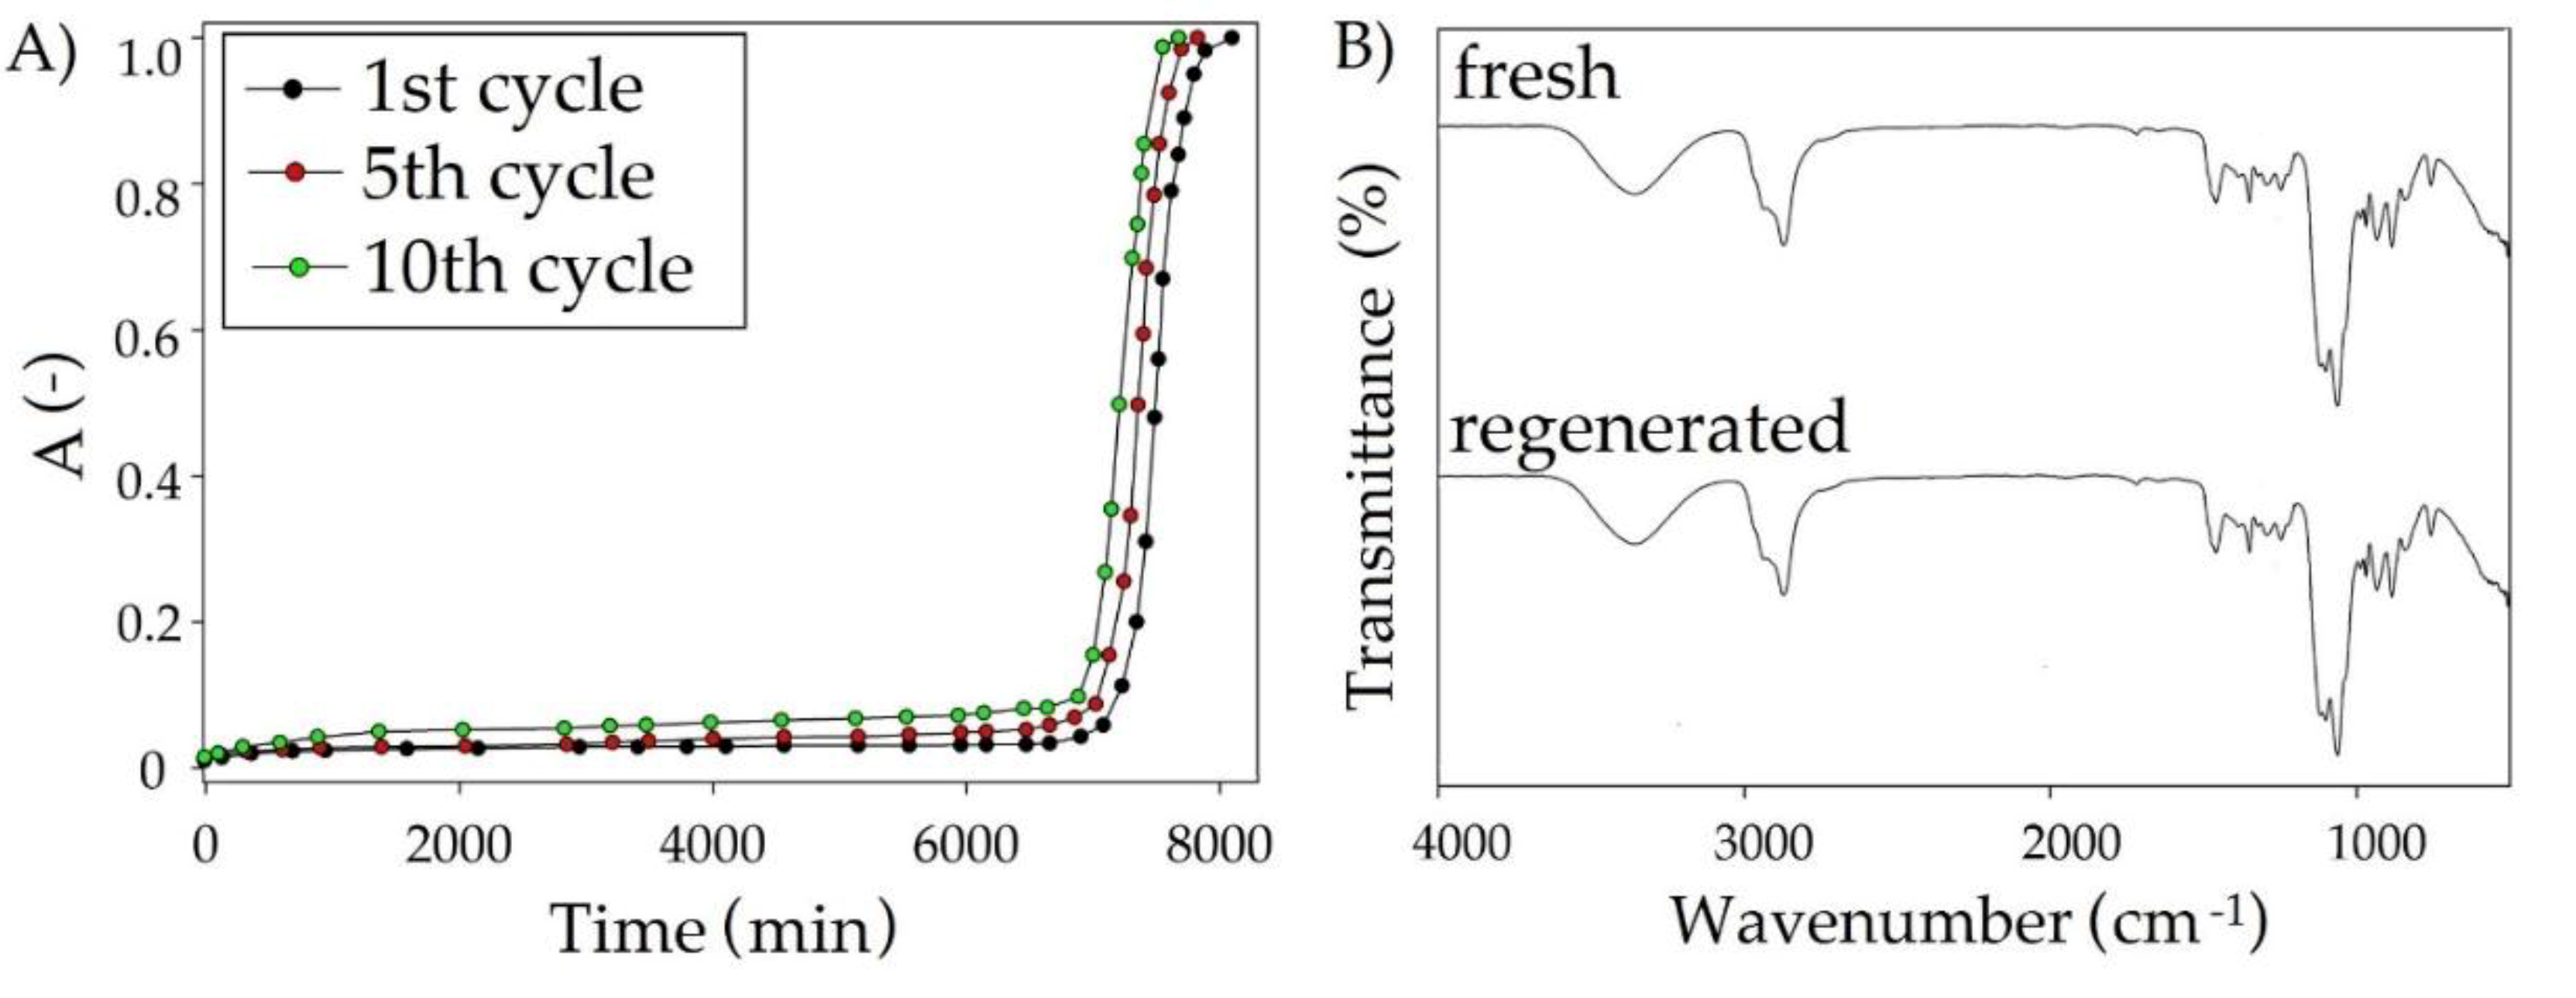
From the industrial point of view, the regeneration processes of absorbents are extremely important because they determine the final costs. The obtained results indicate that siloxanes can be completely removed from TPABr:TEG (1:3) using nitrogen barbotage conducted at a temperature of 90 °C for 3 h. TPABr:TEG (1:3) shows tall and almost unchanging L2, L3, and D4 removal efficiency for up to 10 regeneration cycles (Figure 18A). In addition, the thermal stability of TPABr:TEG (1:3) by means of FT-IR analysis was confirmed. The comparison of fresh and regenerated TPABr:TEG (1:3) spectrum indicates a lack of additional shifts and peaks in the regenerated TPABr:TEG (1:3) (Figure 18B). This confirms stability and effective regeneration of TPABr:TEG (1:3).
4. Conclusions
In the paper, the solubility of siloxanes (L2, L3, and D4) in deep eutectic solvents (DESs) composed of tetrabutylammonium bromide and glycols as well as conventional solvents was investigated. The siloxane solubility was predicted by means of the COSMO-RS model where the highest solubility of both linear and cyclic siloxanes was present in the DES composed of TPABr and TEG in a 1:3 molar ratio. The chemical structures of TPABr:TEG (1:3) and the interaction structures between TPABr and TEG as well as between DES and siloxanes were reported using FT-IR spectroscopy. Furthermore, in order to confirm the interactions, the analyses of σ-profiles and σ-potentials were used.
The results of physicochemical properties indicate that TPABr:TEG (1:3) is a Newtonian liquid due to the lack of viscosity changes during shear changes, which contribute to only minor changes in siloxane removal efficiency with increasing temperature. In turn, carrying out the absorption process at a temperature of 25 °C is beneficial from an economic point of view. Under optimum conditions (50 mL of TPABr:TEG (1:3), 50 mL/min flow rate, and temperature 25 °C), the L2, L3, and D4 can be removed with high efficiency for 375, 280, and 5300 min, respectively. These are much better absorption efficiencies compared to mineral oils. In addition, TPABr:TEG (1:3) also can be easily regenerated up to 5 cycles without significantly changing the siloxane absorption efficiency. The studies on the absorptive mechanism to remove siloxanes indicate that the reason for the high solubility siloxanes in TPABr:TEG (1:3) is the formation of the strong hydrogen interactions between -OH group from DES molecule, and -O- a group from siloxanes.
The cost of the absorption process mainly depends on the type of absorbents. The estimated capital cost of the absorption process based on TPABr:TEG (1:3) is 126.05 €/L [71,72]. The DES price is higher than conventional absorbents prices which are 9.17 €/L for motor oil 5W40 from Elf) [73]; 33.42 €/L for cutting oil Hochleistungs-Schneidöl Alpha 93 from Jokish® GmbH [74]. However, it should be remembered that DES can be used for up to 5 cycles without changing the high efficiency of removing siloxanes from biogas. The initial price of 126.05 €/L can drop to 25.21 €/L. Therefore, DESs can be used as alternative absorbents.
Author Contributions
Conceptualization, E.S. and P.M.-C.; methodology, E.S. and P.M.-C., investigation, P.M.-C., E.S., and J.G.; data curation, P.M.-C. and E.S.; writing—original draft preparation, P.M.-C. and E.S.; writing—review and editing, J.G.; visualization, E.S. and P.M.-C., supervision, J.G., funding acquisition, P.M.-C. All authors have read and agreed to the published version of the manuscript.
Funding
This research was funded by ARGENTUM TRIGGERING RESEARCH GRANDS program as part of the Excellence Initiative—Research University program within the grant project (No. DEC-34/2020/IDUB/I.3.3).
Institutional Review Board Statement
Not applicable.
Informed Consent Statement
Not applicable.
Data Availability Statement
The data presented in this study are available on request from the corresponding author.
Conflicts of Interest
The authors declare no conflict of interest.
References
- Perea-Moreno, M.-A.; Salmeron-Manzano, E.; Perea-Moreno, A.-J. Biomass as Renewable Energy: Worldwide Research Trends. Sustainability 2019, 11, 863. [Google Scholar] [CrossRef] [Green Version]
- Meyer, A.K.; Ehimen, E.A.; Holm-Nielsen, J.B. Future European biogas: Animal manure, straw and grass potentials for a sustainable European biogas production. Biomass Bioenergy 2018, 111, 154–164. [Google Scholar] [CrossRef]
- Zhu, T.; Curtis, J.; Clancy, M. Promoting agricultural biogas and biomethane production: Lessons from cross-country studies. Renew. Sustain. Energy Rev. 2019, 114, 109332. [Google Scholar] [CrossRef]
- Scarlat, N.; Dallemand, J.-F.; Fahl, F. Biogas: Developments and perspectives in Europe. Renew. Energy 2018, 129, 457–472. [Google Scholar] [CrossRef]
- Barragán, E.A.; Ruiz, J.M.O.; Tigre, J.D.C.; Zalamea-León, E. Assessment of Power Generation Using Biogas from Landfills in an Equatorial Tropical Context. Sustainability 2020, 12, 2669. [Google Scholar] [CrossRef] [Green Version]
- Persson, M.; Jonsson, O.; Wellinger, A. Biogas Upgrading to Vehicle Fuel Standards and Grid; IEA Bioenergy Task 37; Susanne AUER: Vienna, Austria, 2007. [Google Scholar]
- Rincón, C.A.; De Guardia, A.; Couvert, A.; Wolbert, D.; Le Roux, S.; Soutrel, I.; Nunes, G. Odor concentration (OC) prediction based on odor activity values (OAVs) during composting of solid wastes and digestates. Atmos. Environ. 2019, 201, 1–12. [Google Scholar] [CrossRef]
- Rasi, S. Biogas Composition and Upgrading to Biomethane; University of Jyväskylä: Jyväskylä, Finland, 2009; ISBN 978-951-39-3618-1. [Google Scholar]
- Carrera-Chapela, F.; Donoso-Bravo, A.; Souto, J.A.; Ruiz-Filippi, G. Modeling the Odor Generation in WWTP: An Integrated Approach Review. Water Air Soil Pollut. 2014, 225, 1–15. [Google Scholar] [CrossRef] [Green Version]
- Sevimoğlu, O.; Tansel, B. Effect of persistent trace compounds in landfill gas on engine performance during energy recovery: A case study. Waste Manag. 2013, 33, 74–80. [Google Scholar] [CrossRef]
- Noorain, R.; Kindaichi, T.; Ozaki, N.; Aoi, Y.; Ohashi, A. Biogas purification performance of new water scrubber packed with sponge carriers. J. Clean. Prod. 2019, 214, 103–111. [Google Scholar] [CrossRef]
- Vo, T.T.; Wall, D.M.; Ring, D.; Rajendran, K.; Murphy, J.D. Techno-economic analysis of biogas upgrading via amine scrubber, carbon capture and ex-situ methanation. Appl. Energy 2018, 212, 1191–1202. [Google Scholar] [CrossRef]
- Rasi, S.; Läntelä, J.; Veijanen, A.; Rintala, J. Landfill gas upgrading with countercurrent water wash. Waste Manag. 2008, 28, 1528–1534. [Google Scholar] [CrossRef] [PubMed]
- Rasi, S.; Läntelä, J.; Rintala, J. Upgrading landfill gas using a high pressure water absorption process. Fuel 2014, 115, 539–543. [Google Scholar] [CrossRef]
- Devia, C.R.; Subrenat, A. Absorption of a linear (L2) and a cyclic (D4) siloxane using different oils: Application to biogas treatment. Environ. Technol. 2013, 34, 3117–3127. [Google Scholar] [CrossRef] [PubMed]
- Ghorbel, L.; Tatin, R.; Couvert, A. Relevance of an organic solvent for absorption of siloxanes. Environ. Technol. 2013, 35, 372–382. [Google Scholar] [CrossRef]
- Ajhar, M.; Travesset, M.; Yüce, S.; Melin, T. Siloxane removal from landfill and digester gas—A technology overview. Bioresour. Technol. 2010, 101, 2913–2923. [Google Scholar] [CrossRef]
- Shen, M.; Zhang, Y.; Hu, D.; Fan, J.; Zeng, G. A review on removal of siloxanes from biogas: With a special focus on volatile methylsiloxanes. Environ. Sci. Pollut. Res. 2018, 25, 30847–30862. [Google Scholar] [CrossRef]
- Schuur, B.; Brouwer, T.; Smink, D.; Sprakel, L.M. Green solvents for sustainable separation processes. Curr. Opin. Green Sustain. Chem. 2019, 18, 57–65. [Google Scholar] [CrossRef]
- Zhang, S.; Zhang, X.; Dong, H.; Zhao, Z.; Zhang, S.; Huang, Y. Carbon capture with ionic liquids: Overview and progress. Energy Environ. Sci. 2012, 5, 6668–6681. [Google Scholar] [CrossRef]
- Blanchard, L.A.; Hancu, D.; Beckman, E.J.; Brennecke, J.F. Green processing using ionic liquids and CO2. Nat. Cell Biol. 1999, 399, 28–29. [Google Scholar] [CrossRef]
- Reddy, R.G. Novel applications of ionic liquids in materials processing. J. Phys. Conf. Ser. 2009, 165, 1–6. [Google Scholar] [CrossRef]
- Sarmad, S.; Mikkola, J.-P.; Ji, X. Carbon Dioxide Capture with Ionic Liquids and Deep Eutectic Solvents: A New Generation of Sorbents. ChemSusChem 2017, 10, 324–352. [Google Scholar] [CrossRef] [PubMed]
- Makoś, P.; Fernandes, A.; Przyjazny, A.; Boczkaj, G. Sample preparation procedure using extraction and derivatization of carboxylic acids from aqueous samples by means of deep eutectic solvents for gas chromatographic-mass spectrometric analysis. J. Chromatogr. A 2018, 1555, 10–19. [Google Scholar] [CrossRef] [PubMed]
- Makoś, P.; Przyjazny, A.; Boczkaj, G. Hydrophobic deep eutectic solvents as “green” extraction media for polycyclic aromatic hydrocarbons in aqueous samples. J. Chromatogr. A 2018, 1570, 28–37. [Google Scholar] [CrossRef] [PubMed]
- Makoś, P.; Słupek, E.; Gębicki, J. Extractive detoxification of feedstocks for the production of biofuels using new hydrophobic deep eutectic solvents—Experimental and theoretical studies. J. Mol. Liq. 2020, 308, 113101. [Google Scholar] [CrossRef]
- Makoś, P.; Słupek, E.; Gębicki, J. Hydrophobic deep eutectic solvents in microextraction techniques—A review. Microchem. J. 2020, 152, 104384. [Google Scholar] [CrossRef]
- Słupek, E.; Makoś, P.; Gębicki, J. Deodorization of model biogas by means of novel non- ionic deep eutectic solvent. Arch. Environ. Prot. 2020, 46, 41–46. [Google Scholar] [CrossRef]
- Słupek, E.; Makoś, P. Absorptive Desulfurization of Model Biogas Stream Using Choline Chloride-Based Deep Eutectic Solvents. Sustainability 2020, 12, 1619. [Google Scholar] [CrossRef] [Green Version]
- Słupek, E.; Makos, P.; Dobrzyniewski, D.; Szulczynski, B.; Gebicki, J. Process control of biogas purification using electronic nose. Chem. Eng. Trans. 2020, 82. [Google Scholar] [CrossRef]
- Shukla, S.K.; Mikkola, J.-P. Unusual temperature-promoted carbon dioxide capture in deep-eutectic solvents: The synergistic interactions. Chem. Commun. 2019, 55, 3939–3942. [Google Scholar] [CrossRef]
- Trivedi, T.J.; Lee, J.H.; Lee, H.J.; Jeong, Y.K.; Choi, J.W. Deep eutectic solvents as attractive media for CO2 capture. Green Chem. 2016, 18, 2834–2842. [Google Scholar] [CrossRef]
- Shukla, S.K.; Mikkola, J.-P. Intermolecular interactions upon carbon dioxide capture in deep-eutectic solvents. Phys. Chem. Chem. Phys. 2018, 20, 24591–24601. [Google Scholar] [CrossRef] [PubMed] [Green Version]
- Makoś, P.; Słupek, E.; Małachowska, A. Silica Gel Impregnated by Deep Eutectic Solvents for Adsorptive Removal of BTEX from Gas Streams. Materials 2020, 13, 1894. [Google Scholar] [CrossRef] [Green Version]
- Słupek, E.; Makoś, P.; Gębicki, J. Theoretical and Economic Evaluation of Low-Cost Deep Eutectic Solvents for Effective Biogas Upgrading to Bio-Methane. Energies 2020, 13, 3379. [Google Scholar] [CrossRef]
- Mu, T.; Rarey, J.; Gmehling, J. Performance of COSMO-RS with Sigma Profiles from Different Model Chemistries. Ind. Eng. Chem. Res. 2007, 46, 6612–6629. [Google Scholar] [CrossRef]
- Klamt, A. Conductor-like Screening Model for Real Solvents: A New Approach to the Quantitative Calculation of Solvation Phenomena. J. Phys. Chem. 1995, 99, 2224–2235. [Google Scholar] [CrossRef]
- Klamt, A. Prediction of the mutual solubilities of hydrocarbons and water with COSMO-RS. Fluid Phase Equilib. 2003, 206, 223–235. [Google Scholar] [CrossRef] [Green Version]
- Klamt, A.; Eckert, F. COSMO-RS: A novel and efficient method for the a priori prediction of thermophysical data of liquids. Fluid Phase Equilib. 2000, 172, 43–72. [Google Scholar] [CrossRef] [Green Version]
- Tansel, B.; Surita, S.C. Managing siloxanes in biogas-to-energy facilities: Economic comparison of pre- vs post-combustion practices. Waste Manag. 2019, 96, 121–127. [Google Scholar] [CrossRef]
- Klamt, A. The COSMO and COSMO-RS solvation models. Wiley Interdiscip. Rev. Comput. Mol. Sci. 2018, 8, 1–11. [Google Scholar] [CrossRef]
- Chu, Y.; He, X. MoDoop: An Automated Computational Approach for COSMO-RS Prediction of Biopolymer Solubilities in Ionic Liquids. ACS Omega 2019, 4, 2337–2343. [Google Scholar] [CrossRef]
- Mullins, E.; Oldland, R.; Liu, Y.A.; Wang, S.; Sandler, S.I.; Chen, C.-C.; Zwolak, A.M.; Seavey, K.C. Sigma-Profile Database for Using COSMO-Based Thermodynamic Methods. Ind. Eng. Chem. Res. 2006, 45, 4389–4415. [Google Scholar] [CrossRef]
- Jibril, B.E.-Y.; Mjalli, F.S.; Naser, J.; Gano, Z.S. New tetrapropylammonium bromide-based deep eutectic solvents: Synthesis and characterizations. J. Mol. Liq. 2014, 199, 462–469. [Google Scholar] [CrossRef]
- García, G.; Aparicio, S.; Ullah, R.; Atilhan, M. Deep Eutectic Solvents: Physicochemical Properties and Gas Separation Applications. Energy Fuels 2015, 29, 2616–2644. [Google Scholar] [CrossRef]
- Santiago, R.; Moya, C.; Palomar, J. Siloxanes capture by ionic liquids: Solvent selection and process evaluation. Chem. Eng. J. 2020, 401, 126078. [Google Scholar] [CrossRef]
- Han, J.; Dai, C.; Yu, G.; Lei, Z. Parameterization of COSMO-RS model for ionic liquids. Green Energy Environ. 2018, 3, 247–265. [Google Scholar] [CrossRef]
- Aissaoui, T. Neoteric FT-IR Investigation on the Functional Groups of Phosphonium- Based Deep Eutectic Solvents. Pharm. Anal. Acta 2015, 6, 10–12. [Google Scholar] [CrossRef]
- Zhu, S.; Li, H.; Zhu, W.; Jiang, W.; Wang, C.; Wu, P.; Zhang, Q.; Li, H. Vibrational analysis and formation mechanism of typical deep eutectic solvents: An experimental and theoretical study. J. Mol. Graph. Model. 2016, 68, 158–175. [Google Scholar] [CrossRef]
- Ghaedi, H.; Ayoub, M.; Sufian, S.; Lal, B.; Uemura, Y. Thermal stability and FT-IR analysis of Phosphonium-based deep eutectic solvents with different hydrogen bond donors. J. Mol. Liq. 2017, 242, 395–403. [Google Scholar] [CrossRef]
- Shameli, K.; Bin Ahmad, M.; Jazayeri, S.D.; Sedaghat, S.; Shabanzadeh, P.; Jahangirian, H.; Shahri, M.M.; Abdollahi, Y. Synthesis and Characterization of Polyethylene Glycol Mediated Silver Nanoparticles by the Green Method. Int. J. Mol. Sci. 2012, 13, 6639–6650. [Google Scholar] [CrossRef] [Green Version]
- Banjare, M.K.; Behera, K.; Satnami, M.L.; Pandey, S.; Ghosh, K.K. Self-assembly of a short-chain ionic liquid within deep eutectic solvents. RSC Adv. 2018, 8, 7969–7979. [Google Scholar] [CrossRef]
- Maheswari, A.U.; Palanivelu, K. Carbon Dioxide Capture and Utilization by Alkanolamines in Deep Eutectic Solvent Medium. Ind. Eng. Chem. Res. 2015, 54, 11383–11392. [Google Scholar] [CrossRef]
- Ruß, C.; König, B. Low melting mixtures in organic synthesis—An alternative to ionic liquids? Green Chem. 2012, 14, 2969–2982. [Google Scholar] [CrossRef] [Green Version]
- Xydis, G.; Nanaki, E.A.; Koroneos, C.J. Exergy analysis of biogas production from a municipal solid waste landfill. Sustain. Energy Technol. Assess. 2013, 4, 20–28. [Google Scholar] [CrossRef]
- Yusof, R.; Abdulmalek, E.; Sirat, K.; Rahman, M.B.A. Tetrabutylammonium Bromide (TBABr)-Based Deep Eutectic Solvents (DESs) and Their Physical Properties. Molecules 2014, 19, 8011–8026. [Google Scholar] [CrossRef]
- Burrell, G.L.; Dunlop, N.F.; Separovic, F. Non-Newtonian viscous shear thinning in ionic liquids. Soft Matter 2010, 6, 2080–2086. [Google Scholar] [CrossRef]
- Basaiahgari, A.; Panda, S.; Gardas, R.L. Acoustic, volumetric, transport, optical and rheological properties of Benzyltripropylammonium based Deep Eutectic Solvents. Fluid Phase Equilib. 2017, 448, 41–49. [Google Scholar] [CrossRef]
- Verduzco, L.F.R. Density and viscosity of biodiesel as a function of temperature: Empirical models. Renew. Sustain. Energy Rev. 2013, 19, 652–665. [Google Scholar] [CrossRef]
- Altamash, T.; Atilhan, M.; Aliyan, A.; Ullah, R.; Nasser, M.S.; Aparicio, S. Rheological, Thermodynamic, and Gas Solubility Properties of Phenylacetic Acid-Based Deep Eutectic Solvents. Chem. Eng. Technol. 2017, 40, 778–790. [Google Scholar] [CrossRef]
- Sigma Aldrich. Safety Data Sheet Tetraethylene Glycol. Available online: https://www.sigmaaldrich.com/MSDS/MSDS/DisplayMSDSPage.do?country=PL&language=pl&productNumber=110175&brand=ALDRICH&PageToGoToURL=https%3A%2F%2Fwww.sigmaaldrich.com%2Fcatalog%2Fproduct%2Faldrich%2F110175%3Flang%3Dpl (accessed on 18 November 2020).
- Abbott, A.P.; Boothby, D.; Capper, G.; Davies, D.L.; Rasheed, R.K. Deep Eutectic Solvents Formed between Choline Chloride and Carboxylic Acids: Versatile Alternatives to Ionic Liquids. J. Am. Chem. Soc. 2004, 126, 9142–9147. [Google Scholar] [CrossRef]
- Hsu, C.H.; Chu, H.; Cho, C.M. Absorption and reaction kinetics of amines and ammonia solutions with carbon dioxide in flue gas. J. Air Waste Manag. Assoc. 2003, 53, 246–252. [Google Scholar] [CrossRef] [Green Version]
- Yincheng, G.; Zhenqi, N.; Wenyi, L. Comparison of removal efficiencies of carbon dioxide between aqueous ammonia and Na– solution in a fine spray column. Energy Procedia 2011, 4, 512–518. [Google Scholar] [CrossRef] [Green Version]
- Horikawa, M.; Rossi, F.; Gimenes, M.; Costa, C.M.; Da Silva, M. Chemical absorption of H2S for biogas purification. Braz. J. Chem. Eng. 2004, 21, 415–422. [Google Scholar] [CrossRef]
- Ma, C.; Liu, C.; Lu, X.; Ji, X. Techno-economic analysis and performance comparison of aqueous deep eutectic solvent and other physical absorbents for biogas upgrading. Appl. Energy 2018, 225, 437–447. [Google Scholar] [CrossRef]
- Lemus, J.; Bedia, J.; Moya, C.; Alonso-Morales, N.; Gilarranz, M.A.; Palomar, J.; Rodriguez, J.J. Ammonia capture from the gas phase by encapsulated ionic liquids (ENILs). RSC Adv. 2016, 6, 61650–61660. [Google Scholar] [CrossRef] [Green Version]
- Ryckebosch, E.; Drouillon, M.; Vervaeren, H. Techniques for transformation of biogas to biomethane. Biomass Bioenergy 2011, 35, 1633–1645. [Google Scholar] [CrossRef]
- Urasaki, N.; Wong, C. Separation of low molecular siloxanes for electronic application by liquid-liquid extraction. IEEE Trans. Electron. Packag. Manuf. 1999, 22, 295–298. [Google Scholar] [CrossRef]
- Sun, S.; Niu, Y.; Sun, Z.; Xu, Q.; Wei, X. Solubility properties and spectral characterization of sulfur dioxide in ethylene glycol derivatives. RSC Adv. 2014, 5, 8706–8712. [Google Scholar] [CrossRef]
- Sigma Aldrich. Tetraethylene Glycol. Available online: https://www.sigmaaldrich.com/catalog/product/aldrich/110175?lang=pl®ion=PL (accessed on 11 December 2020).
- Sigma Aldrich. Tetrapropylammonium Bromide. Available online: https://www.sigmaaldrich.com/catalog/product/aldrich/225568?lang=pl®ion=PL (accessed on 11 December 2020).
- Kolegaberlin Motor Oil. Available online: https://www.kolegaberlin.pl/product-pol-4300-Elf-Evolution-900-NF-5W40-5L.html (accessed on 30 November 2020).
- Hoffmann Group. Cutting Oil. Available online: https://www.hoffmann-group.com/GB/en/houk/Power-tools-and-workshop-supplies/Cooling-lubricants/High-performance-cutting-oil-chlorine-free-Alpha-93/p/084210 (accessed on 30 November 2020).
Figure 1.
Simplified process flow diagram of siloxanes separation using deep eutectic solvent (DES).
Figure 1.
Simplified process flow diagram of siloxanes separation using deep eutectic solvent (DES).

Figure 2.
Structures of hydrogen bond acceptor (HBA) and hydrogen bond donors (HBDs).

Figure 3.
Solubility of hexamethyldisiloxane (L2) in DES and pure solvents.

Figure 4.
Solubility of octamethyltrisiloxane (L3) in DES and pure solvents.

Figure 5.
Solubility of octametylocyclotetrasiloxane (D4) in DES and pure solvents.

Figure 6.
σ-Profile of TPABr:TEG (1:3), L2, L3, and L4.

Figure 7.
σ-Potential of TPAB:TEG (1:3) L2, L3, and L4.

Figure 8.
FT-IR spectrum for pure TPABr, TEG, and TPABr:TEG (1:3).

Figure 9.
(A) Viscosity for TPABr:TEG (1:3) as a function of temperature in the range 25–60 °C. (B) Dependence of viscosity on turnover in the range 10–50 RPM in temperature 40 °C.
Figure 9.
(A) Viscosity for TPABr:TEG (1:3) as a function of temperature in the range 25–60 °C. (B) Dependence of viscosity on turnover in the range 10–50 RPM in temperature 40 °C.

Figure 10.
Density for TPABr:TEG (1:3) as a function of temperature in the range 25–60 °C.

Figure 11.
Experimental breakthrough curves of siloxane absorption with TPABr:TEG (1:3) at the different volumes of DES for (A) L2; (B) L3; and (C) D4.
Figure 11.
Experimental breakthrough curves of siloxane absorption with TPABr:TEG (1:3) at the different volumes of DES for (A) L2; (B) L3; and (C) D4.

Figure 12.
Experimental breakthrough curves of siloxane absorption with TPABr:TEG (1:3) at the different biogas flow rate for (A) L2; (B) L3; and (C) D4.
Figure 12.
Experimental breakthrough curves of siloxane absorption with TPABr:TEG (1:3) at the different biogas flow rate for (A) L2; (B) L3; and (C) D4.

Figure 13.
Experimental breakthrough curves of siloxane absorption with TPABr:TEG (1:3) at different temperatures for (A) L2; (B) L3; and (C) D4.
Figure 13.
Experimental breakthrough curves of siloxane absorption with TPABr:TEG (1:3) at different temperatures for (A) L2; (B) L3; and (C) D4.

Figure 14.
Experimental breakthrough curves of impurities absorption with TPABr:TEG (1:3) using (A) pure nitrogen and (B) mixture of nitrogen and methane at 2:1 volume ratio under optimum conditions, and (C) methane absorption curve using TPABr:TEG (1:3).
Figure 14.
Experimental breakthrough curves of impurities absorption with TPABr:TEG (1:3) using (A) pure nitrogen and (B) mixture of nitrogen and methane at 2:1 volume ratio under optimum conditions, and (C) methane absorption curve using TPABr:TEG (1:3).

Figure 15.
FT-IR spectrum for pure TPABr:TEG (1:3), pure L2 and complex TPABr:TEG + L2 (DES + L2).

Figure 16.
FT-IR spectrum for pure TPABr:TEG (1:3), pure D4 and complex TPABr:TEG + D4 (DES + D4).

Figure 17.
FT-IR spectrum for pure TPABr:TEG (1:3), pure L3 and complex TPABr:TEG + L3 (DES + L3).

Figure 18.
(A) Reusability of TPABr:TEG (1:3) on the example of removing L2, (B) FT-IR spectra from on fresh and regenerated TPABr:TEG (1:3).
Figure 18.
(A) Reusability of TPABr:TEG (1:3) on the example of removing L2, (B) FT-IR spectra from on fresh and regenerated TPABr:TEG (1:3).

Publisher’s Note: MDPI stays neutral with regard to jurisdictional claims in published maps and institutional affiliations. |
© 2021 by the authors. Licensee MDPI, Basel, Switzerland. This article is an open access article distributed under the terms and conditions of the Creative Commons Attribution (CC BY) license (http://creativecommons.org/licenses/by/4.0/).
Share and Cite
MDPI and ACS Style
Słupek, E.; Makoś-Chełstowska, P.; Gębicki, J. Removal of Siloxanes from Model Biogas by Means of Deep Eutectic Solvents in Absorption Process. Materials 2021, 14, 241. https://0-doi-org.brum.beds.ac.uk/10.3390/ma14020241
AMA Style
Słupek E, Makoś-Chełstowska P, Gębicki J. Removal of Siloxanes from Model Biogas by Means of Deep Eutectic Solvents in Absorption Process. Materials. 2021; 14(2):241. https://0-doi-org.brum.beds.ac.uk/10.3390/ma14020241
Chicago/Turabian StyleSłupek, Edyta, Patrycja Makoś-Chełstowska, and Jacek Gębicki. 2021. "Removal of Siloxanes from Model Biogas by Means of Deep Eutectic Solvents in Absorption Process" Materials 14, no. 2: 241. https://0-doi-org.brum.beds.ac.uk/10.3390/ma14020241
Note that from the first issue of 2016, this journal uses article numbers instead of page numbers. See further details here.