
Microstructural Analysis of Novel Preceramic Paper-Derived SiCf/SiC Composites

 ,
,  ,
,
Abstract
:1. Introduction
2. Materials and Methods
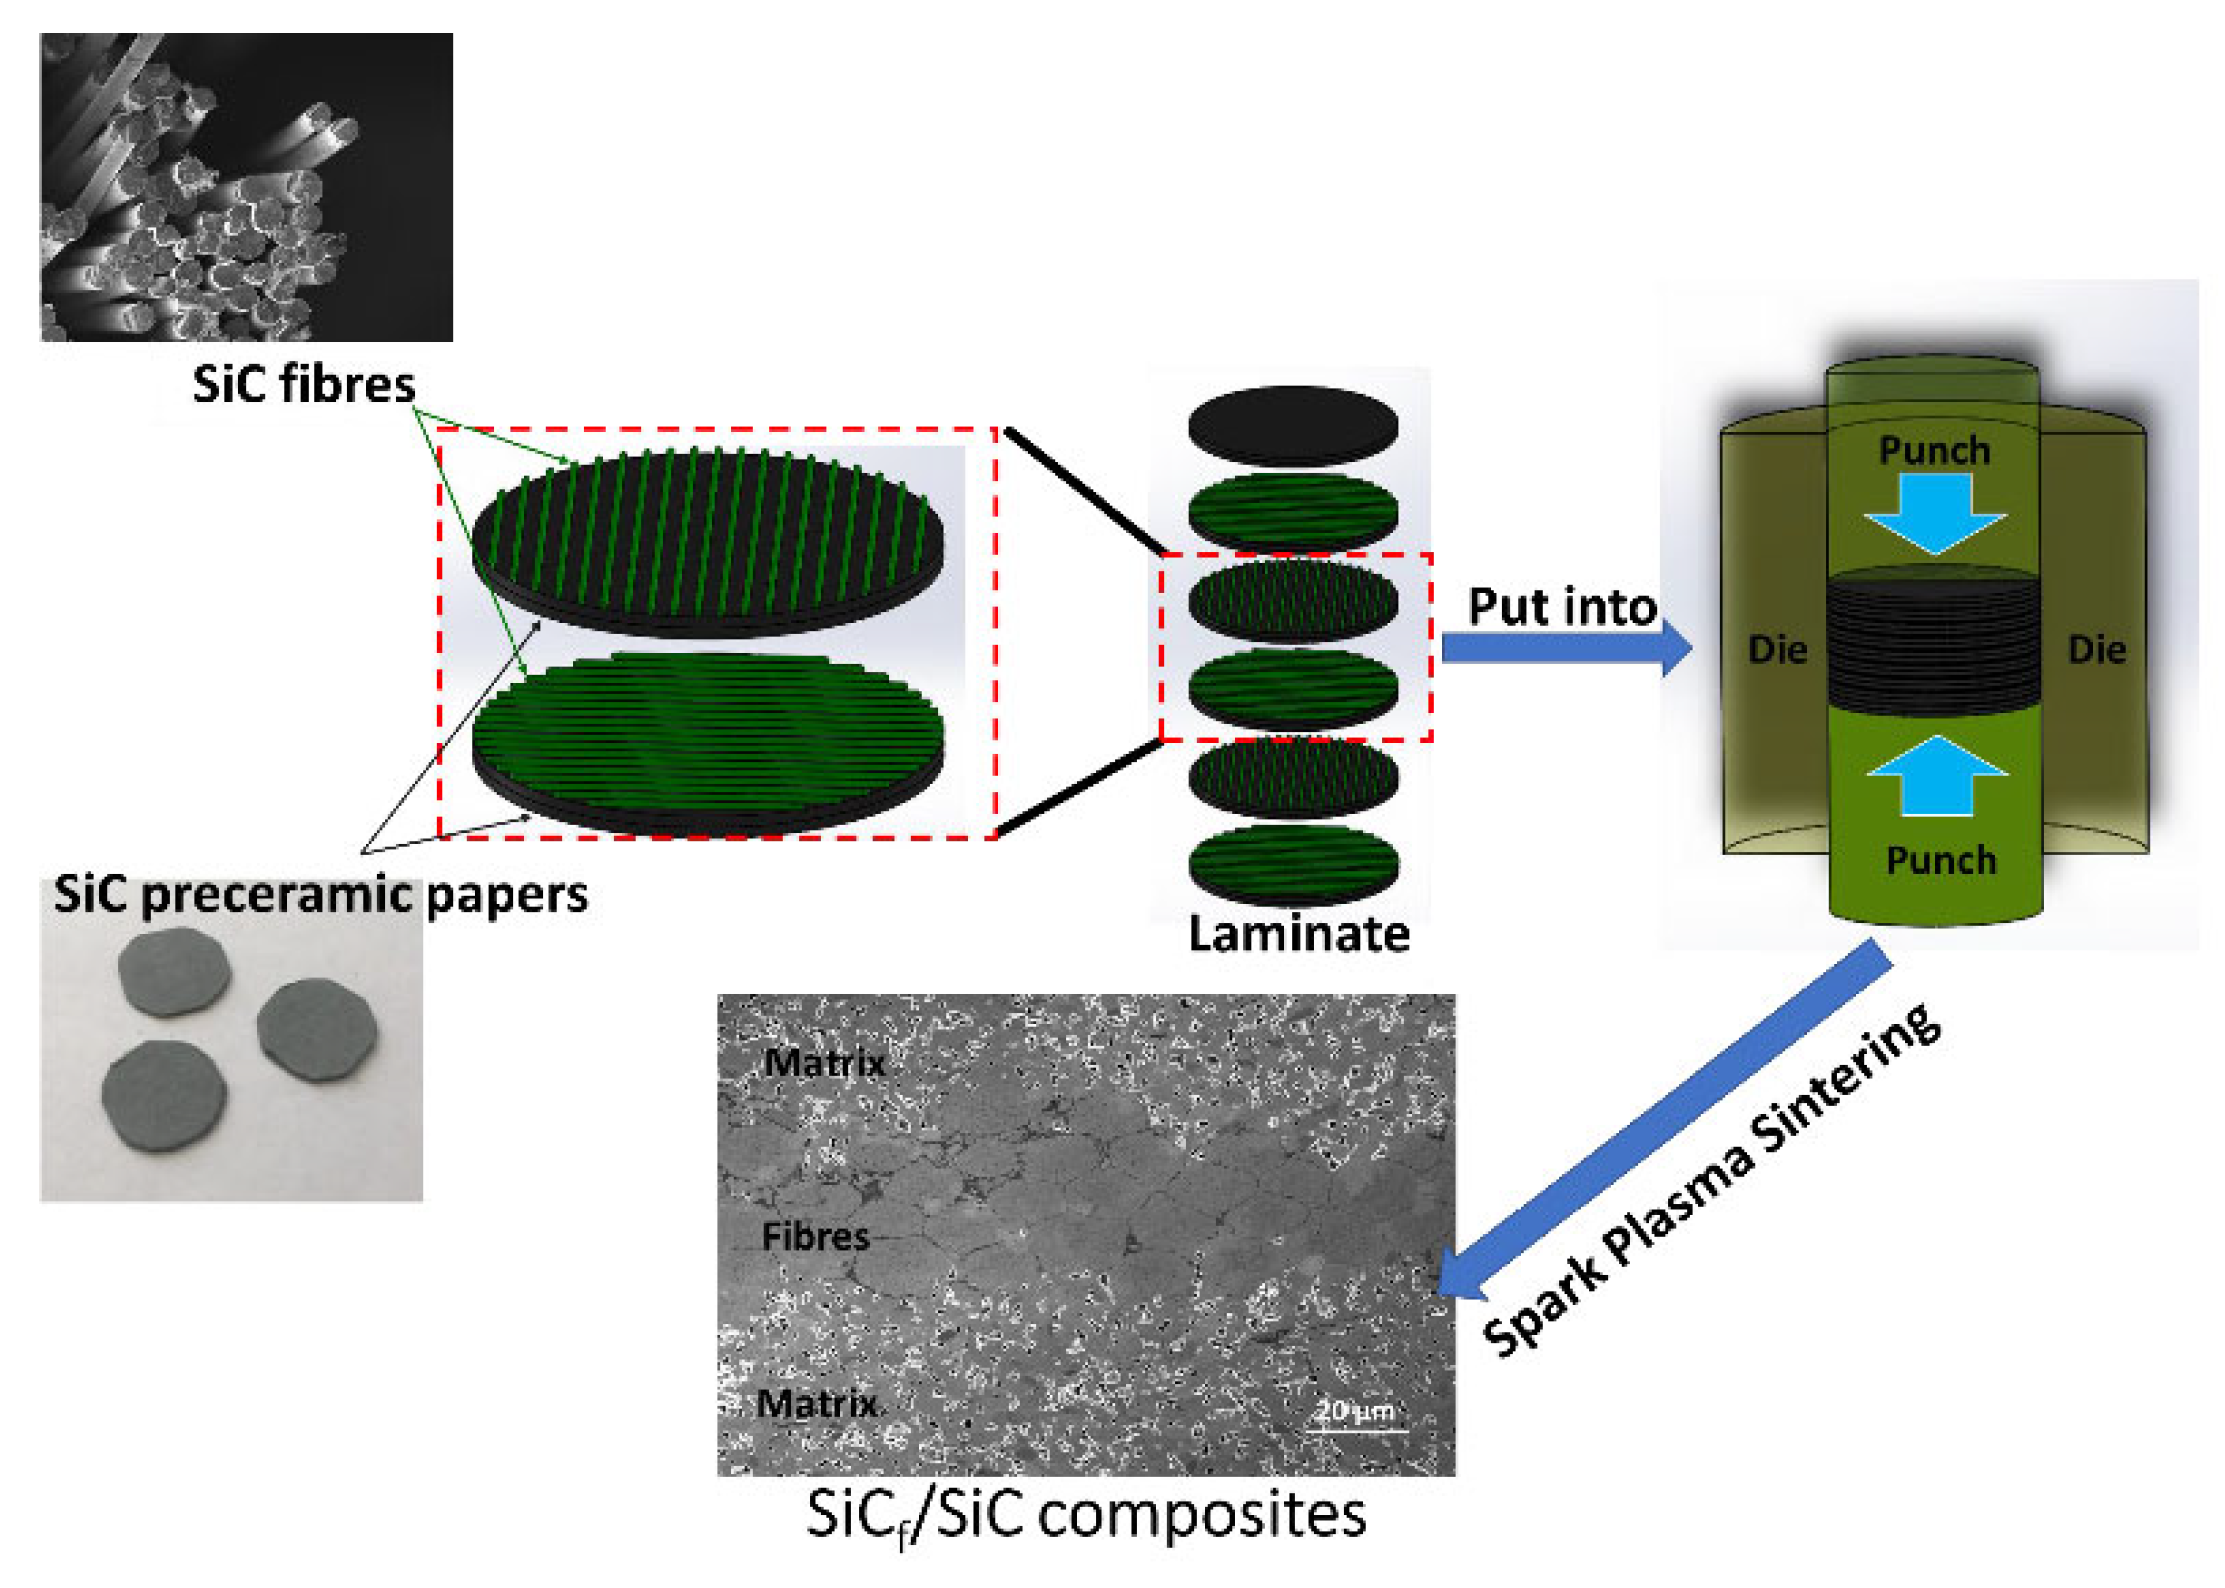
2.1. Fabrication of Paper-Derived SiCf/SiC Composites
2.2. Positron Annihilation Studies
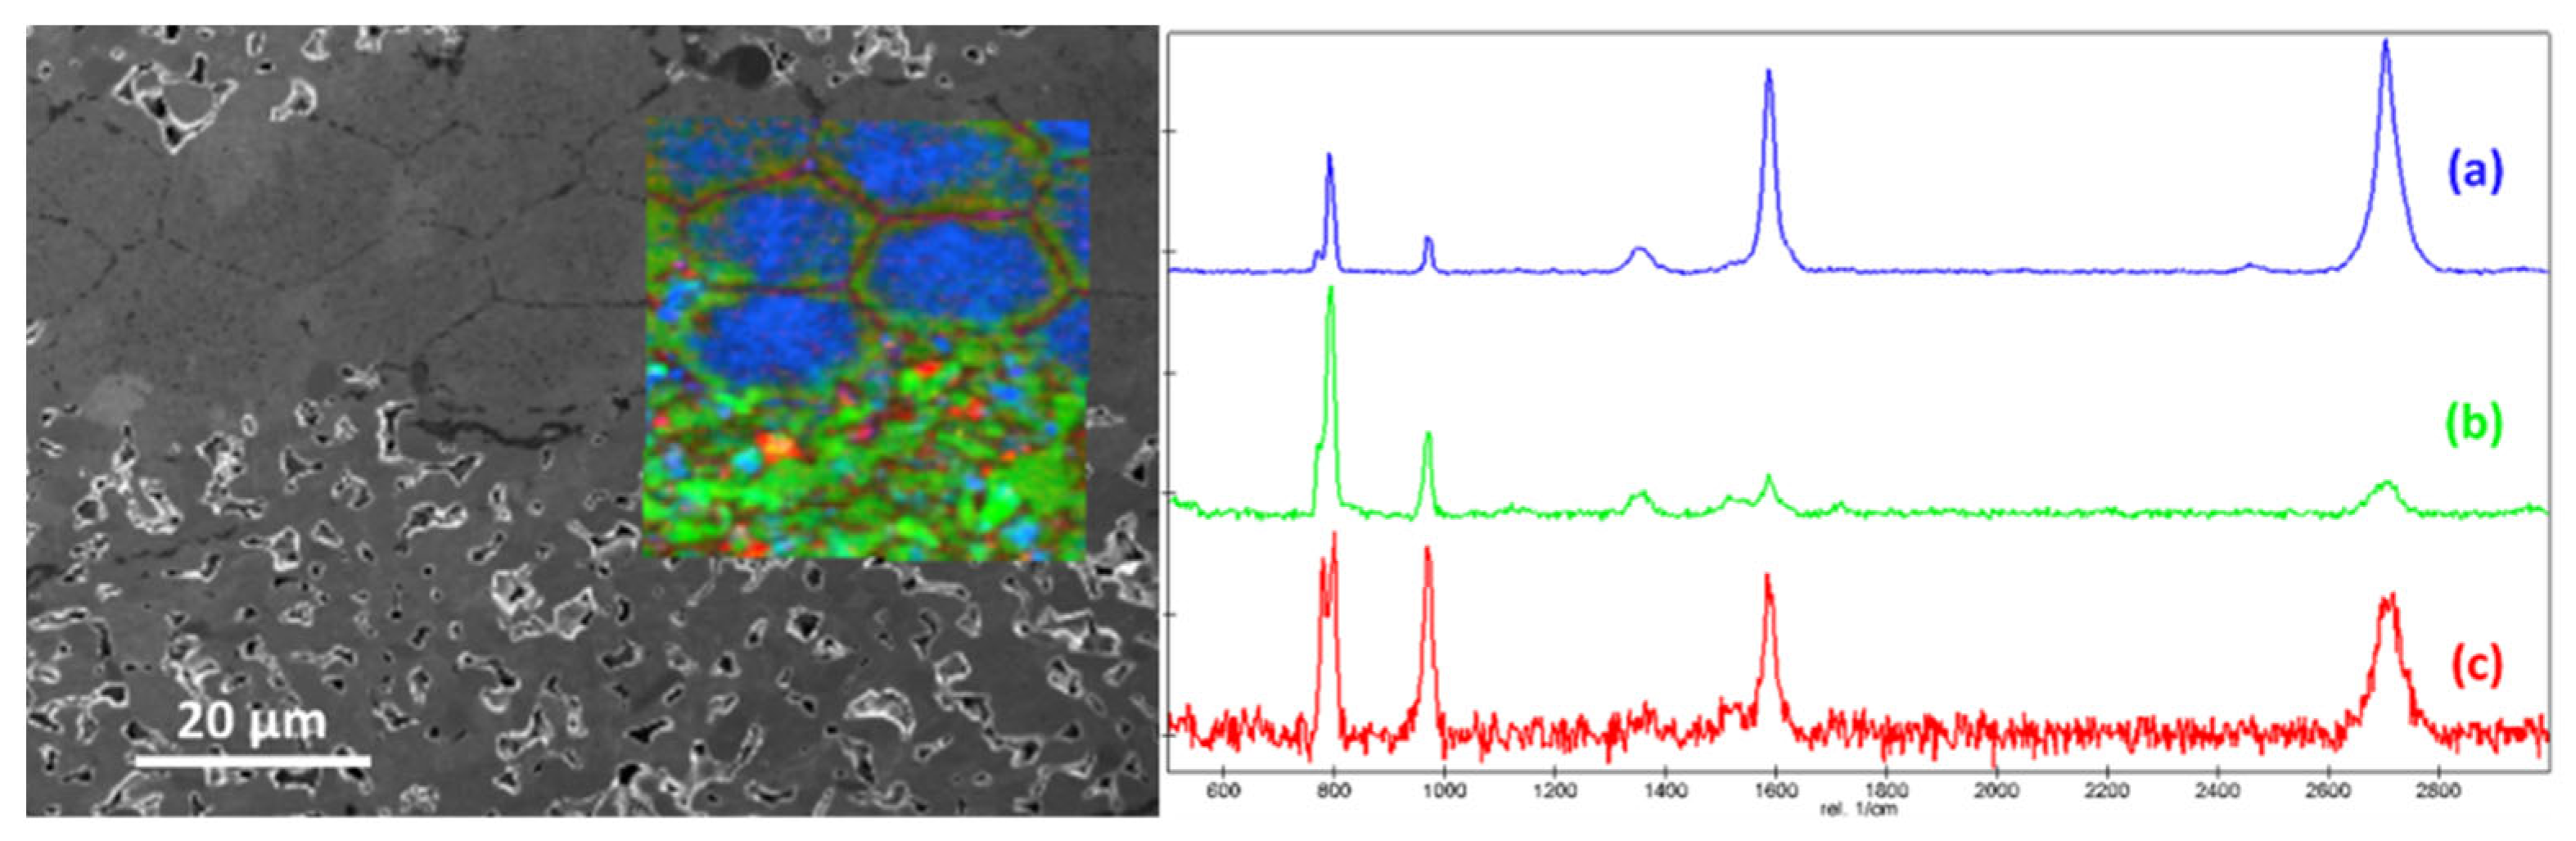
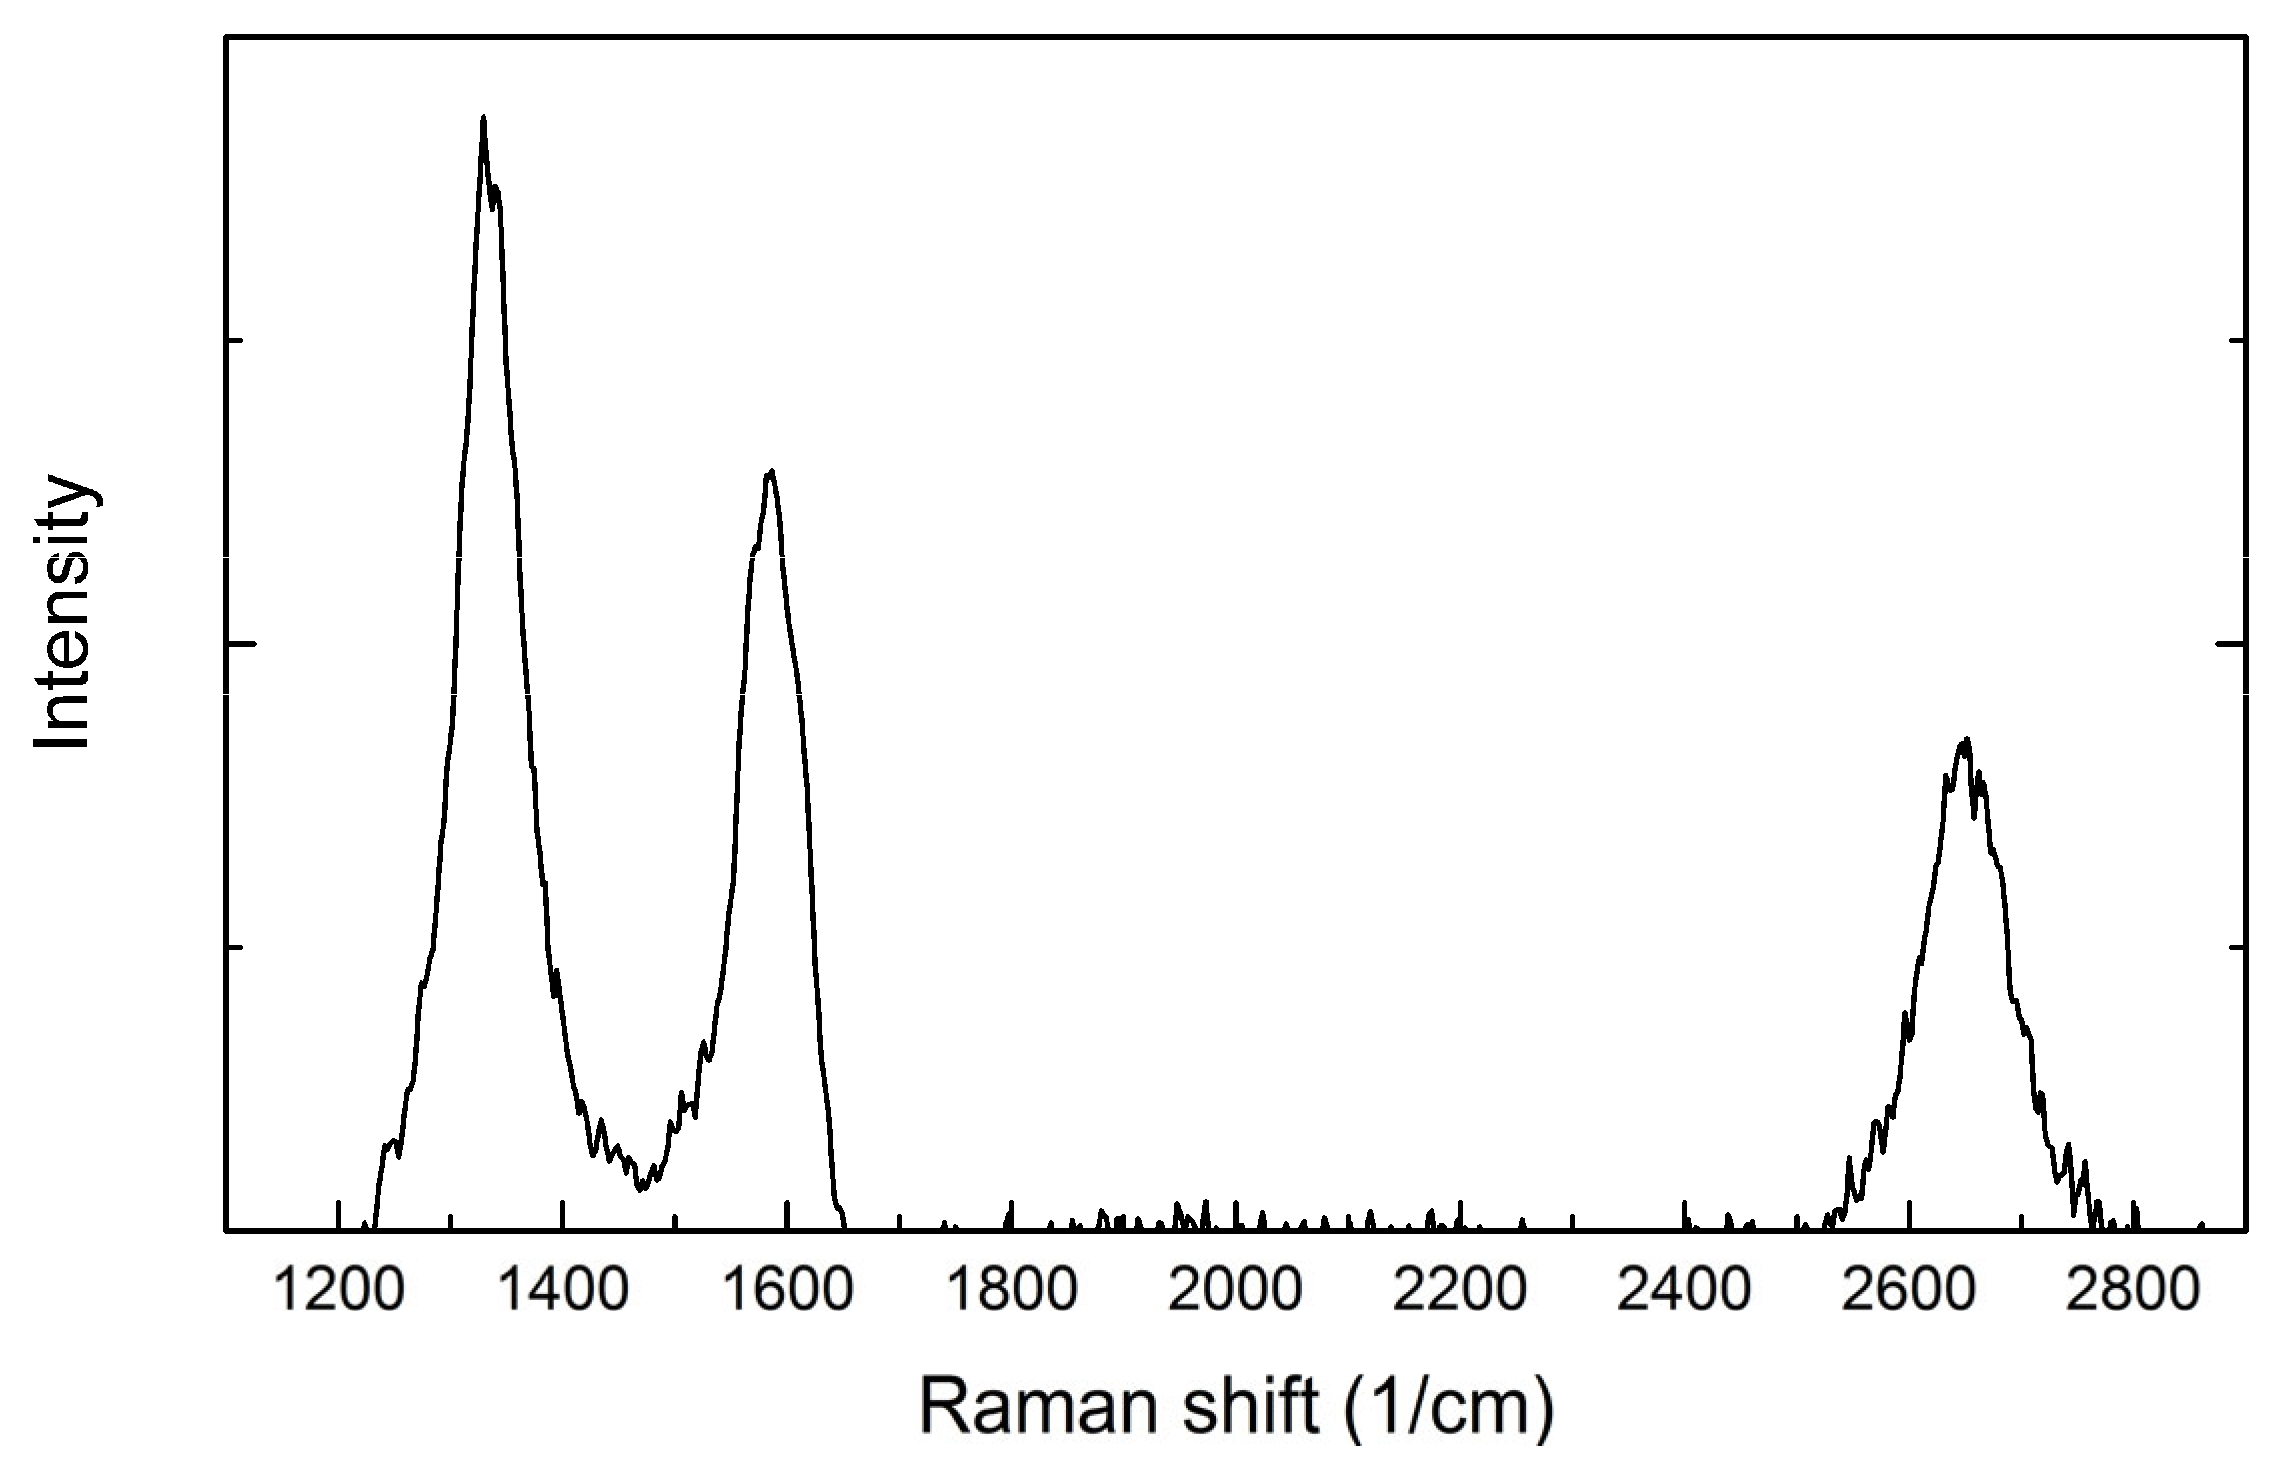
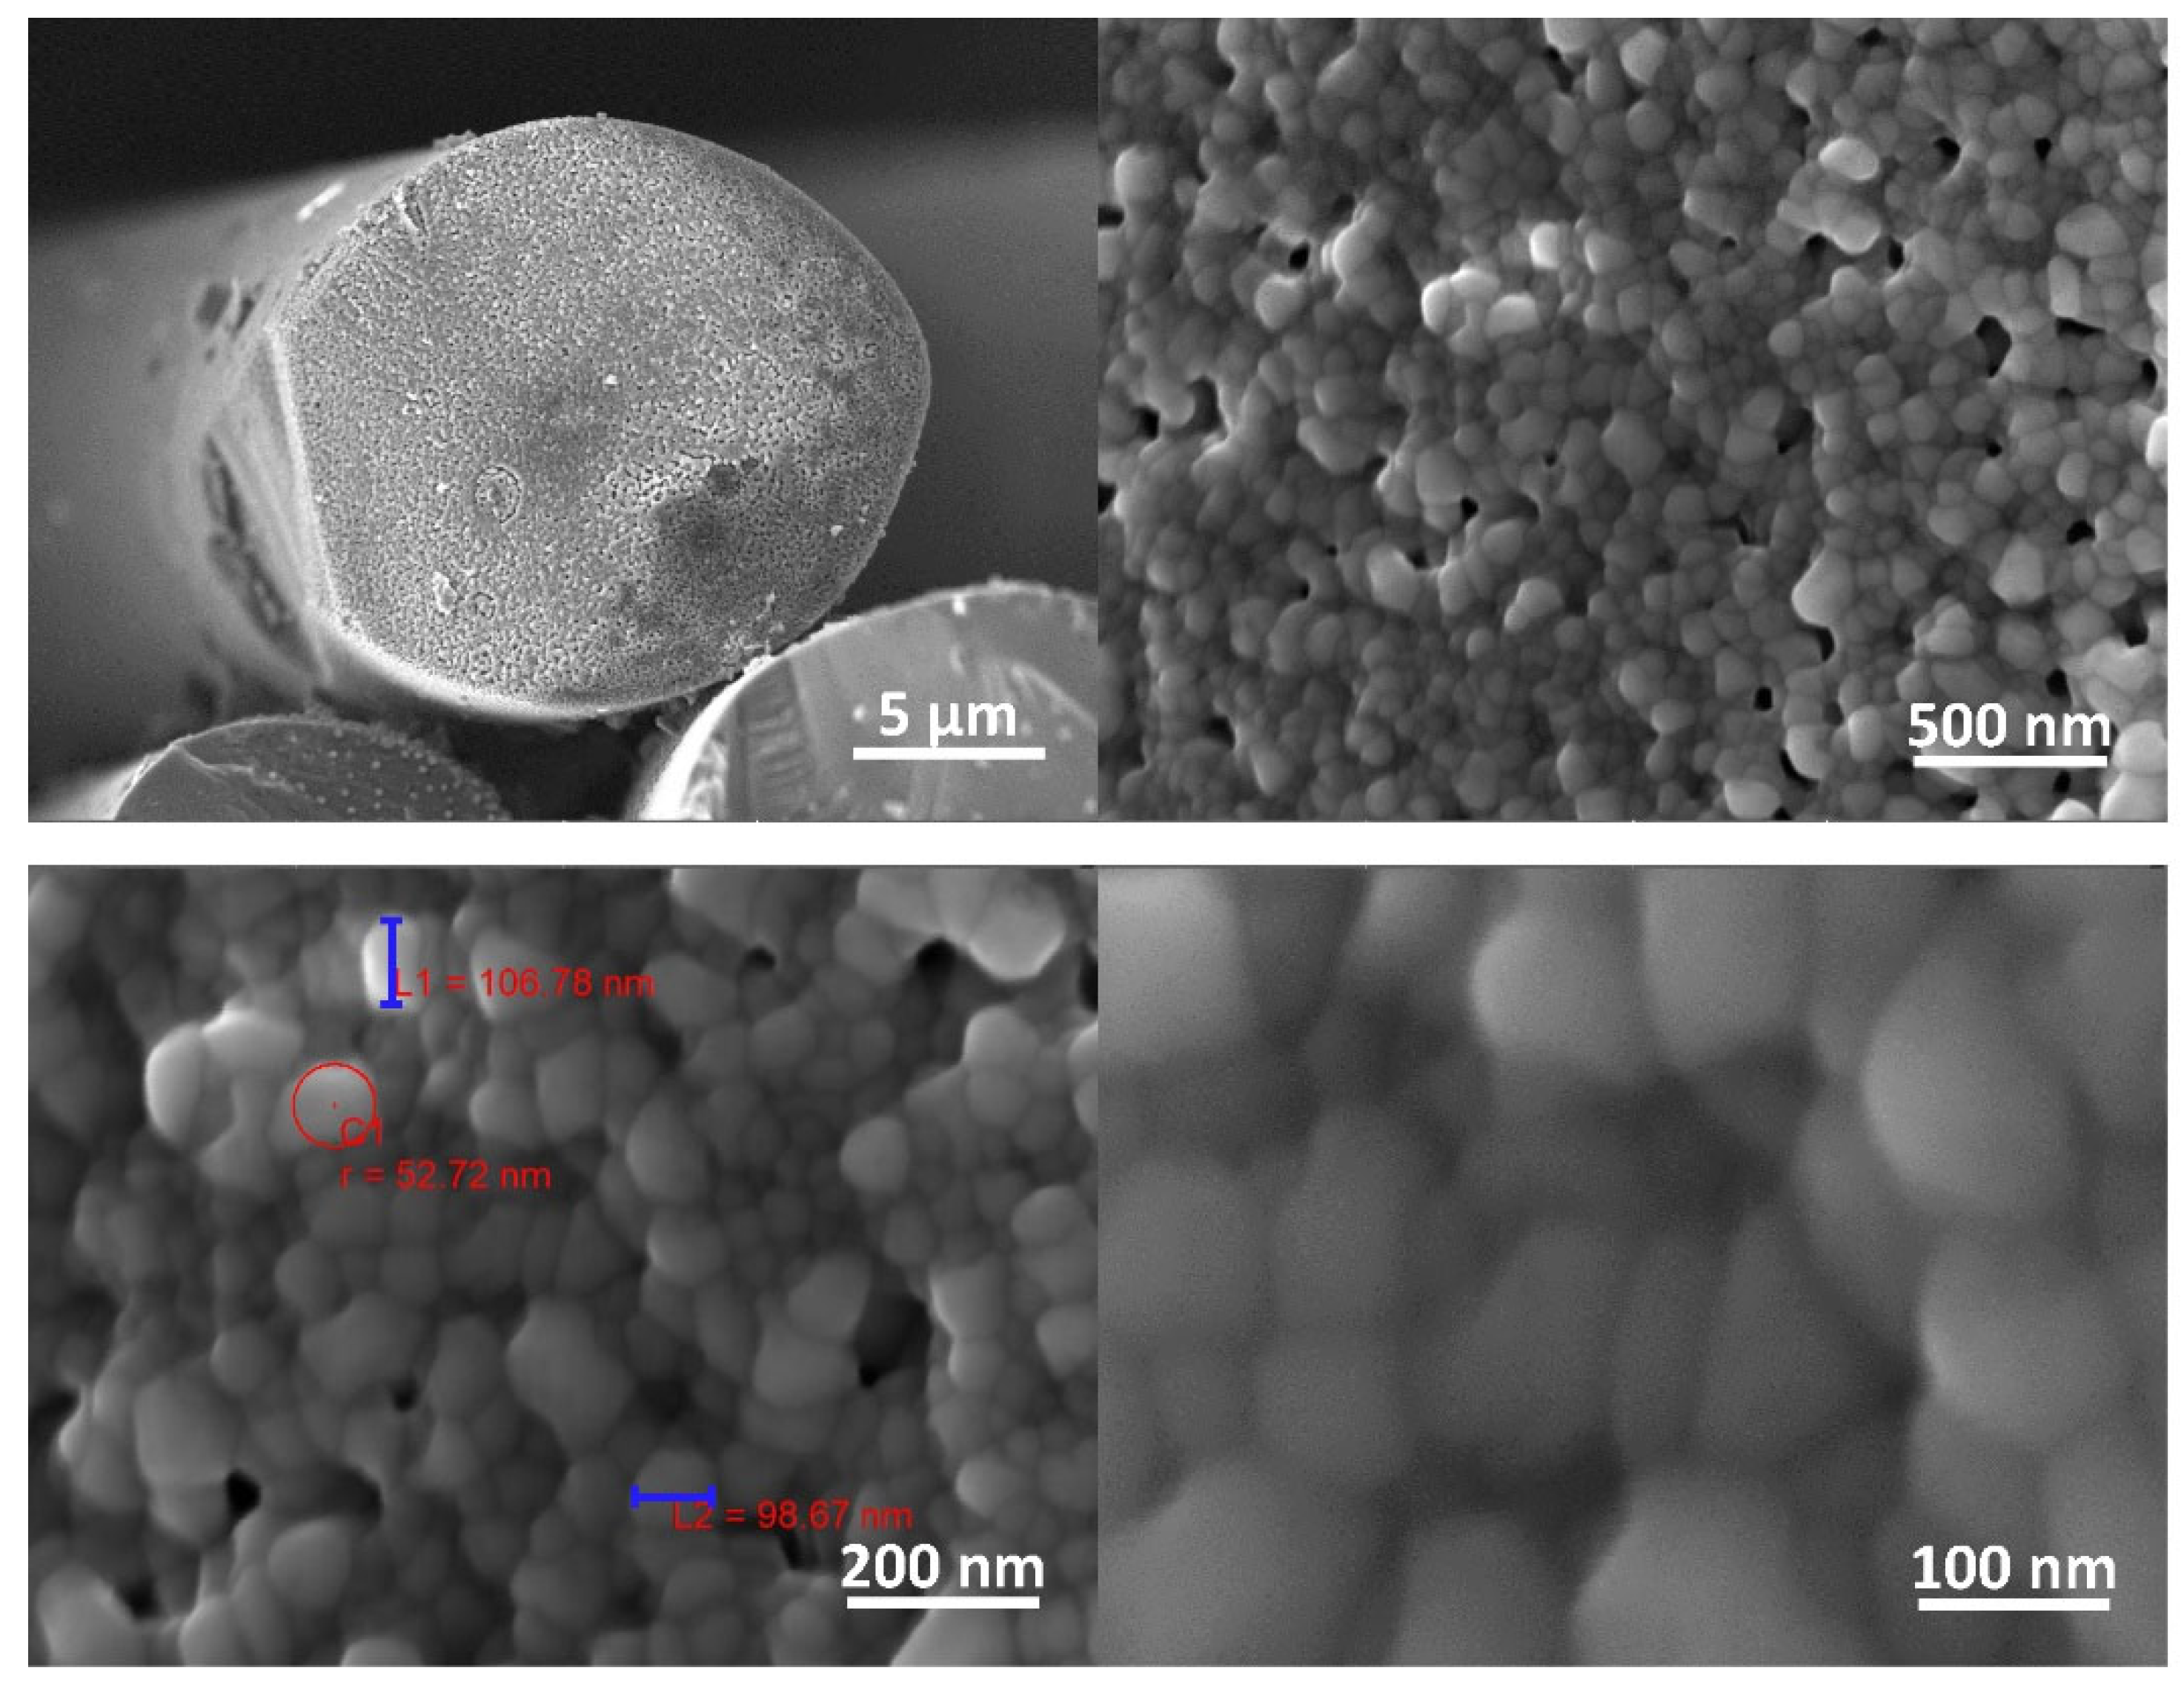
2.3. Characterization by XRD, SEM, and Raman Spectroscopy
3. Results and Discussion
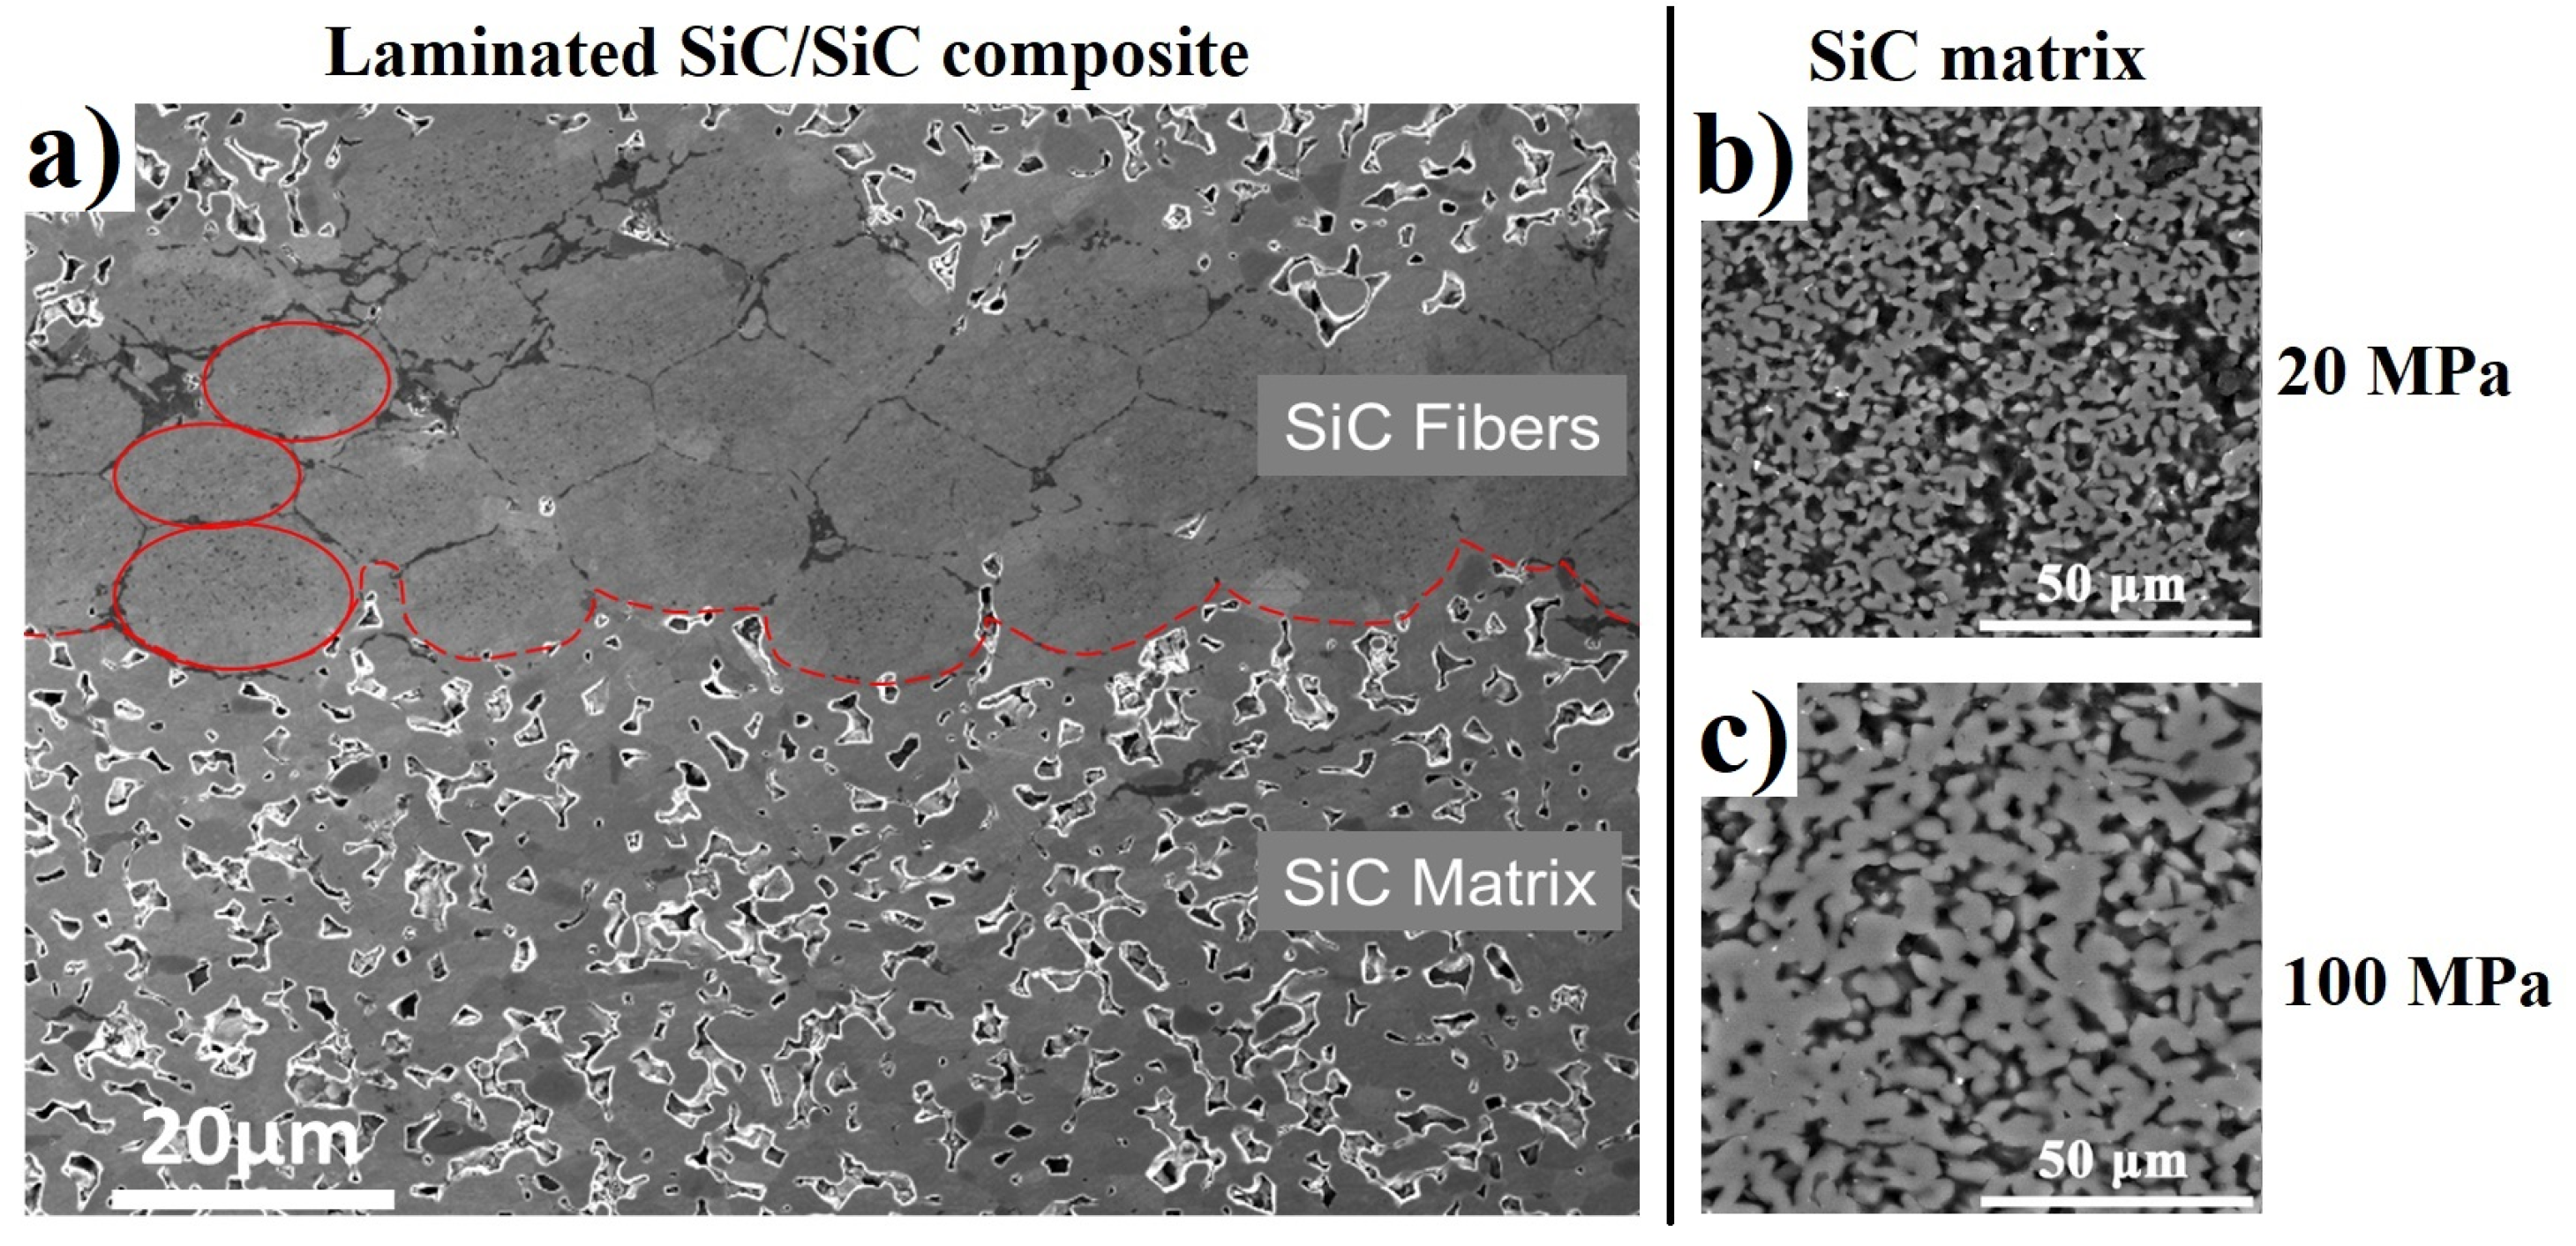
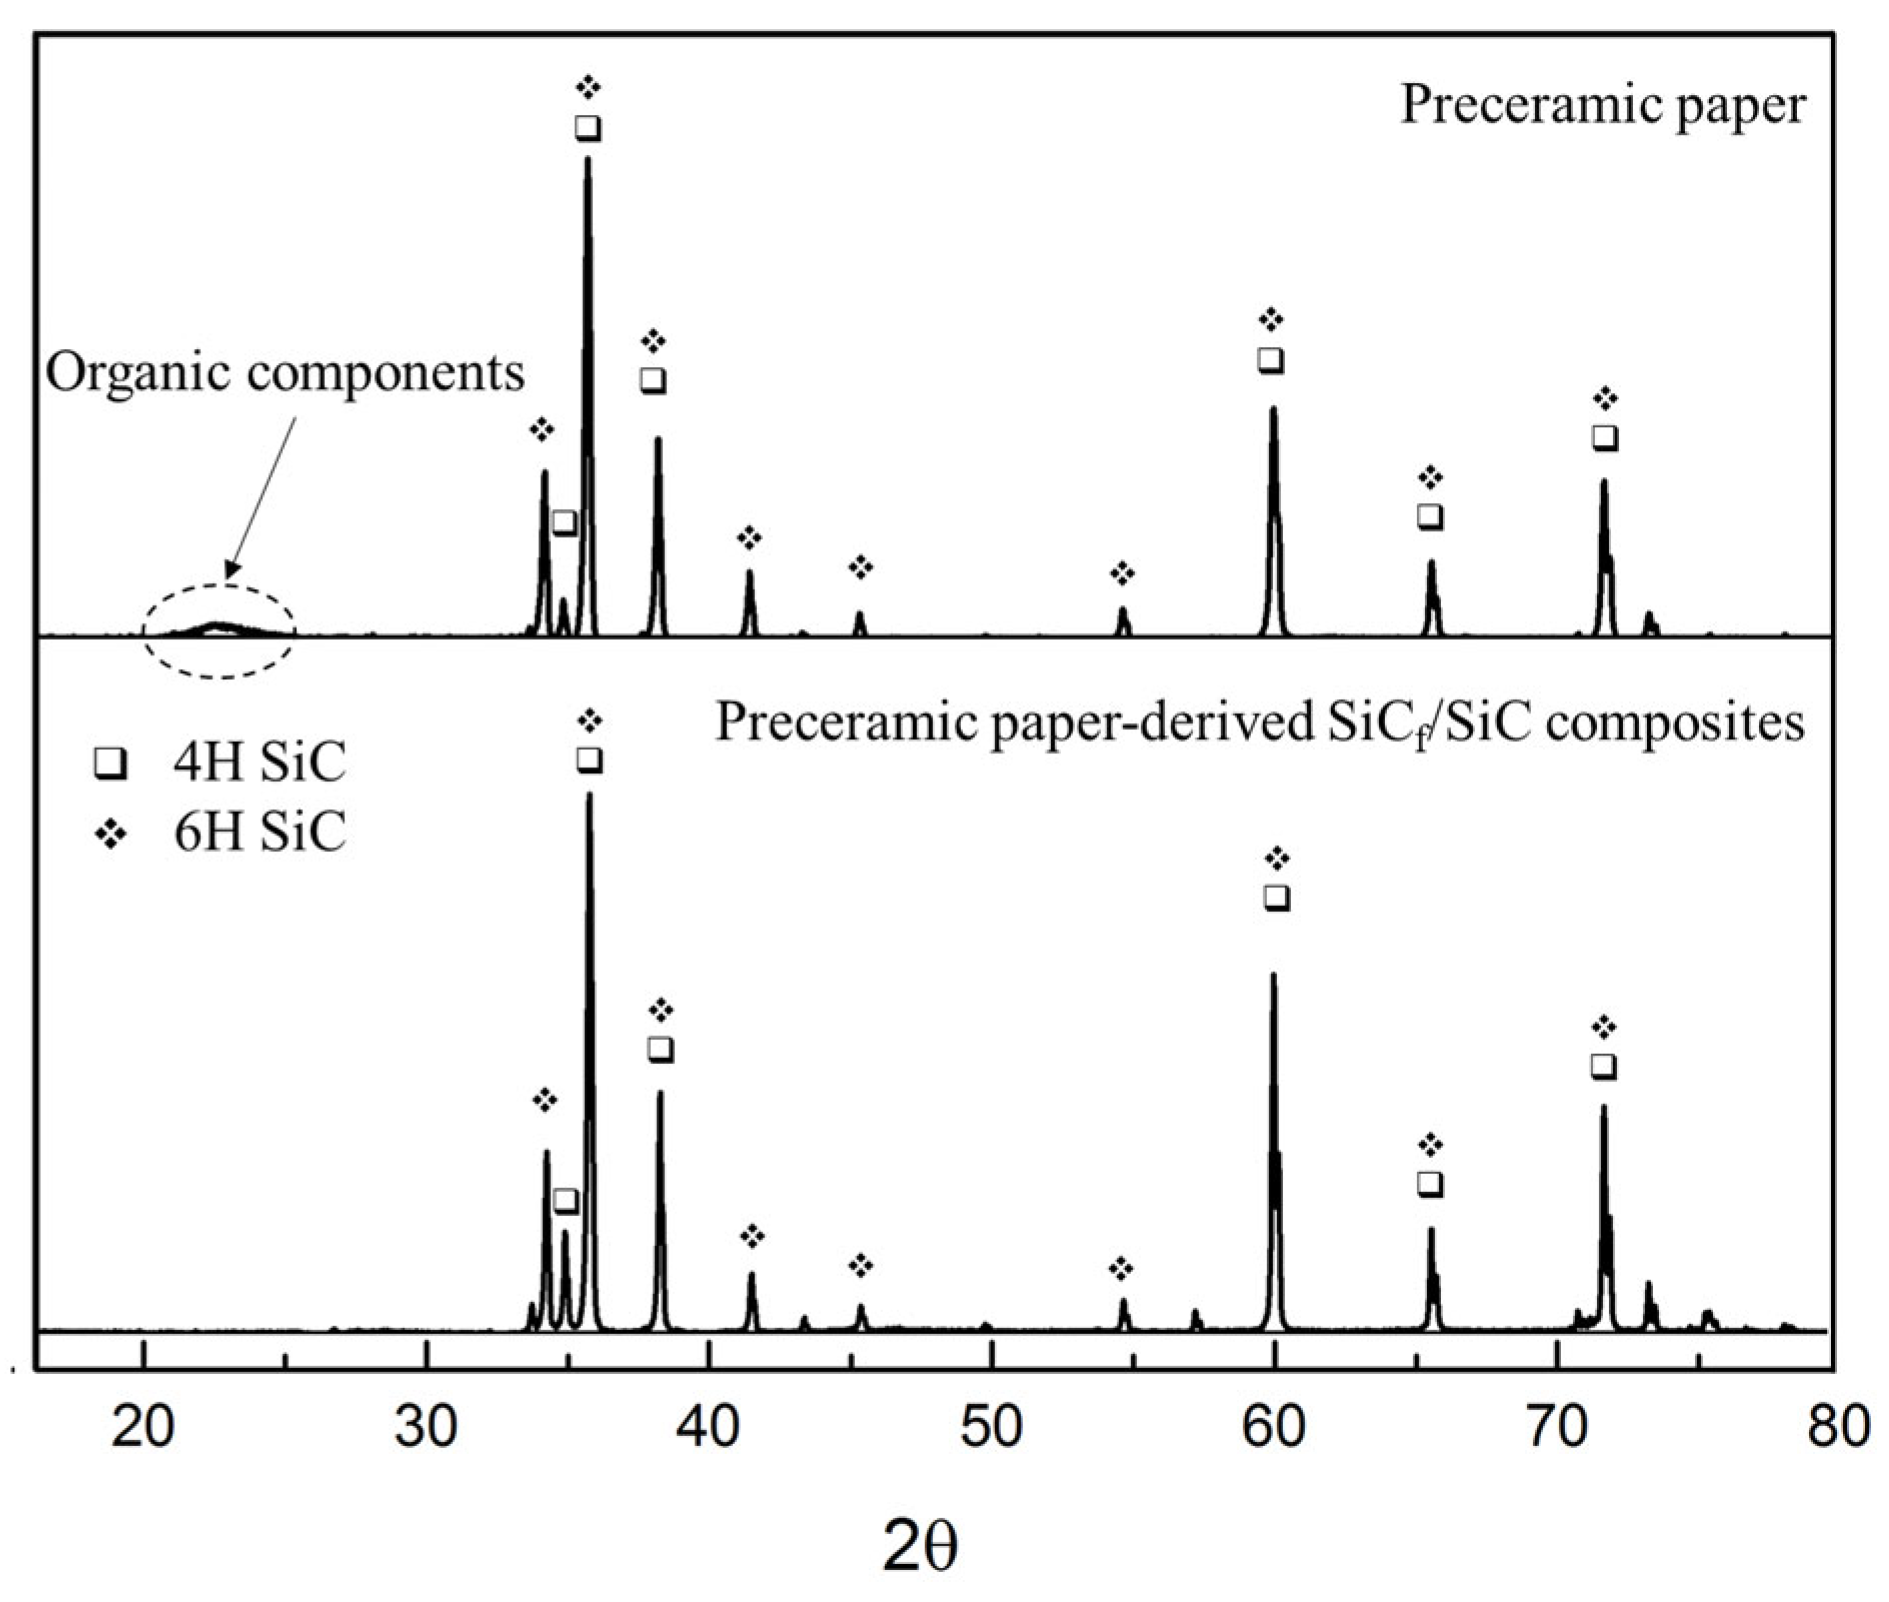
3.1. Phase Composition
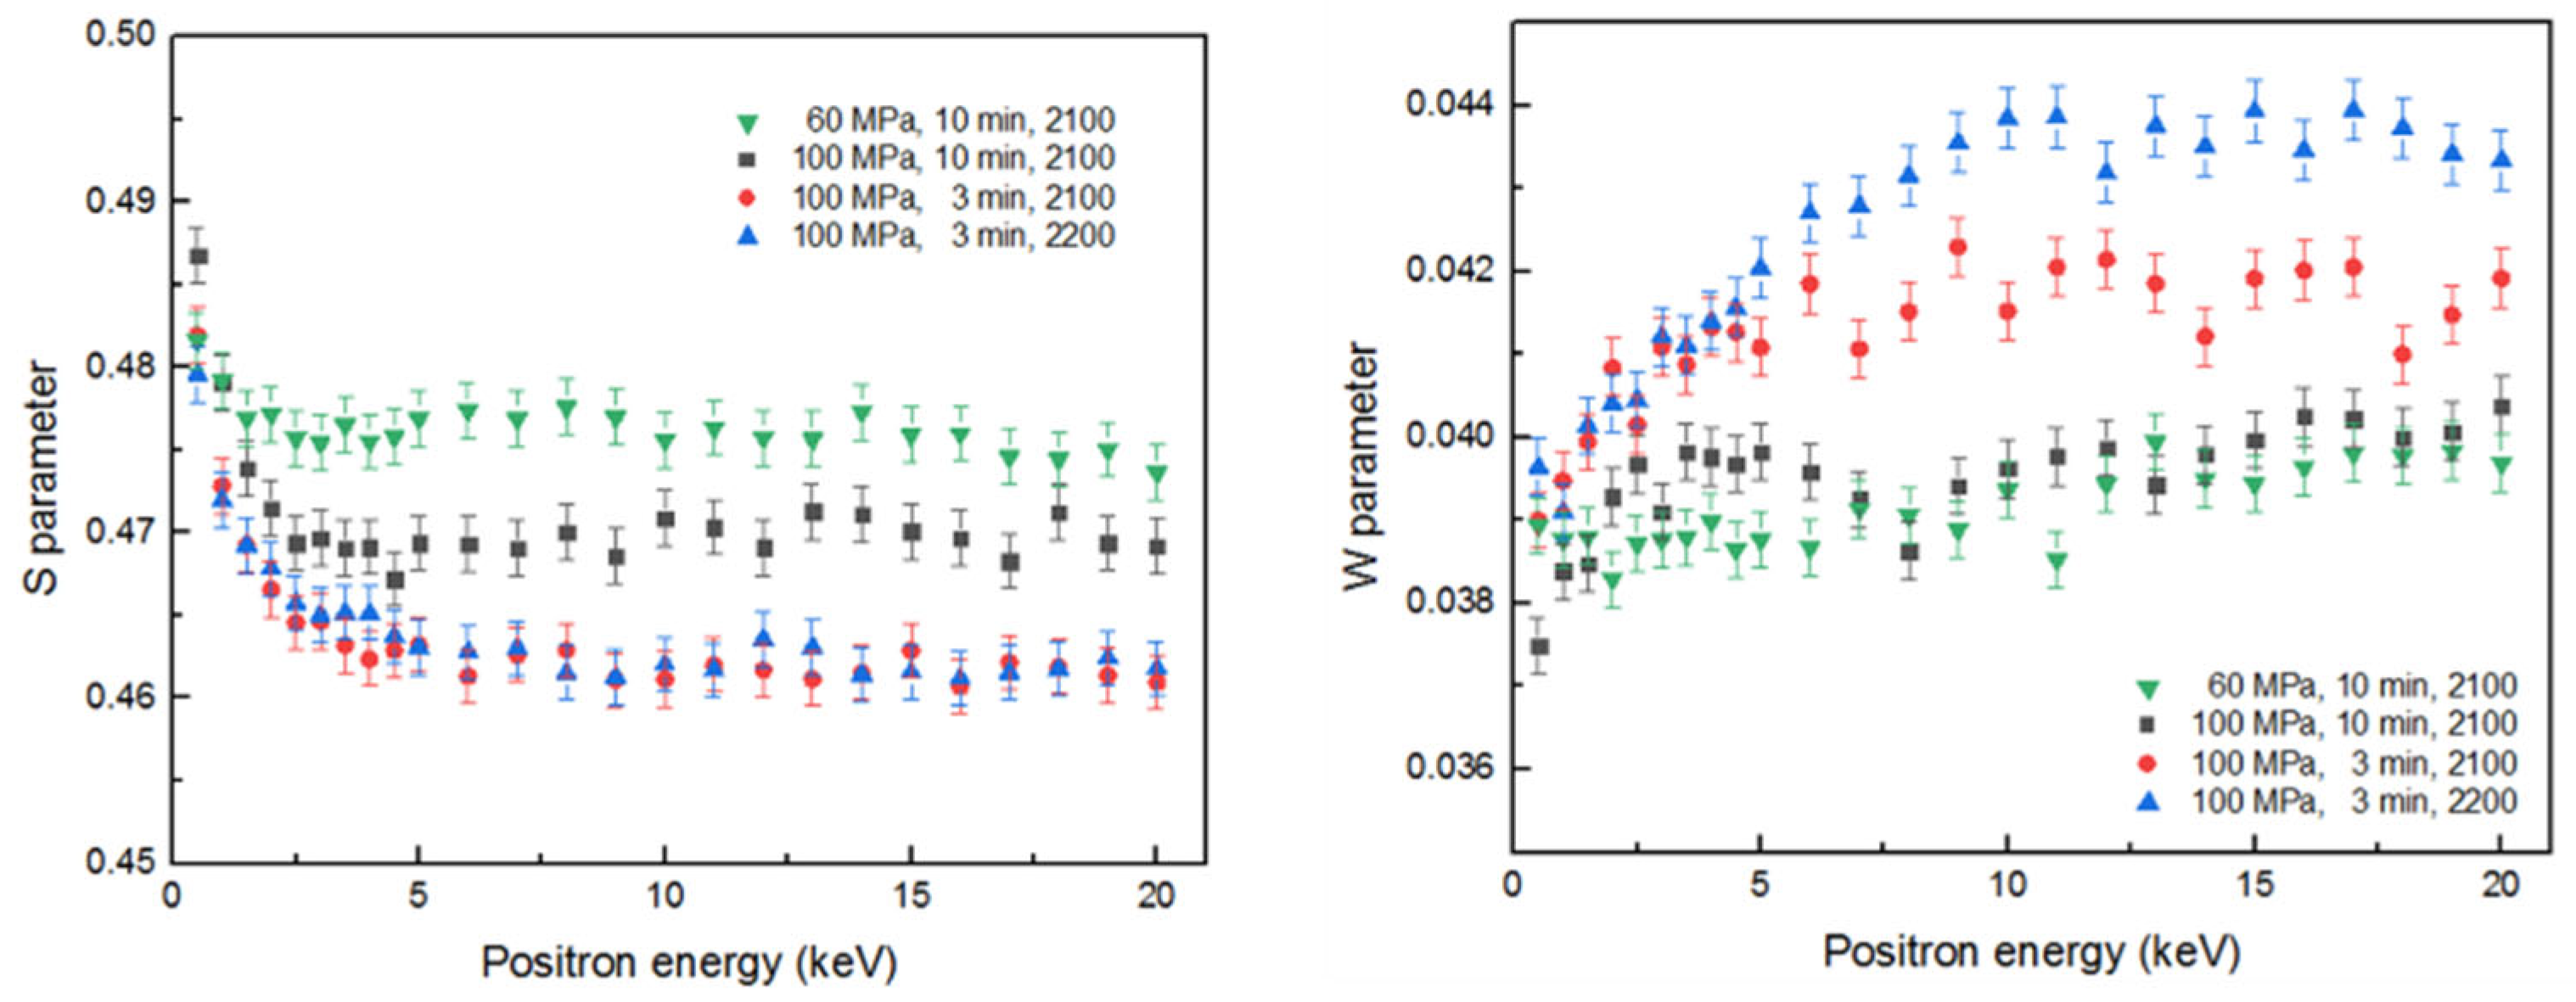
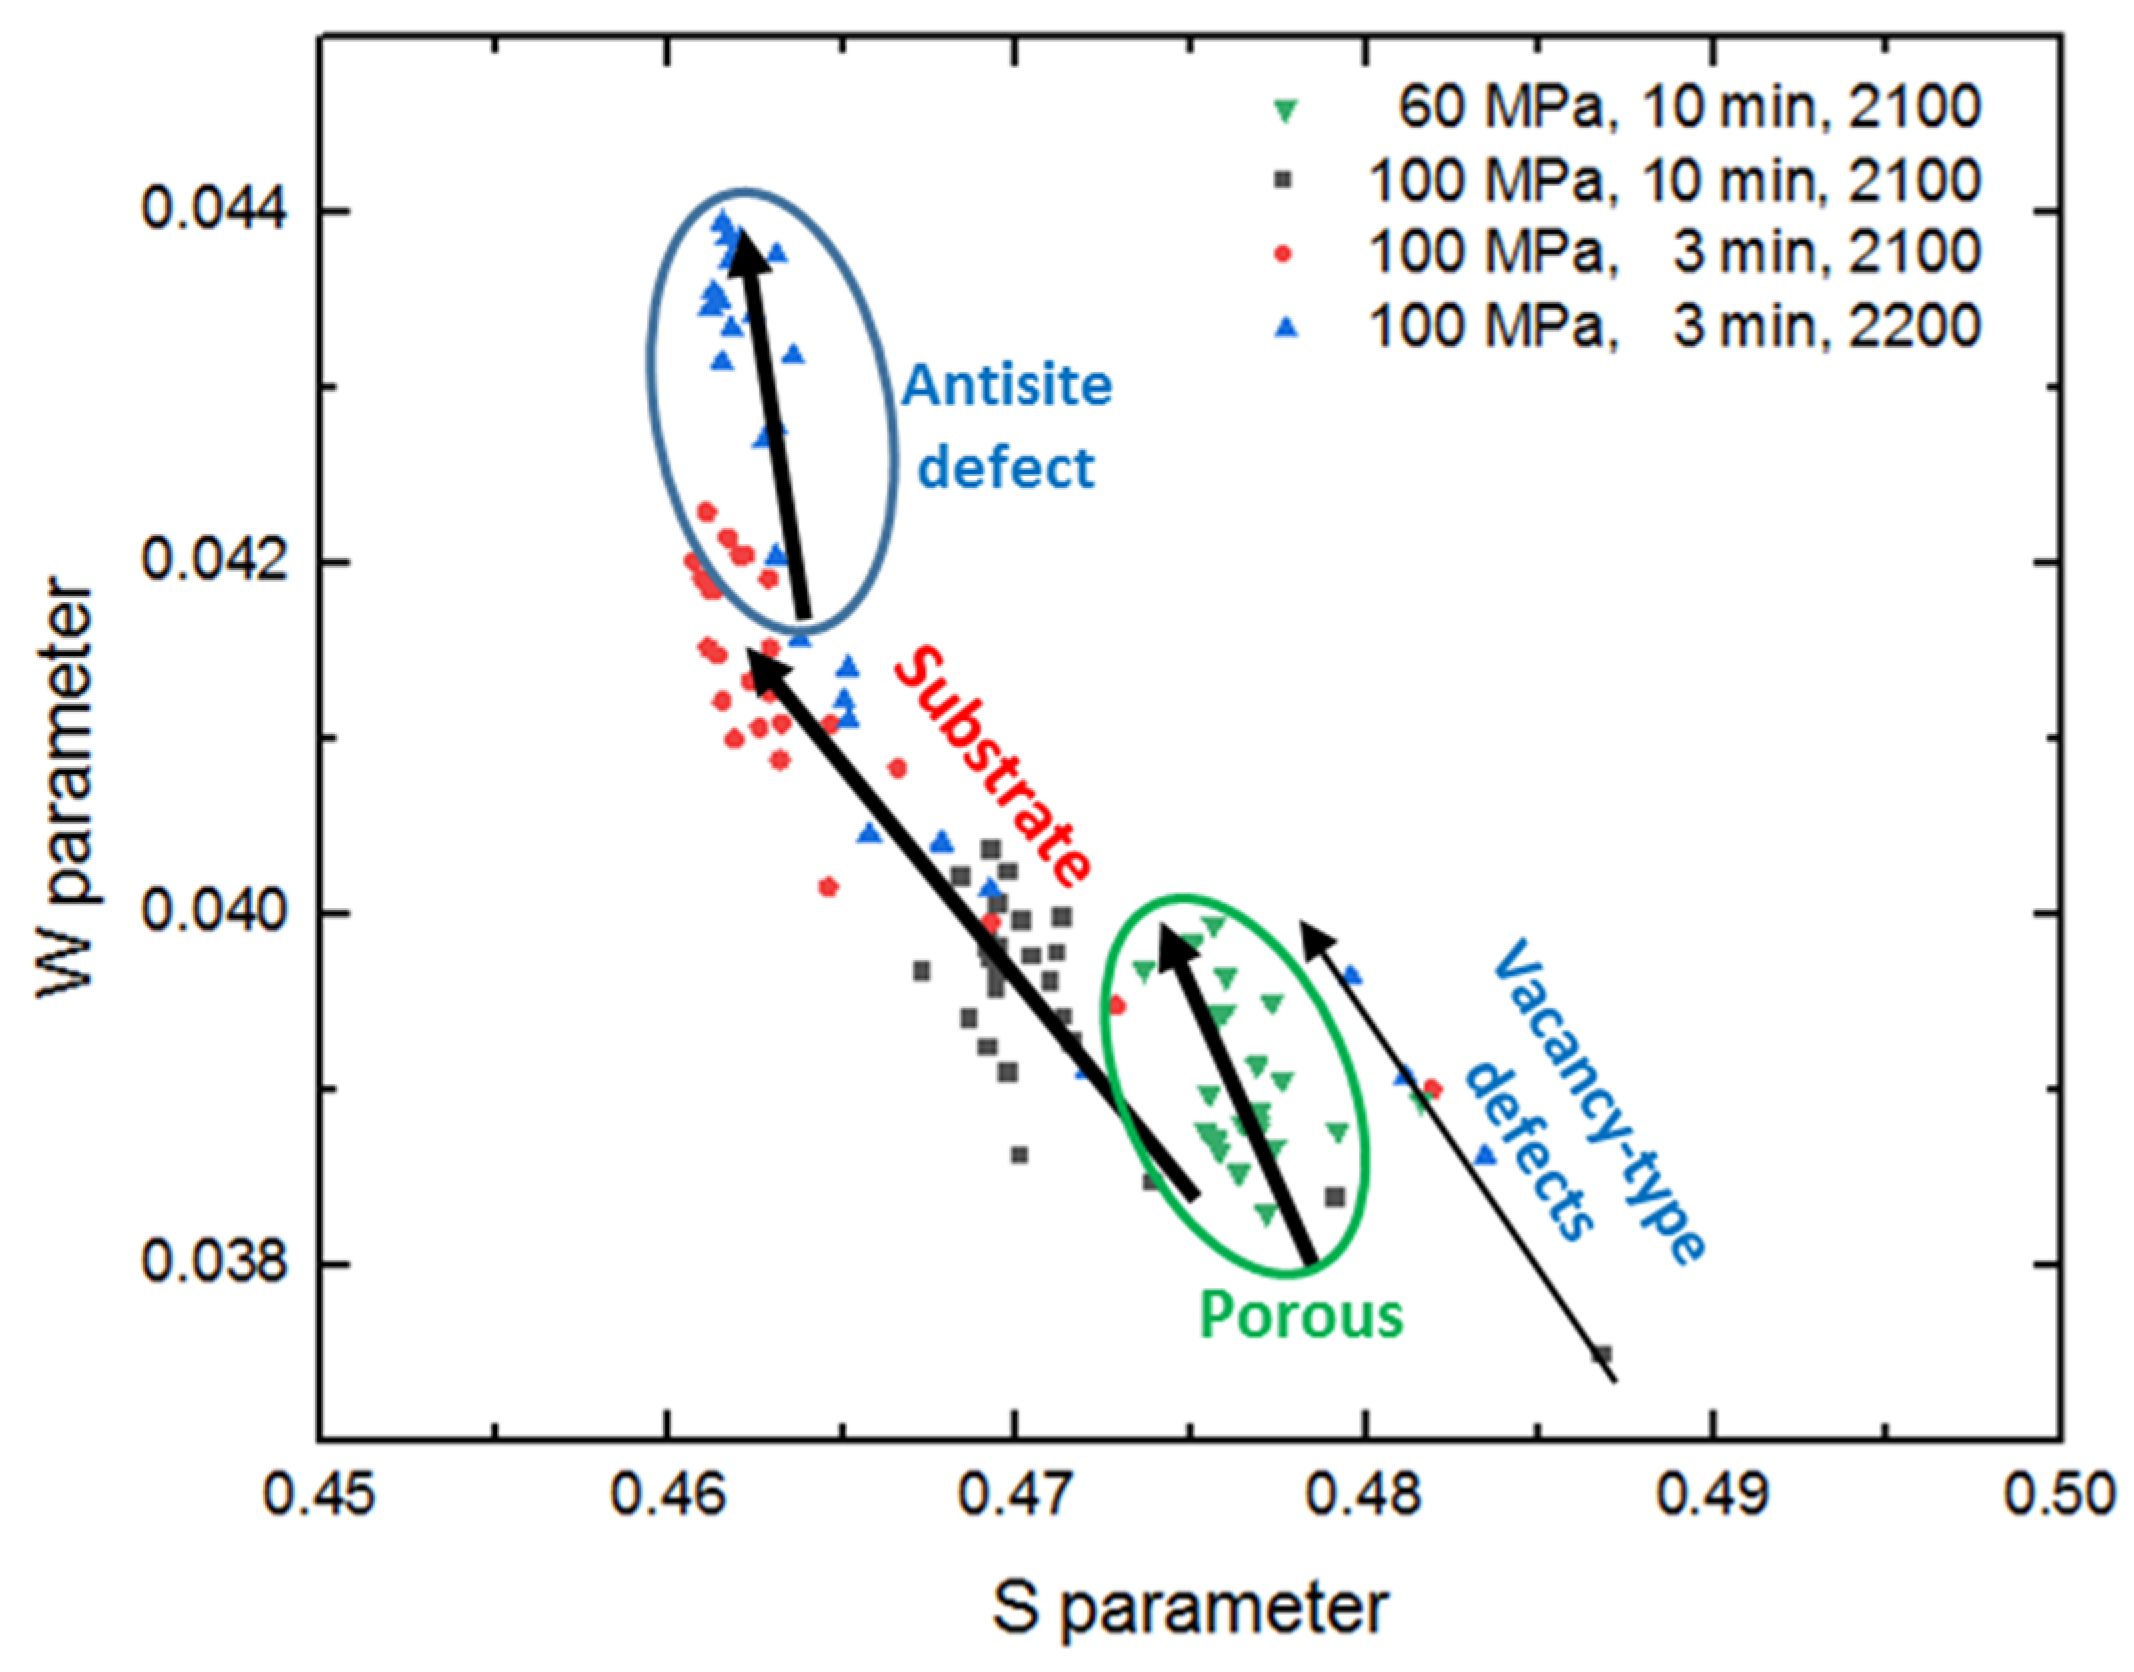
3.2. Defect Structure
4. Conclusions
- Different sintering conditions change the phase composition of the fabricated composites. Compared to a 2100 °C, higher sintering temperature (2200 °C) accelerates the phase transition in the material to 6H-SiC; compared to 3 min, a longer sintering time (10 min) results in an increase in the proportion of 6H-SiC. Nanopores are formed in the specimen sintered at 2200 °C.
- The sintering process removes vacancy-type defects in the material. However, higher sintering temperature (2200 °C) leads to excessively high phase transition rate, further introducing vacancy-type defects.
- A phase is observed in the fibers of SiCf/SiC composites that is believed to be turbostratic graphite. The turbostratic graphite (or graphene) may be caused by the diffusion of carbon from the residual cellulose fibers surface during the sintering process.
Author Contributions
Funding
Institutional Review Board Statement
Informed Consent Statement
Data Availability Statement
Conflicts of Interest
References
- Li, K.; Kashkarov, E.; Syrtanov, M.; Sedanova, E.; Ivashutenko, A.; Lider, A.; Fan, P.; Yuan, D.; Travitzky, N. Preceramic paper-derived SiCf/SiC composites obtained by spark plasma sintering: Processing, microstructure and mechanical properties. Materials 2020, 13, 607. [Google Scholar] [CrossRef] [PubMed] [Green Version]
- Liu, G.; Zhang, X.; Yang, J.; Qiao, G. Recent advances in joining of SiC-based materials (monolithic SiC and SiCf/SiC composites): Joining processes, joint strength, and interfacial behavior. J. Adv. Ceram. 2019, 8, 19–38. [Google Scholar] [CrossRef] [Green Version]
- Zhou, X.G.; Wang, H.L.; Zhao, S. Progress of SiCf/SiC composites for nuclear application. J. Adv. Ceram. 2016, 37, 151–167. [Google Scholar]
- Lee, Y.; McKrell, T.J.; Kazimi, M.S. Thermal shock fracture of silicon carbide and its application to fuel cladding performance during reflood. Nucl. Eng. Technol. 2013, 45, 811–820. [Google Scholar] [CrossRef] [Green Version]
- Chen, M.W.; Xie, W.J.; Qiu, H.P. Recent progress in continuous SiC fiber SiC laminated composites. J. Adv. Ceram. 2016, 37, 393–402. [Google Scholar]
- Perez-Bergquist, A.G.; Nozawa, T.; Shih, C.; Leonard, K.J.; Snead, L.L.; Katoh, Y. High dose neutron irradiation of Hi-Nicalon Type S silicon carbide composites, Part 1: Microstructural evaluations. J. Nucl. Mater. 2015, 462, 443–449. [Google Scholar] [CrossRef] [Green Version]
- Chen, S.; Zhang, C.; Zhang, Y.; Hu, H. Influence of pyrocarbon amount in C/C preform on the microstructure and properties of C/ZrC composites prepared via reactive melt infiltration. Mater. Des. 2014, 58, 570–576. [Google Scholar] [CrossRef]
- Song, C.; Liu, Y.; Ye, F.; Cheng, L.; Zhang, P.; Chai, N. Enhanced mechanical property and tunable dielectric property of SiCf/SiC-SiBCN composites by CVI combined with PIP. J. Adv. Ceram. 2021, 10, 758–767. [Google Scholar] [CrossRef]
- Dermeik, B.; Lorenz, H.; Bonet, A.; Travitzky, N. Highly filled papers, on their manufacturing, processing, and applications. Adv. Eng. Mater. 2019, 21, 1900180. [Google Scholar] [CrossRef]
- Travitzky, N.; Windsheimer, H.; Fey, T.; Greil, P. Preceramic paper-derived ceramics. J. Am. Ceram. Soc. 2008, 91, 3477–3492. [Google Scholar] [CrossRef]
- Shi, L.K.; Zhou, X.; Dai, J.Q.; Chen, K.; Huang, Q. Microstructure and properties of nano-laminated Y3Si2C2 ceramics fabricated via in situ reaction by spark plasma sintering. J. Adv. Ceram. 2021, 10, 578–586. [Google Scholar] [CrossRef]
- Wang, H.; Gao, S.; Peng, S.; Zhou, X.; Zhang, H.; Zhou, X.; Li, B. KD-S SiCf/SiC composites with BN interface fabricated by polymer infiltration and pyrolysis process. J. Adv. Ceram. 2018, 7, 169–177. [Google Scholar] [CrossRef] [Green Version]
- Demir, A. Effect of Nicalon SiC fibre heat treatment on short fibre reinforced β-sialon ceramics. J. Eur. Ceram. Soc. 2012, 32, 1405–1411. [Google Scholar] [CrossRef]
- Gao, P.Z.; Cheng, L.; Yuan, Z.; Liu, X.P.; Xiao, H.N. High temperature mechanical retention characteristics and oxidation behaviors of the MoSi2(Cr5Si3)–RSiC composites prepared via a PIP-AAMI combined process. J. Adv. Ceram. 2019, 8, 196–208. [Google Scholar] [CrossRef] [Green Version]
- Bordulev, I.; Kudiiarov, V.; Svyatkin, L.; Syrtanov, M.; Stepanova, E.; Čížek, J.; Vlček, M.; Li, K.; Laptev, R.; Lider, A. Positron annihilation spectroscopy study of defects in hydrogen loaded Zr-1Nb alloy. J. Alloy. Compd. 2019, 798, 685–694. [Google Scholar] [CrossRef]
- Wang, P.; Ma, Y.; Qin, X.; Zhang, Z.; Cao, X.; Yu, R.; Wang, B. Performance of the plugged-in 22Na Based slow positron beam facility. Chin. Phys. C 2008, 32, 243–246. [Google Scholar] [CrossRef]
- Patterson, A.L. The Scherrer Formula for X-Ray Particle Size Determination. Phys. Rev. 1939, 56, 978–982. [Google Scholar] [CrossRef]
- Chaoli, F.U.; Yang, Y.; Huang, Z.; Liu, G.; Zhang, H.; Jiang, D.; Wei, Y.; Jiao, Z. Investigation on the laser ablation of SiC ceramics using micro-Raman mapping technique. J. Adv. Ceram. 2016, 5, 253–261. [Google Scholar] [CrossRef] [Green Version]
- Jiruše, J.; Haničinec, M.; Havelka, M.; Hollricher, O.; Ibach, W.; Spizig, P. Integrating focused ion-beam-scanning electron microscope with confocal Raman microscope into a single instrument. J. Vac. Sci. Technol. 2014, 32, 06FC03. [Google Scholar] [CrossRef]
- Ogbuji, L.U.; Mitchell, T.E.; Heuer, A.H. The beta-alpha transformation in polycrystalline SiC:3, the thickening of alpha plates. J. Am. Ceram. Soc. 1981, 64, 91–99. [Google Scholar] [CrossRef]
- Jawhari, T.; Roid, A. Casado Raman spectroscopic characterization of some commercially available carbon black materials. Carbon 1995, 33, 1560–1565. [Google Scholar] [CrossRef]
- Kawasuso, A.; Yoshikawa, M.; Itoh, H.; Krause-Rehberg, R.; Redmann, F.; Higuchi, T.; Betsuyaku, K. Positron study of electron irradiation-induced vacancy defects in SiC. Phys. B 2006, 376–377, 350–353. [Google Scholar] [CrossRef]
- Bockstedte, M.; Mattausch, A.; Pankratov, O. Ab initio study of the annealing of vacancies and interstitials in cubic SiC: Vacancy-interstitial recombination and aggregation of carbon interstitials. Phys. Rev. B 2003, 69, 235202. [Google Scholar] [CrossRef] [Green Version]
- Gao, F.; Weber, W.J. Recovery of close Frekel pairs produced by low energy recoils in SiC. J. Appl. Phys. 2003, 94, 4348. [Google Scholar] [CrossRef]
- Itoh, H.; Yoshikawa, M.; Nashiyama, I. Defects in electron-irradiated 3C-SiC epilayers observed by positron annihilation. Hyperfine Interact. 1993, 79, 725–729. [Google Scholar] [CrossRef]
- Syvajrvi, M.; Yakimova, R.; Glans, P.A.; Henry, A.; MacMillan, M.F.; Johansson, L.I.; Janzén, E. Morphology and polytype disturbances in sublimation growth of SiC epitaxial layers. J. Cryst. Growth 1999, 198, 1019–1023. [Google Scholar] [CrossRef]
- Patil, P.N.; Sudarshan, K.; Sharma, S.K.; Dutta, D.; Maheshwari, P.; Pujari, P.K. Microstructural studies of poly (perfluorosulfonic acid) membrane doped with silver nanoparticles using positron annihilation spectroscopy. J. Phys. Conf. Ser. 2011, 262, 012045. [Google Scholar] [CrossRef]
- Sachdeva, A.; Sudarshan, K.; Pujari, P.K.; Goswami, A.; Sreejith, K.; George, V.C.; Pillai, C.G.S.; Dua, A.K. Identification of nitrogen decorated vacancies in CVD diamond films using positron annihilation coincidence Doppler broadening spectroscopy. Diam. Relat. Mater. 2004, 13, 1719–1724. [Google Scholar] [CrossRef]
- Chirayath, V.A.; Chrysler, M.D.; McDonald, A.D.; Gladen, R.W.; Fairchild, A.J.; Koymen, A.R.; Weiss, A.H. Investigation of graphene using low energy positron annihilation induced Doppler broadening spectroscopy. IOP Conf. Ser. J. Phys. Conf. Ser. 2017, 791, 012032. [Google Scholar] [CrossRef] [Green Version]
- Reino, A.; Kimmo, S.; Björn, M.; Erik, J. Clustering of vacancies in semi-insulating SiC observed with positron spectroscopy. Mater. Sci. Forum 2006, 527, 575–578. [Google Scholar] [CrossRef]
- Perova, T.S.; Moore, R.A.; Berreth, K.; Maile, K.; Lyutovich, A. MicroRaman spectroscopy of protective coatings deposited onto C/C–SiC composites. Mater. Sci. Technol. 2007, 23, 1300–1304. [Google Scholar] [CrossRef]
- Okumura, H.; Sakuma, E.; Lee, J.H.; Mukaida, H.; Misawa, S.; Endo, K.; Yoshida, S. Raman scattering of SiC: Application to the identification of heteroepitaxy of SiC polytypes. J. Appl. Phys. 1987, 61, 1134–1136. [Google Scholar] [CrossRef]
- Qiu, W.; Kang, Y.L. Mechanical behavior study of microdevice and nanomaterials by Raman spectroscopy: A review. Chin. Sci. Bull. 2014, 59, 2811–2824. [Google Scholar] [CrossRef]
- Malard, L.M.; Pimenta, M.A.; Dresselhaus, G.; Dresselhaus, M.S. Raman spectroscopy in graphene. Phys. Rep. 2009, 473, 51–87. [Google Scholar] [CrossRef]
- Agarwal, S.; Chen, Q.; Koyanagi, T.; Zhao, Y.; Zinkle, S.J.; Weber, W.J. Revealing irradiation damage along with the entire damage range in ion-irradiated SiC/SiC composites using Raman spectroscopy. J. Nucl. Mater. 2019, 526, 151778. [Google Scholar] [CrossRef]
- Havel, M.; Colomban, P. Rayleigh and Raman images of the bulk/surface nanostructure of SiC based fibres. Compos. Part B Eng. 2004, 35, 139–147. [Google Scholar] [CrossRef]
- Zhang, R.; Yang, Y.; Wang, C.; Shen, W.; Luo, X. Microstructure of SiC fiber fabricated by three-stage chemical vapor deposition. J. Inorg. Mater. 2010, 25, 1281–1285. [Google Scholar] [CrossRef]
- Mattevi, C.; Kim, H.; Chhowalla, M. A review of chemical vapour deposition of graphene on copper. J. Mater. Chem. 2011, 21, 3324–3334. [Google Scholar] [CrossRef]
- Nienhaus, H.; Kampen, T.U.; Mönch, W. Phonons in 3C-, 4H-, and 6H-SiC. Surf. Sci. 1995, 324, 328–332. [Google Scholar] [CrossRef]


| Specimen | Sintering Pressure (MPa) | Sintering Time (min) | Sintering Temperature (°C) | Phase Ratio (wt %) | Crystallite Size (nm) | |
|---|---|---|---|---|---|---|
| 4H | 6H | |||||
| 1 | 60 | 10 | 2100 | 19.5 | 80.5 | 181.3 |
| 2 | 100 | 10 | 2100 | 18.4 | 81.6 | 194.2 |
| 3 | 100 | 3 | 2100 | 28.1 | 71.9 | 112.5 |
| 4 | 100 | 3 | 2200 | 27.4 | 72.6 | 156.1 |
| Specimen | Sintering Pressure (MPa) | Sintering Time (min) | Sintering Temperature (°C) | |||||||
|---|---|---|---|---|---|---|---|---|---|---|
| 1 | 60 | 10 | 2100 | 139 | 99.5 | - | - | 2.8 | 0.5 | 149 |
| 2 | 100 | 10 | 2100 | 139 | 99.5 | - | - | 2.6 | 0.5 | 149 |
| 3 | 100 | 3 | 2100 | 139 | 99.6 | - | - | 2.7 | 0.4 | 148 |
| 4 | 100 | 3 | 2200 | 139 | 87.2 | 190 | 11.7 | 2.1 | 1.1 | 164 |
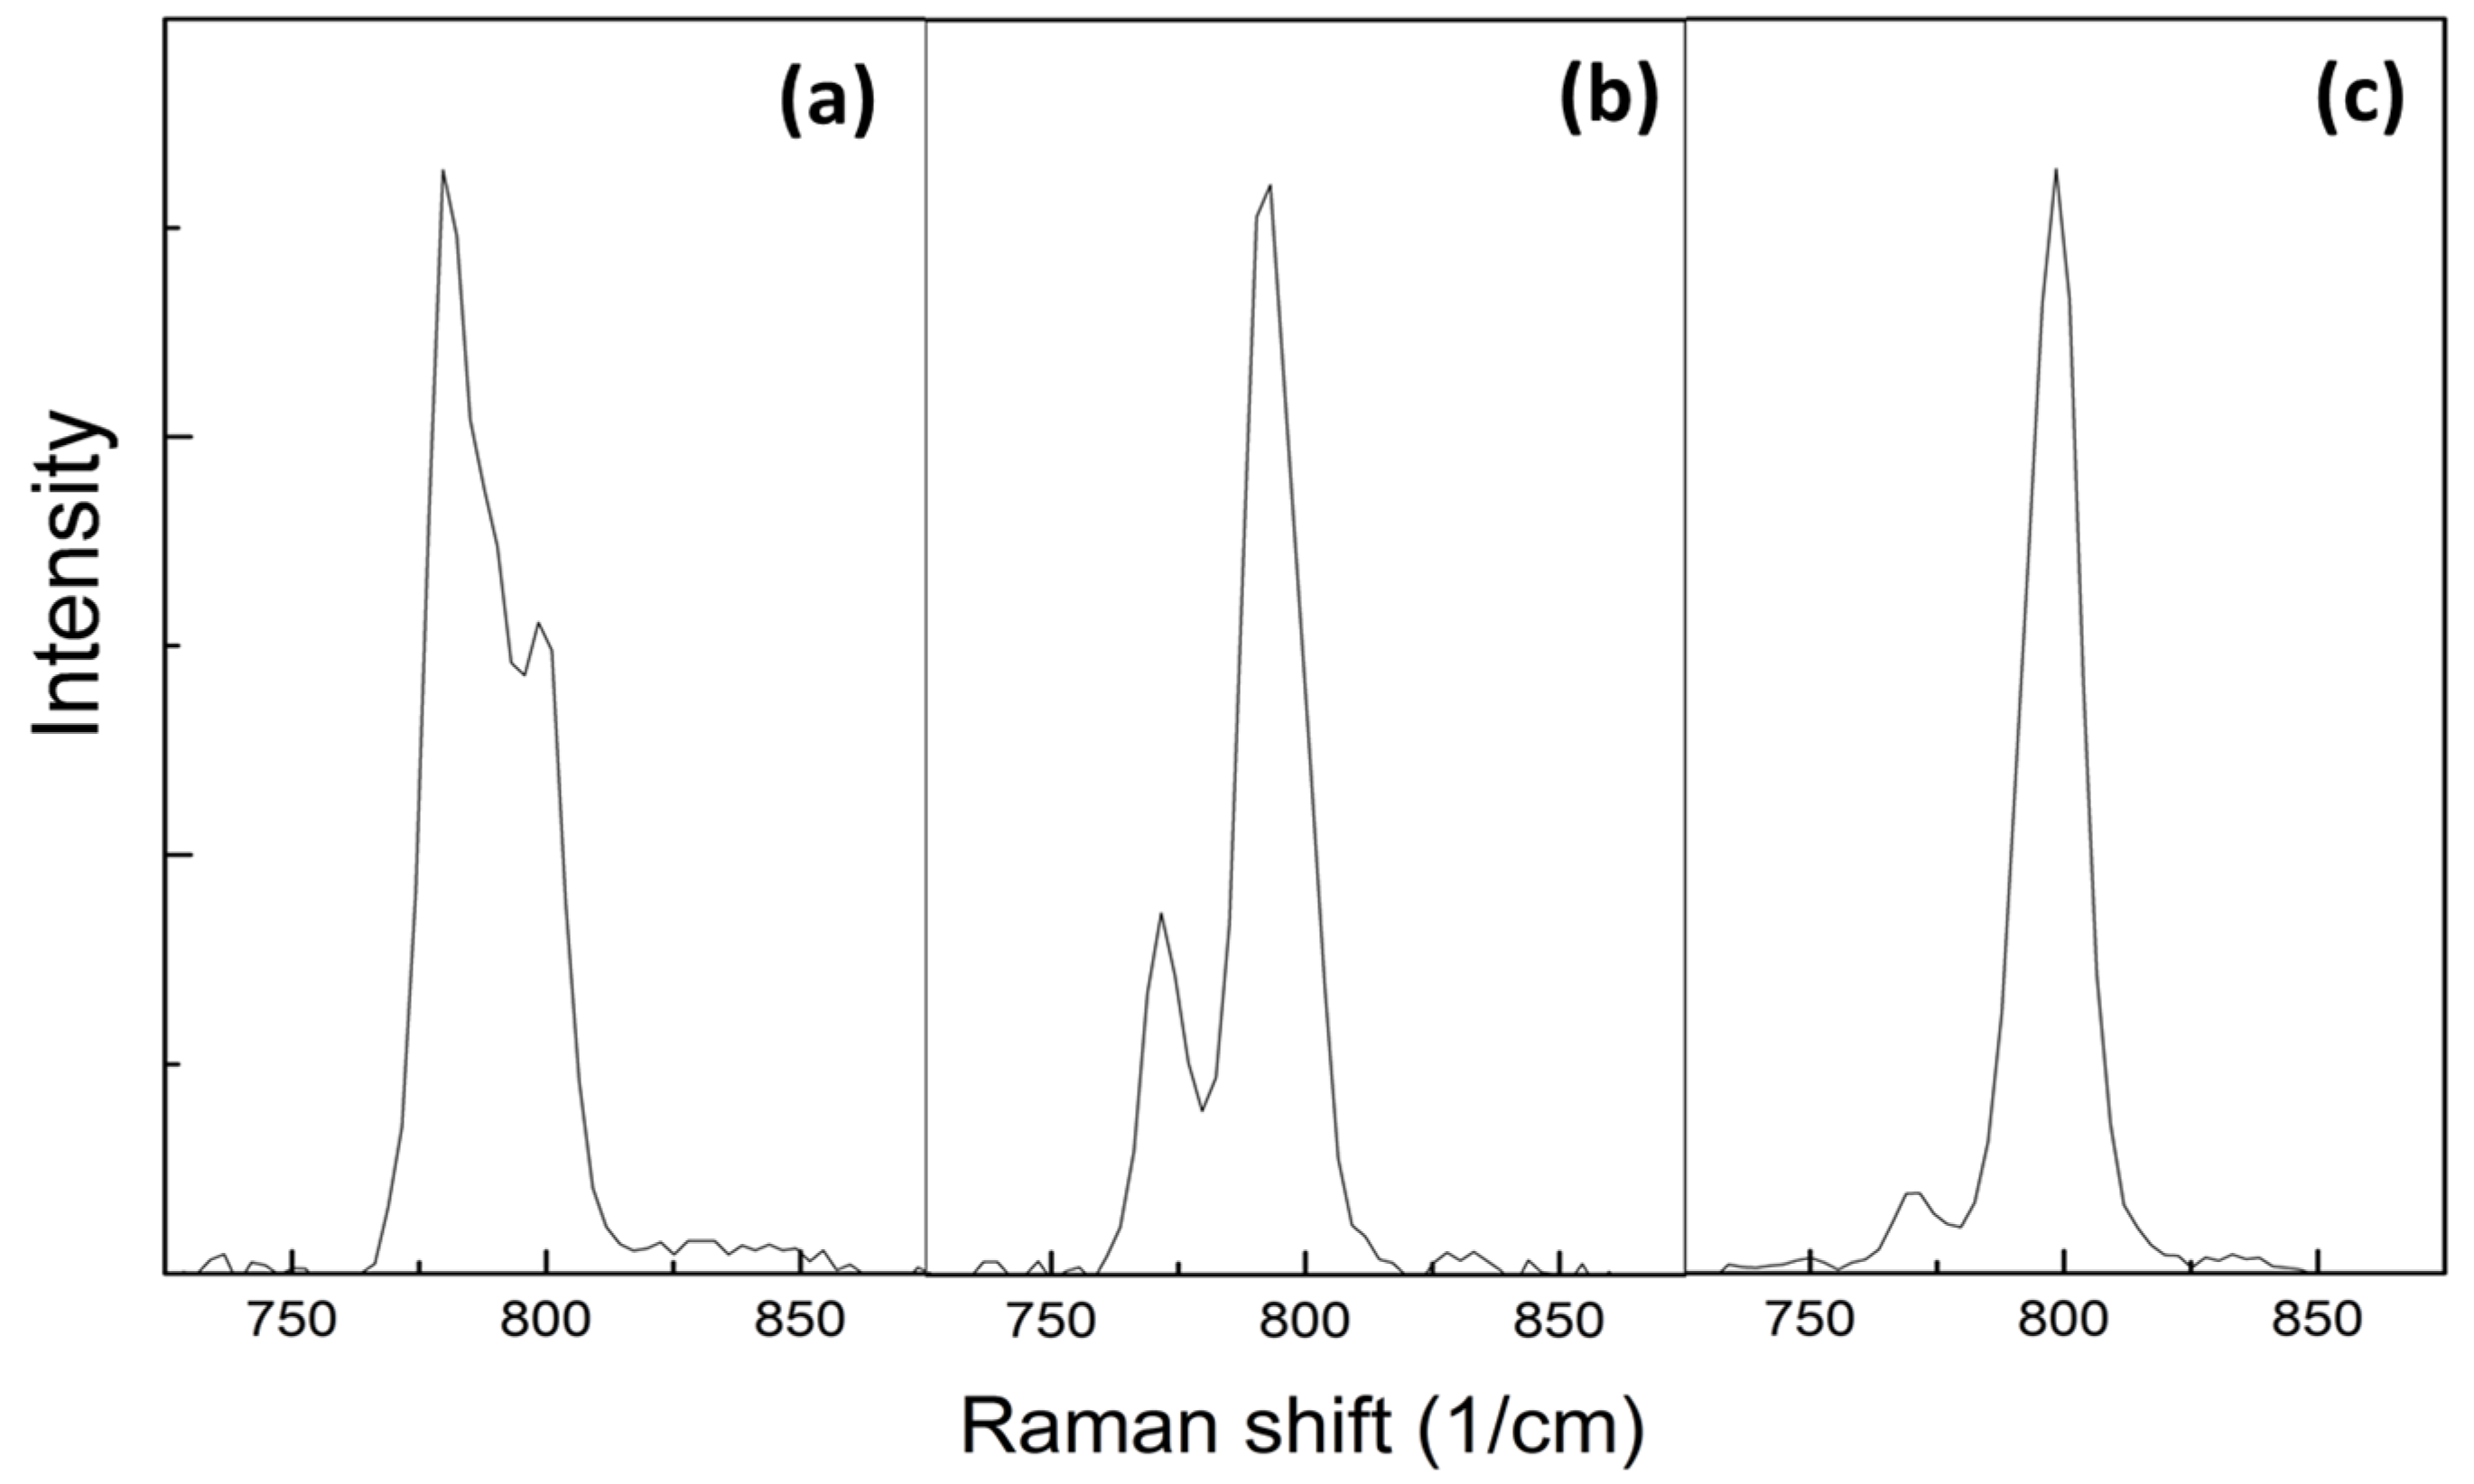
| Specimen | Sintering Pressure (MPa) | Sintering Time (min) | Sintering Temperature (°C) | ||
|---|---|---|---|---|---|
| 1 | 60 | 10 | 2100 | 770 | 772 |
| 798 | 793 | ||||
| 2 | 100 | 10 | 2100 | 770 | 772 |
| 798 | 792 | ||||
| 3 | 100 | 3 | 2100 | 770 | 779 |
| 798 | 799 | ||||
| 4 | 100 | 3 | 2200 | 770 | 772 |
| 798 | 793 |
Publisher’s Note: MDPI stays neutral with regard to jurisdictional claims in published maps and institutional affiliations. |
© 2021 by the authors. Licensee MDPI, Basel, Switzerland. This article is an open access article distributed under the terms and conditions of the Creative Commons Attribution (CC BY) license (https://creativecommons.org/licenses/by/4.0/).
Share and Cite
Li, K.; Kashkarov, E.; Ma, H.; Fan, P.; Zhang, Q.; Zhang, P.; Zhang, J.; Wu, Z.; Wahl, L.; Laptev, R.; et al. Microstructural Analysis of Novel Preceramic Paper-Derived SiCf/SiC Composites. Materials 2021, 14, 6737. https://0-doi-org.brum.beds.ac.uk/10.3390/ma14226737
Li K, Kashkarov E, Ma H, Fan P, Zhang Q, Zhang P, Zhang J, Wu Z, Wahl L, Laptev R, et al. Microstructural Analysis of Novel Preceramic Paper-Derived SiCf/SiC Composites. Materials. 2021; 14(22):6737. https://0-doi-org.brum.beds.ac.uk/10.3390/ma14226737
Chicago/Turabian StyleLi, Ke, Egor Kashkarov, Hailiang Ma, Ping Fan, Qiaoli Zhang, Peng Zhang, Jilong Zhang, Zhaohui Wu, Larissa Wahl, Roman Laptev, and et al. 2021. "Microstructural Analysis of Novel Preceramic Paper-Derived SiCf/SiC Composites" Materials 14, no. 22: 6737. https://0-doi-org.brum.beds.ac.uk/10.3390/ma14226737