
Investigation of Effect of Preliminary Annealing on Superplasticity of Ultrafine-Grained Conductor Aluminum Alloys Al-0.5%Mg-Sc


 , , , ,
Abstract
:1. Introduction
2. Materials and Methods
3. Results
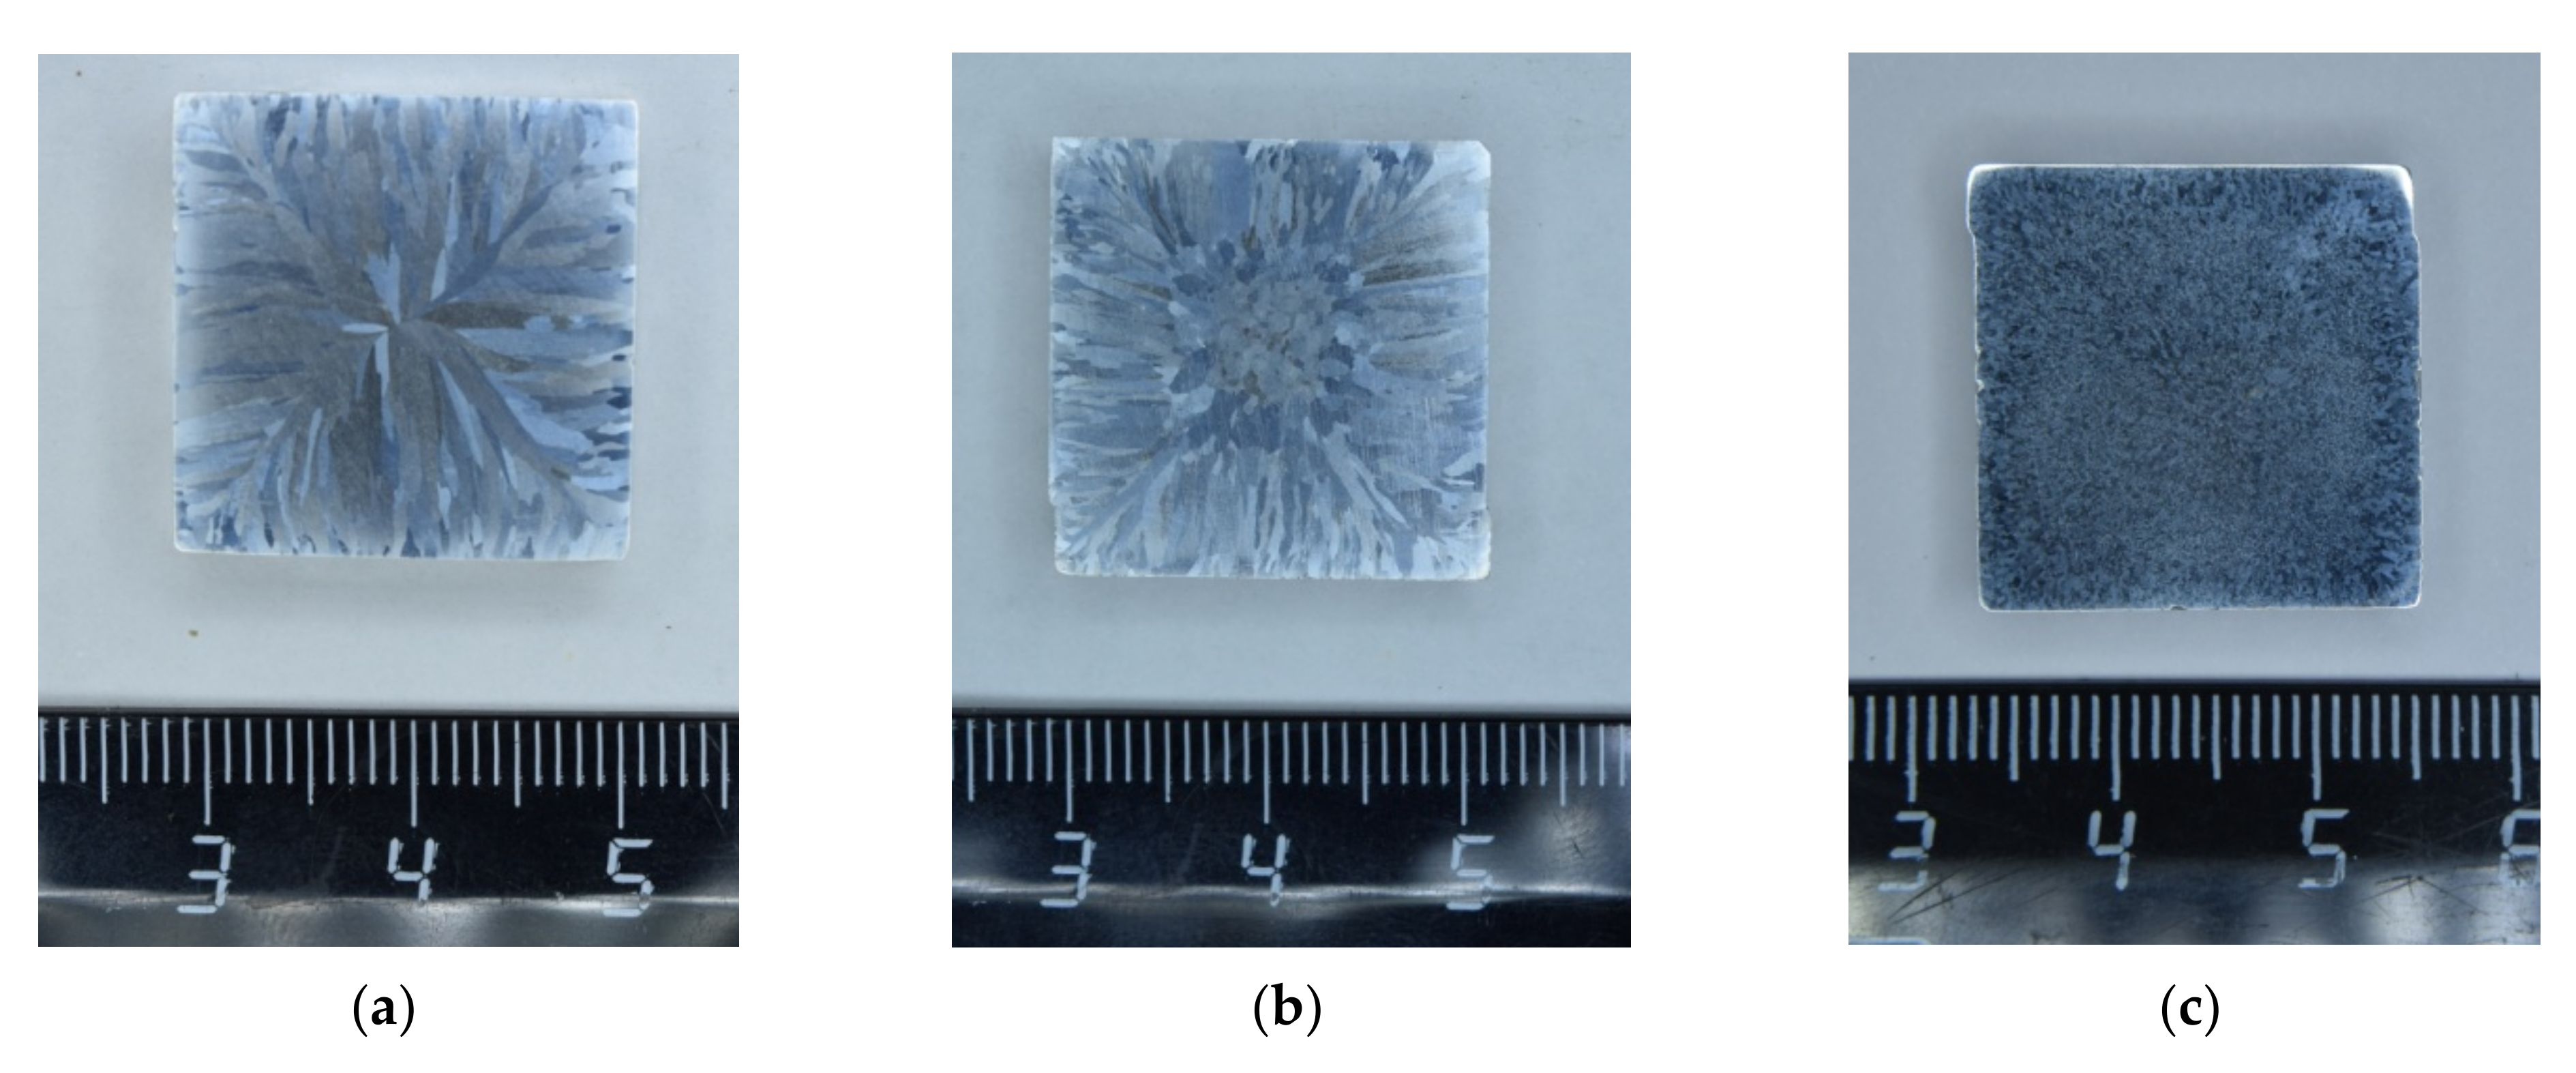
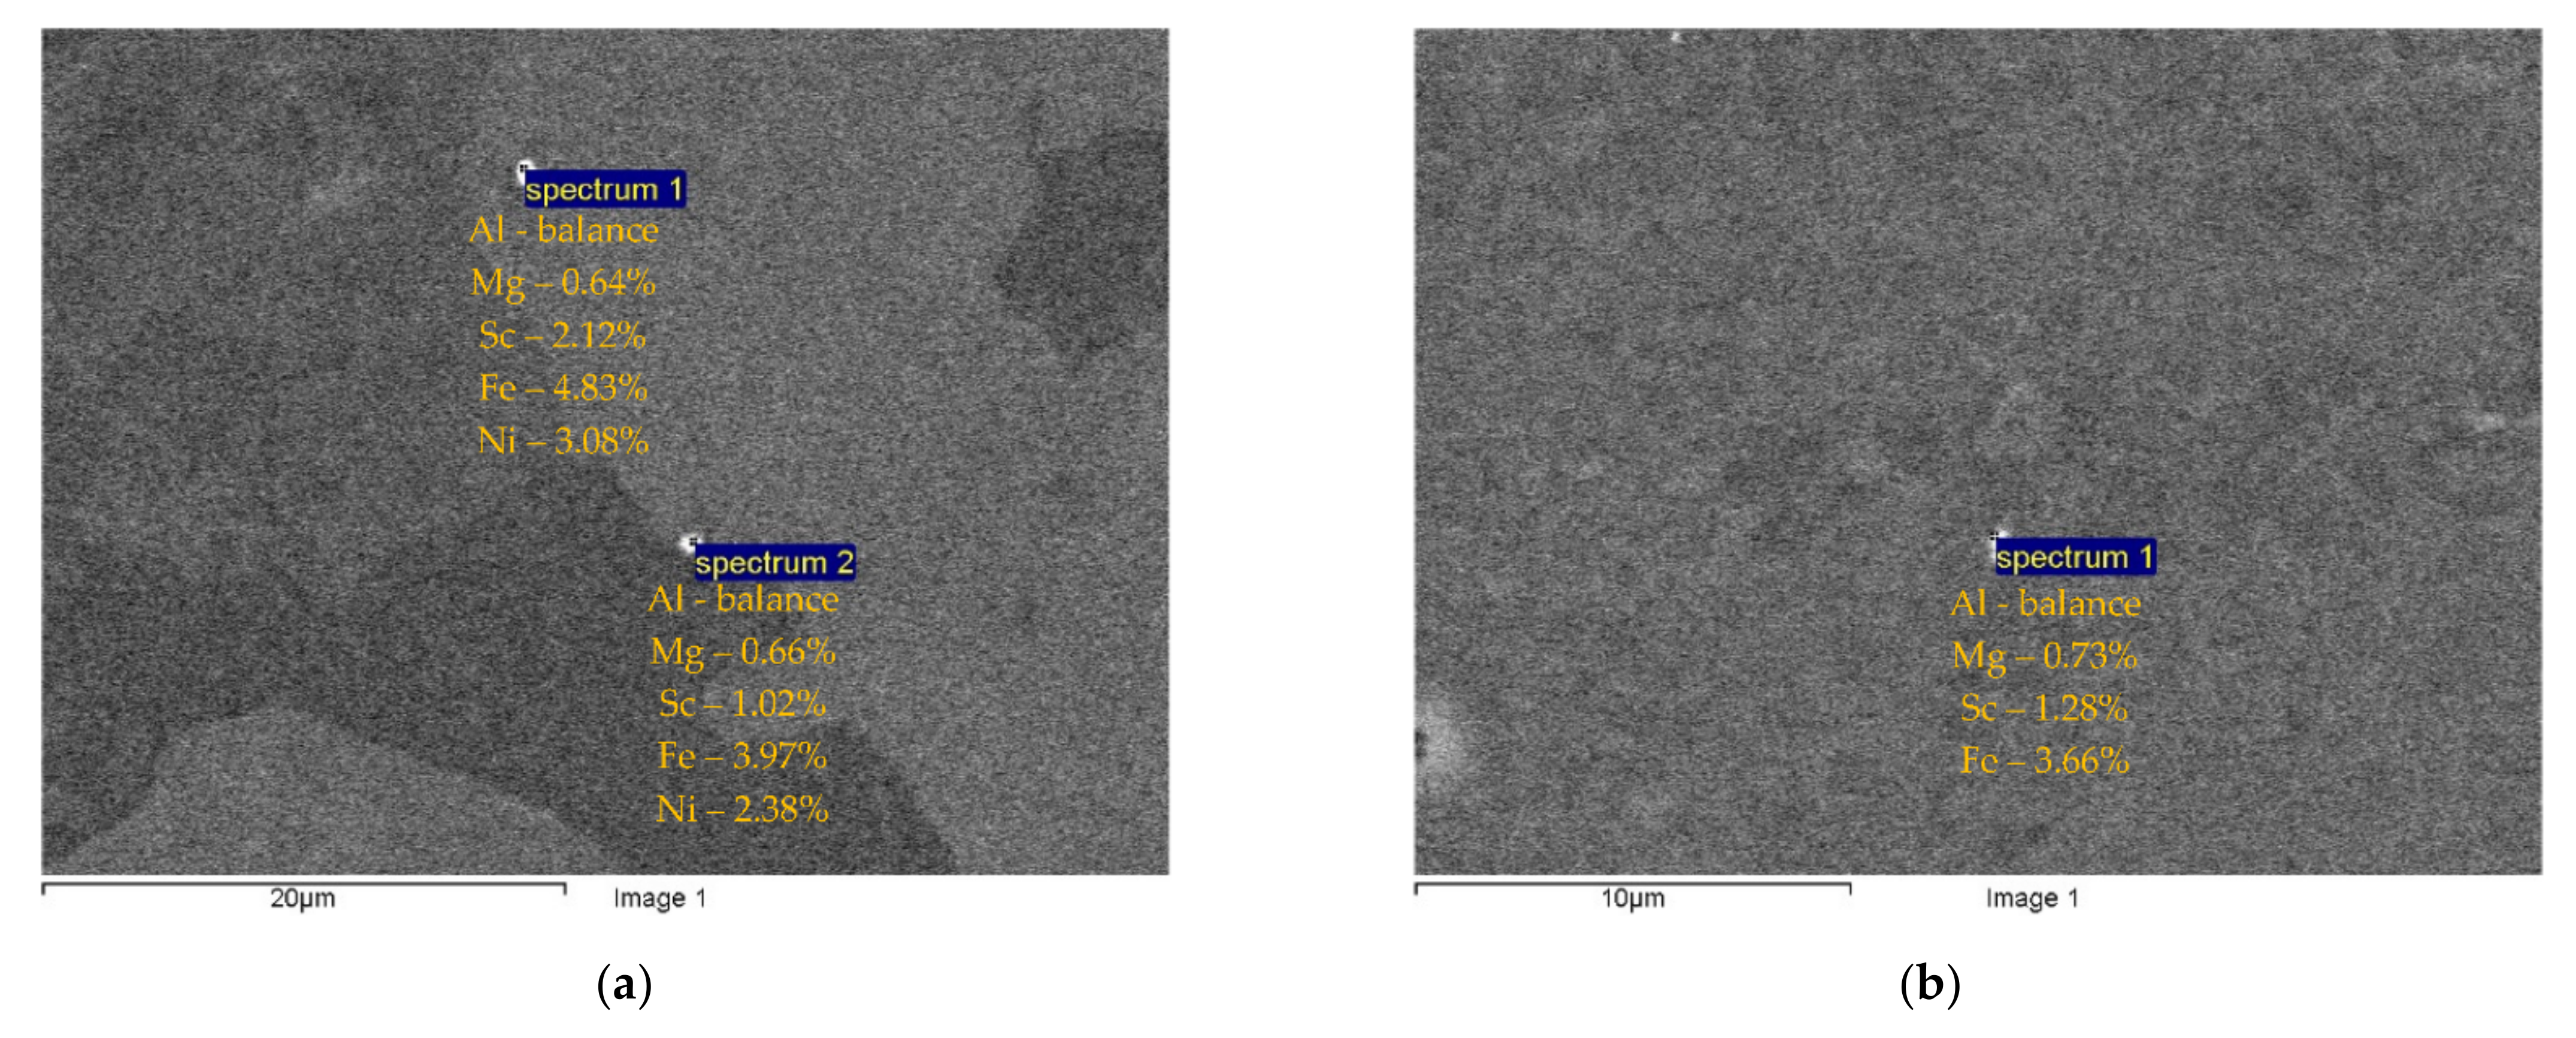
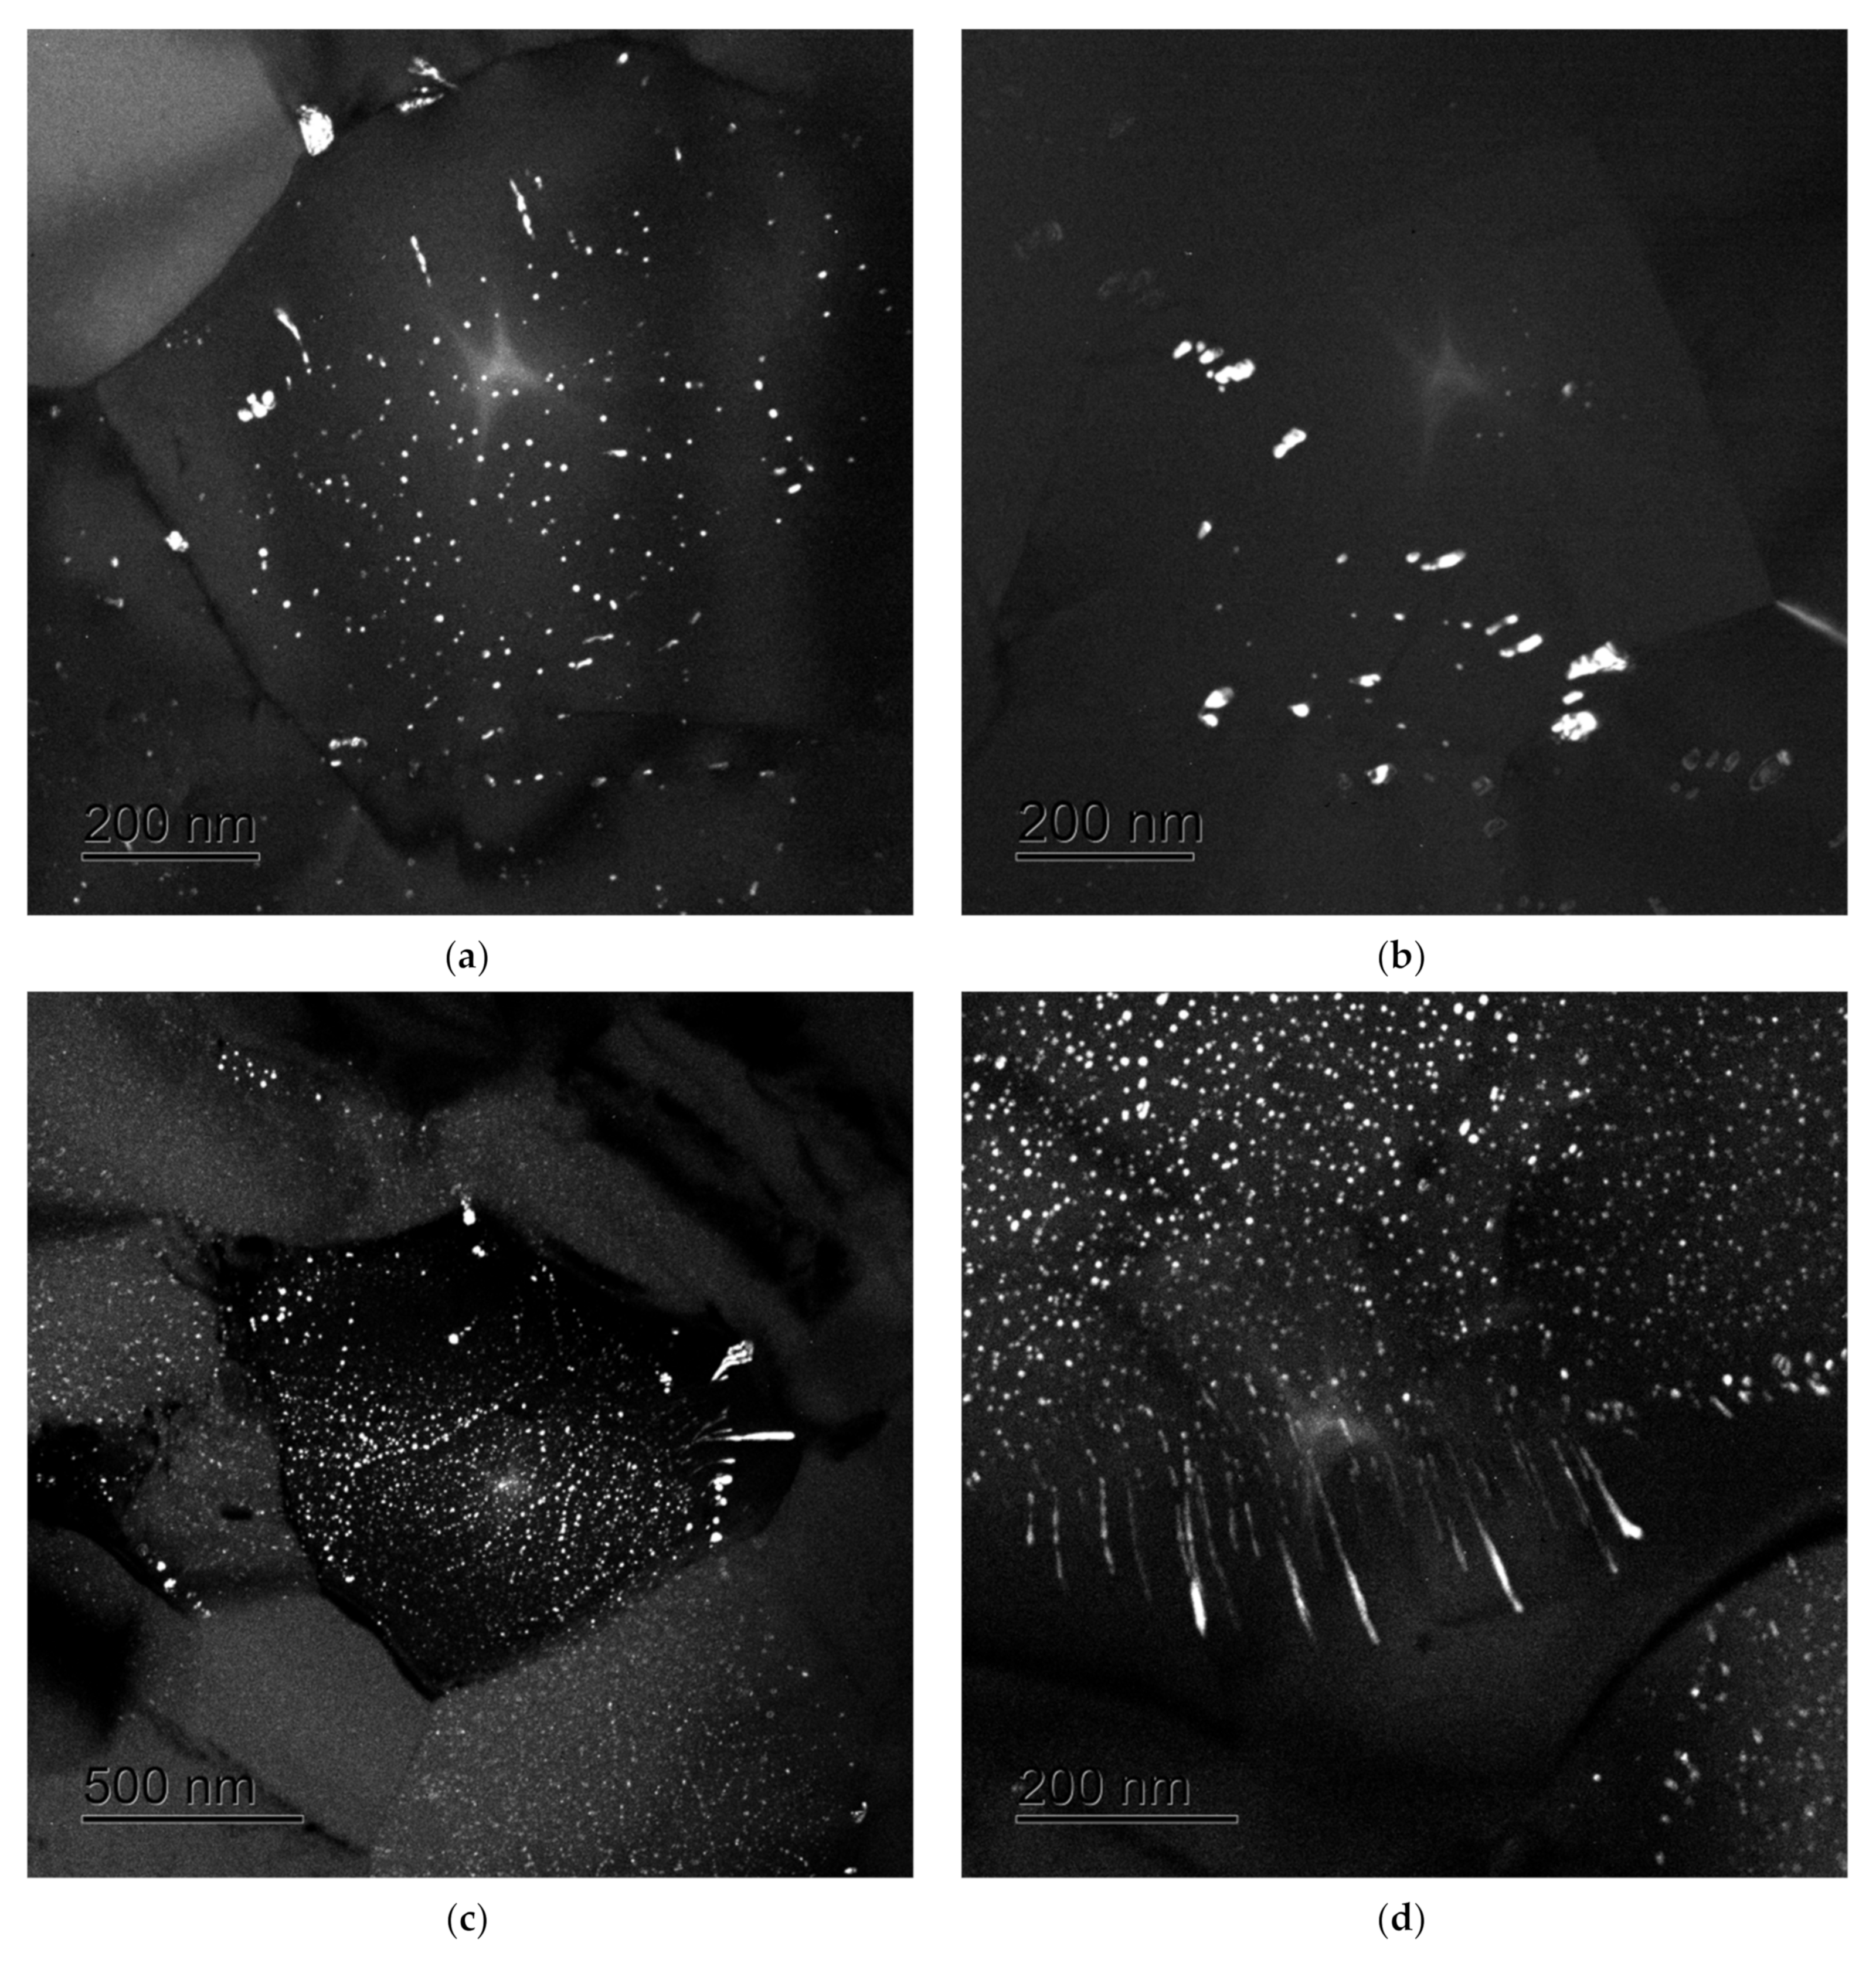
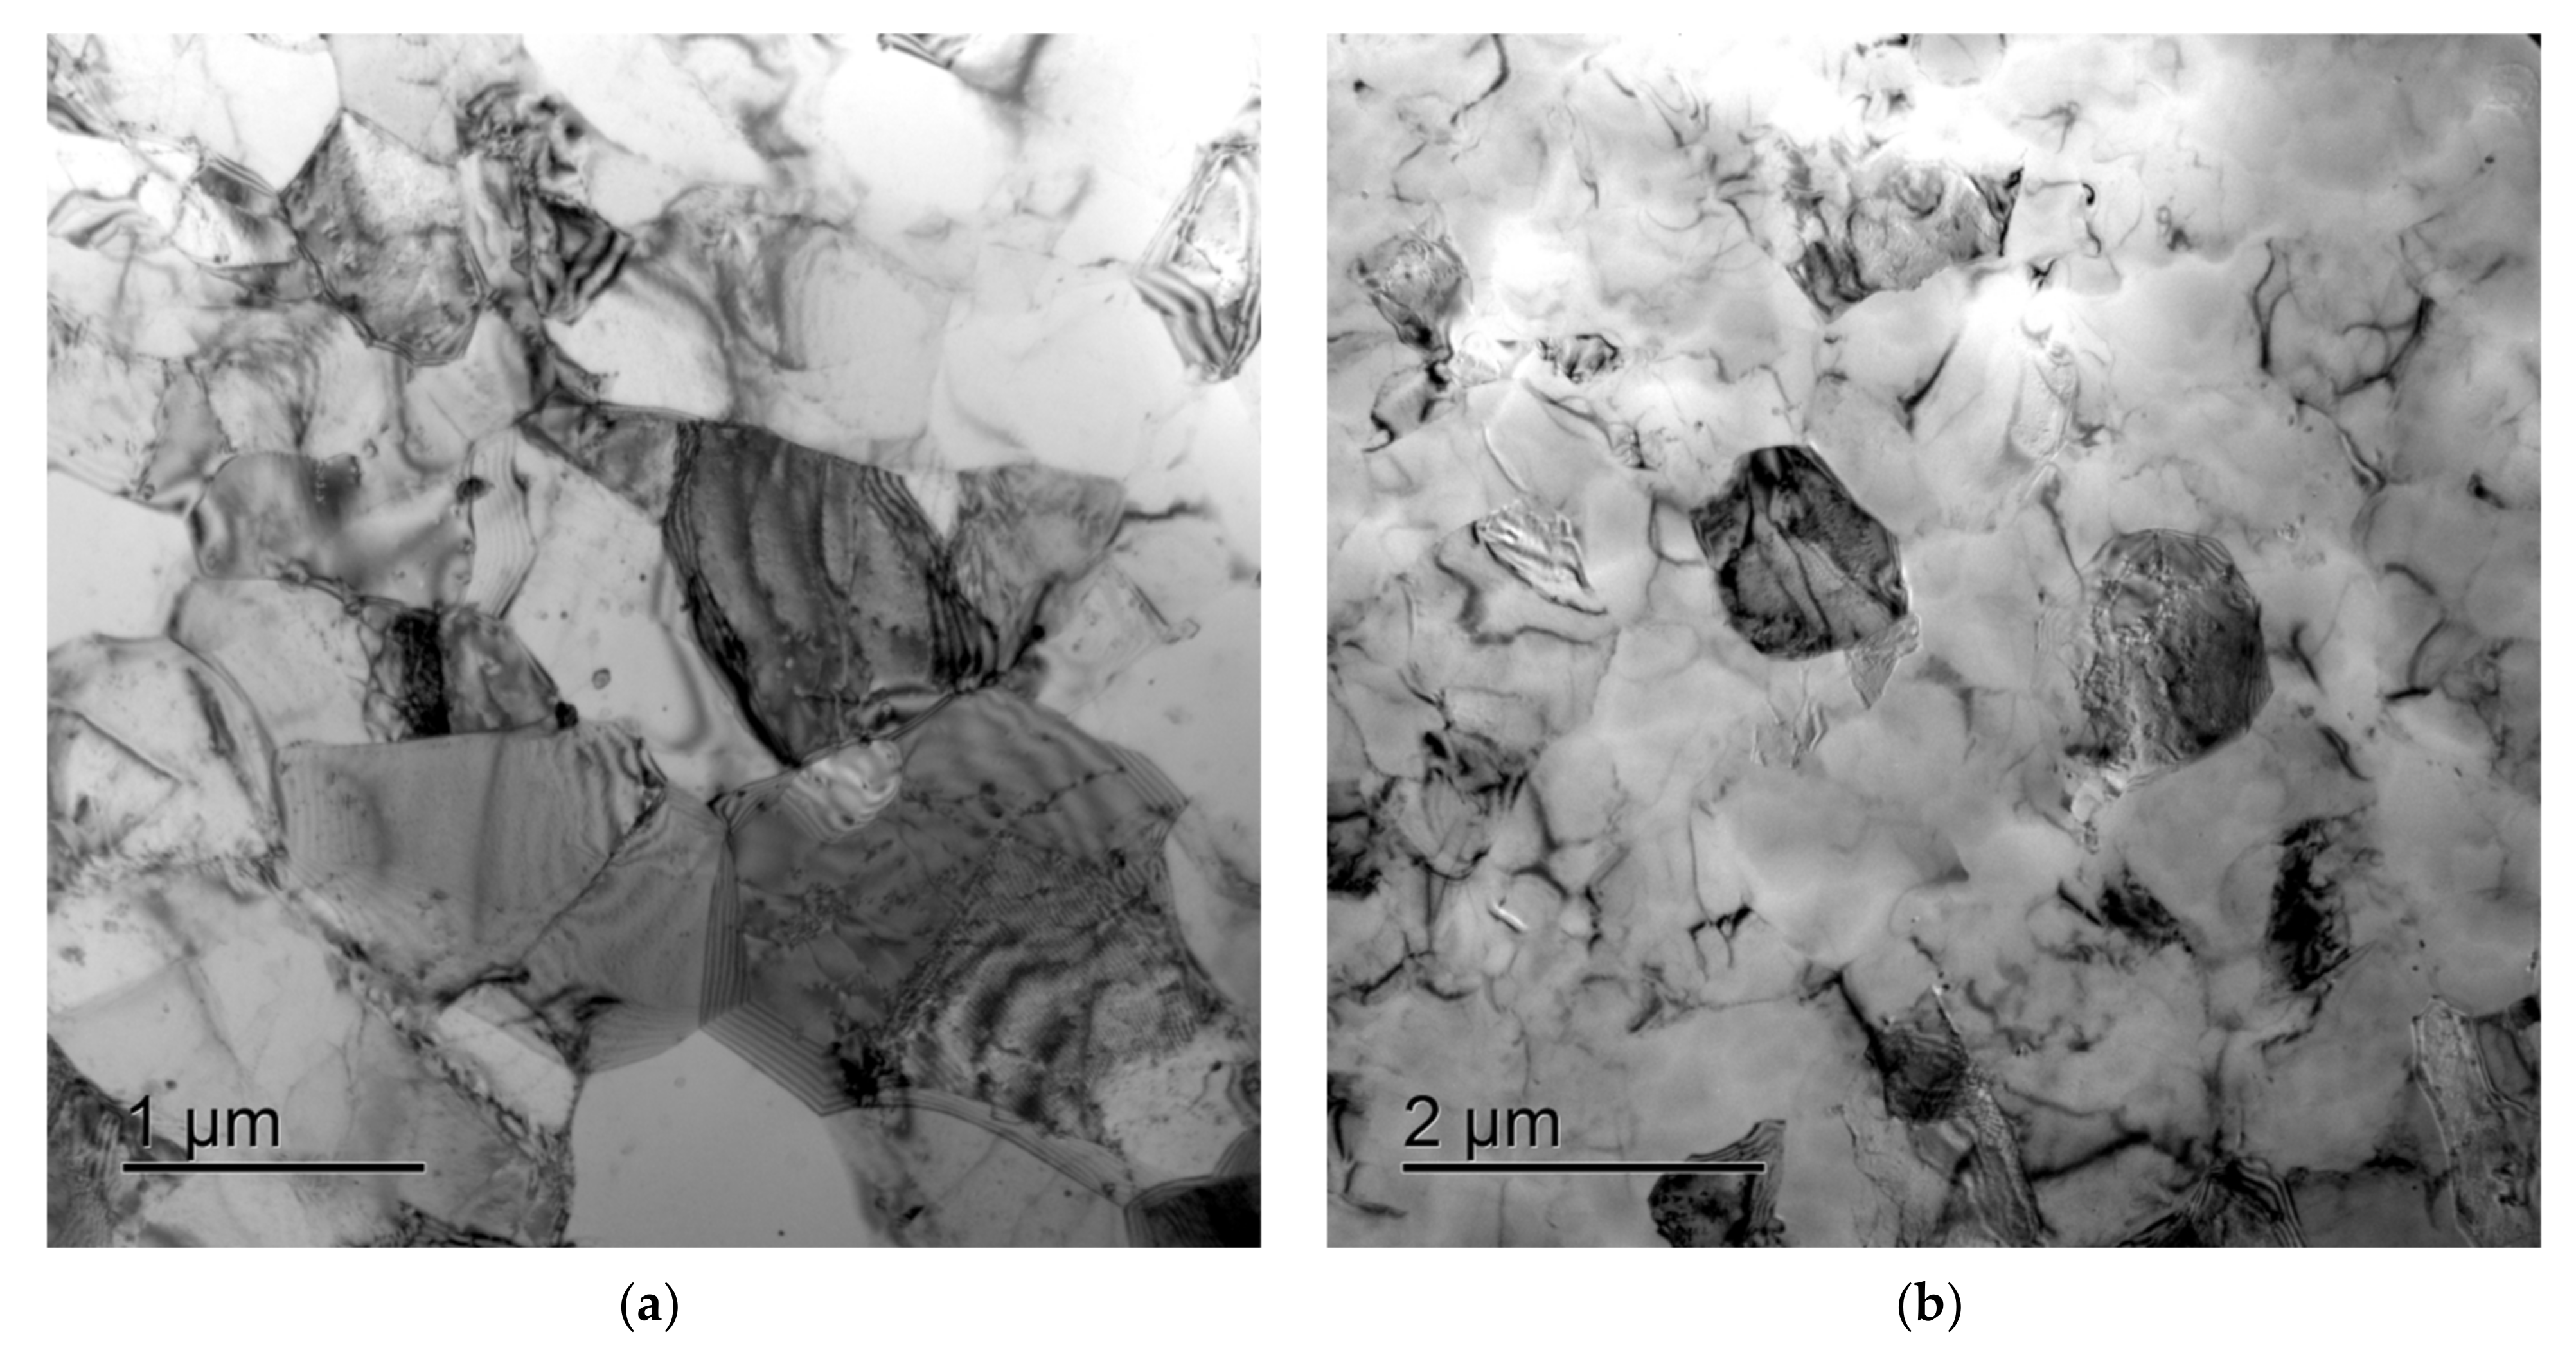
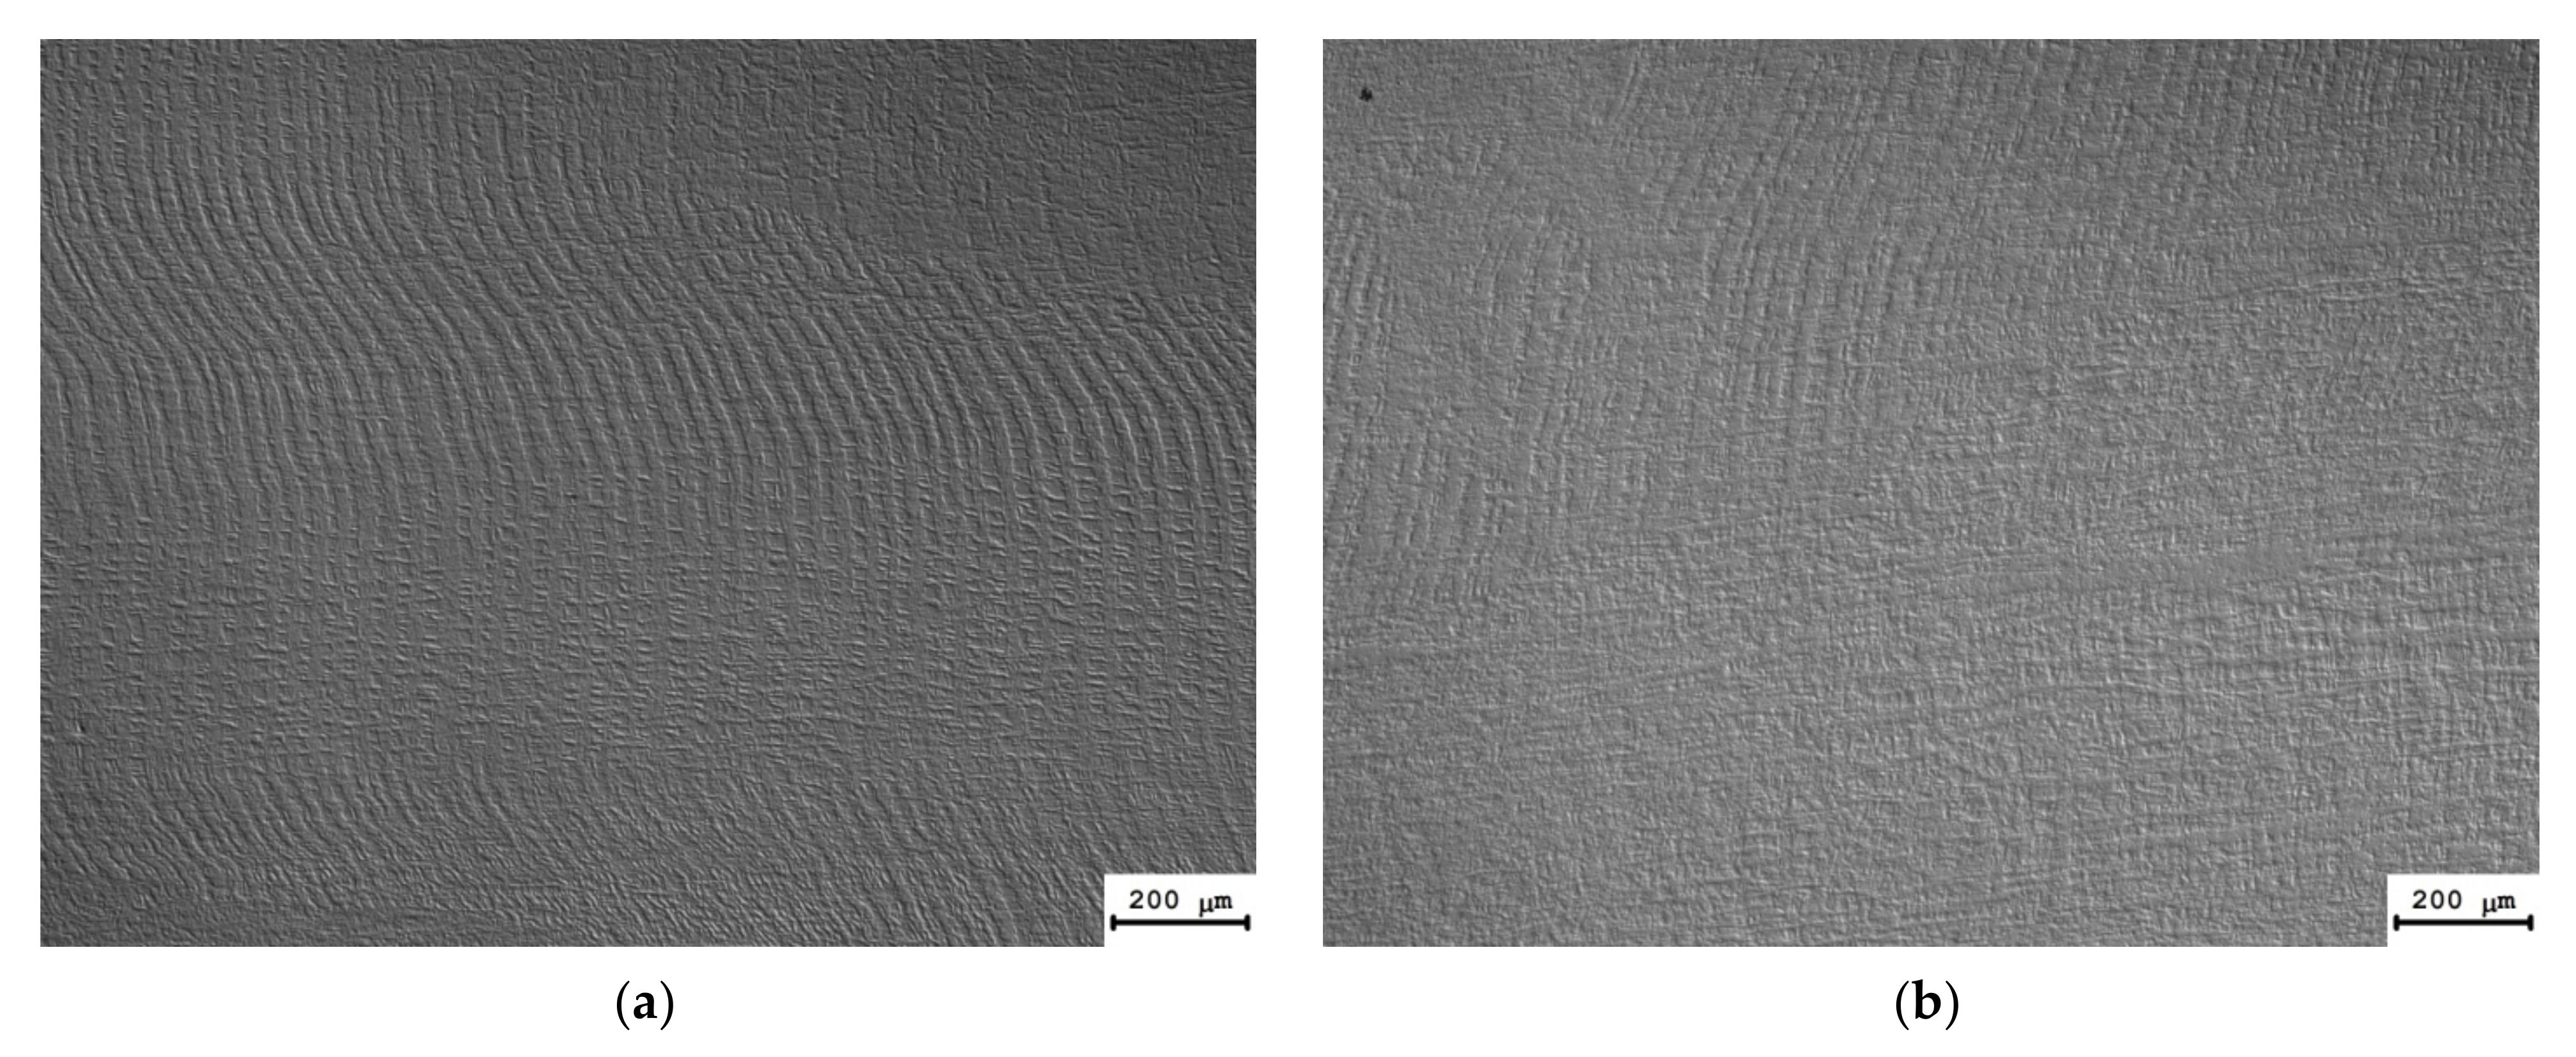
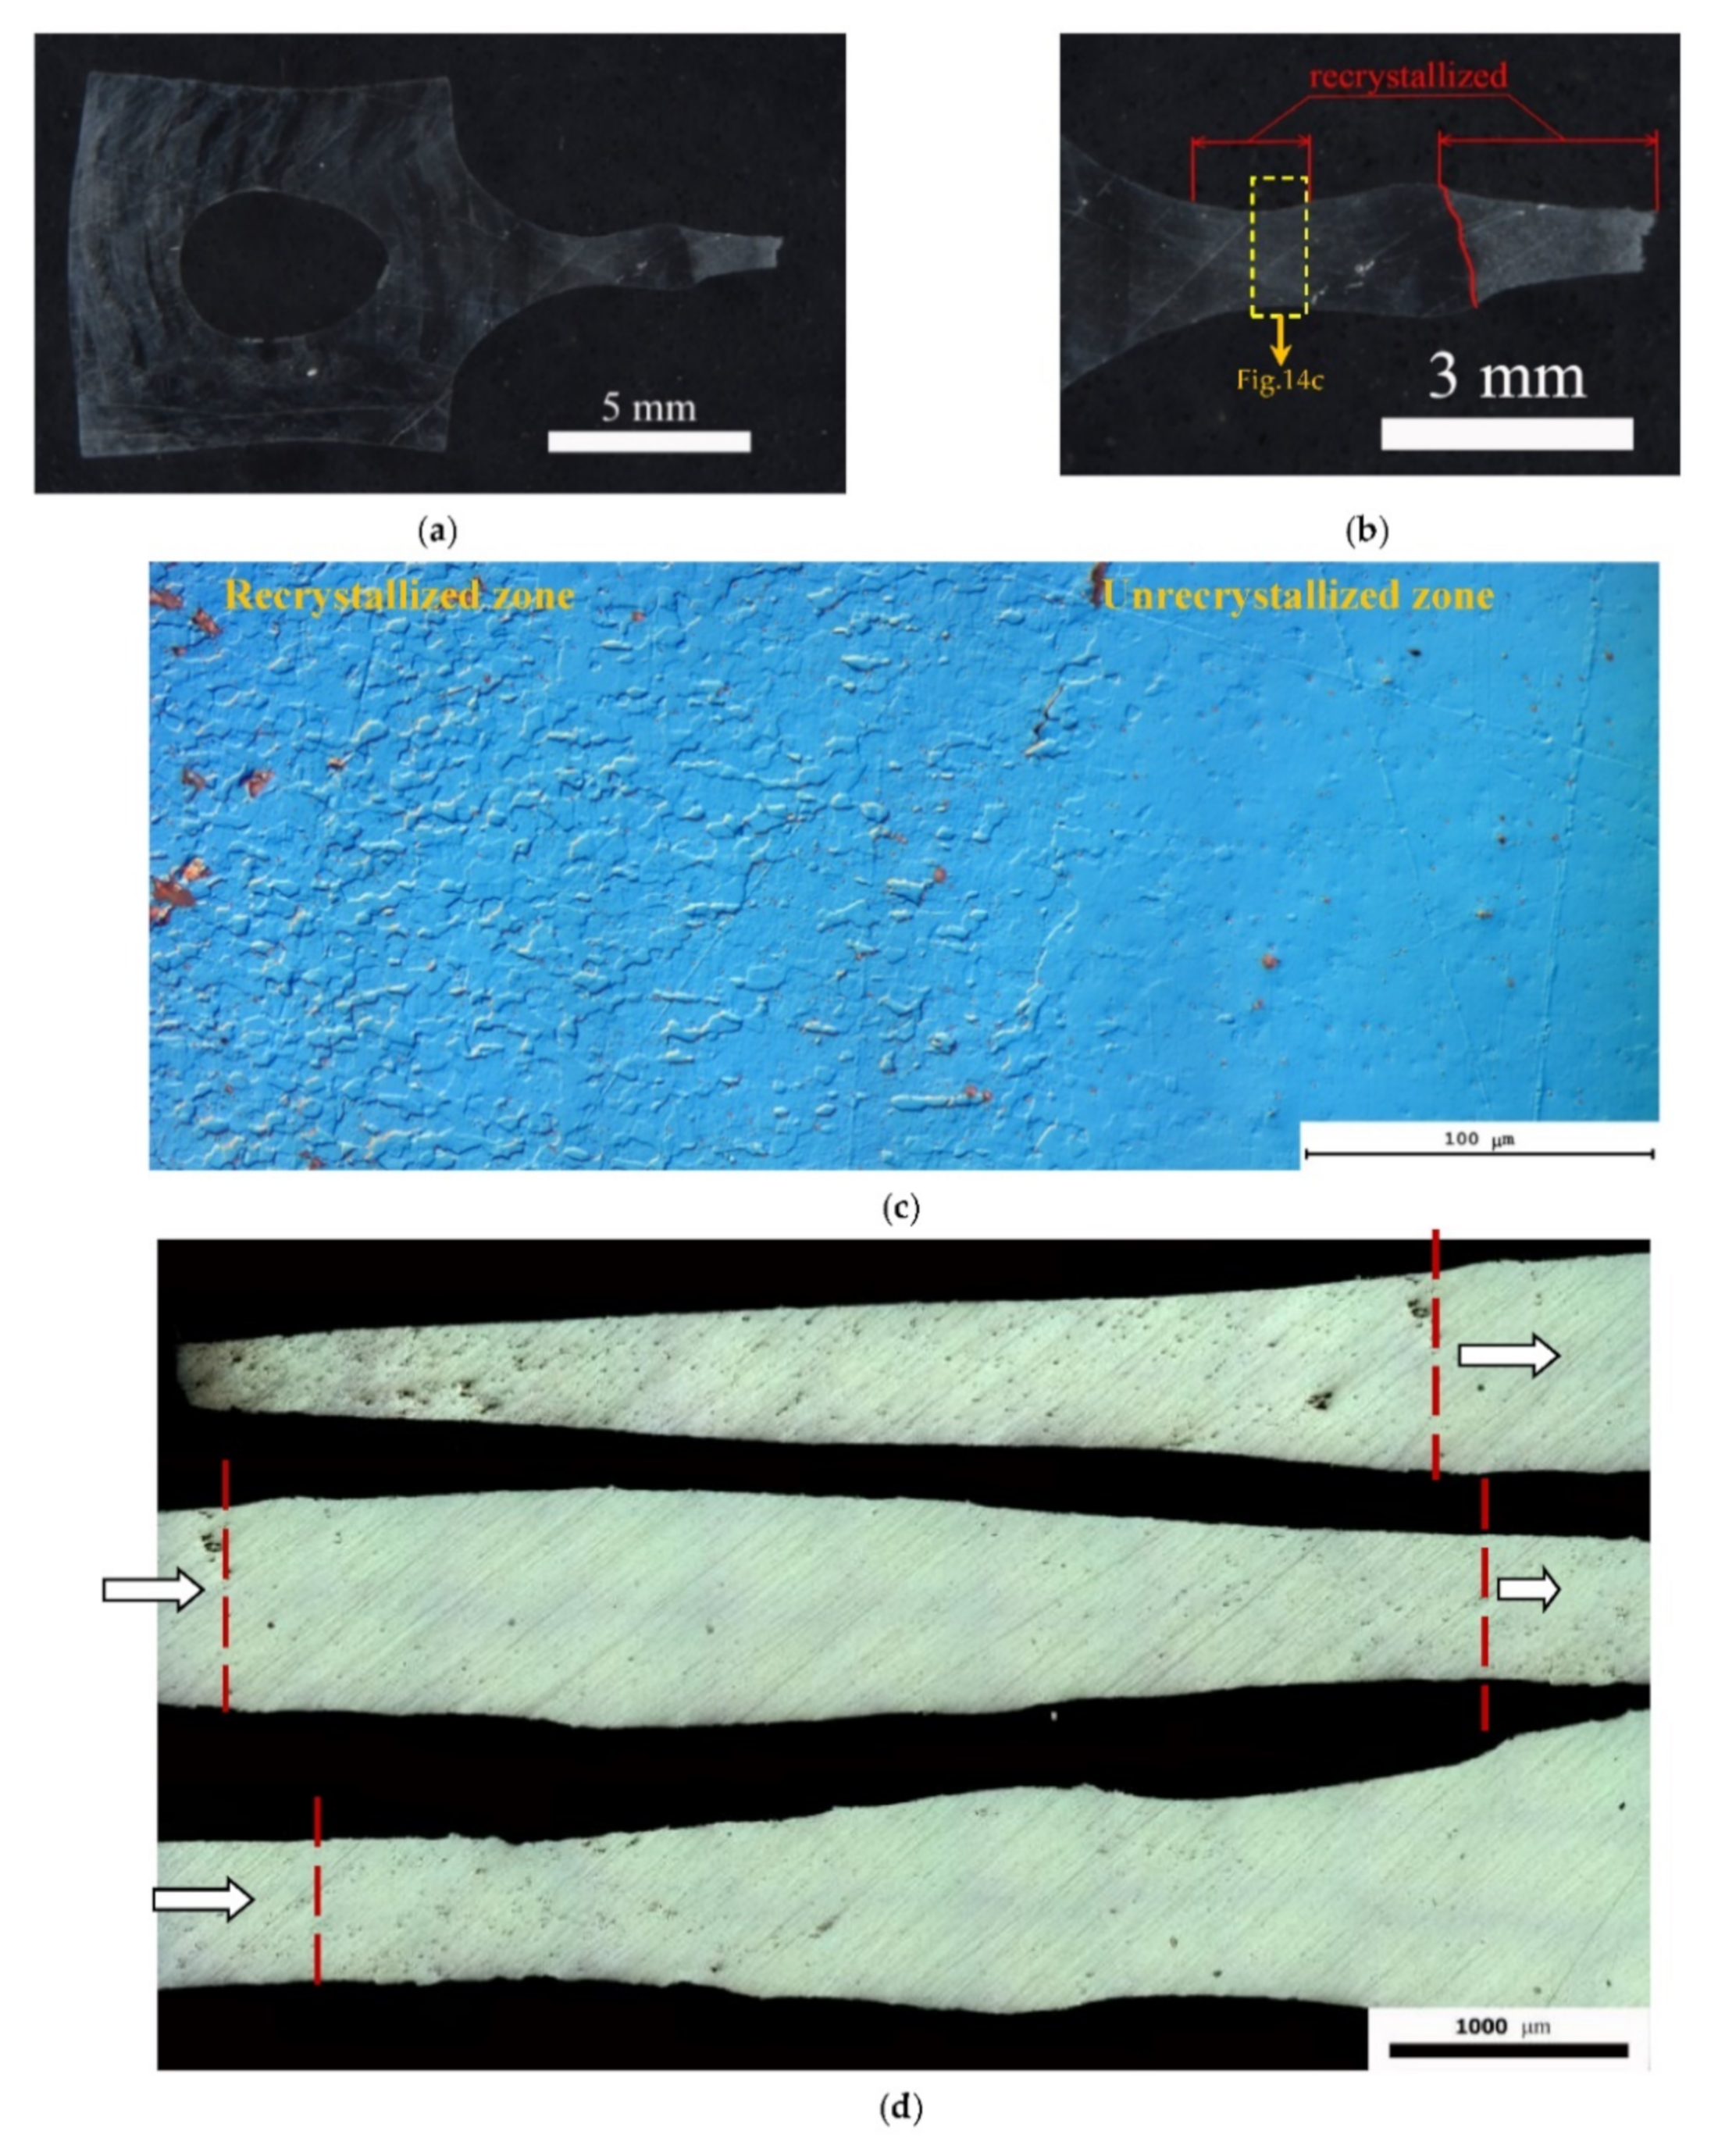
3.1. Microstructure Investigation
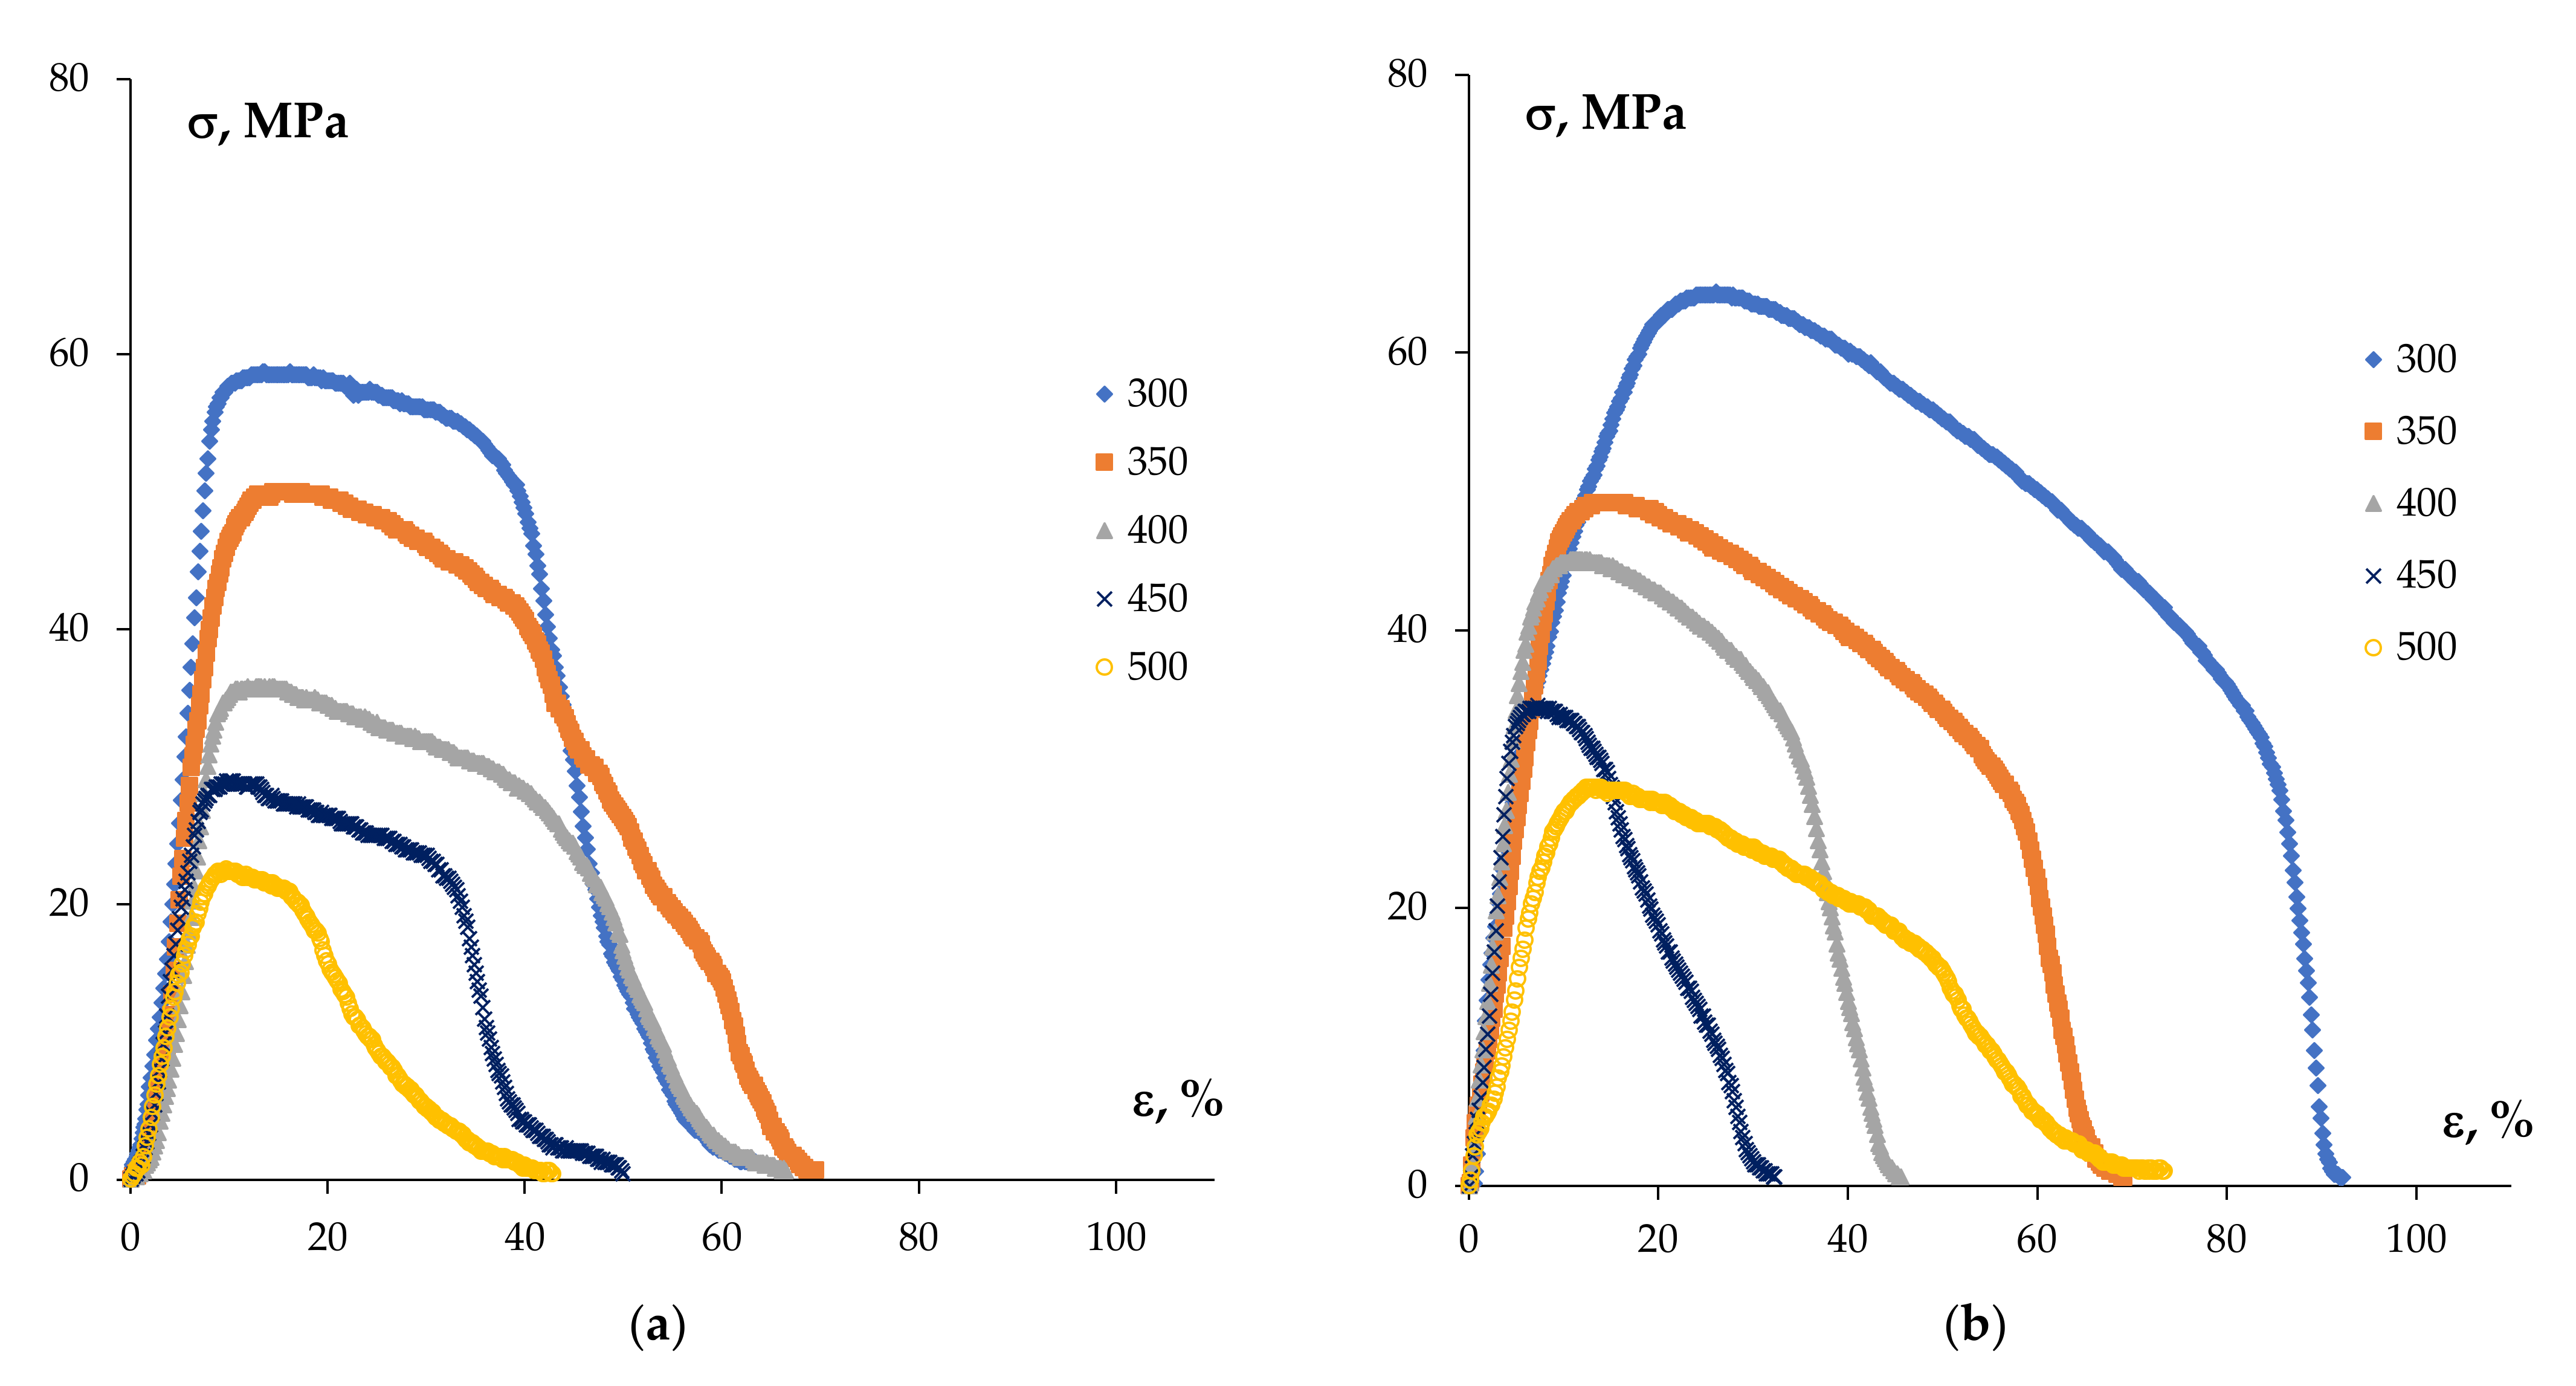
3.2. Superplasticity Testing
3.2.1. Cast Alloys
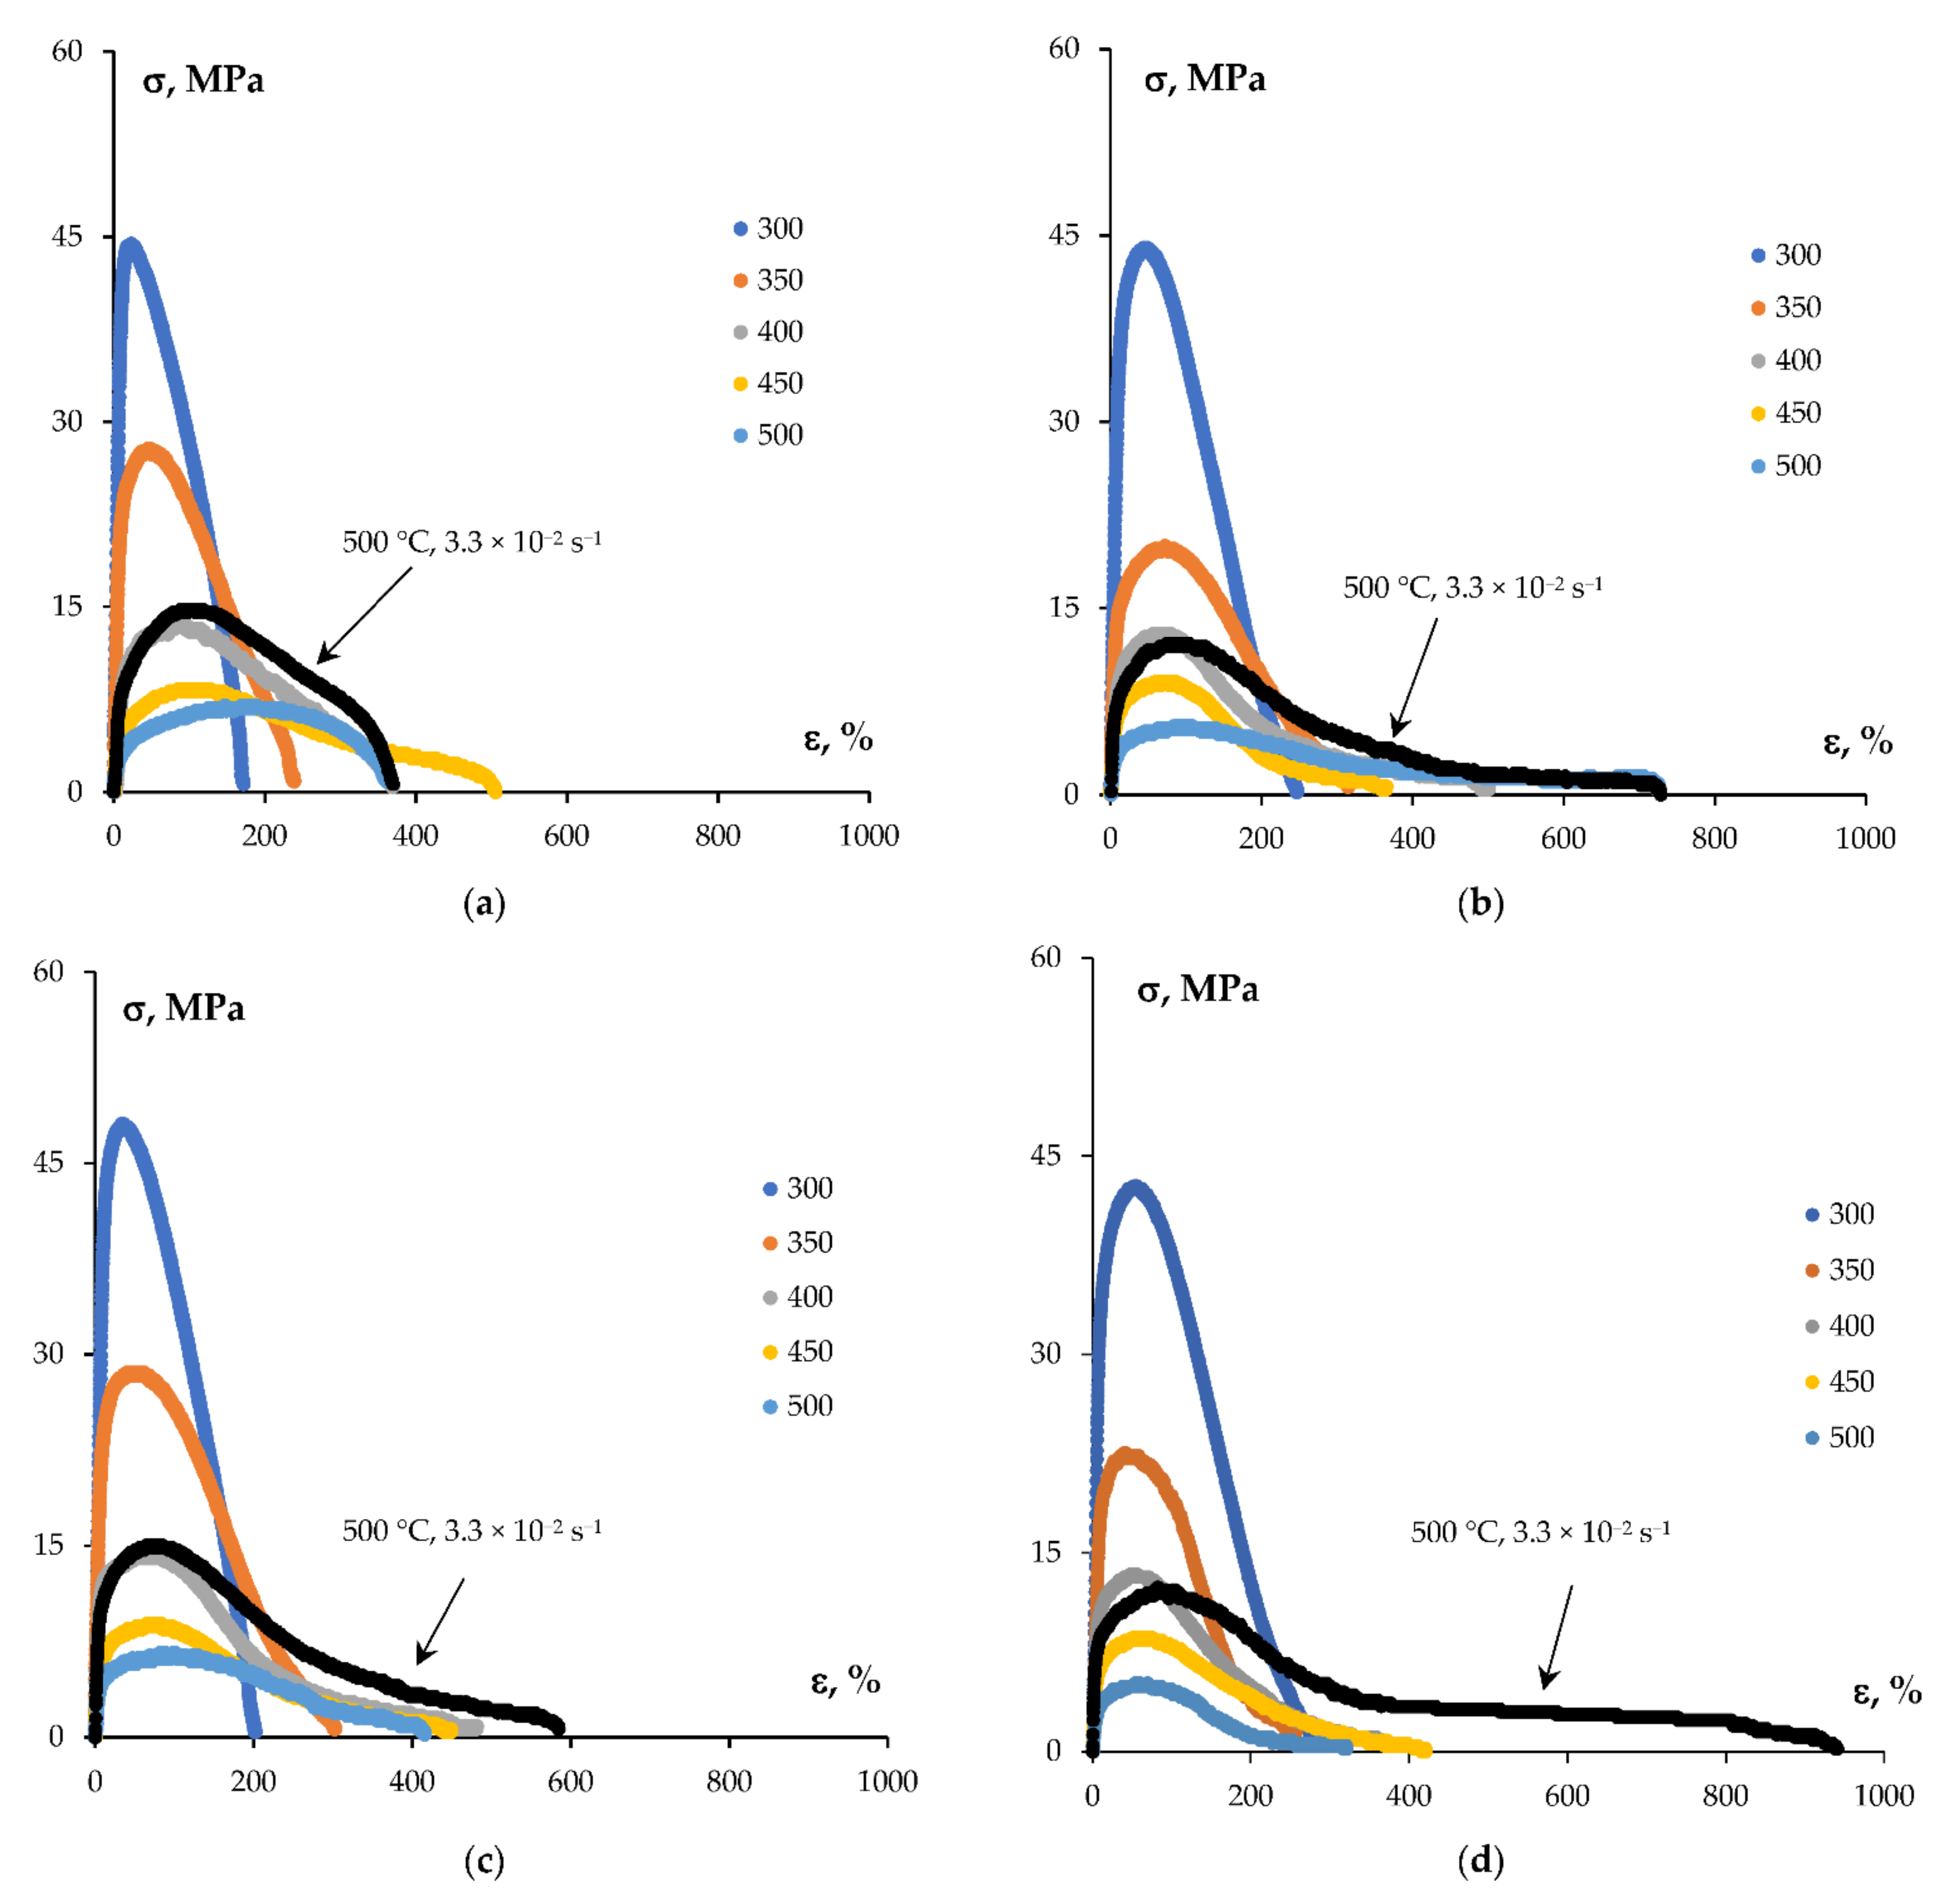
3.2.2. UFG Alloys
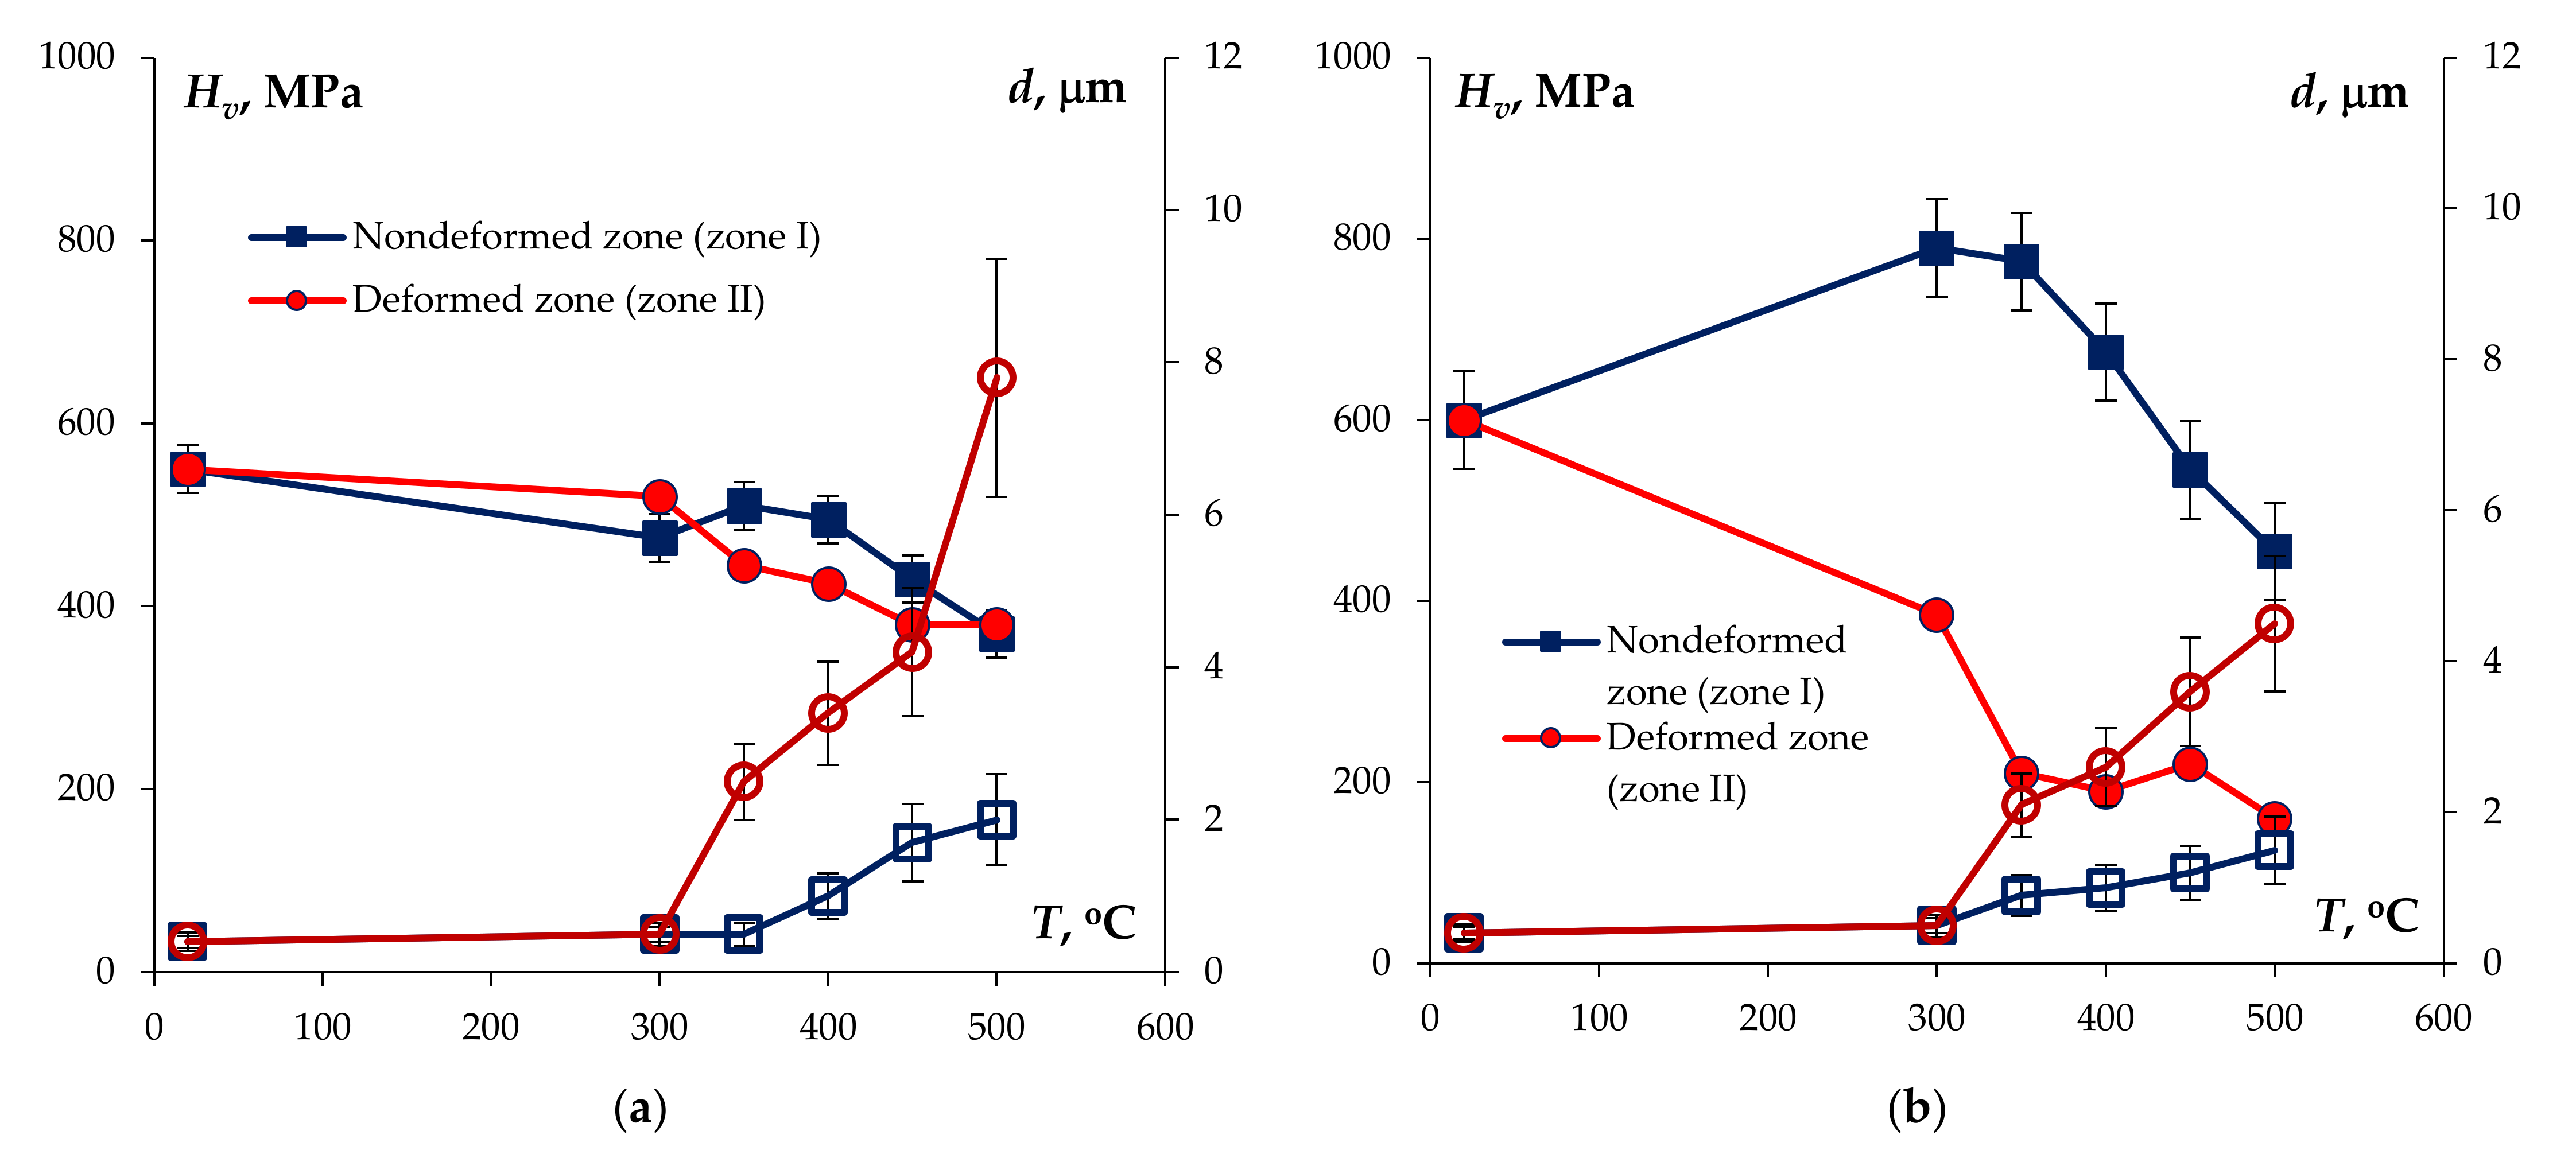
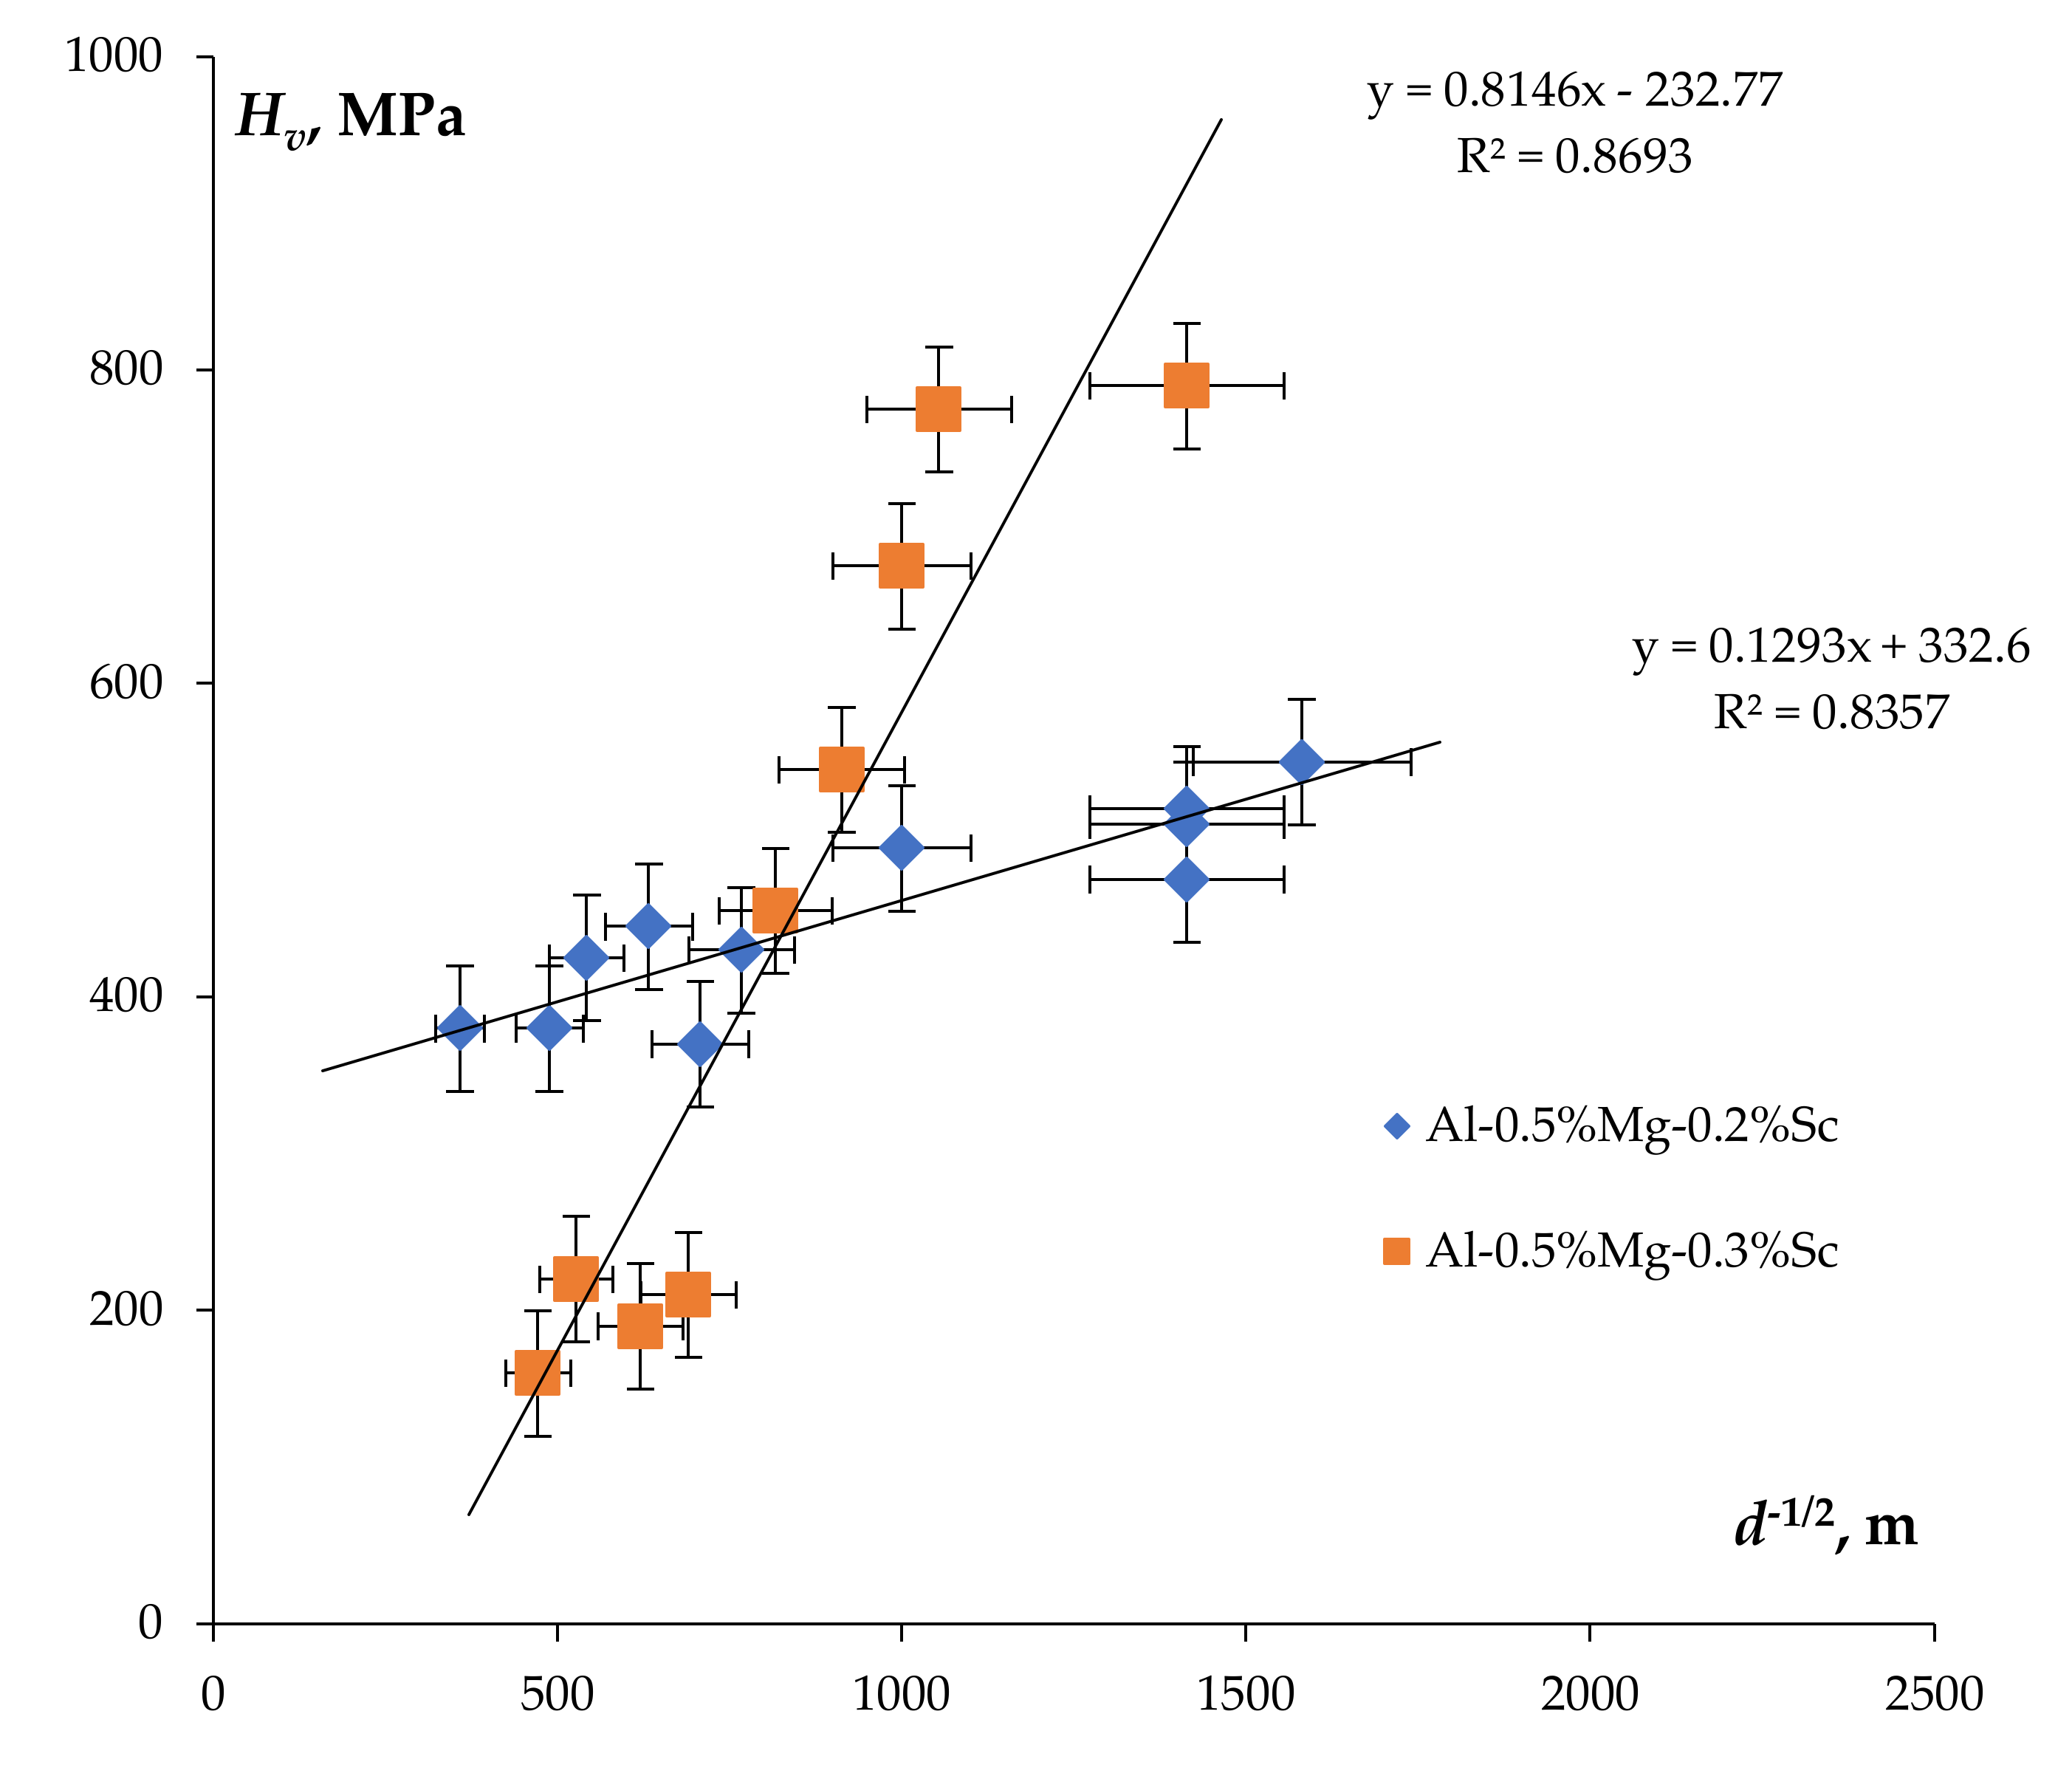
3.3. Dynamic Grain Growth
4. Discussion
5. Conclusions
- The superplasticity of the cast and ultrafine-grained (UFG) Al-0.5%Mg-Sc alloys with the Sc contents from 0.2 to 0.5 wt.% has been studied. The cast structure in the alloys was formed by induction casting without application of subsequent homogenization. The UFG structure was formed by ECAP. The stabilization of the nonequilibrium UFG structure was provided by preliminary annealing at 300 °C that did not exceed the recrystallization temperature in the investigated alloys. In the course of preliminary annealing, the Al3Sc particles of two types, nucleated–coherent Al3Sc nanoparticles inside the grains and relatively large (50–200 nm) elongated fan-shaped Al3Sc particles formed via the discontinuous decay mechanism.
- The UFG alloys have good superplastic characteristics–in the annealed UFG Al-0.5%Mg-0.5%Sc alloy, the relative elongation to failure reached 900% (test temperature 500 °C, strain rate 3.3 × 10⁻² s−1). The magnitude of strain rate sensitivity coefficient m was 0.4–0.47. At reduced test temperatures (300–350 °C) not exceeding the recrystallization temperature, the elongation to failure in the annealed UFG alloys varied from 170% to 320%.
- The values of the elongation to failure for the annealed UFG Al-0.5%Mg-Sc alloys are comparable to the ones for the non-annealed alloys tested in the same temperature and rate strain conditions. The close values of elongation in the UFG alloys with different grain sizes are caused likely by the following factors:
- (a)
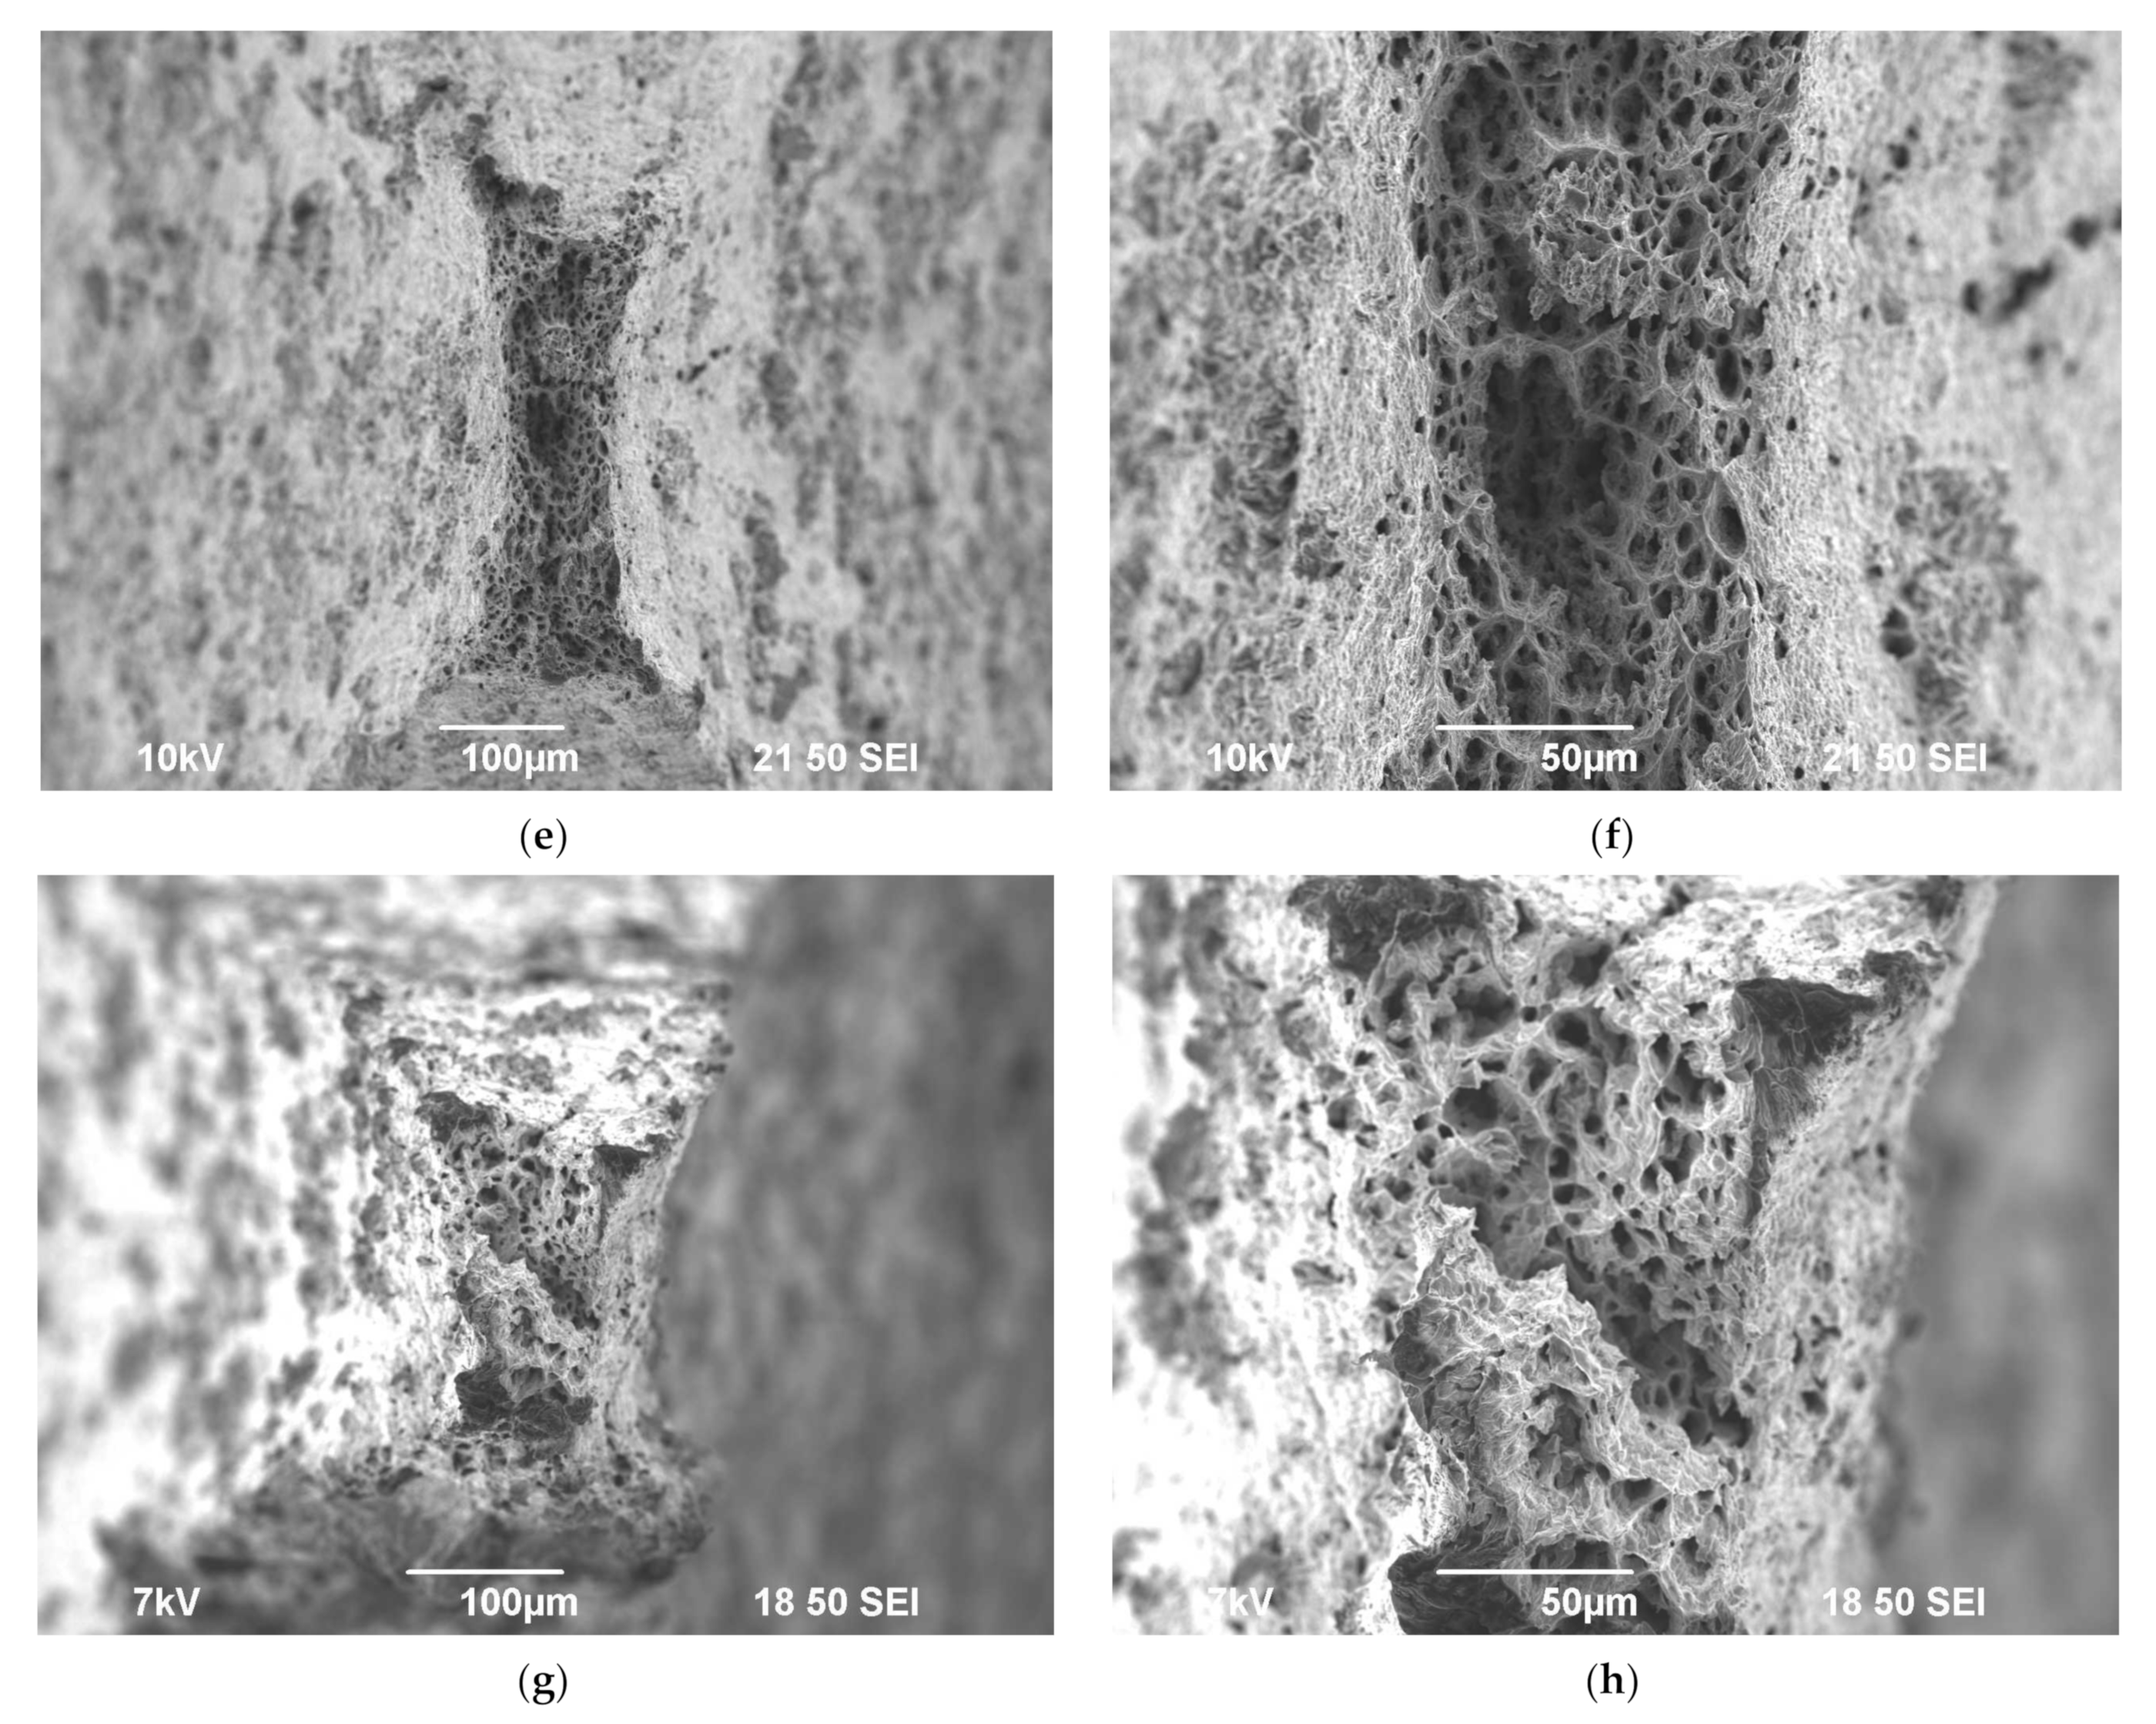
- The formation of pores at large Al3Sc particles forming via the discontinuous decay mechanism during preliminary low-temperature annealing. The generation and growth of the pores at the large Al3Sc particles leads to accelerated cavitation destruction of the UFG Al-0.5%Mg-Sc alloys.
- (b)
- Nonuniformity of the plastic deformation at the macroscopic level and the formation of the macro-neckings of the localized plastic deformation. The low-temperature annealing leads to the increase of the macro-localization scale during the superplastic deformation of the UFG Al-0.5%Mg-Sc alloys.
- (c)
- Accelerated dynamic grain growth, the kinetics of which is determined by the mobility of the orientation mismatch dislocations in the non-equilibrium grain boundaries in the UFG alloys.
Author Contributions
Funding
Institutional Review Board Statement
Informed Consent Statement
Data Availability Statement
Acknowledgments
Conflicts of Interest
References
- Matveev, Y.A.; Gavrilova, V.P.; Baranov, V.V. Light conducting materials for aircraft wires. Cables Wires 2006, 5, 22–23. (In Russian) [Google Scholar]
- Yang, C.; Masquellier, N.; Gandiolle, C.; Sauvage, X. Multifunctional properties of composition graded Al wires. Scr. Mater. 2020, 189, 21–24. [Google Scholar] [CrossRef]
- Moisy, F.; Gueydan, A.; Sauvage, X.; Keller, C.; Guillet, A.; Nguyen, N.; Martinez, M.; Hug, E. Elaboration of architectured copper clad aluminum composites by a multi-step drawing process. Mater. Sci. Forum 2018, 941, 1914–1919. [Google Scholar] [CrossRef]
- Røyset, J.; Ryum, N. Kinetics and mechanisms of precipitation in an Al-0.2wt.%Sc alloy. Mater. Sci. Eng. A 2005, 396, 409–422. [Google Scholar] [CrossRef]
- Latynina, T.A.; Mavlyutov, A.M.; Valiev, R.Z.; Murashkin, M.Y.; Orlova, T.S. The effect of hardening by annealing in ultrafine-grained Al-0.4Zr alloy: Influence of Zr microadditives. Philos. Mag. 2019, 99, 2424–2443. [Google Scholar] [CrossRef]
- Pozdnyakov, A.V.; Barkov, R.Y. Microstructure and mechanical properties of novel Al-Y-Sc alloys with high thermal stability and electrical conductivity. J. Mater. Sci. Technol. 2020, 36, 1–6. [Google Scholar] [CrossRef]
- Barkov, R.Y.; Mikhaylovskaya, A.V.; Yakovtseva, O.A.; Loginova, I.S.; Prosviryakov, A.S.; Pozdniakov, A.V. Effect of thermomechanical treatment on the microstructure, precipitation strengthening, internal friction, and thermal stability of Al-Er-Yb-Sc alloys with good electrical conductivity. J. Alloys Compd. 2021, 855, 157367. [Google Scholar] [CrossRef]
- Belov, N.; Korotkova, N.; Akopyan, T.; Murashkin, M.; Timofeev, V. Structure and properties of Al-0.6wt.%Zr wire alloy manufactured by direct drawing of electromagnetically cast wire rod. Metals 2020, 10, 769. [Google Scholar] [CrossRef]
- Pozdnyakov, A.V.; Barkov, R.Y.; Prosviryakov, A.S.; Churyumov, A.Y.; Golovin, I.S.; Zolotorevskiy, V.S. Effect of Zr on the microstructure, recrystallization behavior, mechanical properties and electrical conductivity of the novel Al-Er-Y alloy. J. Alloys Compd. 2018, 765, 1–6. [Google Scholar] [CrossRef]
- Pozdnyakov, A.V.; Osipenkova, A.A.; Popov, D.A.; Makhov, S.V.; Napalkov, V.I. Effect of low additions of Y, Sm, Gd, Hf and Er on the structure and hardness of alloy Al-0.2%Zr-0.1%Sc. Met. Sci. Heat Treat. 2017, 58, 537–542. [Google Scholar] [CrossRef]
- Barkov, R.Y.; Yakovtseva, O.A.; Mamzurina, O.I.; Loginova, I.S.; Medvedeva, S.V.; Prosviryakov, A.S.; Mikhaylovskaya, A.V.; Pozdniakov, A.V. Effect of Yb on the structure and properties of an electroconductive Al-Y-Sc alloy. Phys. Met. Metallogr. 2020, 121, 604–609. [Google Scholar] [CrossRef]
- Nokhrin, A.; Shadrina, I.; Chuvil’deev, V.; Kopylov, V. Study of structure and mechanical properties of fine-grained aluminum alloys Al-0.6wt.%Mg-Zr-Sc with ratio Zr:Sc = 1.5 obtained by cold drawing. Materials 2019, 12, 316. [Google Scholar] [CrossRef] [Green Version]
- Toropova, L.S.; Eskin, D.G.; Kharakterova, M.L.; Dobatkina, T.V. Advanced Aluminum Alloys Containing Scandium; Taylor and Francis: London, UK, 2017. [Google Scholar]
- Røyset, J.; Ryum, N. Scandium in aluminum alloys. Int. Mater. Rev. 2005, 50, 19–44. [Google Scholar] [CrossRef]
- Filatov, Y.A.; Elagin, V.I.; Zakharov, V.V. New Al-Mg-Sc alloys. Mater. Sci. Eng. A 2000, 280, 97–101. [Google Scholar] [CrossRef]
- Davydov, V.G.; Rostova, T.D.; Zakharov, V.V.; Filatov, Y.A.; Yelagin, V.I. Scientific principles of making an alloying of scandium to aluminium alloys. Mater. Sci. Eng. A 2000, 280, 30–36. [Google Scholar] [CrossRef]
- Eskin, D.G. Sc applications in aluminum alloys: Overview of Russian research in the 20th century. Miner. Met. Mater. Ser. 2018, F4, 1565–1572. [Google Scholar] [CrossRef] [Green Version]
- Eskin, D.G. The scandium story—Part II: Impact on aluminum alloys and their applications. Light Met. Age 2020, 78, 40–44. [Google Scholar]
- Buranova, Y.; Kulitskiy, V.; Peterlechner, M.; Mogucheva, A.; Kaibyshev, R.; Divinski, S.V.; Wilde, G. Al3(Sc,Zr)-based precipitates in Al-Mg alloy: Effect of severe deformation. Acta Mater. 2017, 124, 210–224. [Google Scholar] [CrossRef]
- Mochugovskiy, A.G.; Tabachkova, N.Y.; Ghayoumabadi, M.E.; Cheverkin, V.V.; Mikhaylovskaya, A.V. Joint effect of quasicrystalline icosahedral and L12-strcutured phases precipitation on the grain structure and mechanical properties of aluminum based alloys. J. Mater. Sci. Technol. 2021, 87, 196–206. [Google Scholar] [CrossRef]
- Ocenasek, V.; Slamova, M. Resistance to recrystallization due to Sc and Zr addition to Al-Mg alloys. Mater. Charact. 2001, 47, 157–162. [Google Scholar] [CrossRef]
- Jones, M.J.; Humphreys, F.J. Interactions of recrystallization and precipitation: The effect of Al3Sc on the recrystallization behaviour of deformed aluminium. Acta Mater. 2003, 51, 2149–2159. [Google Scholar] [CrossRef]
- Riddle, Y.W.; Sanders, T.H., Jr. A study of coarsening, recrystallization, and morphology of microstructure in Al-Sc-(Zr)-(Mg) alloys. Metall. Mater. Trans. A Phys. Metall. Mater. Sci. 2004, 35, 341–350. [Google Scholar] [CrossRef]
- Komura, S.; Berbon, P.B.; Furukawa, M.; Horita, Z.; Nemoto, M.; Langdon, T.G. High strain rate superplasticity in an Al-Mg alloy containing scandium. Scr. Mater. 1998, 38, 1851–1856. [Google Scholar] [CrossRef]
- Musin, F.; Kaibyshev, R.; Motohashi, Y.; Itoh, G. High strain rate superplasticity in a commercial Al-Mg-Sc alloy. Scr. Mater. 2004, 50, 511–516. [Google Scholar] [CrossRef]
- Lee, S.; Utsunomiya, A.; Akamatsu, H.; Neishi, K.; Furukawa, M.; Horita, Z.; Langdon, T.G. Influence of scandium and zirconium on grain stability and superplastic ductilities in ultrafine-grained Al-Mg alloys. Acta Mater. 2002, 50, 553–564. [Google Scholar] [CrossRef]
- Komura, S.; Horita, Z.; Furukawa, M.; Nemoto, M.; Langdon, T.G. Influence of scandium on superplastic ductilities in an Al-Mg-Sc alloy. J. Mater. Res. 2000, 15, 2571–2576. [Google Scholar] [CrossRef]
- Mikhaylovskaya, A.V.; Yakovtseva, O.A.; Cheverkin, V.V.; Kotov, A.D.; Portnoy, V.K. Superplastic behaviour of Al-Mg-Zn-Zr-Sc-based alloys at high strain rates. Mater. Sci. Eng. A 2016, 659, 225–233. [Google Scholar] [CrossRef]
- Perevezentsev, V.N.; Chuvil’deev, V.N.; Kopylov, V.I.; Sysoev, A.N.; Langdon, T.G. High-strain-rate superplasticity of Al-Mg-Sc-Zr alloys. Russ. Metall. Met. 2004, 2004, 28–35. (In Russian) [Google Scholar]
- Chuvil’deev, V.N.; Gryaznov, M.Y.; Shotin, S.V.; Kopylov, V.I.; Nokhrin, A.V.; Likhnitskii, C.V.; Chegurov, M.K.; Bobrov, A.A.; Tabachkova, N.Y.; Pirozhnikova, O.E. Investigation of superplasticity and dynamic grain growth in ultrafine-grained Al-0.5%Mg-Sc alloys. J. Alloys Compd. 2021, 877, 160099. [Google Scholar] [CrossRef]
- Bobruk, E.A.; Safargalina, Z.A.; Golubev, O.V.; Baykov, D.; Kazykhanov, V.U. The effect of ultrafine-grained states on superplastic behavior of Al-Mg-Si alloy. Mater. Lett. 2019, 255, 126503. [Google Scholar] [CrossRef]
- Kim, W.J.; Kim, J.K.; Park, T.Y.; Hong, S.I.; Kim, D.I.; Kim, Y.S.; Lee, J.D. Enhancement of strength and superplasticity in a 6061 Al alloy processed by equal-channel-angular-pressing. Metall. Mater. Trans. A 2002, 33, 3155–3164. [Google Scholar] [CrossRef]
- Khamei, A.A.; Dehghani, K. Effects of strain rate and temperature on hot tensile deformation of severe plastic deformed 6061 aluminum alloy. Mater. Sci. Eng. A 2015, 627, 1–9. [Google Scholar] [CrossRef]
- Katsas, S.; Dashwood, R.; Grimes, R.; Jackson, M.; Todd, G.; Henein, H. Dynamic recrystallization and superplasticity in pure aluminum with zirconium addition. Mater. Sci. Eng. A 2007, 444, 291–297. [Google Scholar] [CrossRef]
- Malopheyev, S.; Kulitskiy, V.; Kaibyshev, R. Deformation structure and strengthening mechanisms in an Al-Mg-Sc-Zr alloy. J. Alloys Compd. 2017, 698, 957–966. [Google Scholar] [CrossRef]
- Vinogradov, A. Fatigue limit and crack growth in ultra-fine grain metals produced by severe plastic deformation. J. Mater. Sci. 2007, 42, 1797–1808. [Google Scholar] [CrossRef]
- Vinogradov, A.; Washikita, A.; Kitagawa, K.; Kopylov, V.I. Fatigue life of fine-grained Al-Mg-Sc alloys produced by Equal-Channel Angular Pressing. Mater. Sci. Eng. A 2003, 349, 318–326. [Google Scholar] [CrossRef]
- Chuvil’deev, V.N.; Shadrina, Y.S.; Nokhrin, A.V.; Kopylov, V.I.; Bobrov, A.A.; Gryaznov, M.Y.; Shotin, S.V.; Tabachkova, N.Y.; Chegurov, M.K.; Melekhin, N.V. An investigation of thermal stability of structure and mechanical properties of Al-0.5Mg-Sc ultrafine-grained aluminum alloys. J. Alloys Compd. 2020, 831, 154805. [Google Scholar] [CrossRef]
- Mikhaylovskaya, A.V.; Mochugovskiy, A.G.; Levchenko, V.S.; Tabachkova, N.Y.; Mufalo, W.; Portnoy, V.K. Precipitation behavior of L12 Al3Zr phase in Al-Mg-Zr alloy. Mater. Charact. 2018, 139, 30–37. [Google Scholar] [CrossRef]
- Mochugovskiy, A.G.; Mikhaylovskaya, A.V.; Zadorognyy, M.Y.; Golovin, I.S. Effect of heat treatment on the grain size control, superplasticity, internal friction, and mechanical properties of zirconium-bearing aluminum-based alloy. J. Alloys Compd. 2021, 856, 157455. [Google Scholar] [CrossRef]
- Mochugovskiy, A.G.; Mikhaylovskaya, A.V. Comparison of precipitation kinetics and mechanical properties in Zr and Sc-bearing aluminum-based alloys. Mater. Lett. 2020, 275, 128096. [Google Scholar] [CrossRef]
- Nes, E.; Ryun, N. On the formation of fan-shaped precipitates during the decomposition of a highly supersaturated Al-Zr alloy solid solution. Scr. Metall. 1971, 5, 987–989. [Google Scholar] [CrossRef]
- Mochugovskiy, A.G.; Mikhaylovskaya, A.V.; Tabachkova, N.Y.; Portnoy, V.K. The mechanism of L12 phase precipitation, microstructure and tensile properties of Al-Mg-Er-Zr alloy. Mater. Sci. Eng. A 2019, 744, 195–205. [Google Scholar] [CrossRef]
- Perevezentsev, V.N.; Rybin, V.V.; Chuvil’deev, V.N. The theory of structural superplasticity: IV. Cavitation during superplastic deformation. Acta Metall. Mater. 1992, 40, 915–923. [Google Scholar] [CrossRef]
- Rybin, V.V.; Perevezentsev, V.N.; Chuvil’deev, V.N. Pore nucleation at the precipitate-matrix interface under superplastic deformation. Surface 1986, 11, 130–139. (In Russian) [Google Scholar]
- Fellows, J.A.; Boyer, H.E. Metals Handbook. V. 9. Fractography and Atlas of Fractographs, 8th ed.; Boyer, H.E., Ed.; American Society for Metals: Metals Park, OH, USA, 1974. [Google Scholar]
- Nieh, T.G.; Wadsworth, J.; Sherby, O.D. Superplasticity in Metals and Ceramics; Cambridge University Press: Cambridge, UK, 1997. [Google Scholar]
- Novikov, I.I.; Portnoy, V.K. Superplasticity of Fine-Grained Alloys; Metallurgiya: Moscow, Russia, 1981. (In Russian) [Google Scholar]
- Perevezentsev, V.N.; Rybin, V.V.; Chuvil’deev, V.N. The theory of structural superplasticity: I. The physical nature of the superplasticity phenomenon. Acta Metall. Mater. 1992, 40, 887–894. [Google Scholar] [CrossRef]
- Safyari, M.; Moshtaghi, M.; Hojo, T.; Akiyama, E. Mechanisms of hydrogen embrittlement in high-strength aluminum alloys containing coherent and incoherent dispersoids. Corros. Sci. 2022, 194, 109895. [Google Scholar] [CrossRef]
- Teixeira, J.C.; Cram, D.G.; Bourgeois, L.; Bastow, T.J.; Hill, A.J.; Hutchinson, C.R. On the strengthening response of aluminum alloys containing shear-resistant plate-shaped precipitates. Acta Mater. 2008, 56, 6109–6122. [Google Scholar] [CrossRef]
- Krasilnikov, V.S.; Mayer, A.E. Dislocation dynamics in aluminum containing θ’ phase: Atomistic simulation and continuum modeling. Int. J. Plast. 2019, 119, 21–42. [Google Scholar] [CrossRef]
- Zuiko, I.; Kaibyshev, R. Deformation structures and strengthening mechanisms in an Al-Cu alloy subjected to extensive cold rolling. Mater. Sci. Eng. A 2017, 702, 53–64. [Google Scholar] [CrossRef]
- Fribourg, G.; Brechet, Y.; Deschamps, A.; Simar, A. Microstructure-based modeling of isotropic and kinematic strain hardening in a precipitation-hardening aluminum alloy. Acta Mater. 2011, 59, 3621–3635. [Google Scholar] [CrossRef]
- Chuvil’deev, V.N.; Nokhrin, A.V.; Smirnova, E.S.; Kopylov, V.I. Slid solution decomposition mechanisms in as-cast and microcrystalline Al-Sc alloys: IV. Effect of the decomposition of solid solution on the mechanical properties of the alloys. Russ. Metall. Met. 2013, 2013, 676–690. [Google Scholar] [CrossRef]
- Perevezentsev, V.N.; Rybin, V.V.; Chuvil’deev, V.N. The theory of structural superplasticity: III. Boundary migration and grain growth. Acta Metall. Mater. 1992, 40, 907–914. [Google Scholar] [CrossRef]
- Perevezentsev, V.N.; Pirozhnikova, O.E.; Chuvil’deev, V.N. Grain growth during superplastic deformation of microduplex alloys. Phys. Met. Metallogr. 1991, 71, 29–36. (In Russian) [Google Scholar]
- Segal, V.M.; Beyerlein, I.J.; Tome, C.N.; Chuvil’deev, V.N.; Kopylov, V.I. Fundamentals and Engineering of Severe Plastic Deformation; Nova Science Publishers: New York, NY, USA, 2010. [Google Scholar]


| T, °C | , s−1 | Sc Concentration in the Alloy, wt.% | |||||||||||
|---|---|---|---|---|---|---|---|---|---|---|---|---|---|
| 0.3% | 0.5% | ||||||||||||
| Initial State | Annealing 300 °C, 10 h | Annealing 300 °C, 300 h | Initial State | Annealing 300 °C, 10 h | Annealing 300 °C, 300 h | ||||||||
| σb, MPa | δ, % | σb, MPa | δ, % | σb, MPa | δ, % | σb, MPa | δ, % | σb, MPa | δ, % | σb, MPa | δ, % | ||
| 300 | 10−2 | 43 | 53 | 55 | 56 | 55 | 90 | 58 | 66 | 70 | 85 | 64 | 90 |
| 350 | 10−2 | 32 | 51 | 38 | 38 | 37 | 46 | 50 | 68 | 52 | 75 | 50 | 68 |
| 400 | 10−2 | 21 | 51 | 26 | 52 | 31 | 46 | 36 | 66 | 38 | 80 | 45 | 42 |
| 3.3 × 10⁻² | - | - | 40 | 90 | 40 | 52 | 46 | 76 | 52 | 100 | 54 | 87 | |
| 3.3 × 10⁻¹ | 43 | 69 | 54 | 90 | 46 | 85 | 63 | 77 | 70 | 115 | 70 | 110 | |
| 450 | 10−2 | 15 | 45 | 21 | 50 | 25 | 30 | 29 | 50 | 31 | 70 | 34 | 30 |
| 500 | 10−2 | 11 | 24 | 18 | 30 | 17 | 33 | 22 | 43 | 25 | 58 | 29 | 70 |
| 1.7 × 10⁻² | - | - | - | - | 22 | 60 | - | - | - | - | 33 | 90 | |
| 3.3 × 10⁻² | 18 | 46 | 22 | 50 | 24 | 53 | 26 | 55 | 29 | 55 | 33 | 50 | |
| 3.3 × 10⁻¹ | - | - | - | - | 28 | 70 | 36 | 80 | - | - | 40 | 75 | |
| T, °C | , s−1 | Sc Concentration in the Alloy, wt.% | |||||||||||||||
|---|---|---|---|---|---|---|---|---|---|---|---|---|---|---|---|---|---|
| 0.2% | 0.3% | 0.4% | 0.5% | ||||||||||||||
| Initial State [30] | Annealing 300 °C, 300 h | Initial State [30] | Annealing 300 °C, 1 h | Initial State [30] | Annealing 300 °C, 300 h | Initial State [30] | Annealing 300 °C, 1 h | ||||||||||
| σb, MPa | δ, % | σb, MPa | δ, % | σb, MPa | δ, % | σb, MPa | δ, % | σb, MPa | δ, % | σb, MPa | δ, % | σb, MPa | δ, % | σb, MPa | δ, % | ||
| 300 | 10−2 | 65 | 160 | 44 | 170 | 59 | 205 | 44 | 250 | 56 | 225 | 48 | 200 | 57 | 345 | 42 | 275 |
| 350 | 10−2 | 33 | 290 | 28 | 235 | 32 | 295 | 20 | 320 | 28 | 280 | 28 | 300 | 33 | 320 | 22 | 250 |
| 400 | 3.3 × 10⁻³ | 9 | 275 | - | - | 7 | 510 | - | - | 10 | 250 | - | - | 11 | 290 | - | - |
| 10−2 | 10 | 560 | 15 | 360 | 12 | 490 | 13 | 480 | 12 | 350 | 14 | 460 | 13 | 260 | 13 | 370 | |
| 3.3 × 10⁻² | 20 | 350 | 39 | 220 | 18 | 425 | 28 | 300 | 17 | 460 | 35 | 280 | 21 | 480 | 32 | 300 | |
| 10−1 | 24 | 290 | - | - | 20 | 360 | - | - | 23 | 320 | - | - | 23 | 680 | - | - | |
| 3.3 × 10⁻¹ | - | - | 65 | 130 | - | - | 62 | 220 | - | - | 60 | 150 | - | - | 62 | 130 | |
| 450 | 10−2 | 13 | 350 | 10 | 500 | 10 | 490 | 9 | 350 | 10 | 500 | 9 | 440 | 14 | 400 | 8 | 420 |
| 500 | 3.3 × 10⁻³ | 4 | 400 | - | - | 4 | 540 | - | - | 4 | 330 | - | - | 4 | 520 | - | |
| 10−2 | 8 | 265 | 7 | 360 | 5 | 820 | 5.5 | 700 | 4 | 530 | 6 | 420 | 5 | 670 | 5 | 320 | |
| 1.7 × 10⁻² | - | - | 12 | 330 | - | - | 9 | 440 | - | - | 9 | 380 | - | - | 9 | 500 | |
| 3.3 × 10⁻² | 9 | 350 | 15 | 370 | 6 | 625 | 12 | 720 | 8 | 840 | 15 | 580 | 7 | 750 | 12 | 900 | |
| 10−1 | 14 | 220 | - | - | 13 | 400 | - | - | 7 | 1060 | - | - | 9 | 1055 | - | - | |
| 3.3 × 10⁻¹ | - | - | 32 | 175 | - | - | 31 | 330 | 15 | 500 | 30 | 240 | - | - | 26 | 410 | |
| T, °C | , s−1 | Sc Concentration in the Alloy, wt.% | |||||||||||||||
|---|---|---|---|---|---|---|---|---|---|---|---|---|---|---|---|---|---|
| 0.2% | 0.3% | 0.4% | 0.5% | ||||||||||||||
| Initial State [30] | Annealing 300 °C, 300 h | Initial State [30] | Annealing 300 °C, 1 h | Initial State [30] | Annealing 300 °C, 300 h | Initial State [30] | Annealing 300 °C, 1 h | ||||||||||
| d1, μm 1 | d2, μm 1 | d1, μm (fR,%) | d2, μm (fR,%) | d1, μm | d2, μm | d1, μm (fR,%) | d2, μm (fR,%) | d1, μm | d2, μm | d1, μm (fR,%) | d2, μm (fR,%) | d1, μm | d2, μm | d1, μm (fR,%) | d2, μm (fR,%) | ||
| 20 | 10−2 | 0.4–0.5 | 0.5–0.8 | 0.4–0.5 | 0.5–0.7 | 0.4–0.5 | 0.5–0.7 | 0.4–0.5 | 0.5–0.7 | ||||||||
| 300 | 10−2 | 0.4–0.5 | 0.4–0.5 | 0.5–0.8 (<1) | 0.5–0.8 (<1) | 0.4–0.5 | 0.4–0.5 | 0.5–0.8 (0) | 2.3 (<1) | 0.4–0.5 | 1.5 | 0.5–0.7 (0) | 0.5–0.7 (<1) | 0.4–0.5 | 0.4–0.5 | 0.5–0.7 (0) | 0.5–0.7 (0) |
| 350 | 10−2 | 0.4–0.5 | 2.5 | 1.6 (<10) | 3.4 (55) | 0.4–0.5 | 2.1 | 0.5–0.8 (0) | 2.5 (35) | 0.4–0.5 | 2.0 | 0.5–0.7 (0) | 1.9 (45) | 0.4–0.5 | 1.9 | 0.5–0.7 (0) | 1–1.5 (<10) |
| 400 | 3.3 × 10⁻³ | 1.5 | 4.8 | - | - | 1.3 | 3.3 | - | - | 1.2 | 3.1 | - | - | 1.2 | 3.1 | - | - |
| 10−2 | 1.3 | 4.1 | - | - | 1.2 | 2.9 | - | - | 1–1.2 | 2.9 | - | - | 1–1.2 | 2.6 | 0.9 (<1) | 1.7–1.9 (<10) | |
| 3.3 × 10⁻² | 0.8–1.2 | 3.4 | 1.9 (<10) | 3.6 (60) | 0.8–1 | 2.7 | 0.6–0.8 (0) | 2.7 (45) | 0.5 | 2.2 | 0.5–0.7 (0) | 2.4 (20) | 0.5 | 2.2 | 0.5–0.7 (0) | 1.5 (<10) | |
| 10−1 | 0.7 | 2.8 | 1.7 (<10) | 2.3 (15) | 0.5 | 2.6 | 0.6–0.8 (0) | 2.6 (20) | 0.5 | 2.1 | 0.5–0.7 (0) | 2.2 (20) | 0.5 | 2.1 | 0.5–0.7 (0) | 1–1.5 (<10) | |
| 3.3 × 10⁻¹ | - | - | - | - | - | - | - | - | - | - | - | - | - | - | - | - | |
| 450 | 10−2 | - | - | 1.5 (<10) | 1.9 (<10) | - | - | 0.6–0.8 (0) | 2.6 (<10) | - | - | - | - | - | - | 1.5 (<1) | 2.3 (20) |
| 500 | 3.3 × 10⁻³ | 1.7 | 4.2 | 2.0 (<10) | 5.0 (70) | 1.2 | 3.6 | 0.6–0.9 (<1) | 2.9 (50) | 1.2 | 2.8 | 0.5–0.7 (<1) | 2.7 (40) | 1–1.2 | 2.4 | 0.5–0.7 (<1) | 2.5 (20) |
| 10−2 | 2.5 | 10.3 | - | - | 2.1 | 8.0 | - | - | 1.5 | 6.0 | - | - | 1.2 | 4.5 | 0.9–2 (<1) | 3.8 (20) | |
| 1.7 × 10⁻² | 2.2 | 8.8 | - | - | 1.7 | 5.6 | - | - | 1.2 | 5.3 | - | - | 1.2–1.3 | 3.6 | - | - | |
| 3.3 × 10⁻² | 2.0 | 7.8 | 2.9 (<10) | 6.3 (80) | 1.5 | 4.5 | 0.7–1 (<1) | 5.5 (70) | 1.0 | 4.6 | 0.8–0.9 (<1) | 4.8 (60) | 1.0 | 3.5 | 0.8–0.9 (<1) | 4.6 (55) | |
| 10−1 | - | - | 2.6 (<10) | 4.8 (30) | - | - | 0.7–0.9 (<1) | 4.2 (30) | - | - | - | - | - | - | - | - | |
| 3.3 × 10⁻¹ | 0.5 | 5.6 | 2 (<10) | 4.2 (25) | 0.5 | 3.3 | 0.6–0.9 (<1) | 3.7 (25) | 0.5 | 3.9 | 0.5–0.7 (<1) | 2.9 (25) | 0.5 | 3.2 | 0.6–1 (<1) | 2.7 (20) | |
| - | - | <1 (<10) | 3.5 (<10) | - | - | 0.6–0.9 (<1) | 2.8 (<10) | - | - | - | - | - | - | - | - | ||
Publisher’s Note: MDPI stays neutral with regard to jurisdictional claims in published maps and institutional affiliations. |
© 2021 by the authors. Licensee MDPI, Basel, Switzerland. This article is an open access article distributed under the terms and conditions of the Creative Commons Attribution (CC BY) license (https://creativecommons.org/licenses/by/4.0/).
Share and Cite
Gryaznov, M.; Shotin, S.; Nokhrin, A.; Chuvil’deev, V.; Likhnitskii, C.; Kopylov, V.; Chegurov, M.; Tabachkova, N.; Shadrina, I.; Smirnova, E.; et al. Investigation of Effect of Preliminary Annealing on Superplasticity of Ultrafine-Grained Conductor Aluminum Alloys Al-0.5%Mg-Sc. Materials 2022, 15, 176. https://0-doi-org.brum.beds.ac.uk/10.3390/ma15010176
Gryaznov M, Shotin S, Nokhrin A, Chuvil’deev V, Likhnitskii C, Kopylov V, Chegurov M, Tabachkova N, Shadrina I, Smirnova E, et al. Investigation of Effect of Preliminary Annealing on Superplasticity of Ultrafine-Grained Conductor Aluminum Alloys Al-0.5%Mg-Sc. Materials. 2022; 15(1):176. https://0-doi-org.brum.beds.ac.uk/10.3390/ma15010176
Chicago/Turabian StyleGryaznov, Mikhail, Sergey Shotin, Aleksey Nokhrin, Vladimir Chuvil’deev, Constantine Likhnitskii, Vladimir Kopylov, Mikhail Chegurov, Nataliya Tabachkova, Iana Shadrina, Elena Smirnova, and et al. 2022. "Investigation of Effect of Preliminary Annealing on Superplasticity of Ultrafine-Grained Conductor Aluminum Alloys Al-0.5%Mg-Sc" Materials 15, no. 1: 176. https://0-doi-org.brum.beds.ac.uk/10.3390/ma15010176