
A Review of Non-Destructive Testing (NDT) Techniques for Defect Detection: Application to Fusion Welding and Future Wire Arc Additive Manufacturing Processes


Abstract
:1. Introduction

| NDT Method | Summary of the Operation Procedure | Suitable for Online/Offline Monitoring | The Smallest Detected Defect (µm) |
|---|---|---|---|
| Visual inspection [17] | An expert evaluates the workpiece with a naked eye or various simple equipment such as magnifiers or endoscopes [17]. | X/✓ | No information available |
| Liquid penetrant testing [9] | The fluorescent penetrant is applied on the surface of the material. It penetrates the defects, then the additional fluorescent is cleaned, and a developer used, which causes the defects to be identified [9]. | X/✓ | >750 [26] |
| Magnetic particle testing [9] | In the first step, component magnetization occurs. Imperfections cause a magnetic current to penetrate the material. After that, the particles are spread on the surface of the component, leading to particle accumulation in the penetration zone and, finally, welding defects detection [9]. | X/✓ [17] | >1000 [27] |
| Eddy currents [9] | A magnetic field is created surrounding the examined workpiece by means of an emitted coil. The generated eddy currents inside the sample are alternated by the existing welding flaws. The welding defects can be detected via the variations in the impedance of the coil equivalent to the alternation of the eddy currents [9]. | ✓/✓ [17] | >350 [22] |
| Laser opto-ultrasonic dual detection [28,29] | It combines both laser ultrasonic and laser-induced breakdown spectroscopy technologies to detect defects and acquire elemental information of the tested material during the process [28,29]. | ✓/X | No information available |
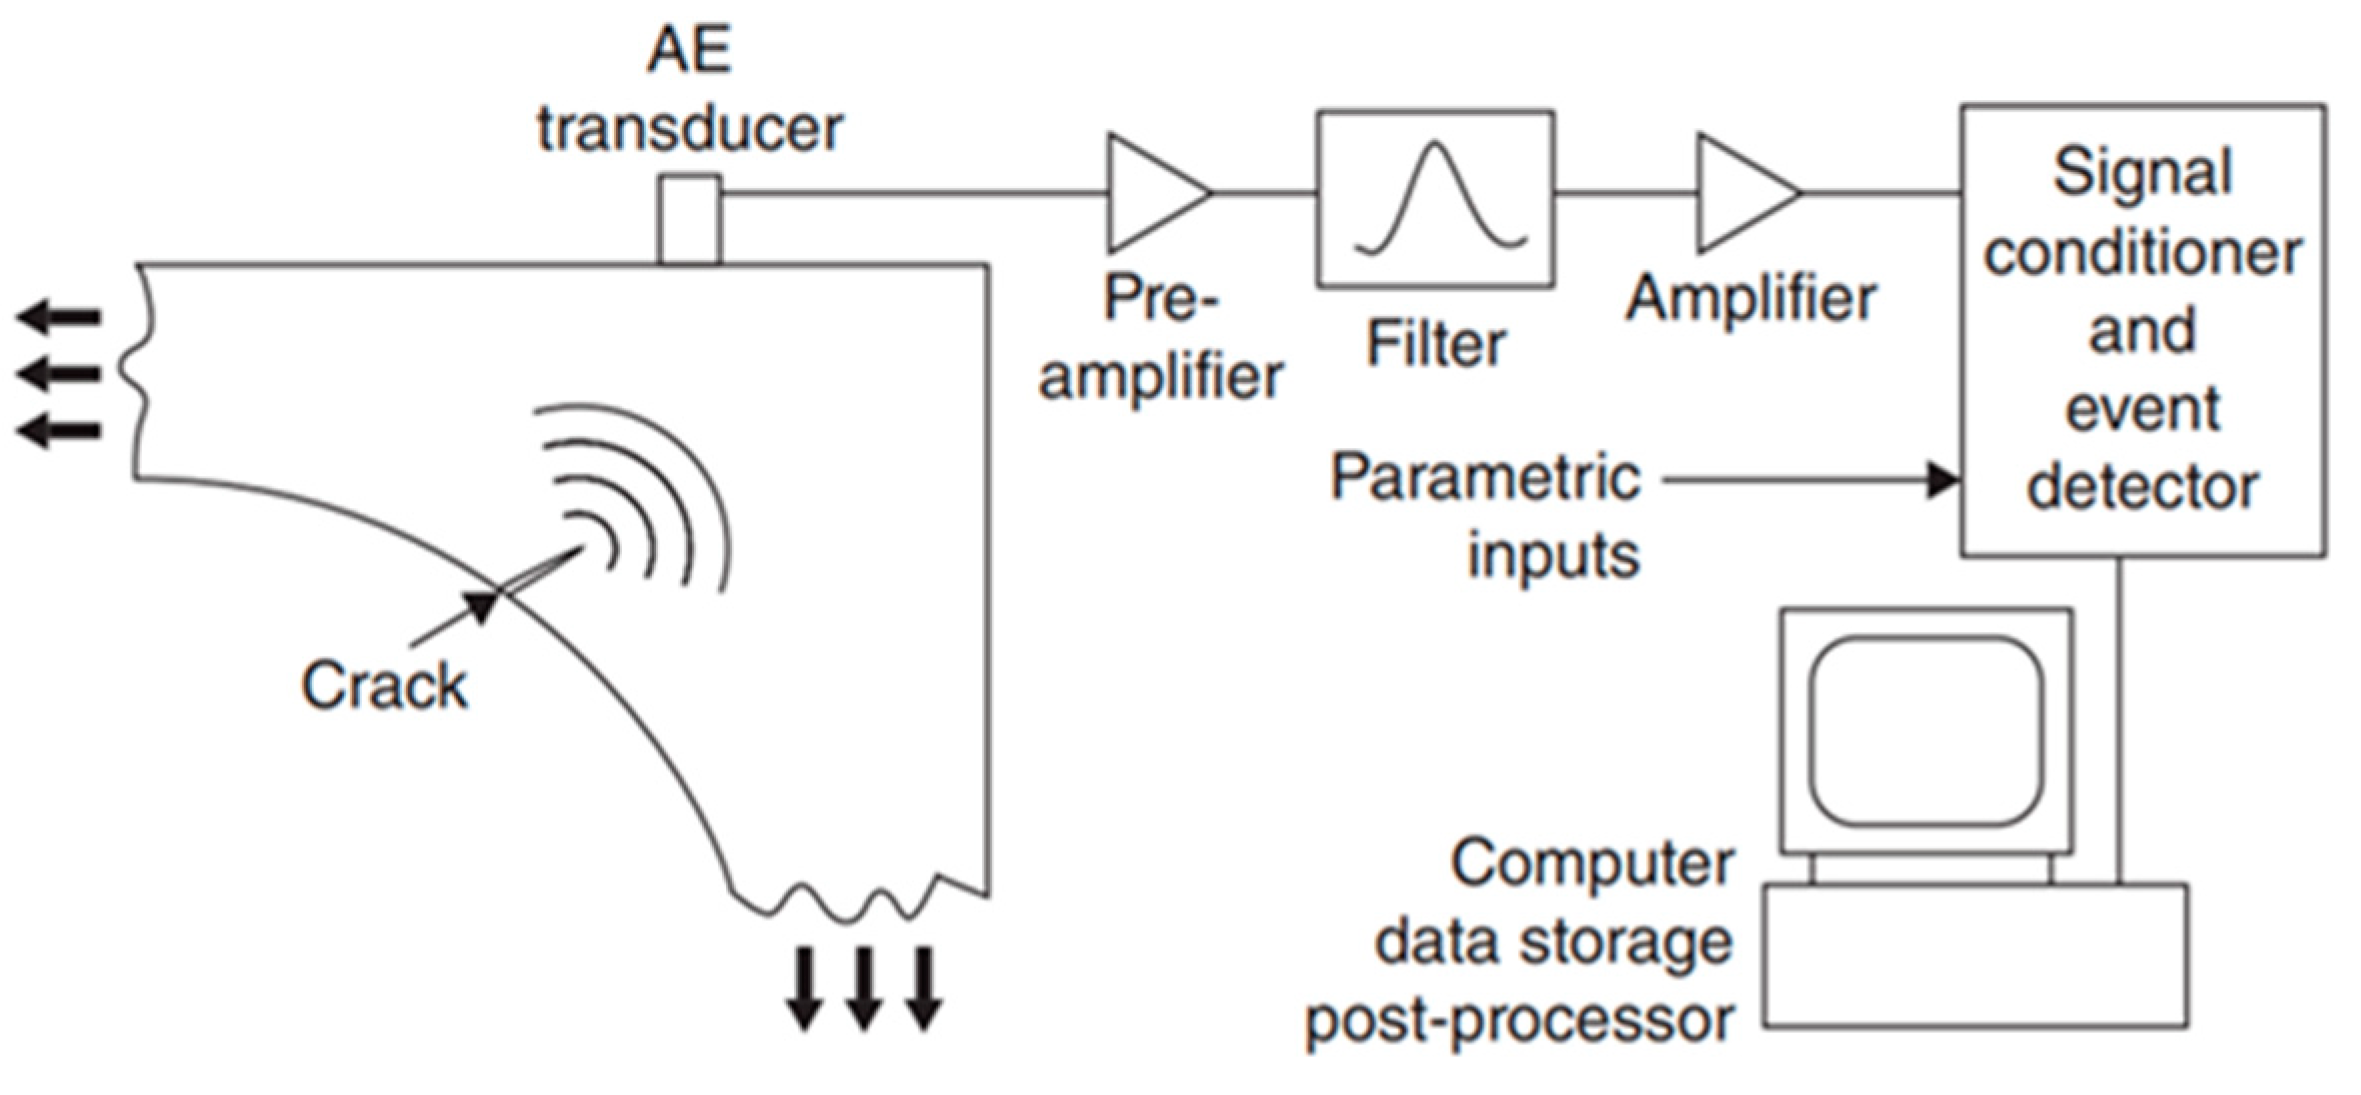
| Conventional acoustic emission [9] | A piezoelectric transducer placed on the surface detects the generated acoustic waves during the manufacturing process [9]. | ✓/X [17] | No information available |
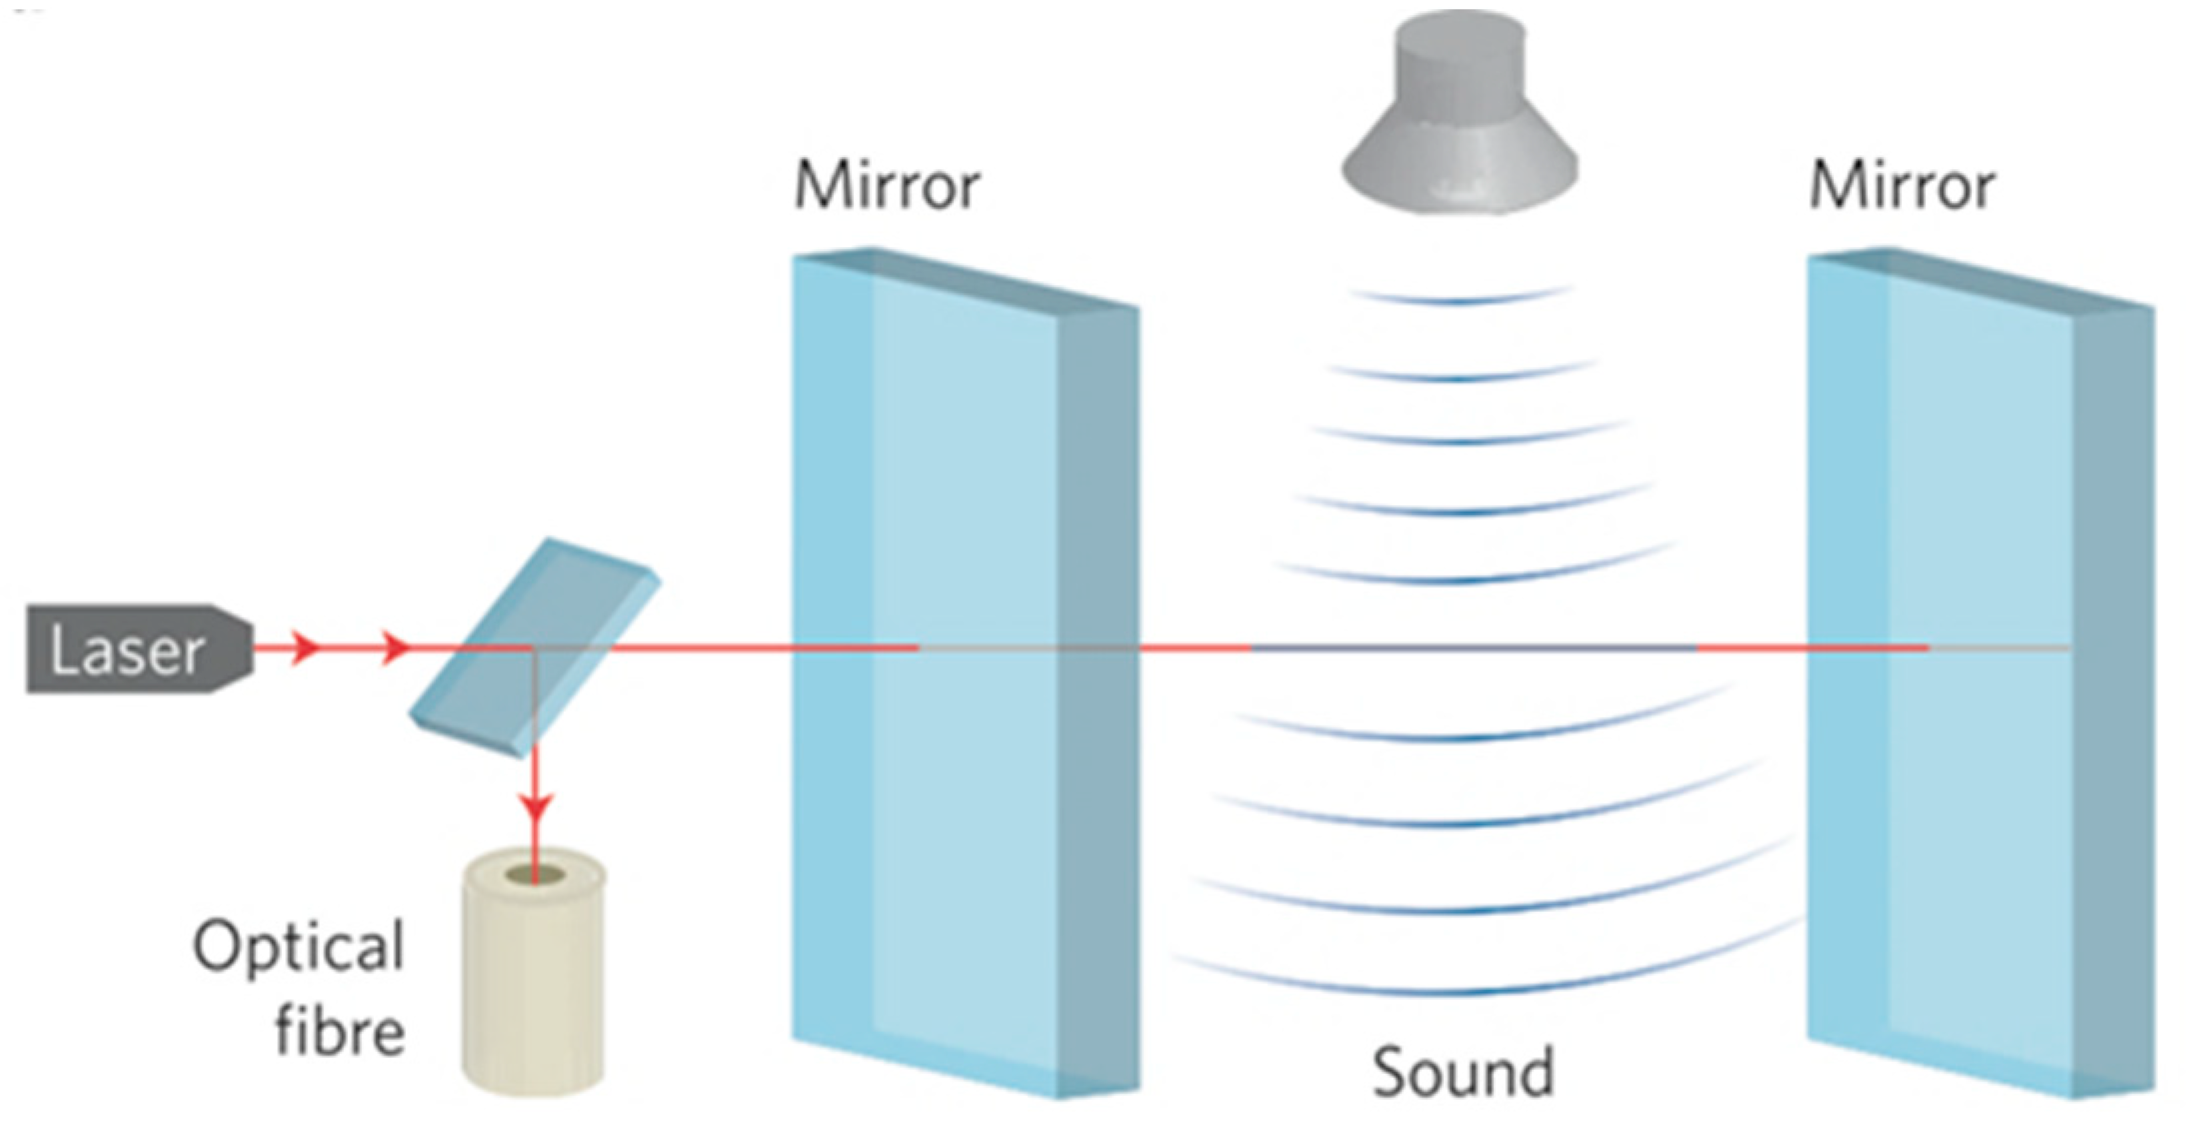
| Acoustic emission using optical microphone [30] | An airborne optical microphone with the ability to hear the frequencies up to 2 MHz is used to detect the soundwaves during the process [30]. | ✓/X [31] | No information available |
| Conventional ultrasonic testing [9] | Acoustic waves generated by a transducer, which has contact with the sample, are propagated into the specimen. These waves interact with the welding defects and then return to the surface of the specimen. These waves are detected and evaluated to recognize the defects [9]. | X/✓ [9] | >500 [32] |
| Phased array ultrasonic testing [9] | A PC is employed to control each multi-element probe instead of single element probe in conventional ultrasonic testing to create a concentrated ultrasonic beam, and a software to direct it [9]. | ✓/✓ [17] | >600 [24] |
| Immersion ultrasonic testing [9] | In comparison to conventional ultrasonic, the examined component is plunged into the liquid (usually water). Using this technology eases the transmission of the waves into the sample [9]. | X/✓ [17] | >500 [32] |
| Electro-magnetic acoustic transducer [9] | An electro-magnetic sensor is employed near to the surface of the sample to generate and capture the acoustic waves. This technology is contactless and does not require any couplant [9,33]. | ✓/✓ [17] | >500 [32] |
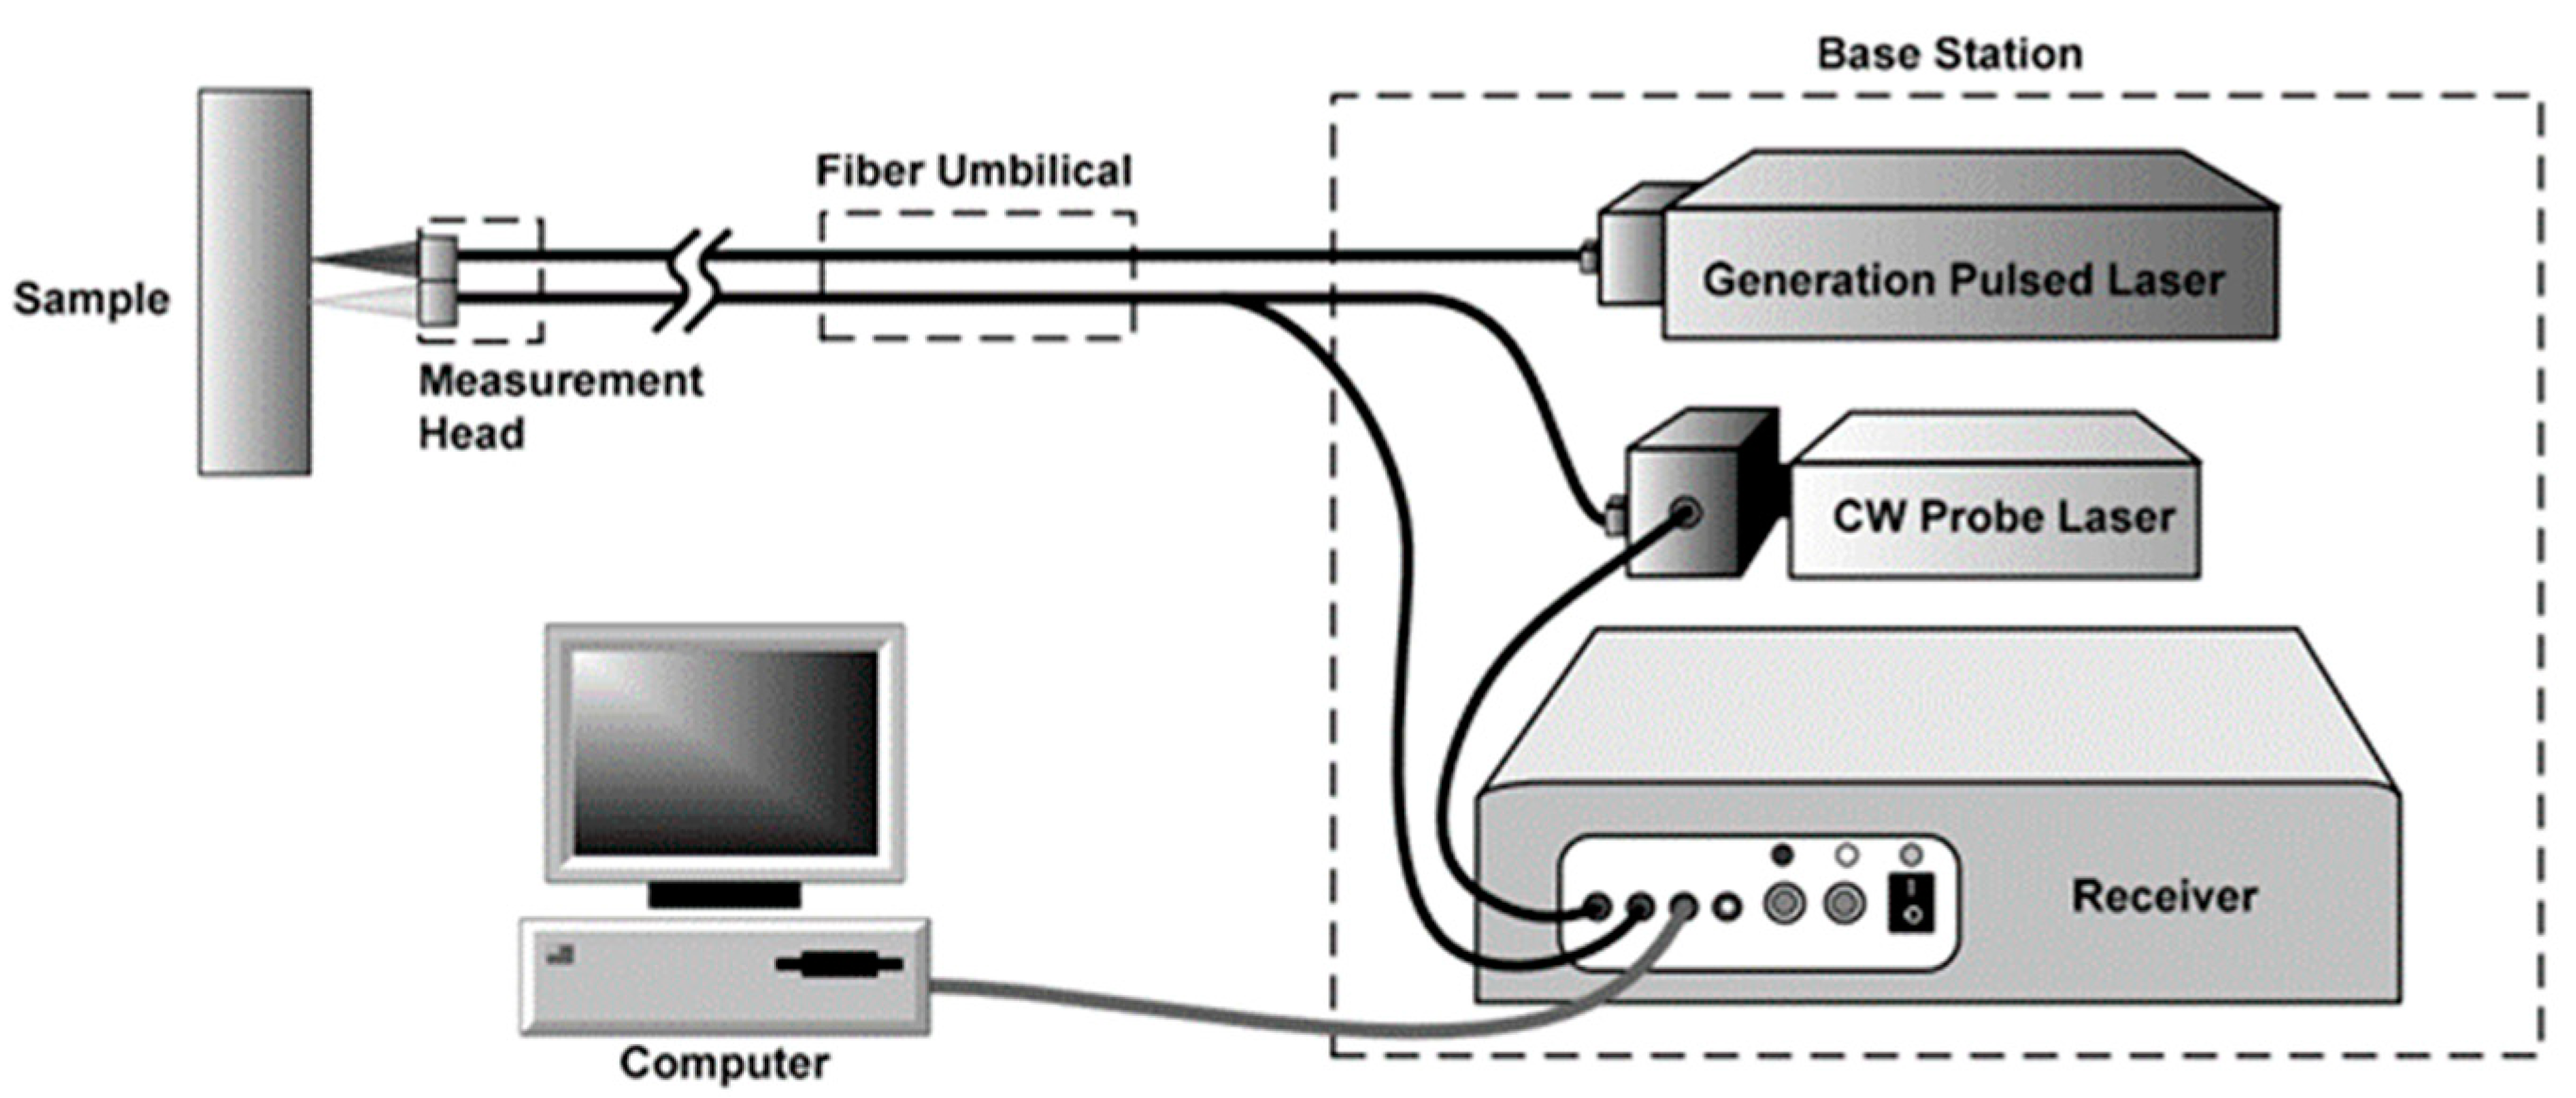
| Laser ultrasonic testing [9] | The excitation and reception of the soundwaves occurs by means of two different lasers [9]. | ✓/✓ [17] | >100 [34] |
| Radiographic inspection [9] | Although the sample uniformly receives the excited radiation energy, imperfections, density alternation and thickness areas captured the radiation energy ununiformly. Thereafter, film(s) or electronic devices are used to capture the absorption differences [9]. | X/✓ [17] | >45 Digital Radiographic [35] |
| Real-time radiography (RTR) [36] | Compared to conventional radiography, digital data are generated during X-ray penetration in the sample [36]. | ✓/✓ [11] | >250 conventional RTR [11] |
| >250 RTR with Image Processing [11] | |||
| >50 Microfocus RTR with Image Processing [11] | |||
| X-ray backscatter [9] | One of the main comparison between the X-ray backscatter and conventional X-ray technique is that the returned X-ray energy from a single side of the tested sample is recorded in the X-ray backscatter technique [9,37]. | ✓/✓ [17] | >20 [9] |
| Computed tomography [9] | A number of 2D X-ray images are captured surrounding a rotation axis. These are collected and used to create a 3D model of the sample by applying algorithms [9,38]. | X/✓ [17] | >600 [39] |
| >10 for micro-CT [40] | |||
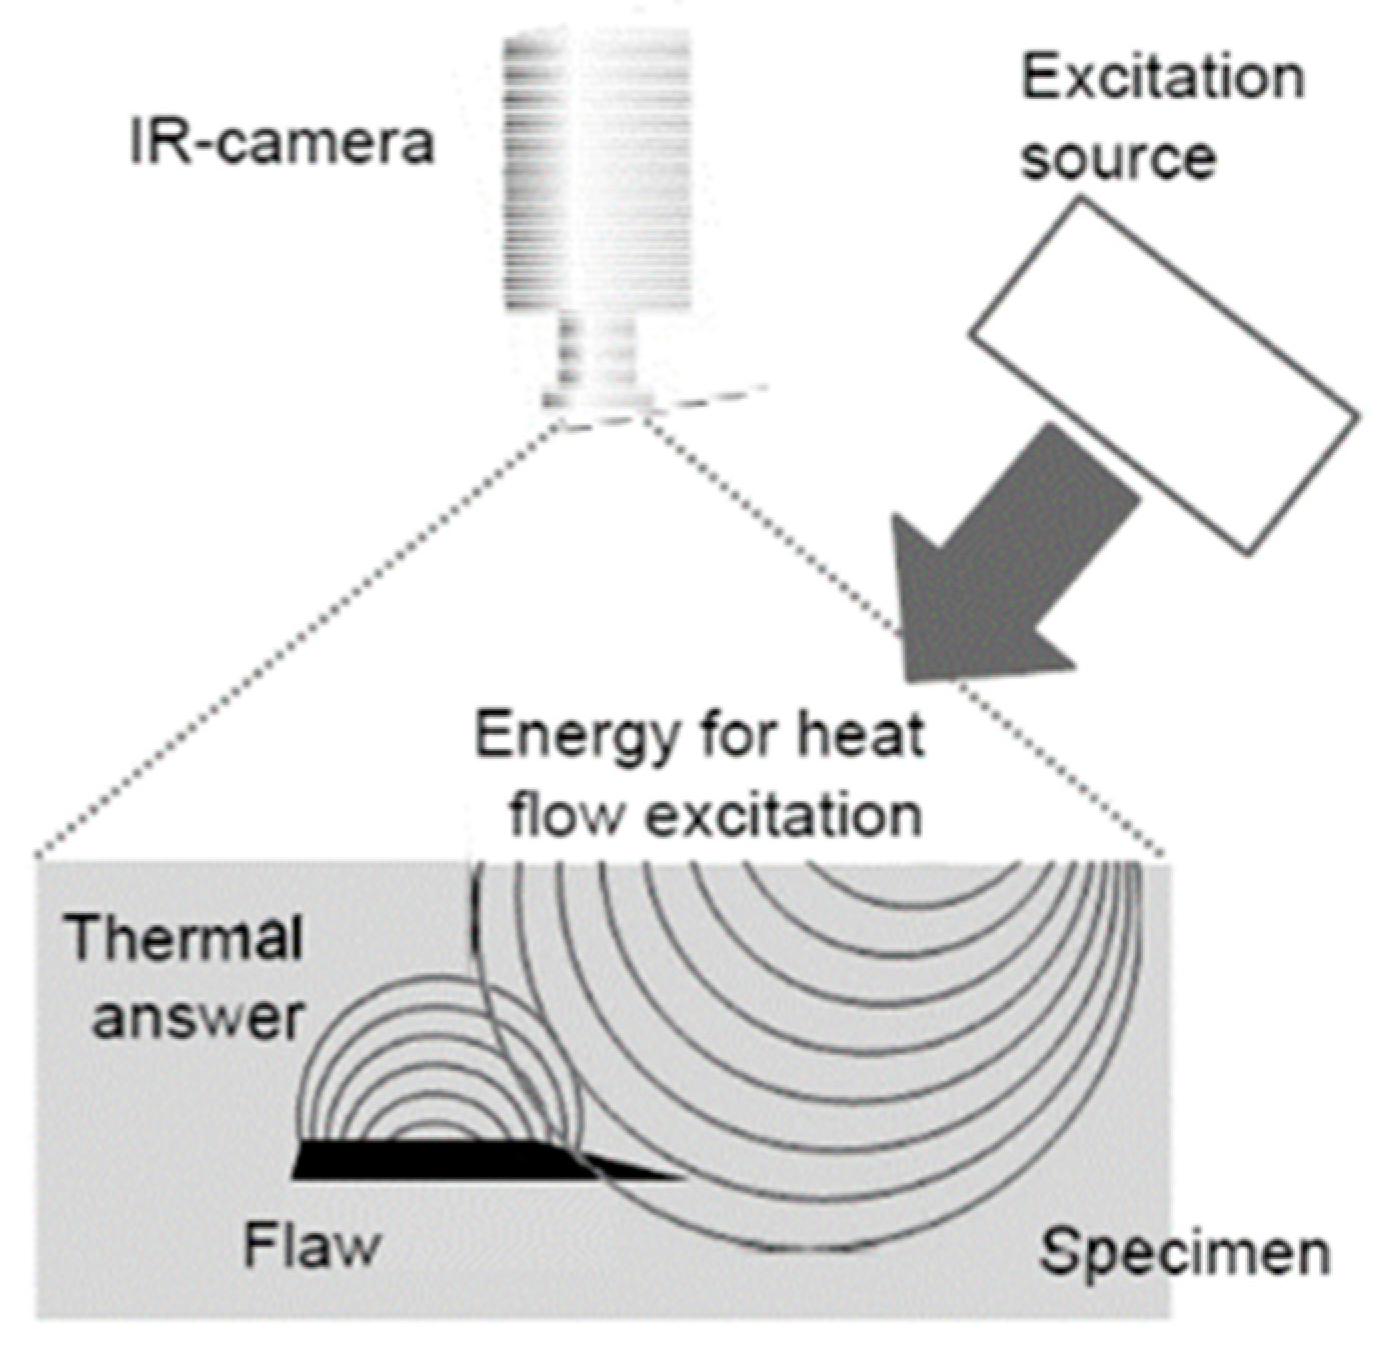
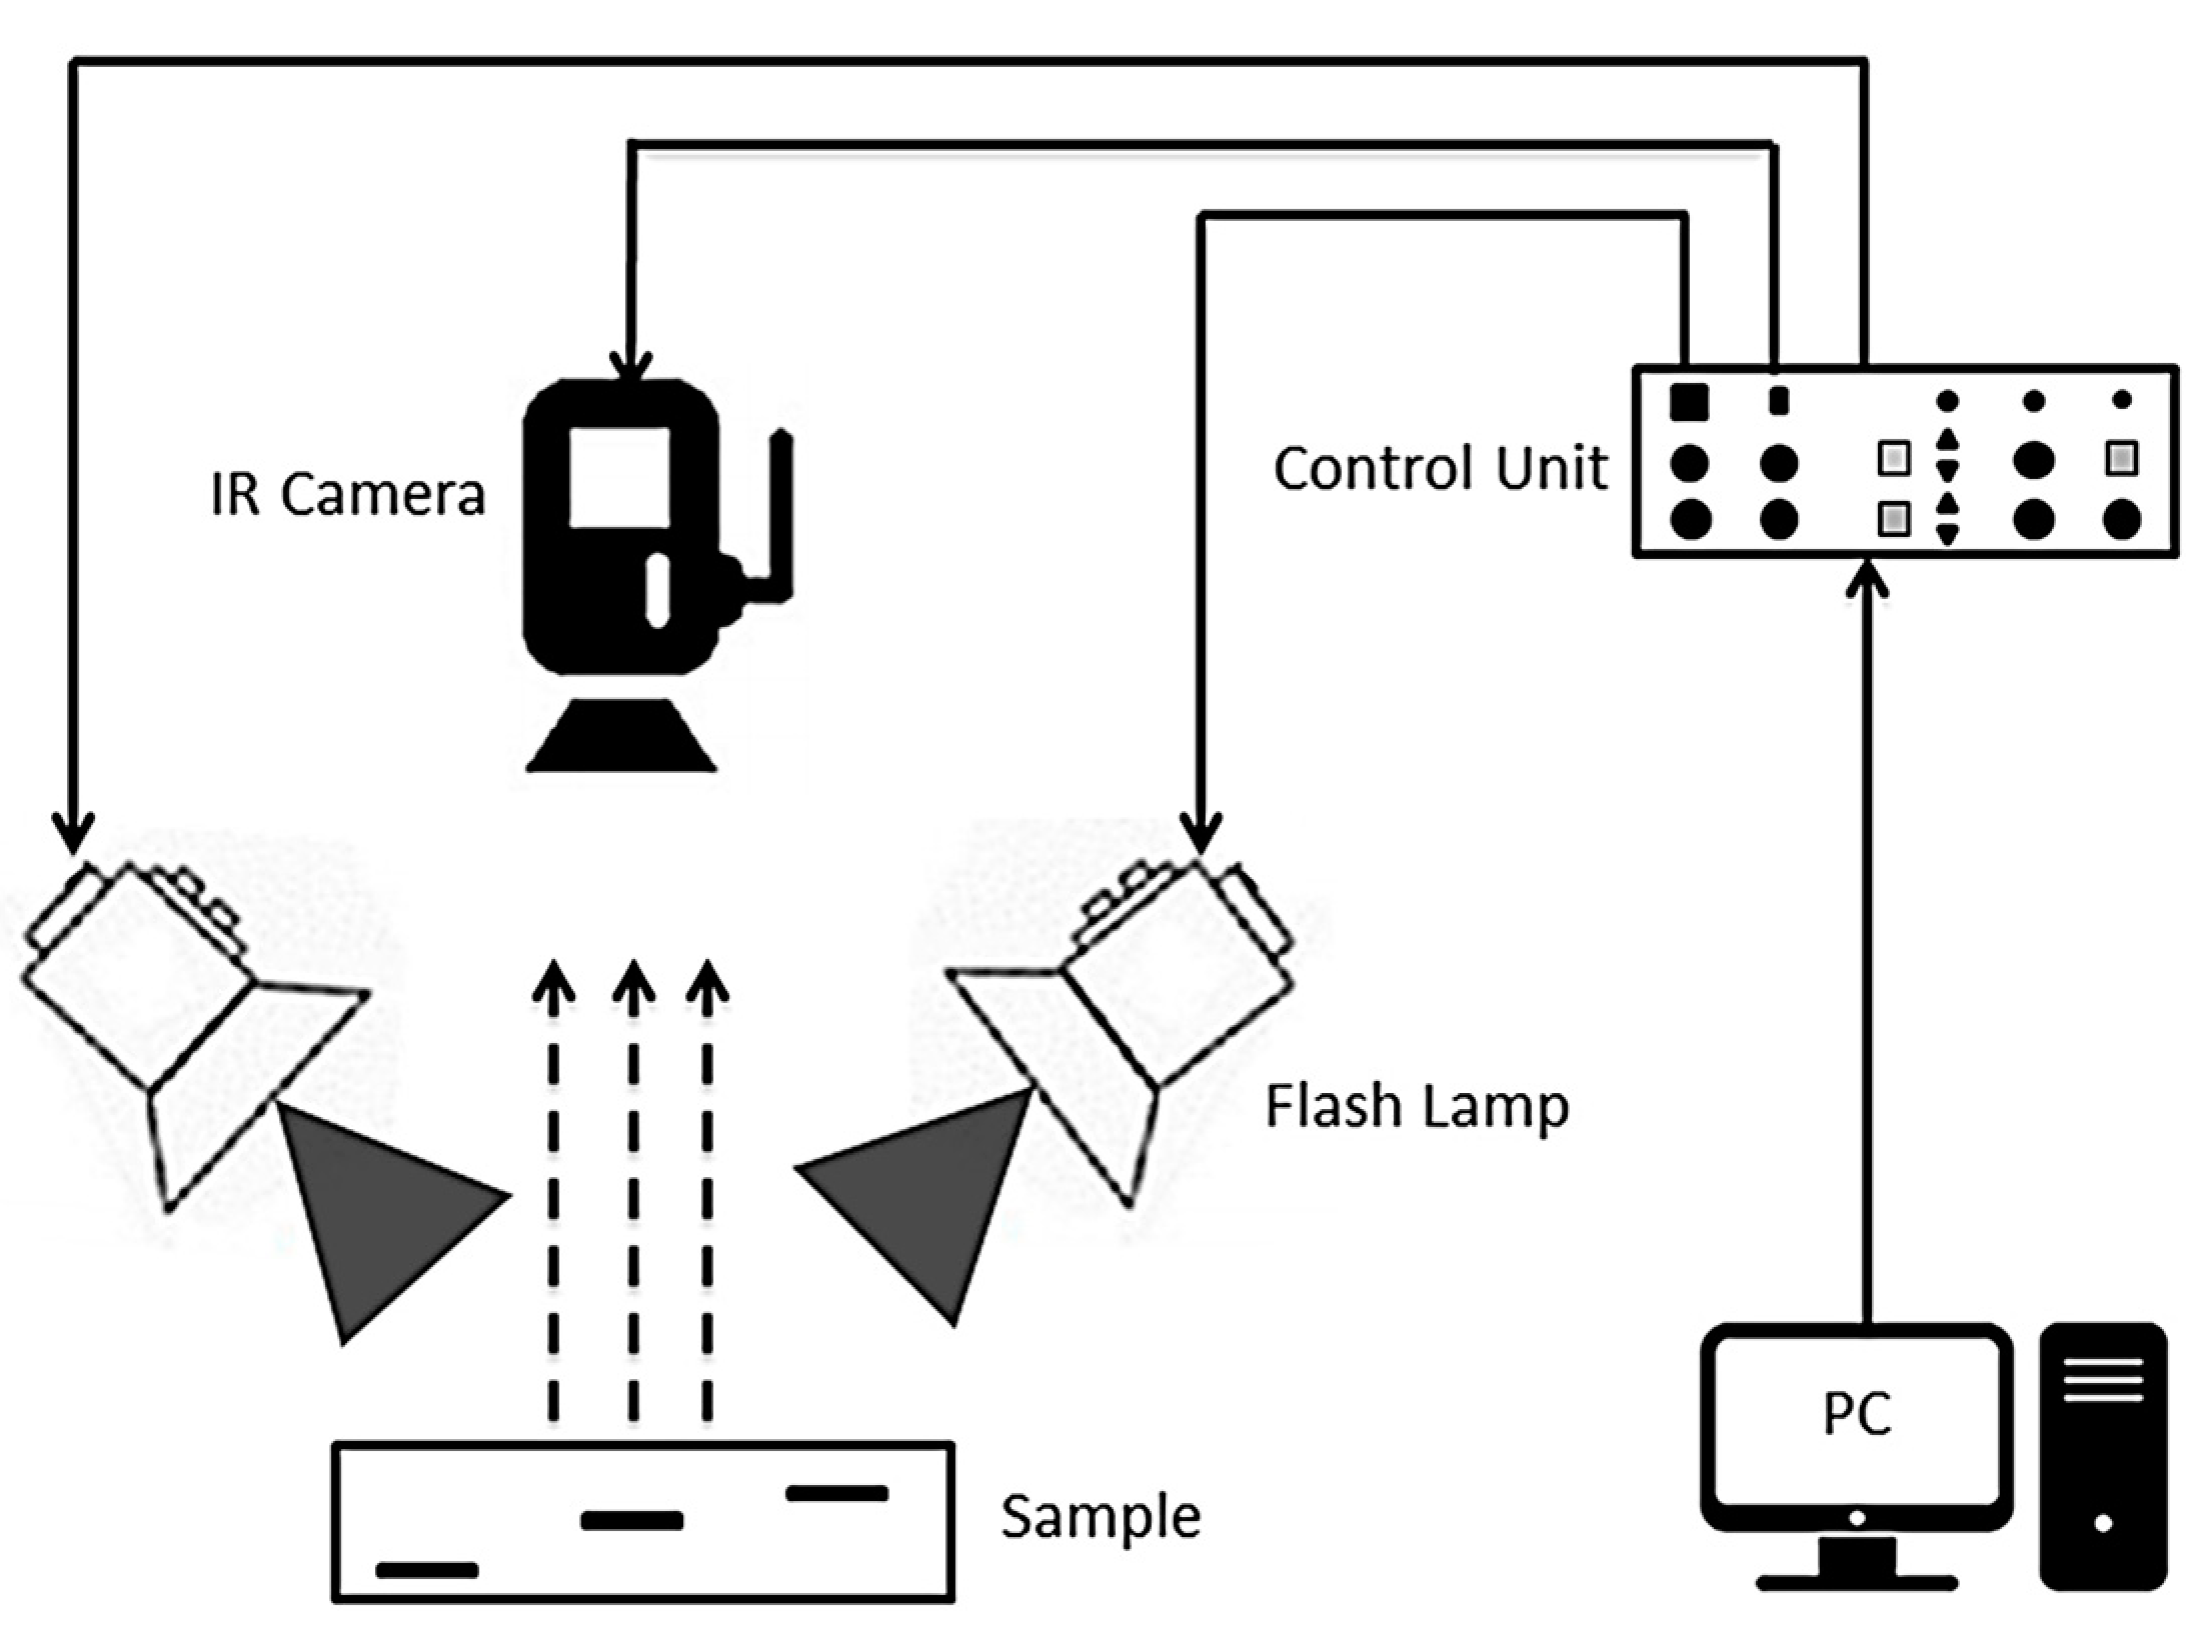
| Infrared Thermography [9] | During the monitoring, an IR camera is used to measure the temperature difference on the surface of the sample caused by the presence of the defects [9]. | ✓/✓ [17] | >400 [41] |
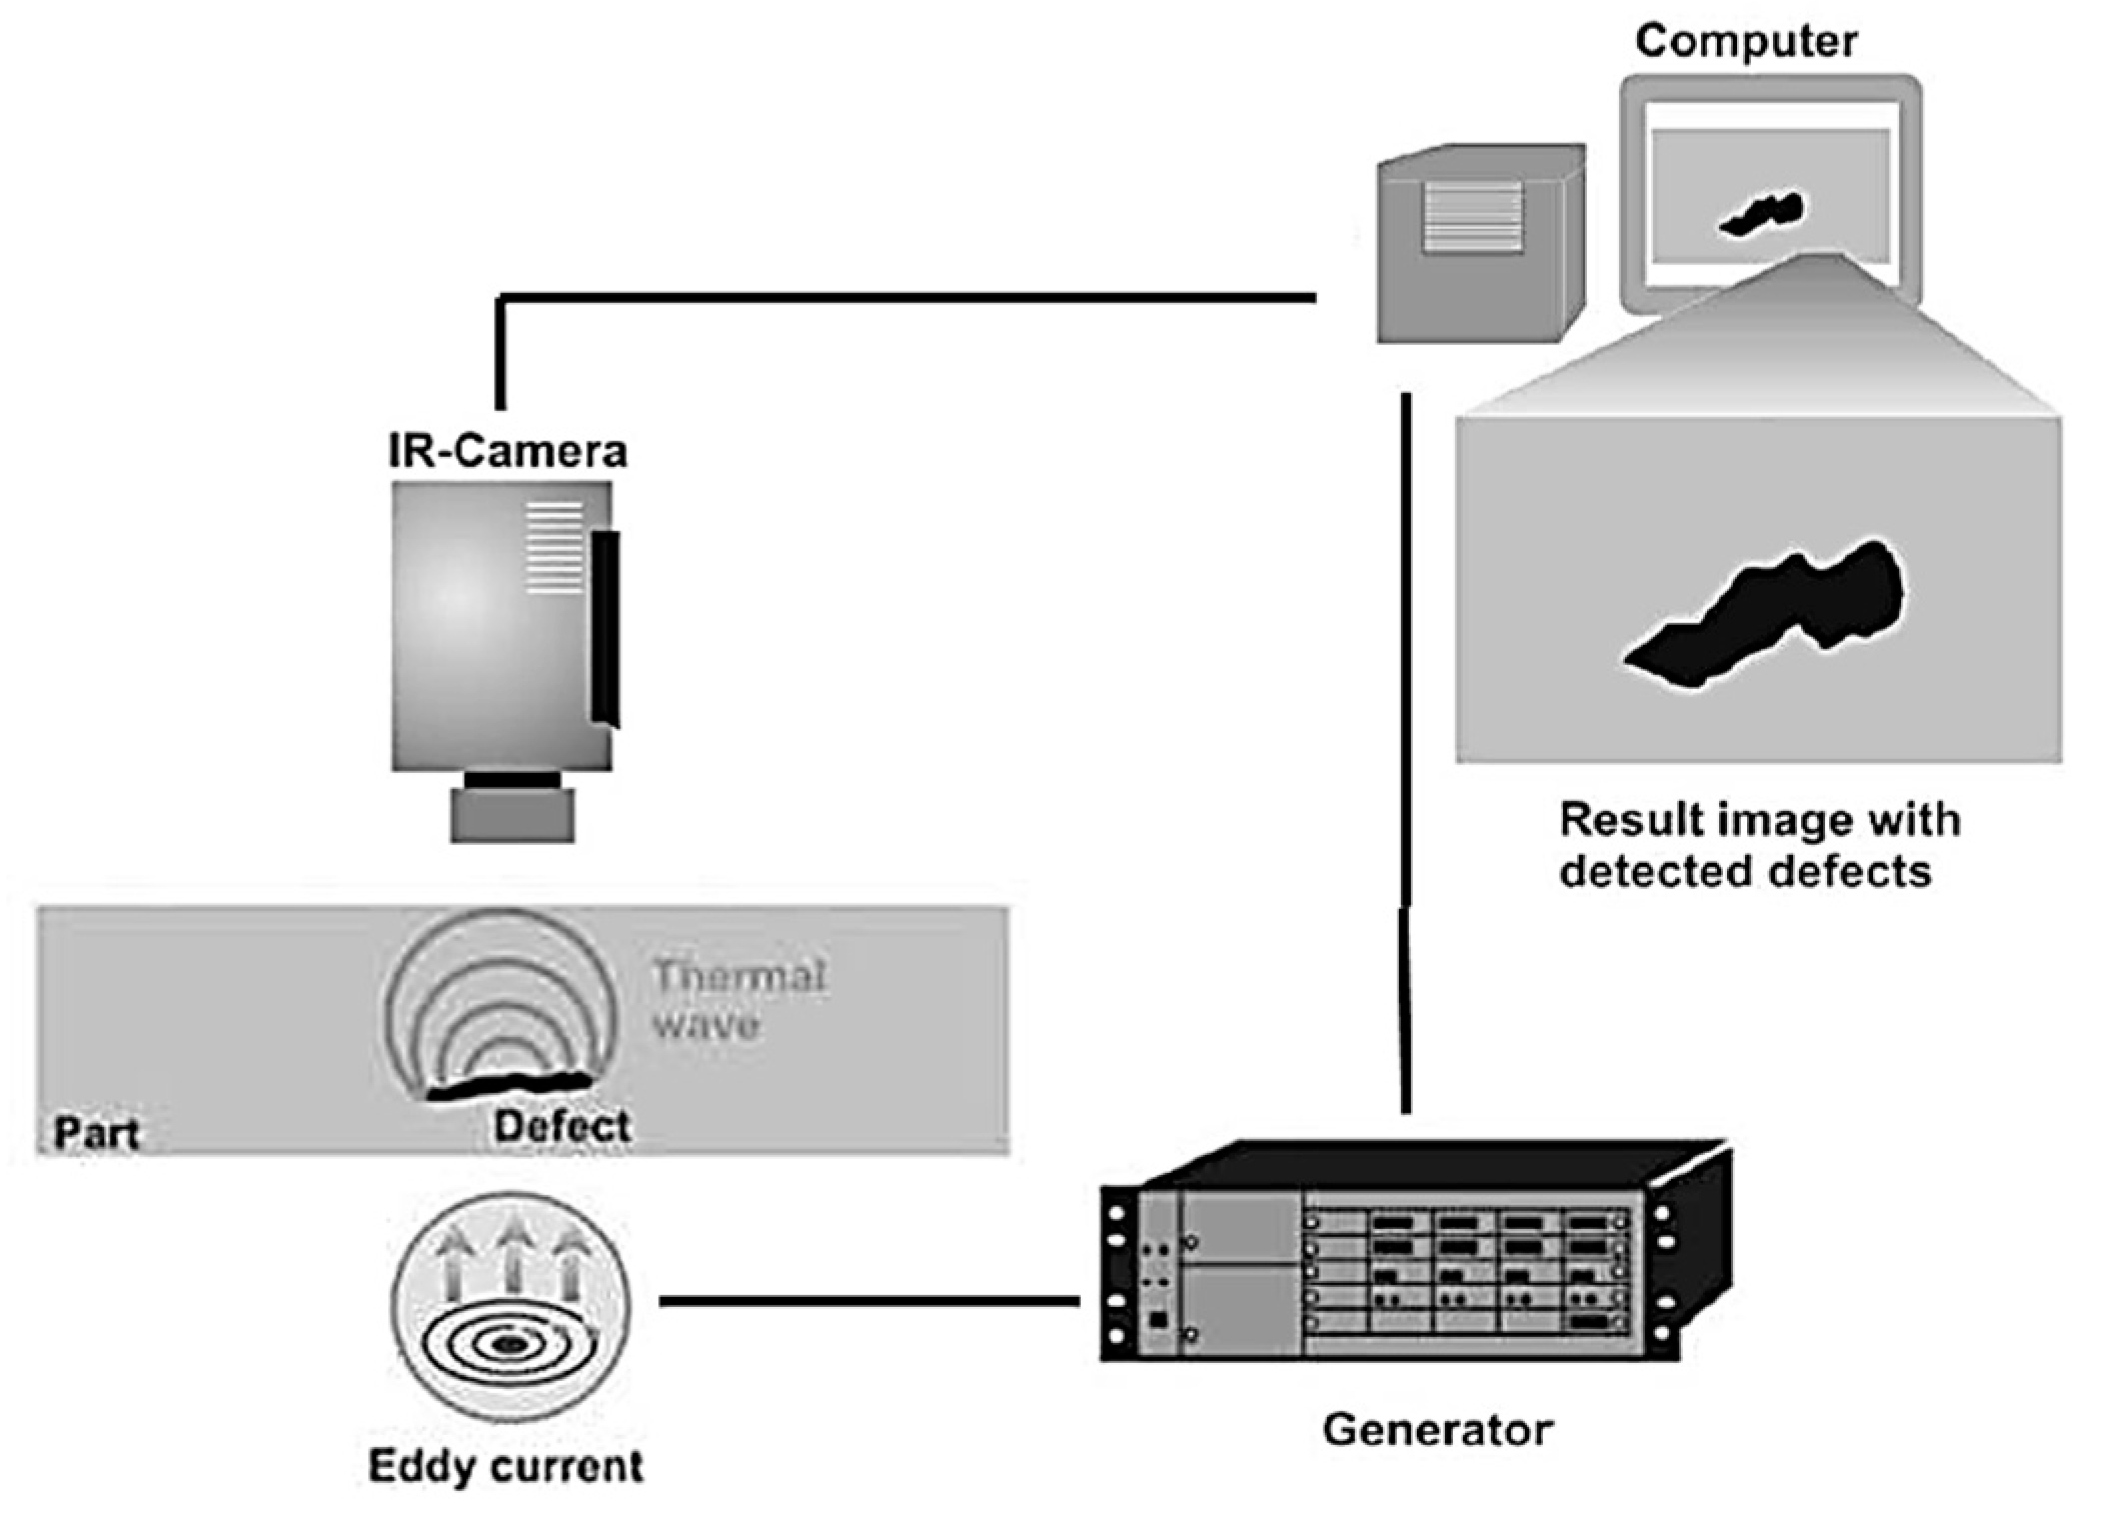
| Eddy current thermography [9] | The heat is generated in the examined material generated by eddy current method and recorded by an IR camera [9]. | ✓/✓ [9] | >400 [41] |
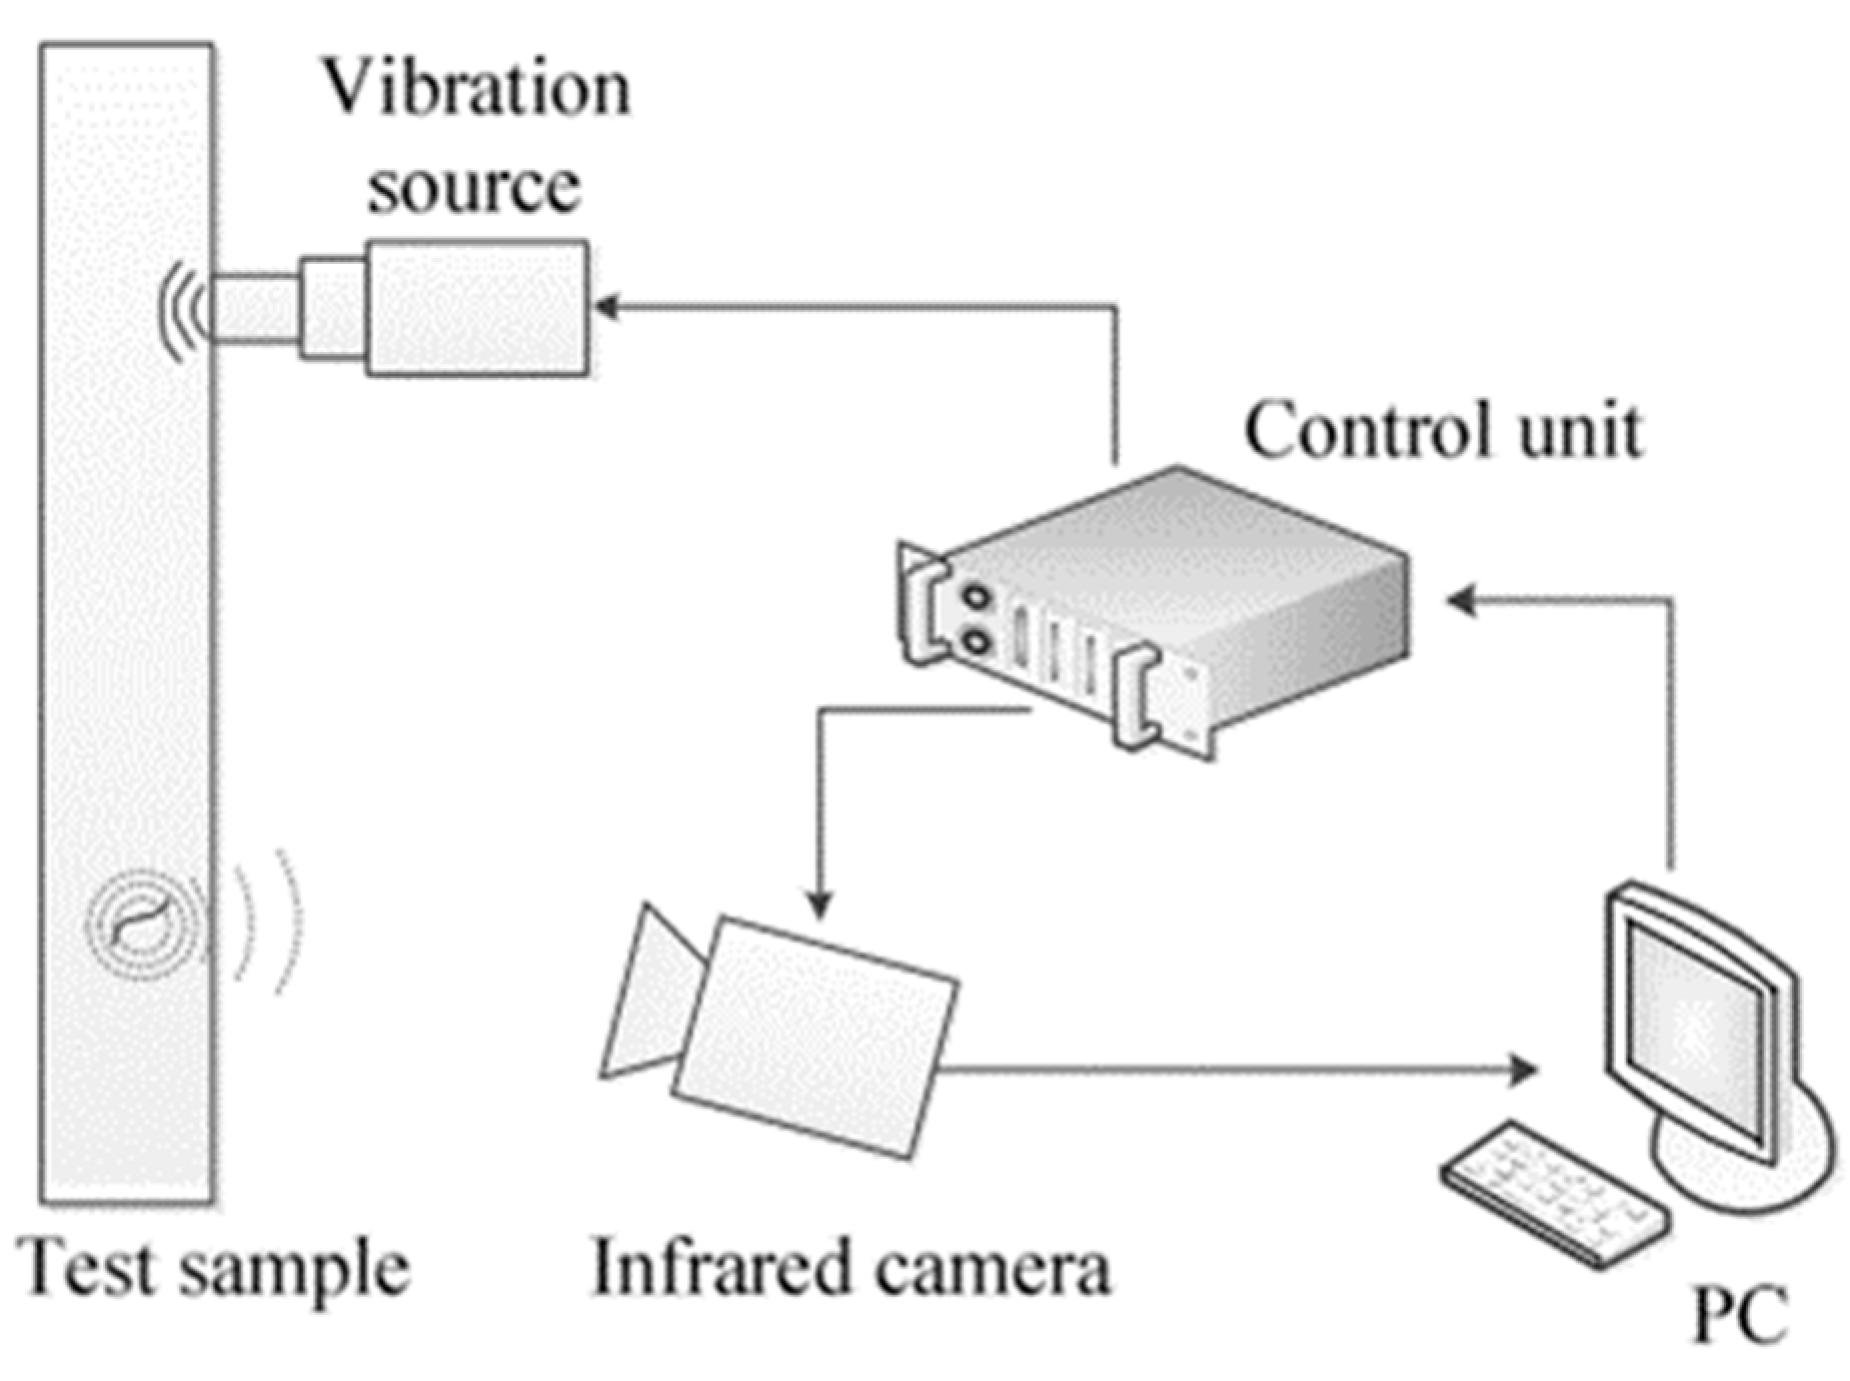
| Vibrothermography [9] | The produced soundwaves by an UT transducer inside the material collide with the defects and cause a heat release as a consequence of friction. Then, the released heat is captured via an IR camera [9]. | X/✓ [9] | >400 [41] |
| Laser thermography [9] | The sample is heated up using a laser. The energy interacts with the defects. Assessing the heat distribution surrounding the laser spot on the surface of the material allows the defects to be identified [9]. | ✓/✓ [9] | >400 [41] |
| Voltage and current evaluation | During WAAM and fusion welding processes, voltage and current are captured in real time and/then analysed by means of statistical analysis tools or machine/deep learning techniques to detect defects [42]. | ✓/X | No information available |
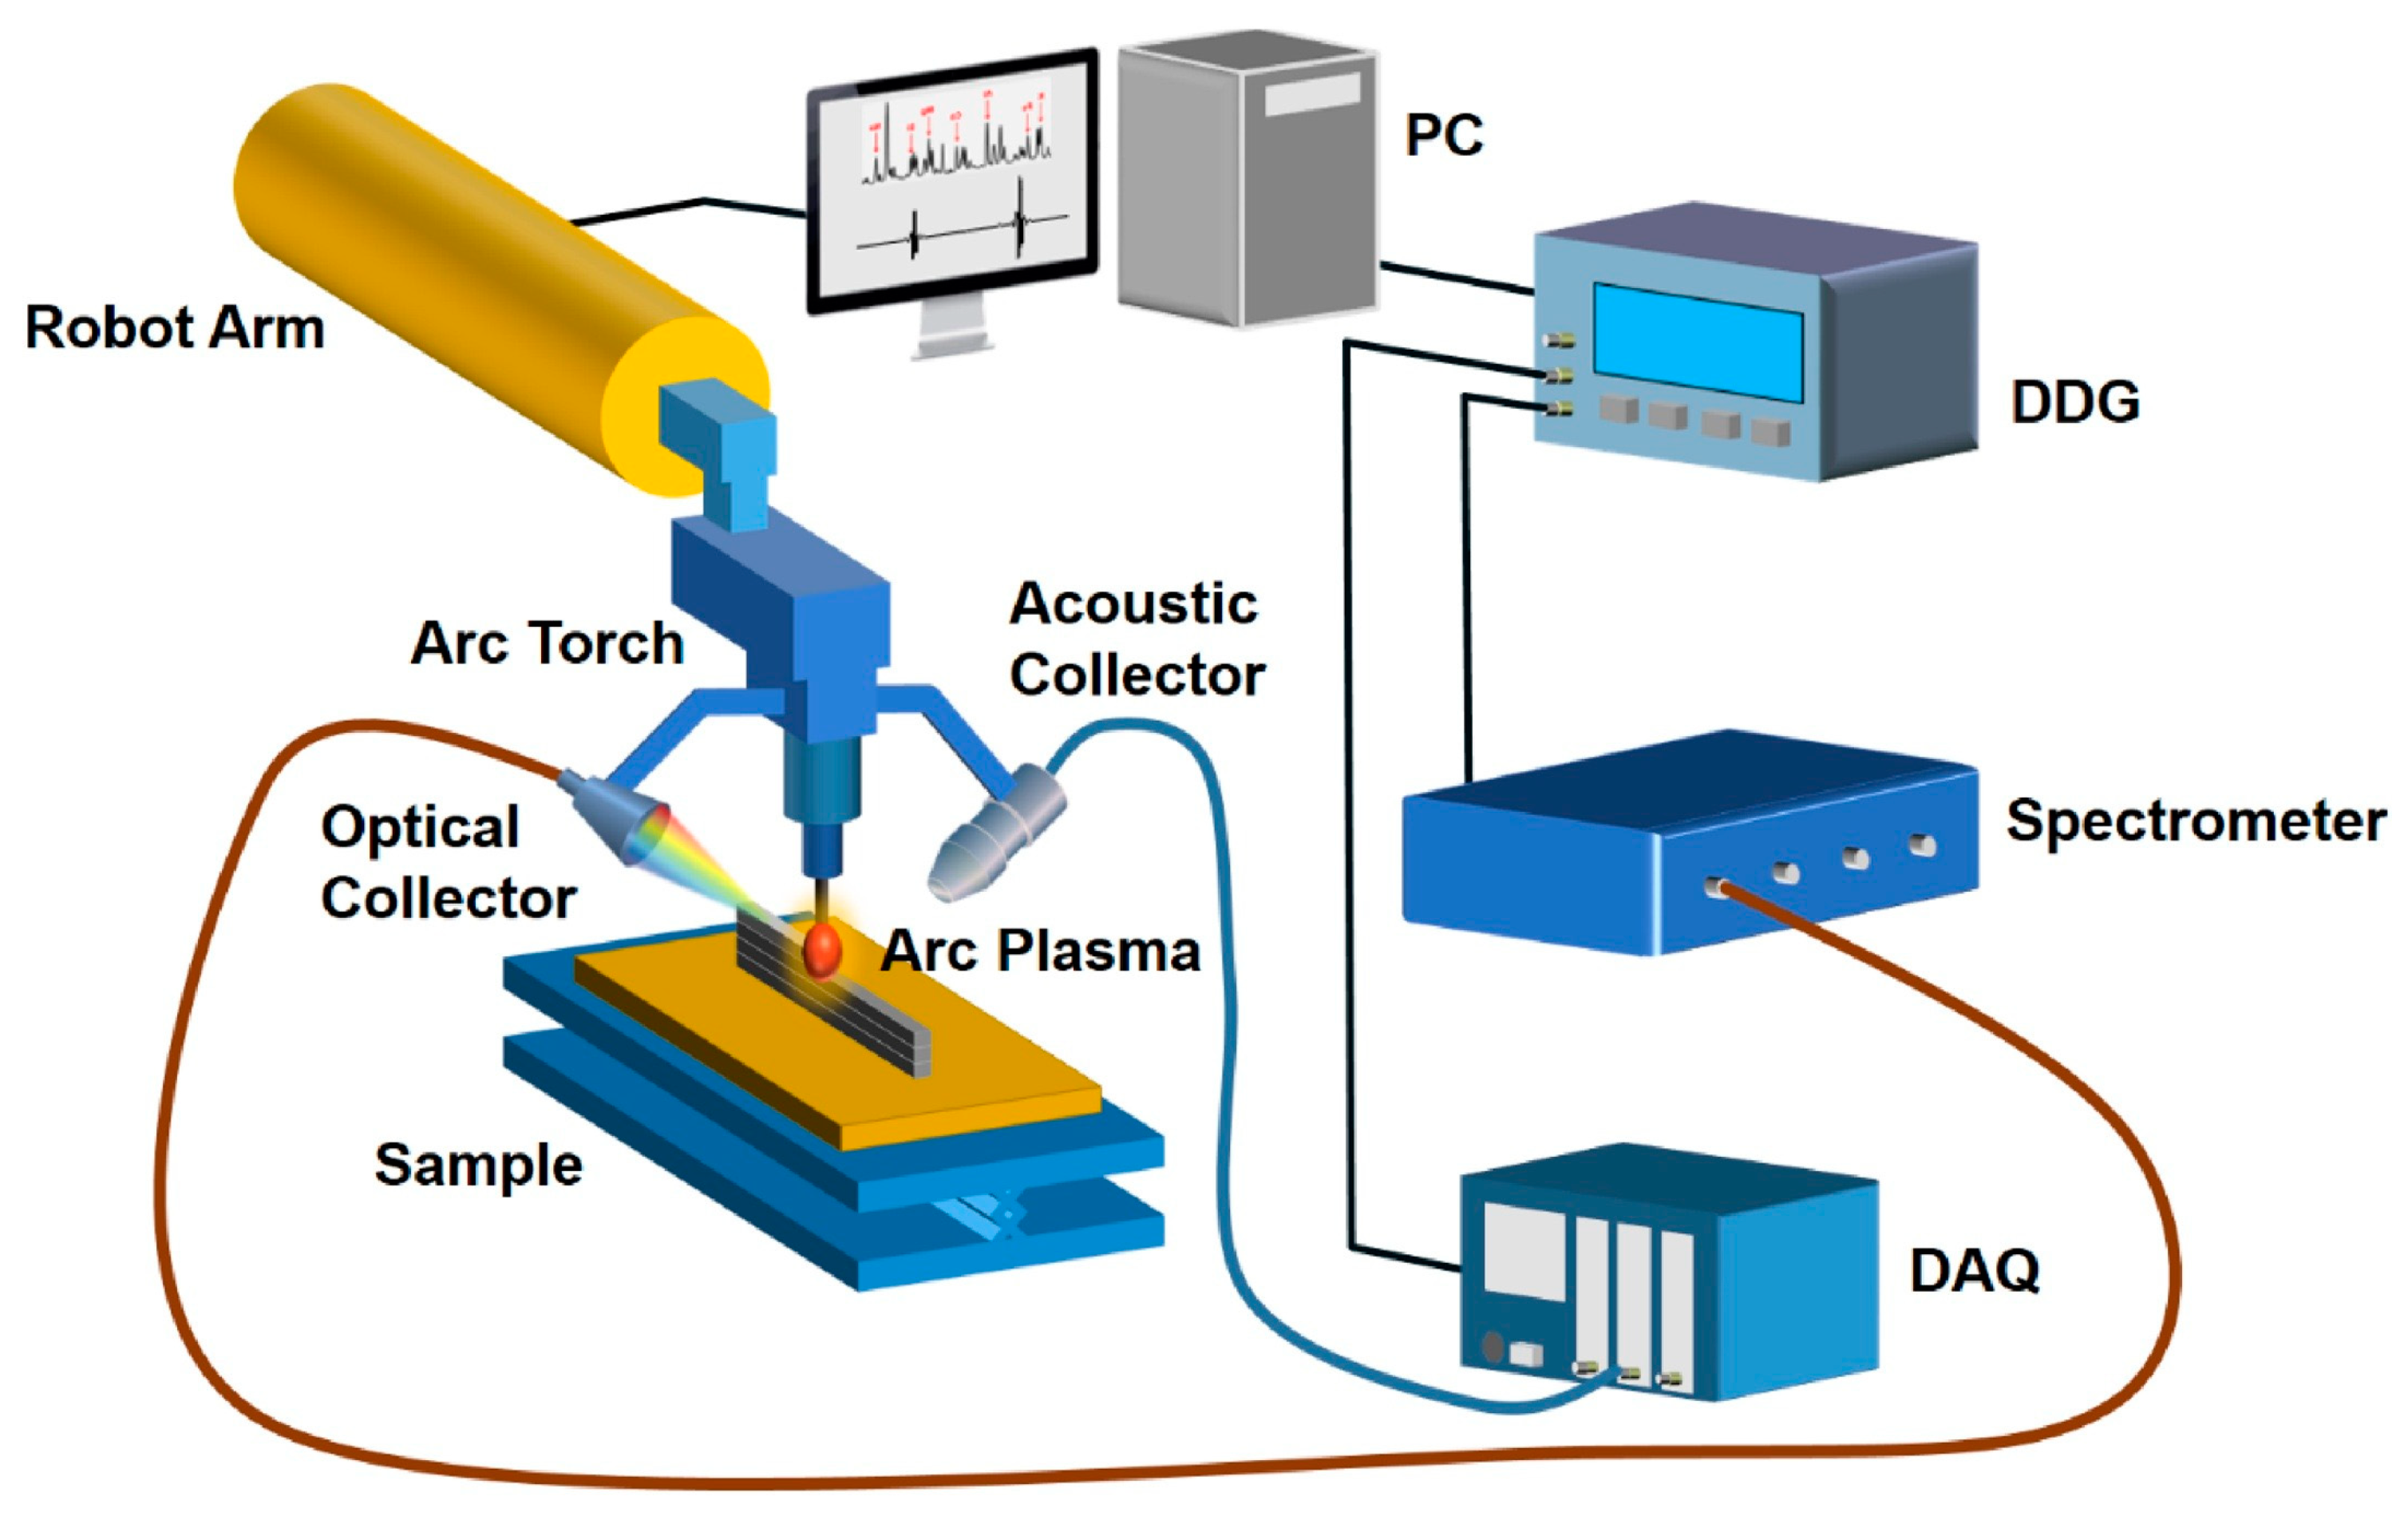
| Optical emission spectroscopy [17] | The electronic temperature profile is determined during the process by means of assessing the generated light during welding process. This electronic temperature profile is then correlated with existing flaws in the component [17]. | ✓/X [17] | No information available |
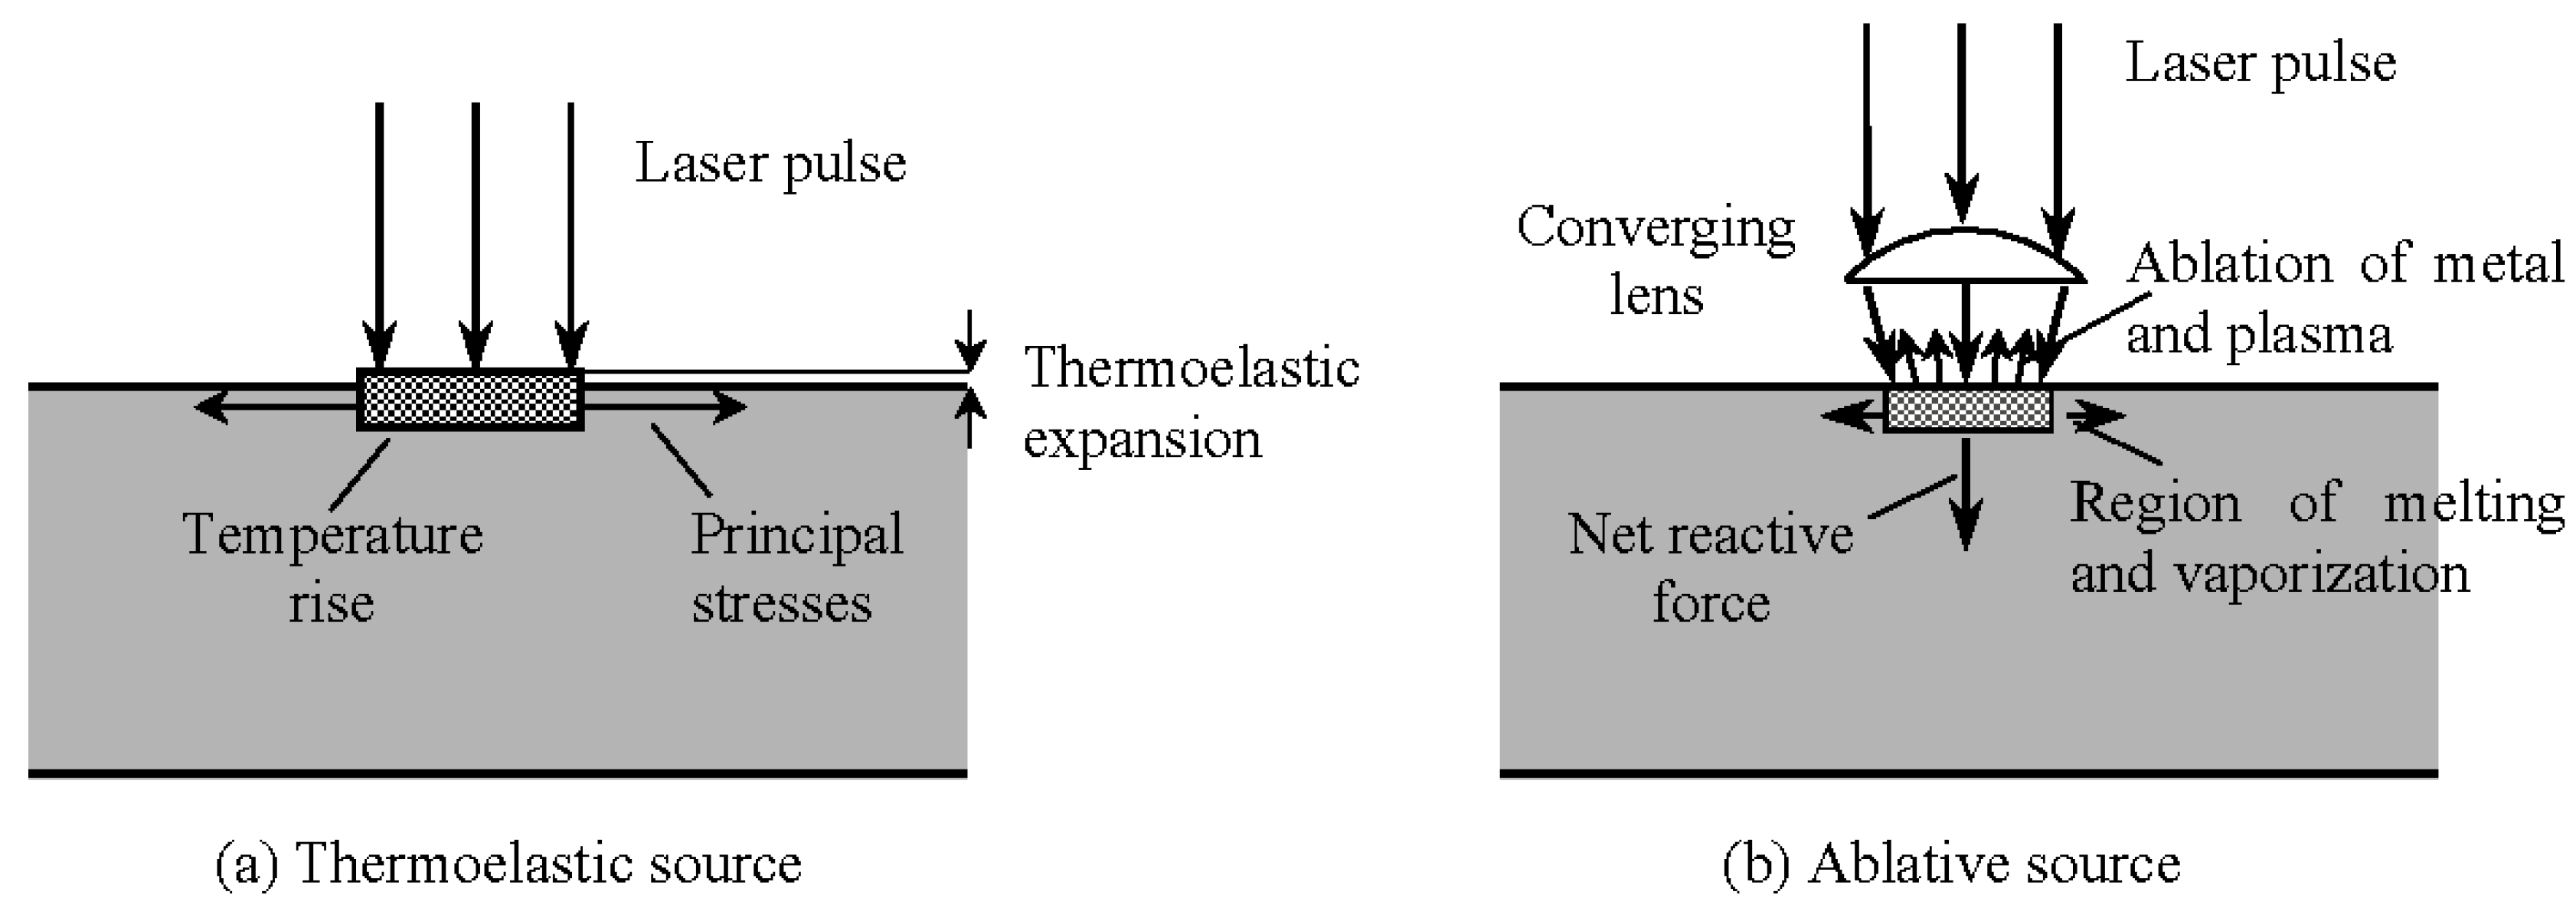
2. Laser-Ultrasonics Testing
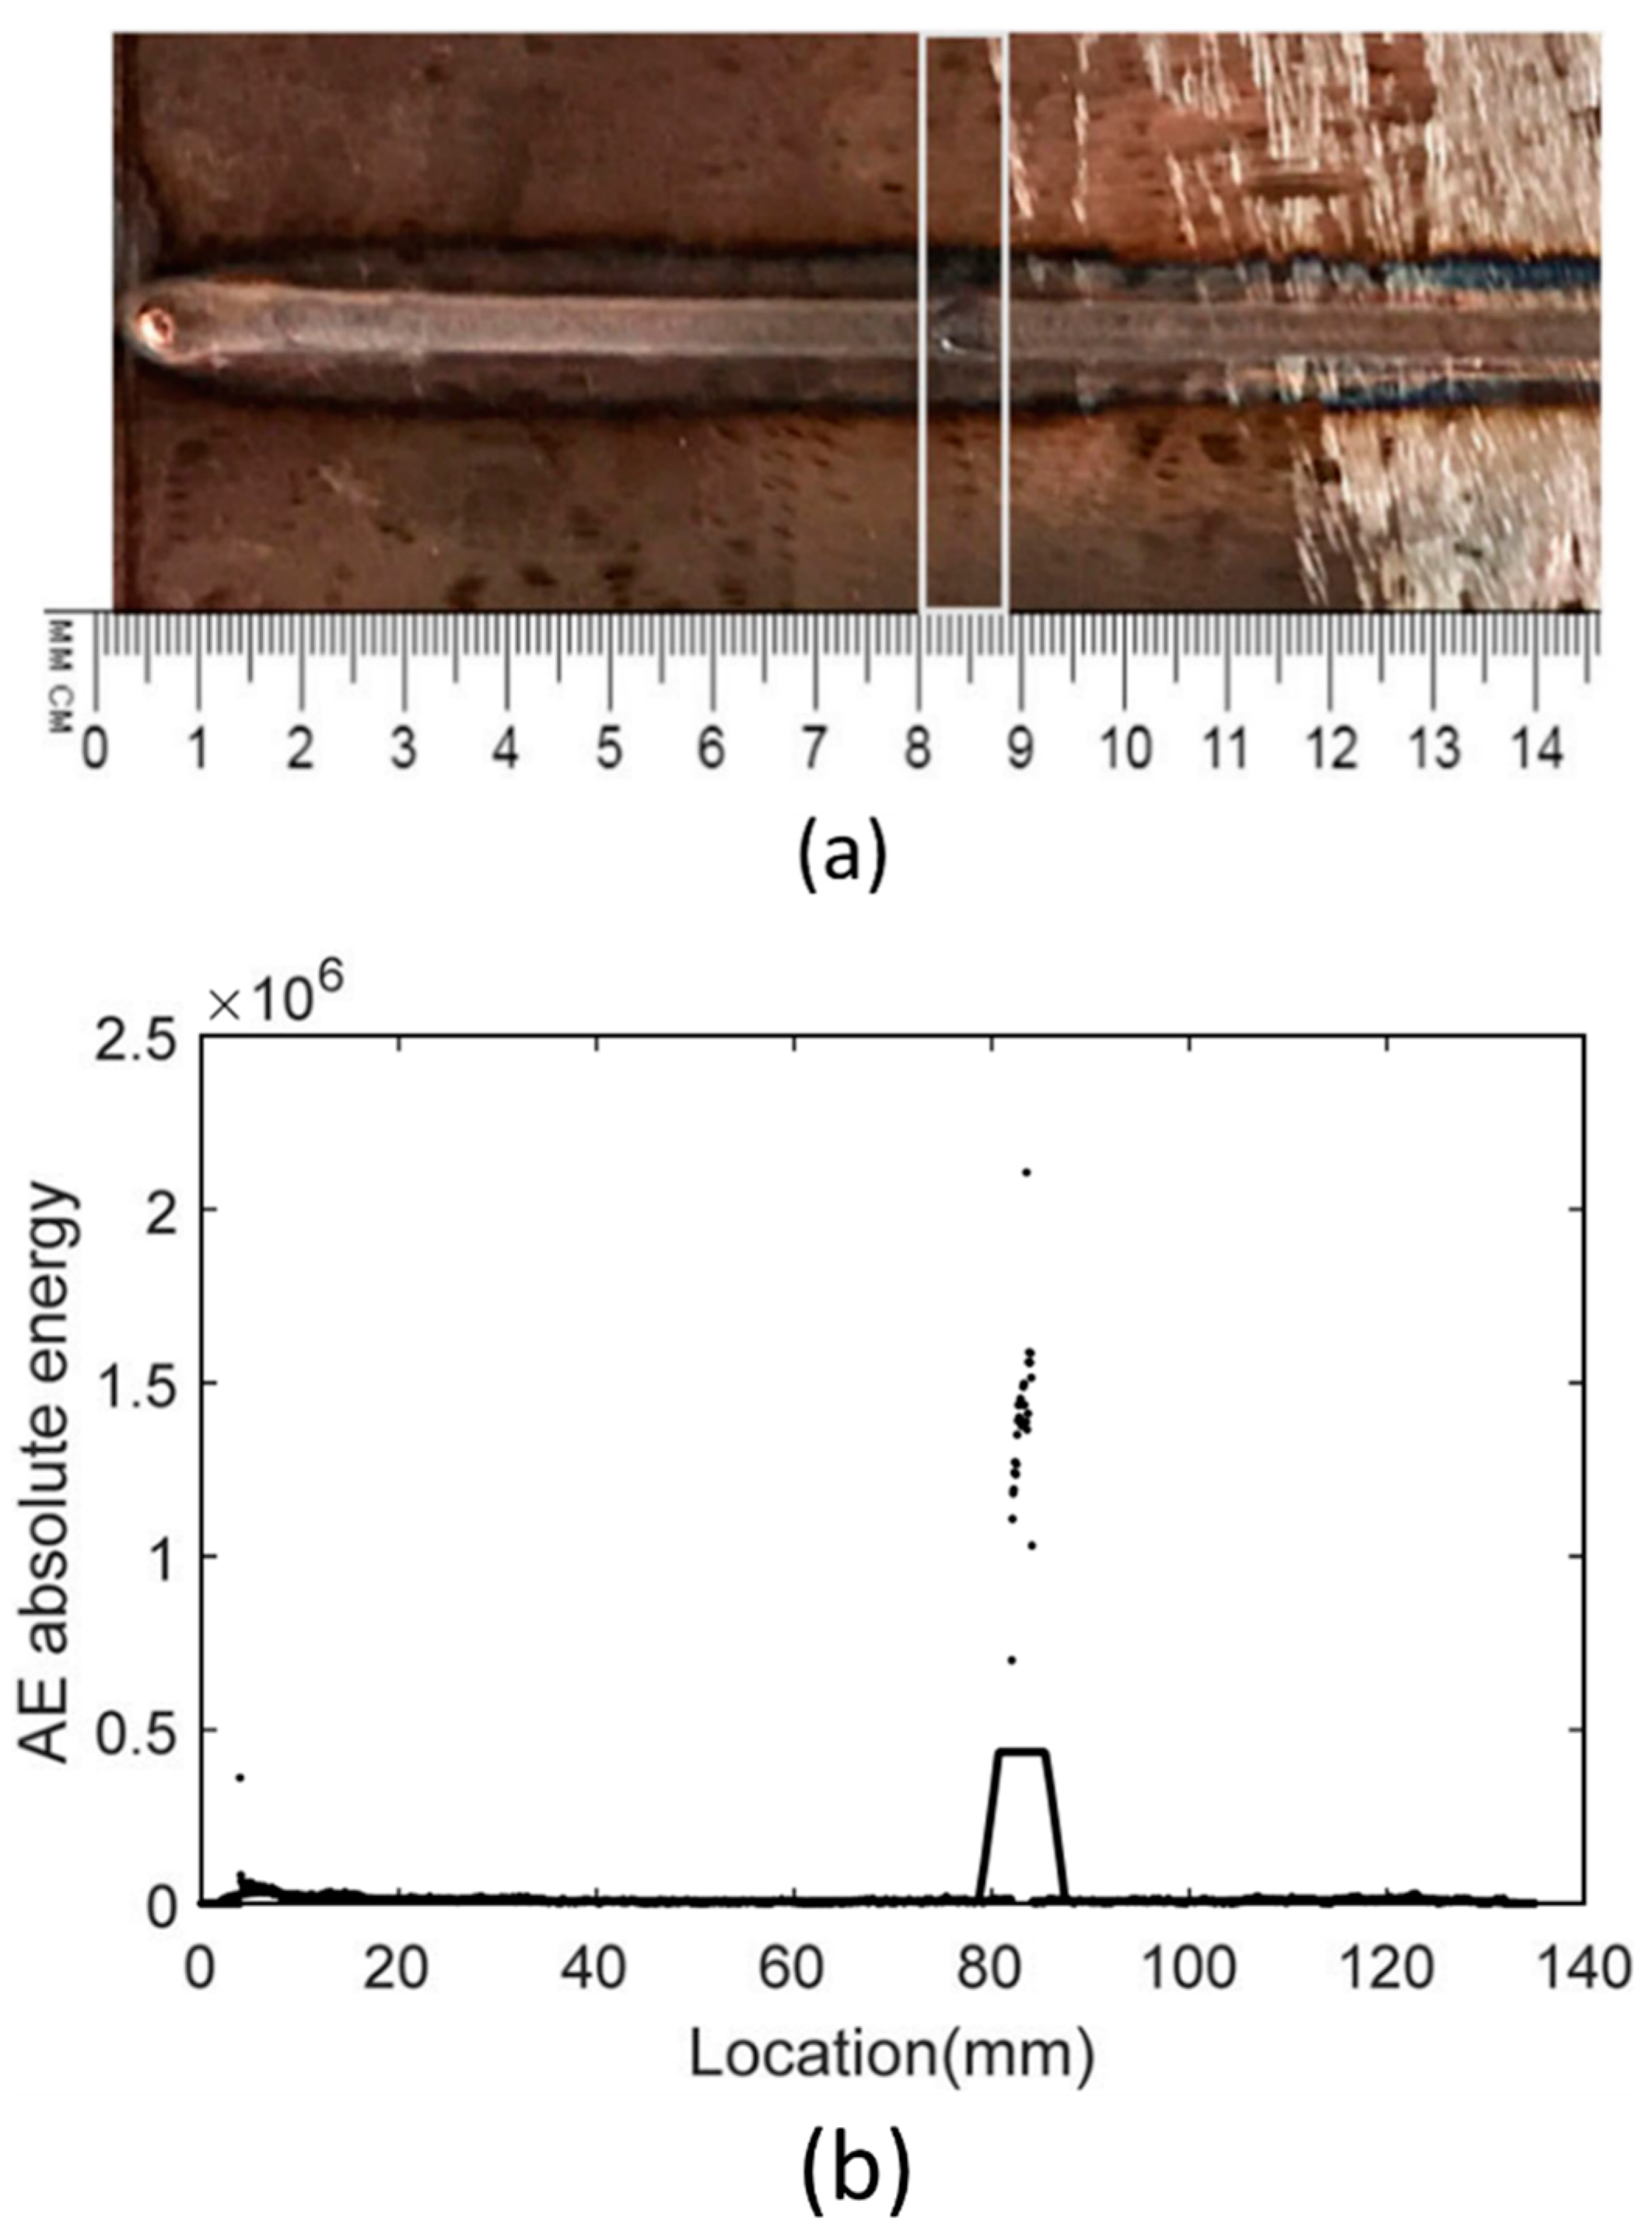
3. Acoustic Emission
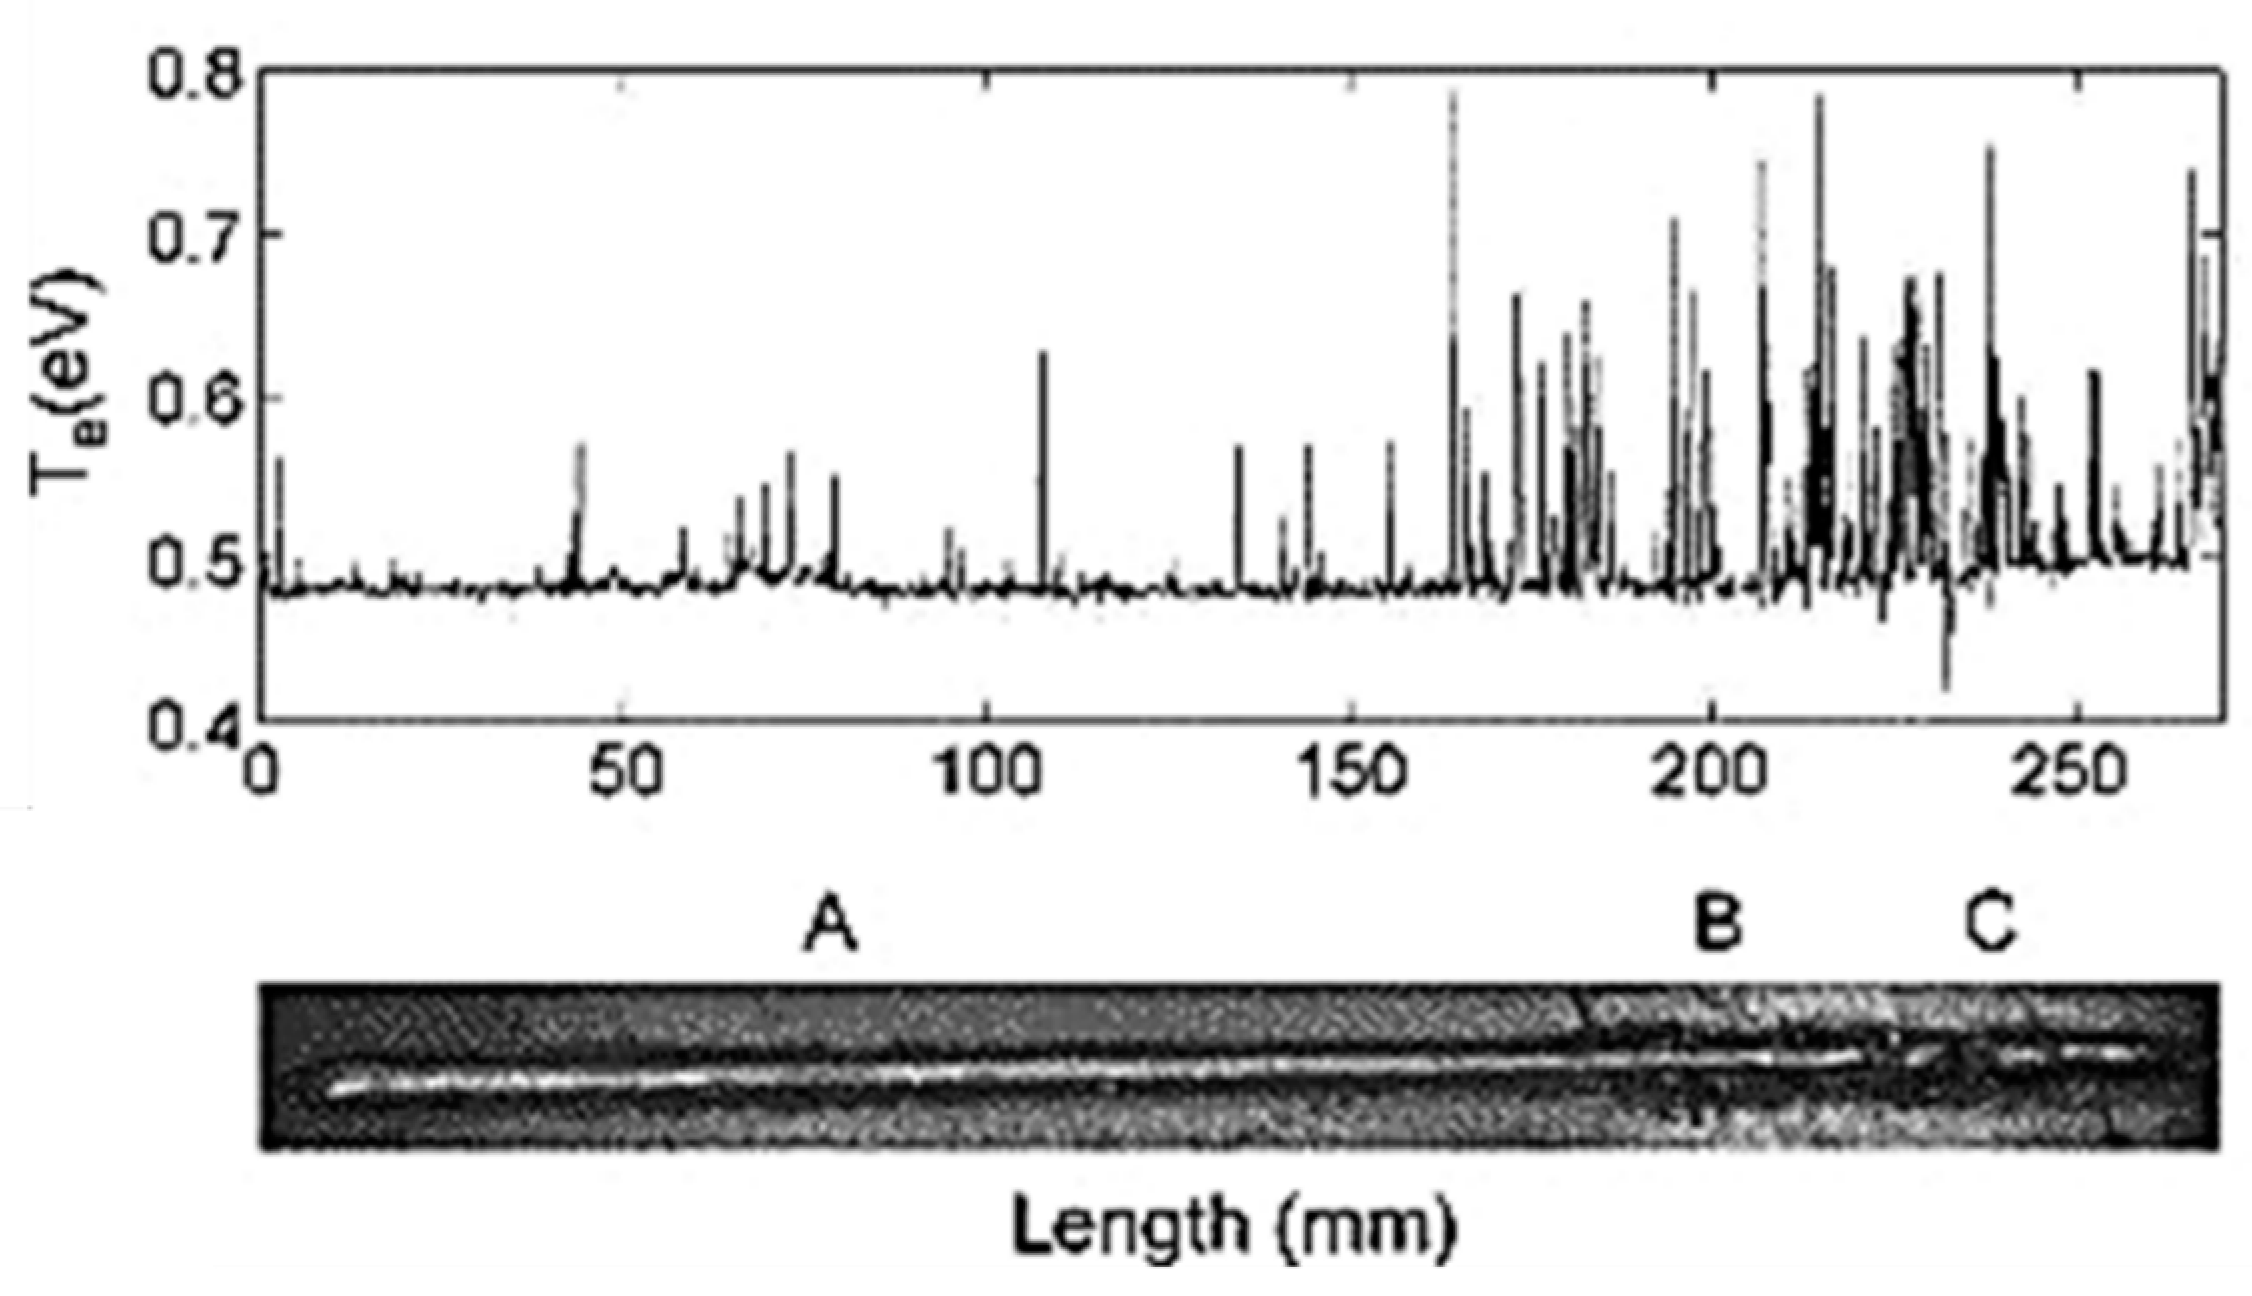
4. Optical Emission Spectroscopy
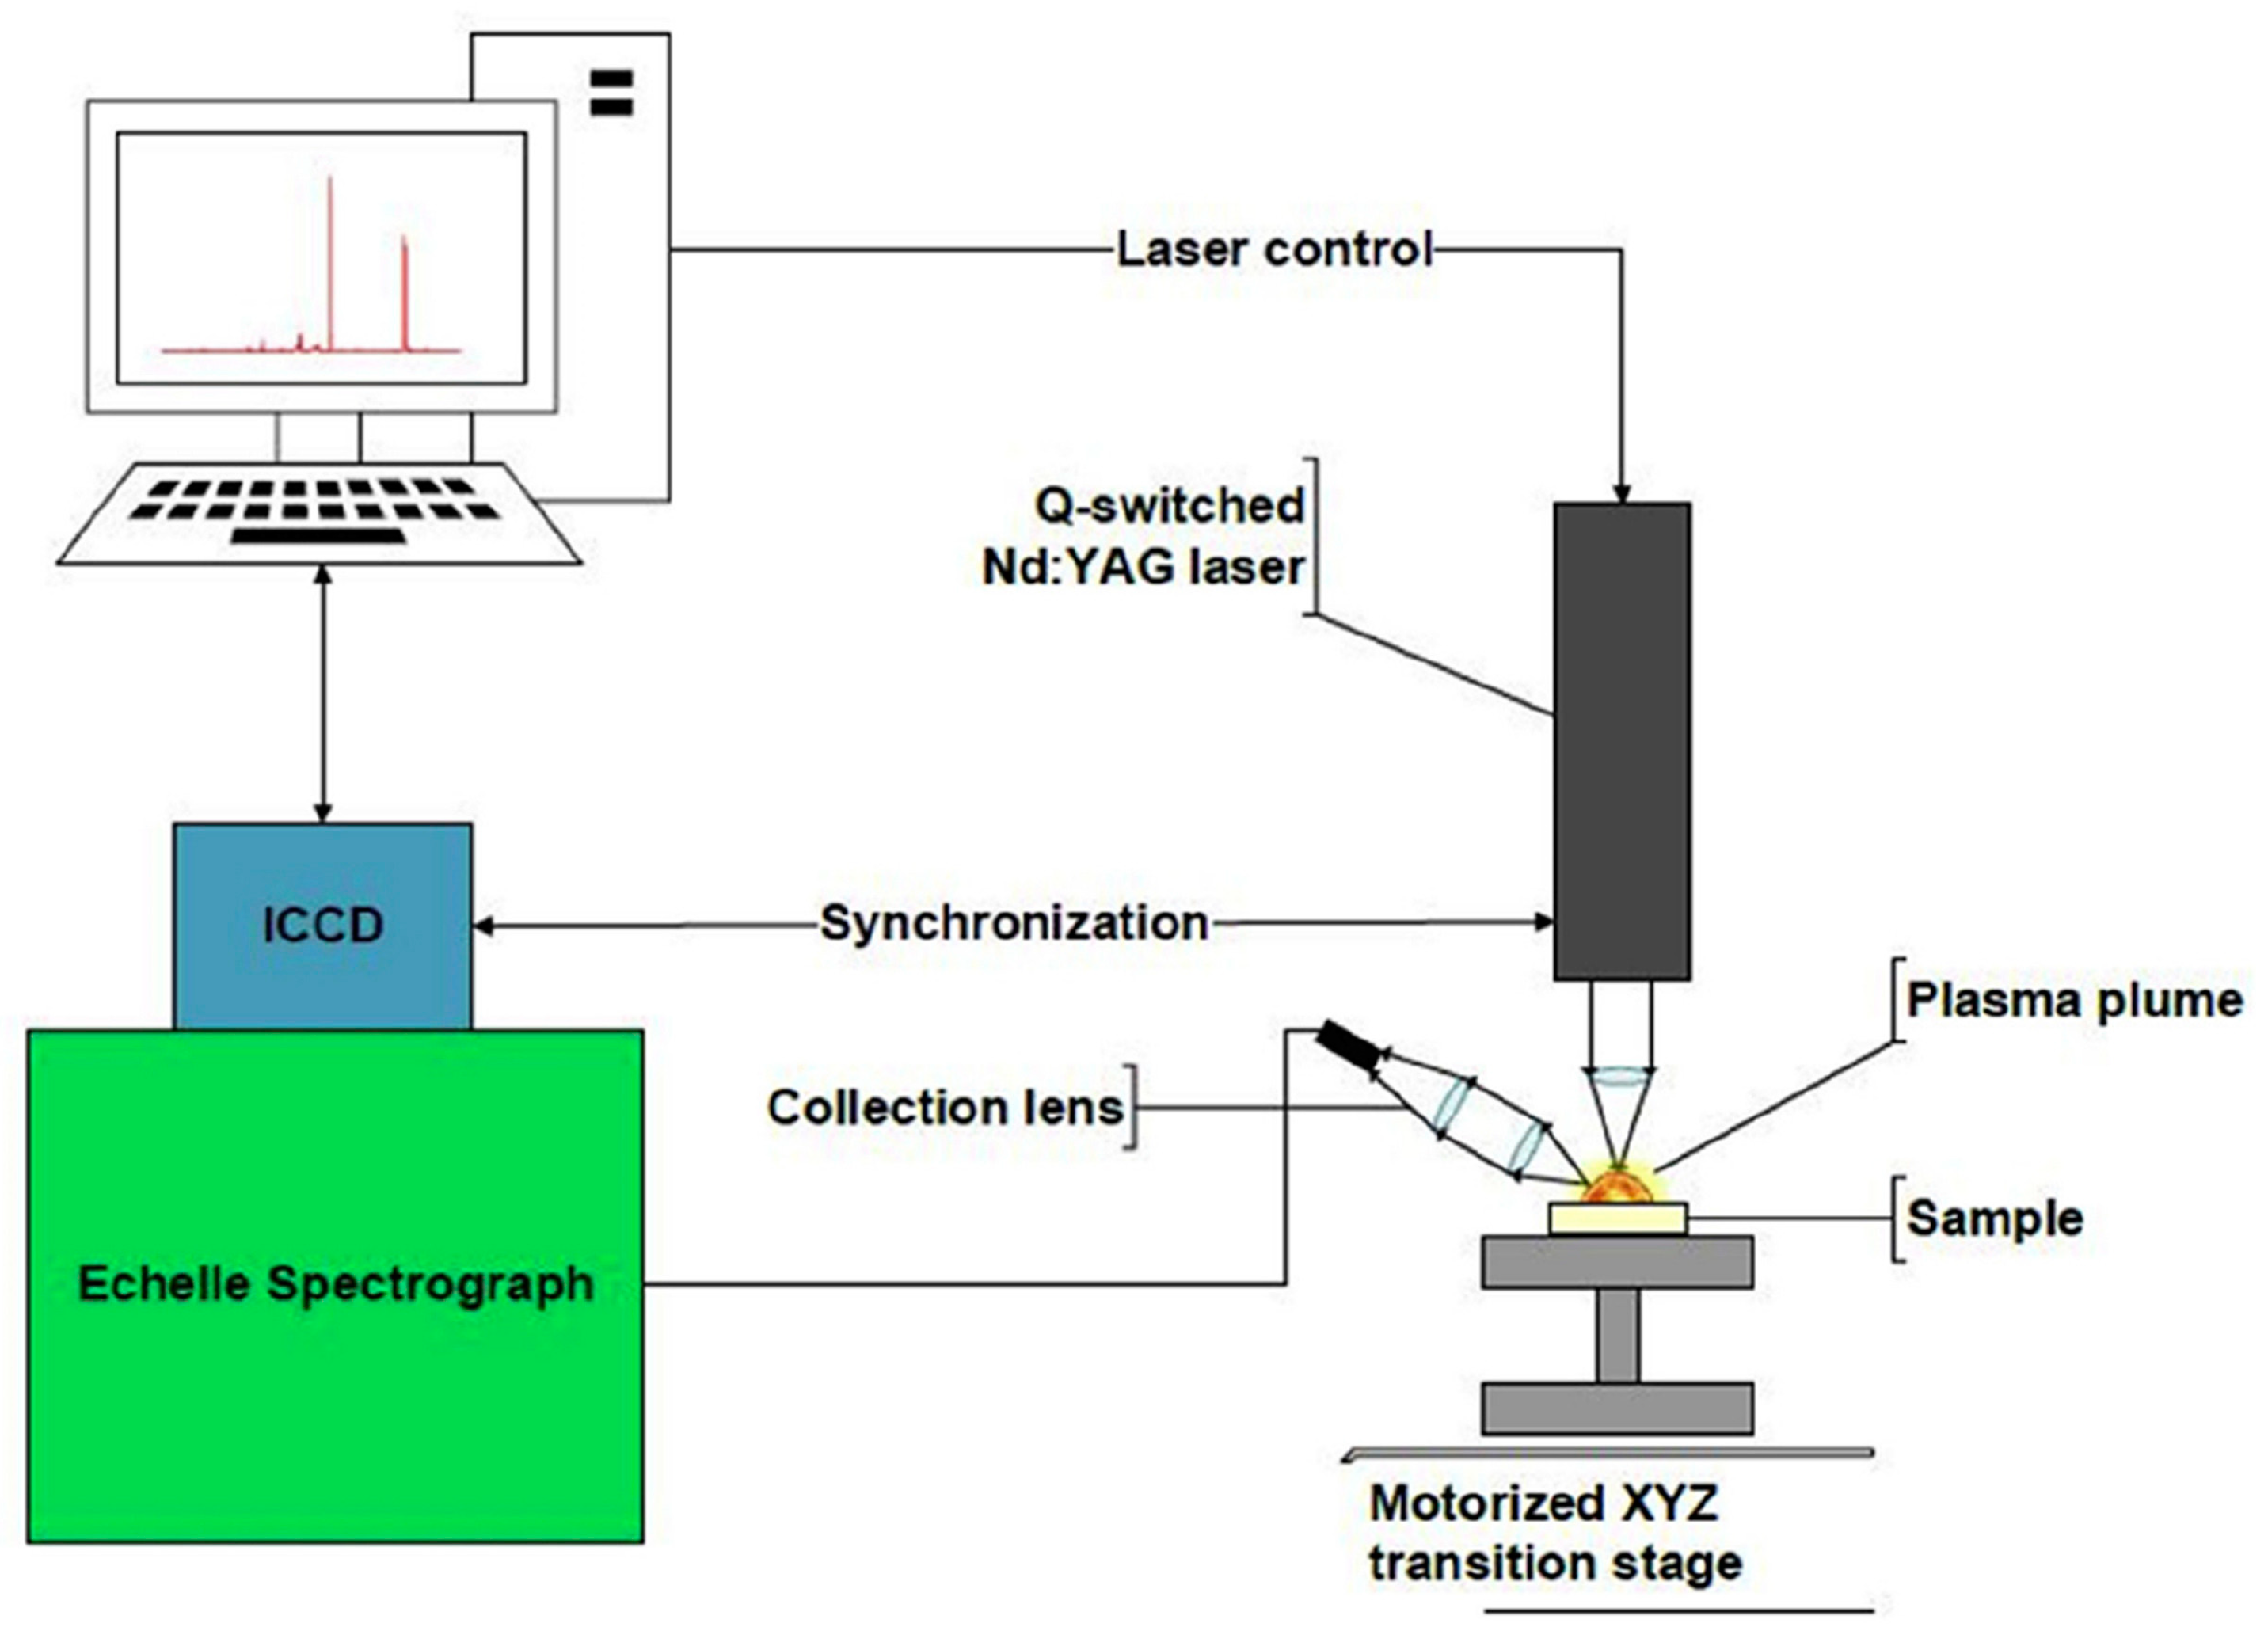
5. Laser-Induced Breakdown Spectroscopy
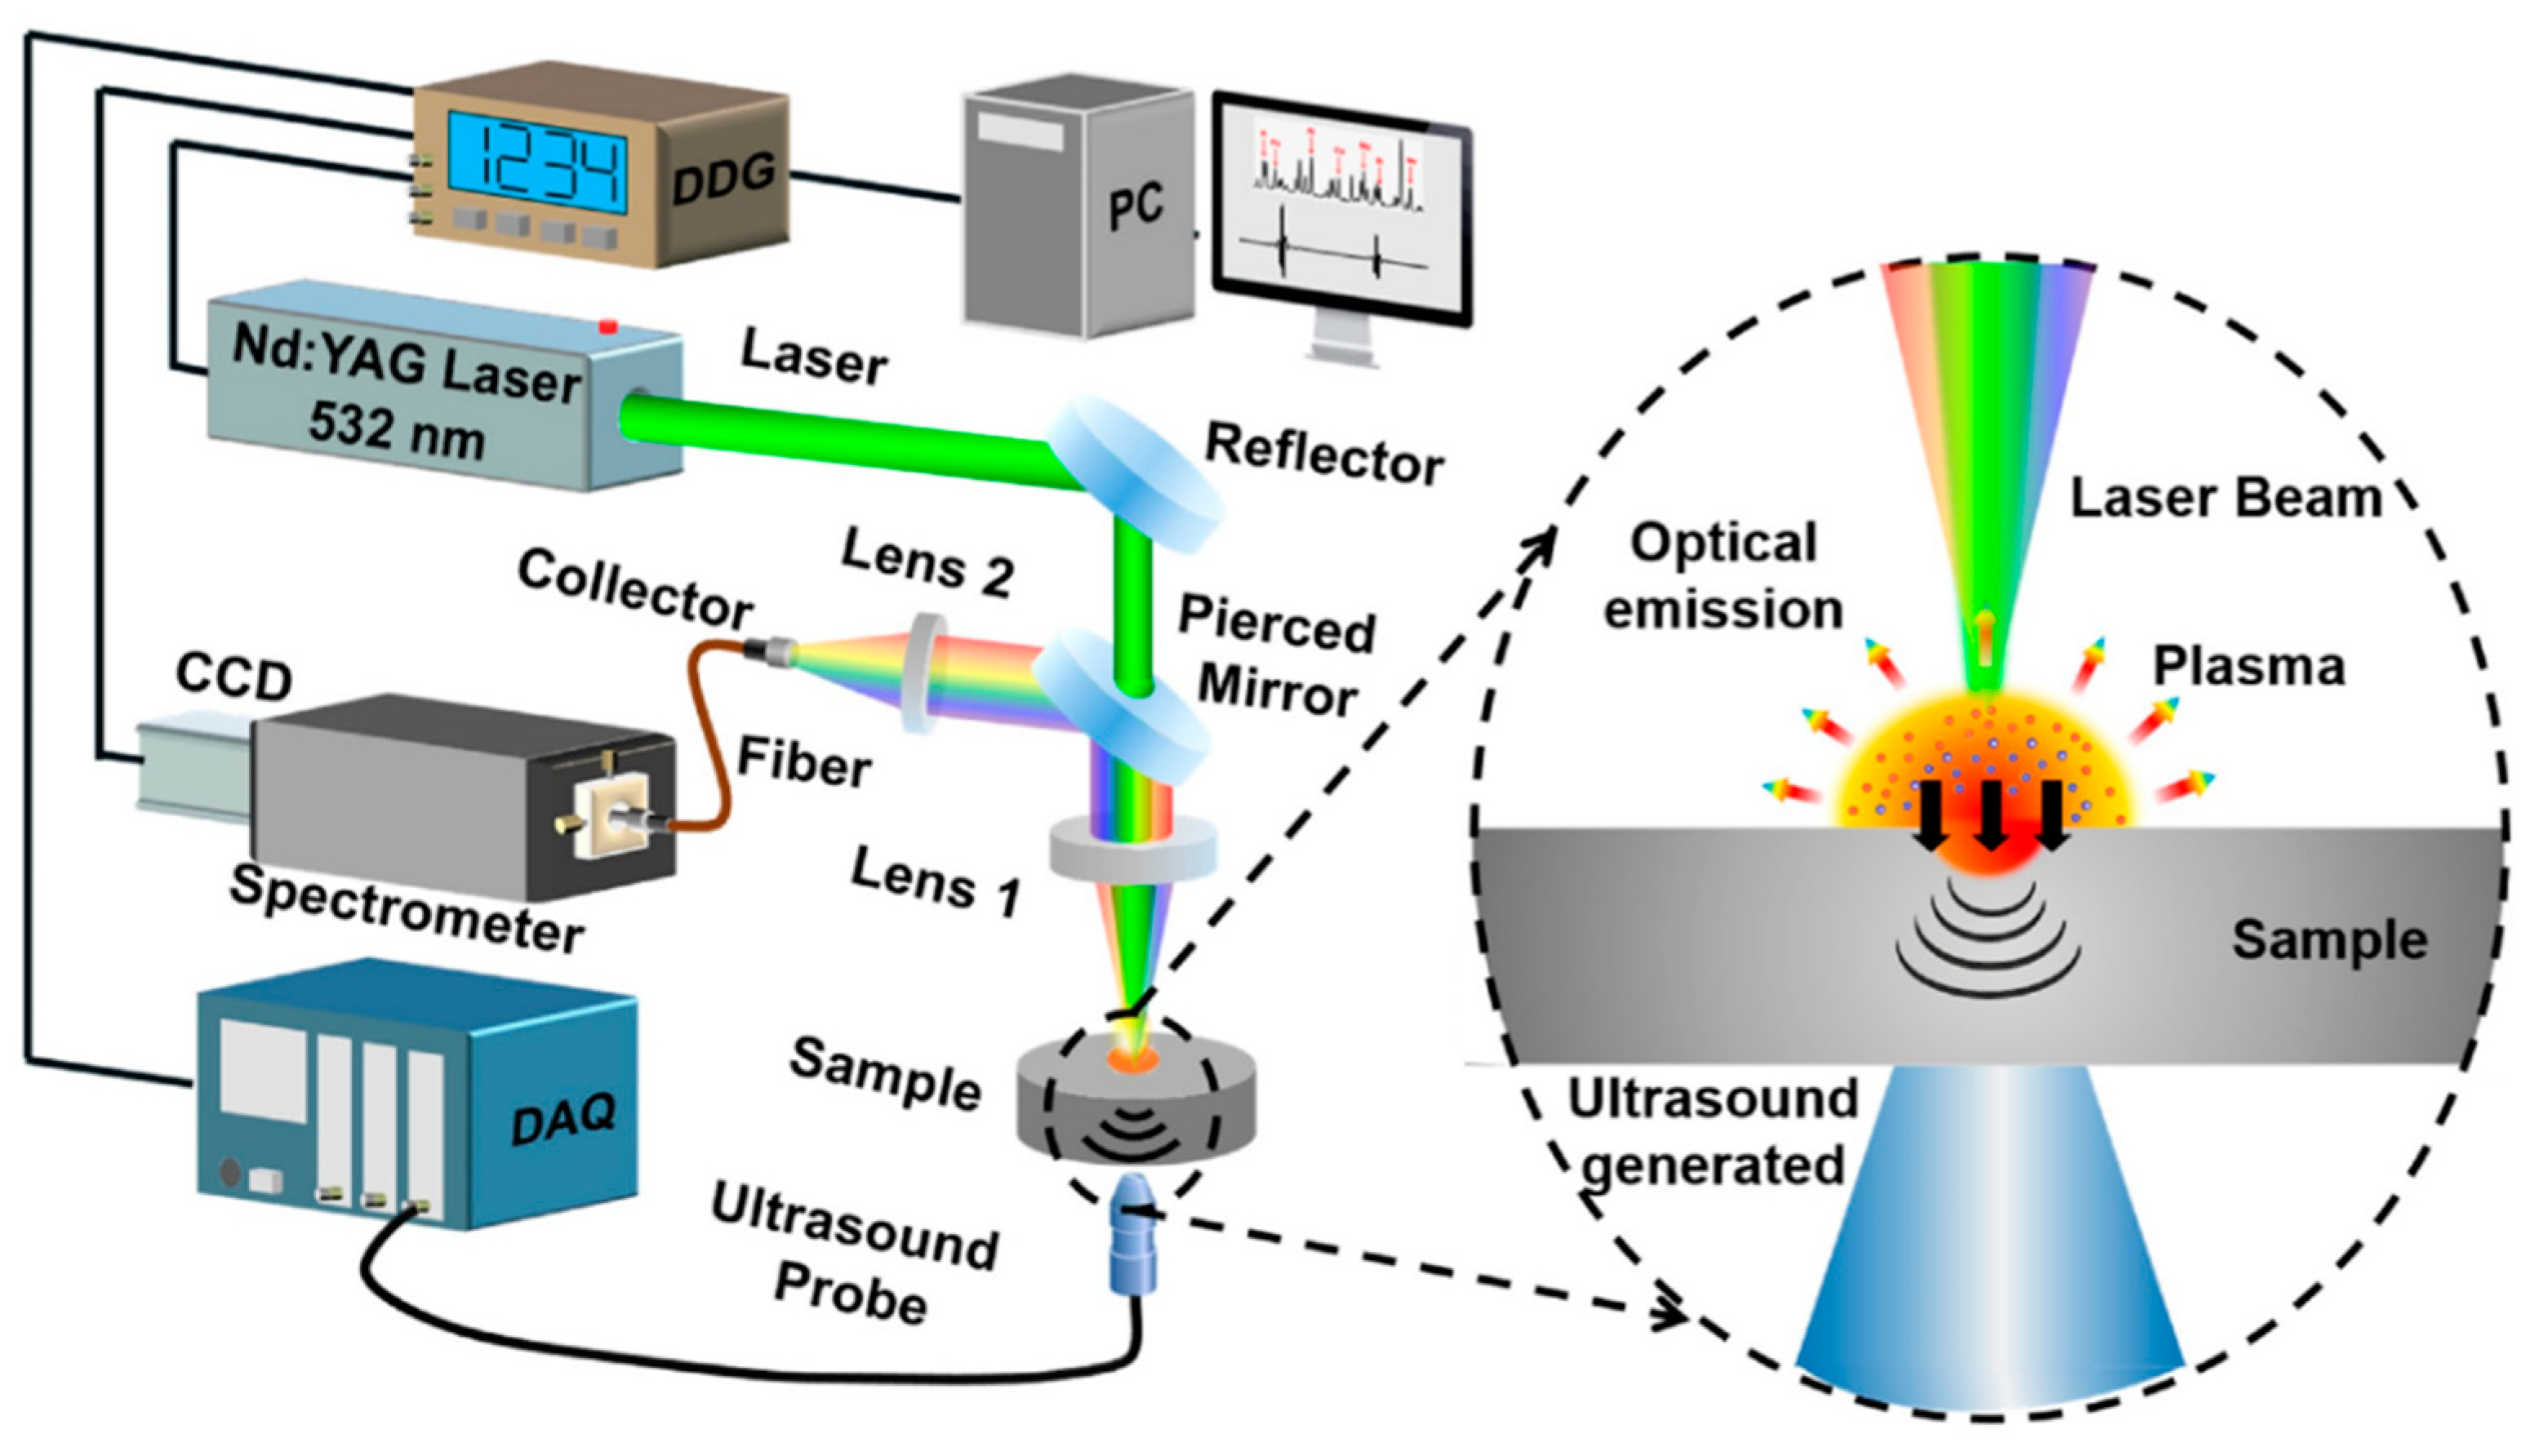
6. Laser Opto-Ultrasonic Dual Detection
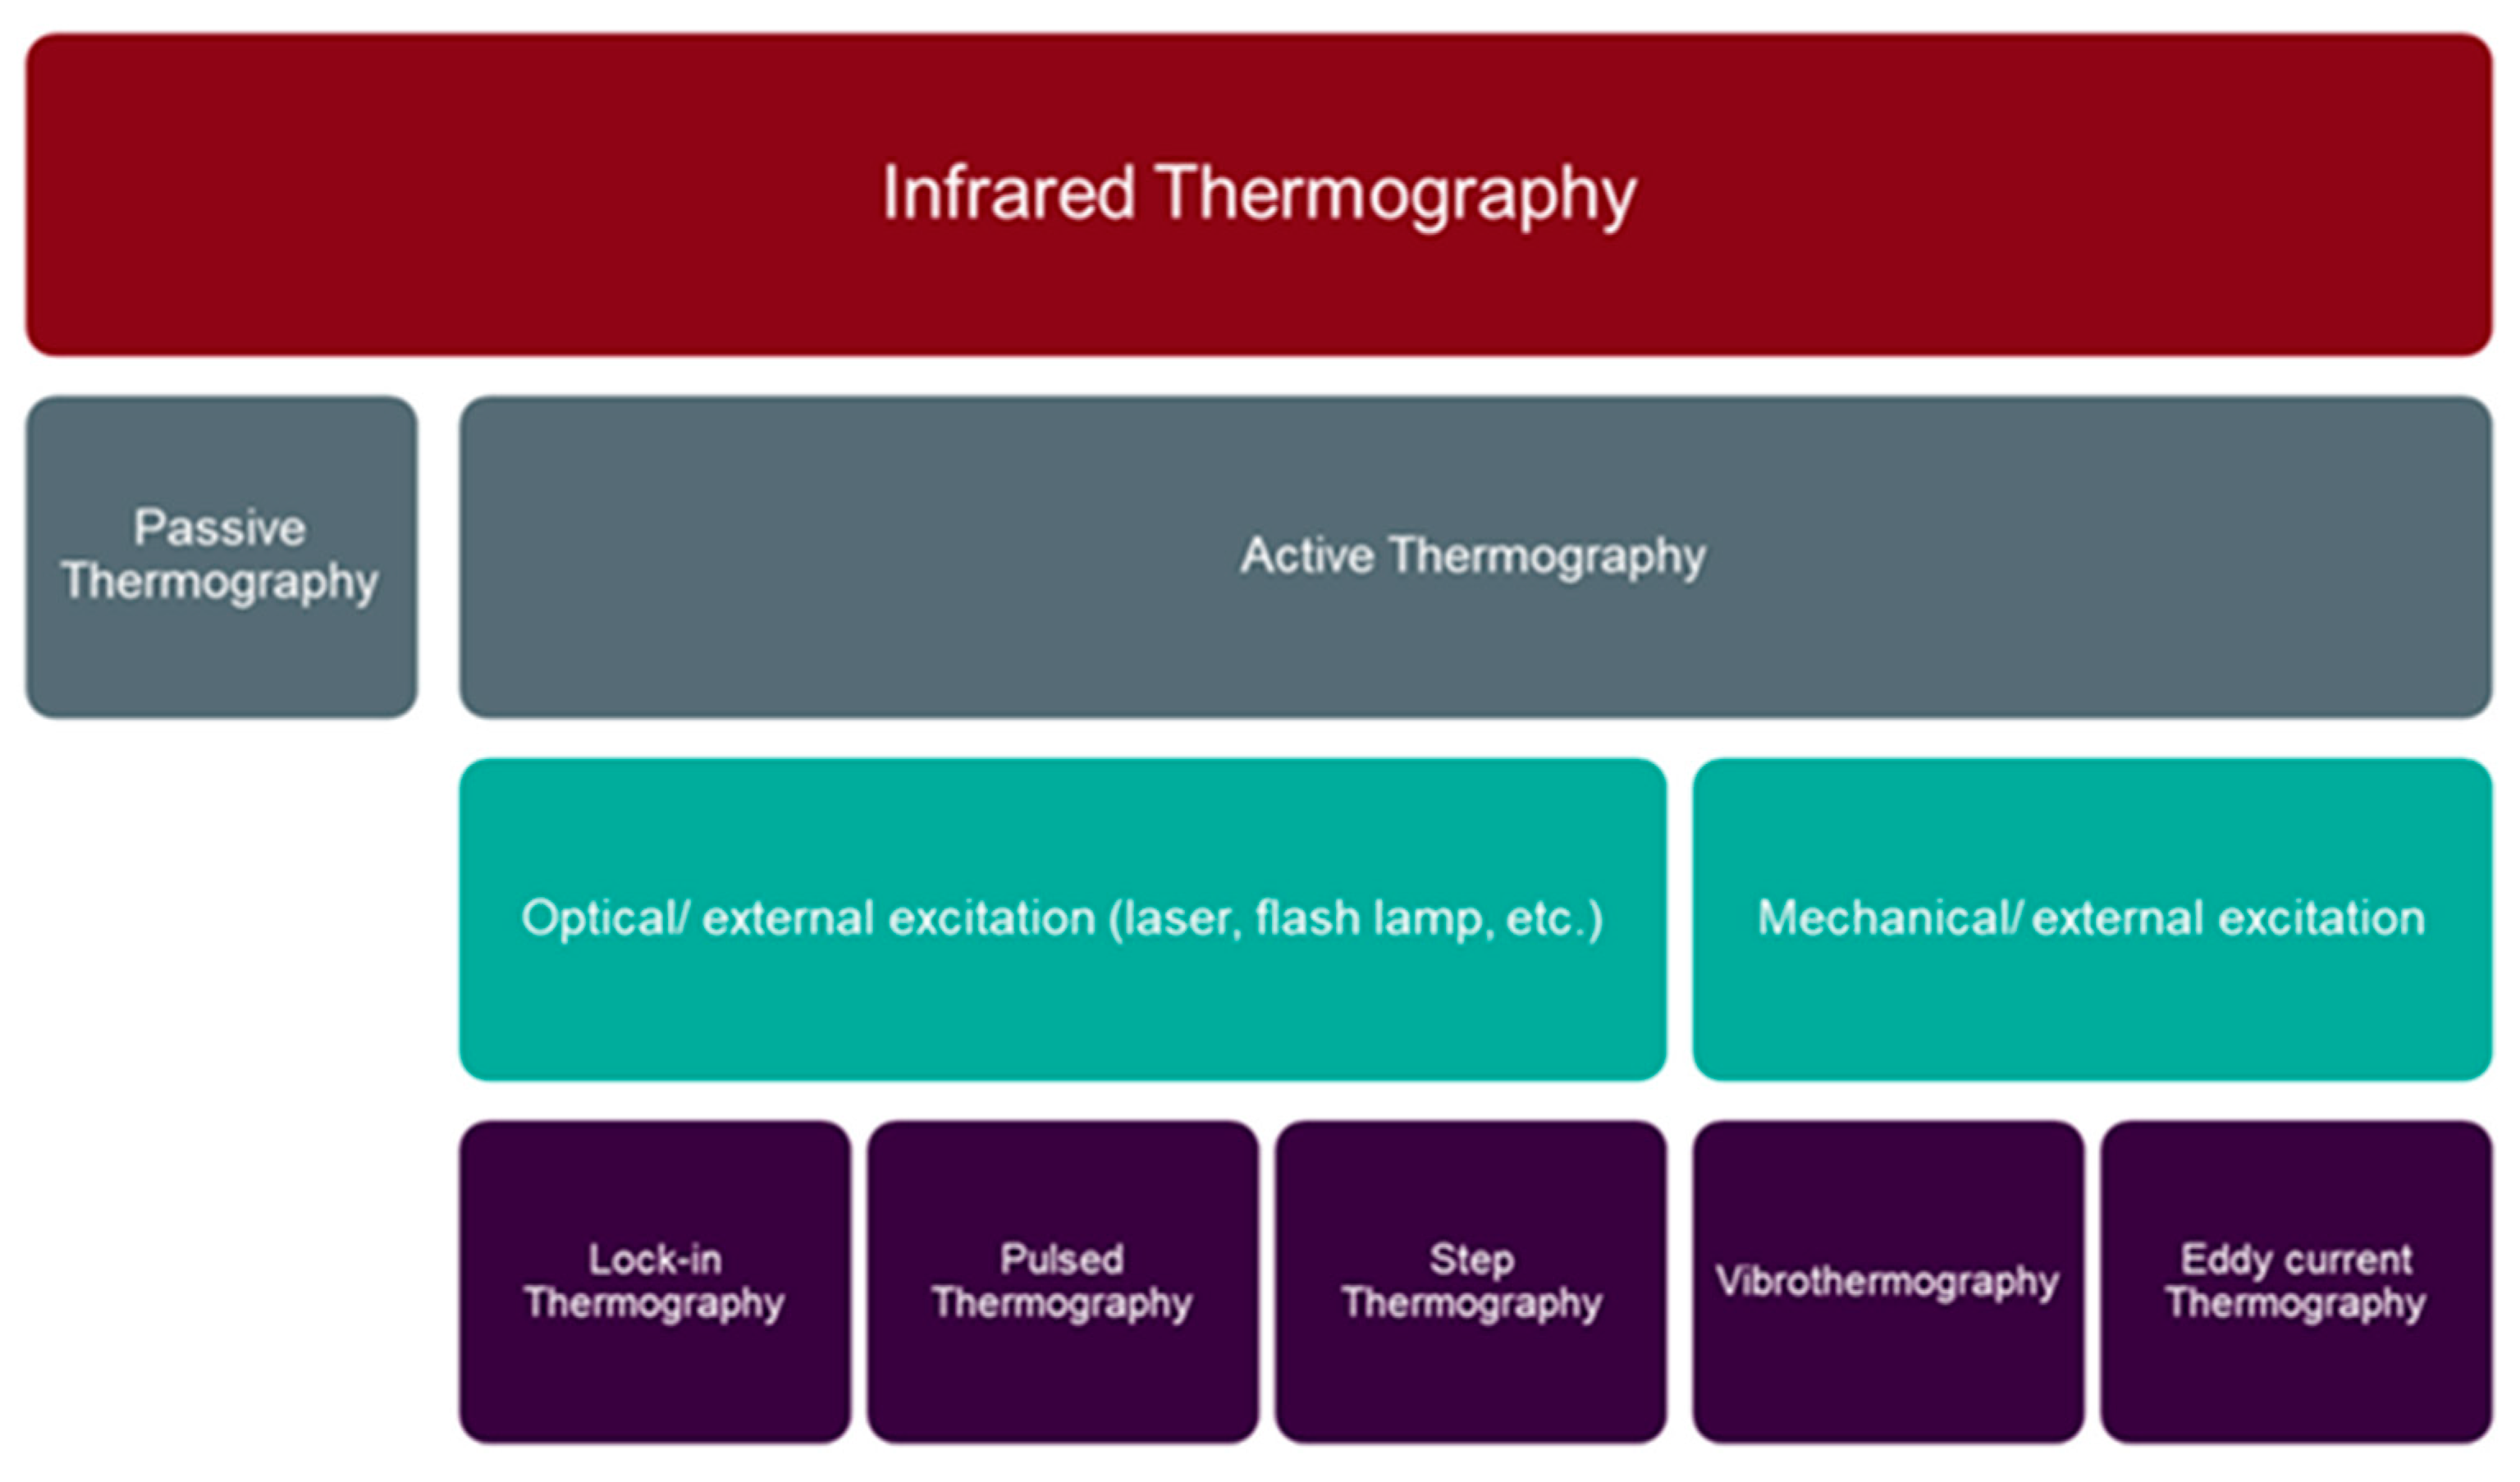
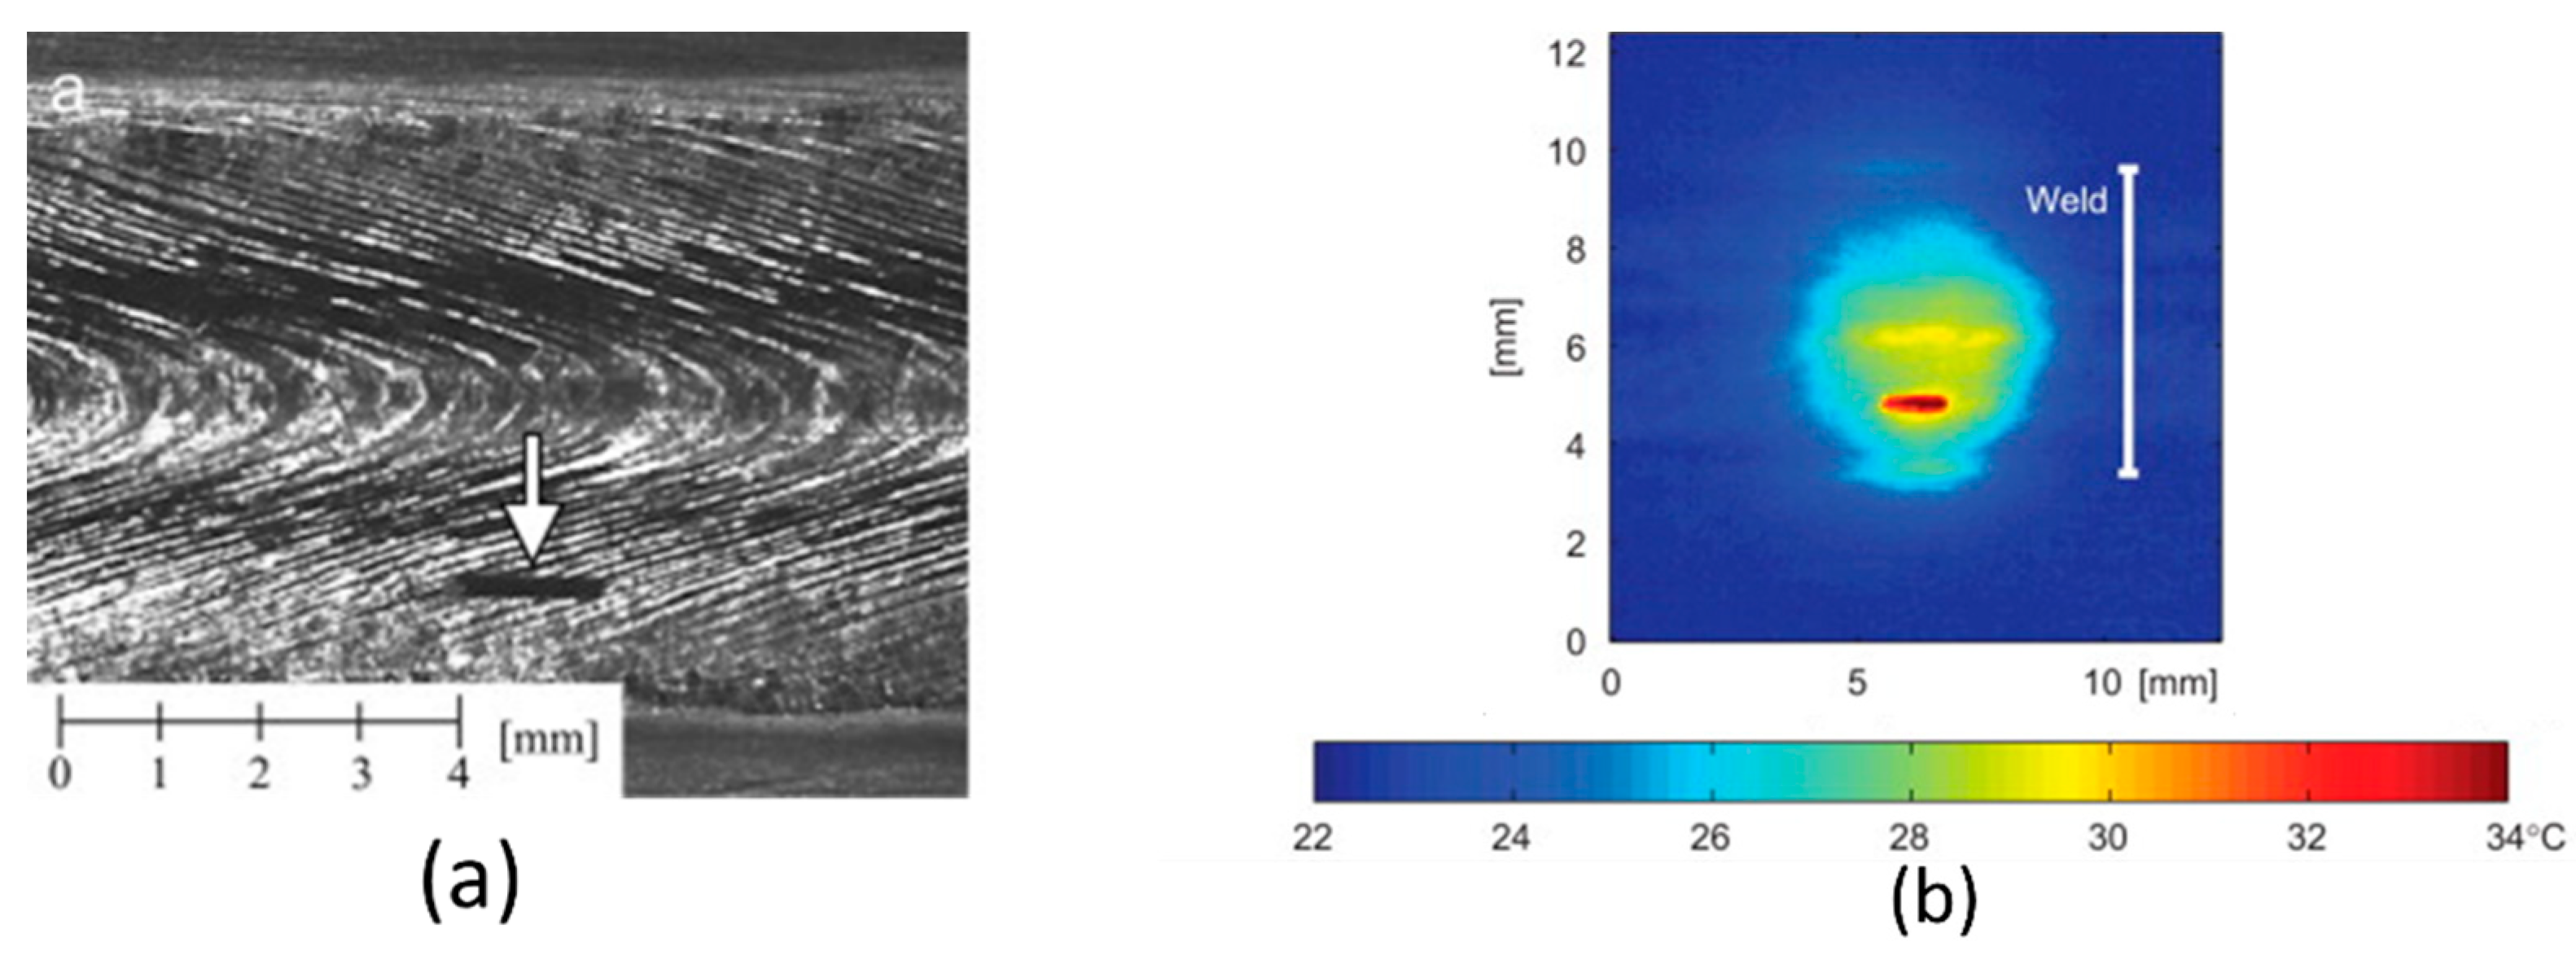
7. Thermography
8. Defect Detection by Monitoring WAAM and Fusion Welding Process Parameters
9. Summary and Conclusions
- LU is a fast technique and capable of detecting internal defects as small as 100 µm in WAAM and fusion welding. It requires no contact with the sample and can be implemented in harsh environments and also for the automation processes. However, LU vaporizes a small amount of the component under inspection.
- Acoustic emission is able to measure the soundwaves ranges from 150 up to 300 kHz during the manufacturing process. It is cost-effective and can be used for defect detection during WAAM and fusion welding. Since it is a passive technology, it cannot be used for offline monitoring. In addition, there is lack of knowledge on applying a membrane-free optical microphone for defect detection in WAAM and fusion welding.
- Laser induced breakdown spectroscopy is capable of acquiring elemental information of the sample and detecting defects such as porosity by means of assessing the chemical elements of the sample. Detecting other types of the defects in WAAM and fusion welding has not been investigated yet.
- Laser opto-ultrasonic dual detection can rapidly detect defects and elemental information at the same time during the manufacturing process without having contact with the sample.
- OES is a contactless technique and able to detect defects in situ. However, it is not appropriate for offline monitoring.
- Thermography is able to detect surface and subsurface defects and recognize flaws as small as 600 µm in WAAM and fusion welding. It requires no contact with the sample and can measure the thermophysical properties of the part online. It can be used as a signal for real-time closed-loop control systems, however, a heated sample and a proper machine learning algorithm for evaluation are required.
- Monitoring process parameters, such as voltage and current using DSOs or data acquisition systems enables real-time defect detection. These signals are fast and sensitive and suitable for real-time closed-loop control systems.
Author Contributions
Funding
Data Availability Statement
Acknowledgments
Conflicts of Interest
References
- Williams, S.W.; Martina, F.; Addison, A.C.; Ding, J.; Pardal, G.; Colegrove, P. Wire + Arc Additive Manufacturing. Mater. Sci. Technol. 2016, 32, 641–647. [Google Scholar] [CrossRef] [Green Version]
- Wu, B.; Pan, Z.; Ding, D.; Cuiuri, D.; Li, H.; Xu, J.; Norrish, J. A review of the wire arc additive manufacturing of metals: Properties, defects and quality improvement. J. Manuf. Process. 2018, 35, 127–139. [Google Scholar] [CrossRef]
- ASTM D907-15; Standard Terminology for Additive Manufacturing Technologies. ASTM: West Conshohocken, PA, USA, 2013; pp. 10–12. [CrossRef]
- Mehnen, J.; Ding, J.; Lockett, H.; Kazanas, P. Design study for wire and arc additive manufacture. Int. J. Prod. Dev. 2014, 19, 2–20. [Google Scholar] [CrossRef]
- Rodrigues, T.A.; Duarte, V.; Miranda, R.M.; Santos, T.G.; Oliveira, J.P. Current Status and Perspectives on Wire and Arc Additive Manufacturing (WAAM). Materials 2019, 12, 1121. [Google Scholar] [CrossRef] [Green Version]
- Köhler, M.; Fiebig, S.; Hensel, J.; Dilger, K. Wire and Arc Additive Manufacturing of Aluminum Components. Metals 2019, 9, 608. [Google Scholar] [CrossRef] [Green Version]
- Knezović, N.; Topić, A. Wire and Arc Additive Manufacturing (WAAM)—A New Advance in Manufacturing. In New Technologies, Development and Applications; Lecture Notes in Networks and Systems; Springer International Publishing: New York, NY, USA, 2019; pp. 65–71. ISBN 978-3-319-90892-2. [Google Scholar]
- He, X.; Wang, T.; Wu, K.; Liu, H. Automatic defects detection and classification of low carbon steel WAAM products using improved remanence/magneto-optical imaging and cost-sensitive convolutional neural network. Measurement 2020, 173, 108633. [Google Scholar] [CrossRef]
- Lopez, A.; Bacelar, R.; Pires, I.; Santos, T.G.; Sousa, J.P.; Quintino, L. Non-destructive testing application of radiography and ultrasound for wire and arc additive manufacturing. Addit. Manuf. 2018, 21, 298–306. [Google Scholar] [CrossRef]
- Soštarić, D.; Vinko, D.; Žagar, D.; Samardžić, I. Reliability of welding parameters monitoring system. Strojarstvo 2010, 52, 217–226. [Google Scholar]
- Kah, P.; Mvola, B.; Martikainen, J.; Suoranta, R. Real Time Non-Destructive Testing Methods of Welding. Adv. Mater. Res. 2014, 933, 109–116. [Google Scholar] [CrossRef]
- Javadi, Y.; MacLeod, C.N.; Pierce, S.; Gachagan, A.; Lines, D.; Mineo, C.; Ding, J.; Williams, S.; Vasilev, M.; Mohseni, E.; et al. Ultrasonic phased array inspection of a Wire + Arc Additive Manufactured (WAAM) sample with intentionally embedded defects. Addit. Manuf. 2019, 29, 100806. [Google Scholar] [CrossRef]
- Yusof, F.; Jamaluddin, M. Welding Defects and Implications on Welded Assemblies. Compr. Mater. Process 2014, 6, 125–134. [Google Scholar] [CrossRef]
- Thornton, M.; Han, L.; Shergold, M. Progress in NDT of resistance spot welding of aluminium using ultrasonic C-scan. NDT E Int. 2012, 48, 30–38. [Google Scholar] [CrossRef]
- Nomura, K.; Otaki, S.; Kita, R.; Asai, S. In-situ detection of weld defect during the welding process by laser ultrasonic technique. Proc. Mtgs. Acoust. 2019, 38, 030016. [Google Scholar] [CrossRef]
- Honarvar, F.; Varvani-Farahani, A. A review of ultrasonic testing applications in additive manufacturing: Defect evaluation, material characterization, and process control. Ultrasonics 2020, 108, 106227. [Google Scholar] [CrossRef]
- Bacelar, R. Evaluation of WAAM Parts by NDT. Master’s Thesis, Instituto Superior Técnico, Lisboa, Portugal, 2017. [Google Scholar]
- Faramarzi, F.; Motamedi, M. Image processing for radiographic films of weld inspection. In Proceedings of the International Conference on Image Processing, Computer Vision, and Pattern Recognition (IPCV), Las Vegas, NV, USA, 18–21 July 2011; pp. 337–343. [Google Scholar]
- The MathWorks Inc: MATLAB. Available online: https://de.mathworks.com/company.html?s_tid=hp_ff_a_company (accessed on 17 August 2021).
- Seow, C.E.; Zhang, J.; Coules, H.E.; Wu, G.; Jones, C.; Ding, J.; Williams, S. Effect of crack-like defects on the fracture behaviour of Wire + Arc Additively Manufactured nickel-base Alloy 718. Addit. Manuf. 2020, 36, 101578. [Google Scholar] [CrossRef]
- Wang, J.; Cui, Y.; Liu, C.; Li, Z.; Wu, Q.; Fang, D. Understanding internal defects in Mo fabricated by wire arc additive manufacturing through 3D computed tomography. J. Alloy Compd. 2020, 840, 155753. [Google Scholar] [CrossRef]
- Bento, J.B.; Lopez, A.; Pires, I.; Quintino, L.; Santos, T.G. Non-destructive testing for wire + arc additive manufacturing of aluminium parts. Addit. Manuf. 2019, 29, 100782. [Google Scholar] [CrossRef]
- Lopez, A.B.; Santos, J.; Sousa, J.P.; Santos, T.G.; Quintino, L. Phased Array Ultrasonic Inspection of Metal Additive Manufacturing Parts. J. Nondestruct. Eval. 2019, 38, 62. [Google Scholar] [CrossRef]
- Chabot, A.; Laroche, N.; Carcreff, E.; Rauch, M.; Hascoët, J.-Y. Towards defect monitoring for metallic additive manufacturing components using phased array ultrasonic testing. J. Intell. Manuf. 2019, 31, 1191–1201. [Google Scholar] [CrossRef]
- Lukacs, P.; Davis, G.; Stratoudaki, T.; Williams, S.; MacLeod, C.N.; Gachagan, A. Remote Ultrasonic Imaging of a Wire Arc Additive Manufactured Ti-6AI-4V Component using Laser Induced Phased Array. In Proceedings of the 2021 IEEE International Instrumentation and Measurement Technology Conference (I2MTC), Glasgow, UK, 17–20 May 2021; pp. 1–6. [Google Scholar] [CrossRef]
- Shipway, N.; Barden, T.; Huthwaite, P.; Lowe, M. Automated defect detection for Fluorescent Penetrant Inspection using Random Forest. NDT E Int. 2018, 101, 113–123. [Google Scholar] [CrossRef]
- Company TPA KKS GmbH. Telephone Communication with TPA KKS GmbH Austria. Available online: https://www.tpa-kks.at/home/ (accessed on 27 March 2022).
- Ma, Y.; Hu, Z.; Tang, Y.; Ma, S.; Chu, Y.; Li, X.; Luo, W.; Guo, L.; Zeng, X.; Lu, Y. Laser opto-ultrasonic dual detection for simultaneous compositional, structural, and stress analyses for wire + arc additive manufacturing. Addit. Manuf. 2019, 31, 100956. [Google Scholar] [CrossRef]
- Ma, Y.; Hu, X.; Hu, Z.; Sheng, Z.; Ma, S.; Chu, Y.; Wan, Q.; Luo, W.; Guo, L. Simultaneous Compositional and Grain Size Measurements Using Laser Opto-Ultrasonic Dual Detection for Additive Manufacturing. Materials 2020, 13, 2404. [Google Scholar] [CrossRef]
- Stefano, Z.; Christian, S.; Sommerhuber, R. Akustische Überwachung für die Lasermaterialbearbeitung. pp. 36–38. Available online: https://xarion.com/de/medien/publikationen/process-control/107-akustische-%C3%BCberwachung-f%C3%BCr-die-lasermaterialbearbeitung (accessed on 12 December 2021).
- Company XARION Laser Acoustics GmbH Germany. Email Communication with XARION Laser Acoustics GmbH. 2021. Available online: https://xarion.com/en/ (accessed on 27 March 2022).
- Company SONOTEC GmbH. Personal Communication with SONOTEC GmbH Germany. Available online: https://www.sonotec.de/ (accessed on 27 March 2022).
- Chang, M.K.; Lin, Z.L.; Jeng, J.J. The Study on Defects of 6-Inch Cylinder by Electro Magnetic Acoustic Transducer (EMAT). Adv. Sci. Lett. 2011, 4, 1062–1066. [Google Scholar] [CrossRef]
- Santos, T.; Vilaça, P.; Miranda, R. Electrical conductivity field analysis for evaluation of FSW joints in AA6013 and AA7075 alloys. J. Mater. Process. Technol. 2011, 211, 174–180. [Google Scholar] [CrossRef]
- Lindgren, E. Detection, 3-D positioning, and sizing of small pore defects using digital radiography and tracking. EURASIP J. Adv. Signal Process. 2014, 2014, 9. [Google Scholar] [CrossRef] [Green Version]
- Company IRISNDT Real Time Radiography (RTR). Canada. Available online: https://www.irisndt.com/us/contact/ (accessed on 5 November 2021).
- Shedlock, D.; Edwards, T.; Toh, C.; Thompson, D.O.; Chimenti, D.E. X-ray backscatter imaging for aerospace applications. AIP Conf. Proc. 2011, 1335, 509. [Google Scholar] [CrossRef]
- Sun, W.; Brown, S.B.; Leach, R.K. An Overview of Industrial X-ray Computed Tomography. Available online: https://eprintspublications.npl.co.uk/5385/ (accessed on 19 November 2021).
- Mireles, J.; Ridwan, S.; Morton, P.A.; Hinojos, A.; Wicker, R.B. Analysis and correction of defects within parts fabricated using powder bed fusion technology. Surf. Topogr. Metrol. Prop. 2015, 3, 034002. [Google Scholar] [CrossRef]
- du Plessis, A.; le Roux, S.G.; Els, J.; Booysen, G.; Blaine, D.C. Application of microCT to the non-destructive testing of an additive manufactured titanium component. Case Stud. Nondestruct. Test. Eval. 2015, 4, 1–7. [Google Scholar] [CrossRef] [Green Version]
- Company Volton GmbH. Telephone Communication with Volton GmbH. Available online: https://volton.at/ (accessed on 27 March 2022).
- Madhvacharyula, A.S.; Pavan, A.V.S.; Gorthi, S.; Chitral, S.; Venkaiah, N.; Kiran, D.V. In situ detection of welding defects: A review. Weld. World 2022, 66, 611–628. [Google Scholar] [CrossRef]
- Heillier, C.J. Handbook of Nondestructive Evaluation 4.0; The McGraw-Hill Companies, Inc.: New York, NY, USA, 2003. [Google Scholar]
- Klein, M.B.; Bacher, G.D. Design and engineering of photorefractive materials for use in adaptive laser ultrasonic receivers. Int. Soc. Opt. Photonics 1998, 3263, 96–101. [Google Scholar] [CrossRef]
- Kruger, S.E.; Moreau, A.; Bescond, C.; Monchalin, J.P. Real-time sensing of metallurgical transformations by laser-ultrasound. In Proceedings of the 16th World Conference on Nondestructive Testing, Montreal, QC, Canada, 30 August–3 September 2004. [Google Scholar]
- Laser-Ultraschall-LUS. Available online: https://www.recendt.at/de/LUS.html (accessed on 1 November 2021).
- Monchalin, J.-P. Laser-ultrasonics: Principles and industrial applications. In Ultrasonic and Advanced Methods for Nondestructive Testing and Material Characterization; World Scientific: Singapore, 2007; pp. 79–115. [Google Scholar] [CrossRef] [Green Version]
- Klein, M.B.; Ansari, H. Signal processing methods for non-destructive evaluation using ultrasonics. NDT E Int. 1998, 31, 93–97. [Google Scholar]
- Ganjei, J. Advantages and Disadvantages. Print. Circuit Fabr. 1997, 20, 1–36. [Google Scholar] [CrossRef] [Green Version]
- Veres, I.A.; Berer, T.; Reitinger, B.; Burgholzer, P. Numerical modeling of thermoelastic laser-generation of ultrasonic waves. In Proceedings of the 2011 IEEE International Ultrasonics Symposium, Orlando, FL, USA, 18–21 October 2011; pp. 1091–1094. [Google Scholar] [CrossRef]
- Grünsteidl, C.; Veres, I.A.; Murray, T.W. Experimental and numerical study of the excitability of zero group velocity Lamb waves by laser-ultrasound. J. Acoust. Soc. Am. 2015, 138, 242–250. [Google Scholar] [CrossRef]
- Veres, I.A.; Berer, T.; Burgholzer, P. Numerical modeling of thermoelastic generation of ultrasound by laser irradiation in the coupled thermoelasticity. Ultrasonics 2012, 53, 141–149. [Google Scholar] [CrossRef] [Green Version]
- Scruby, C.B.; Drain, L.E. Laser Ultrasonics: Techniques and Applications; Routledge: England, UK, 2019; ISBN 9780203749098. [Google Scholar]
- Murray, T.W.; Wagner, J.W. Laser generation of acoustic waves in the ablative regime. J. Appl. Phys. 1999, 85, 2031–2040. [Google Scholar] [CrossRef]
- Ochiai, M. Development and Applications of Laser-ultrasonic Testing in Nuclear Industry. In Proceedings of the 1st International Symposium on Laser Ultrasonics: Science, Technology and Applications, Montreal, QC, Canada, 16–18 July 2008; pp. 4–12. [Google Scholar]
- Shah, S.K.H.; Iqbal, J.; Ahmad, P.; Khandaker, M.U.; Haq, S.; Naeem, M. Laser induced breakdown spectroscopy methods and applications: A comprehensive review. Radiat. Phys. Chem. 2020, 170, 108666. [Google Scholar] [CrossRef]
- Djordjevic, B.B.; Cerniglia, D.; Cosenza, C. Guided Wave Non-Contact Ultrasonic for NDE. 2004. Available online: https://www.ndt.net/article/wcndt2004/pdf/guided_waves/649_djordjevic.pdf (accessed on 17 May 2022).
- Moreau, A. Laser-Ultrasonic Characterization of the Microstructure of Aluminium. Mater. Sci. Forum 2006, 519–521, 1373–1378. [Google Scholar] [CrossRef]
- Lévesque, D.; Bescond, C.; Lord, M.; Cao, X.; Wanjara, P.; Monchalin, J.-P. Inspection of additive manufactured parts using laser ultrasonics. AIP Conf. Proc. 2016, 1706, 130003. [Google Scholar] [CrossRef] [Green Version]
- Lévesque, D.; Asaumi, Y.; Lord, M.; Bescond, C.; Hatanaka, H.; Tagami, M.; Monchalin, J.-P. Inspection of thick welded joints using laser-ultrasonic SAFT. Ultrasonics 2016, 69, 236–242. [Google Scholar] [CrossRef]
- Klein, M.; Sears, J. Laser Ultrasonic Inspection of Laser Cladded 316LSS and TI-6-4. J. Laser Appl. 2004, 1006. [Google Scholar] [CrossRef]
- Dixon, S.; Edwards, C.; Palmer, S. A laser–EMAT system for ultrasonic weld inspection. Ultrasonics 1999, 37, 273–281. [Google Scholar] [CrossRef]
- Zeng, Y.; Wang, X.; Qin, X.; Hua, L.; Xu, M. Laser Ultrasonic inspection of a Wire + Arc Additive Manufactured (WAAM) sample with artificial defects. Ultrasonics 2020, 110, 106273. [Google Scholar] [CrossRef] [PubMed]
- Fang, H.; Ye, G.; Liang, J.; Yang, Y.; Zhang, B. Laser Ultrasonic in Transmission Mode for Defect Detection of Additive Manufactured Parts. In Proceedings of the 2021 IEEE 5th Advanced Information Technology, Electronic and Automation Control Conference (IAEAC), Chongqing, China, 12–14 March 2021; Volume 2021, pp. 2403–2407. [Google Scholar]
- Guo, S.; Feng, H.; Fenga, W.; Lv, G.; Chen, D.; Liu, Y.; Wu, X. Automatic Quantification of Subsurface Defects by Analyzing Laser Ultrasonic Signals Using Convolutional Neural Networks and Wavelet Transform. IEEE Trans. Ultrason. Ferroelectr. Freq. Control. 2021, 68, 3216–3225. [Google Scholar] [CrossRef]
- Lévesque, D.; Blouin, A.; Néron, C.; Monchalin, J.-P. Performance of laser-ultrasonic F-SAFT imaging. Ultrasonics 2002, 40, 1057–1063. [Google Scholar] [CrossRef]
- Blouin, A.; Levesque, D.; Neron, C.; Drolet, D.; Monchalin, J.-P. Improved resolution and signal-to-noise ratio in laser-ultrasonics by SAFT processing. Opt. Express 1998, 2, 531–539. [Google Scholar] [CrossRef]
- Zeng, W.; Yao, Y.; Qi, S.; Liu, L. Finite element simulation of laser-generated surface acoustic wave for identification of subsurface defects. Optik 2019, 207, 163812. [Google Scholar] [CrossRef]
- Karabutov, A.; Devichensky, A.; Ivochkin, A.; Lyamshev, M.; Pelivanov, I.; Rohadgi, U.; Solomatin, V.; Subudhi, M. Laser ultrasonic diagnostics of residual stress. Ultrasonics 2008, 48, 631–635. [Google Scholar] [CrossRef]
- Polytec GmbH NoiseImage Basic. Available online: https://www.polytec.com/us/acoustics/products/software/noiseimage-basic (accessed on 6 September 2021).
- Senthilkumar, S.; Boopathi, M.; Srivani, A.; Mannayee, G. A review on application of acoustic emission analysis in friction stir welding. J. Chem. Pharm. Sci. 2017, 10, 715–723. [Google Scholar]
- Gholizadeh, S.; Leman, Z.; Baharudin, B. A review of the application of acoustic emission technique in engineering. Struct. Eng. Mech. 2015, 54, 1075–1095. [Google Scholar] [CrossRef]
- Grosse, C.U.; Ohtsu, M. Acoustic Emission Testing: Basics for Research-Applications in Civil Engineering; Springer: Lepzig, Germany, 2008; ISBN 9783540698951. [Google Scholar]
- Sridharan, S. Delamination Behaviour of Composites; Elsevier: Amsterdam, The Netherlands, 2008; ISBN 9781845692445. Available online: http://0-www-sciencedirect-com.brum.beds.ac.uk/science/book/9781845692445 (accessed on 17 May 2022).
- Chuang, S.Y. Real-Time Aircraft Structural Monitoring Using Acoustic Emission. In Review of Progress in Quantitative Nondestructive Evaluation; Springer: Boston, MA, USA, 1987; pp. 371–377. [Google Scholar] [CrossRef] [Green Version]
- Karbhari, V.M.; Lee, L.S. Service Life Estimation and Extension of Civil Engineering Structures; Elsevier: Amsterdam, The Netherlands, 2010; ISBN 9781845693985. [Google Scholar]
- Rohringer, W.; Heine, T.; Sommerhuber, R.; Lehmann, N.; Fischer, B. Optical Microphone as Laser-Ultrasound Detector. Available online: https://xarion.com/itrfile/_1_/27059ddf4f50b42f54dd6dc08d3f1fe0/XARION_DAGA_2018.pdf.pdf (accessed on 18 August 2021).
- Sonoda, Y.; Nakazono, Y. Development of Optophone with No Diaphragm and Application to Sound Measurement in Jet Flow. Adv. Acoust. Vib. 2012, 2012. [Google Scholar] [CrossRef] [Green Version]
- Fraden, J. Handbook of Modern Sensors; Springer International Publishing: Berlin/Heidelberg, Germany, 2016; ISBN 9783319193021. [Google Scholar]
- Fischer, B. Optical microphone hears ultrasound. Angew. Chem. Int. Ed. 2016, 6, 951–952. [Google Scholar] [CrossRef]
- Rohringer, W.R.W.; GmbH, V.X.L.A.; Sommerhuber, R.S.R.; Csaszar, L.C.L.; Panzer, N.P.N.; Wald, S.W.S.; Fischer, B.F.B.; Garrecht, H.G.H.; Grüner, F.G.F.; Frick, J.F.J.; et al. Material characterization via contact-free detection of surface waves using an optical microphone. In Proceedings of the 5th International Conference on Sustainable Construction Materials and Technologies SCMT5, London, UK, 14–17 July 2019. [Google Scholar] [CrossRef]
- Ramalho, A.; Santos, T.G.; Bevans, B.; Smoqi, Z.; Rao, P.; Oliveira, J. Effect of contaminations on the acoustic emissions during wire and arc additive manufacturing of 316L stainless steel. Addit. Manuf. 2021, 51, 102585. [Google Scholar] [CrossRef]
- Aboali, A.; El-Shaib, M.; Sharara, A.; Shehadeh, M. Screening for Welding Defects Using Acoustic Emission Technique. Adv. Mater. Res. 2014, 1025–1026, 7–12. [Google Scholar] [CrossRef]
- Droubi, M.G.; Faisal, N.; Orr, F.; Steel, J.A.; El-Shaib, M. Acoustic emission method for defect detection and identification in carbon steel welded joints. J. Constr. Steel Res. 2017, 134, 28–37. [Google Scholar] [CrossRef]
- Luo, Y.; Zhu, L.; Han, J.; Xie, X.; Wan, R.; Zhu, Y. Study on the acoustic emission effect of plasma plume in pulsed laser welding. Mech. Syst. Signal Process. 2019, 124, 715–723. [Google Scholar] [CrossRef]
- Grad, L.; Grum, J.; Polajnar, I.; Slabe, J.M. Feasibility study of acoustic signals for on-line monitoring in short circuit gas metal arc welding. Int. J. Mach. Tools Manuf. 2004, 44, 555–561. [Google Scholar] [CrossRef]
- Zhang, L.; Basantes-Defaz, A.C.; Ozevin, D.; Indacochea, E. Real-time monitoring of welding process using air-coupled ultrasonics and acoustic emission. Int. J. Adv. Manuf. Technol. 2018, 101, 1623–1634. [Google Scholar] [CrossRef]
- Lee, C.-J.; Kim, J.-D.; Kim, Y.-C. Study on monitoring of plasma emission signal in lap welding of Zn coated steel sheet using CO2 laser. Int. J. Precis. Eng. Manuf. 2015, 16, 495–500. [Google Scholar] [CrossRef]
- Shevchik, S.; Le-Quang, T.; Meylan, B.; Farahani, F.V.; Olbinado, M.P.; Rack, A.; Masinelli, G.; Leinenbach, C.; Wasmer, K. Supervised deep learning for real-time quality monitoring of laser welding with X-ray radiographic guidance. Sci. Rep. 2020, 10, 3389. [Google Scholar] [CrossRef] [Green Version]
- Taheri, H.; Koester, L.W.; Bigelow, T.A.; Faierson, E.J.; Bond, L.J. In Situ Additive Manufacturing Process Monitoring With an Acoustic Technique: Clustering Performance Evaluation Using K-Means Algorithm. J. Manuf. Sci. Eng. 2019, 141, 041011. [Google Scholar] [CrossRef]
- Mahmoud, D.; Magolon, M.; Boer, J.; Elbestawi, M.A.; Mohammadi, M.G. Applications of Machine Learning in Process Monitoring and Controls of L-PBF Additive Manufacturing: A Review. Appl. Sci. 2021, 11, 11910. [Google Scholar] [CrossRef]
- Wasmer, K.; Saeidi, F.; Meylan, B.; Le, Q.T.; Shevchik, S.A. When AE (Acoustic Emission) Meets AI (Artificial Intelligence) II. Laboratory for Advanced Materials Processing, Empa-Swiss Federal Laboratories Abstract. In Proceedings of the 33rd European Conference on Acoustic Emission Testing, Senlis, France, 12–14 September 2018; pp. 1–12. [Google Scholar]
- Masinelli, G.; Shevchik, S.A.; Pandiyan, V.; Quang-Le, T.; Wasmer, K. Artificial Intelligence for Monitoring and Control of Metal Additive Manufacturing. In Industrializing Additive Manufacturing; Meboldt, M., Klahn, C., Eds.; Springer International Publishing: Cham, Switzerland, 2021; pp. 205–220. ISBN 978-3-030-54333-4. [Google Scholar]
- Sibillano, T.; Ancona, A.; Berardi, V.; Lugarà, P.M. A Real-Time Spectroscopic Sensor for Monitoring Laser Welding Processes. Sensors 2009, 9, 3376–3385. [Google Scholar] [CrossRef] [PubMed]
- Alfaro, S.C.A.; Mendonça, D.d.S.; Matos, M.S. Emission spectrometry evaluation in arc welding monitoring system. J. Mater. Process. Technol. 2006, 179, 219–224. [Google Scholar] [CrossRef]
- Mills, G.S. Use of Emission Spectroscopy for Welding Arc Analysis. Weld. J. 1977, 56, 93–96. [Google Scholar]
- Mirapeix, J.; Cobo, A.; Conde, O.; Quintela, M.A.; Lopez-Higuera, J.-M. Spectroscopic analysis technique for arc-welding process control. Photonics Appl. Ind. Res. IV 2005, 5948, 594824. [Google Scholar] [CrossRef]
- Zhang, C.; Gao, M.; Chen, C.; Zeng, X. Spectral diagnosis of wire arc additive manufacturing of Al alloys. Addit. Manuf. 2019, 30, 100869. [Google Scholar] [CrossRef]
- Kisielewicz, A.; Sikström, F.; Christiansson, A.-K.; Ancona, A. Spectroscopic monitoring of laser blown powder directed energy deposition of Alloy 718. Procedia Manuf. 2018, 25, 418–425. [Google Scholar] [CrossRef]
- Nassar, A.R.; Spurgeon, T.J.; Reutzel, E.W. Sensing Defects during Directed-Energy ADDITIVE manufacturing of Metal Parts Using Optical Emissions Spectroscopy. In Proceedings of the 2014 International Solid Freeform Fabrication Symposium, Austin, TX, USA, 4–6 August 2014. [Google Scholar]
- Harmon, R.; Russo, R. Laser-Induced Breakdown Spectroscopy. In Treatise Geochemistry, 2nd ed.; Elsevier: Amsterdam, The Netherlands, 2014; Volume 245–272. [Google Scholar] [CrossRef]
- Lednev, V.N.; Sdvizhenskii, P.; Asyutin, R.D.; Tretyakov, R.S.; Grishin, M.Y.; Stavertiy, A.Y.; Pershin, S.M. In situ multi-elemental analysis by laser induced breakdown spectroscopy in additive manufacturing. Addit. Manuf. 2018, 25, 64–70. [Google Scholar] [CrossRef]
- Taparli, U.A.; Jacobsen, L.; Griesche, A.; Michalik, K.; Mory, D.; Kannengiesser, T. In situ laser-induced breakdown spectroscopy measurements of chemical compositions in stainless steels during tungsten inert gas welding. Spectrochim. Acta Part B At. Spectrosc. 2018, 139, 50–56. [Google Scholar] [CrossRef]
- Avdelidis, N.P.; Almond, D.P.; Dobbinson, A.; Hawtin, B.C. Pulsed thermography: Philosophy, qualitative and quantitative analysis on certain aircraft applications. Insight-Non-Destr. Test. Cond. Monit. 2006, 48, 286–289. [Google Scholar] [CrossRef]
- Chung, Y.; Shrestha, R.; Lee, S.; Kim, W. Thermographic Inspection of Internal Defects in Steel Structures: Analysis of Signal Processing Techniques in Pulsed Thermography. Sensors 2020, 20, 6015. [Google Scholar] [CrossRef] [PubMed]
- Andonova, A.; Todorov, D. Thermographic NDT System. Annu. J. Electron. 2013, 78, 139–143. [Google Scholar]
- Jolly, M.R.; Prabhakar, A.; Sturzu, B.; Hollstein, K.; Singh, R.; Thomas, S.; Foote, P.; Shaw, A. Review of Non-destructive Testing (NDT) Techniques and their Applicability to Thick Walled Composites. Procedia CIRP 2015, 38, 129–136. [Google Scholar] [CrossRef] [Green Version]
- Broberg, P. Surface crack detection in welds using thermography. NDT E Int. 2013, 57, 69–73. [Google Scholar] [CrossRef]
- Bagavac, P. Lock-in Thermography Image Processing, Faculty of Electrical Engineering, Mechanical Engineering and Naval Architecture, University of Split. Available online: https://hrcak.srce.hr/file/251414, (accessed on 28 August 2021).
- He, Y.; Pan, M.; Chen, D.; Tian, G.; Zhang, H. Eddy current step heating thermography for quantitatively evaluation. Appl. Phys. Lett. 2013, 103, 194101. [Google Scholar] [CrossRef]
- Qu, Z.; Jiang, P.; Zhang, W. Development and Application of Infrared Thermography Non-destructive Testing Techniques. Sensors 2020, 20, 3851. [Google Scholar] [CrossRef]
- Roemer, J.; Pieczonka, L.; Szwedo, M.; Uhl, T.; Staszewski, W.J. Thermography of Metallic and Composite Structures-review of applications. In Proceedings of the International Workshop on SMART MATERIALS, STRUCTURES & SHM NDT in Canada 2013 Conference & NDT for the Energy Industry, Calgary, AB, Canada, 7–10 October 2013. [Google Scholar]
- Marani, R.; Palumbo, D.; Galietti, U.; D’Orazio, T. Deep learning for defect characterization in composite laminates inspected by step-heating thermography. Opt. Lasers Eng. 2021, 145, 106679. [Google Scholar] [CrossRef]
- Kamińska, P.; Ziemkiewcz, J.; Synaszko, P.; Dragan, K. Comparison of Pulse Thermography (PT) and Step Heating (SH) Thermography in Non-Destructive Testing of Unidirectional GFRP Composites. Fatigue Aircr. Struct. 2019, 2019, 87–102. [Google Scholar] [CrossRef]
- Renshaw, J.; Chen, J.C.; Holland, S.D.; Thompson, R.B. The sources of heat generation in vibrothermography. NDT E Int. 2011, 44, 736–739. [Google Scholar] [CrossRef] [Green Version]
- Pieczonka, L.; Szwedo, M. “Vibrothermography” in Advanced Structural Damage Detection: From Theory to Engineering Applications; Stepinski, T., Uhl, T., Staszewski, W., Eds.; Wiley: Hoboken, NJ, USA, 2013; ISBN 9781118536148. [Google Scholar]
- Zenzinger, G.; Bamberg, J.; Satzger, W.; Carl, V. Thermographic crack detection by eddy current excitation. Nondestruct. Test. Eval. 2007, 22, 101–111. [Google Scholar] [CrossRef]
- Swiderski, W.; Hlosta, P. Pulsed Eddy Current Thermography for Defects Detection in Joints of Metal Sheets. In Proceedings of the 11th European Conference on Non-Destructive Testing, Prague, Czech Republic, 6–10 October 2014. [Google Scholar]
- Yang, D.; Wang, G.; Zhang, G. Thermal analysis for single-pass multi-layer GMAW based additive manufacturing using infrared thermography. J. Mater. Process. Technol. 2017, 244, 215–224. [Google Scholar] [CrossRef]
- Runnemalm, A.; Broberg, P.; Fernandez, E.; Garcia, A.; Yedra, D.E.L.A.; Henrikson, P.; Thorpe, N. Automatic thermography inspection of welded components with limited access. In Proceedings of the 6th International Symposium on NDT in Aerospace, Madrid, Spain, 12–14 November 2014. [Google Scholar]
- Sreedhar, U.; Krishnamurthy, C.; Balasubramaniam, K.; Raghupathy, V.; Ravisankar, S. Automatic defect identification using thermal image analysis for online weld quality monitoring. J. Mater. Process. Technol. 2012, 212, 1557–1566. [Google Scholar] [CrossRef]
- Elkihel, A.; Bakdid, A.; Jeffali, F.; Gziri, H. Evaluation of thermal losses for welded structures. Mater. Today Proc. 2020, 31, S78–S82. [Google Scholar] [CrossRef]
- Massaro, A.; Panarese, A.; Dipierro, G.; Cannella, E.; Galiano, A. Infrared Thermography and Image Processing applied on Weldings Quality Monitoring. In Proceedings of the 2020 IEEE International Workshop on Metrology for Industry 4.0 & IoT, Roma, Italy, 3–5 June 2020; pp. 559–564. [Google Scholar] [CrossRef]
- Ziegler, M.; Thiel, E.; Ahmadi, S. Lock-in Thermography using High-Power Laser Sources 2. Laser Thermography–Evolution from a highly specialised into a versatile tool for NDT. In Proceedings of the 12th European Conference on Non-Destructive Testing 2018, Gothenburg, Sweden, 11–15 June 2018. [Google Scholar]
- Cerniglia, D.; Montinaro, N. Defect Detection in Additively Manufactured Components: Laser Ultrasound and Laser Thermography Comparison. Procedia Struct. Integr. 2018, 8, 154–162. [Google Scholar] [CrossRef]
- Kumar, V.; Albert, S.K.; Chandrasekhar, N. Signal processing approach on weld data for evaluation of arc welding electrodes using probability density distributions. Measurement 2018, 133, 23–32. [Google Scholar] [CrossRef]
- Kumar, V.; Albert, S.K.; Chandrasekhar, N.; Jayapandian, J.; Venkatesan, M.V. Performance analysis of arc welding parameters using self organizing maps and probability density distributions. In Proceedings of the 2016 IEEE First International Conference on Control, Measurement and Instrumentation (CMI), Kolkata, India, 8–10 January 2016; pp. 196–200. [Google Scholar] [CrossRef]
- Mičian, M.; Marônek, M. Analysis of the Arc Current of CMT Brazing Process; Research Papers; Faculty of Materials Science and Technology, Slovak University of Technology: Bratislava, Slovakia, 2018; Volume 26, pp. 103–108. [Google Scholar] [CrossRef] [Green Version]
- Kumar, V.; Chandrasekhar, N.; Albert, S.; Jayapandian, J. Analysis of arc welding process using Digital Storage Oscilloscope. Measurement 2016, 81, 1–12. [Google Scholar] [CrossRef]
- Savyasachi, N.; Chandrasekar, N.; Albert, S.K.; Surendranathan, A.O. Evaluation of Arc Welding Process Using Digital Storage Oscilloscope and High Speed Camera. Indian Weld. J. 2015, 48, 35. [Google Scholar] [CrossRef]
- Mazlan, A.; Daniyal, H.; Mohamed, A.I.; Ishak, M.; Hadi, A.A. Monitoring the quality of welding based on welding current and ste analysis. IOP Conf. Ser. Mater. Sci. Eng. 2017, 257, 012043. [Google Scholar] [CrossRef]


| Propagation Mode | Description |
|---|---|
| Longitudinal (compression) | The particle motion is parallel to the wave travel direction. |
| Transverse (shear) | The particle vibration is perpendicular to the wave travel direction. |
| Surface (Rayleigh) | The wave is generated at the surface of thick solids caused by an elliptical motion of particles. |
| Plate (Lamb including ZGV modes) | A complex particle motion happens throughout the thickness and parallel to the surface of the material. |
Publisher’s Note: MDPI stays neutral with regard to jurisdictional claims in published maps and institutional affiliations. |
© 2022 by the authors. Licensee MDPI, Basel, Switzerland. This article is an open access article distributed under the terms and conditions of the Creative Commons Attribution (CC BY) license (https://creativecommons.org/licenses/by/4.0/).
Share and Cite
Shaloo, M.; Schnall, M.; Klein, T.; Huber, N.; Reitinger, B. A Review of Non-Destructive Testing (NDT) Techniques for Defect Detection: Application to Fusion Welding and Future Wire Arc Additive Manufacturing Processes. Materials 2022, 15, 3697. https://0-doi-org.brum.beds.ac.uk/10.3390/ma15103697
Shaloo M, Schnall M, Klein T, Huber N, Reitinger B. A Review of Non-Destructive Testing (NDT) Techniques for Defect Detection: Application to Fusion Welding and Future Wire Arc Additive Manufacturing Processes. Materials. 2022; 15(10):3697. https://0-doi-org.brum.beds.ac.uk/10.3390/ma15103697
Chicago/Turabian StyleShaloo, Masoud, Martin Schnall, Thomas Klein, Norbert Huber, and Bernhard Reitinger. 2022. "A Review of Non-Destructive Testing (NDT) Techniques for Defect Detection: Application to Fusion Welding and Future Wire Arc Additive Manufacturing Processes" Materials 15, no. 10: 3697. https://0-doi-org.brum.beds.ac.uk/10.3390/ma15103697