Figure 1.
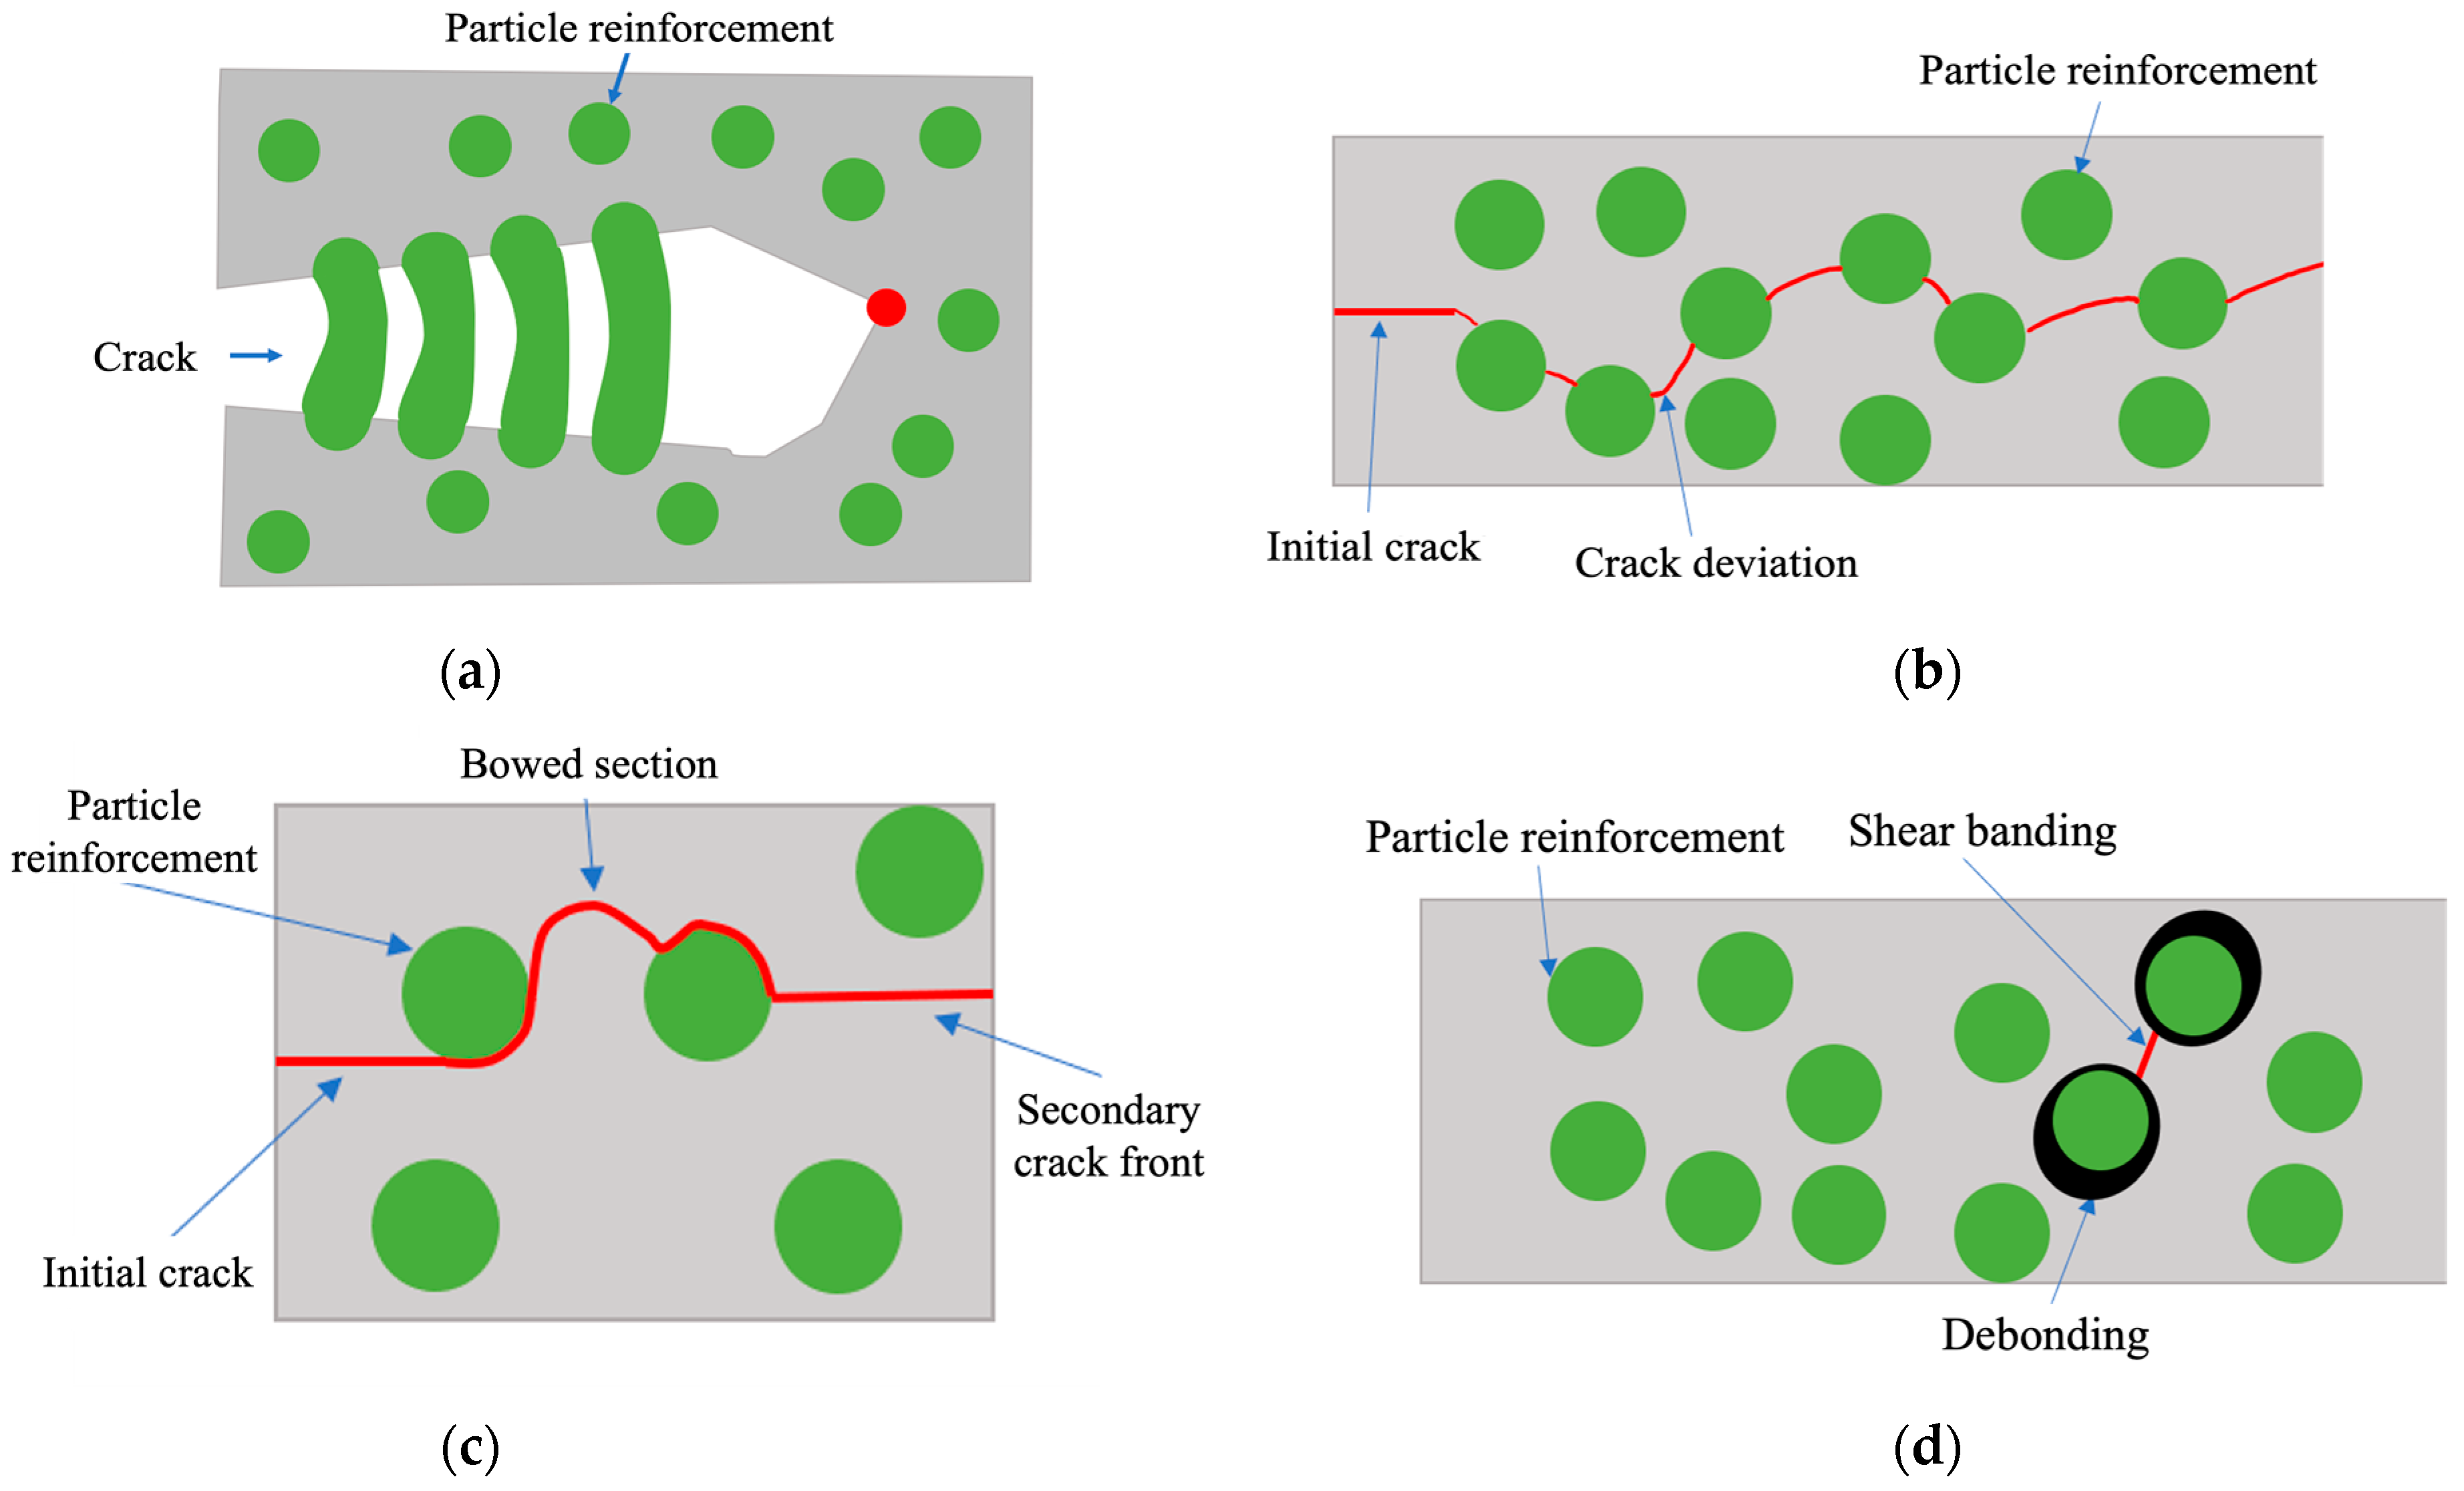
Schematic representation of different toughening mechanisms in particle reinforced polymers. (a) Bridging. (b) Crack growth deviation. (c) Crack pinning and bowing. (d) Shear banding due to particle debonding.
Figure 1.
Schematic representation of different toughening mechanisms in particle reinforced polymers. (a) Bridging. (b) Crack growth deviation. (c) Crack pinning and bowing. (d) Shear banding due to particle debonding.
Figure 2.
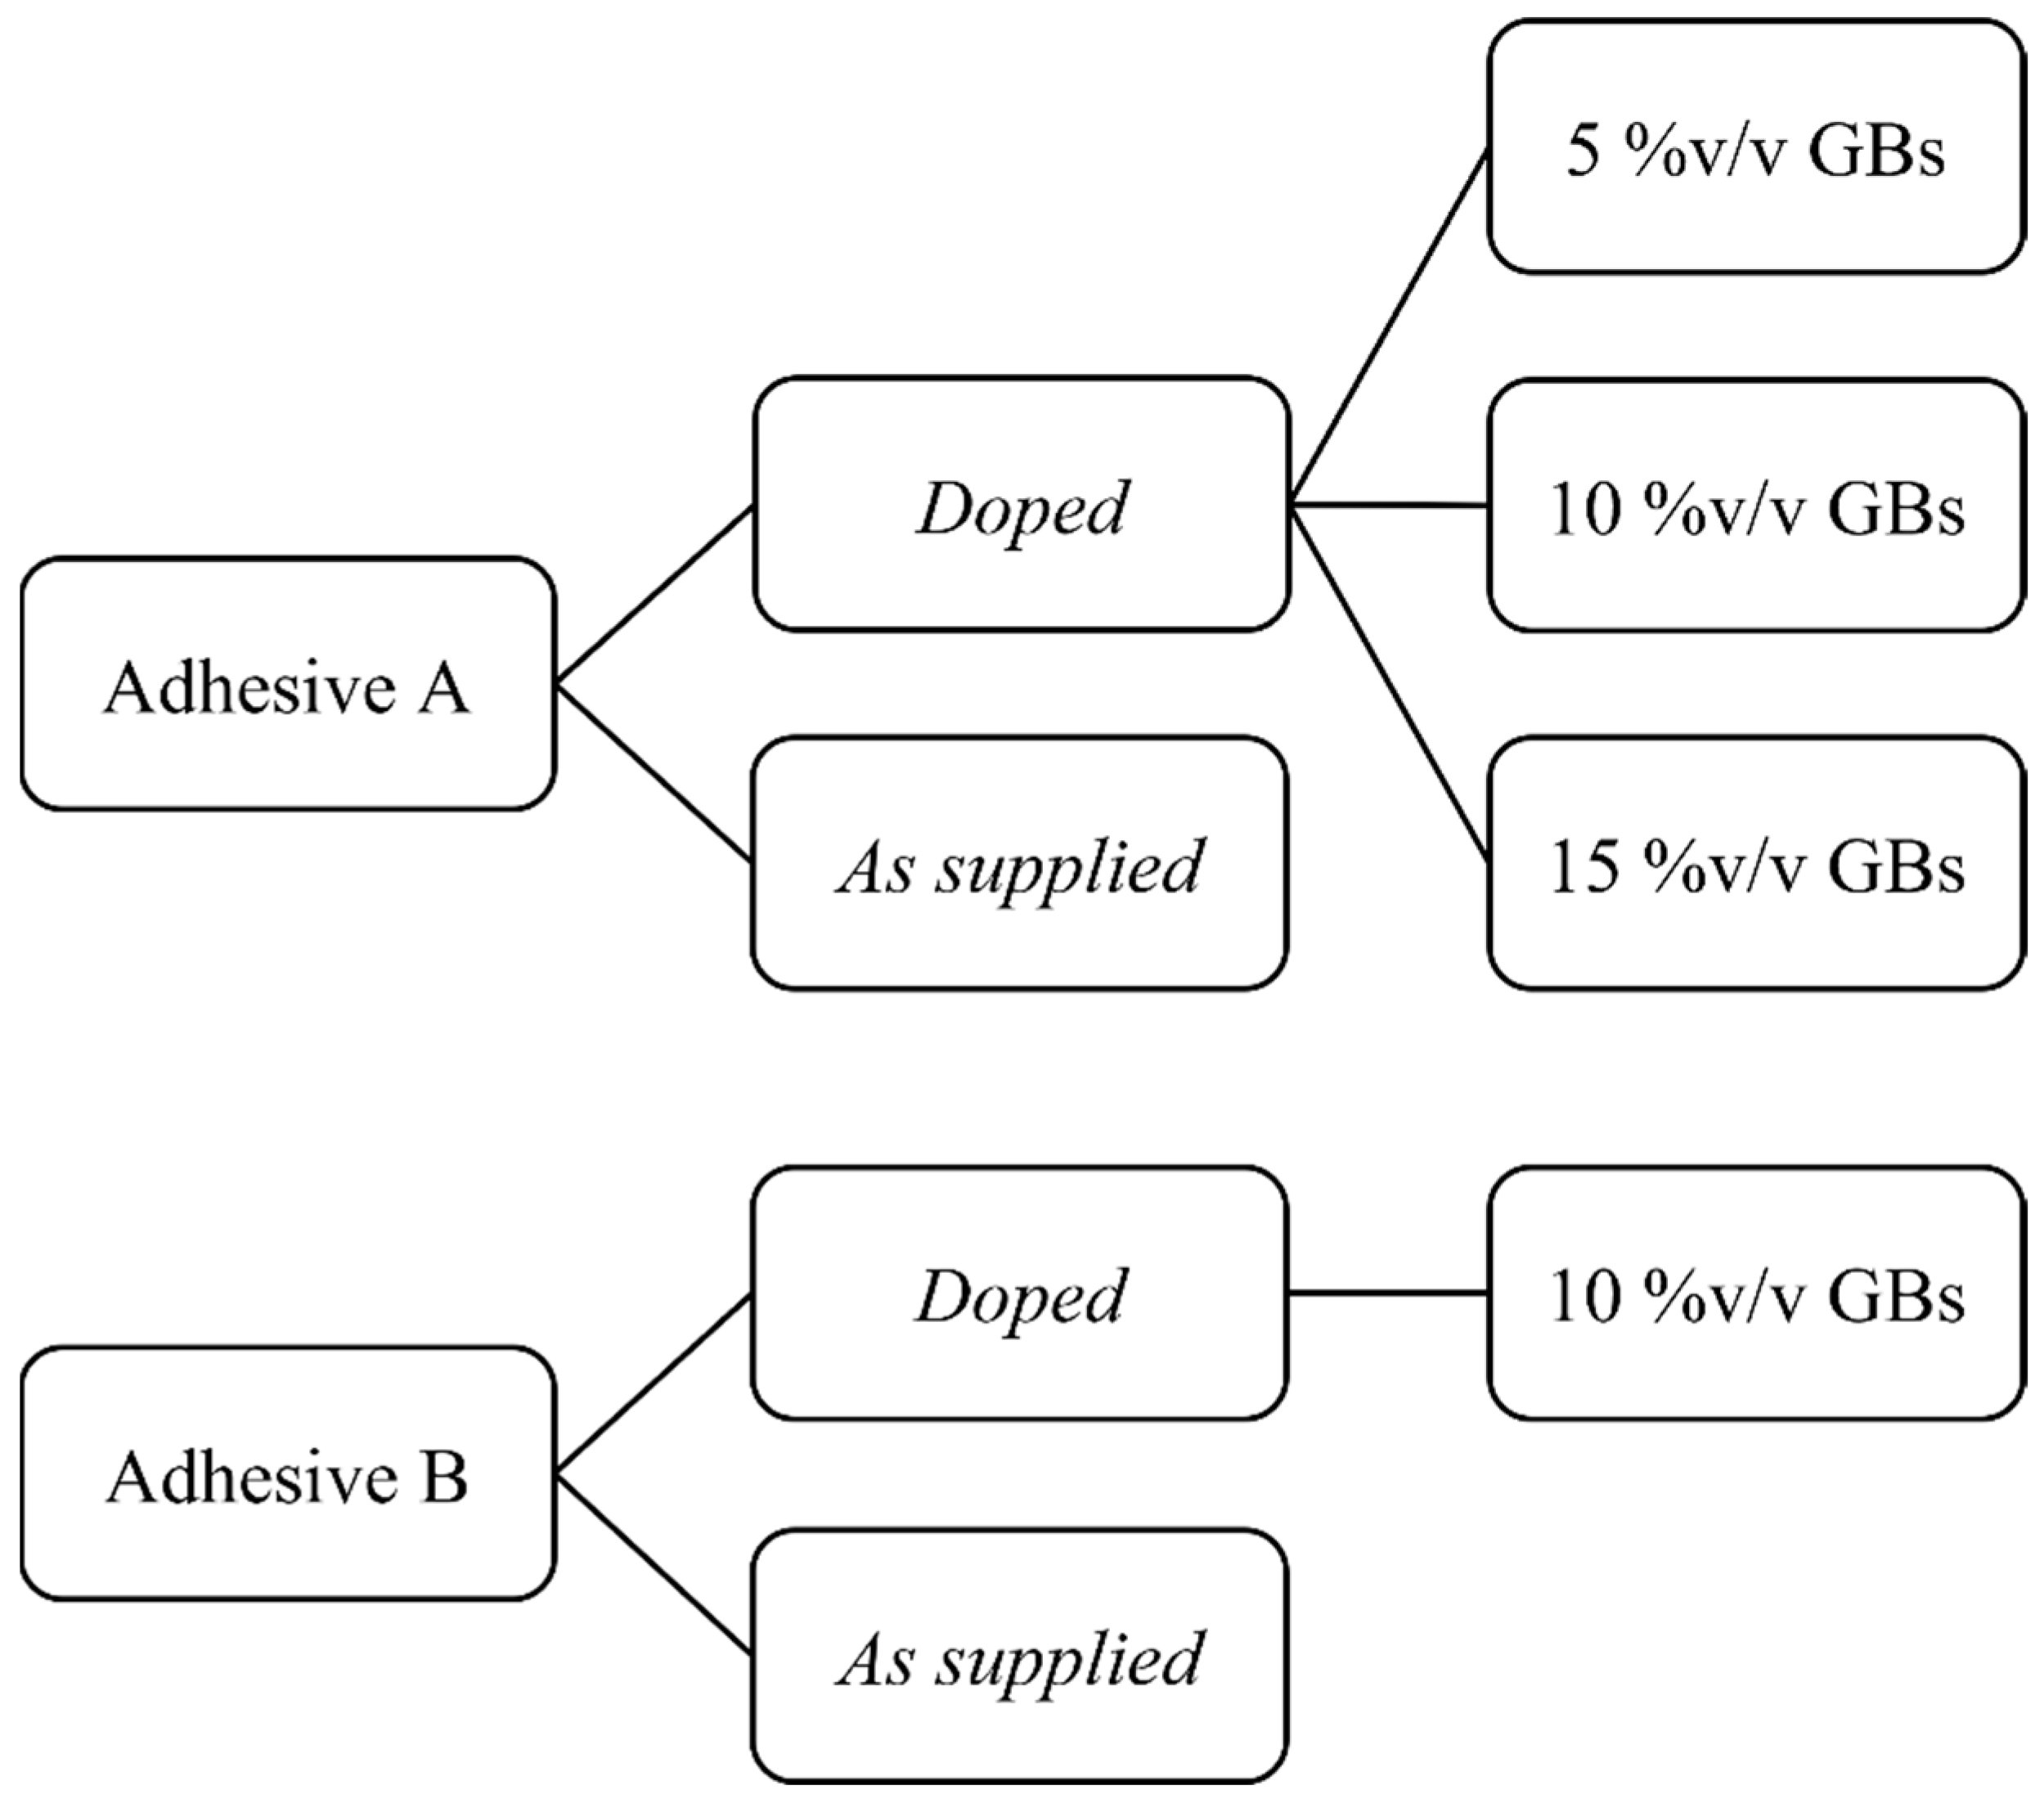
Schematic diagram of the adhesive configurations analyzed for both adhesives (A and B) in the as supplied and doped states.
Figure 2.
Schematic diagram of the adhesive configurations analyzed for both adhesives (A and B) in the as supplied and doped states.
Figure 3.
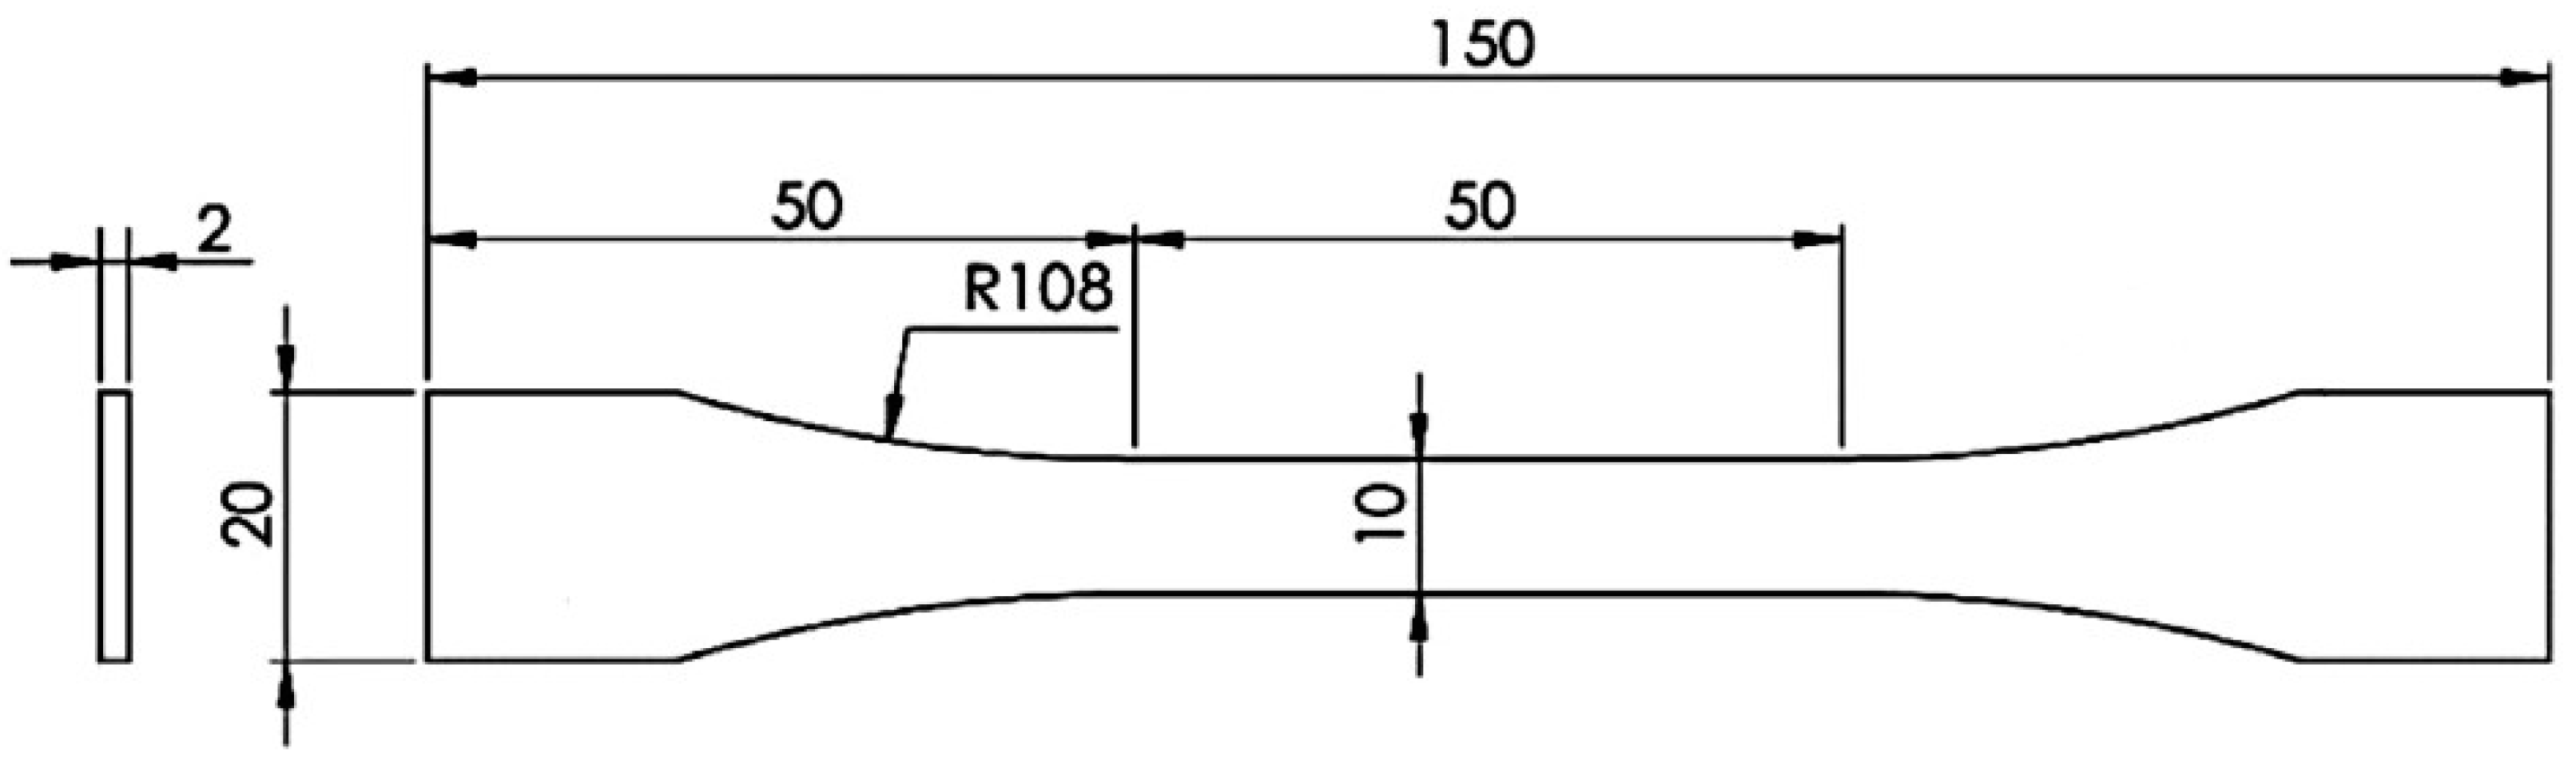
Representation of tensile specimens’ geometry, adapted from BS 2782 [
22], dimensions in mm.
Figure 3.
Representation of tensile specimens’ geometry, adapted from BS 2782 [
22], dimensions in mm.
Figure 4.
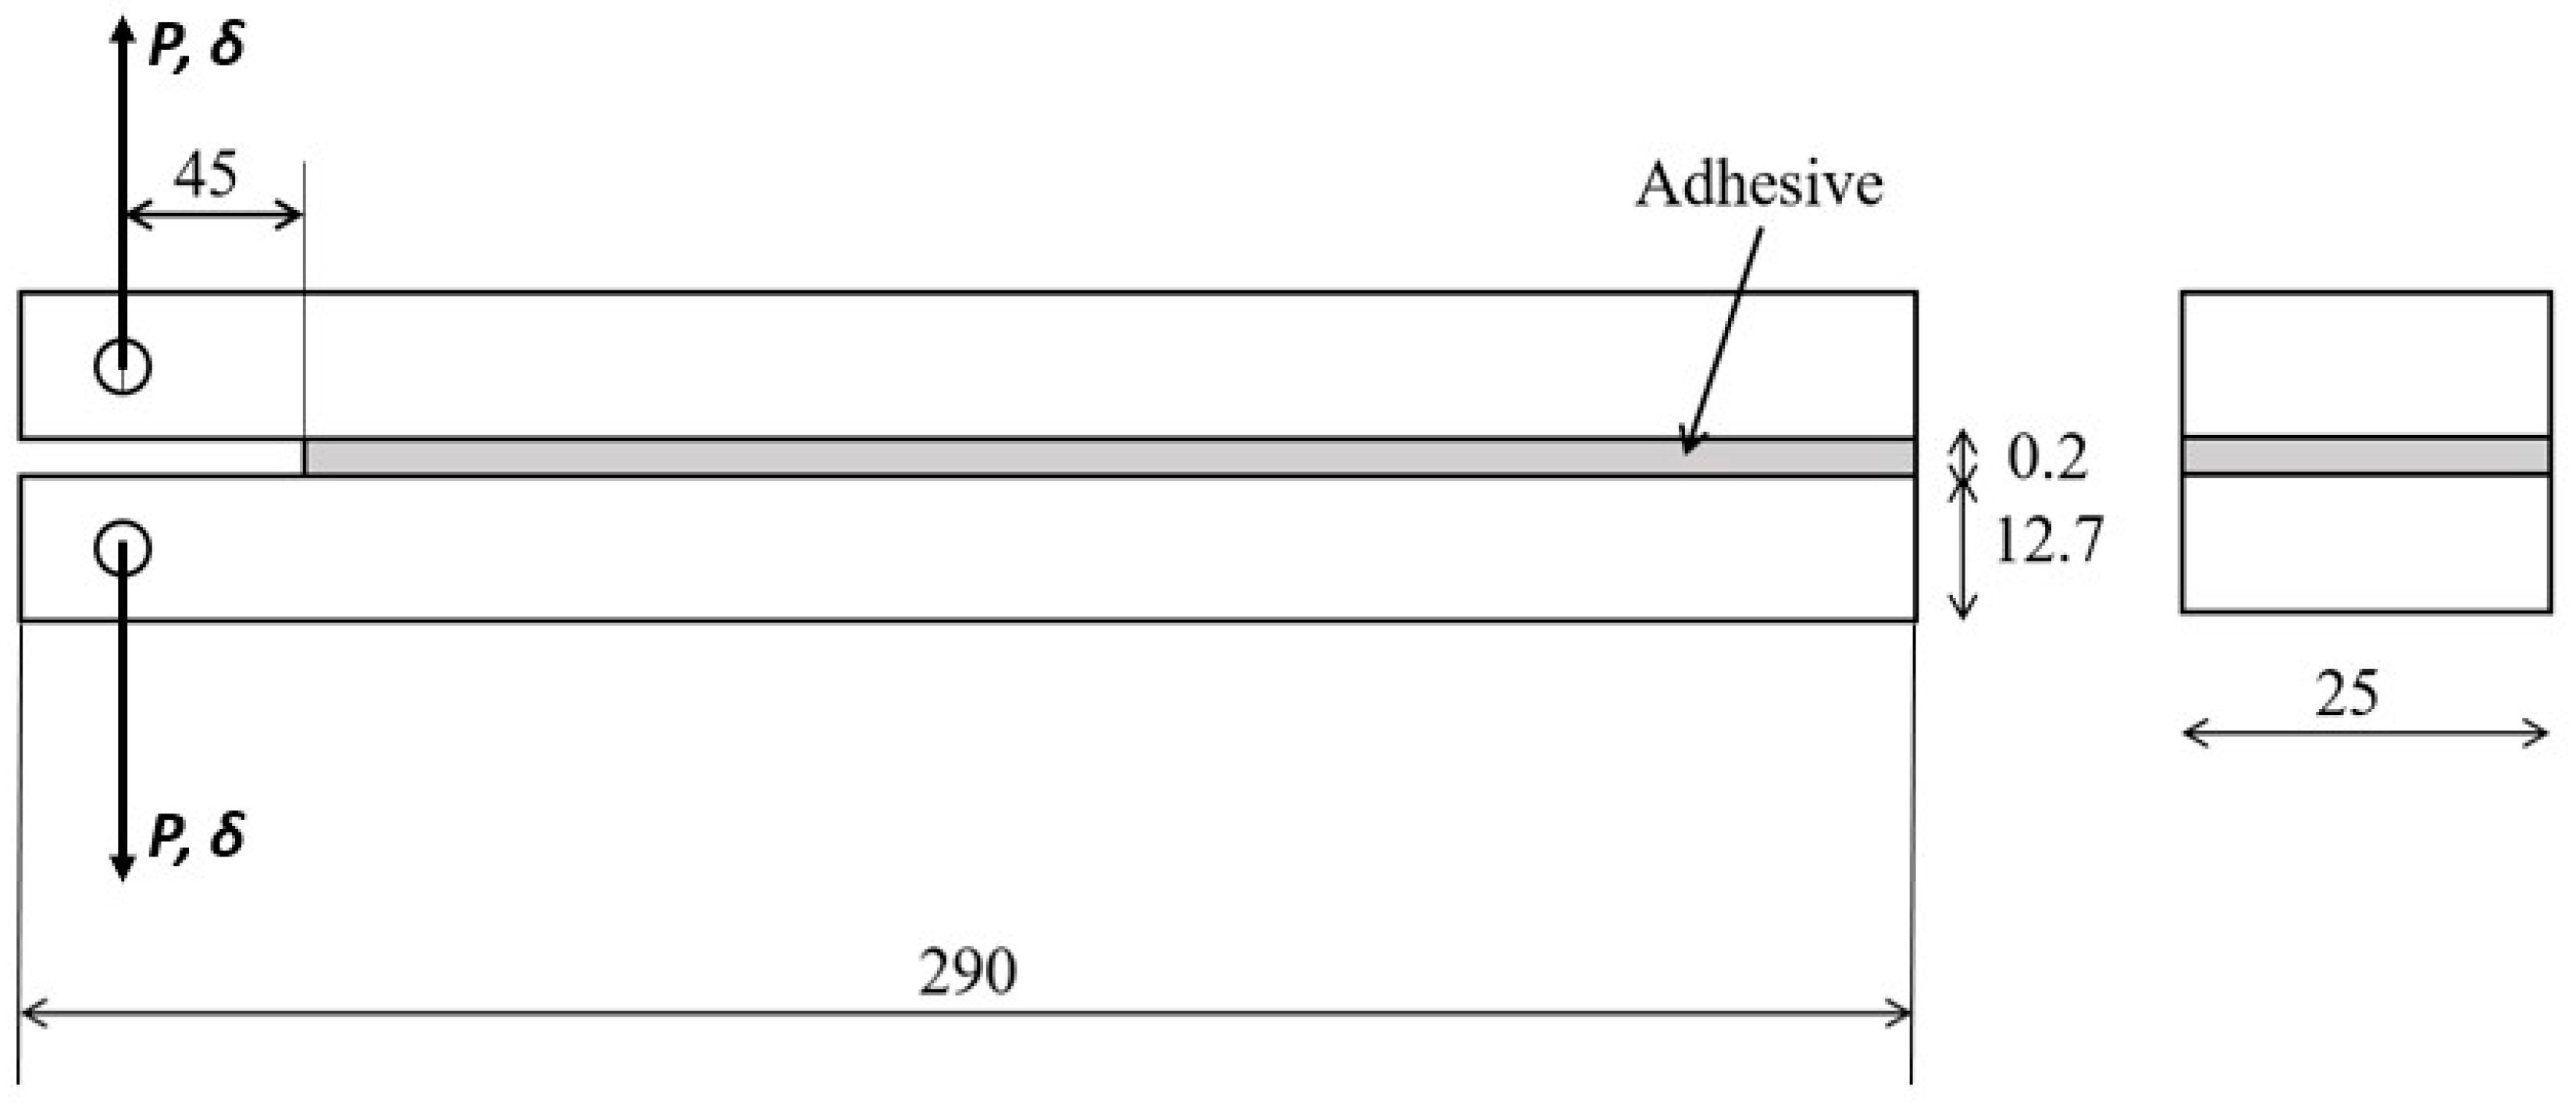
Representation of DCB specimens’ geometry and testing, dimensions in mm.
Figure 4.
Representation of DCB specimens’ geometry and testing, dimensions in mm.
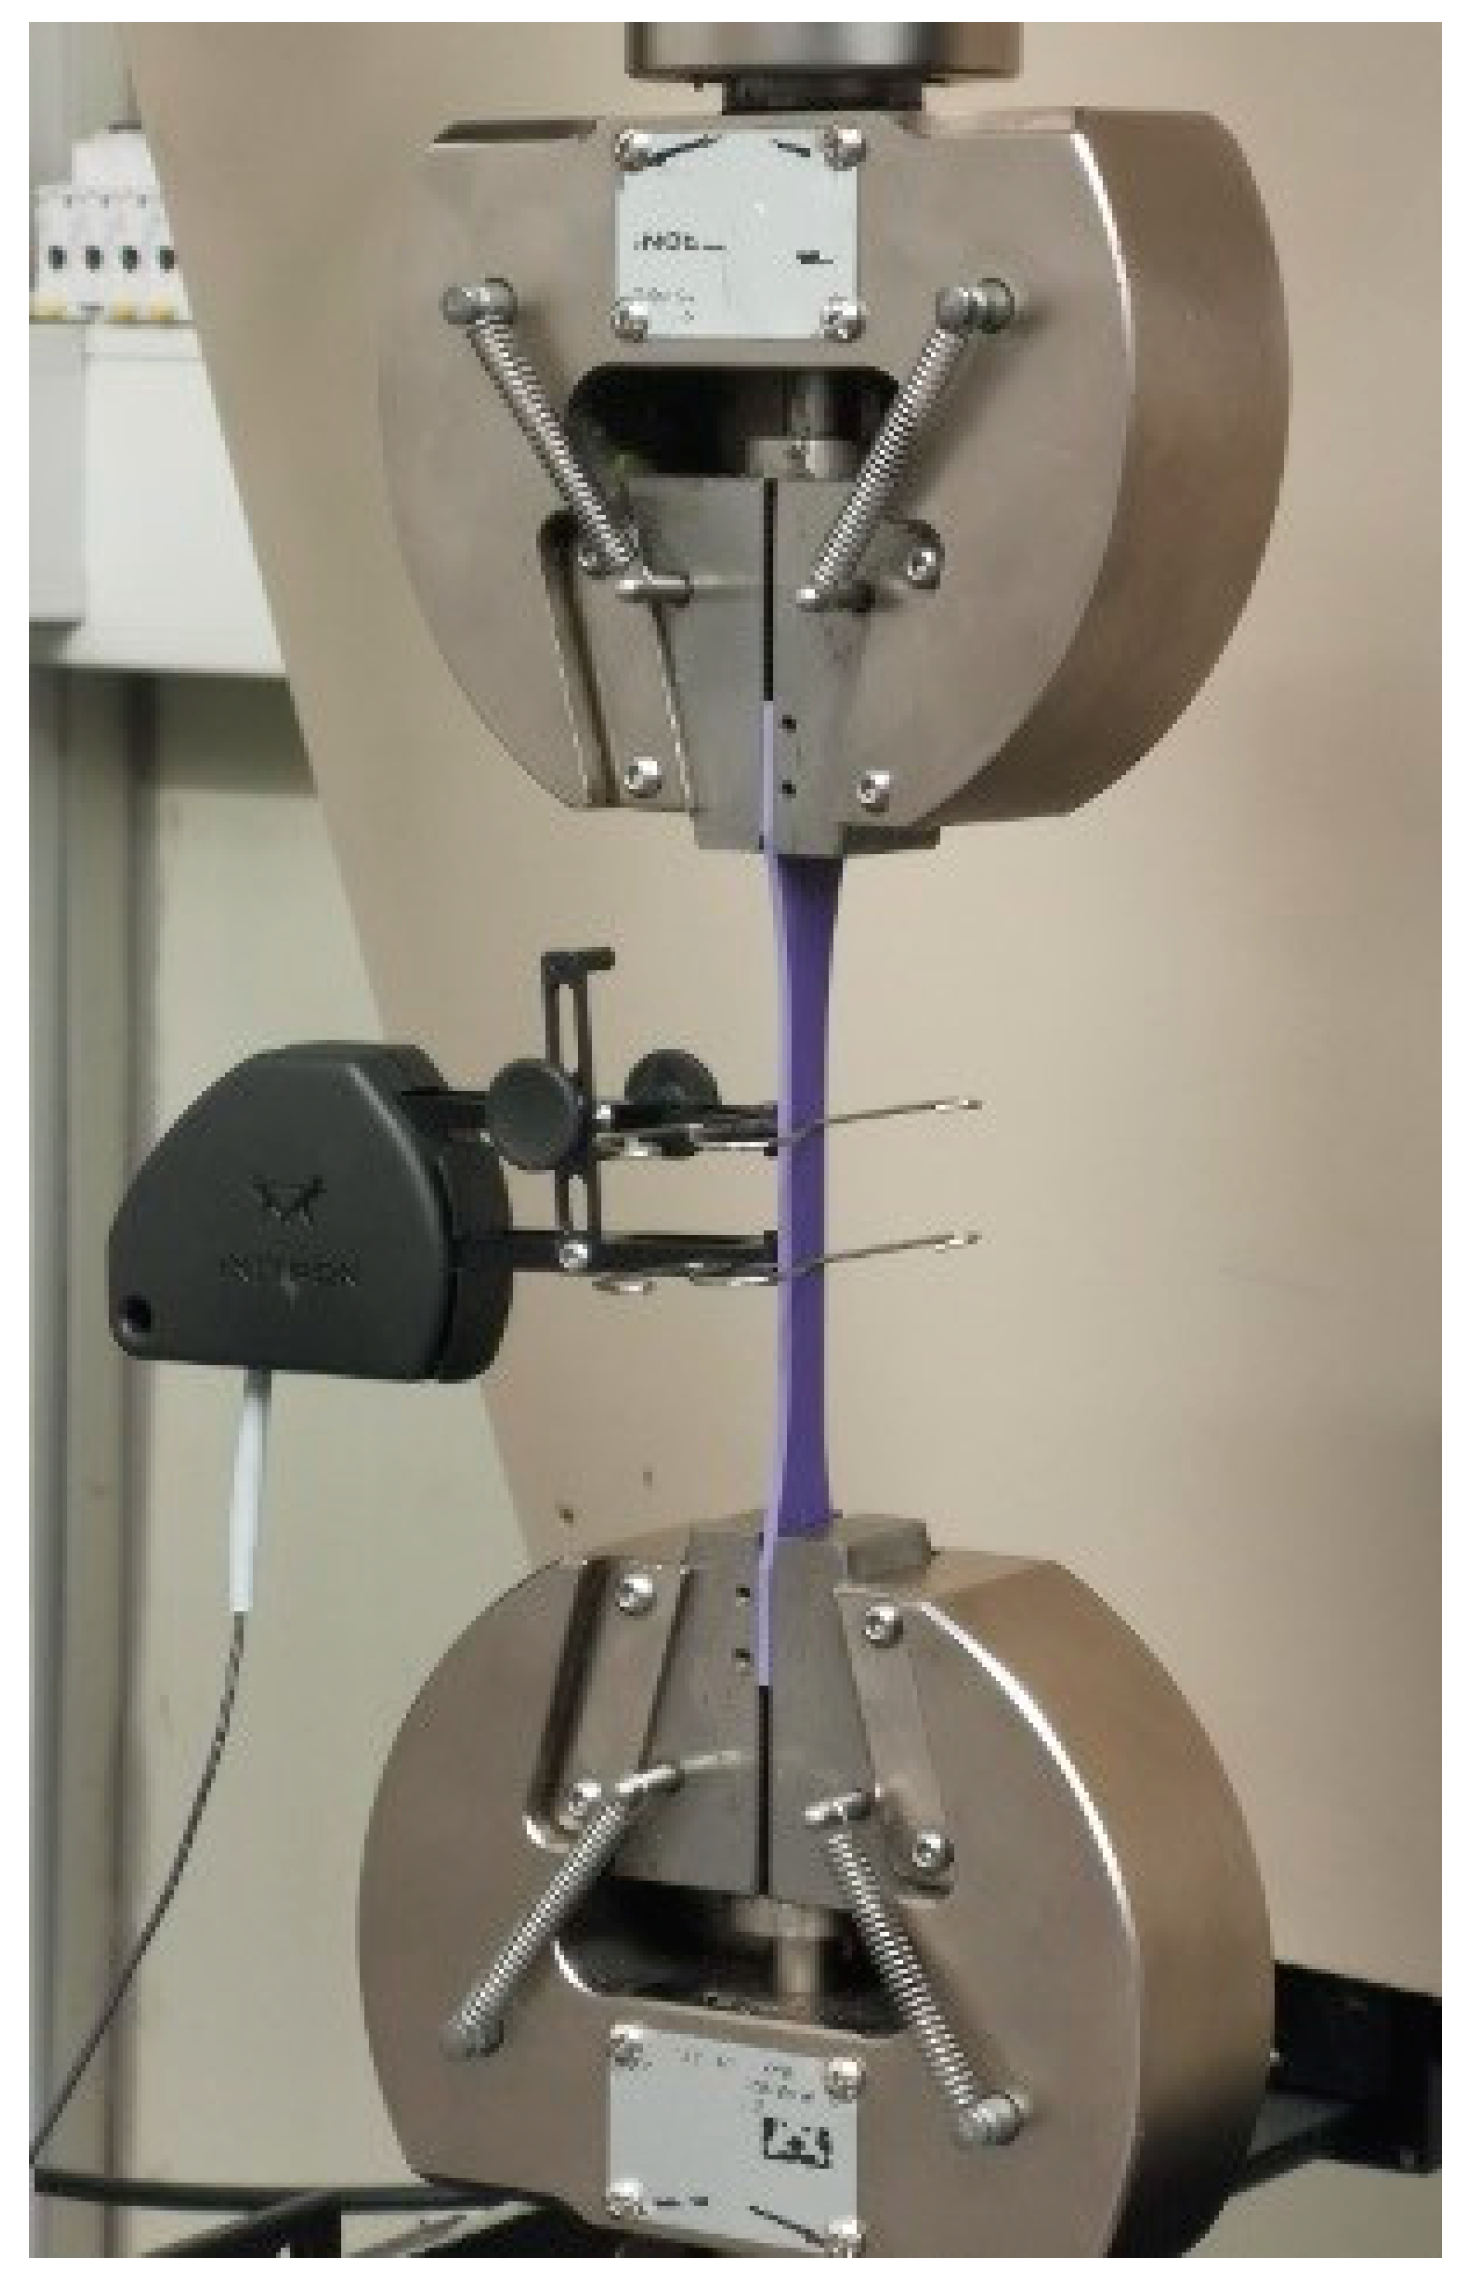
Figure 5.
Tensile test setup. The specimen is fixed with wedge action tensile grips and a clip-on extensometer is used to record the test’s extension.
Figure 5.
Tensile test setup. The specimen is fixed with wedge action tensile grips and a clip-on extensometer is used to record the test’s extension.
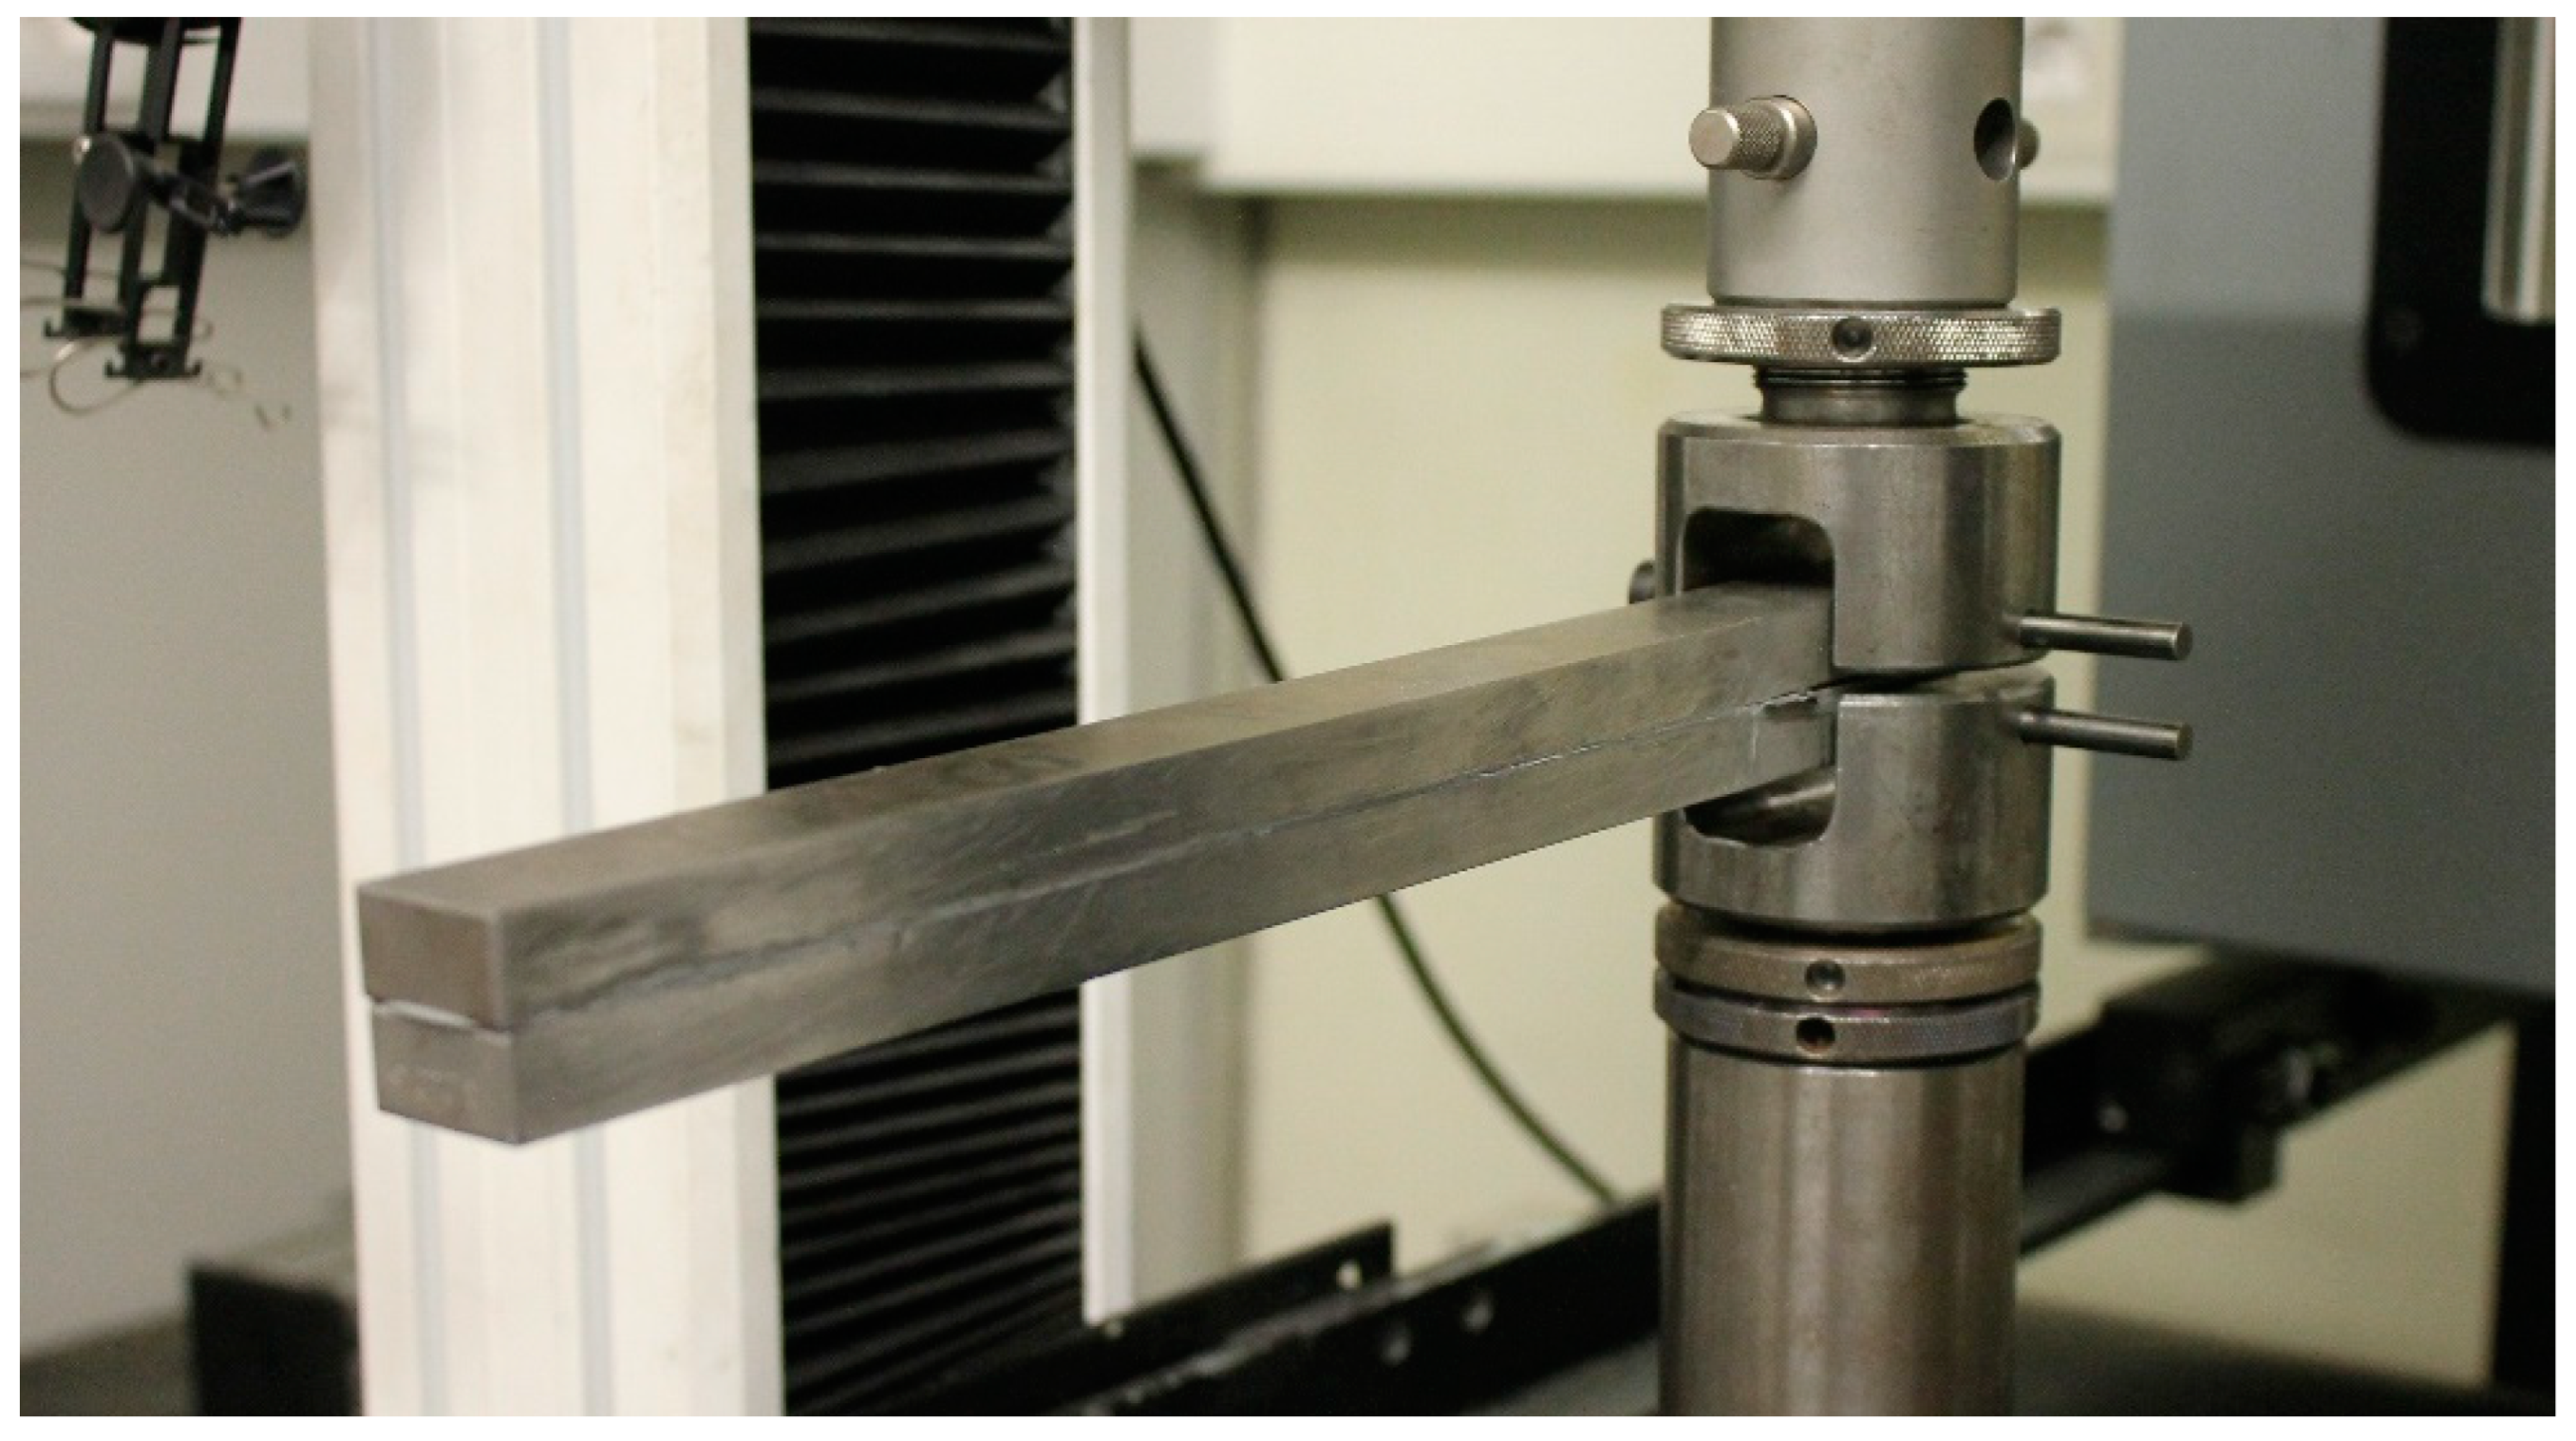
Figure 6.
DCB test setup. The specimen is fixed with U-shaped pin-based systems.
Figure 6.
DCB test setup. The specimen is fixed with U-shaped pin-based systems.
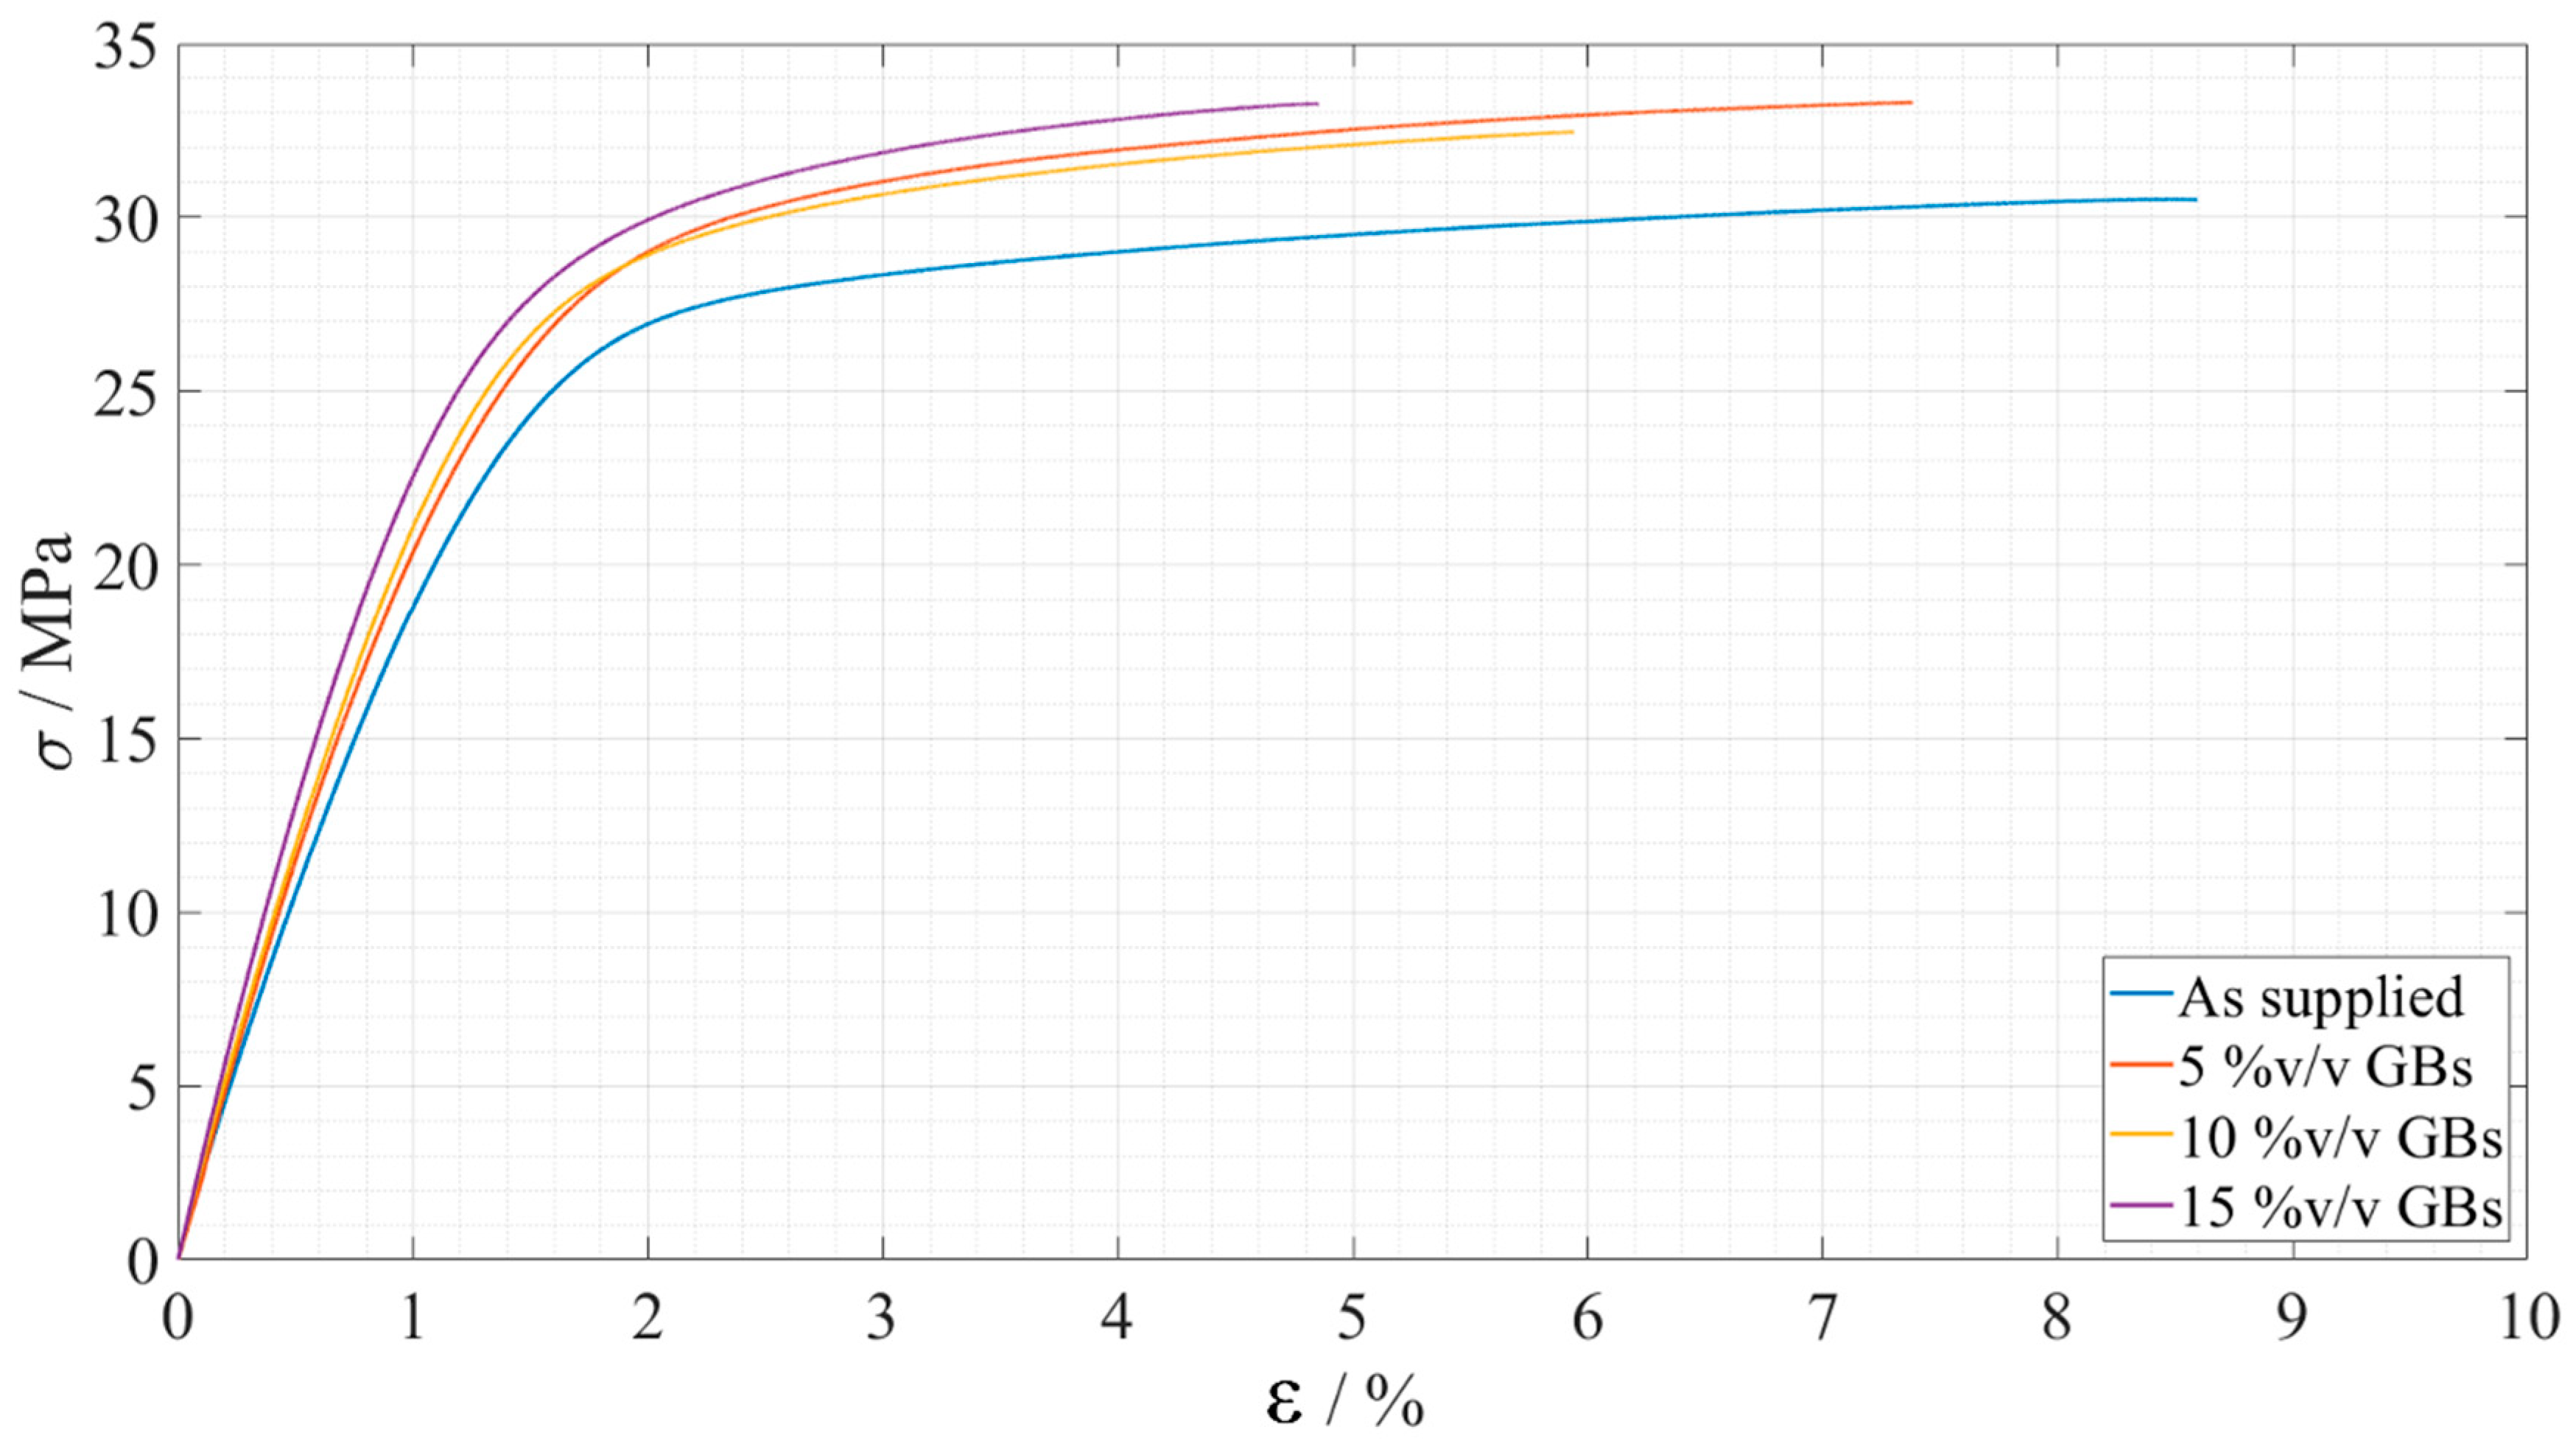
Figure 7.
Representative stress-strain curves of the bulk tensile tests for each Adhesive A configuration. As supplied in presented in blue, 5%v/v GBs in orange, 10%v/v GBs in yellow, and 15%v/v GBs in purple.
Figure 7.
Representative stress-strain curves of the bulk tensile tests for each Adhesive A configuration. As supplied in presented in blue, 5%v/v GBs in orange, 10%v/v GBs in yellow, and 15%v/v GBs in purple.
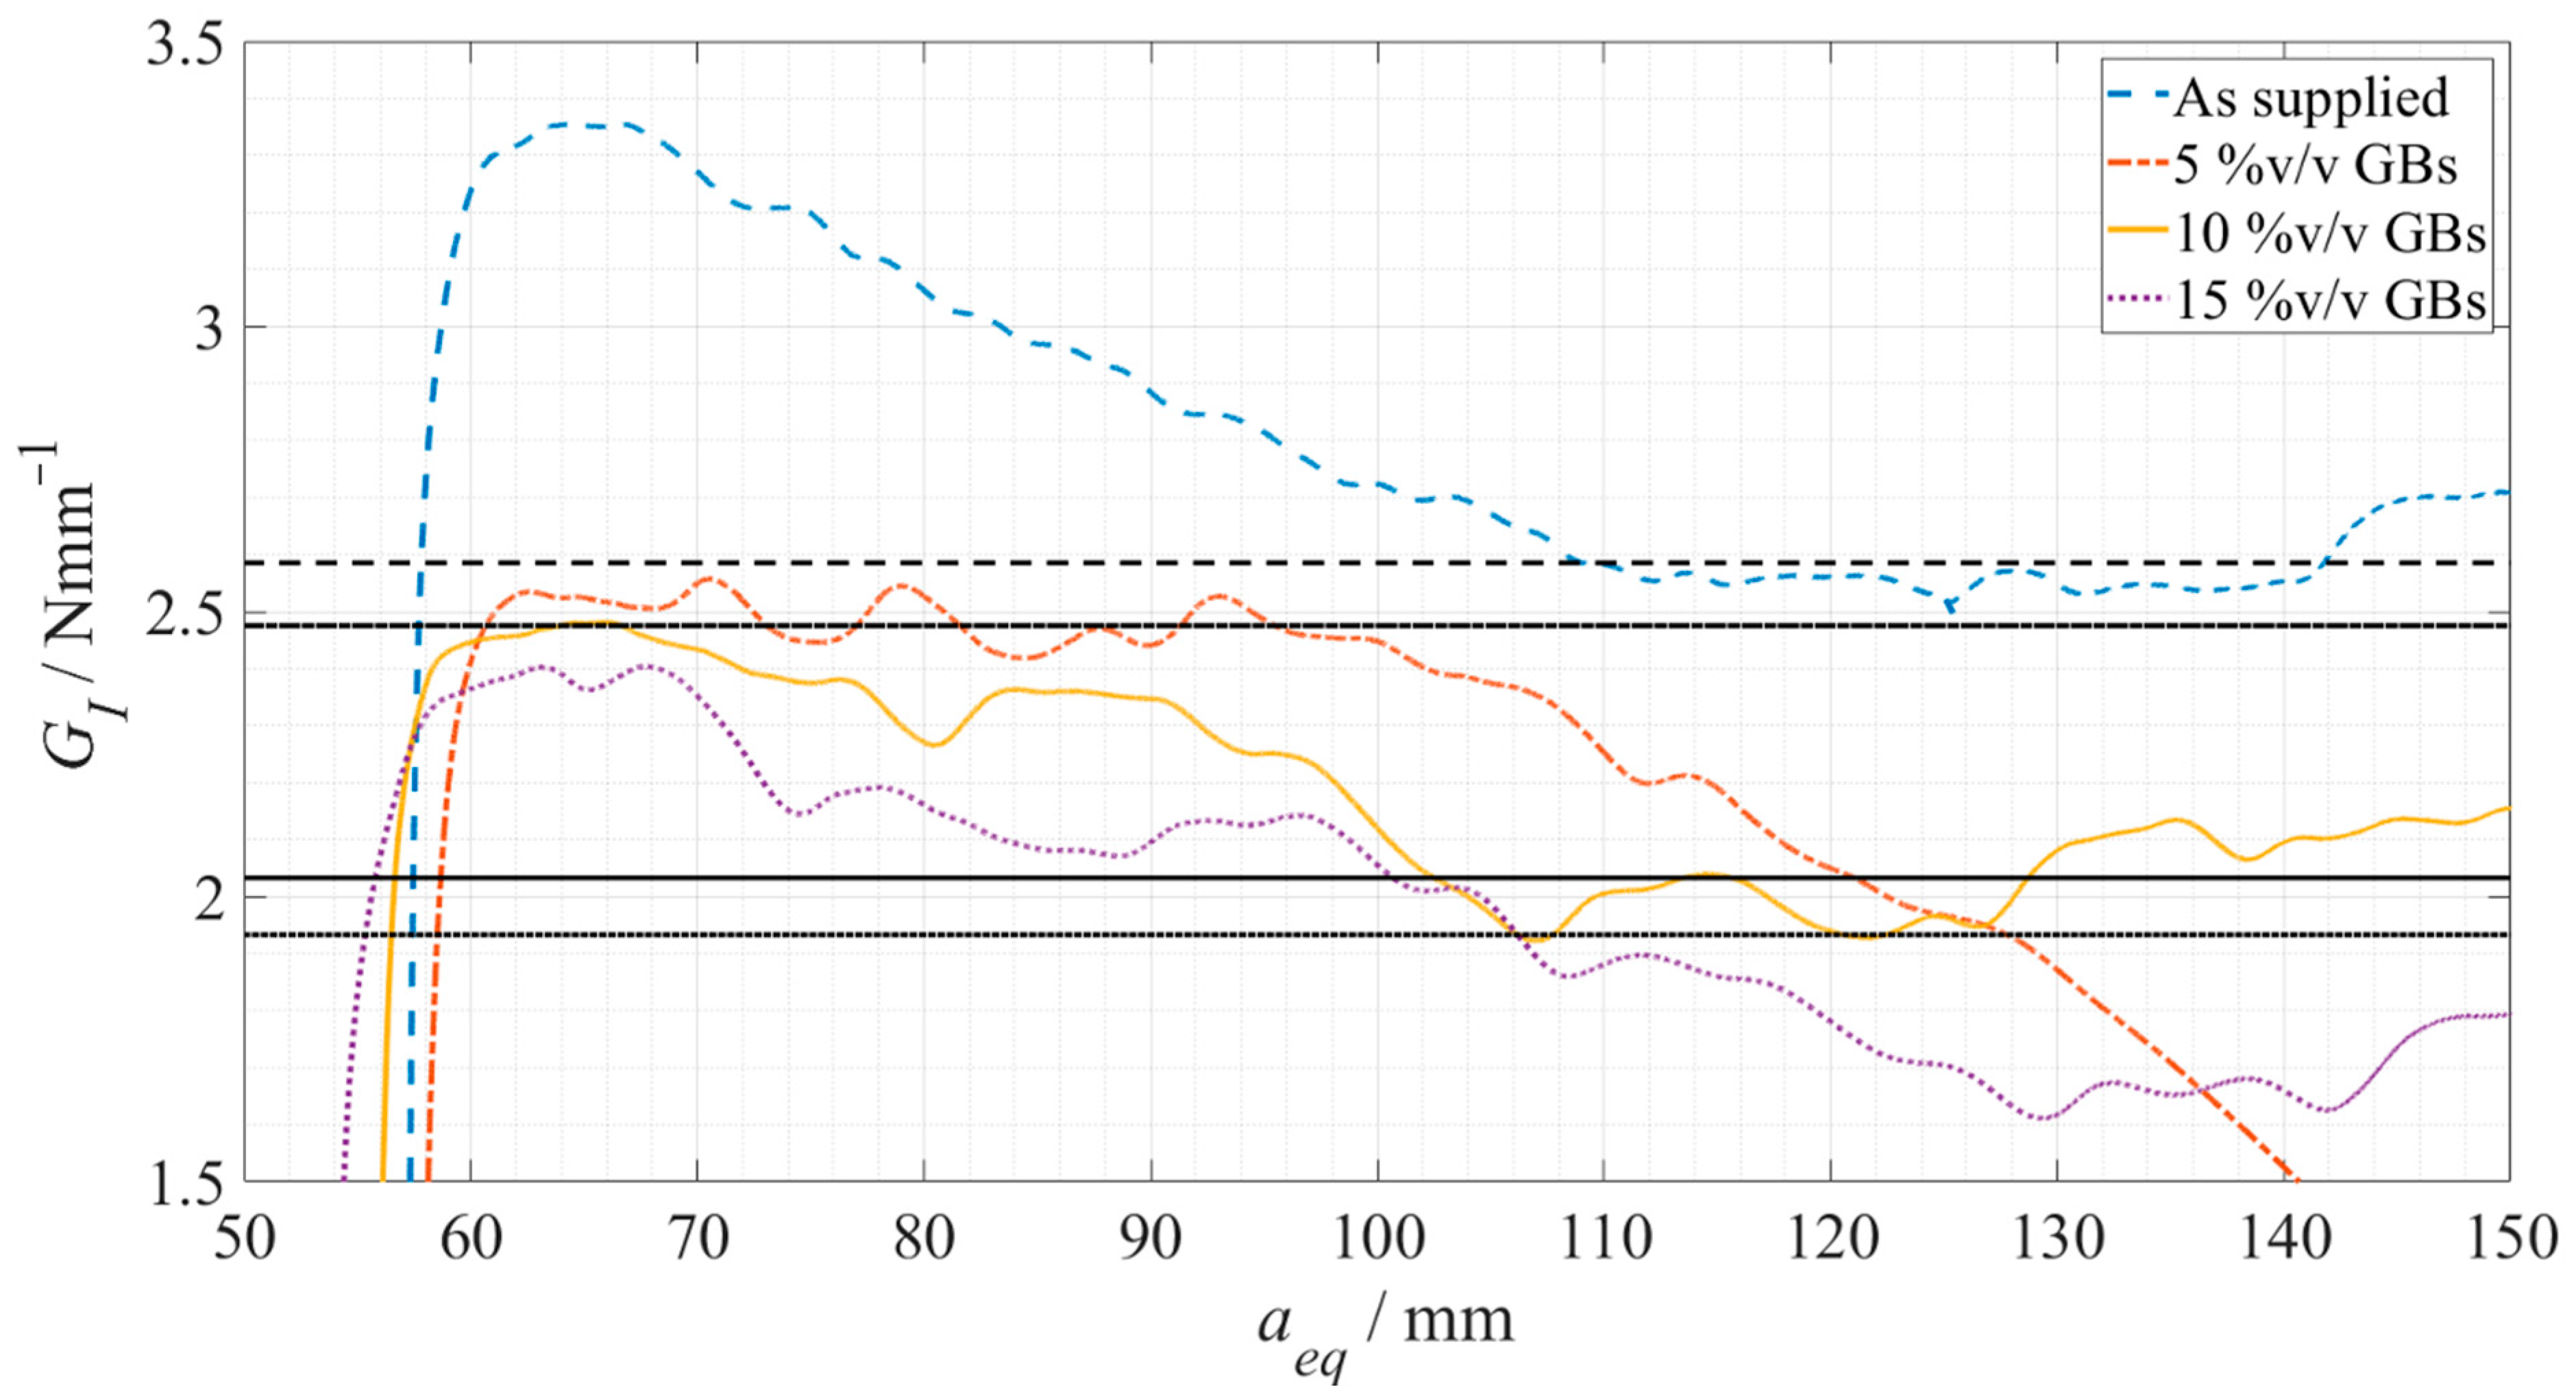
Figure 8.
Representative R-curves for each Adhesive A configuration. As supplied is presented in a dashed blue line, 5%v/v GBs in a dot-dashed orange line, 10%v/v GBs in a full yellow line, and 15%v/v GBs in a dotted purple line, being each GIC plateau represented in dark grey with the corresponding line pattern.
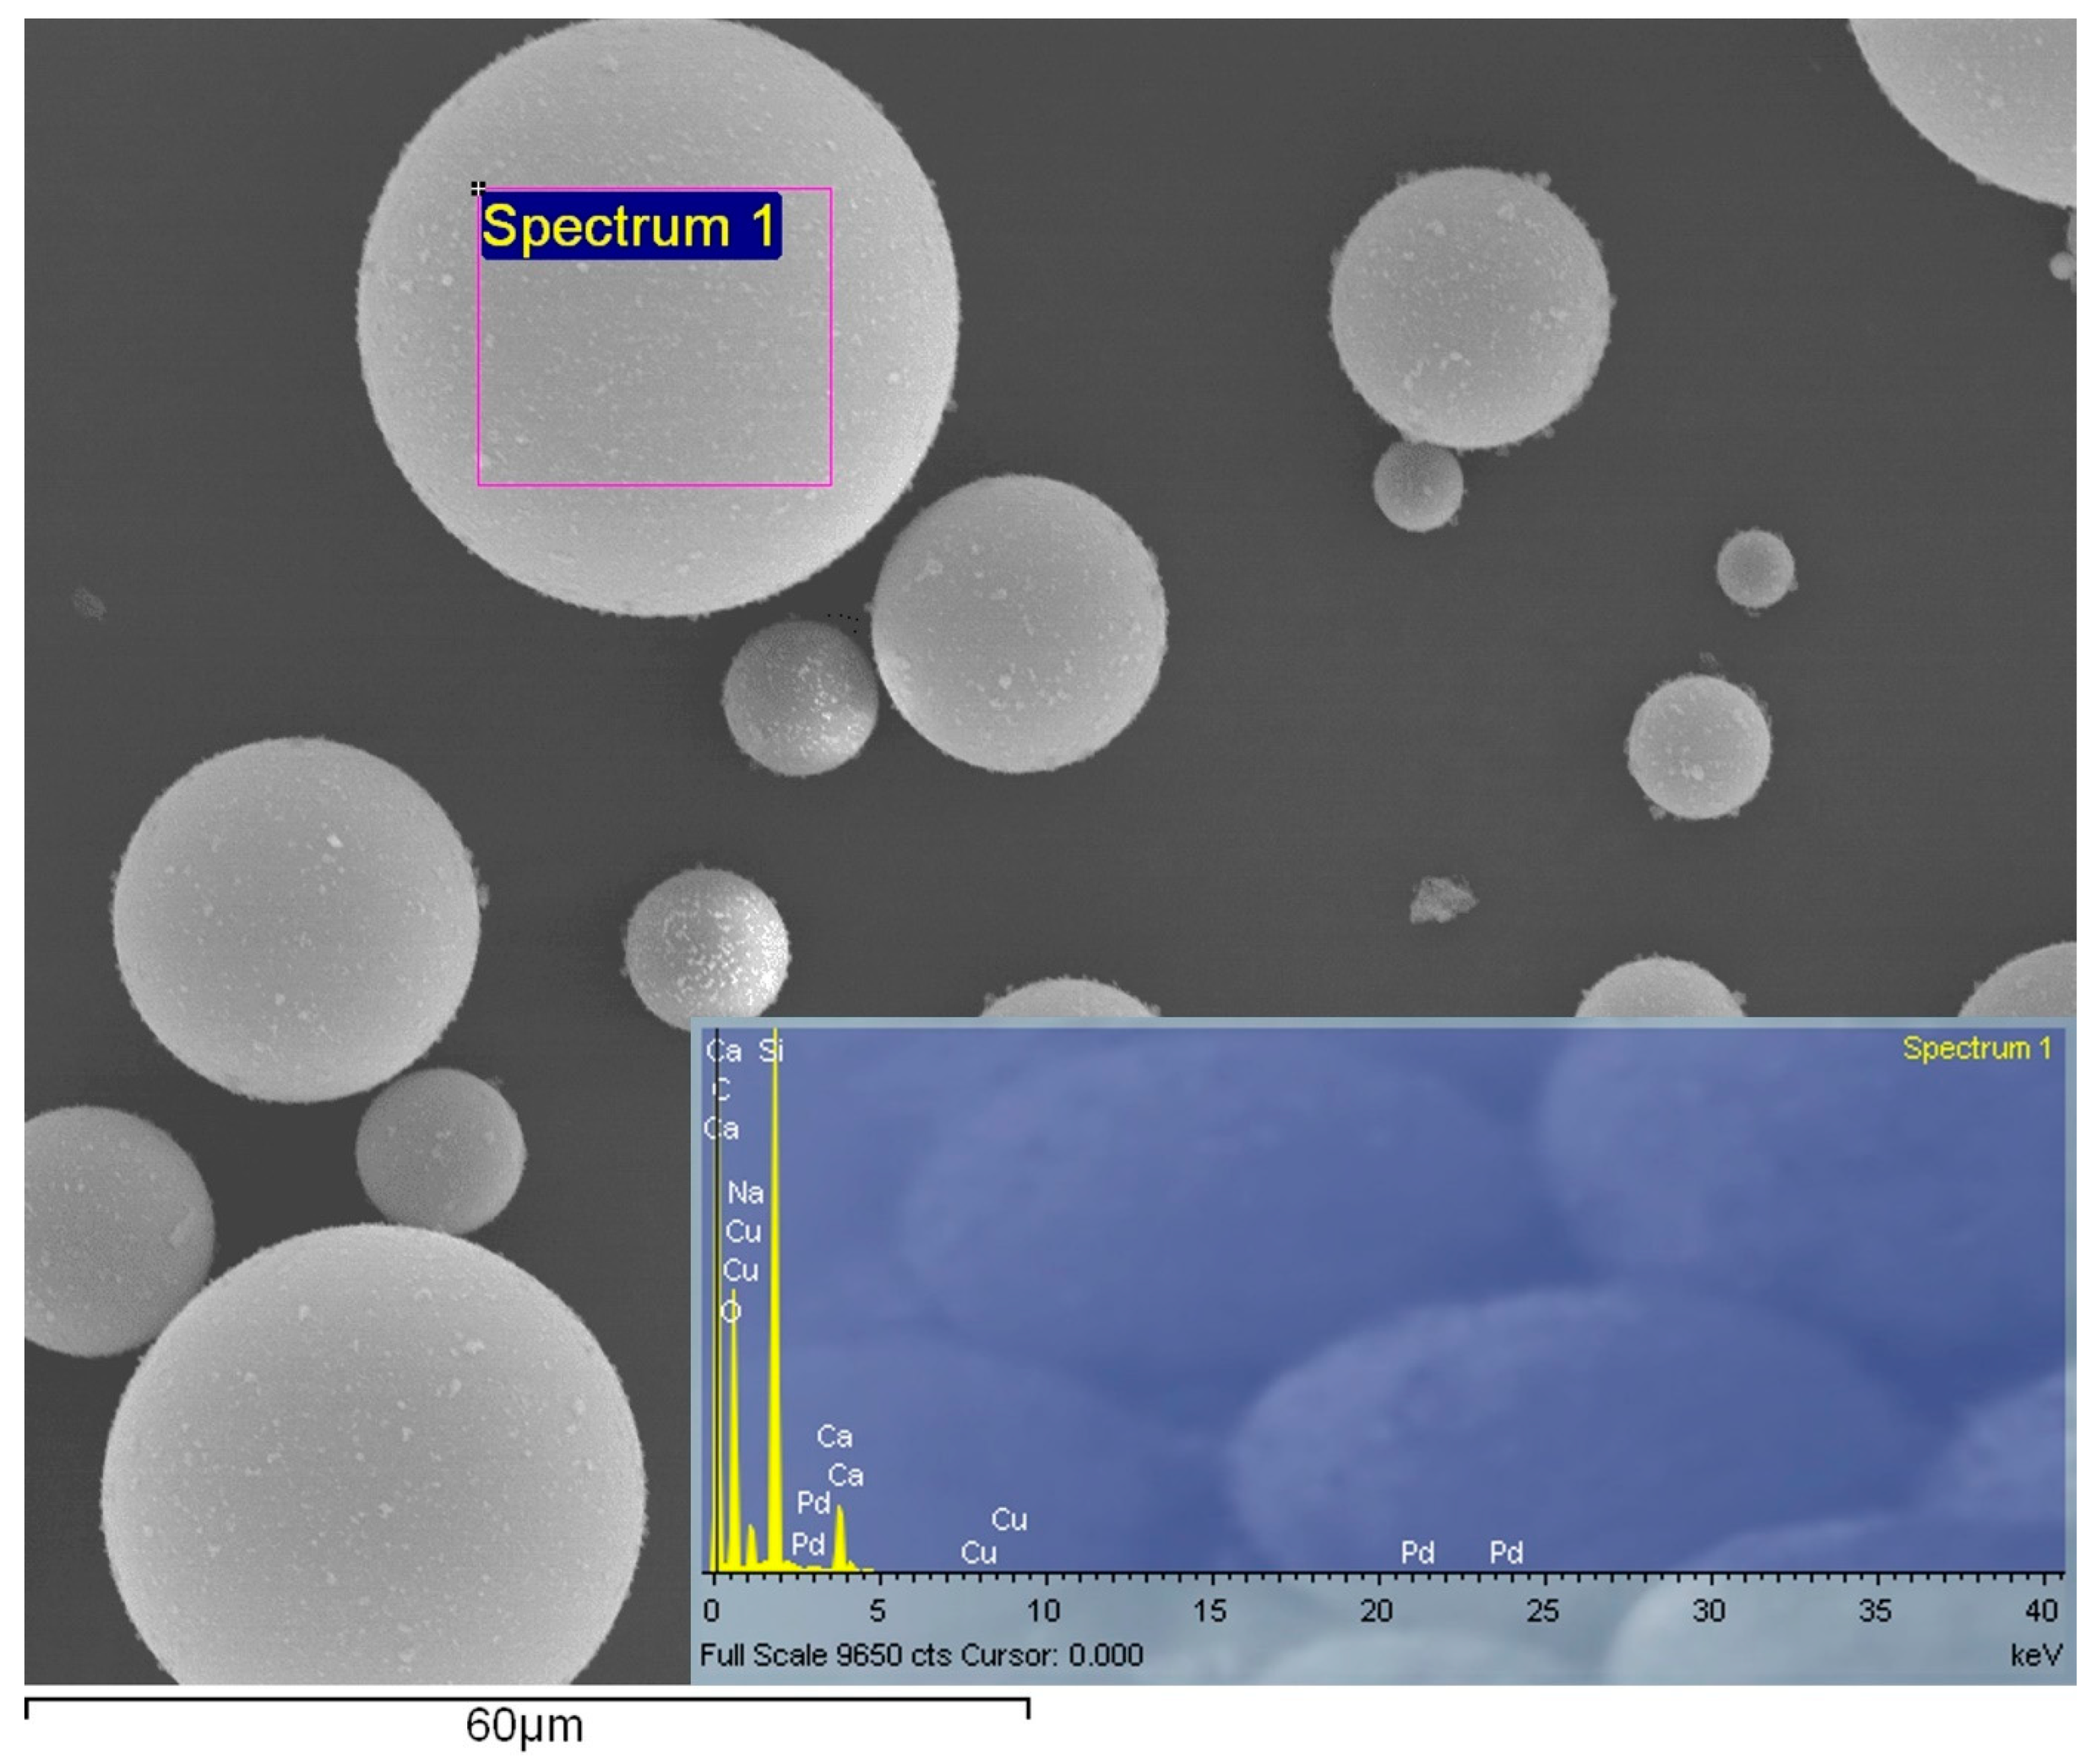
Figure 9.
Backscatter electron analysis of the glass microspheres, and the respective spectrum analysis of the spheres in the highlighted area (Spectrum 1).
Figure 9.
Backscatter electron analysis of the glass microspheres, and the respective spectrum analysis of the spheres in the highlighted area (Spectrum 1).
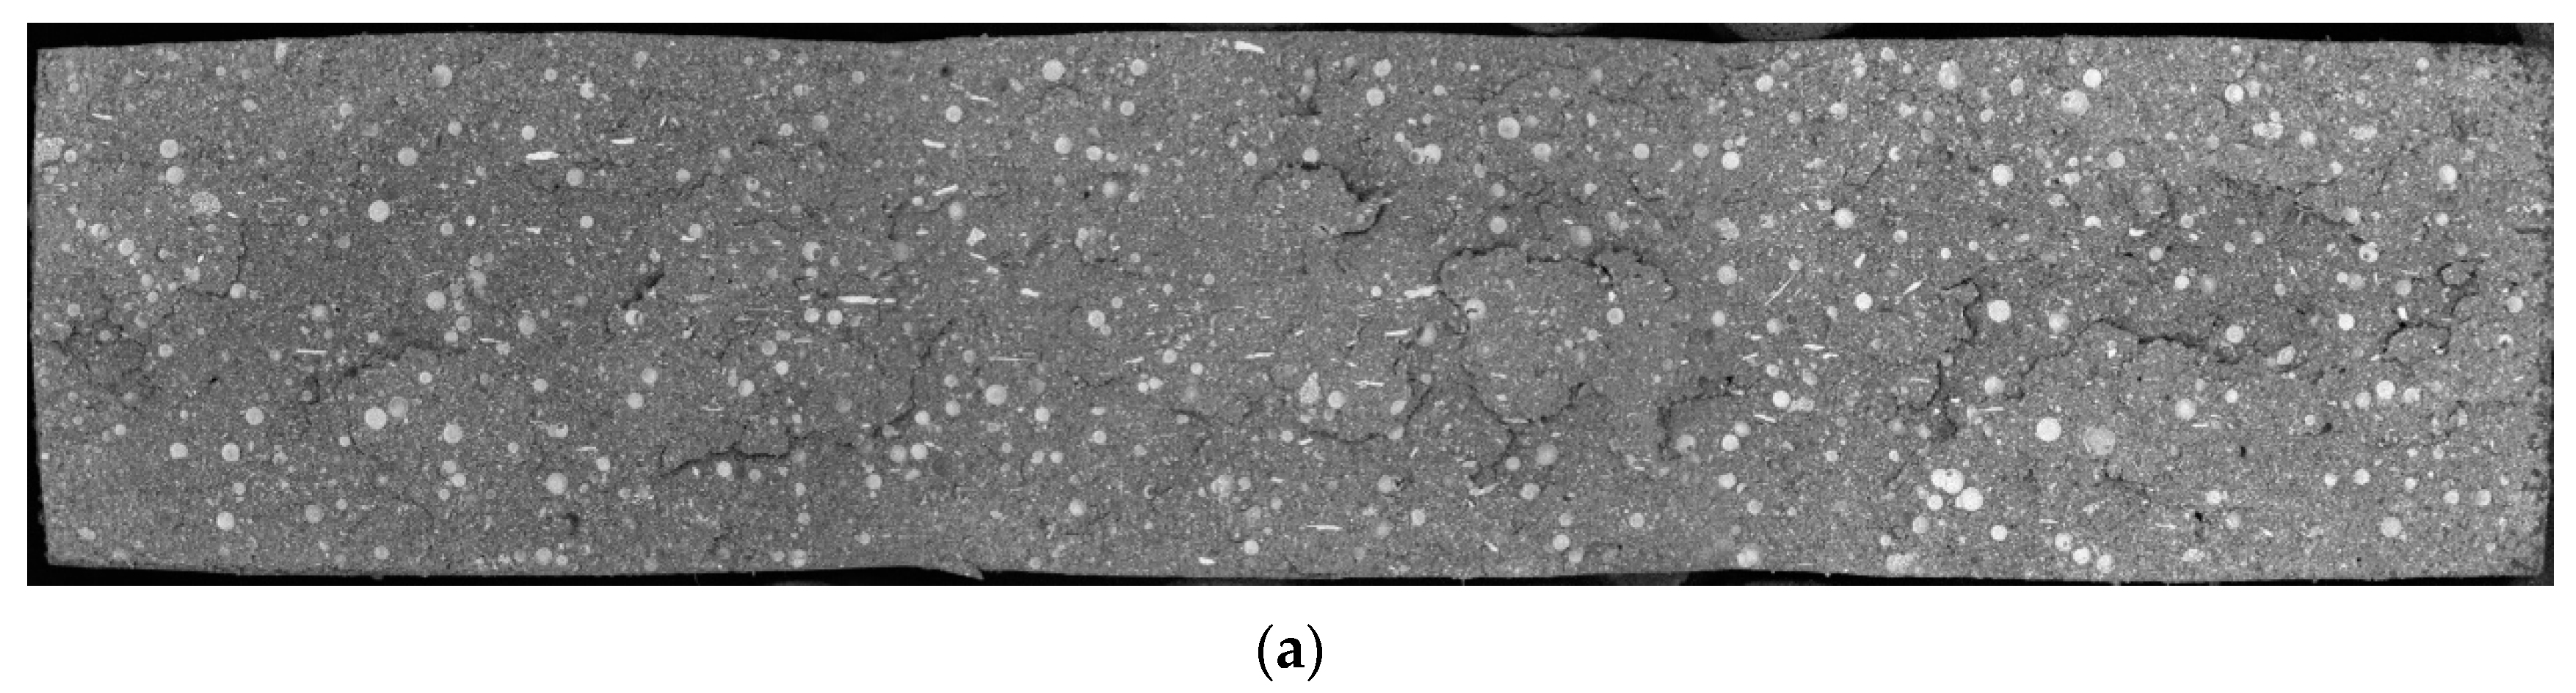
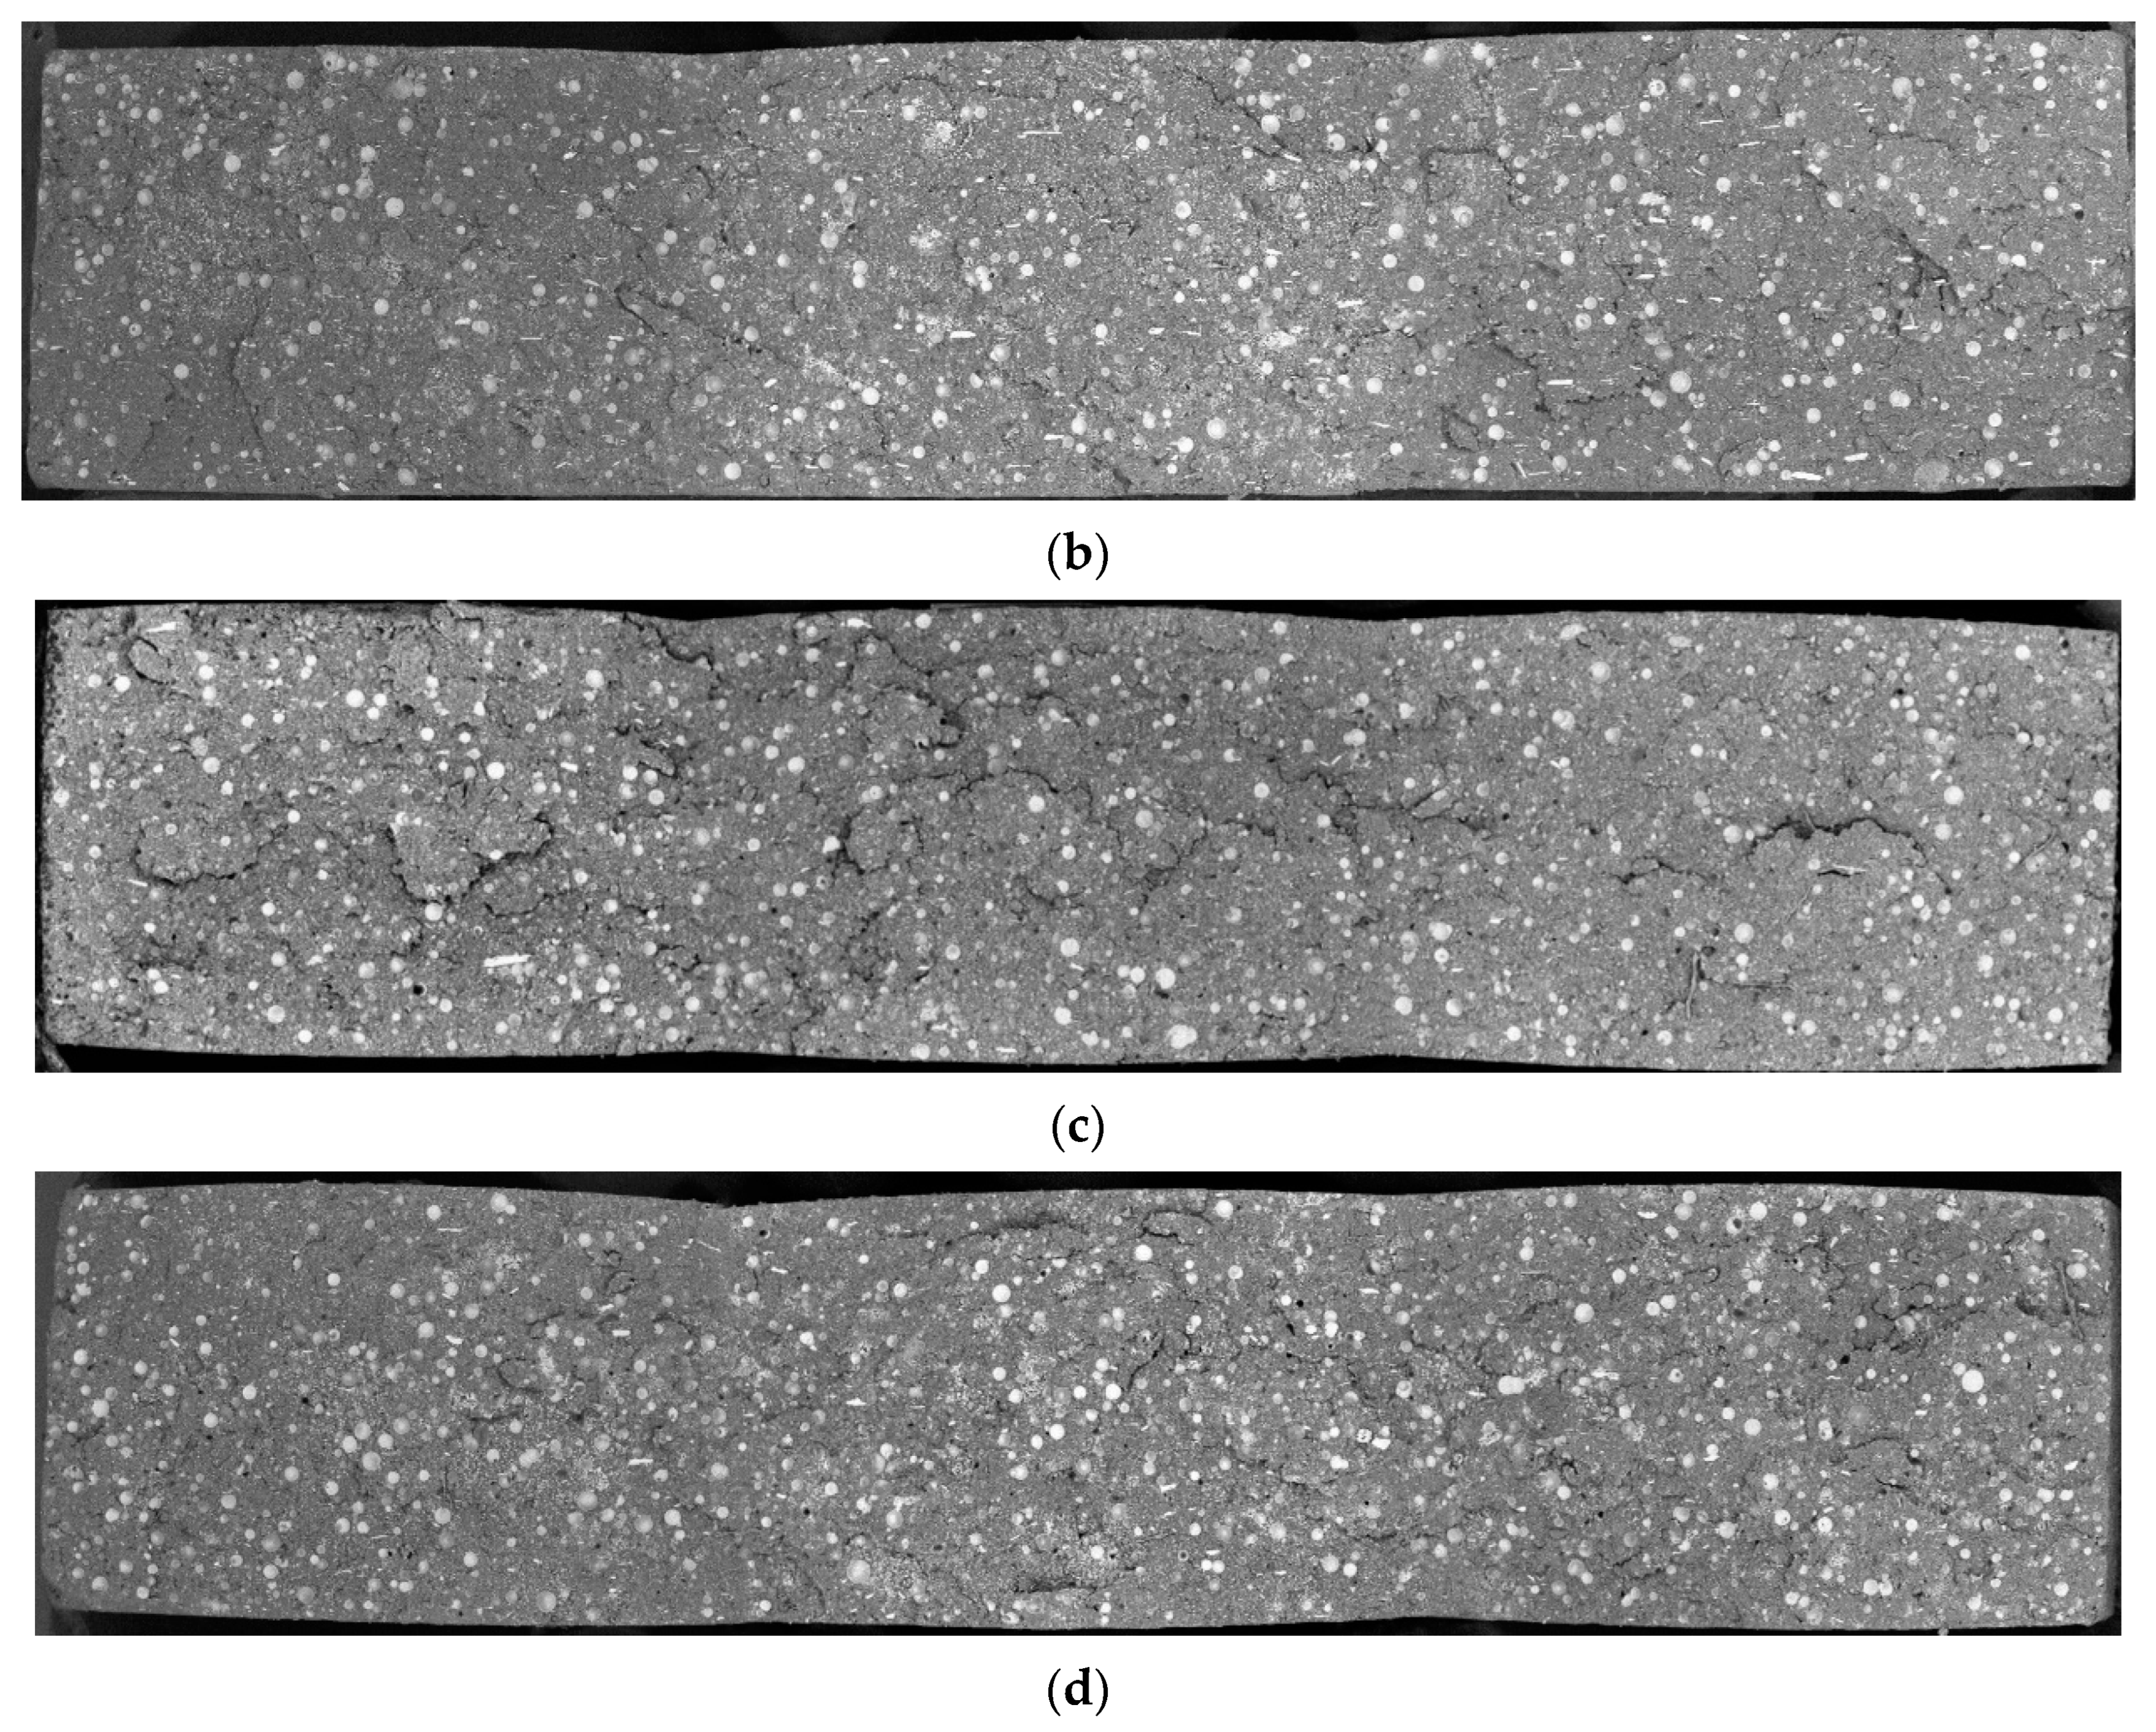
Figure 10.
Fracture surfaces of the bulk specimens of Adhesive A, obtained through backscatter electron analysis. (a) Adhesive A as supplied. (b) Adhesive A doped with 5% GBs. (c) Adhesive A doped with 10% GBs. (d) Adhesive A doped with 15% GBs.
Figure 10.
Fracture surfaces of the bulk specimens of Adhesive A, obtained through backscatter electron analysis. (a) Adhesive A as supplied. (b) Adhesive A doped with 5% GBs. (c) Adhesive A doped with 10% GBs. (d) Adhesive A doped with 15% GBs.
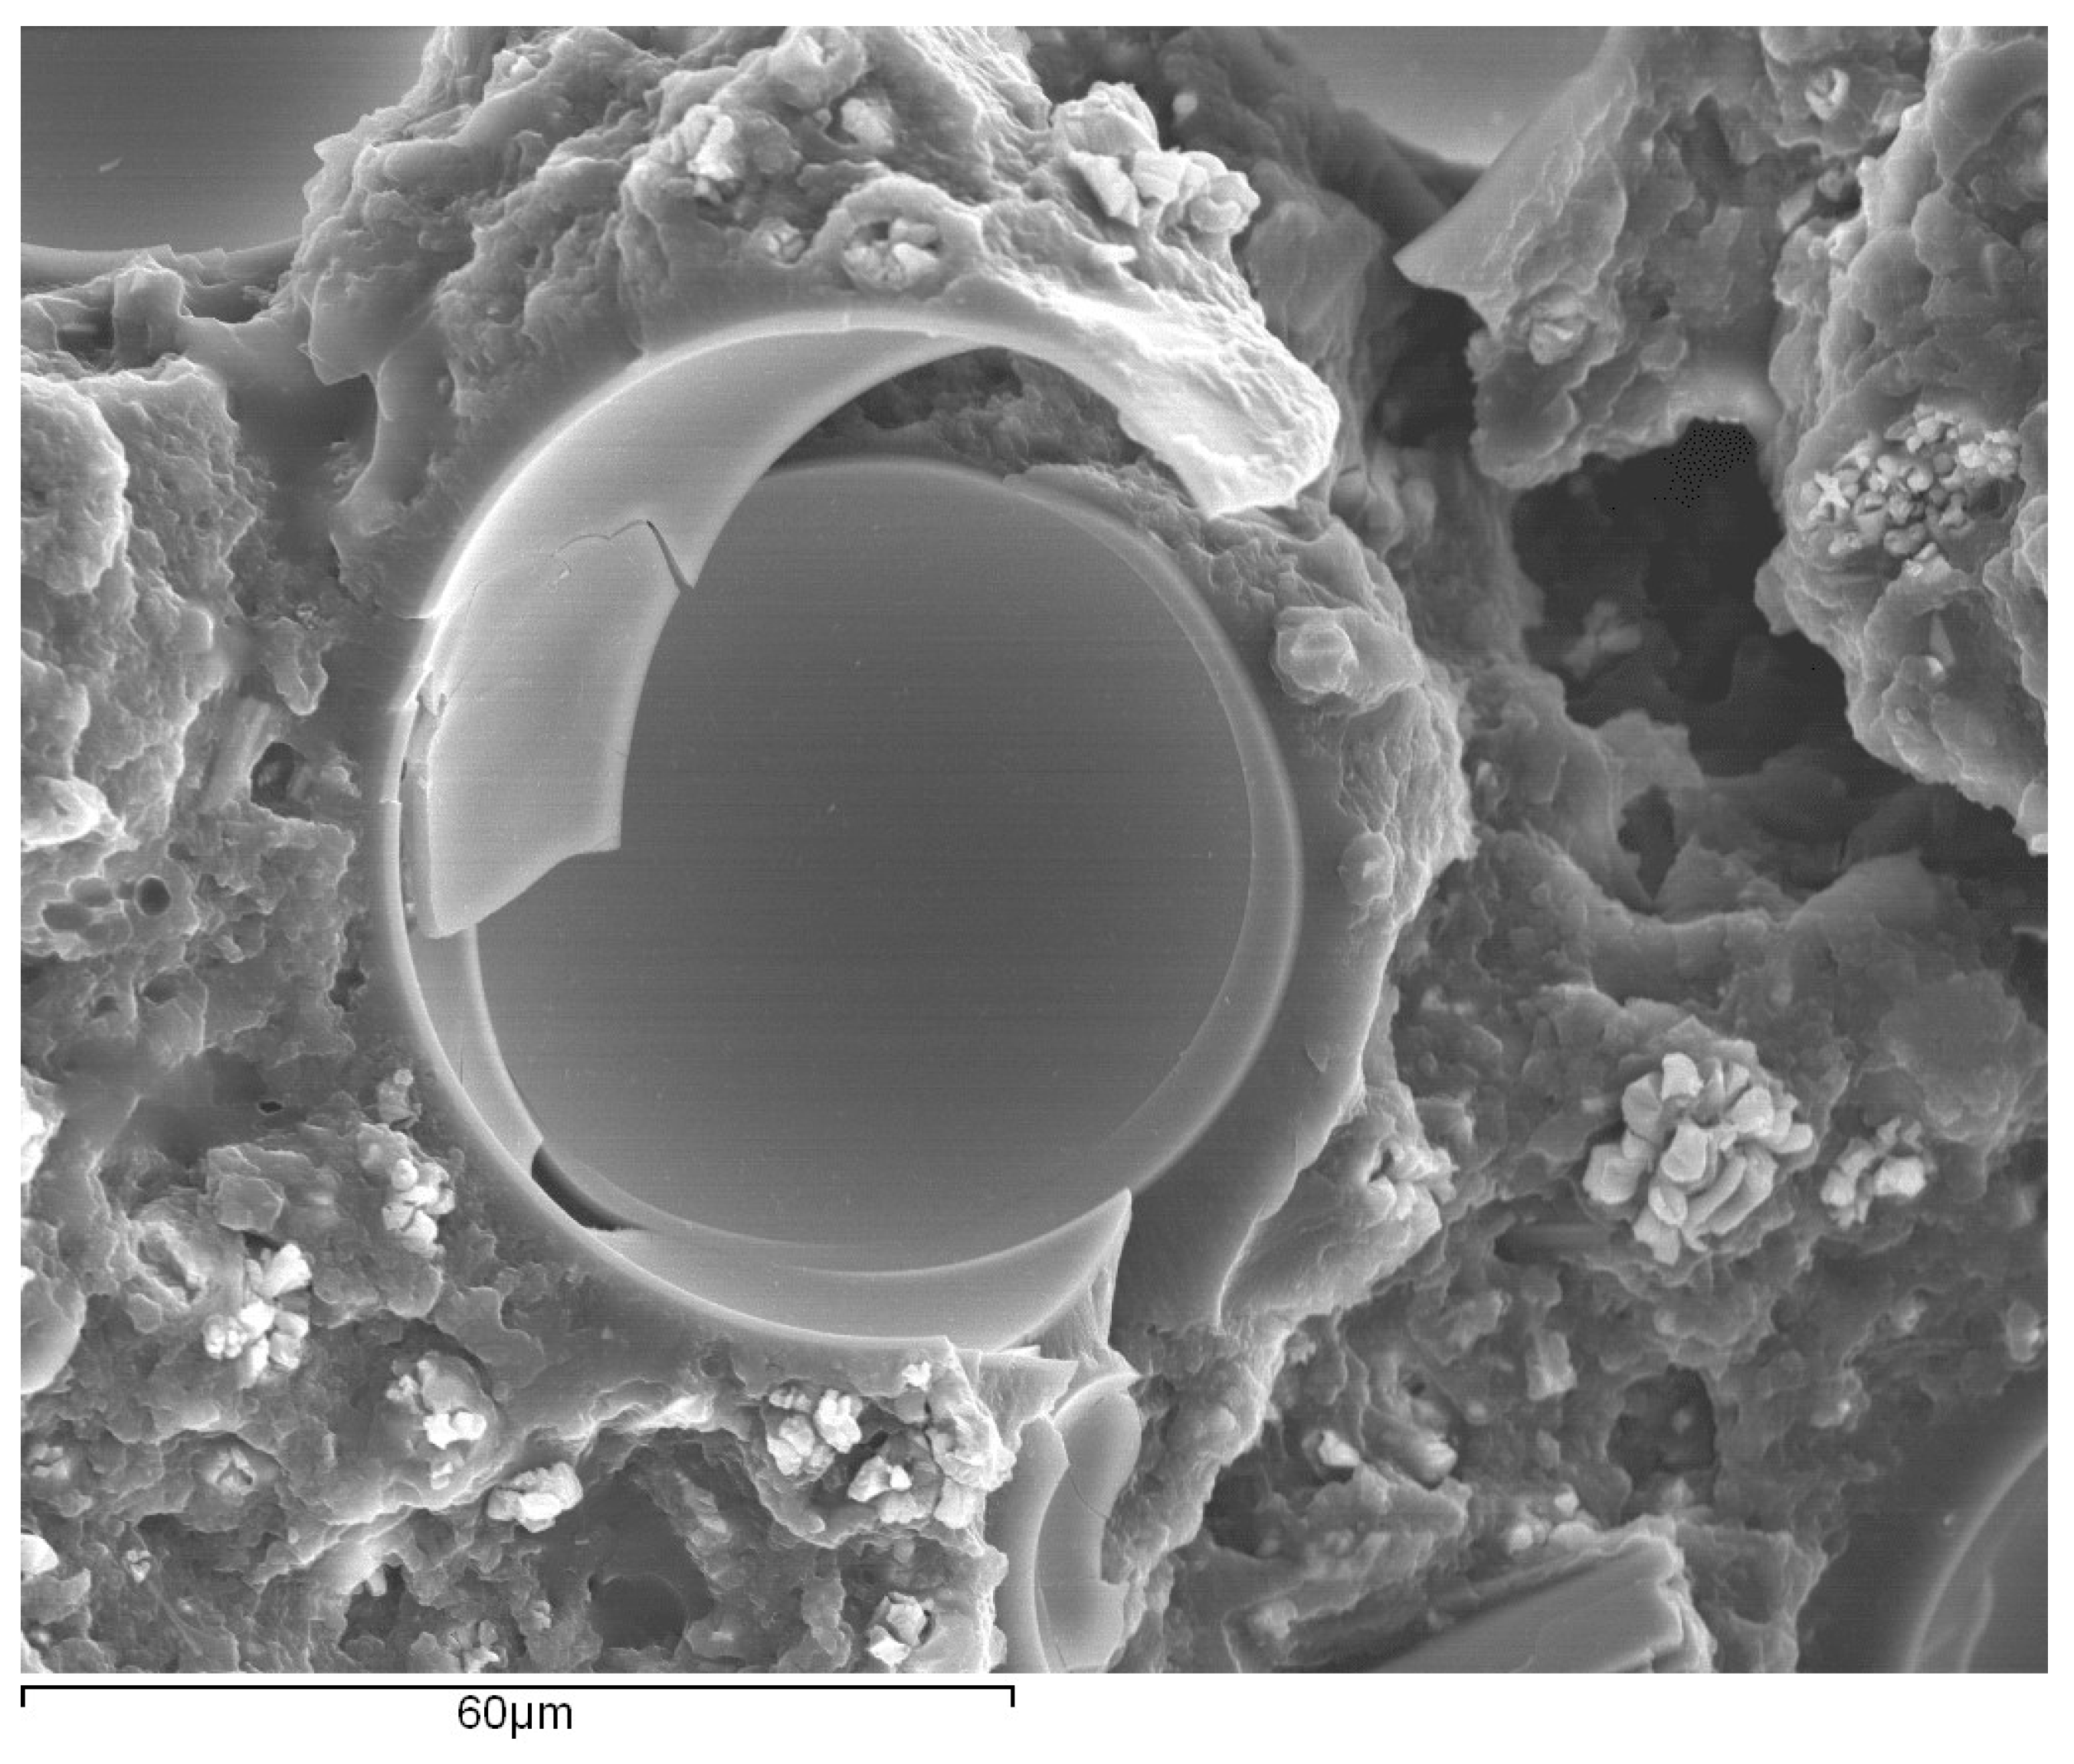
Figure 11.
Fracture surface of a bulk specimen with focus on the region around the glass beads, obtained through secondary electron analysis.
Figure 11.
Fracture surface of a bulk specimen with focus on the region around the glass beads, obtained through secondary electron analysis.
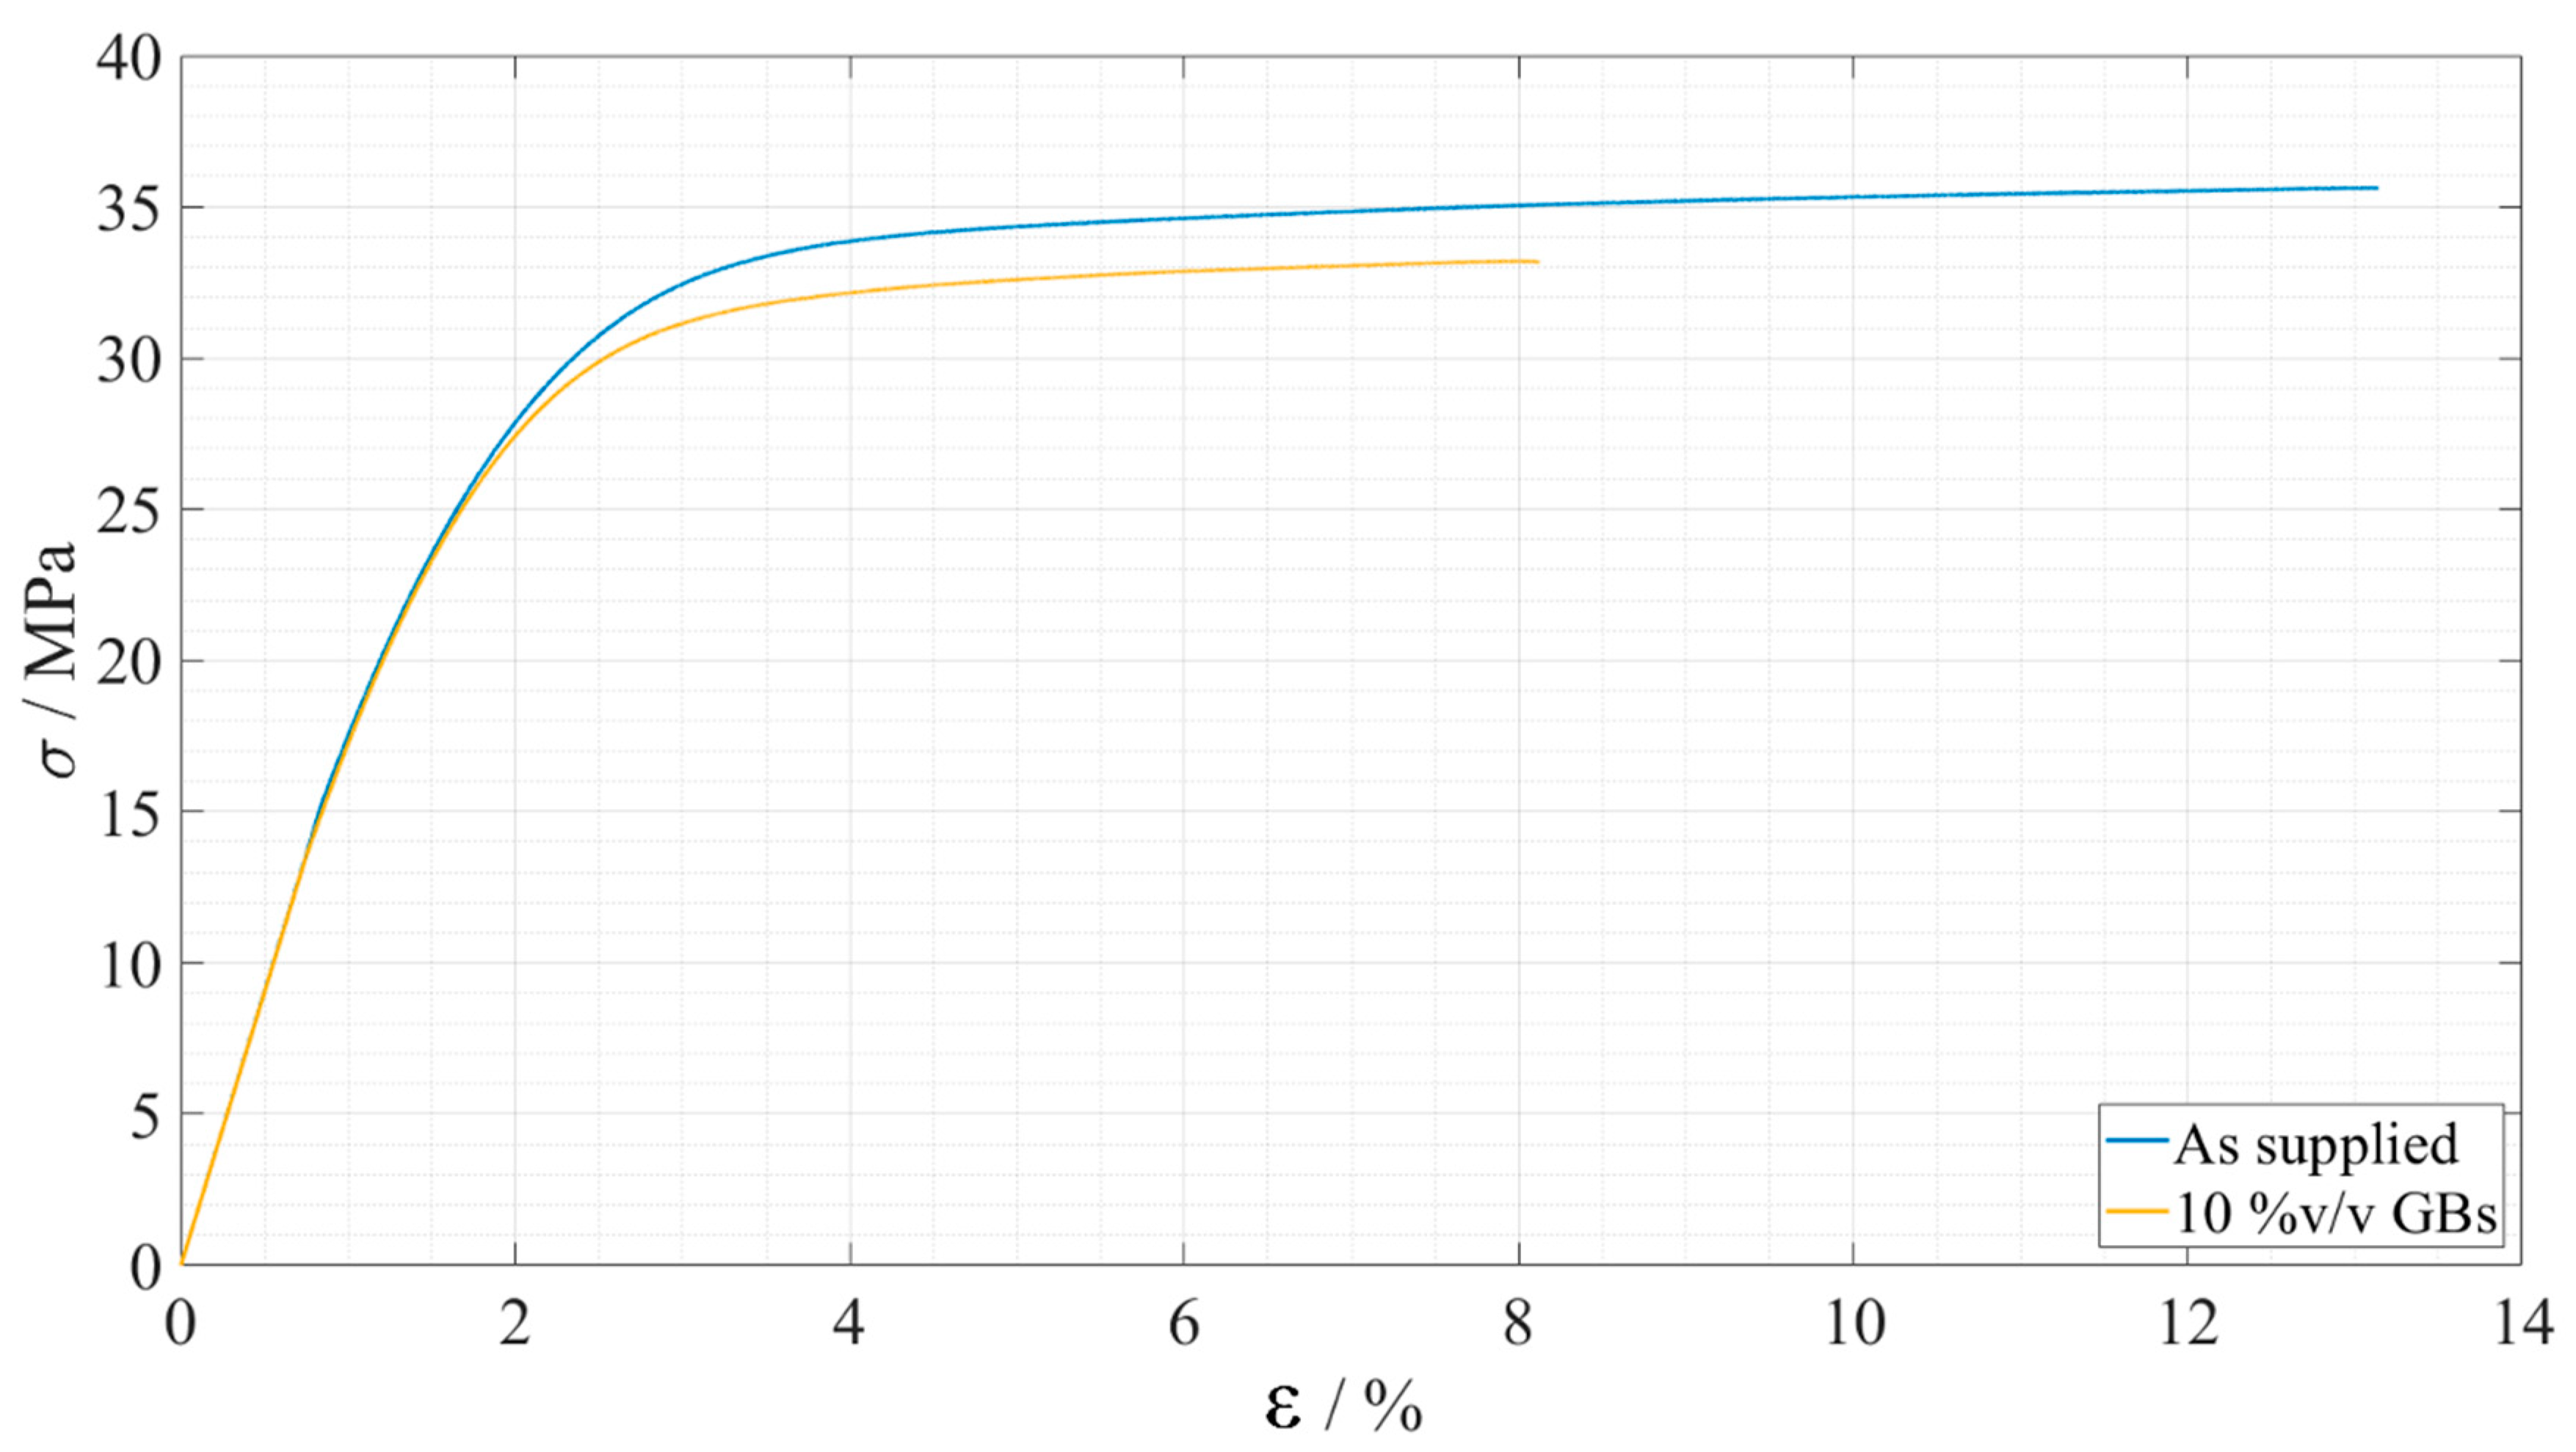
Figure 12.
Representative stress-strain curves of the bulk tensile tests for each Adhesive B configuration. As supplied is presented in blue and 10%v/v GBs in yellow.
Figure 12.
Representative stress-strain curves of the bulk tensile tests for each Adhesive B configuration. As supplied is presented in blue and 10%v/v GBs in yellow.
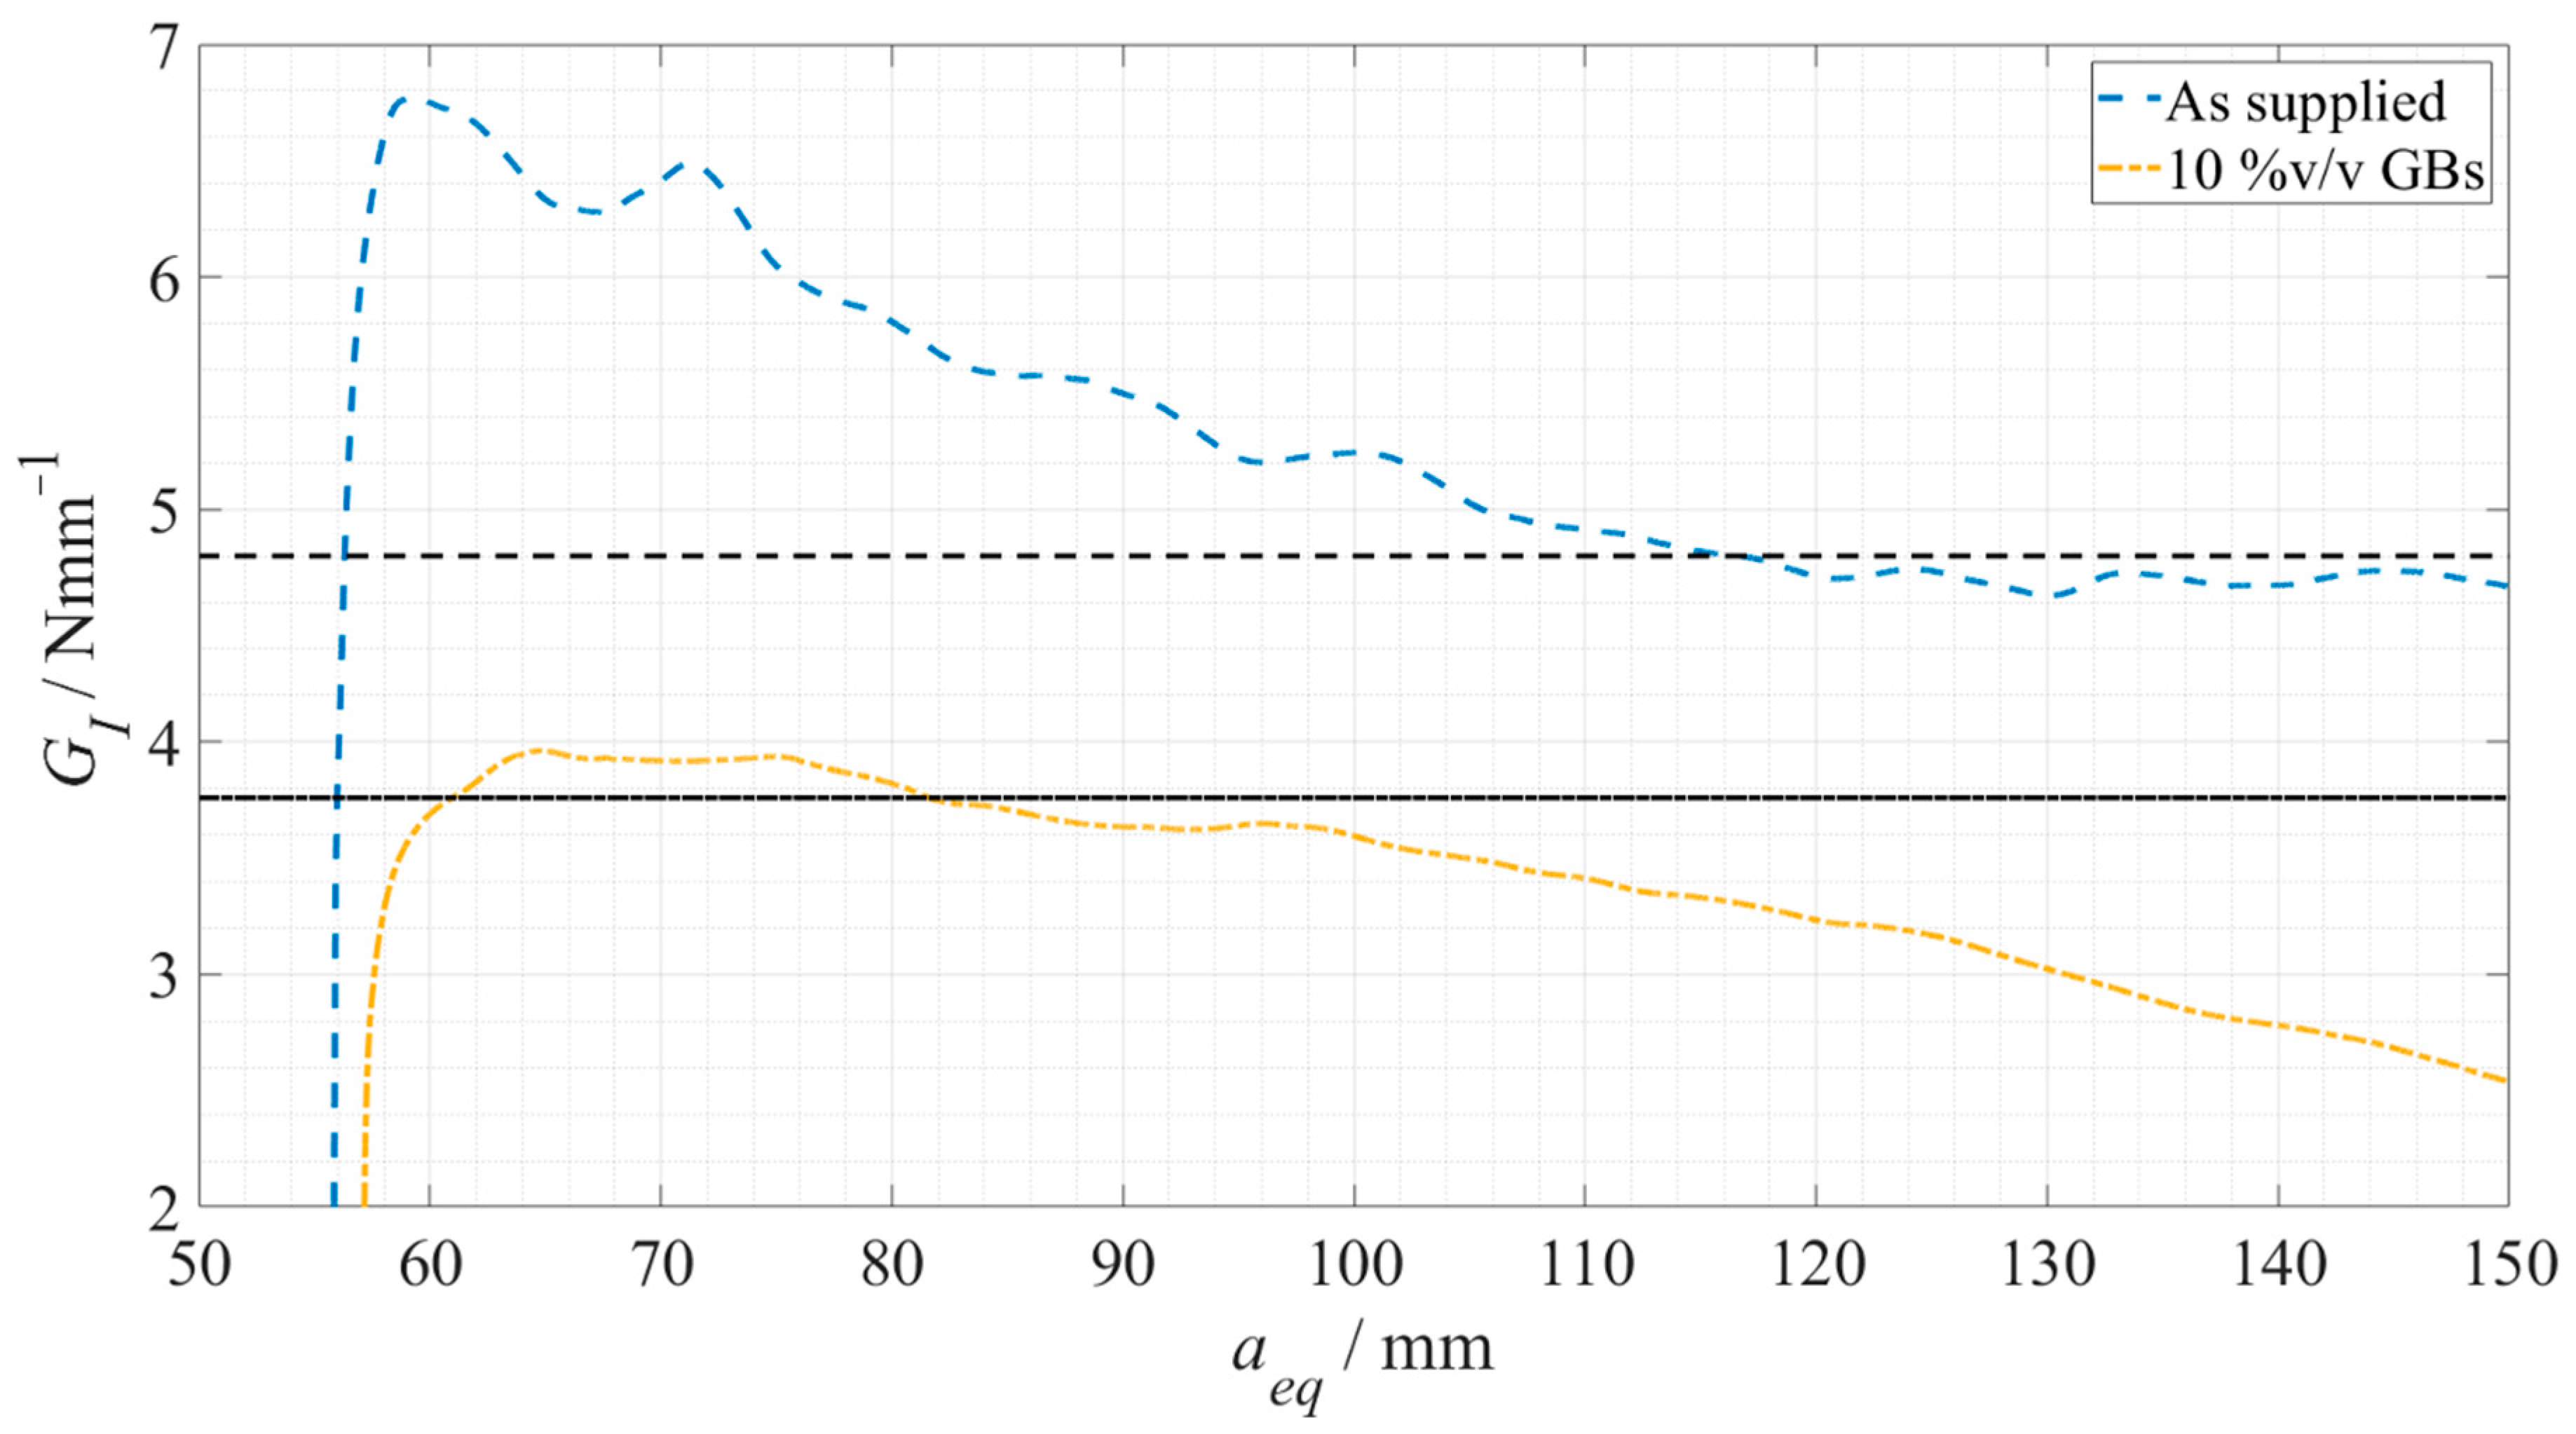
Figure 13.
Representative R-curves for each Adhesive B configuration. As supplied is presented in a dashed blue line and 10%v/v GBs in a dot-dashed yellow line, each GIC plateau being represented in dark grey with the corresponding line pattern.
Figure 13.
Representative R-curves for each Adhesive B configuration. As supplied is presented in a dashed blue line and 10%v/v GBs in a dot-dashed yellow line, each GIC plateau being represented in dark grey with the corresponding line pattern.
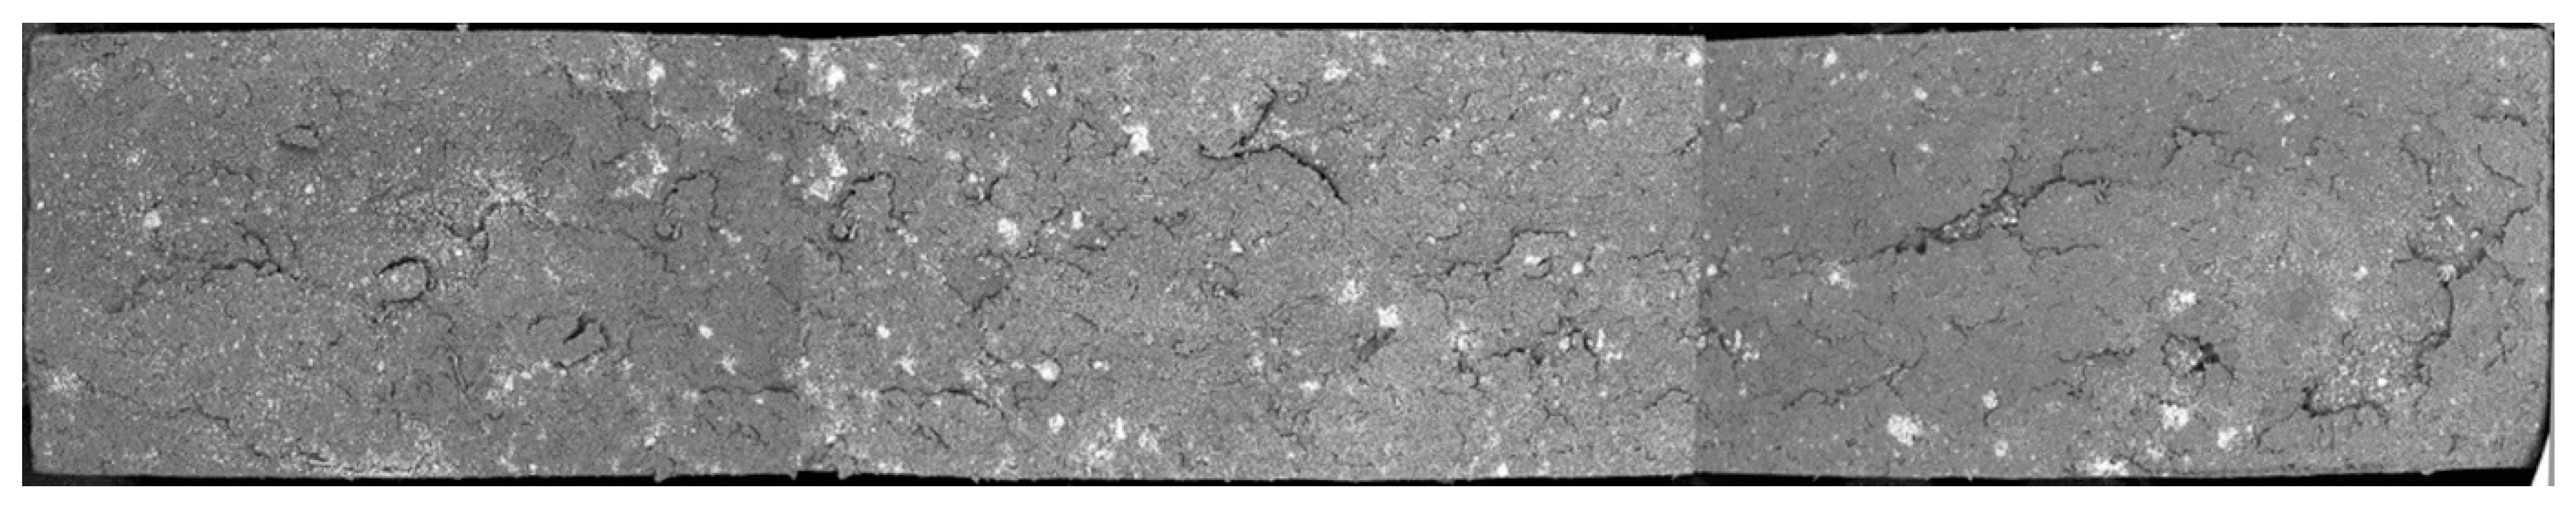
Figure 14.
Fracture surfaces of bulk specimens of Adhesive B in the as supplied state, obtained through backscatter electron analysis.
Figure 14.
Fracture surfaces of bulk specimens of Adhesive B in the as supplied state, obtained through backscatter electron analysis.
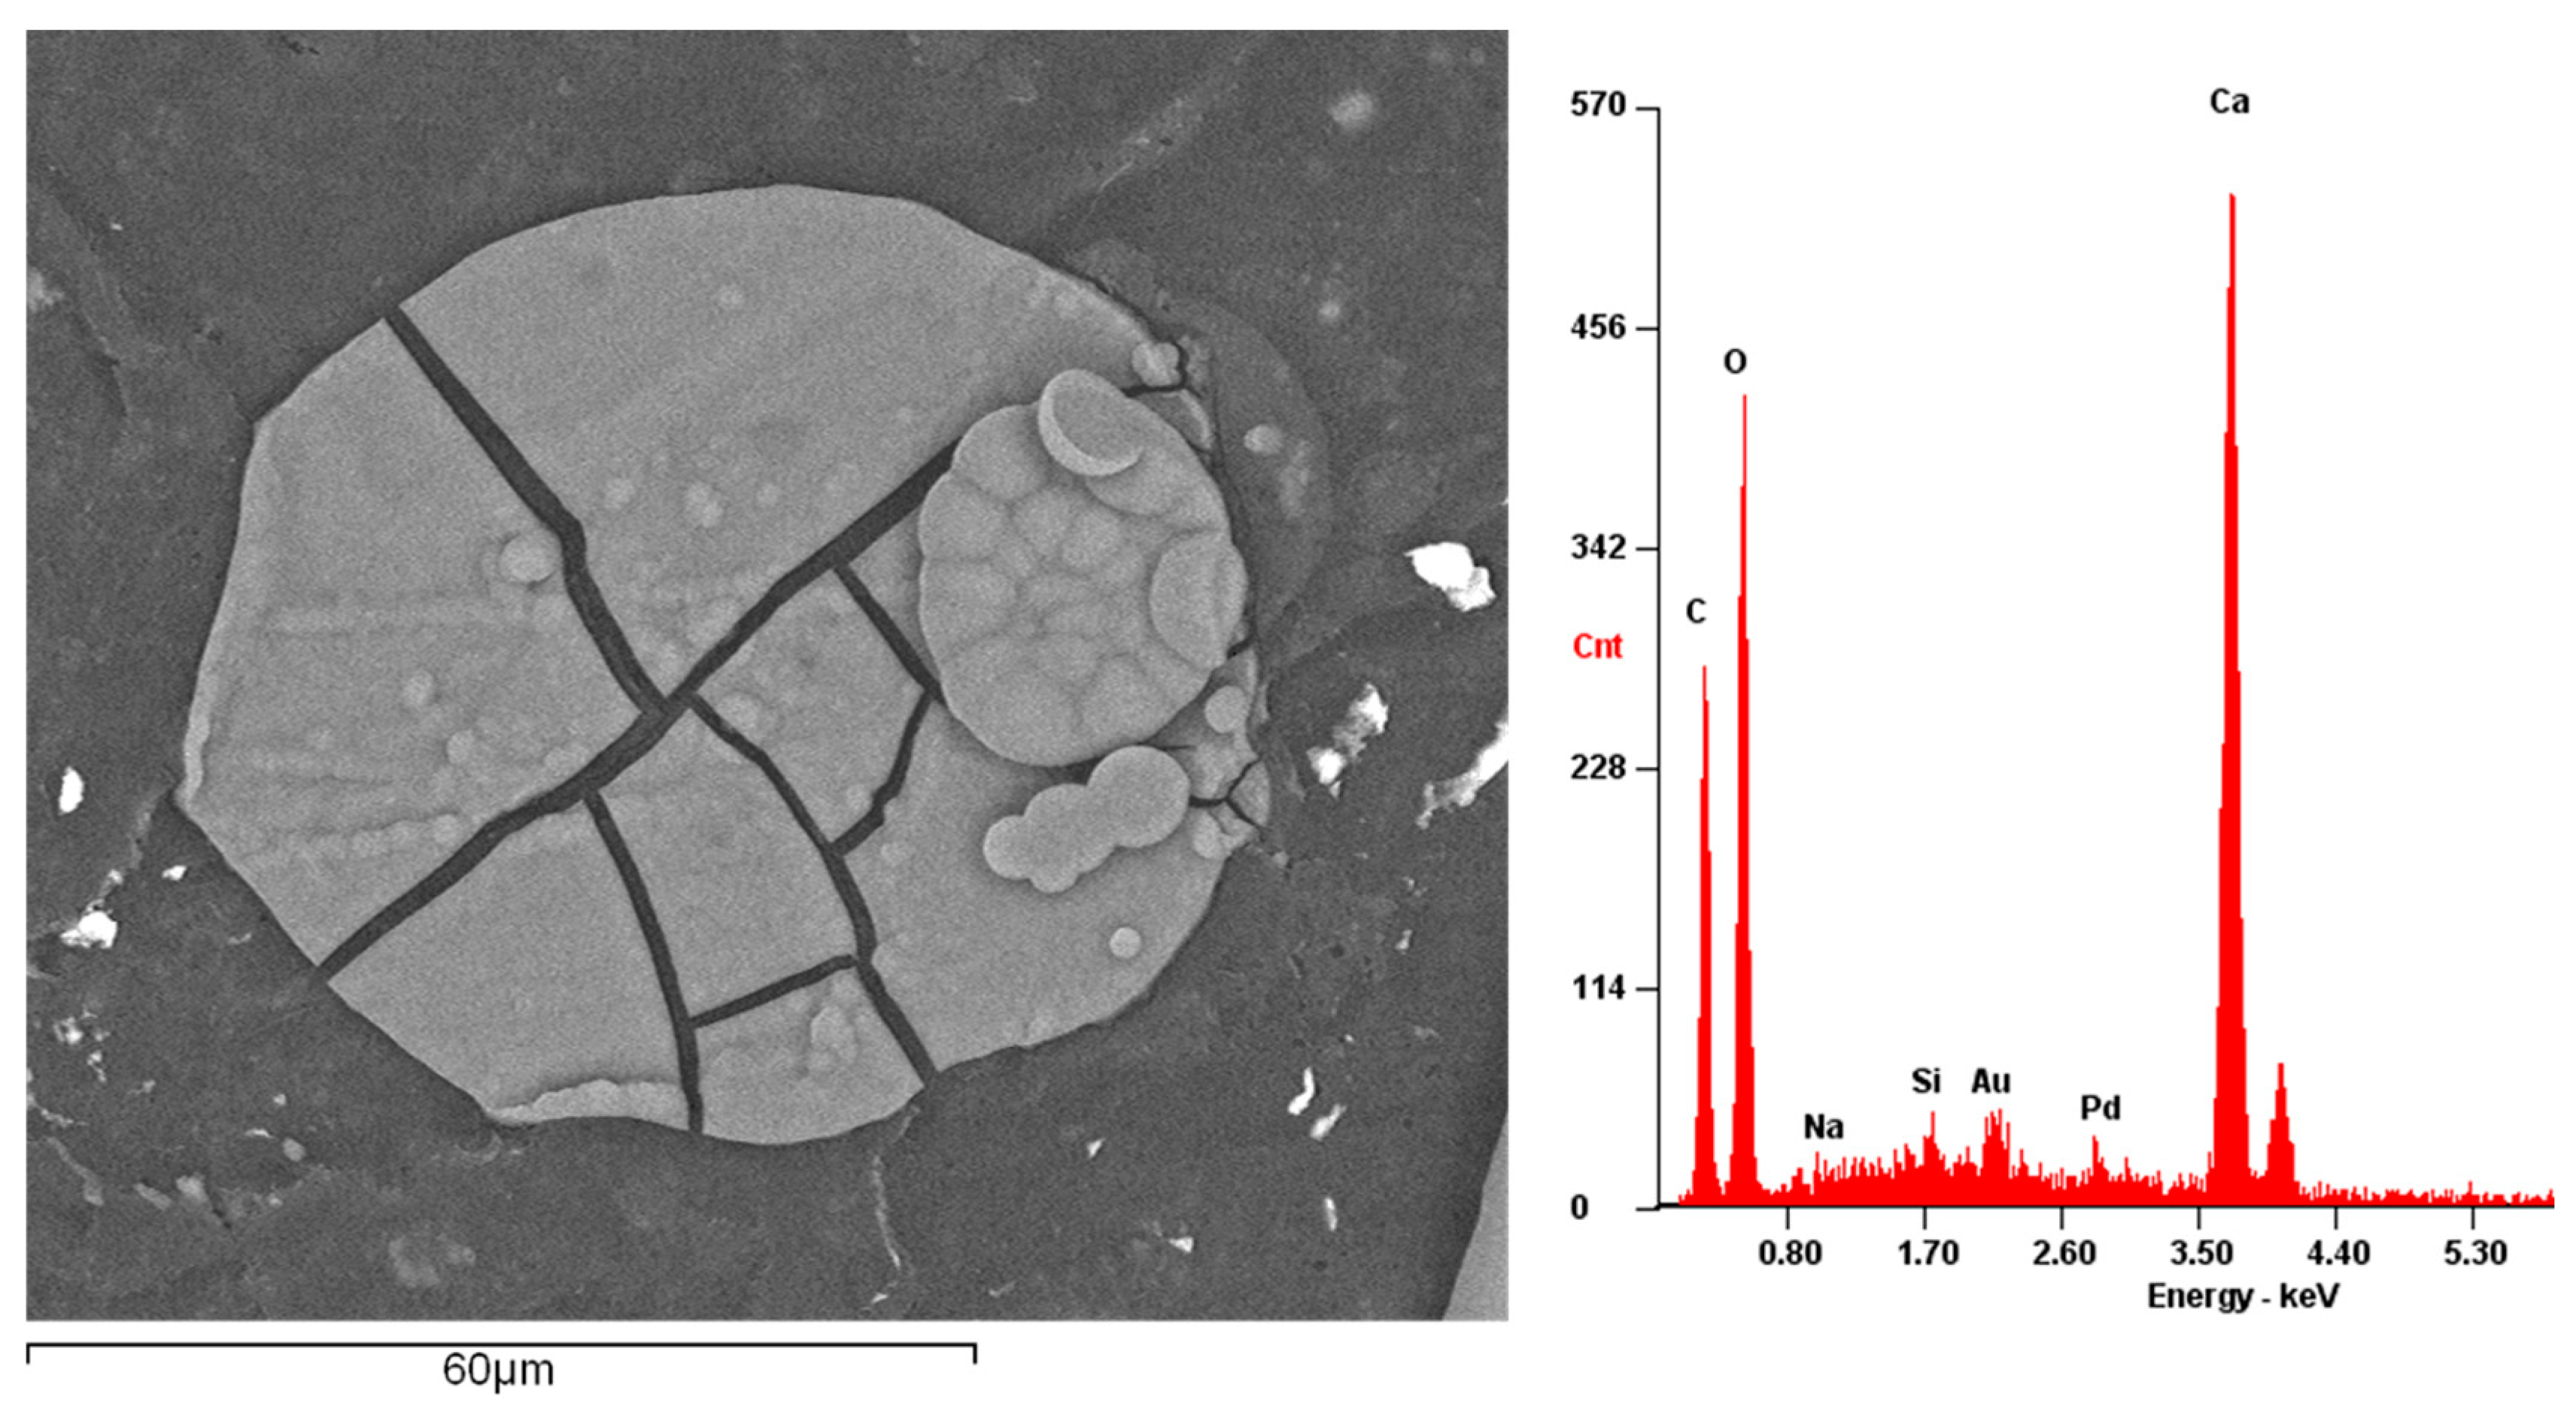
Figure 15.
Fracture surface of a bulk specimen of Adhesive B, with focus on the region around a broken calcium carbonate particle, obtained through secondary electron analysis (left) and its respective spectrum analysis (right).
Figure 15.
Fracture surface of a bulk specimen of Adhesive B, with focus on the region around a broken calcium carbonate particle, obtained through secondary electron analysis (left) and its respective spectrum analysis (right).
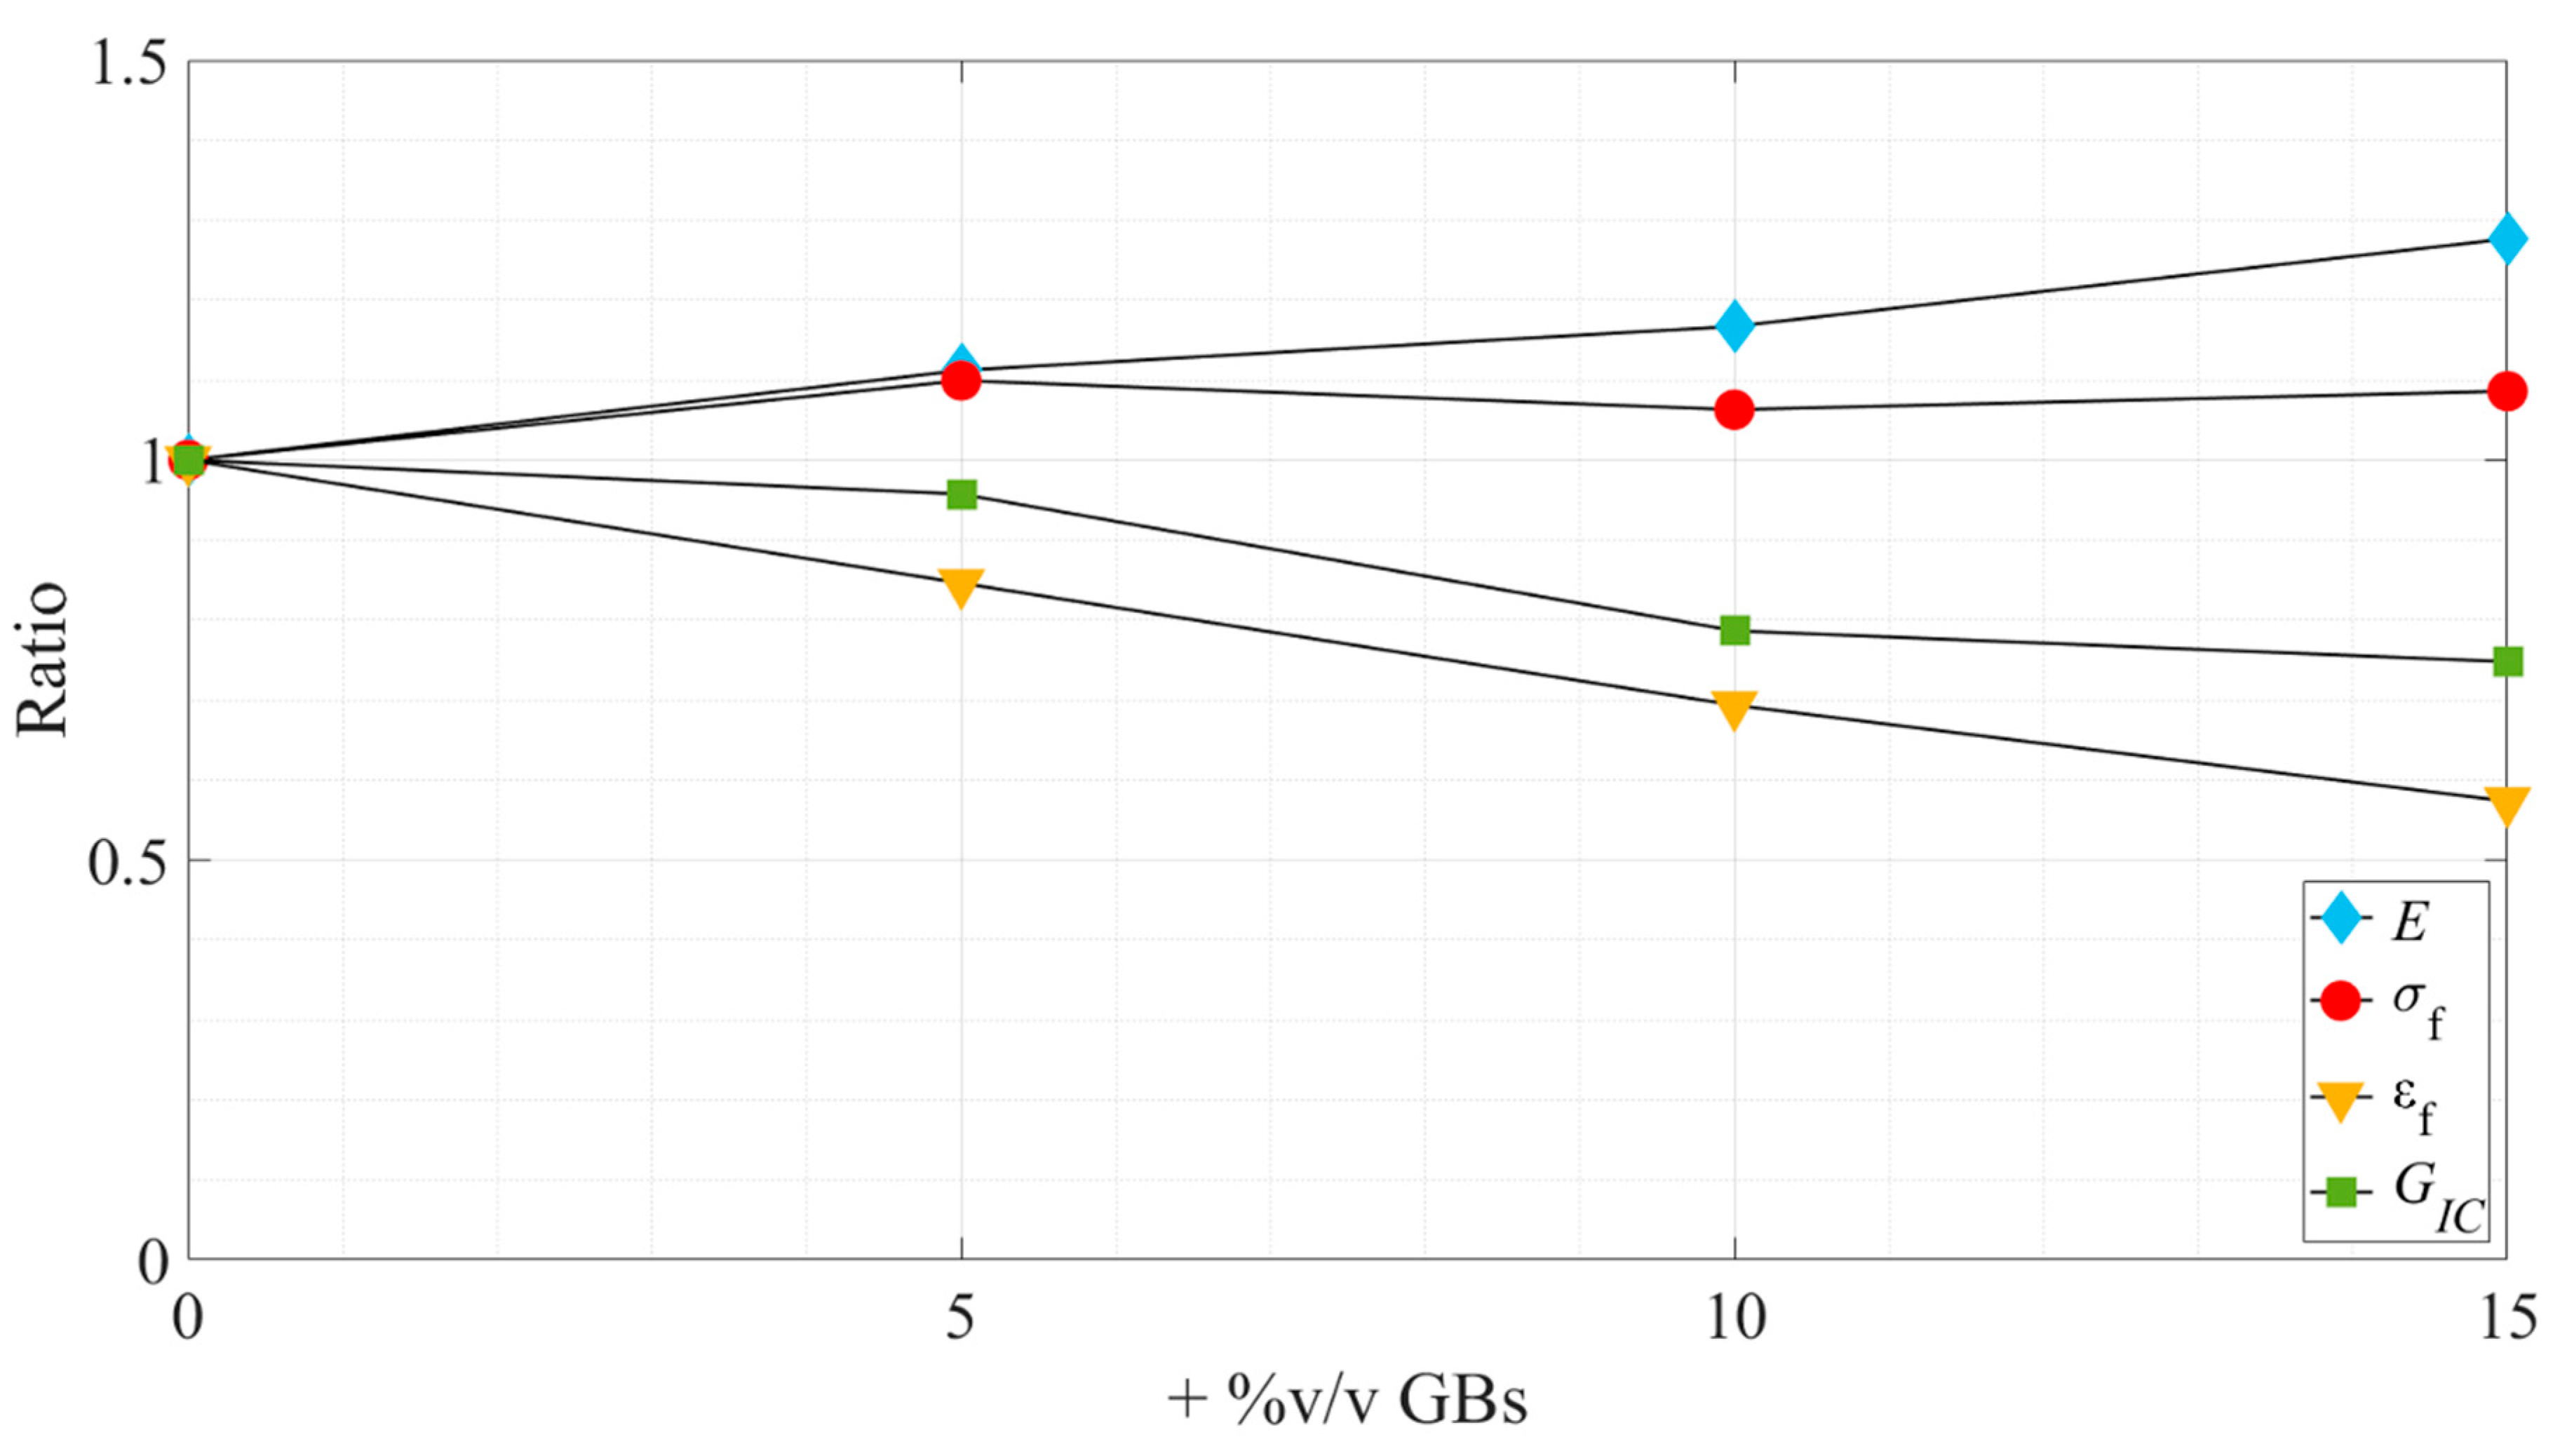
Figure 16.
Variation, in ratio related to the as supplied state, of the tensile and fracture properties as a function of the added %v/v GBs—Adhesive A.
Figure 16.
Variation, in ratio related to the as supplied state, of the tensile and fracture properties as a function of the added %v/v GBs—Adhesive A.
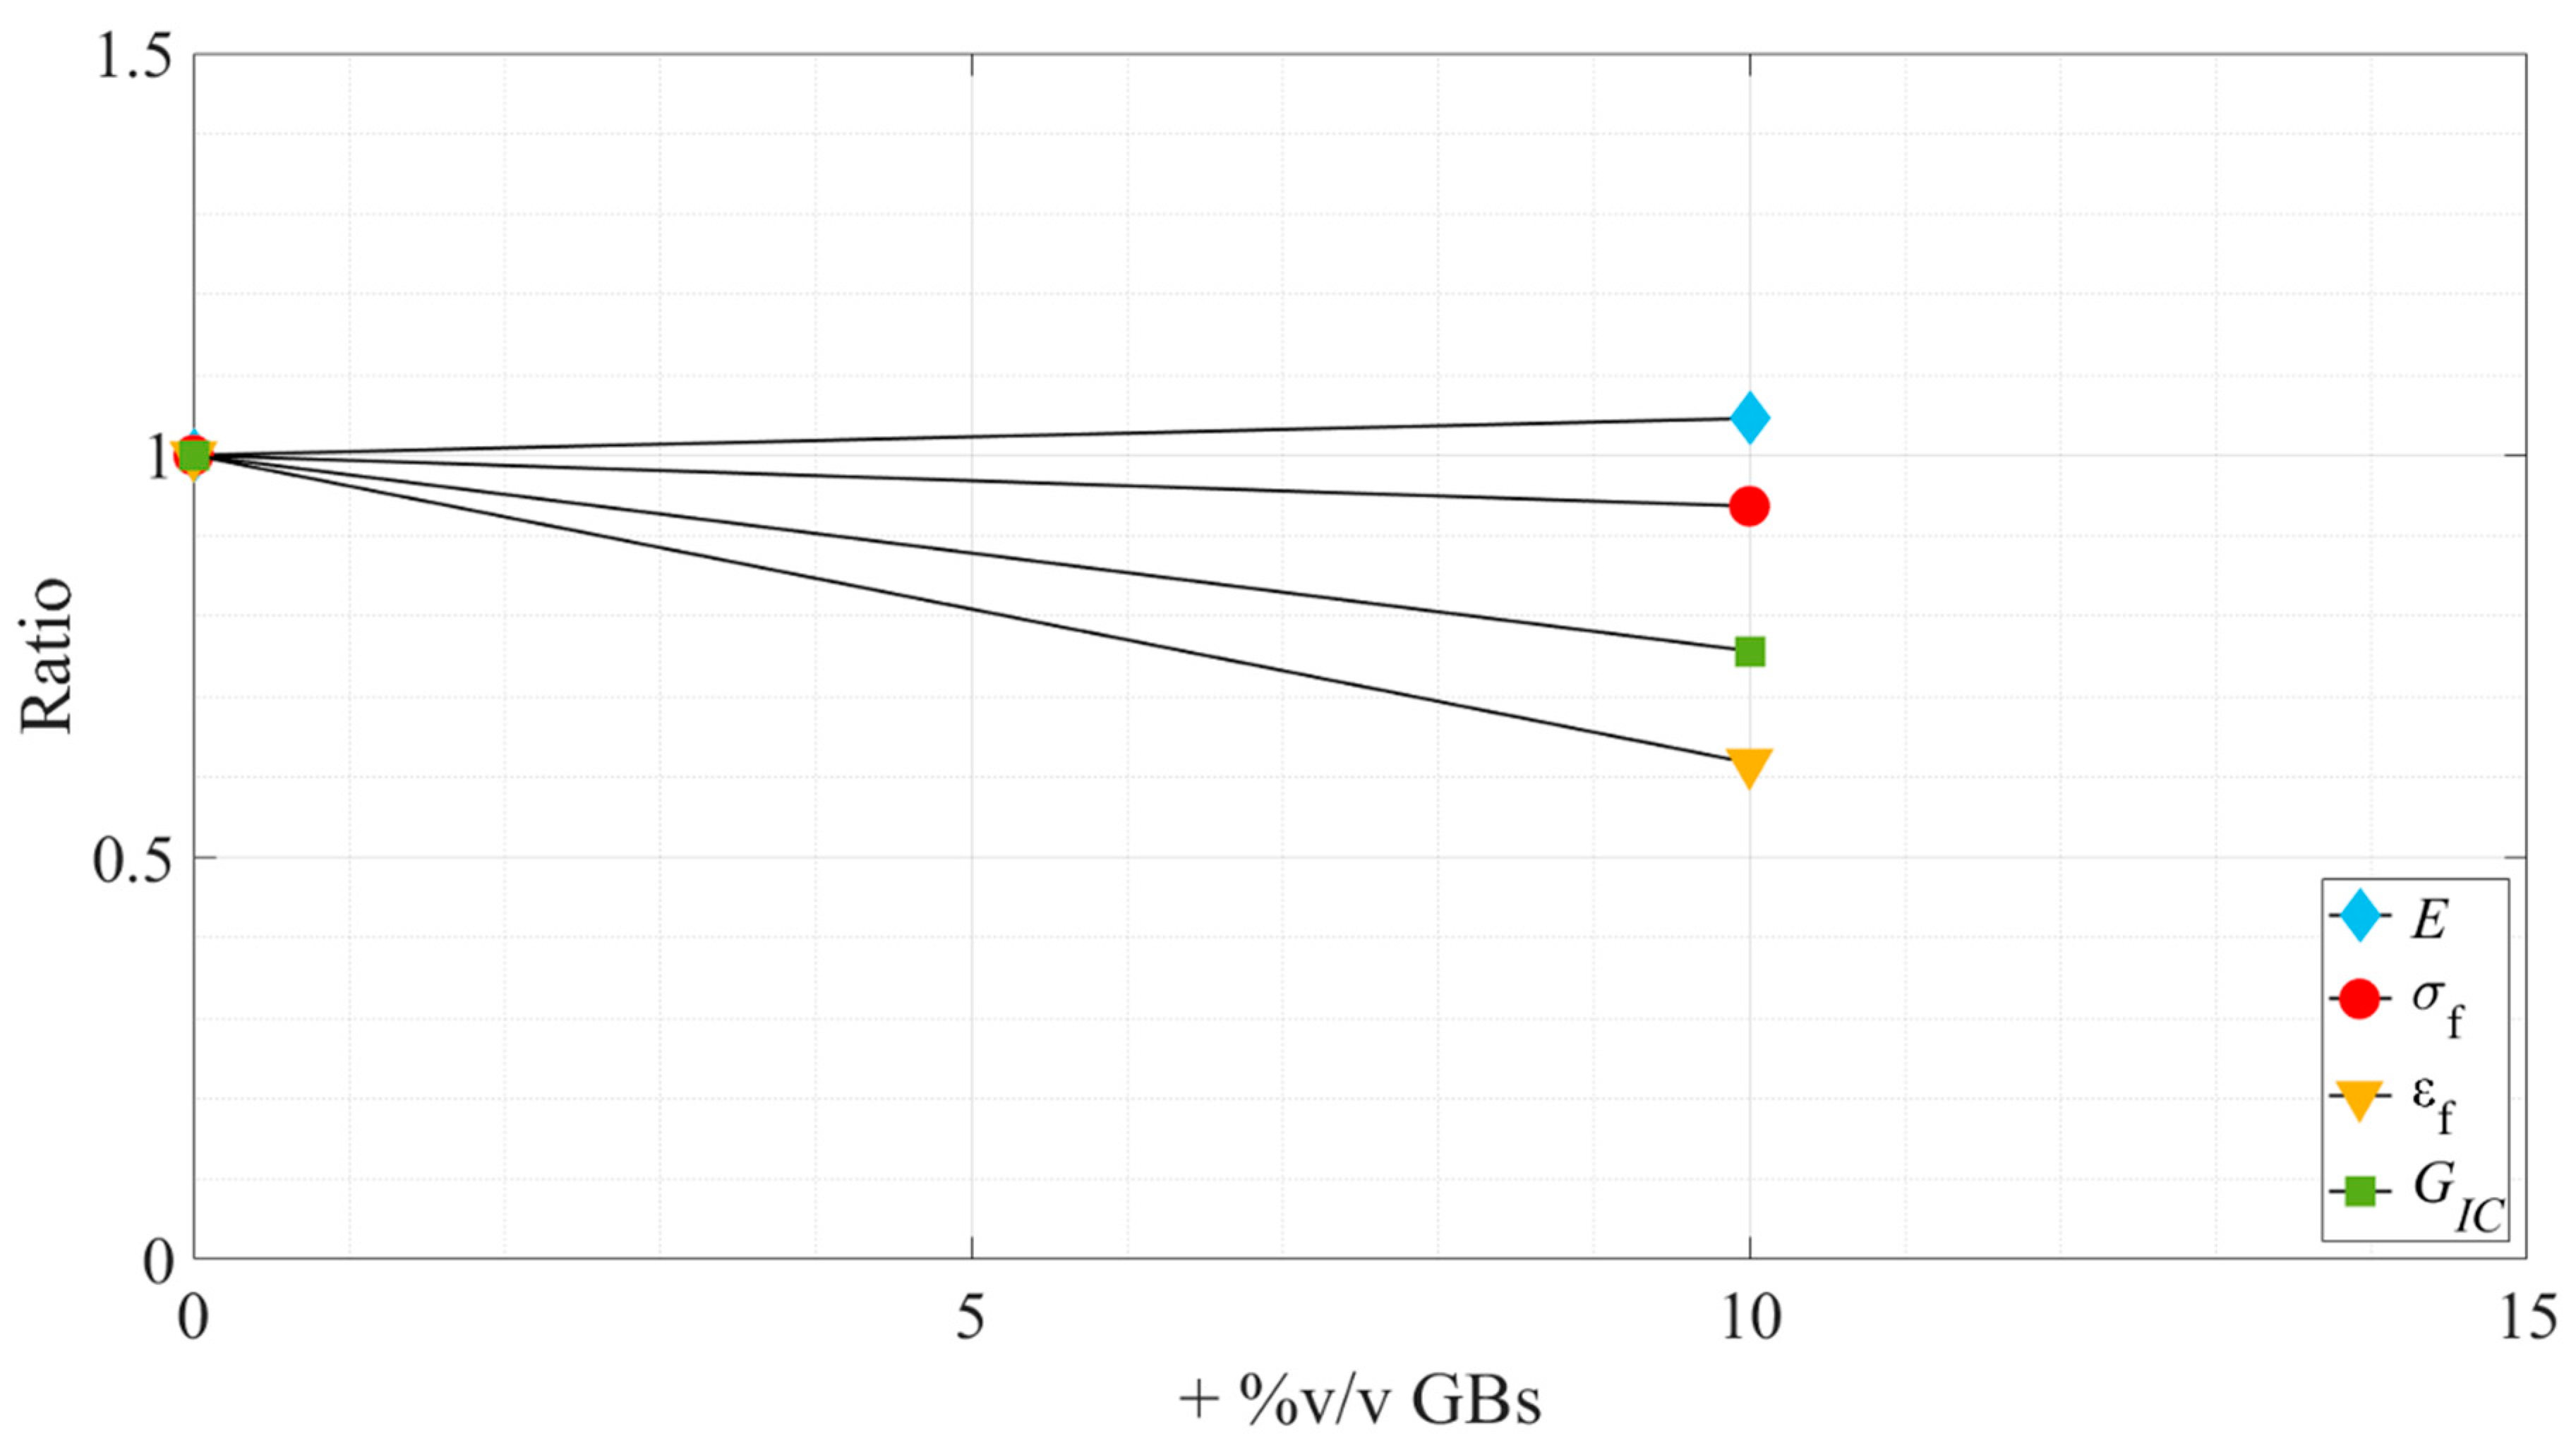
Figure 17.
Variation, in ratio related to the as supplied state, of the tensile and fracture properties as a function of the added %v/v GBs—Adhesive B.
Figure 17.
Variation, in ratio related to the as supplied state, of the tensile and fracture properties as a function of the added %v/v GBs—Adhesive B.
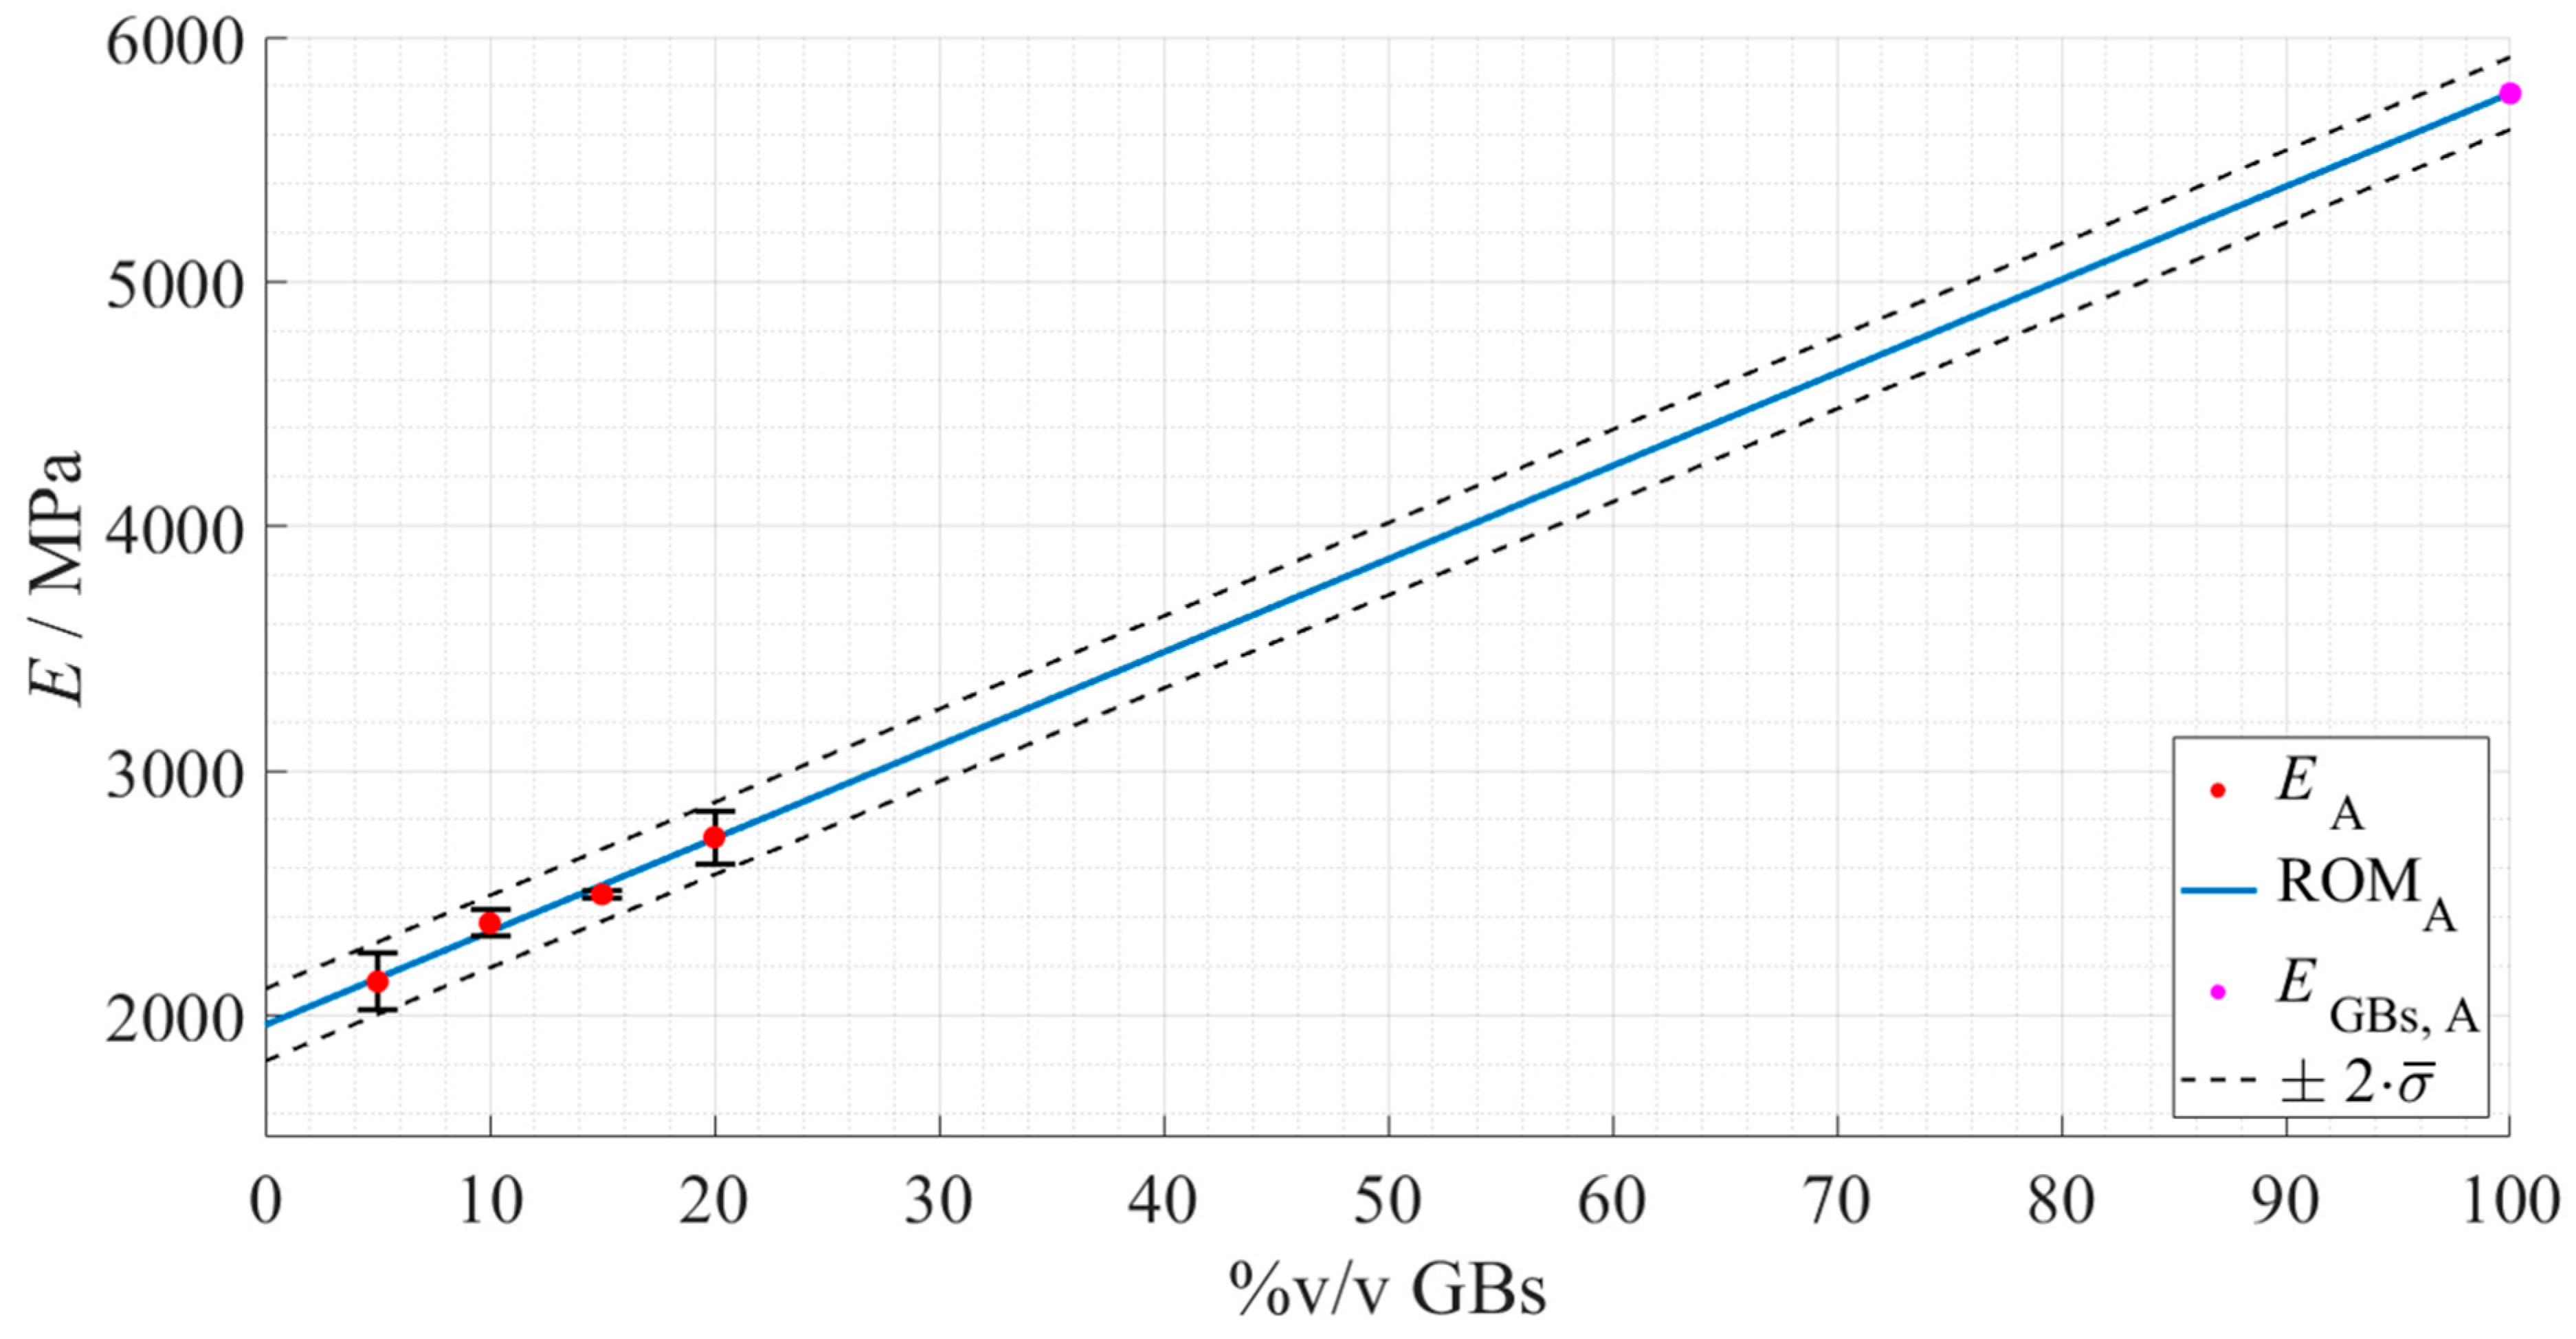
Figure 18.
Rule of mixture’s prediction for the Young’s modulus evolution, with regard to Adhesive A as a function of the true %v/v of hollow glass beads. The experimental data points are presented in red with the respective standard deviation, the ROM plot in a full blue line, the predicted Young’s modulus of the GBs in magenta, and the standard deviation based fitting limits in dashed dark grey lines.
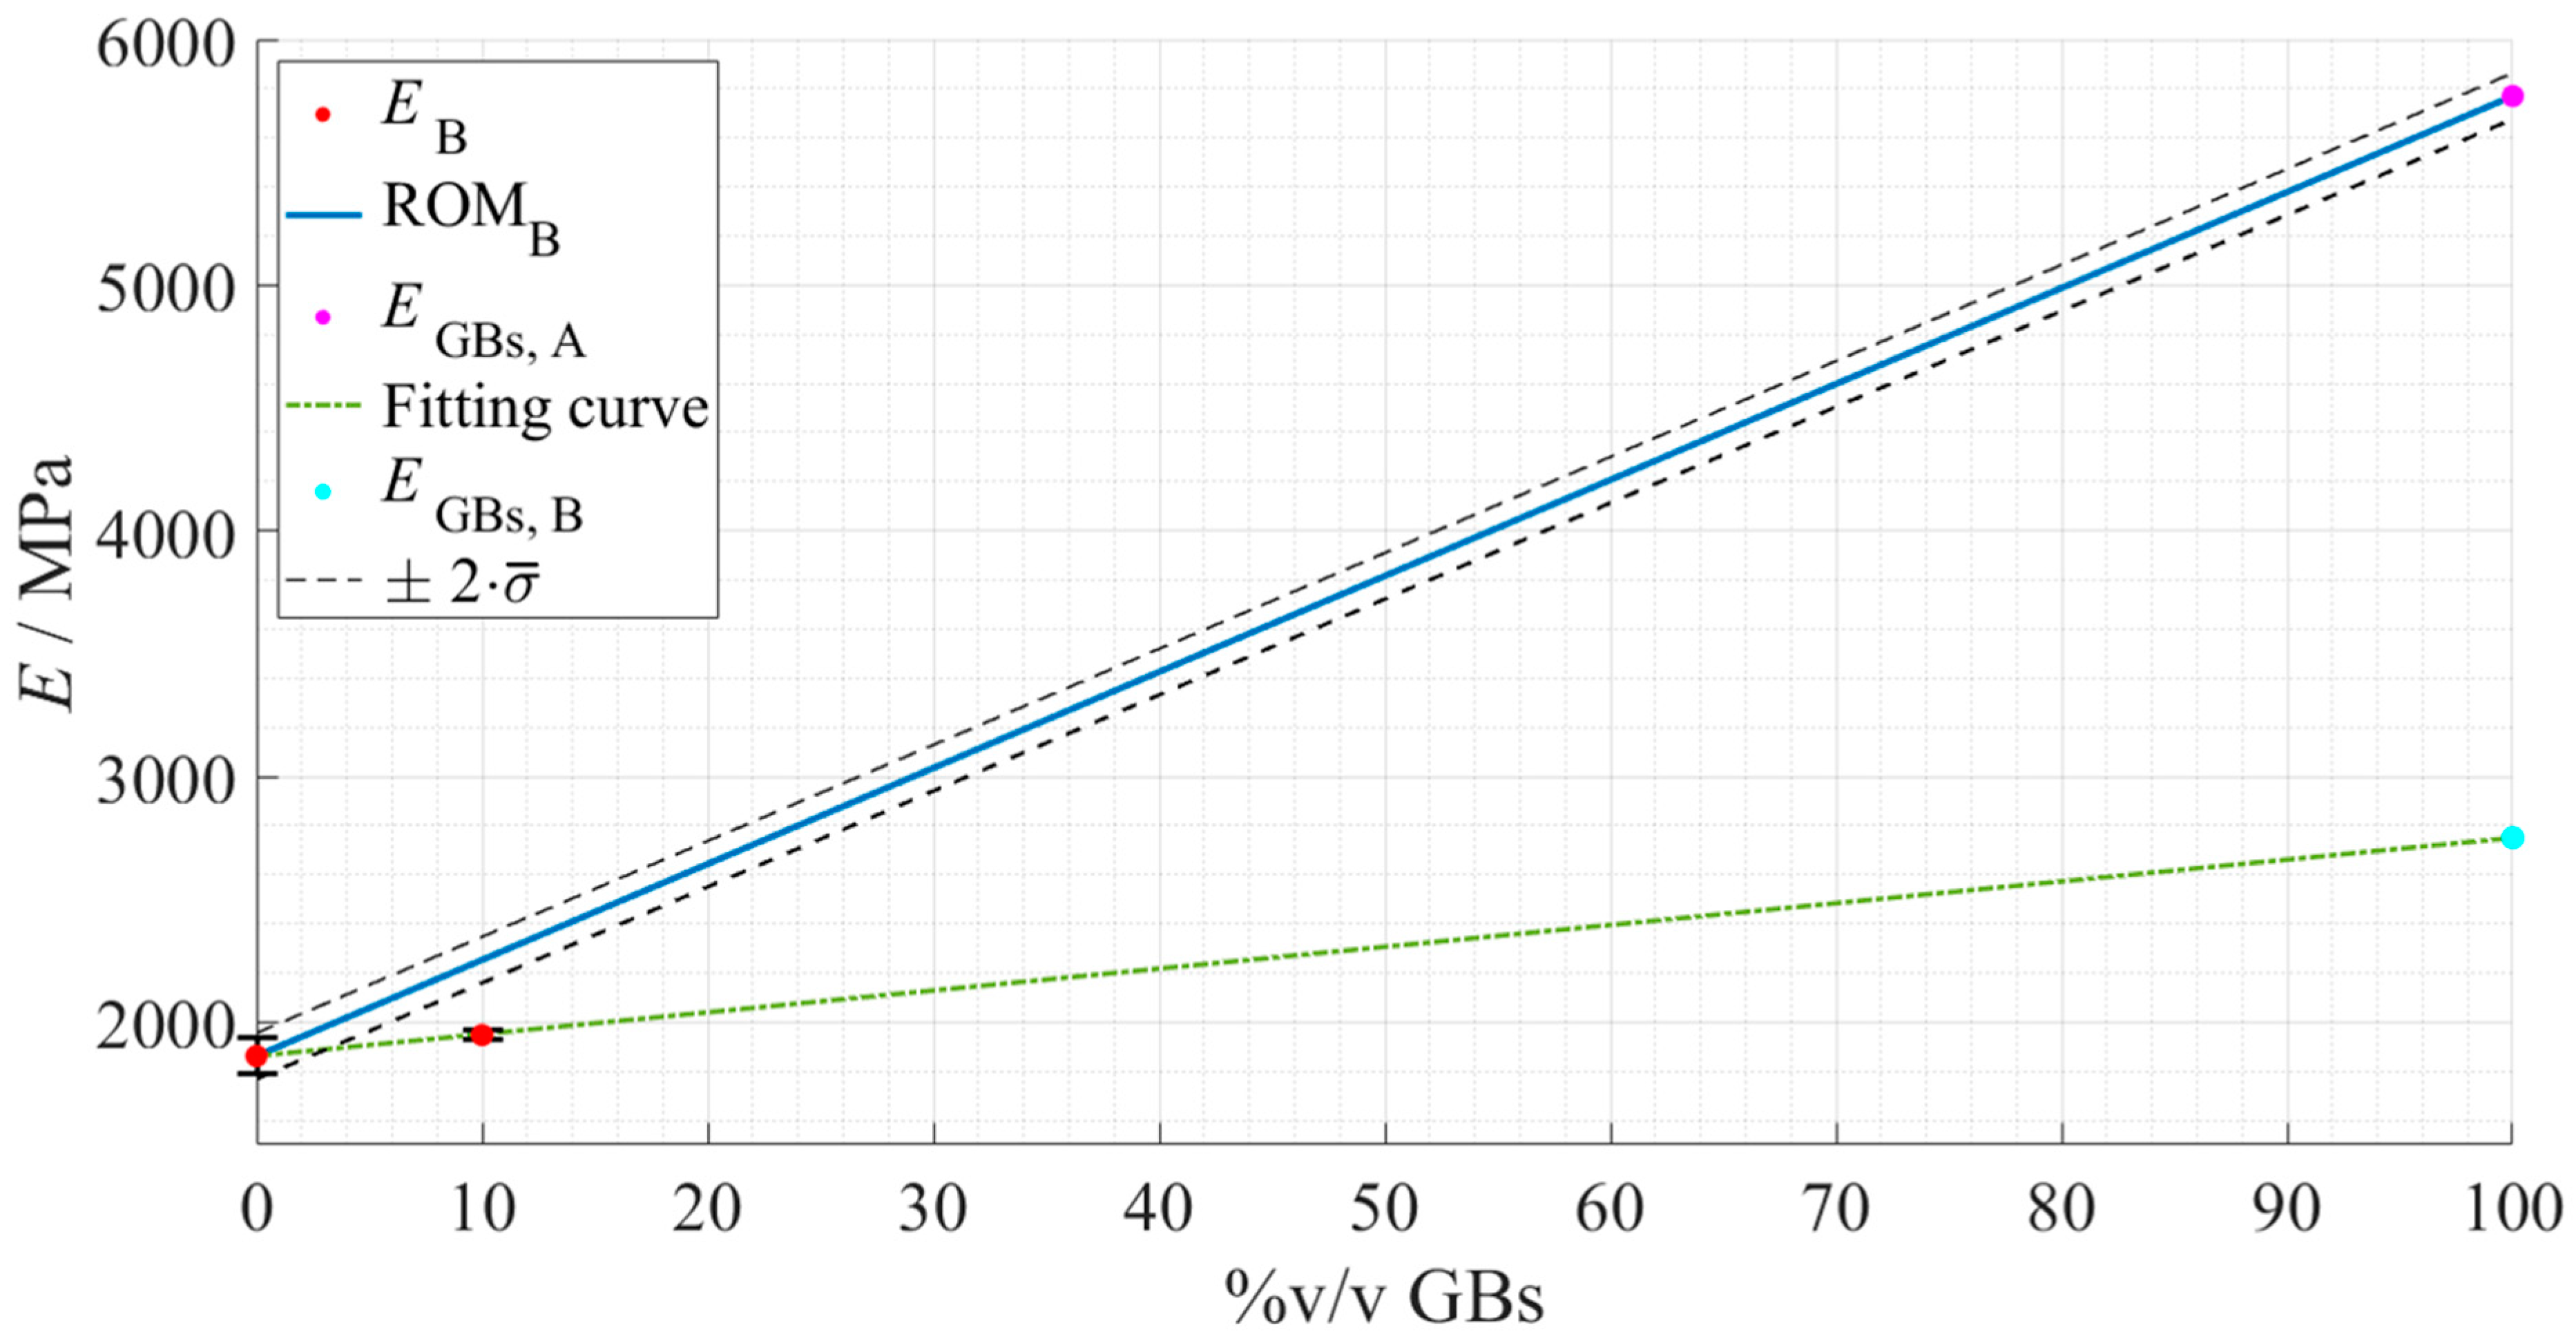
Figure 19.
Rule of mixture’s prediction for the Young’s modulus evolution, with regard to Adhesive B as a function of the true %v/v of hollow glass beads. The experimental data points are presented in red with the respective standard deviation, the ROM plot in a full blue line, the previously predicted Young’s modulus of the GBs in magenta, and the standard deviation based fitting limits in dashed dark grey lines. Considering the deviated results, the actual fitting line of the experimental data of Adhesive B is presented in a dot-dashed green line, and a new predicted Young’s modulus of the GBs in cyan for comparison purposes.
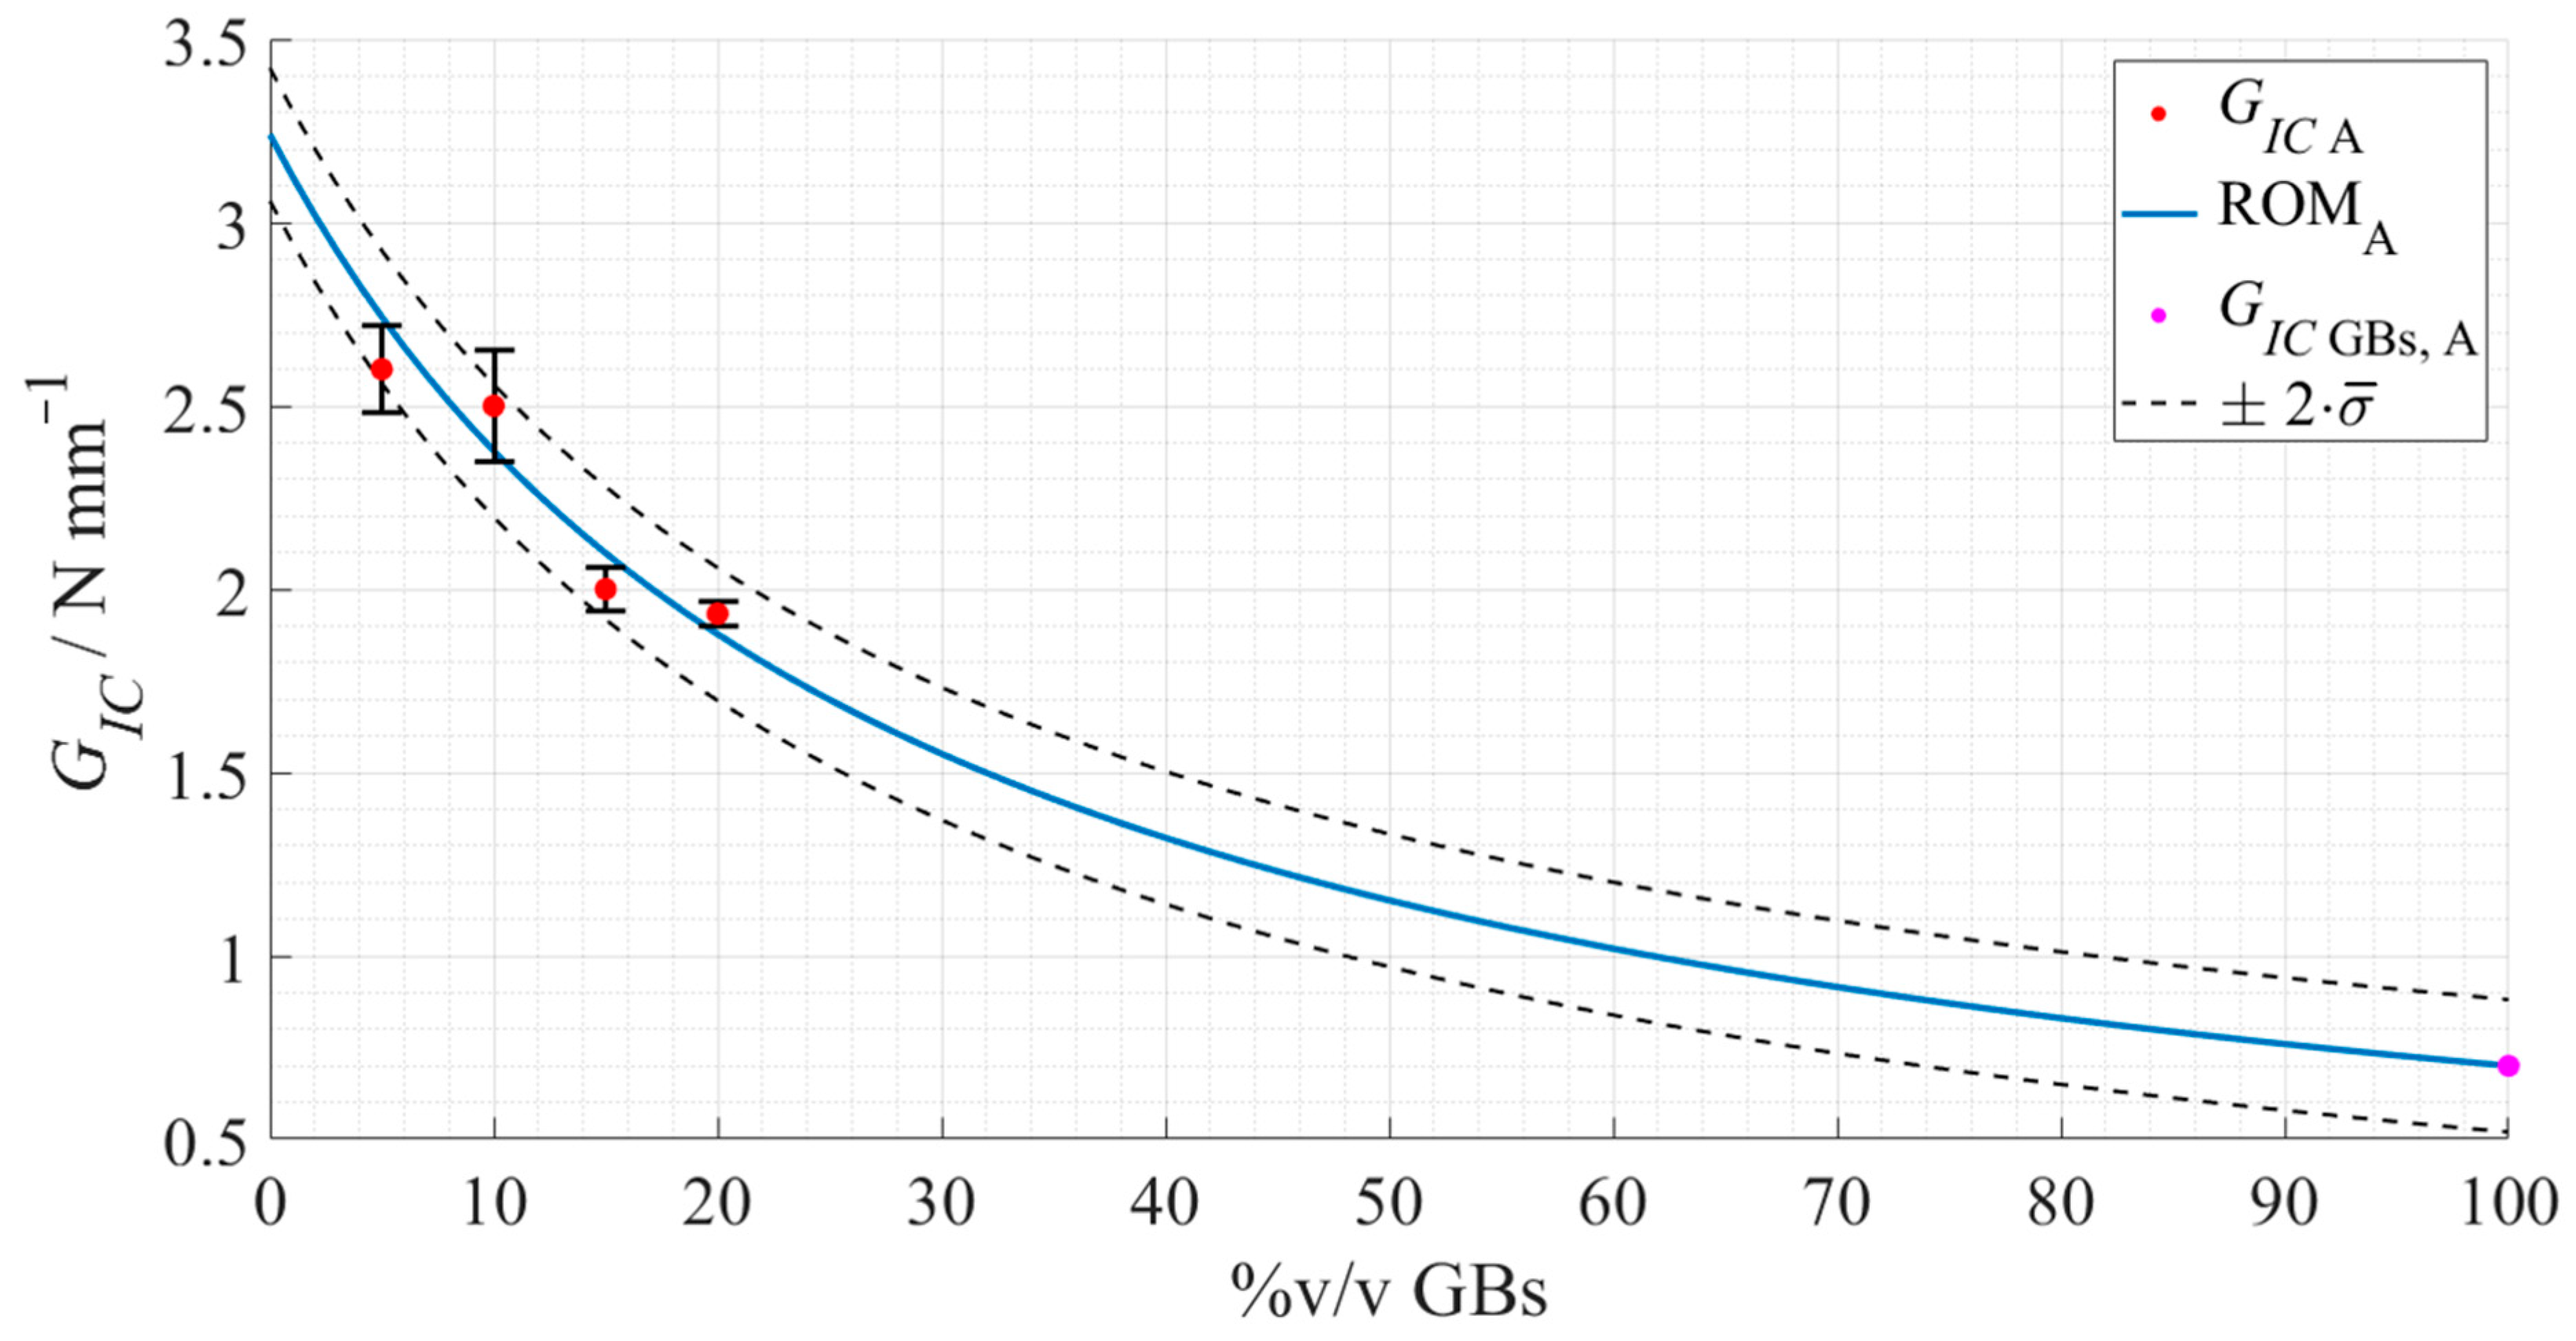
Figure 20.
Rule of mixture’s prediction for the GIC evolution, with regard to Adhesive A as a function of the true %v/v of hollow glass beads. The experimental data points are presented in red with the respective standard deviation, the ROM plot in a full blue line, the predicted mode I fracture toughness of the GBs in magenta, and the standard deviation based fitting limits in dashed dark grey lines.
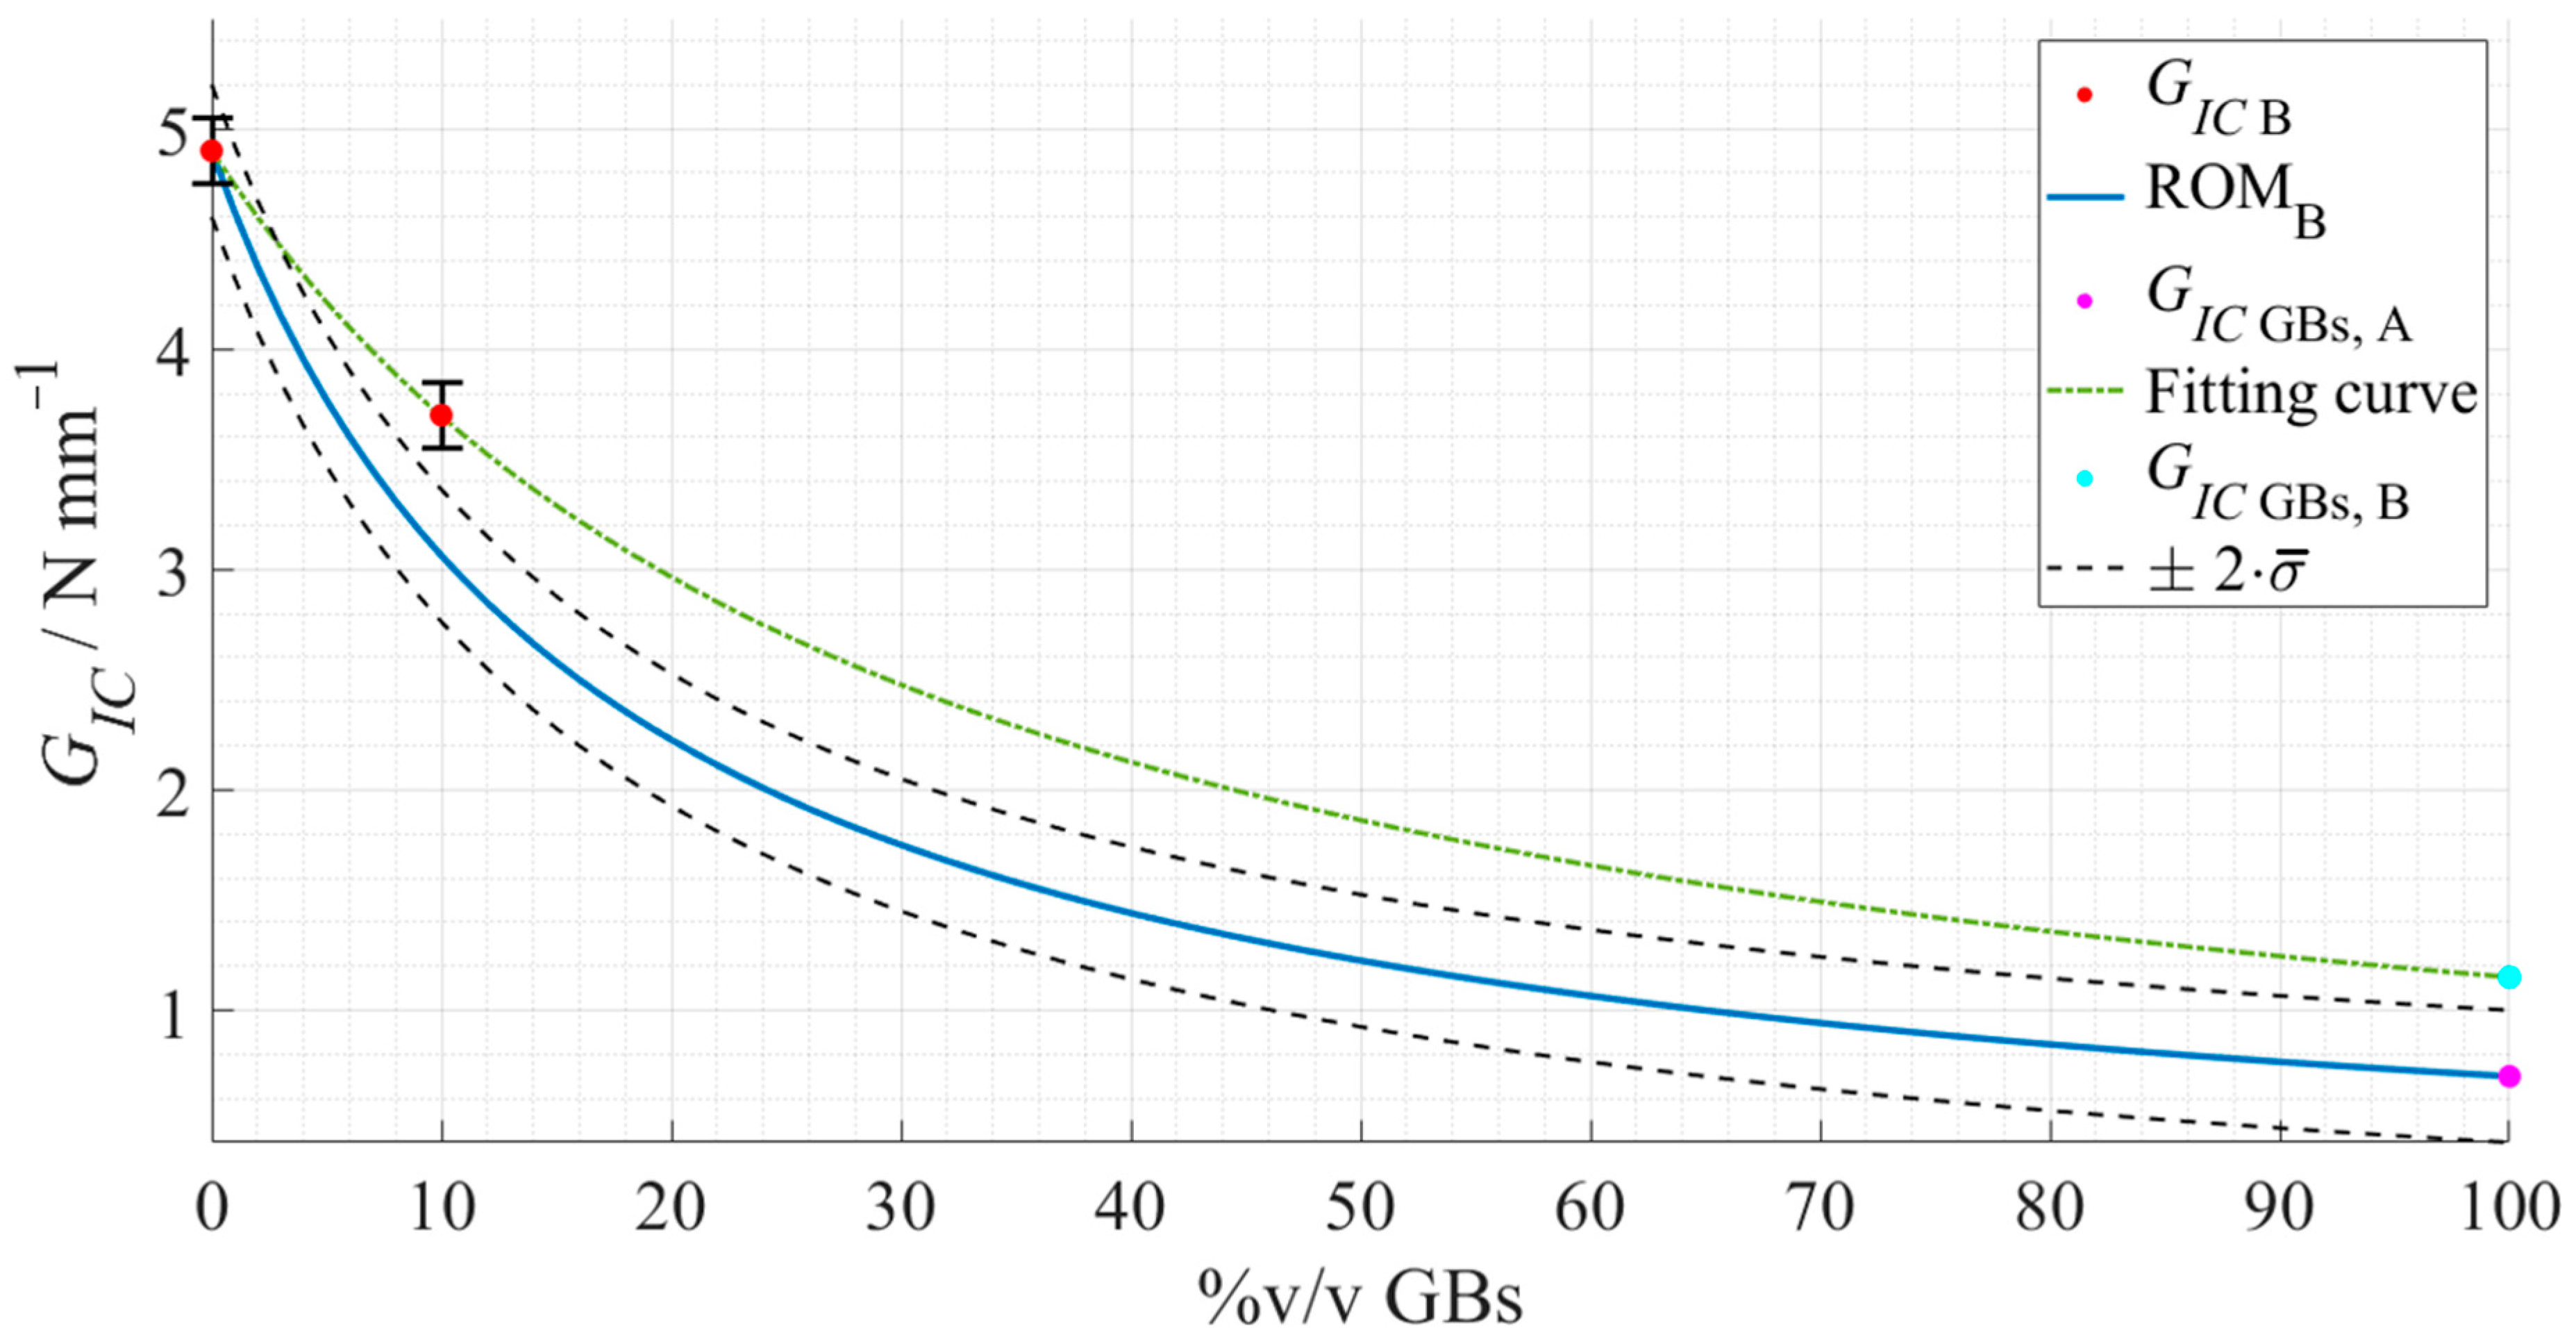
Figure 21.
Rule of mixture’s prediction for the GIC evolution, with regard to Adhesive B as a function of the true %v/v of hollow glass beads. The experimental data points are presented in red with the respective standard deviation, the ROM plot in a full blue line, the previously predicted mode I fracture toughness of the GBs in magenta, and the standard deviation based fitting limits in dashed dark grey lines. Considering the deviated results, the actual fitting line of the experimental data of Adhesive B is presented in a dot-dashed green line, and a new predicted mode I fracture toughness of the GBs in cyan for comparison purposes.
Table 1.
Main properties of the structural adhesives used, provided by the supplier.
Table 1.
Main properties of the structural adhesives used, provided by the supplier.
| Property | Adhesive A | Adhesive B |
|---|
| ρ/gcm−3 | 1.26 | 1.18 |
| E/MPa | 2100 | 1800 |
| σf/MPa | 32 | 35 |
| εf/% | ≈6 | ≈10 |
Table 2.
Main properties of the hollow glass spheres, provided by the supplier [
18].
Table 2.
Main properties of the hollow glass spheres, provided by the supplier [
18].
| Property | Hollow Glass Beads |
|---|
| ρ/gcm−3 | 0.37 |
| Color | White, powdery |
| Composition | Soda-lime-borosilicate glass |
| dmedian/µm | 45 |
| σc/MPa | 20.6 |
Table 3.
Evolution of the tensile properties’ as a function of %v/v GBs—Adhesive A.
Table 3.
Evolution of the tensile properties’ as a function of %v/v GBs—Adhesive A.
| Property | As Supplied | 5%v/v GBs | 10%v/v GBs | 15%v/v GBs |
|---|
| E/MPa | 2136.6 ± 116.9 | 2376.1 ± 54.2 | 2493.6 ± 14.9 | 2727.6 ± 109.5 |
| σf/MPa | 30.2 ± 0.4 | 33.2 ± 0.4 | 32.1 ± 0.4 | 32.8 ± 0.5 |
| εf/% | 8.6 ± 0.3 | 7.2 ± 0.5 | 6.0 ± 0.3 | 4.9 ± 0.6 |
Table 4.
Evolution of the critical energy release rates in mode I as a function of %v/v GBs—Adhesive A.
Table 4.
Evolution of the critical energy release rates in mode I as a function of %v/v GBs—Adhesive A.
| Property | As Supplied | 5%v/v GBs | 10%v/v GBs | 15%v/v GBs |
|---|
| GIC/N·mm−1 | 2.6 ± 0.1 | 2.5 ± 0.2 | 2.0 ± 0.1 | 1.9 ± 0.1 |
Table 5.
Tensile properties’ evolution as a function of %v/v GBs—Adhesive B.
Table 5.
Tensile properties’ evolution as a function of %v/v GBs—Adhesive B.
| Property | As Supplied | 10%v/v GBs |
|---|
| E/MPa | 1861.5 ± 72.8 | 1946.8 ± 21.0 |
| σf/MPa | 35.5 ± 0.2 | 33.2 ± 0.2 |
| εf/% | 13.1 ± 0.1 | 8.0 ± 0.1 |
Table 6.
Critical energy release rate in mode I evolution as a function of %v/v GBs—Adhesive B.
Table 6.
Critical energy release rate in mode I evolution as a function of %v/v GBs—Adhesive B.
| Property | As Supplied | 10%v/v GBs |
|---|
| GIC/N·mm−1 | 4.9 ± 0.2 | 3.7 ± 0.2 |
Table 7.
Parameters of the Young’s modulus ROM, regarding Adhesive A, EAdh, and the hollow glass beads, EGB.
Table 7.
Parameters of the Young’s modulus ROM, regarding Adhesive A, EAdh, and the hollow glass beads, EGB.
| Constituent | E/MPa |
|---|
| Adhesive A without GBs (prediction) | |
| Hollow glass beads (prediction) | |
Table 8.
Parameters of the Young’s modulus ROM, with regard to Adhesive B, EAdh, and the hollow glass beads, EGB.
Table 8.
Parameters of the Young’s modulus ROM, with regard to Adhesive B, EAdh, and the hollow glass beads, EGB.
| Constituent | E/MPa |
|---|
| Adhesive B (as supplied) | |
| Hollow glass beads (new prediction) | |
Table 9.
Parameters of the GIC’s ROM, regarding Adhesive A, GAdh, and the hollow glass beads, GGB.
Table 9.
Parameters of the GIC’s ROM, regarding Adhesive A, GAdh, and the hollow glass beads, GGB.
| Constituent | GIC/N·mm−1 |
|---|
| Adhesive A without GBs (prediction) | |
| Hollow glass beads (prediction) | |
Table 10.
Parameters of the GIC’s ROM, in regard to Adhesive B, GAdh, and the hollow glass beads, GGB.
Table 10.
Parameters of the GIC’s ROM, in regard to Adhesive B, GAdh, and the hollow glass beads, GGB.
| Constituent | GIC/N·mm−1 |
| Adhesive B (as supplied) | |
| Hollow glass beads (new prediction) | |


 ,
, 


