
Determination of Nanoindentation Behavior of HAZ on Glass Material Machined via ECSM Process through Simulation Approach

 ,
,
Abstract
:1. Introduction
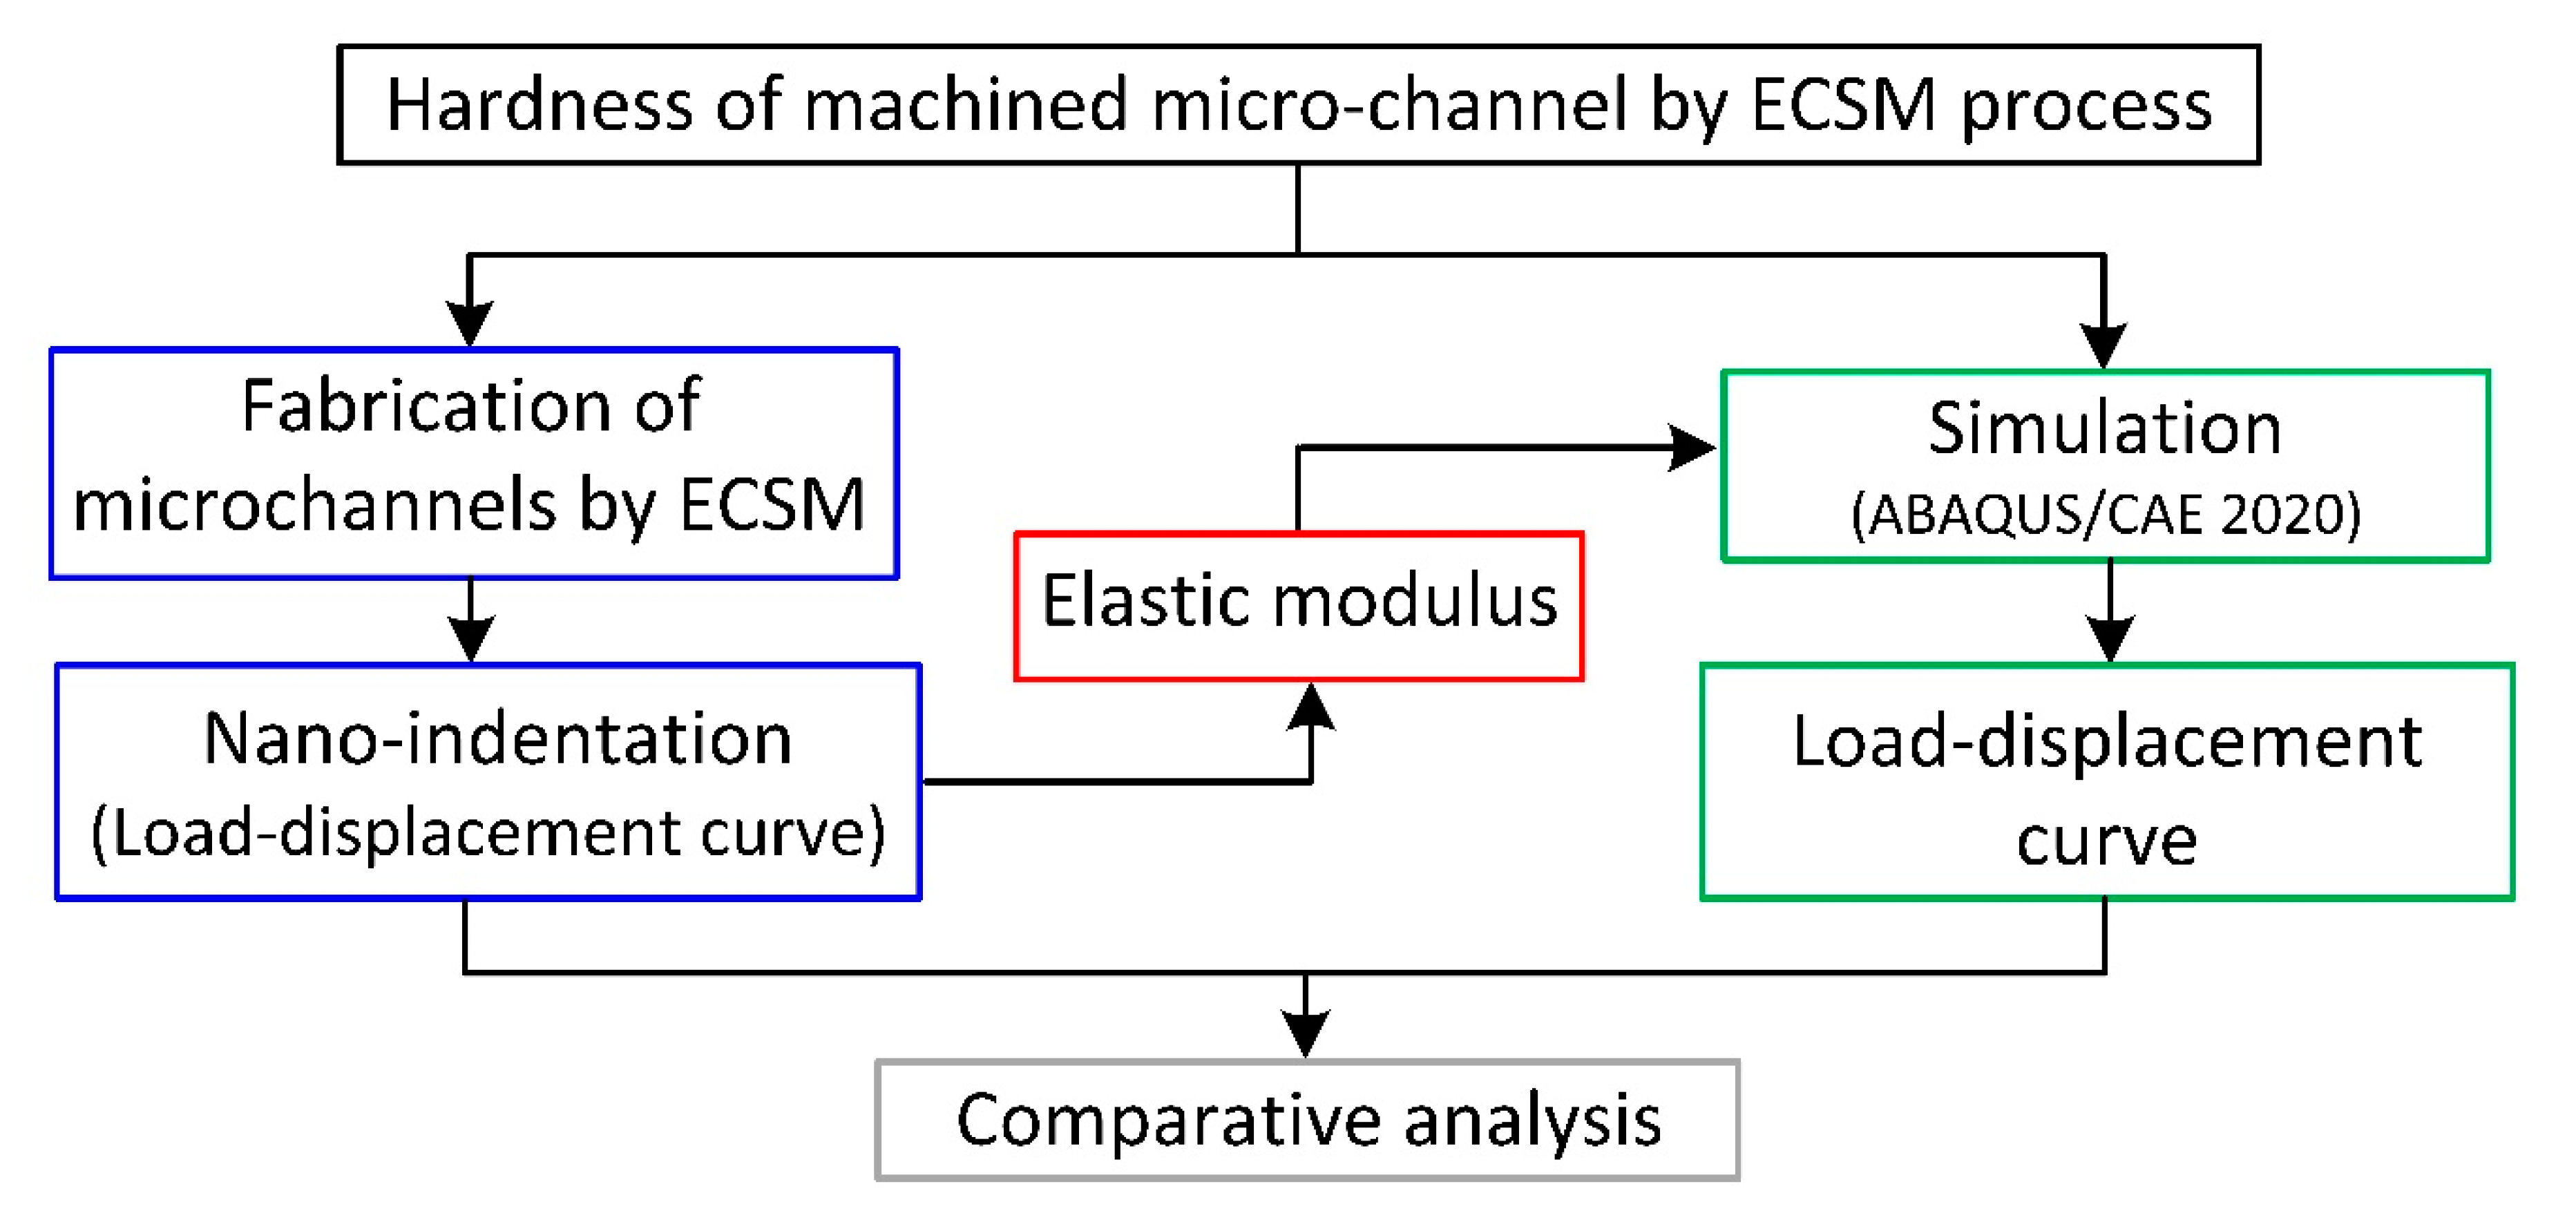
2. Methodology
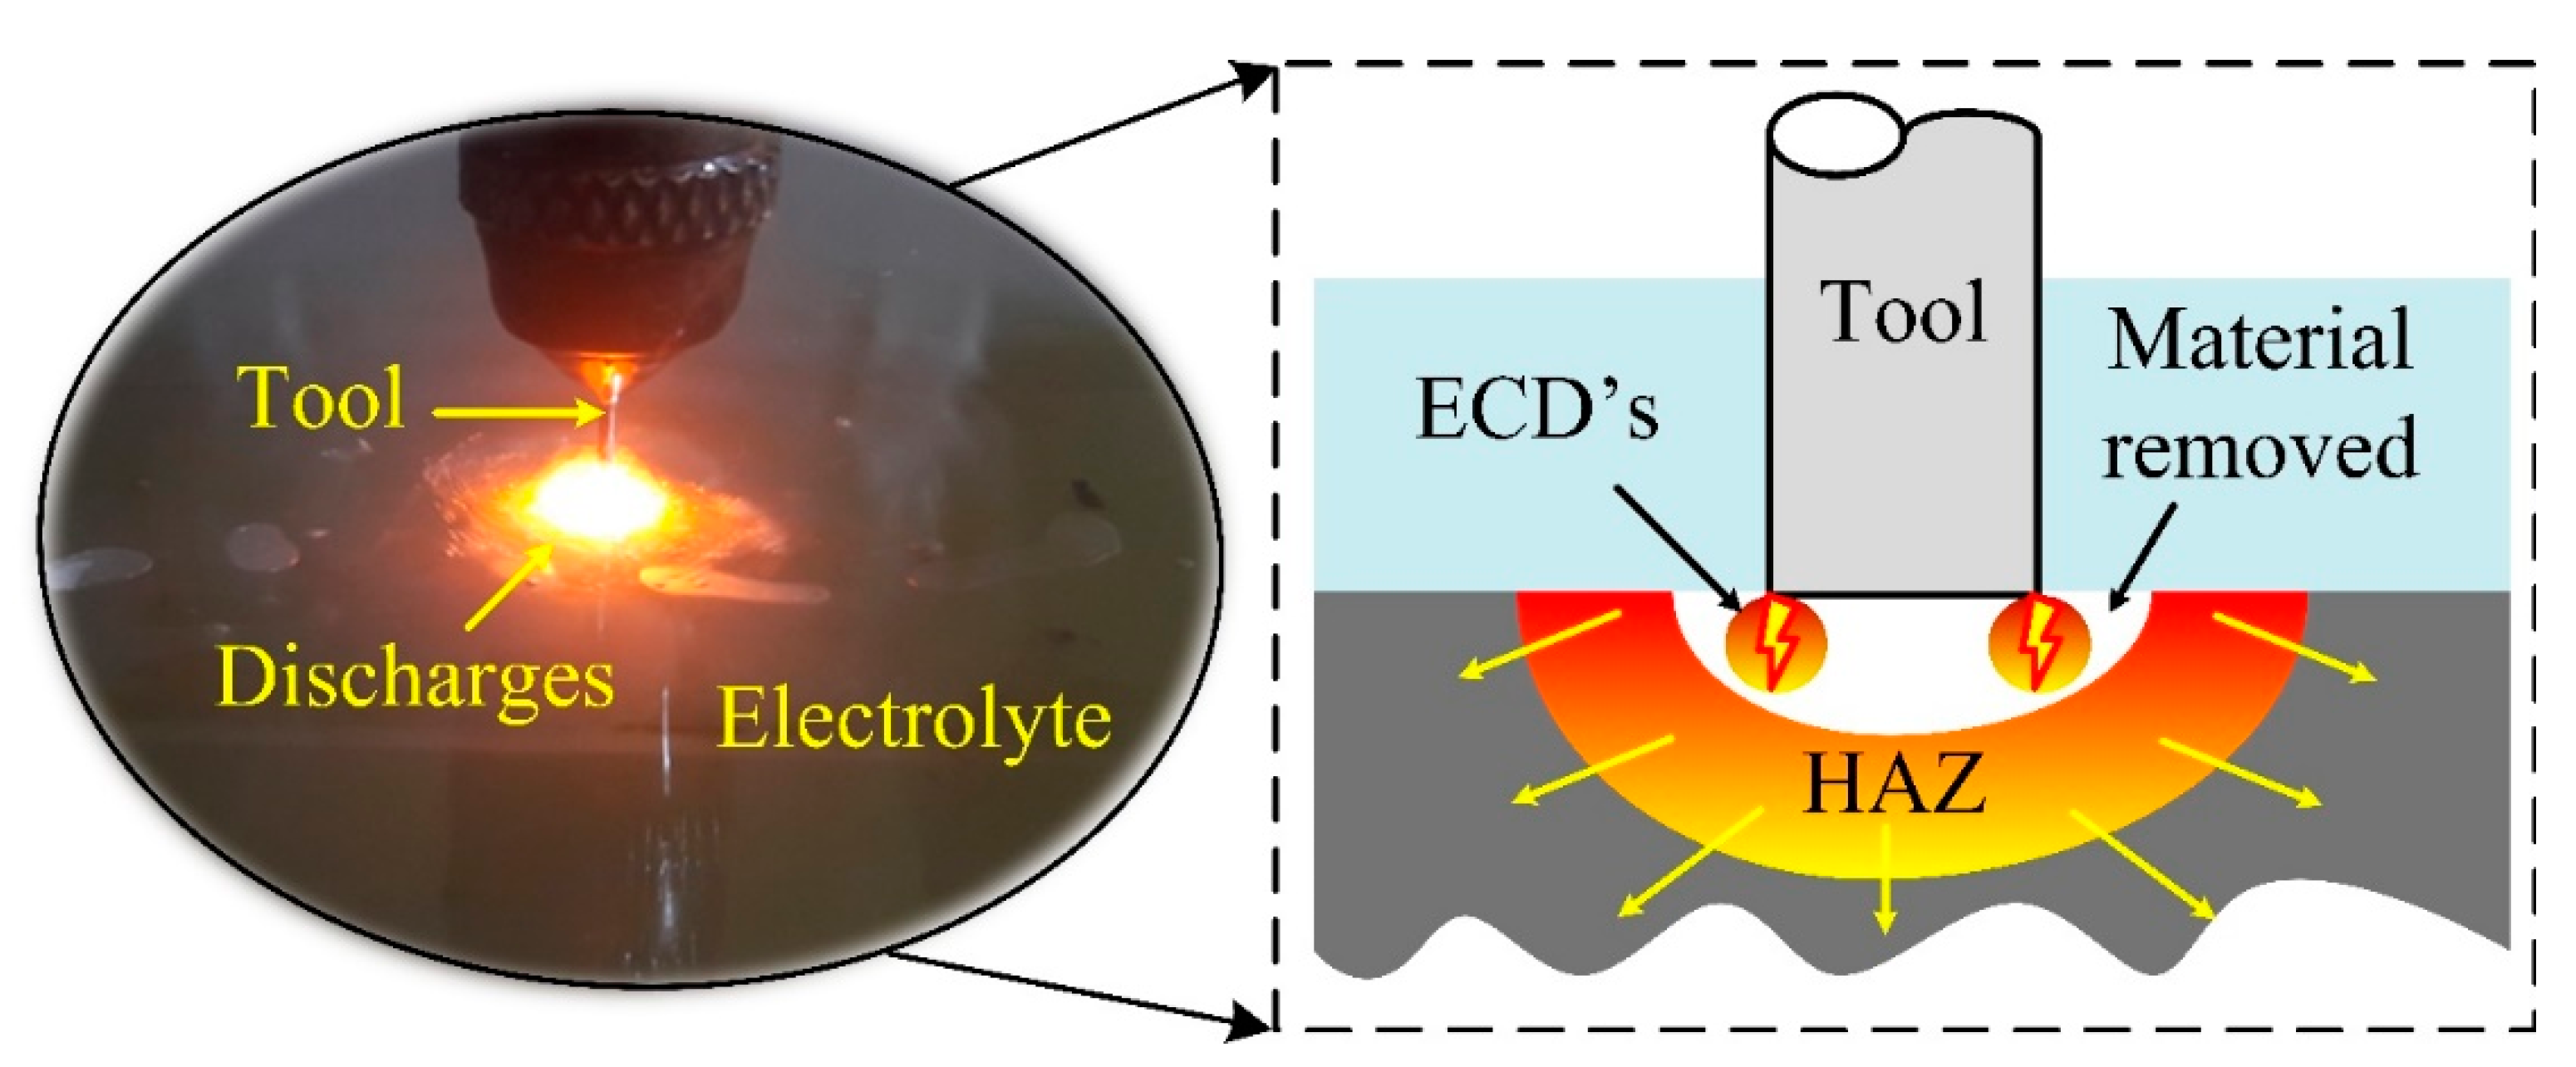
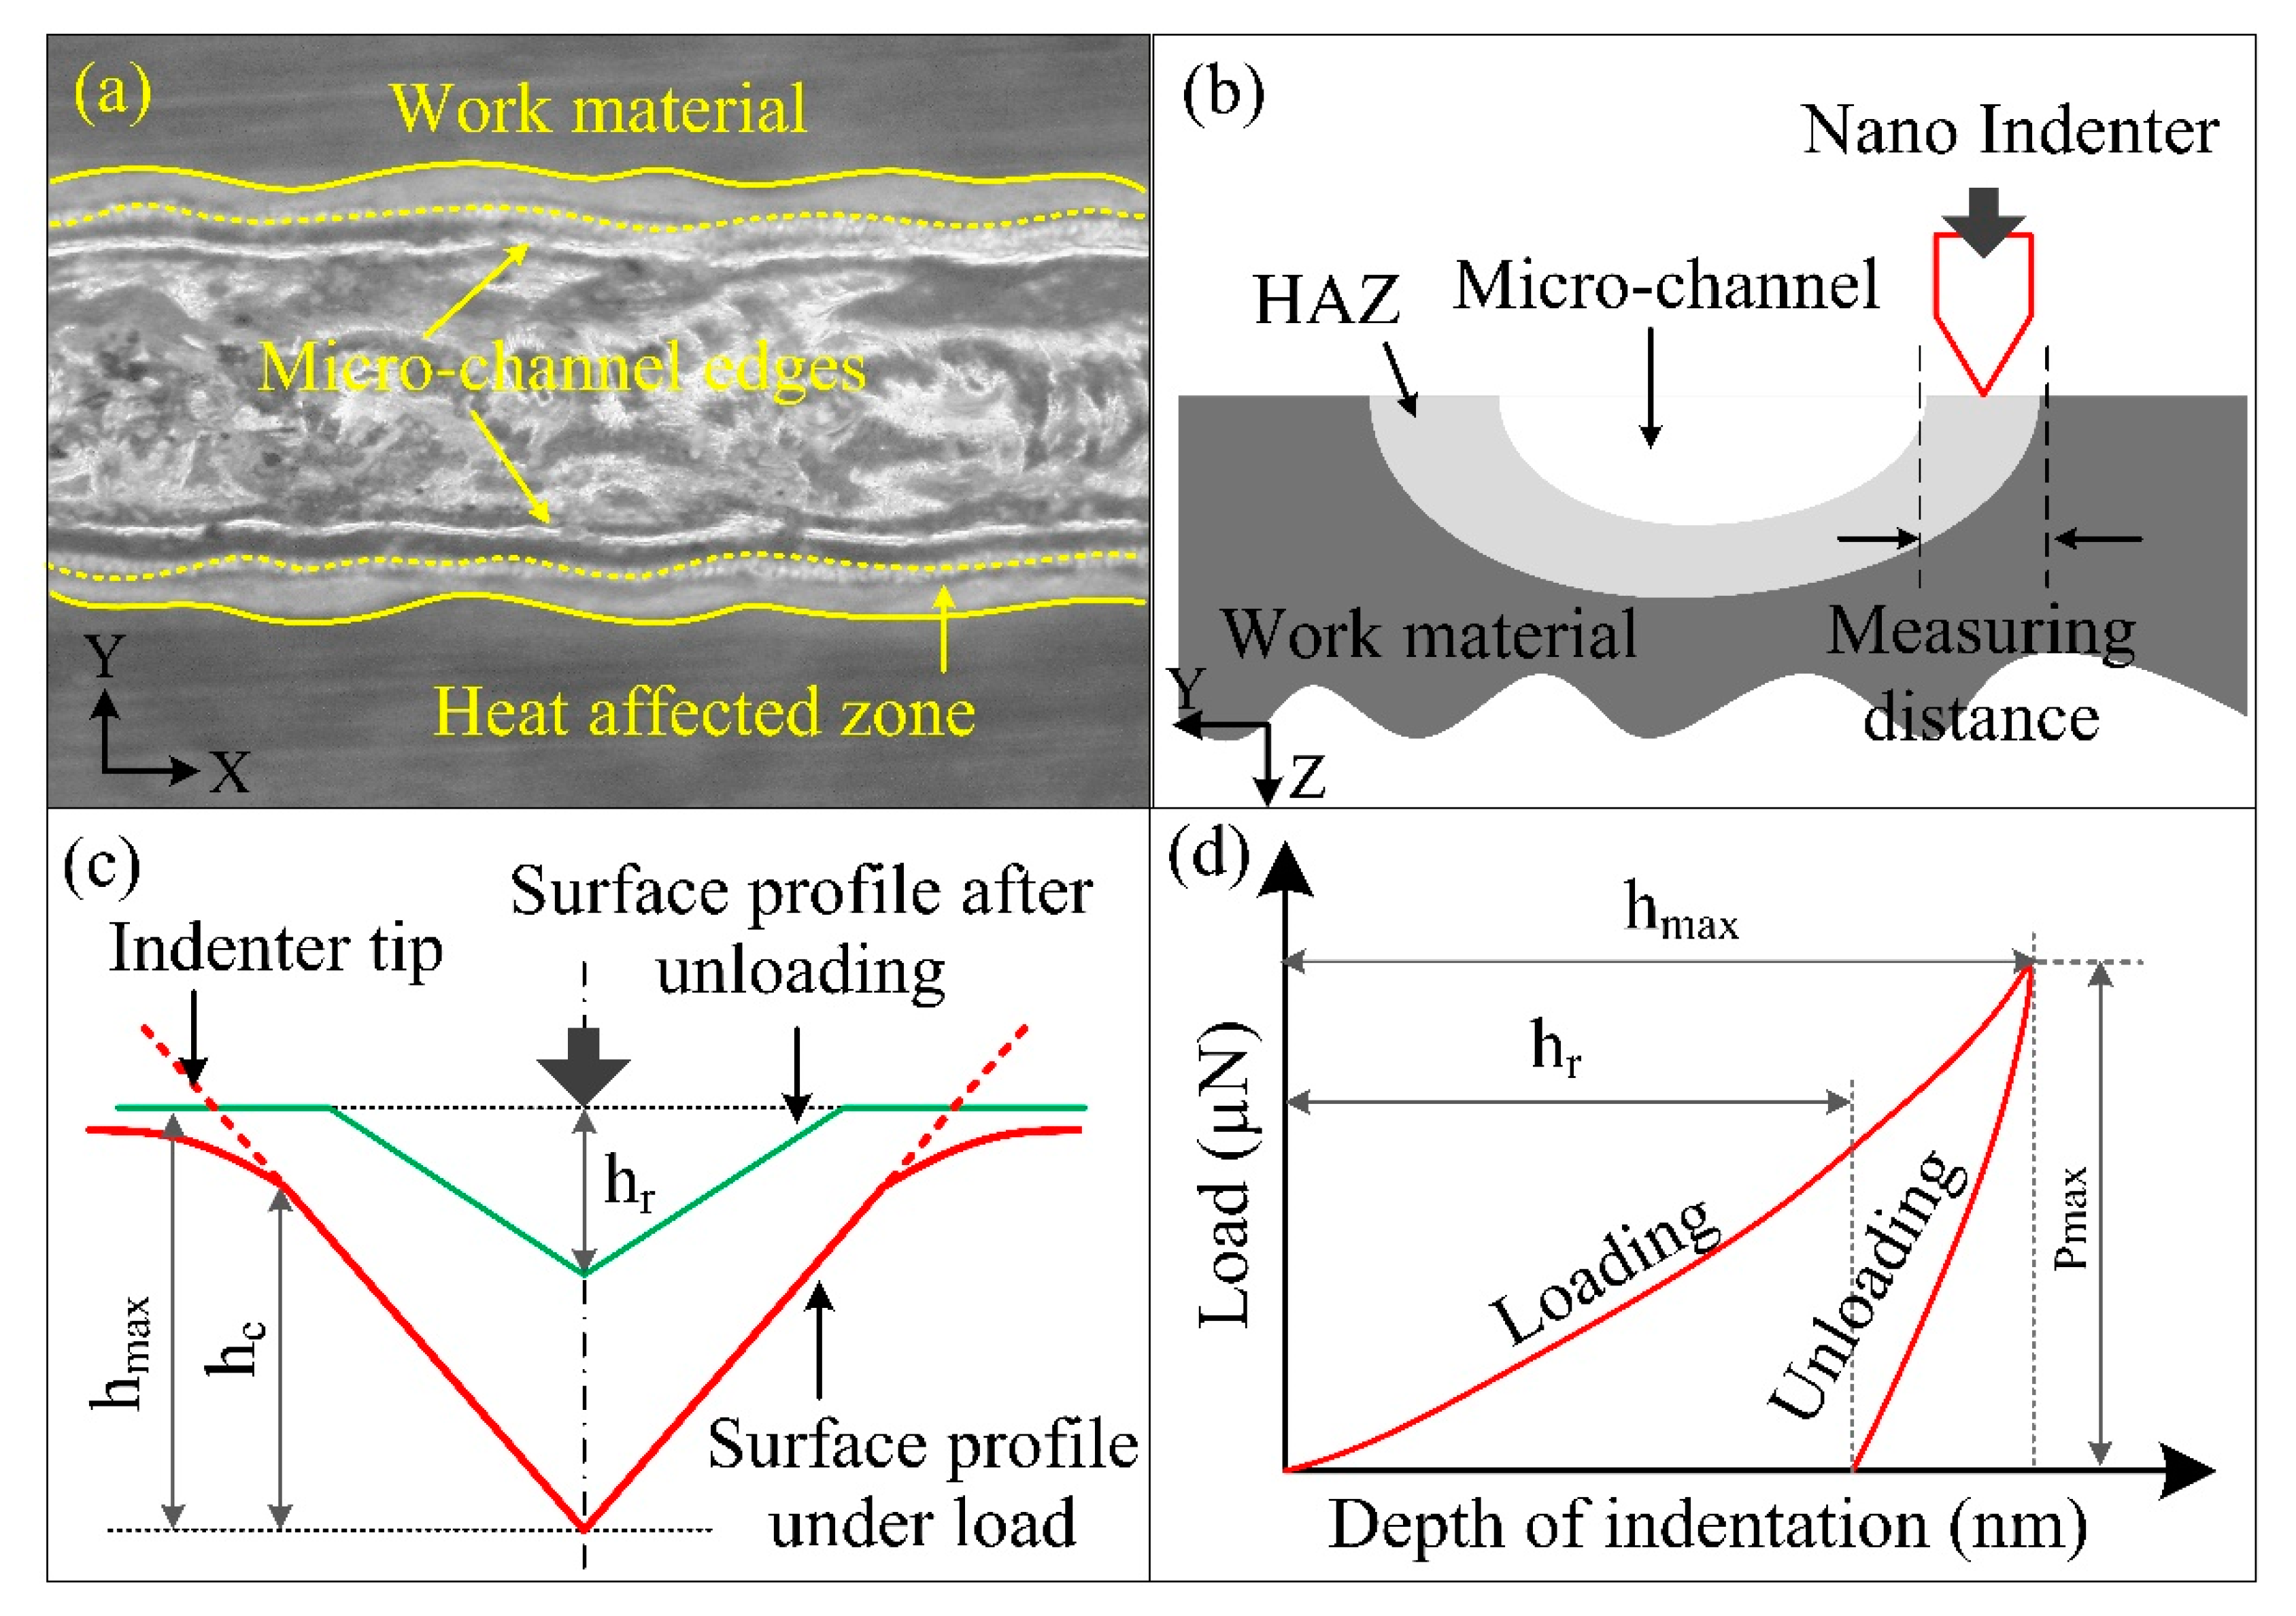
2.1. Experimental Procedure
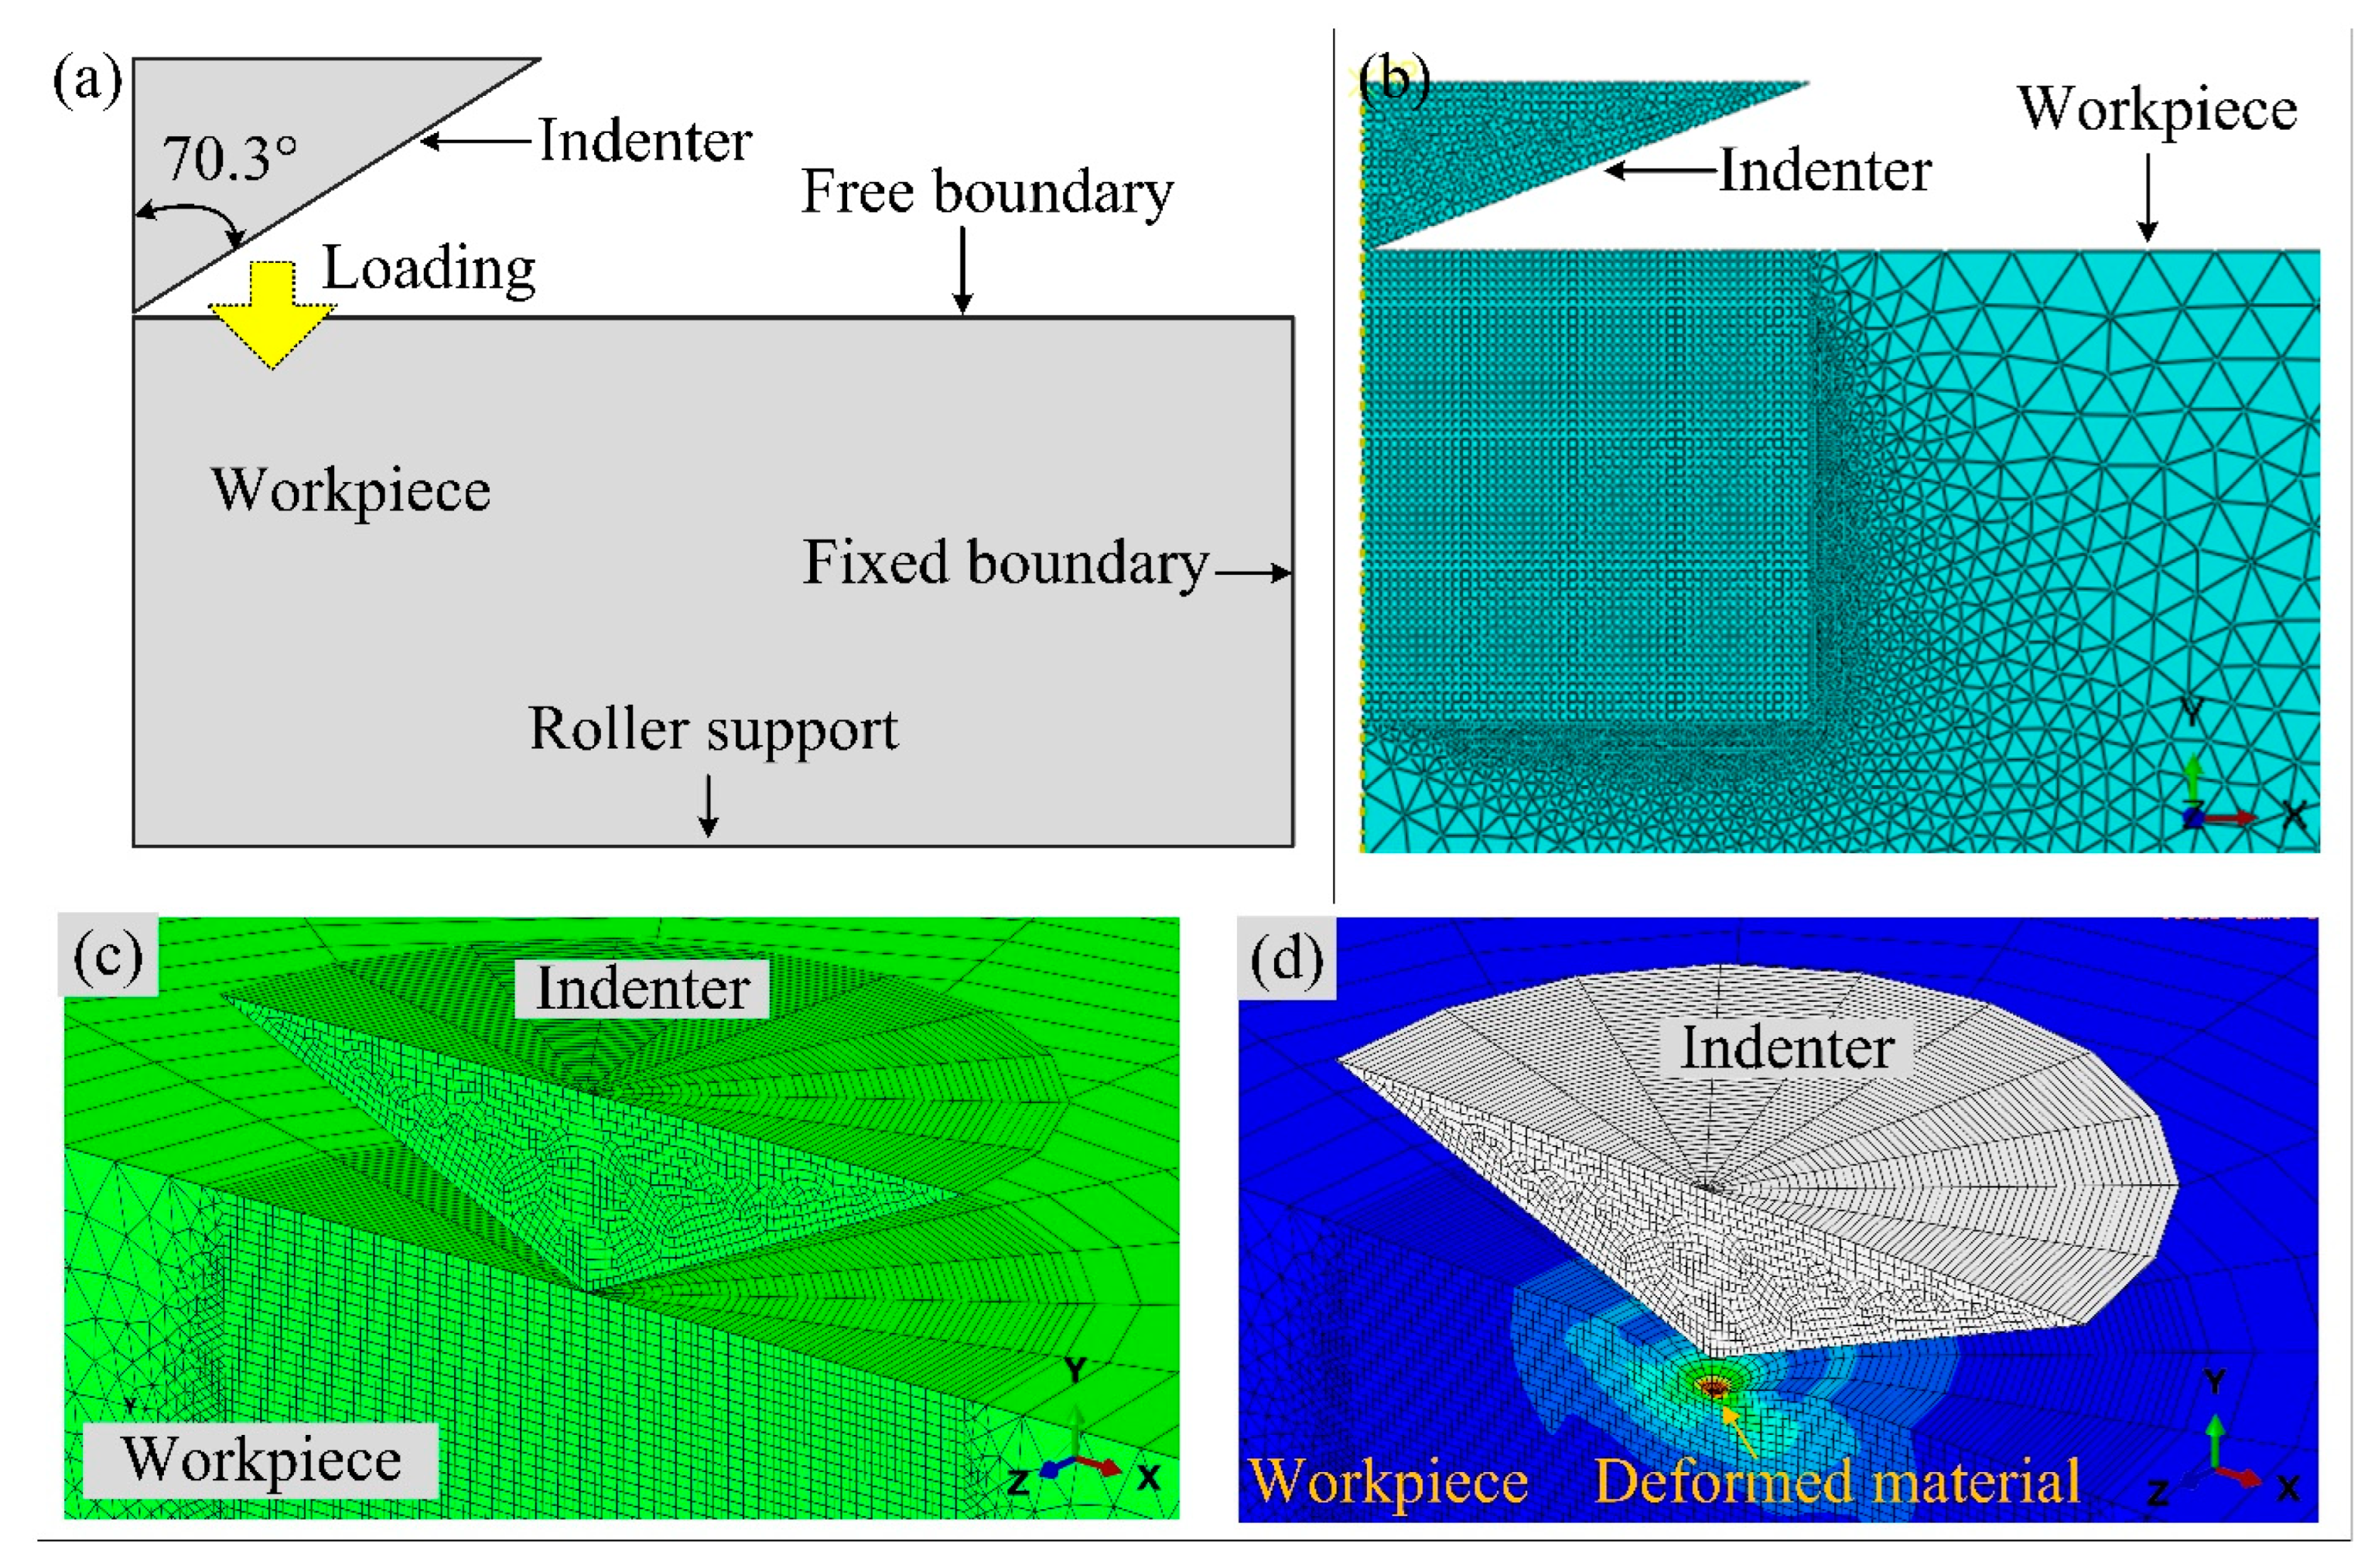
2.2. Simulation Procedure
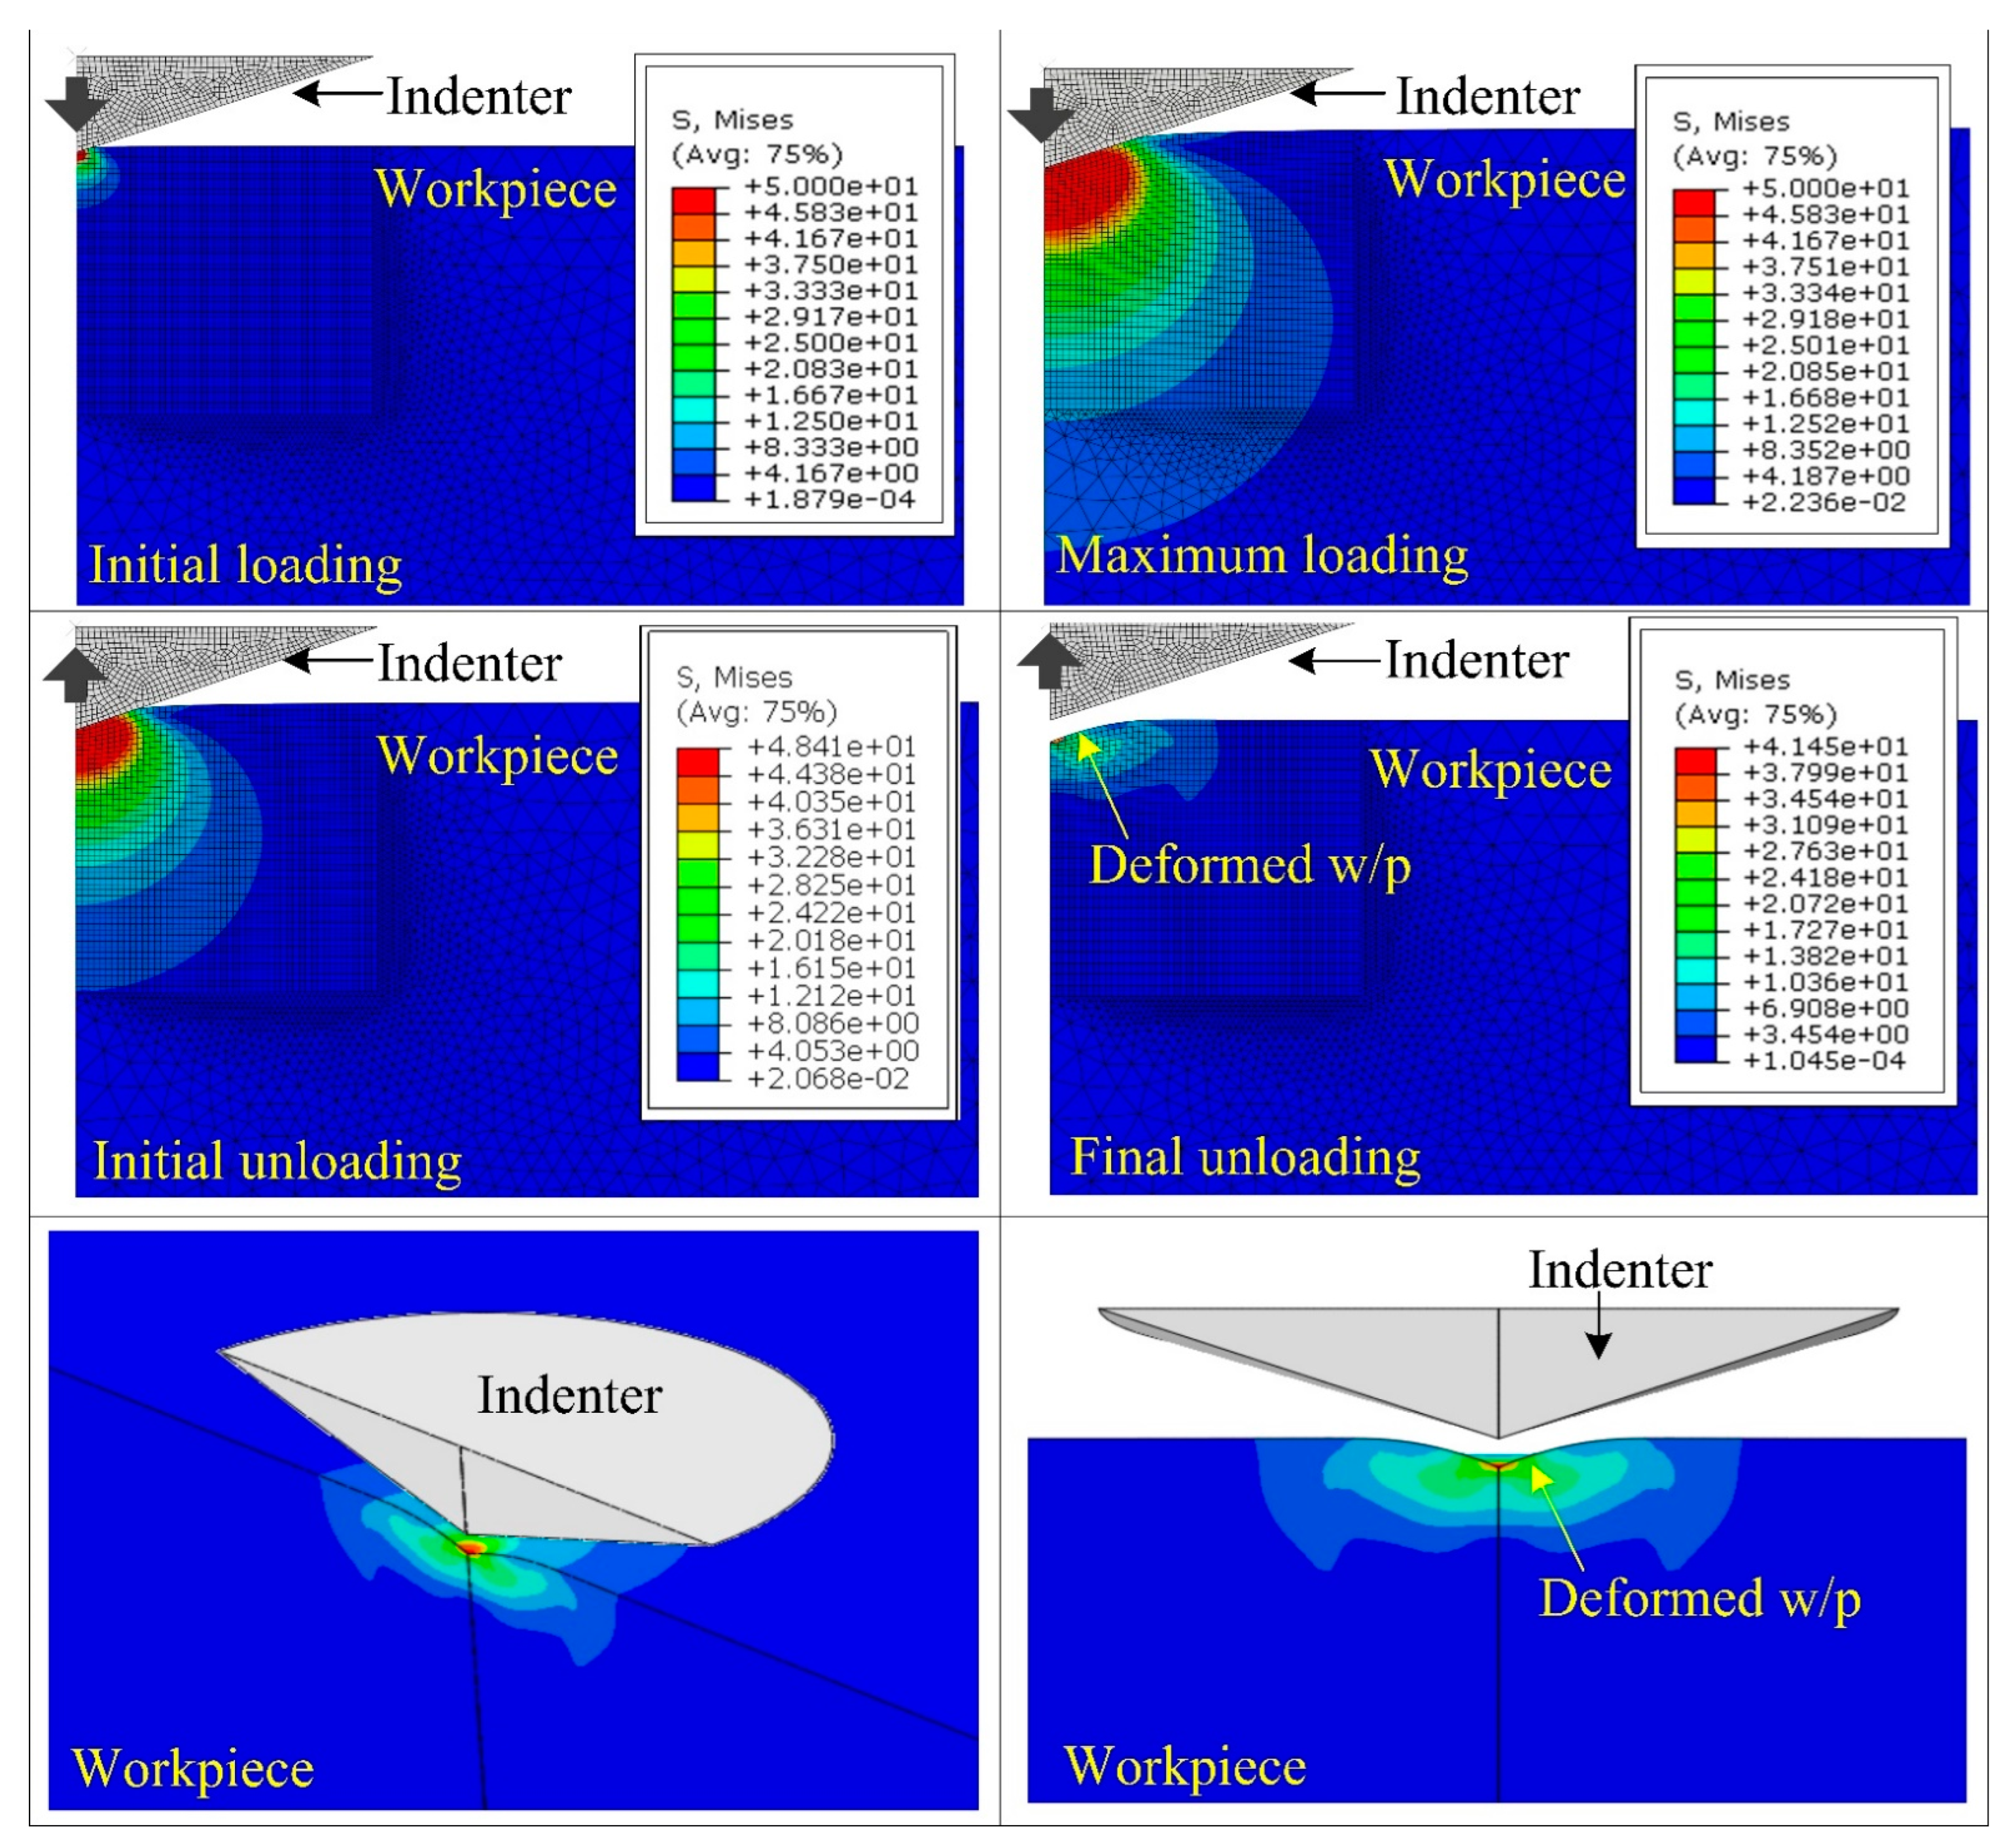
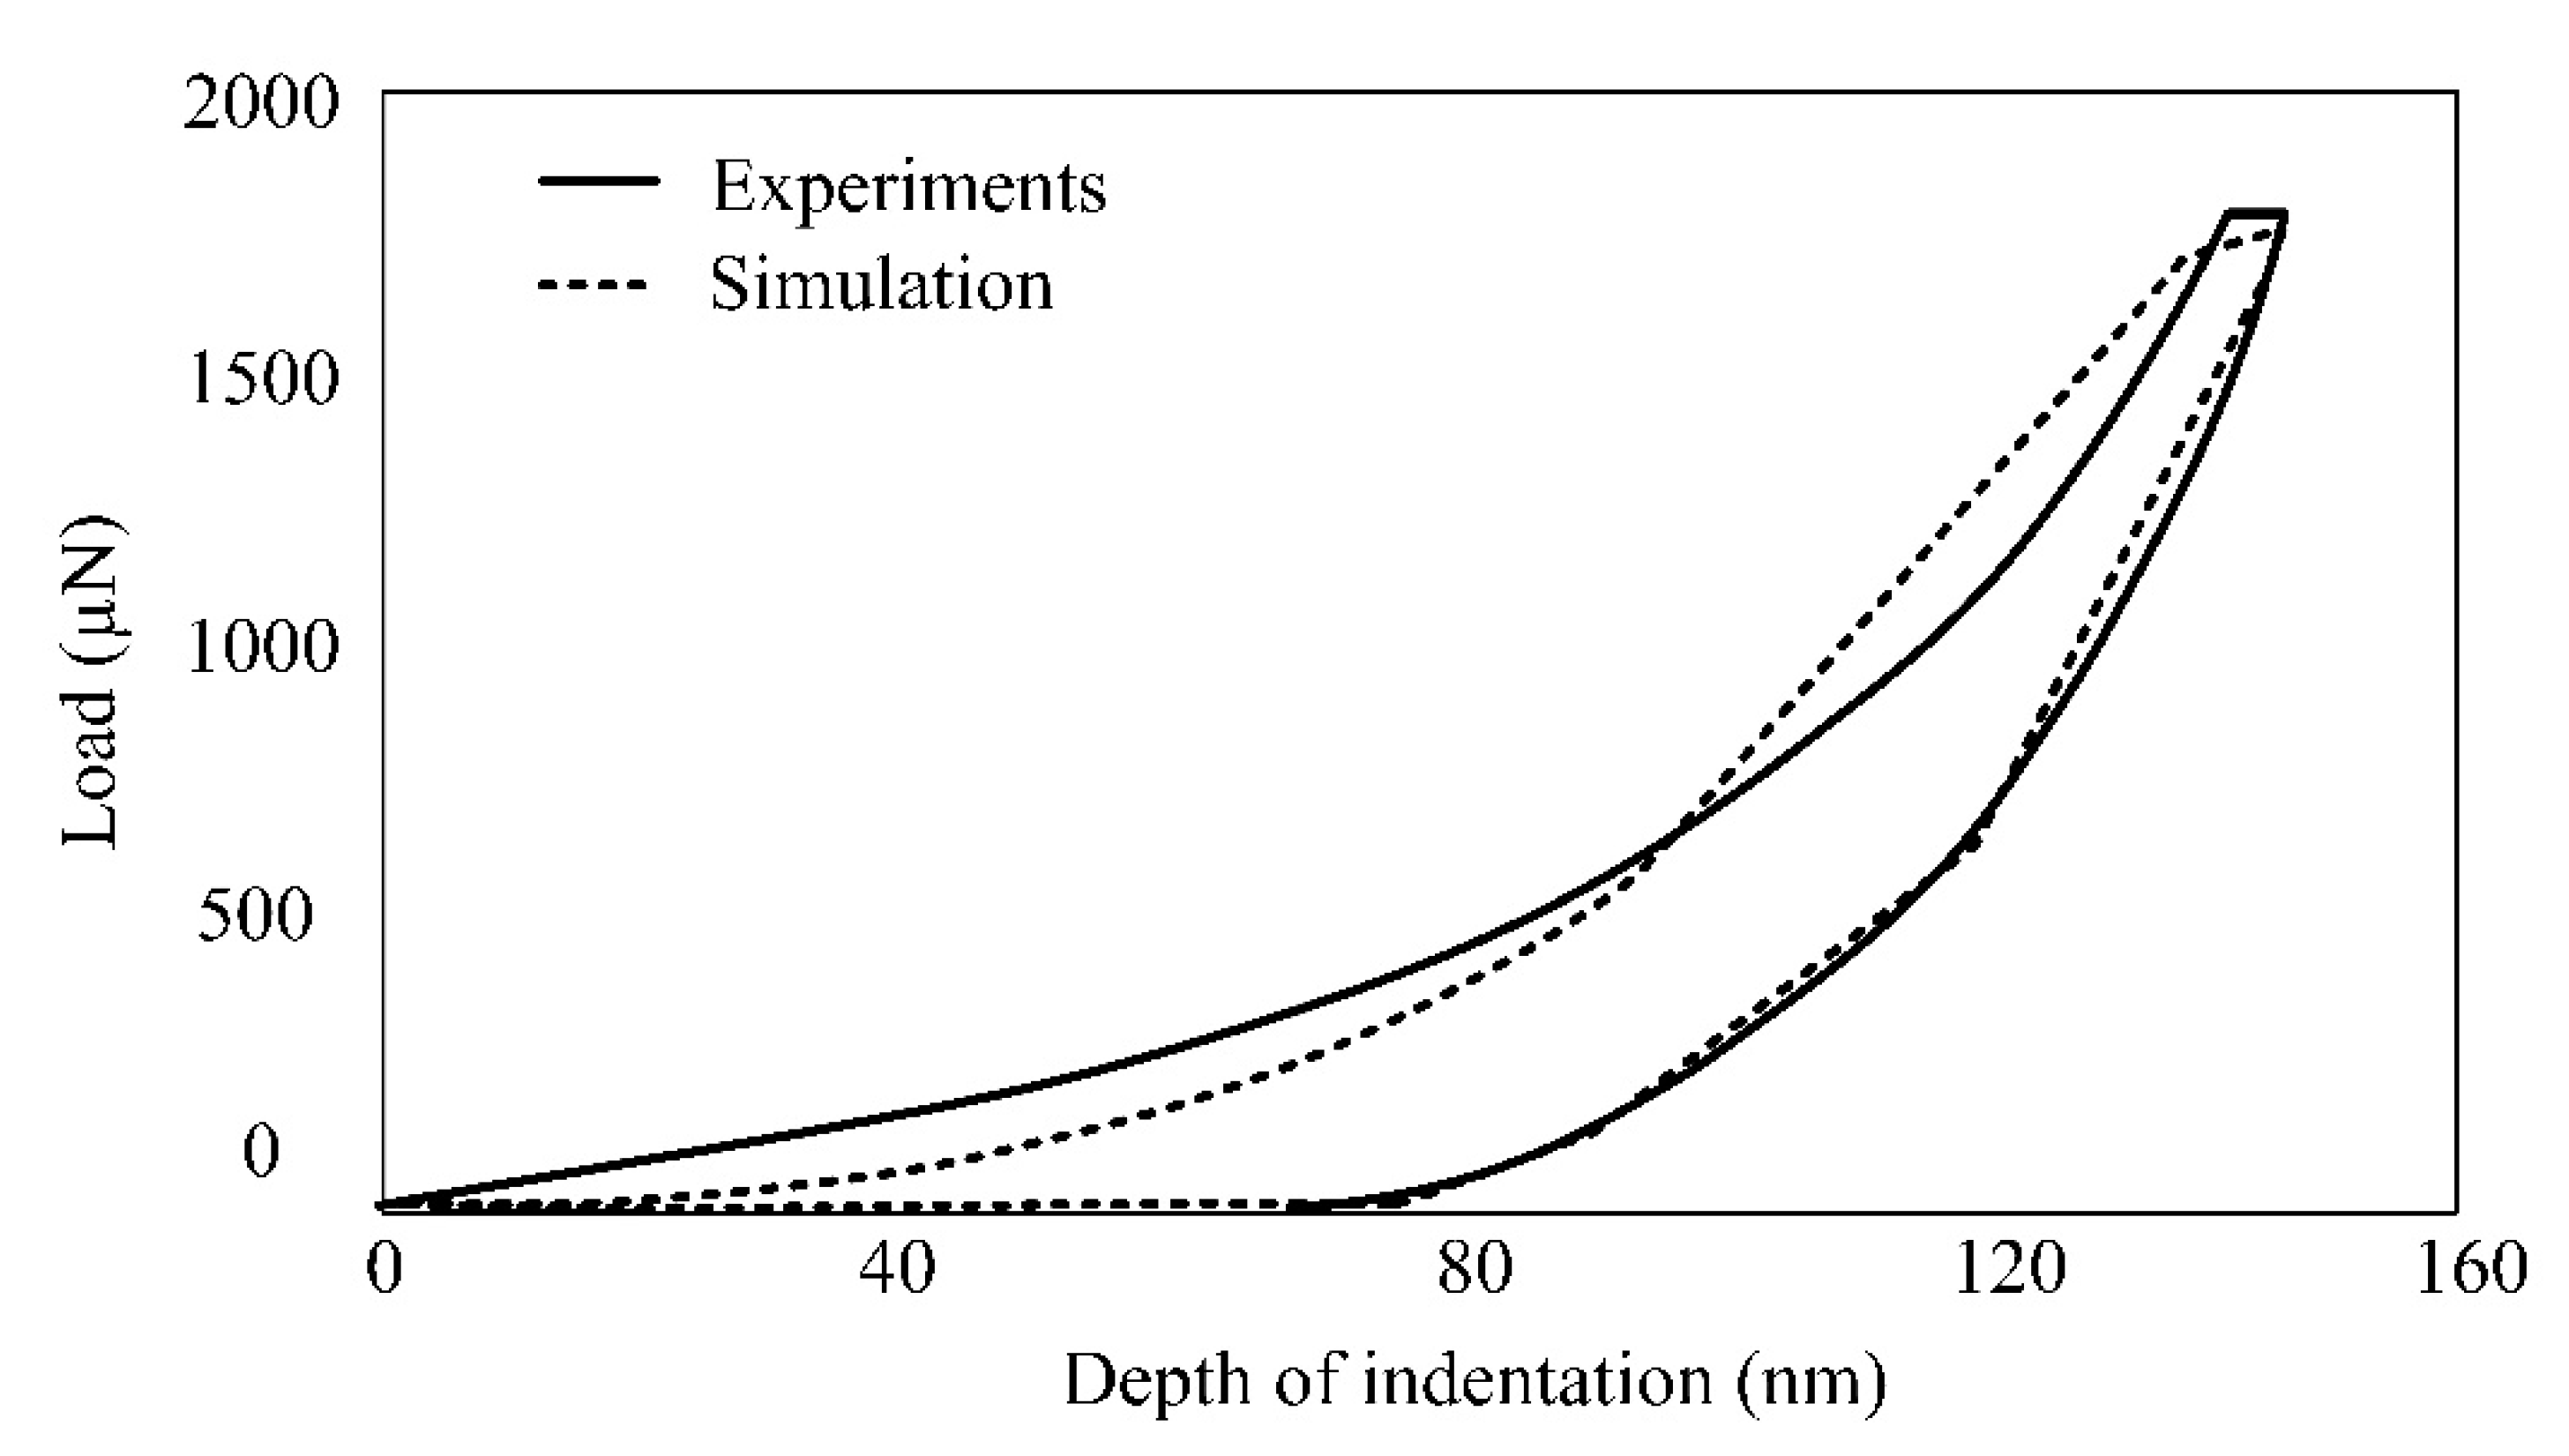
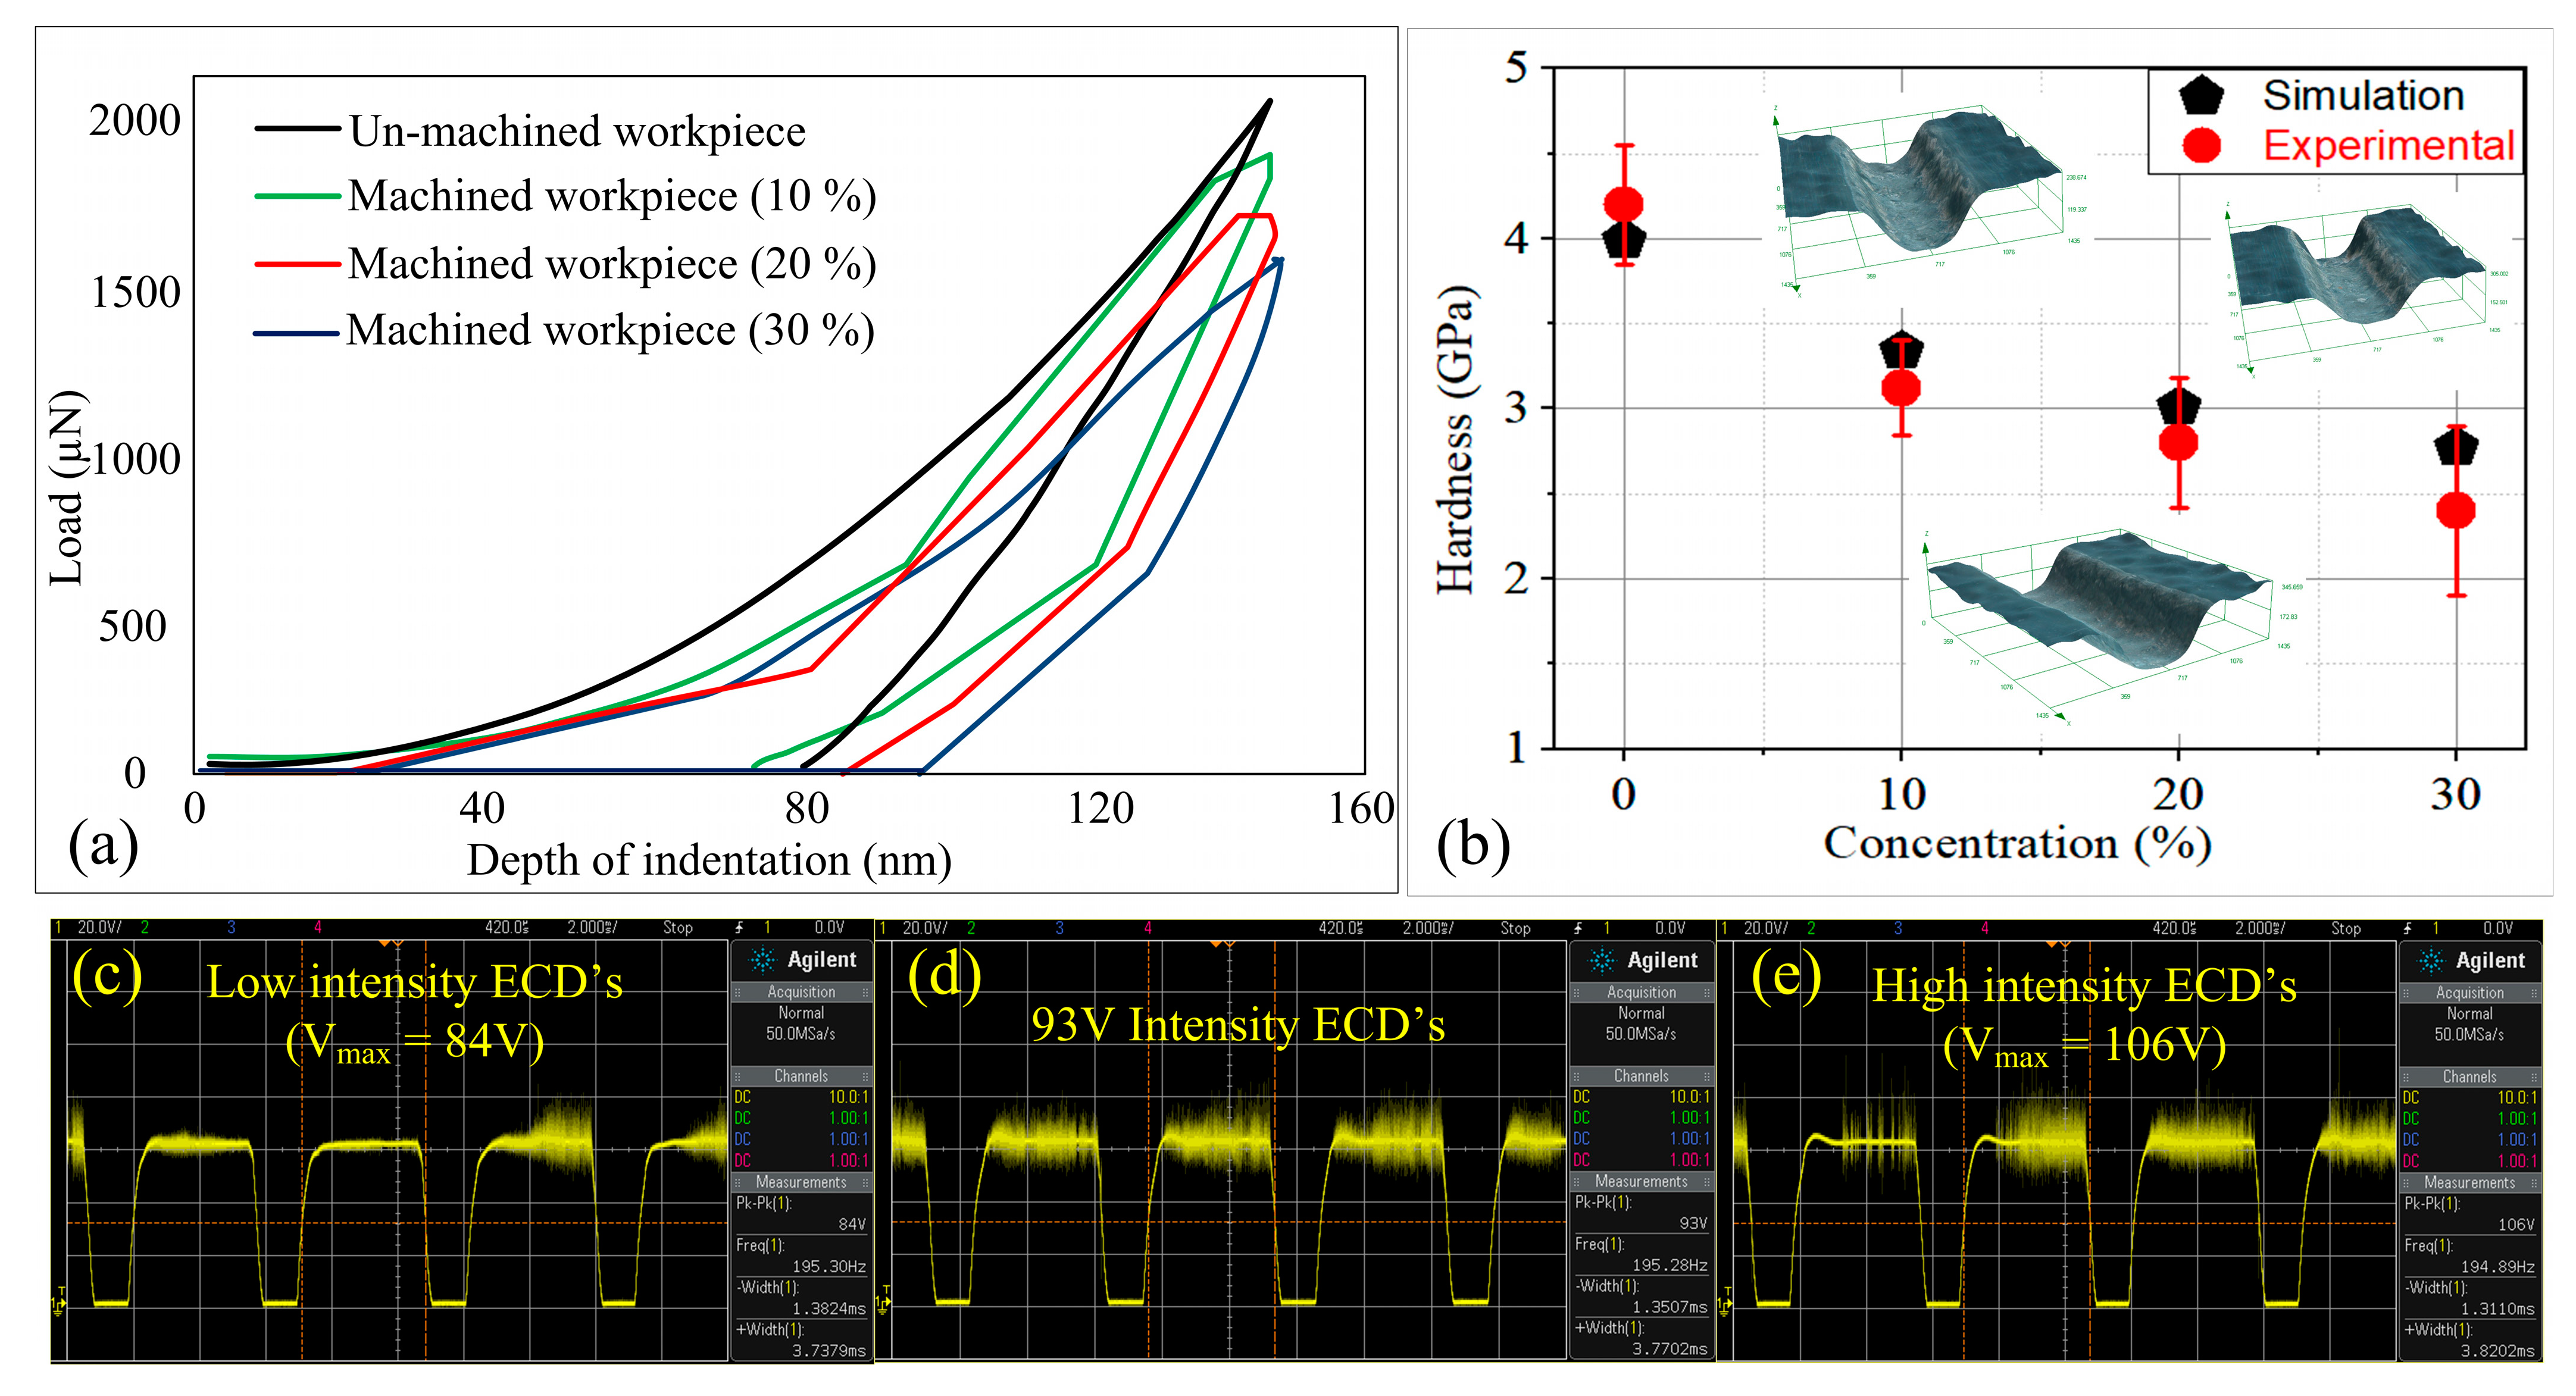
3. Results and Discussion
4. Conclusions
Author Contributions
Funding
Institutional Review Board Statement
Informed Consent Statement
Data Availability Statement
Acknowledgments
Conflicts of Interest
References
- Singh, T.; Dvivedi, A. Developments in electrochemical discharge machining: A review on electrochemical discharge machining, process variants and their hybrid methods. Int. J. Mach. Tools Manuf. 2016, 105, 1–13. [Google Scholar] [CrossRef]
- Abou Ziki, J.D.; Didar, T.F.; Wüthrich, R. Micro-texturing channel surfaces on glass with spark assisted chemical engraving. Int. J. Mach. Tools Manuf. 2012, 57, 66–72. [Google Scholar] [CrossRef]
- Singh, T.; Dvivedi, A. On performance evaluation of textured tools during micro-channeling with ECDM. J. Manuf. Process. 2018, 32, 699–713. [Google Scholar] [CrossRef]
- Arya, R.K.; Dvivedi, A. Investigations on quantification and replenishment of vaporized electrolyte during deep micro-holes drilling using pressurized flow-ECDM process. J. Mater. Process. Technol. 2019, 266, 217–229. [Google Scholar] [CrossRef]
- Bhargav, K.V.J.; Balaji, P.S.; Sahu, R.K.; Katiyar, J.K. Exemplary approach using tool rotation-assisted µ-ECDM for CFRP composites machining. Mater. Manuf. Process. 2022, 1–13. [Google Scholar] [CrossRef]
- Singh, T.; Dvivedi, A.; Arya, R.K. Fabrication of micro-slits using W-ECDM process with textured wire surface: An experimental investigation on kerf overcut reduction and straightness improvement. Precis. Eng. 2019, 59, 211–223. [Google Scholar] [CrossRef]
- Kumar, N.; Mandal, N.; Das, A.K. Micro-machining through electrochemical discharge processes: A review. Mater. Manuf. Process. 2020, 35, 363–404. [Google Scholar] [CrossRef]
- Shamim, F.A.; Dvivedi, A.; Kumar, P. On near-dry wire ECDM of Al6063/SiC/10p MMC. Mater. Manuf. Process. 2021, 36, 122–134. [Google Scholar] [CrossRef]
- Appalanaidu, B.; Dvivedi, A. On controlling of gas film shape in electrochemical discharge machining process for fabrication of elliptical holes. Mater. Manuf. Process. 2021, 36, 558–571. [Google Scholar] [CrossRef]
- Appalanaidu, B.; Dvivedi, A. On the use of sacrificial layer in ECDM process for form accuracy. J. Manuf. Process. 2022, 79, 219–232. [Google Scholar] [CrossRef]
- Jain, V.K.; Dixit, P.M.; Pandey, P.M. On the analysis of the electrochemical spark machining process. Int. J. Mach. Tools Manuf. 1999, 39, 165–186. [Google Scholar] [CrossRef]
- Elhami, S.; Razfar, M.R. Effect of ultrasonic vibration on the single discharge of electrochemical discharge machining. Mater. Manuf. Process. 2018, 33, 444–451. [Google Scholar] [CrossRef]
- Wüthrich, R.; Ziki, J.D.A. Micromachining Using Electrochemical Discharge Phenomenon; Elsevier: Amsterdam, The Netherlands, 2015; ISBN 9780323241427. [Google Scholar]
- Singh, T.; Dvivedi, A. On prolongation of discharge regime during ECDM by titrated flow of electrolyte. Int. J. Adv. Manuf. Technol. 2020, 107, 1819–1834. [Google Scholar] [CrossRef]
- Sabahi, N.; Hajian, M.; Razfar, M.R. Experimental study on the heat-affected zone of glass substrate machined by electrochemical discharge machining (ECDM) process. Int. J. Adv. Manuf. Technol. 2018, 97, 1557–1564. [Google Scholar] [CrossRef]
- Sabahi, N.; Razfar, M.R.; Hajian, M. Experimental investigation of surfactant-mixed electrolyte into electrochemical discharge machining (ECDM) process. J. Mater. Process. Technol. 2017, 250, 190–202. [Google Scholar] [CrossRef]
- Qu, J.; Riester, L.; Shih, A.J.; Scattergood, R.O.; Lara-Curzio, E.; Watkins, T.R. Nanoindentation characterization of surface layers of electrical discharge machined WC–Co. Mater. Sci. Eng. A 2003, 344, 125–131. [Google Scholar] [CrossRef]
- Miao, Q.; Ding, W.; Kuang, W.; Fu, Y.; Yin, Z.; Dai, C.; Cao, L.; Wang, H. Indentation behavior of creep-feed grinding induced gradient microstructures in single crystal nickel-based superalloy. Mater. Lett. 2022, 306, 130956. [Google Scholar] [CrossRef]
- Muhammad, H.; Massab, J.; Muhammad, S.; Alkuhayli, A.; Noman, A.M.; Al-Shamma’a, A.A. Indentation creep behavior of pulsed Tungsten inert gas welded Ti-5Al-2.5Sn alloy joints by nanoindentation and atomic force microscopy. Proc. Inst. Mech. Eng. Part E J. Process. Mech. Eng. 2022, 095440892210781. [Google Scholar] [CrossRef]
- Singh, G.; Pandey, P.M. Neck growth kinetics during ultrasonic-assisted sintering of copper powder. Proc. Inst. Mech. Eng. Part C J. Mech. Eng. Sci. 2020, 234, 2178–2188. [Google Scholar] [CrossRef]
- Karimzadeh, A.; Ayatollahi, M.R.; Alizadeh, M. Finite element simulation of nano-indentation experiment on aluminum 1100. Comput. Mater. Sci. 2014, 81, 595–600. [Google Scholar] [CrossRef]
- Roy, T.; Sharma, A.; Ranjan, P.; Balasubramaniam, R. Modeling the Nano Indentation Behavior of Recast Layer and Heat Affected Zone on Reverse Micro EDMed Hemispherical Feature. J. Manuf. Sci. Eng. 2021, 143. [Google Scholar] [CrossRef]
- Wagih, A.; Fathy, A. Experimental investigation and FE simulation of nano-indentation on Al–Al2O3 nanocomposites. Adv. Powder Technol. 2016, 27, 403–410. [Google Scholar] [CrossRef]
- Singh, T.; Dvivedi, A. On pressurized feeding approach for effective control on working gap in ECDM. Mater. Manuf. Process. 2018, 33, 462–473. [Google Scholar] [CrossRef]
- Oliver, W.C.; Pharr, G.M. An improved technique for determining hardness and elastic madulus using load and displacement. J. Mater. Res. 1992, 7, 1564–1583. [Google Scholar] [CrossRef]
- Pharr, G.M.; Bolshakov, A. Understanding nanoindentation unloading curves. J. Mater. Res. 2002, 17, 2660–2671. [Google Scholar] [CrossRef]


| Glass machined at different electrolyte concentration | 0% | 10% | 20% | 30% |
| Young’s modulus (GPa) | 76.84985 | 75.63827 | 74.38144 | 72.1095 |
| Yield Stress (MPa) | 30 | 42 | 50 | 55 |
| Plastic strain | 0.00 | 0.021 | 0.046 | 0.051 |
Publisher’s Note: MDPI stays neutral with regard to jurisdictional claims in published maps and institutional affiliations. |
© 2022 by the authors. Licensee MDPI, Basel, Switzerland. This article is an open access article distributed under the terms and conditions of the Creative Commons Attribution (CC BY) license (https://creativecommons.org/licenses/by/4.0/).
Share and Cite
Singh, T.; Sharma, S.; Sidhu, S.S.; Shlykov, E.S.; Ablyaz, T.R. Determination of Nanoindentation Behavior of HAZ on Glass Material Machined via ECSM Process through Simulation Approach. Materials 2022, 15, 5870. https://0-doi-org.brum.beds.ac.uk/10.3390/ma15175870
Singh T, Sharma S, Sidhu SS, Shlykov ES, Ablyaz TR. Determination of Nanoindentation Behavior of HAZ on Glass Material Machined via ECSM Process through Simulation Approach. Materials. 2022; 15(17):5870. https://0-doi-org.brum.beds.ac.uk/10.3390/ma15175870
Chicago/Turabian StyleSingh, Tarlochan, Sahil Sharma, Sarabjeet Singh Sidhu, Evgeny Sergeevich Shlykov, and Timur Rizovich Ablyaz. 2022. "Determination of Nanoindentation Behavior of HAZ on Glass Material Machined via ECSM Process through Simulation Approach" Materials 15, no. 17: 5870. https://0-doi-org.brum.beds.ac.uk/10.3390/ma15175870