1. Introduction
There is a significant importance of fracture mechanics in mechanical engineering. Most structural failures in automobiles, aircraft, bridges, and tanks are a result of fatigue crack propagation in materials [
1]. Structural failure of a 58-year-old Grumman G73T Turbo Mallard Seaplane is one of the examples that occurred in 2005; the right hand wing of which shed on a domestic flight in the USA. In 2002, a Chinese Boeing 777 crashed mid-air as a result of a structural failure as well. The crash of a Japanese Boeing 747 SR100 was also due to structural failure. Such accidents pose a serious threat to automobile manufacturing companies to survive, as these failures lead towards human loss, as well as enormous economic deficit. This remains to be a matter of serious concern. Crack propagation under fatigue has been comprehensively explored by researchers and professionals in this field and many of them tried to predict it using various methodologies with the help of theoretical and experimental knowledge [
2,
3].
In engineering, fatigue is a process of material failure at a stage that is far below the actual material strength when subjected to cyclic loading [
4]. The traditional models attempt to predict the fatigue crack growth (FCG) rate
with respect to the stress intensity factor (SIF),
[
5]. A typical graph is shown in
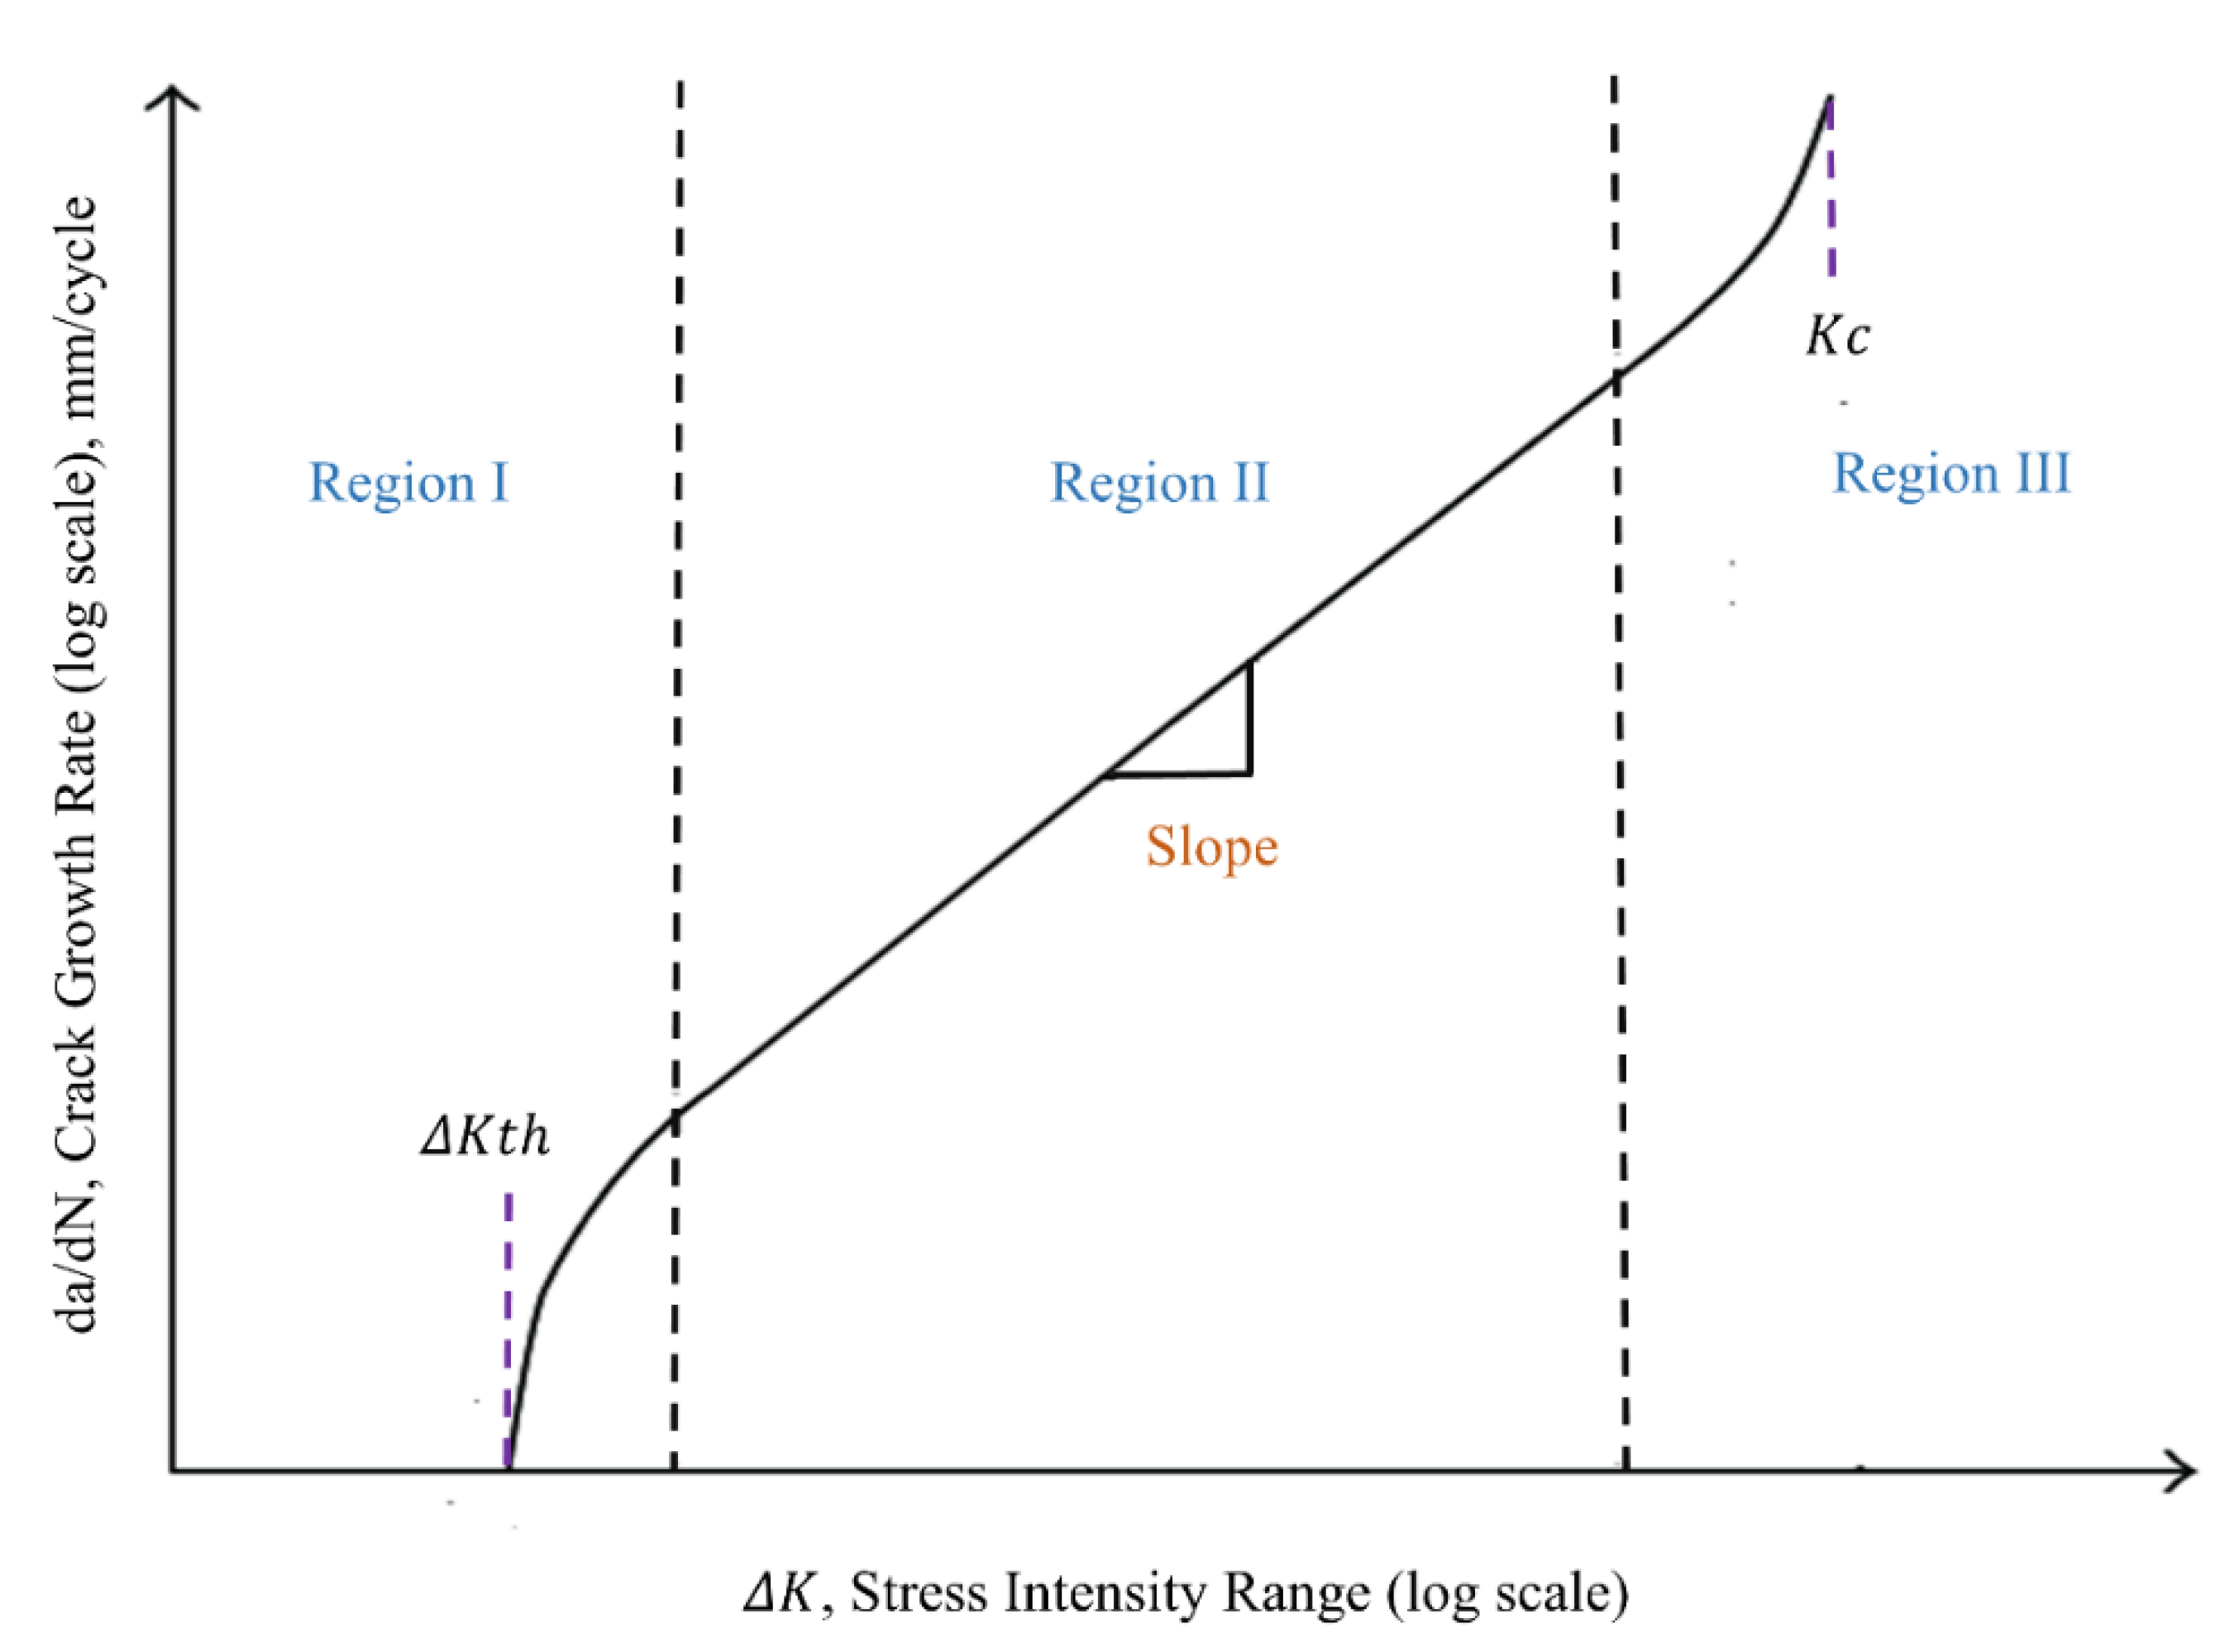
Figure 1. In this figure,
represents the length of the crack, while
represents the number of cycles that leads to failure of structure. The FCG curve is divided into three regions. The crack growth rate is much slower in Region I. In Region II, the graph shows a linear and stable growth followed by a rapid growth in Region III [
6]. Paris and Erdogan [
7] presented a pioneer model in their study using an extensive pool of data, which is also known as Paris’ law. It presented the accurate modeling of an FCG curve, especially in Region II, which is also called the Paris region. Forman et al. [
8] claimed that the stress ratio effect was ignored in the Paris model. The model was improved in their study by considering the stress ratio and crack instability effect. It is stated that this model is more flexible compared to the classical Paris model as it is based upon a large amount of data. Priddle et al. [
9] presented a method that improves Paris’ law. However, this model failed to address SIF at threshold,
, average SIF, and stress ratio effects [
10]. Kujawski et al. [
11] designed a parameter to relate stress ratio and FCG rate, both for long and short cracks in the Paris region. All the above mentioned models cannot handle non-linearity in Region II and III of the graph [
12]. A short literature summary has been provided in
Table 1.
In comparison to the extensive literature on empirical techniques, machine learning-based models have lesser literature available as this is a relatively modern technique [
19]. Jang et al. [
20] forecasted the fatigue life of chains used in cranes to lift heavy duty cargo loads using machine learning. Specifically, a logistic regression-based model was used. The experimental data were extracted using strain gauges. Fatigue life prediction in overhead wires was predicted using artificial neural networks (ANNs) by Nowel and Nowel [
21]. Yan et al. [
22] analyzed the failure of a bridge as a result of an overloading of vehicles using machine learning methodology. This approach gave more accurate results as compared to conventional finite element analysis-based techniques. In [
23], the researchers used a radial basis function neural network (RBF-NN) to predict the fatigue crack growth rate in the airplane industry. The problem of vibrations in electrical transmission lines caused by wind, earthquakes, or snow loading was addressed by Pestana et al. using ANNs [
24]. Younis [
25] carried his work forward by predicting fatigue crack length using radial-based function-NN (RBF-NN). Moreover, optimized neural networks were used to predict the FCG rate in aircraft aluminum structures by Younis et al. [
12]. The hill climbing optimized neural network produced better results among the other two by having better relevance with experimental data.
2. Fracture Mechanics
Fracture mechanics is the study of crack propagation in materials. All engineering structures are prone to geometrical discontinuities. The size and shapes of such features are crucial as they pose serious concerns about the strength of the component [
26]. Structures exposed to cyclic loading fail far below their strength due to fatigue. It refers to the progressive degradation of material due to cyclic loading when subjected to applied force such as stress, strain, and torque [
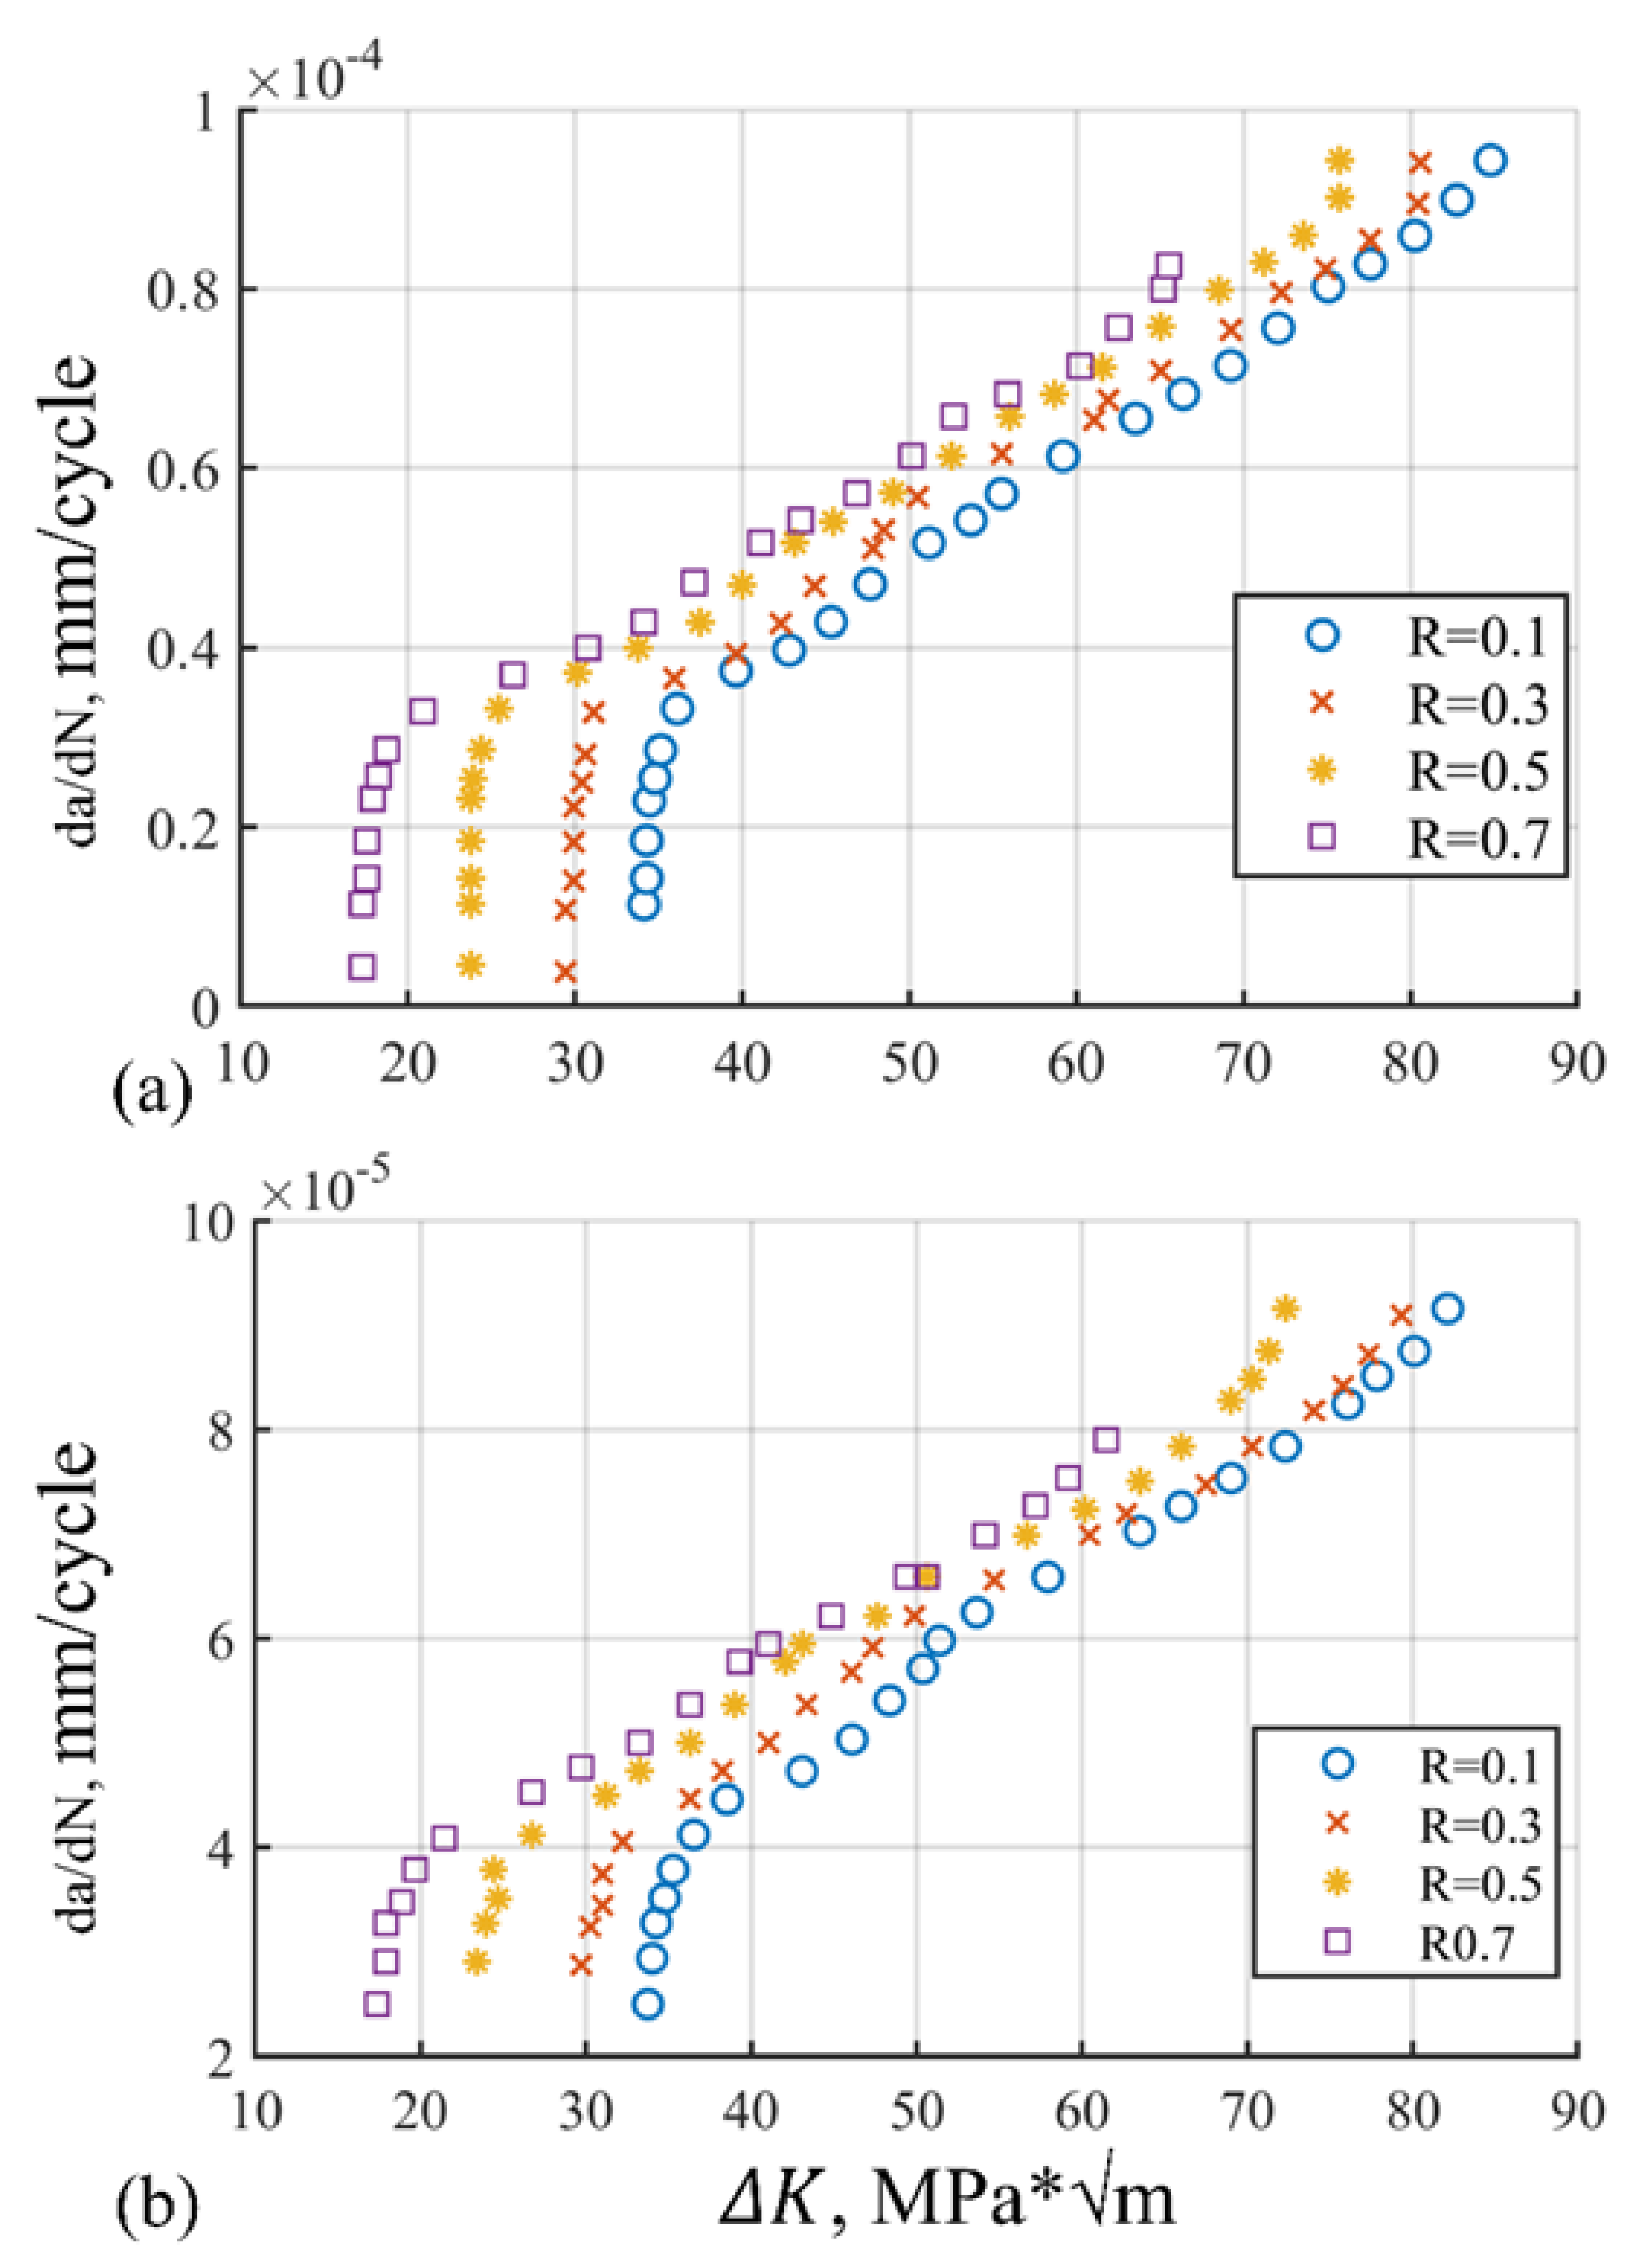
27]. Fatigue crack growth is discussed in context to different crack regions as shown in
Figure 2 for 2324 T39 and 6013 T651 materials. Crack initiation is the first phase of crack propagation, followed by stable crack propagation and unstable crack propagation, respectively. In the first region, small cracks initiate that are of the order 10–25 µm or even less. This region is also called the threshold region. In Region II or the Paris region, the crack growth rate is of the order
After crossing Region II, the crack propagates exponentially; that is, of the order
. The Paris region is a main concern of our research, which is explained by Paris and Erdogan [
7] in the form of the crack growth equation. It is also called Paris’ law. The stress intensity factor
illustrates load all over the crack tip. The
can be utilized to correlate the R-ratio effects [
27]. Crack propagation is the function of SIF range and
during cycling loading. It is mathematically presented as (1):
where
is the crack length,
is the crack growth rate for load cycle
.
and
are constants that are material dependent. SIF range can be represented as (2):
3. Proposed Technique
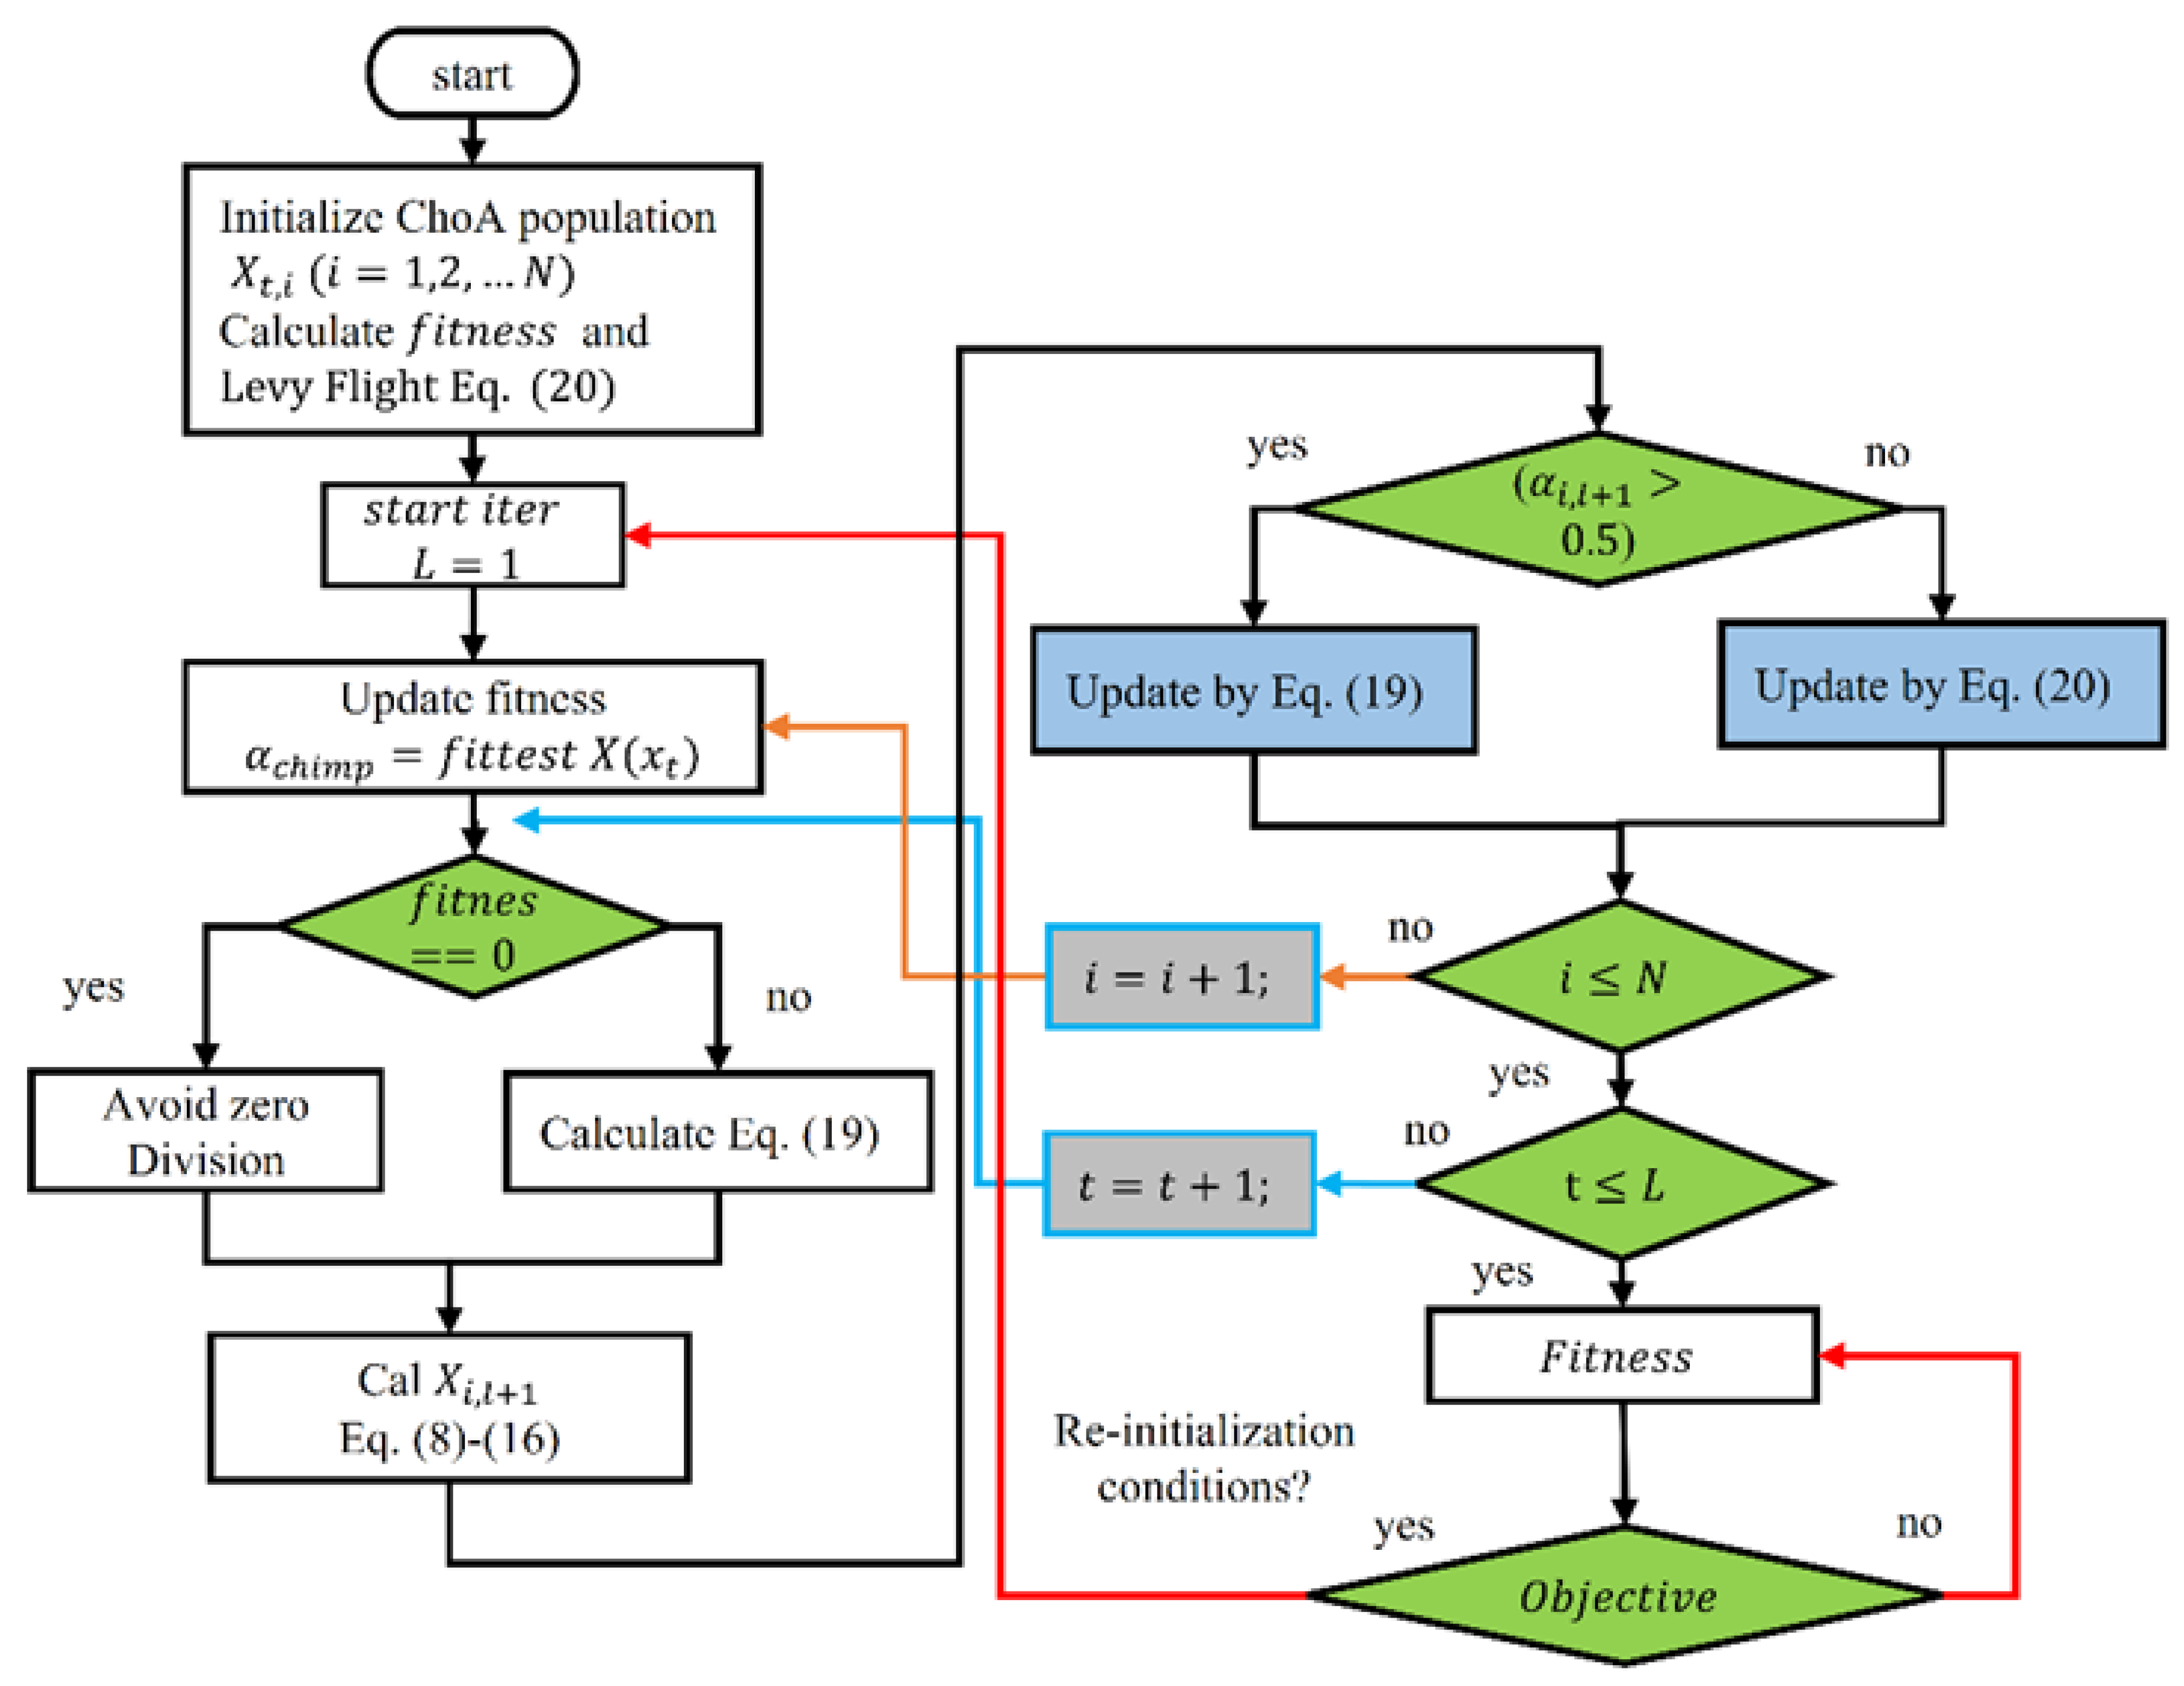
3.1. Dynamic Levy Flight Chimp Optimization Algorithm
In the following section, a new chimp optimization algorithm with Levy Flight random movement (DLFCO) is put forward in order to train DNN. The presented procedure updates the weights and biases of the DNN in order to decrease the cost mapping. DLFCO is an optimization algorithm based on the populace that has the application in the hunting and preying behavior of the chimps to update the weights and biases with the Levy flight random walk in order to obtain global maxima in the exploitation phase. Fusion of LF with the ChoA improves the exploration and exploitation capability of the algorithm [
28]. This extremely exploratory attitude enables it to locate the overall best answer, that in turn efficiently trains the DNN model. This trained framework forecasts the fatigue crack growth for the aluminum alloys in aircraft applications. The preceding segment elucidates the chimp optimization and sine–cosine merged chimp optimization algorithm.
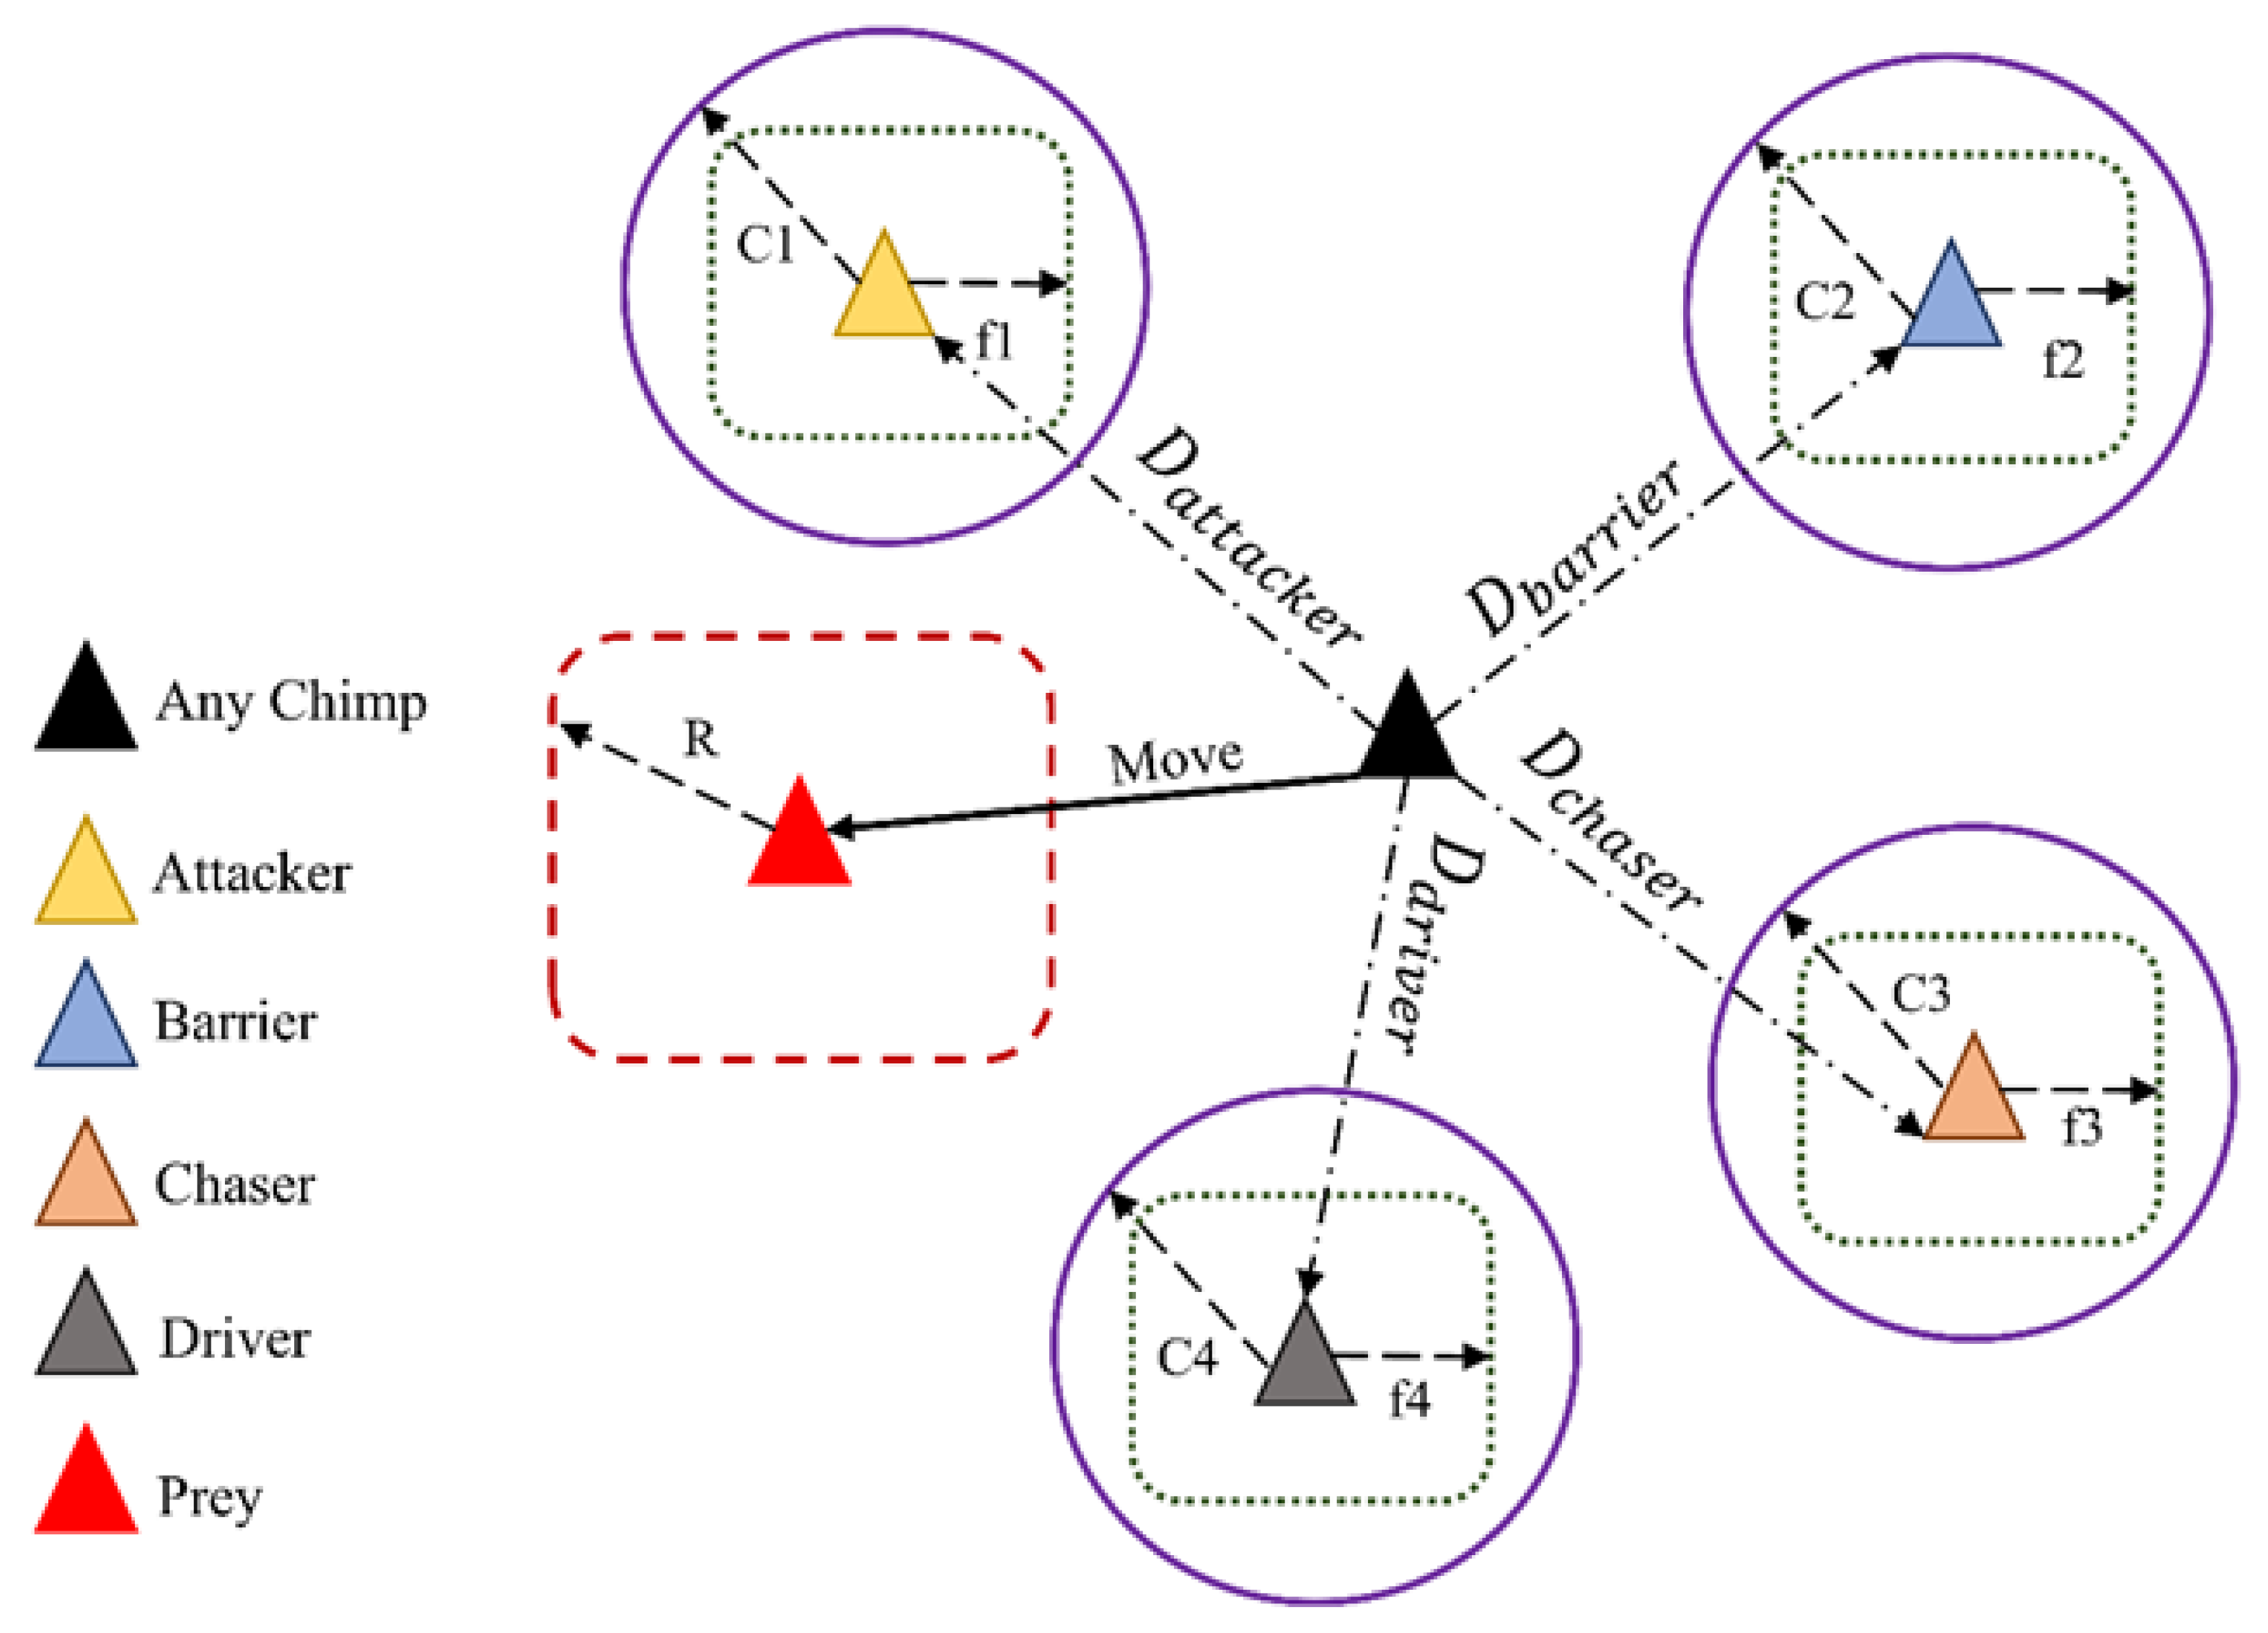
3.1.1. Chimp Optimization Algorithm (ChoA)
This model obtains its motivation by the intellect of the chimpanzee and breeding actions in cluster hunting. Four techniques are implemented to replicate the attitude, which are attack, chase, barrier, and driver as show in
Figure 3. The scientific equations of the driver and attacker of the presented approach are mentioned in (3) and (4), respectively.
where
m,
c, and
d are the co-efficient vectors. These factors may be rationalized by (5)–(7).
where
and
represent random numbers in the range of 0–1 and
is a constant which decreases in the direction of a line from 2.5 till 0 all along the iterations and
is a disordered vector. To mathematically simulate this system, the four best results with optimal capability are chosen which are attacker, barrier, chaser, and driver. The remaining inhabitants will upgrade their location with help from the data provided by the best four results. Their statistical demonstration is given by Equations (8), (9), (10), and (11), respectively.
The succeeding point of the chimps are restructured consequently using (12)–(15):
Using the above equations, the positions are upgraded through:
Subsequently, after upgrading the positions, (17) is applied.
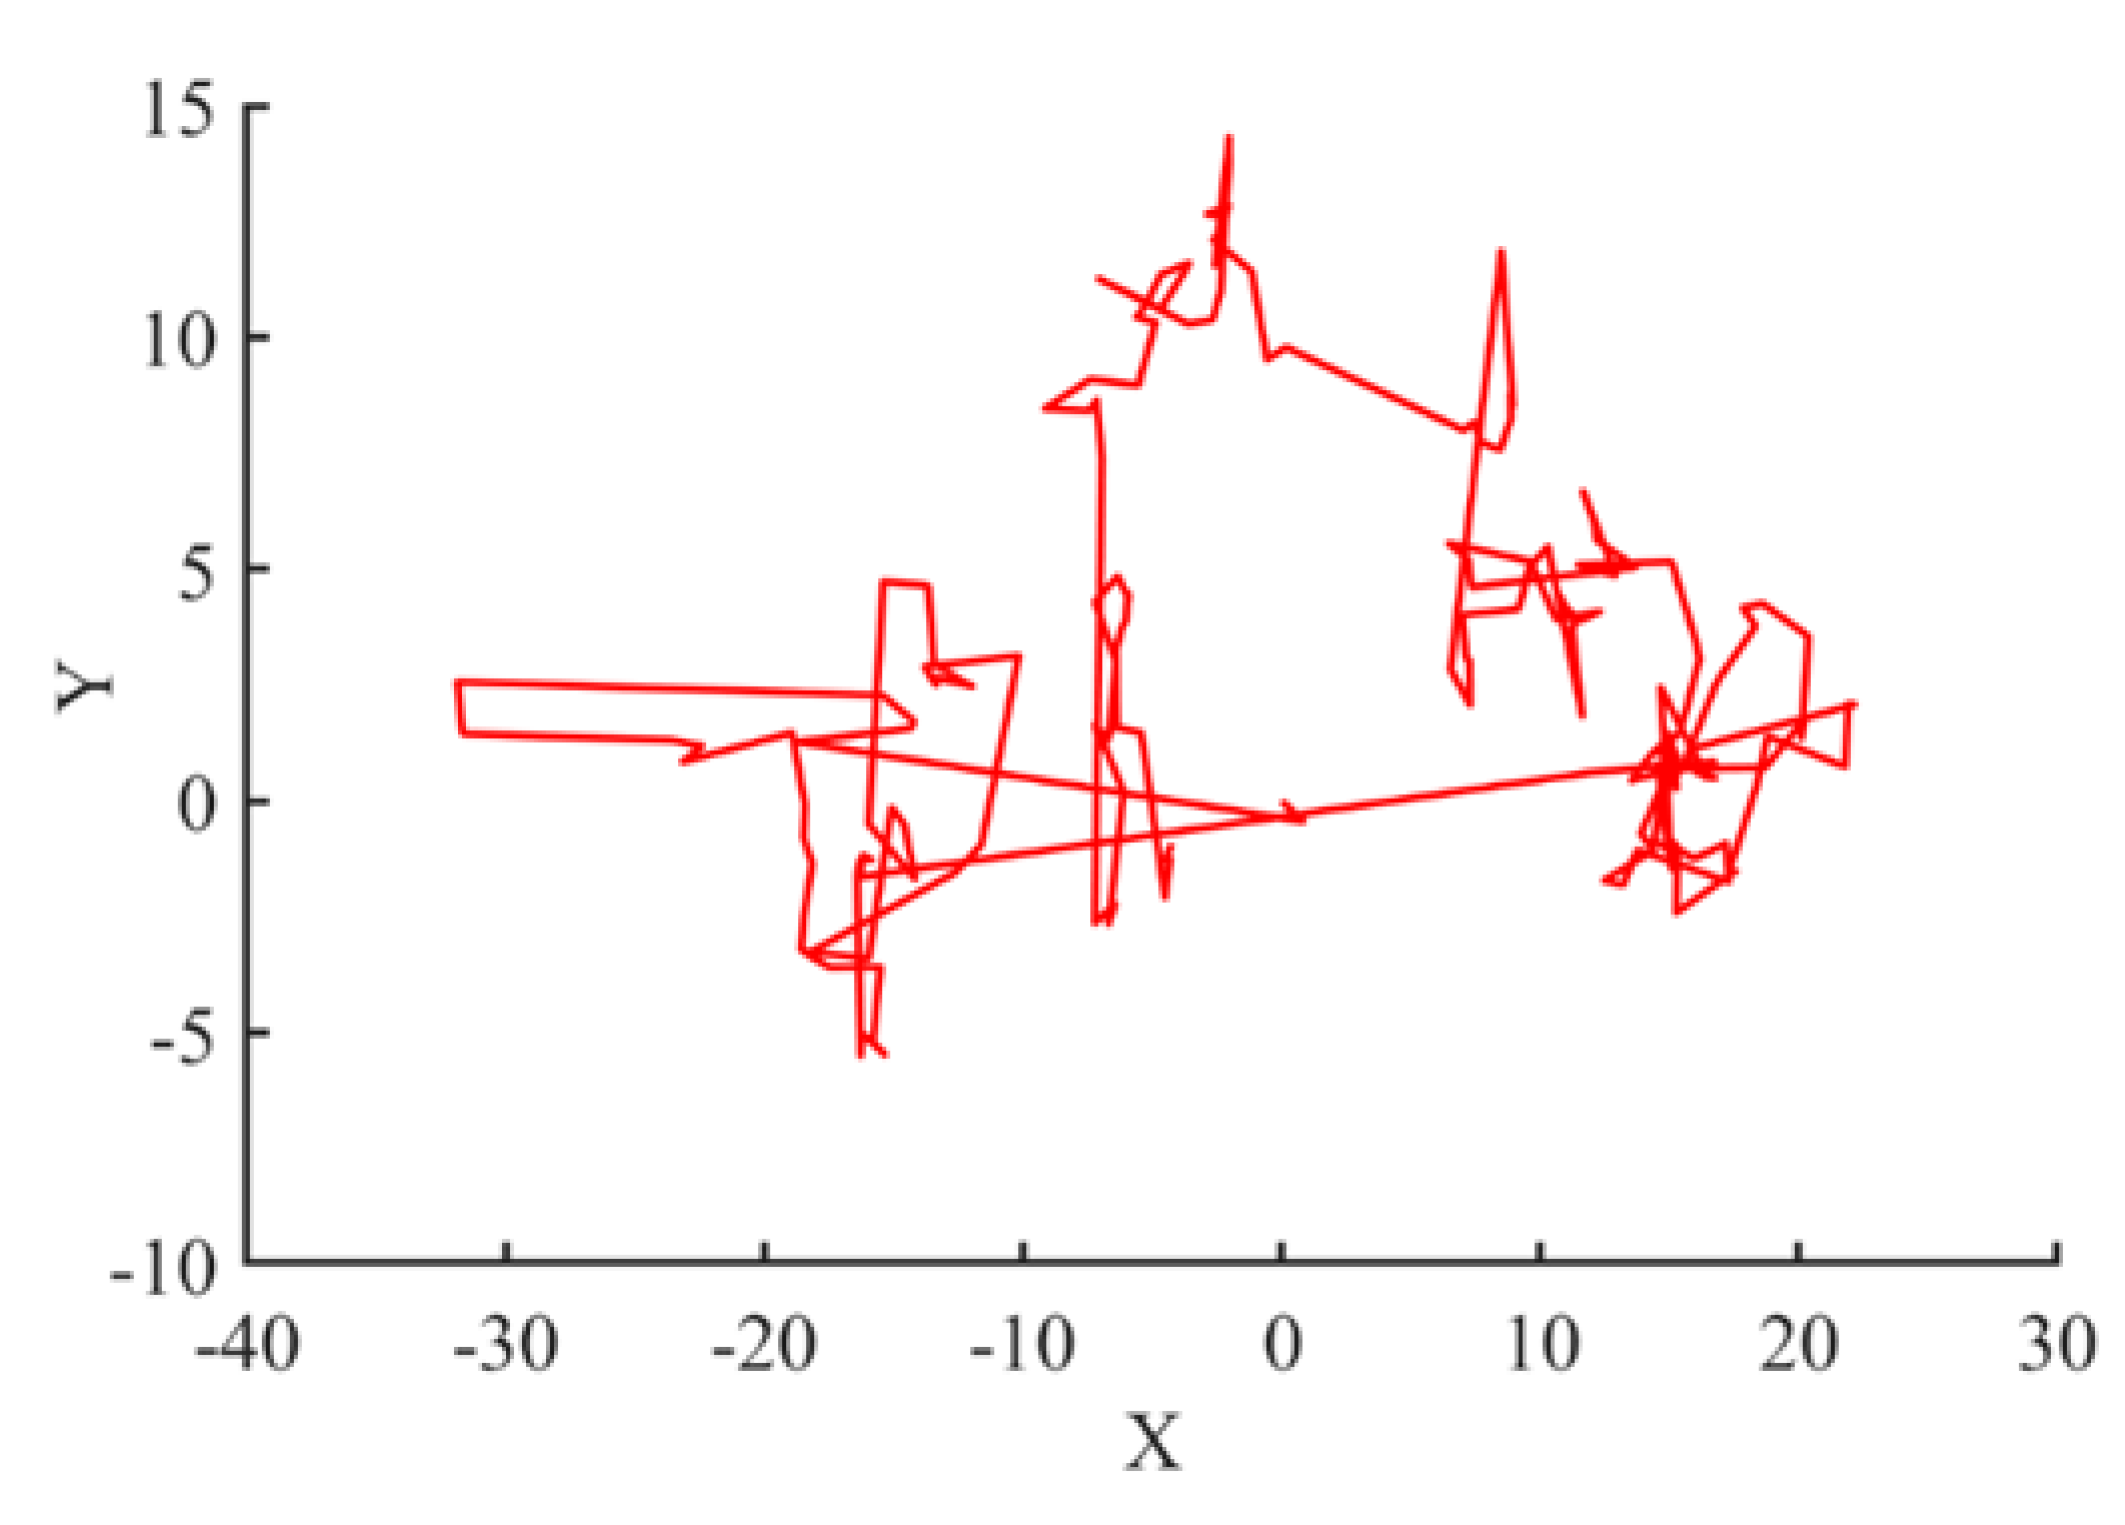
3.1.2. Levy Flight (LF)
Levy flight is the random walk used for position updating in a search of global maximum position in the area of search. LF is a non-Gaussian distribution based on arbitrary numbers. The Levy flight random walk is presented in
Figure 4. The Gaussian method is a relatively stable procedure, containing summation of the Gaussian variables and Gaussian spread. The probability density function is shown in (18).
The Levy spread has two constraints, i.e.,
,
, and is proportional as well, regarding
. Where
is the scaling aspect,
> 0 and
is between [0, 2] [
29]. The factor
defines the spreading figure to attain a number of probability distribution characters; specifically, the end of dispersion is governed by the factor
.
Figure 4 provides the chaotic map of the Levy flight showing long and short jumps in the search space.
3.1.3. Improved ChoA with LF
The established ChoA keeps its agents posted in the direction of its prey, i.e., the best position on the basis of the driver, chaser, barrier, and attacker positions. On the other hand, the search neurons of the algorithm can become stuck in local minima in some circumstances. So, the premature conjunction issue may pose a threat. In a few circumstances, the acknowledged ChoA is unable to perform the transition from the exploration to exploitation phase and back smoothly. In this section, LF is applied to speak about the above stated limitations. The DLFCO offers more deep searching arrays that lead towards an efficient global search. This arrangement can solve immobility issues as well. In addition, the agent features must be upgraded in DLFCO through all iterations. The chimp’s location can be updated using (19) and (20).
where ⊕ designates multiplication in the hierarchical entry,
W1 and
W2 are decreasing over the iterations, in that order; these equations are defined in a manner that
W1 shows a descending angle and
W2 shows an ascending angle, and both of the parameters show an arbitrary performance. The pseudo code of the proposed technique is presented in
Figure 5.
3.2. Deep Neural Network (DNN)
An artificial neural network (ANN) is a brain-like structure in which learning is undertaken by experience. It consists of three layers, i.e., input layer, hidden layer, and output layer. The input layer acts as a channel to pass information to the hidden layer by multiplying with weights , which are weights from the input layer to the hidden layer. The relationship of input and output data of the hidden layer is presented in Equation (22). The hidden layer applies to the predefined mathematical model which is called the activation function. The output of the hidden layer is passed onto the output layer after multiplying it with weights . The relationship between the output and hidden layer is presented by Equation (23).
Figure 5.
Pseudocode of DLFCO.
Figure 5.
Pseudocode of DLFCO.
The number of weights and biases are directly proportional to the number of neurons in the hidden layer. The selection of the number of neurons in the hidden layer depend upon the non-linearity of the dataset. A high number of neurons could result in overfitting, while a lower number of neurons could lead to inefficient training of the ANN. Therefore, in order to deal with a highly non-linear dataset, multiple hidden layers need to be added between the input layer and output layer, which is called the deep neural network.
The deep neural network (DNN) is a multi-layered structure like the ANN, but it consists of more than one hidden layer. In this work, a layered DNN is implemented which contains one input layer, two hidden layer neurons, and one output layer, as shown in
Figure 6. Six neurons are selected in the hidden layer.
3.3. Activation Function
For active mapping of inputs and outputs, a function is required in the hidden layer neurons called the activation function. Each hidden layer neuron has the activation function which is chosen on the basis of application. There are different types of activation functions in classification and regression applications. For classification, the sigmoid function is commonly used as in Equation (21).
As the fatigue crack growth rate is a regression problem and has a highly non-linear nature, the radial basis function neural network is chosen as the activation function, which is given by (22).
Figure 6.
Structure of DNN.
Figure 6.
Structure of DNN.
3.4. Cost Function
The cost function or fitness function is the function that tells the difference between actual data and predicted data. This is the function which needs to be minimized during training of the ANN by updating the weights and biases. Various types of cost functions are presented in Equations (23)–(26).
The normalized root mean square error (NRMSE) is the cost function which is selected for this problem and is presented in Equation (26). The specifications of the DNN used in this network are presented in
Table 2.
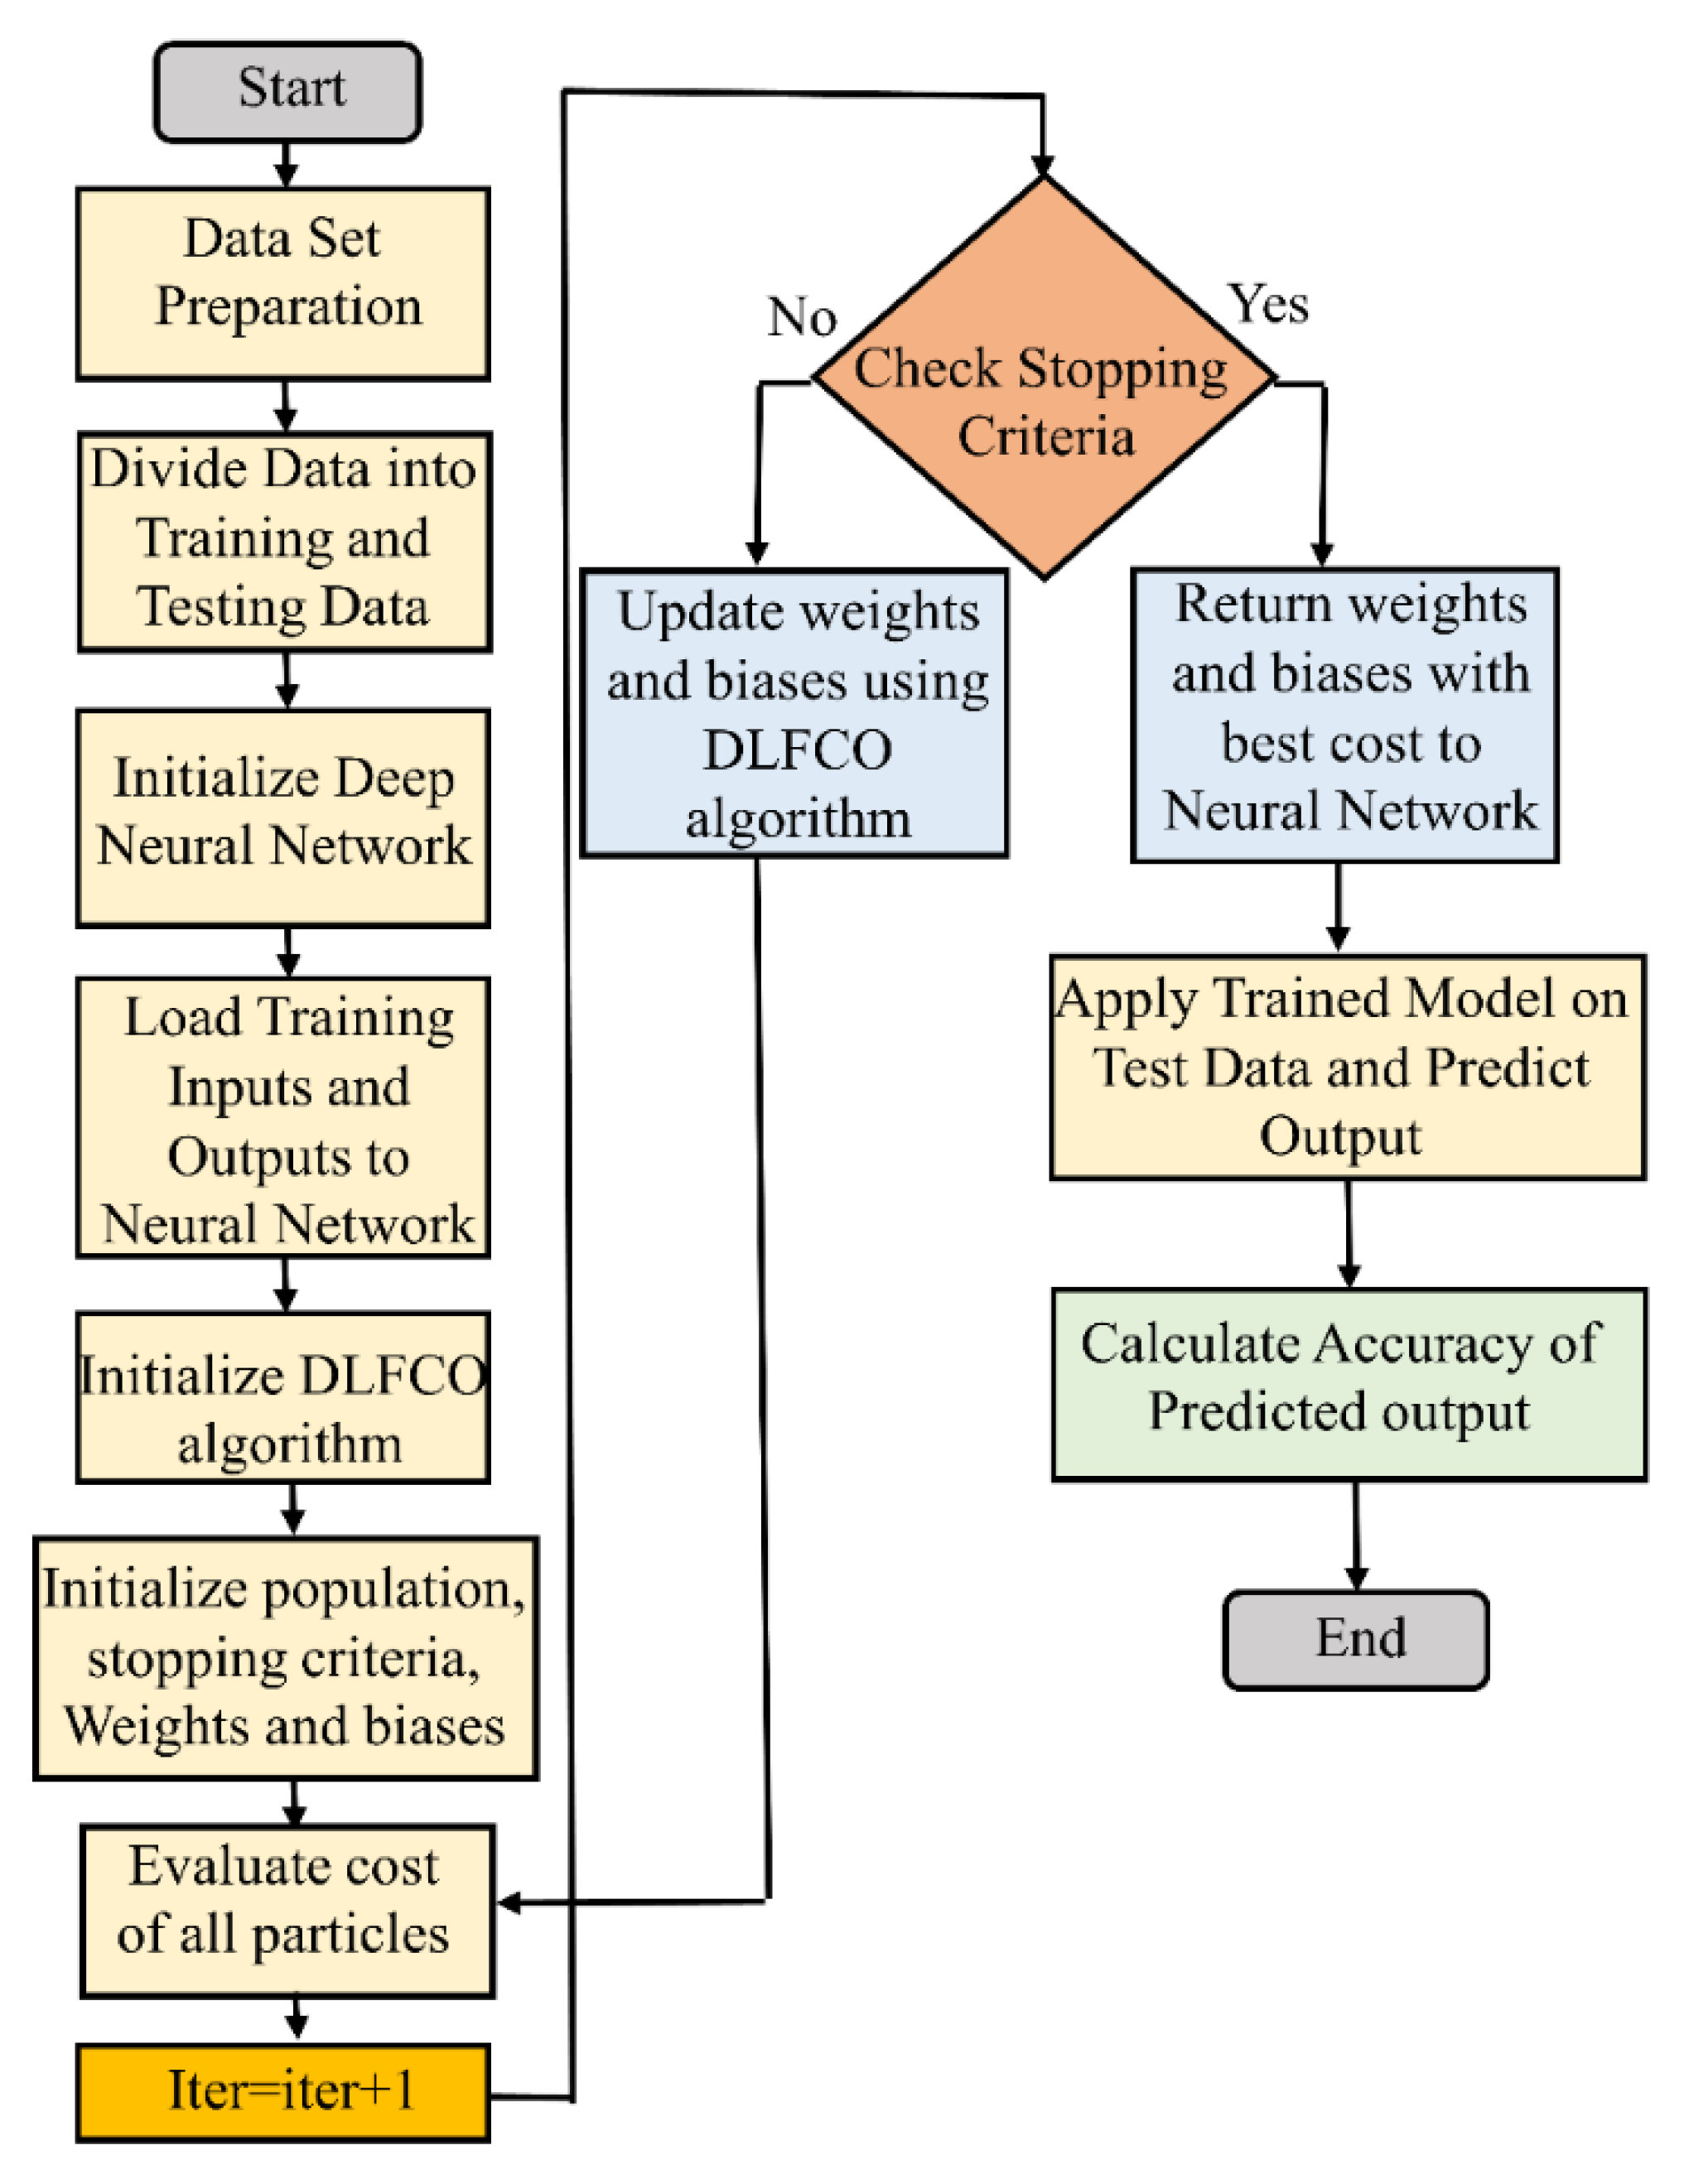
3.5. Neural Network Training Using DLFCO
Updating weights and biases in the neural network is called the training of the neural network. The back propagation (BP) algorithm is one of the simplest algorithms to train neural networks, but it takes lots of iterations for effective training, which makes BPNN expensive computationally. For effective training of weights and biases, the metaheuristic optimization algorithm is used in this work, which calculates the cost function and updates weights and biases according to the mathematical model of the optimization algorithm.
As shown in
Figure 7, firstly, 50 sets of weights and biases are initialized over the search space randomly. These sets of weights and biases are the particle’s position. Then, the DNN structure with two hidden layers having six neurons in each layer are initialized. After that, fitness is calculated for every particle using NMSE, which defines the best particle’s position for the current iteration in the population. After calculation of the best particle, the particle’s position is updated using the optimization algorithm. This phase of optimization is called the exploration phase.
5. Discussion
To verify the prediction performance of shape and growth rate evolution, the testing set has been employed. The aluminum alloys under experimental data are 6013 T651, 7055 T7511, and 2324 T39. The 6013 T651 is medium strength aerospace alloy that offers enhanced formidability and corrosion resistance. The 2324 T39 alloy exhibits higher strength with better fracture toughness. The 7055 T7511 alloy is predominantly employed in compression-dominated structures due to improvised compressive and tensile strengths. The experiments conducted at the Fracture Technology Associates Laboratory utilize aluminum with an
R-ratio range of 0.1–0.7 in several experiments. The stress was applied using a servo-controlled, hydraulically actuated, closed-loop assembly equipped with HIL data acquisition and parameter control. Strain gauge transducers measure the displacement that is utilized to measure the length and growth rates secondarily [
30].
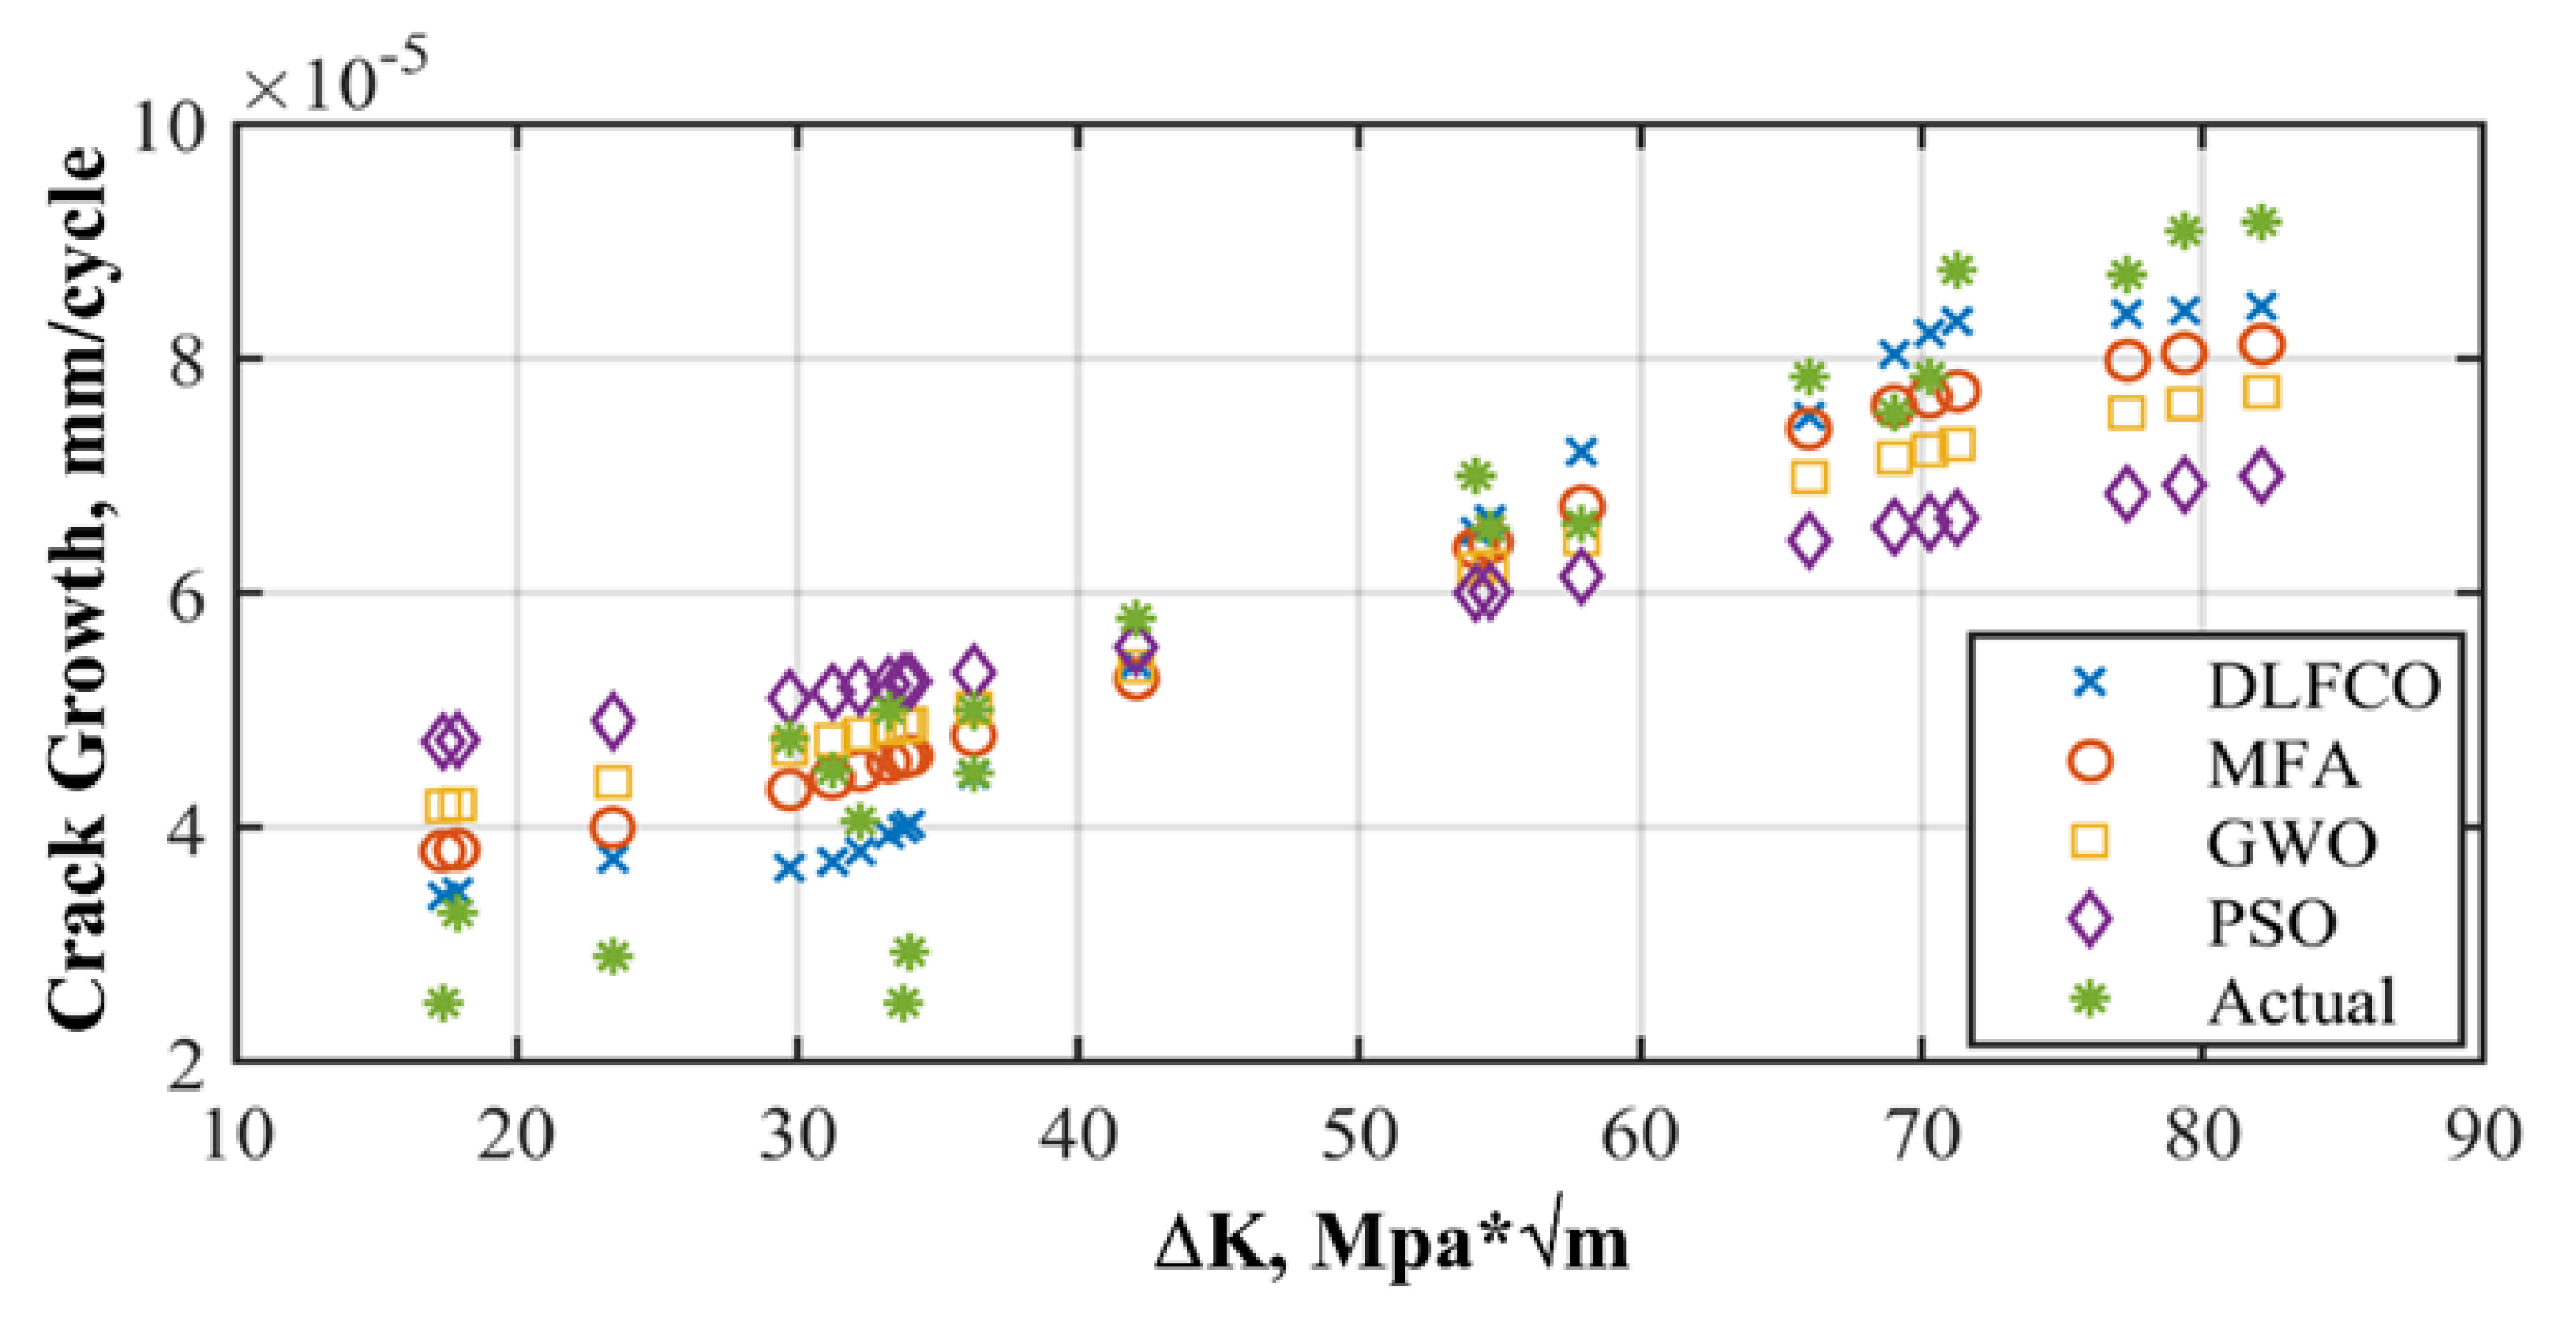
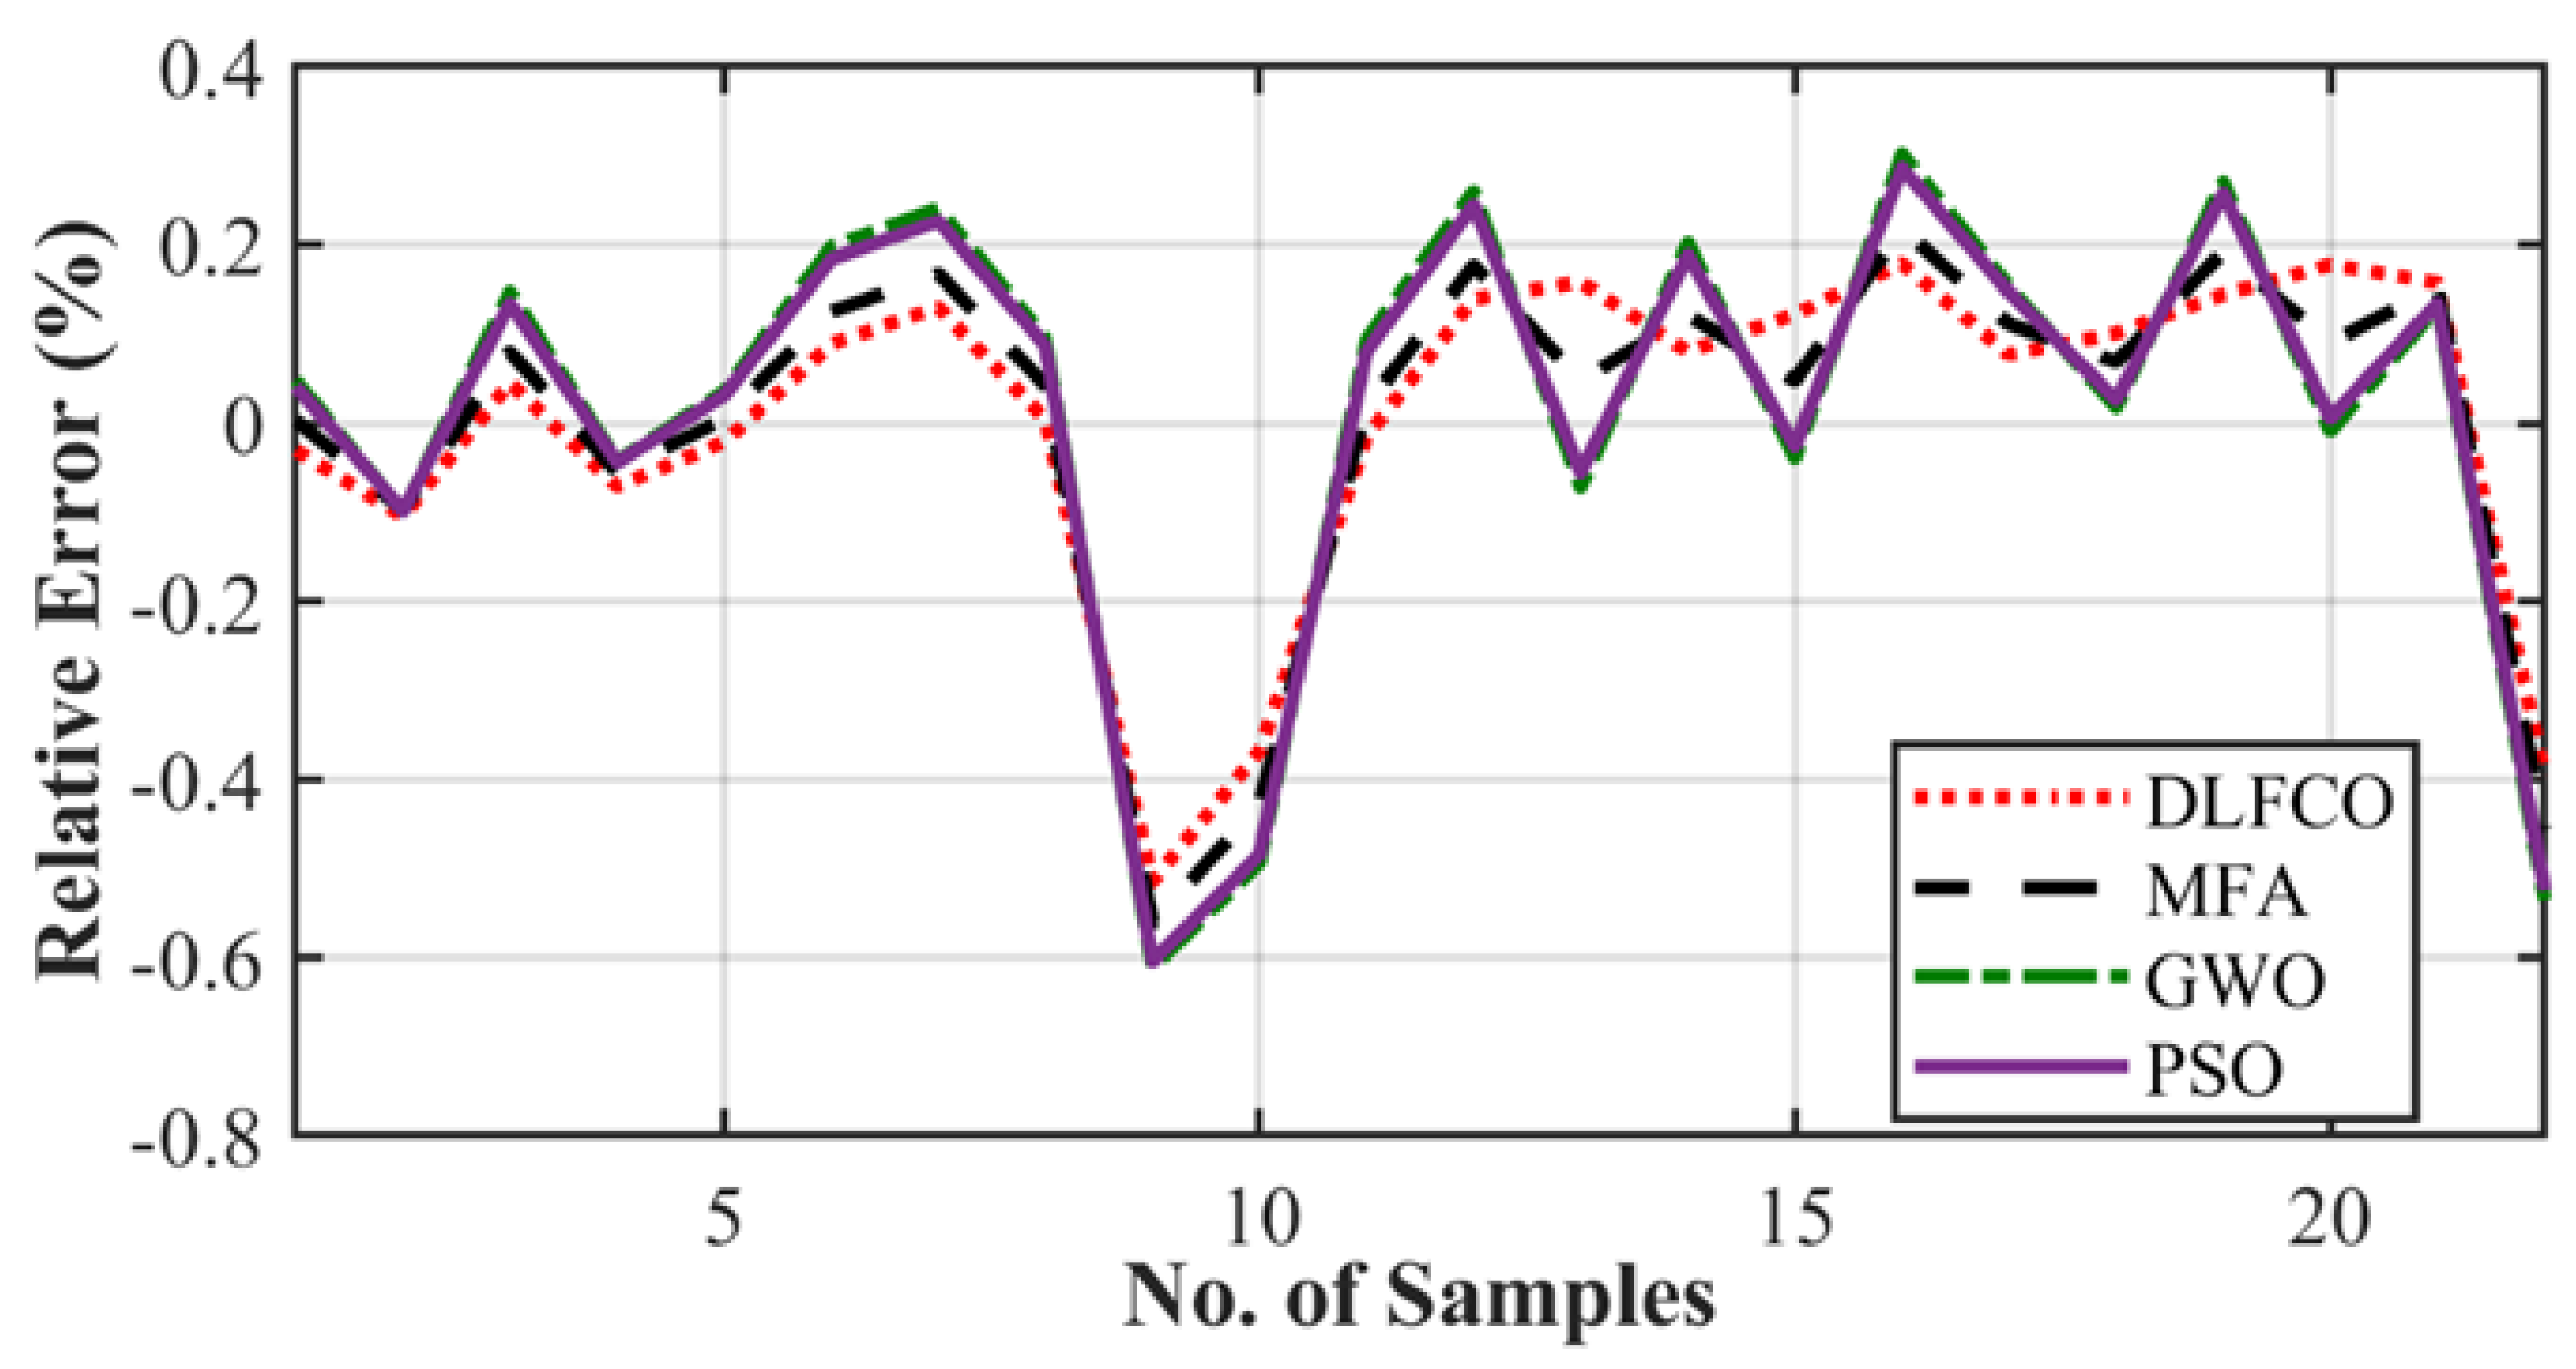
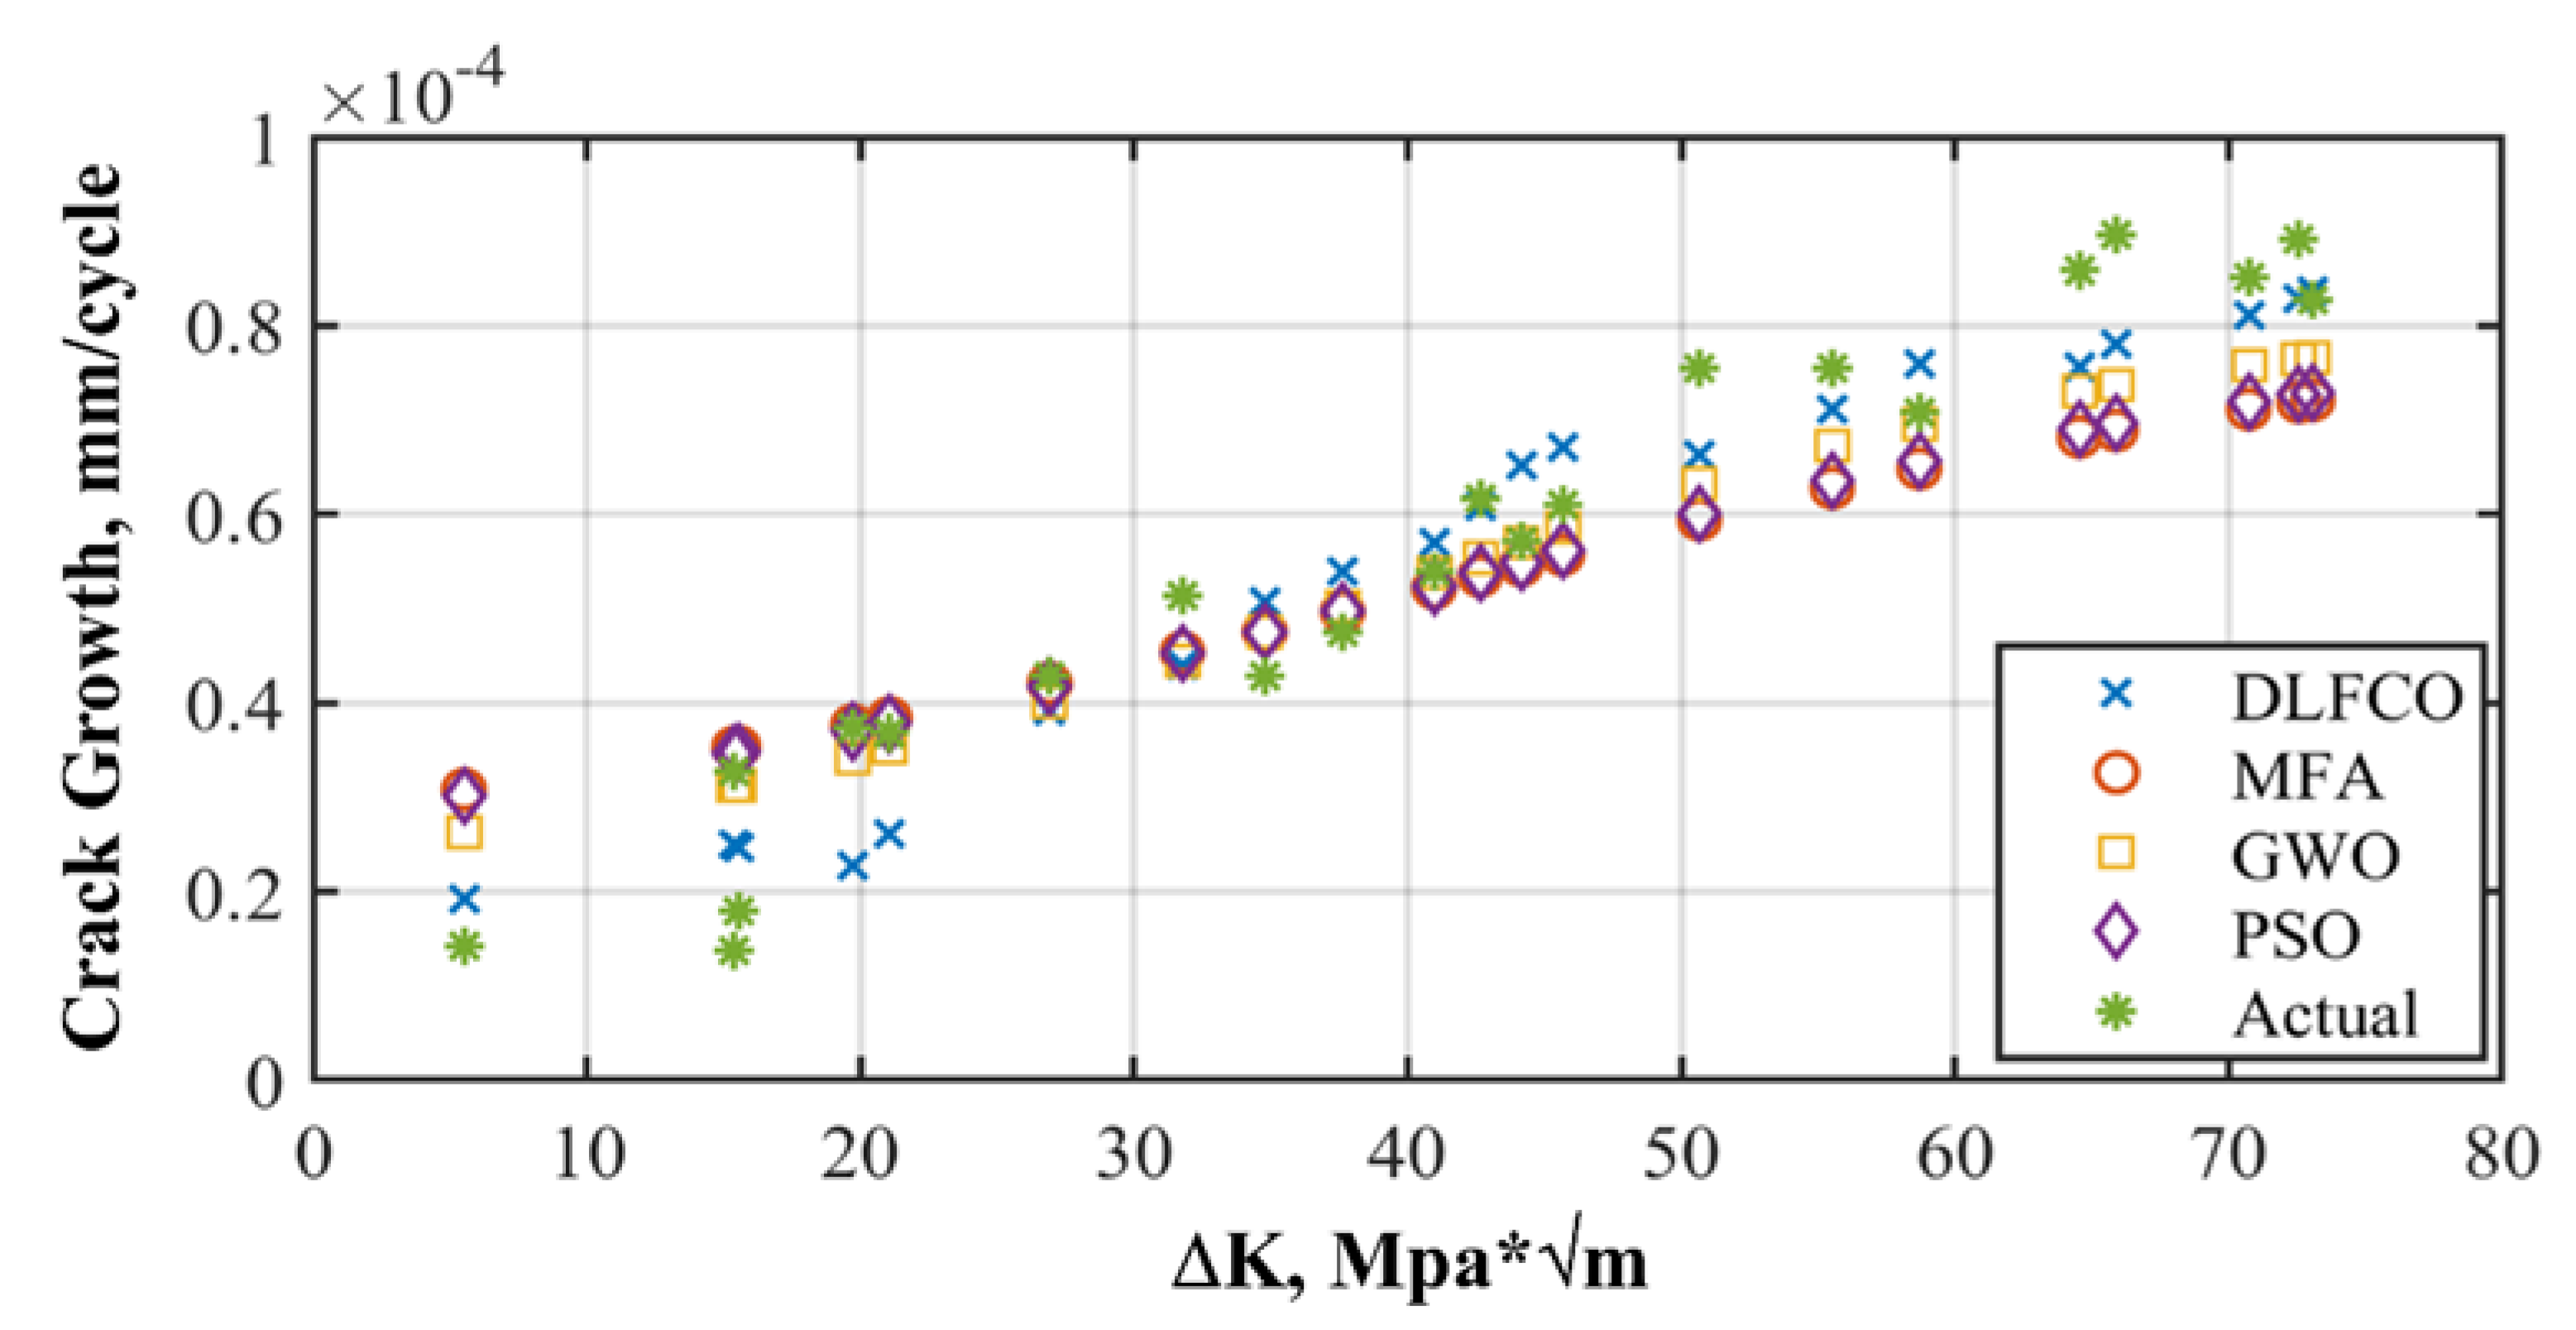
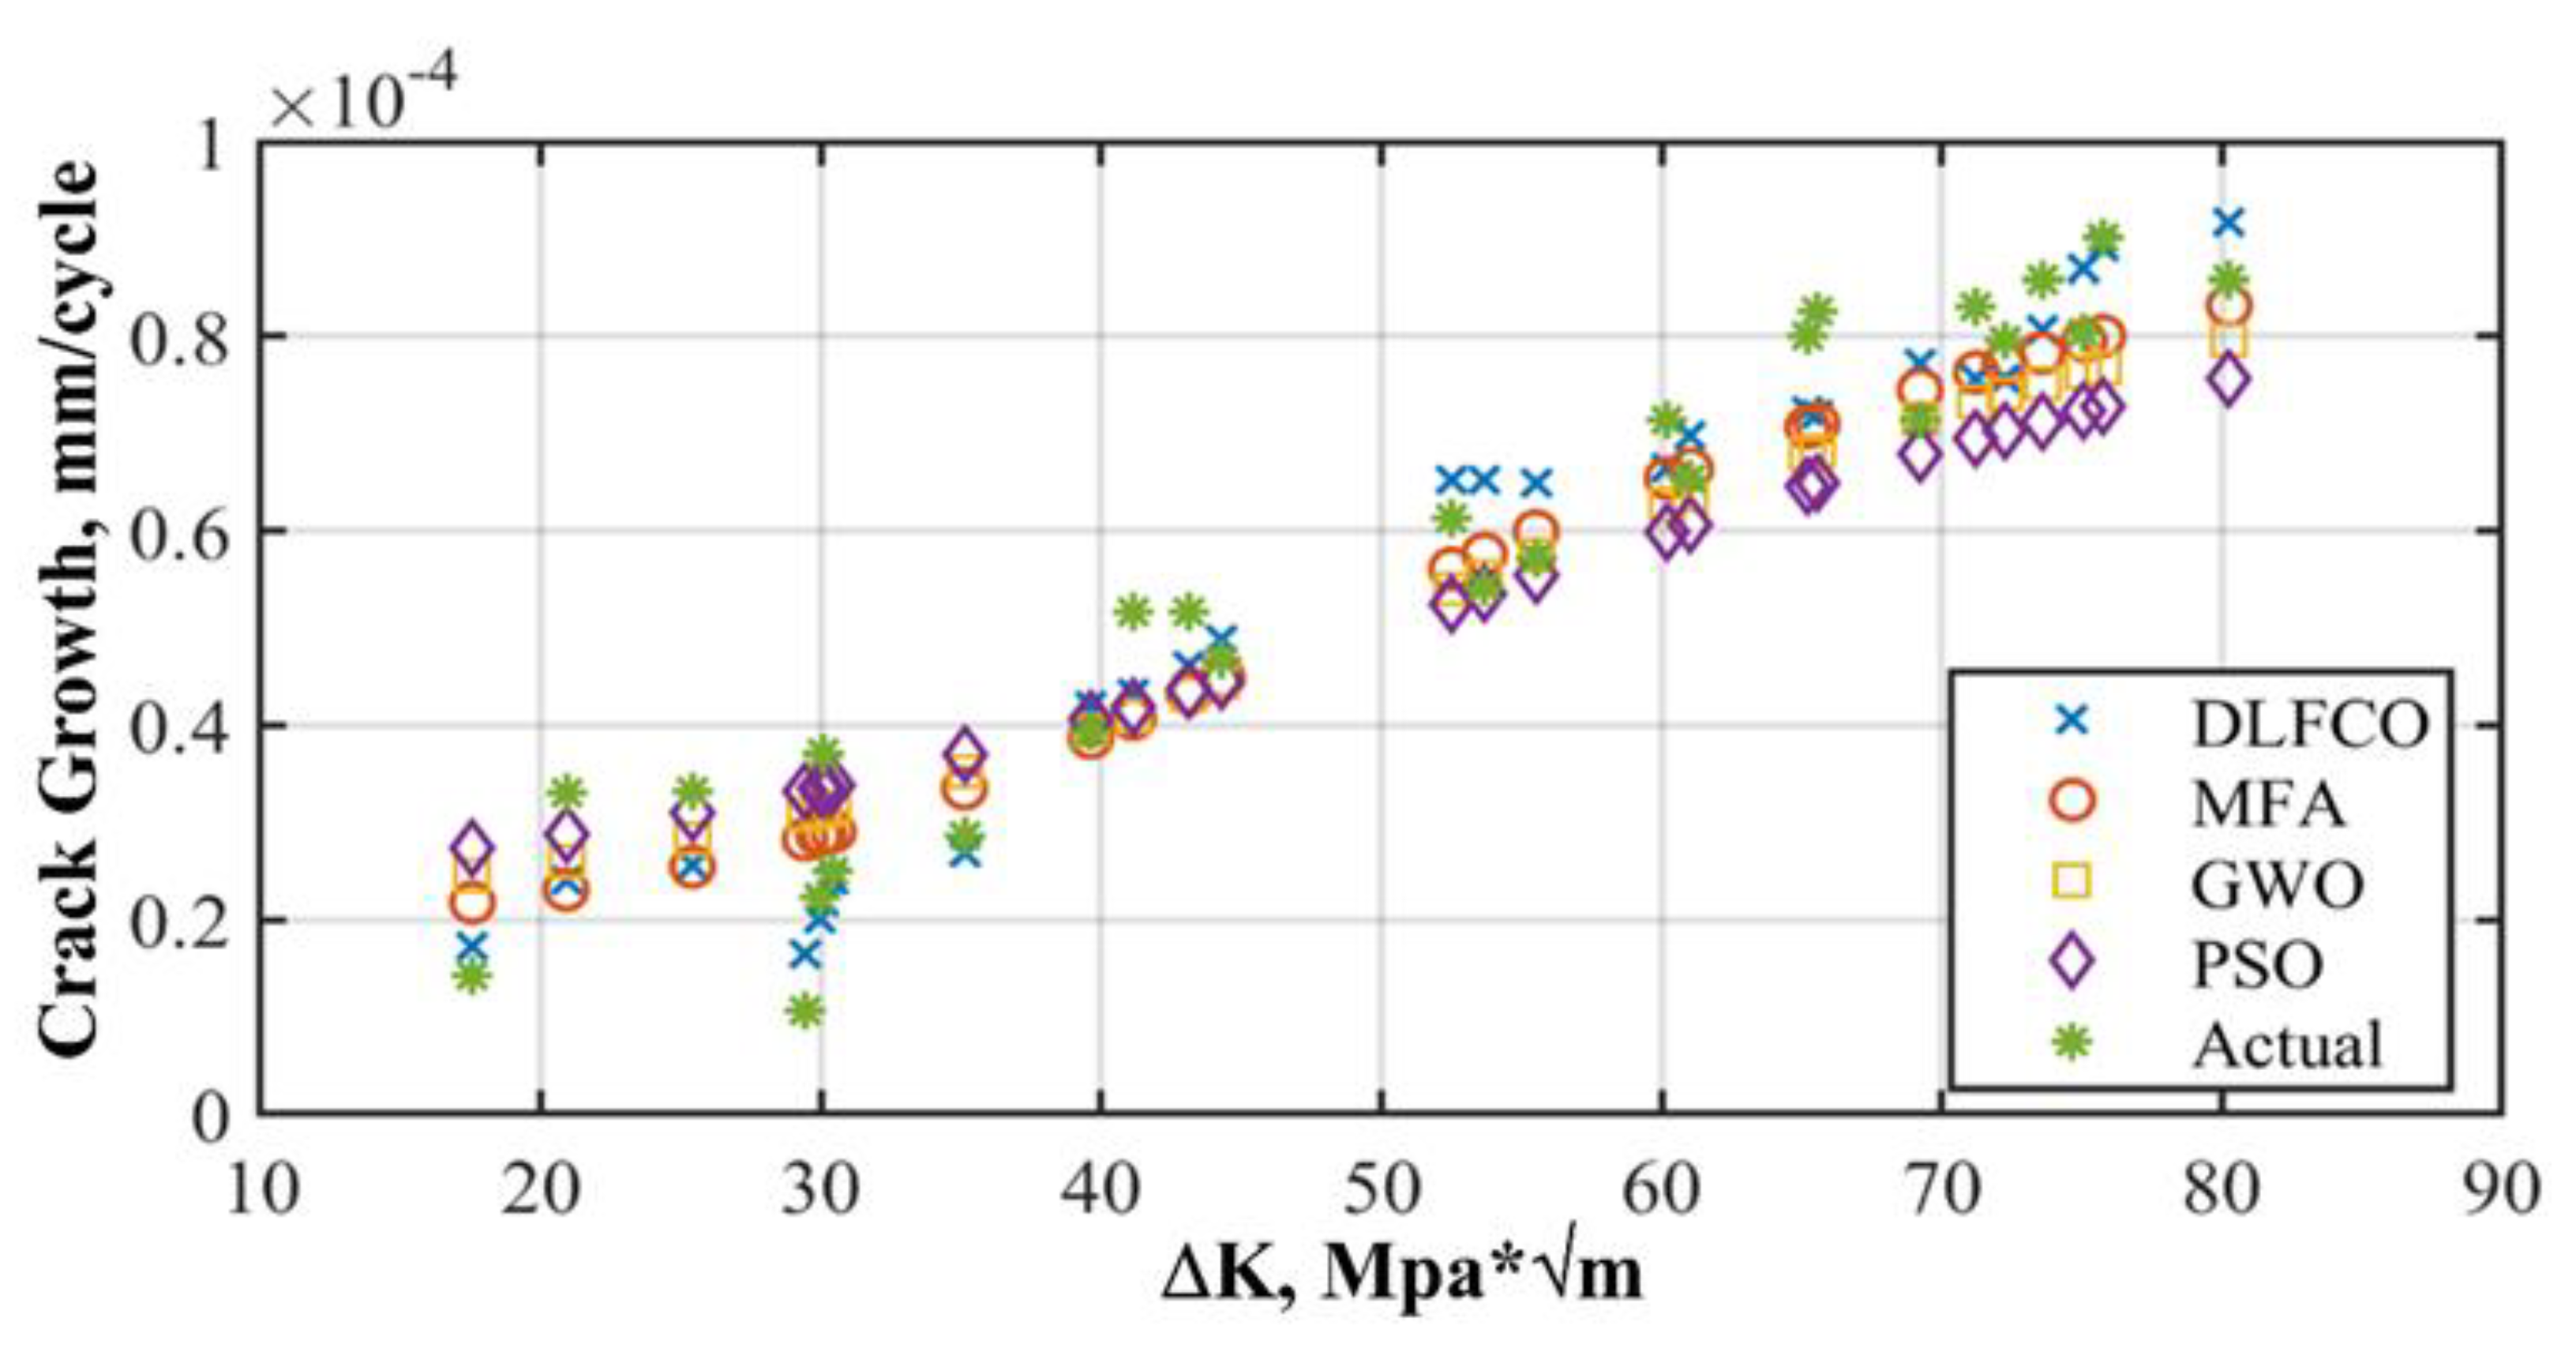
The performance of the proposed framework has been compared with three highly effective and recently studied optimization algorithms. It includes particle swarm optimization algorithms that provide standard behavior of metaheuristic optimization algorithms, which have the capability to distinguish among sub-optimum solutions. The second algorithm is the grey wolf optimization algorithm (GWO). The improved information sharing mechanism among GWO solutions enhances the accuracy towards optimum solutions. The comparison is made in terms of testing error, training errors, and algorithm run time. A more comprehensive statistical analysis is made for MFA-DNN, GWO-DNN, PSO-DNN, and DLFCO-DNN in
Table 8 for statistical indices such as MAE, RMSE, correlation (
), and mean RE [
31].
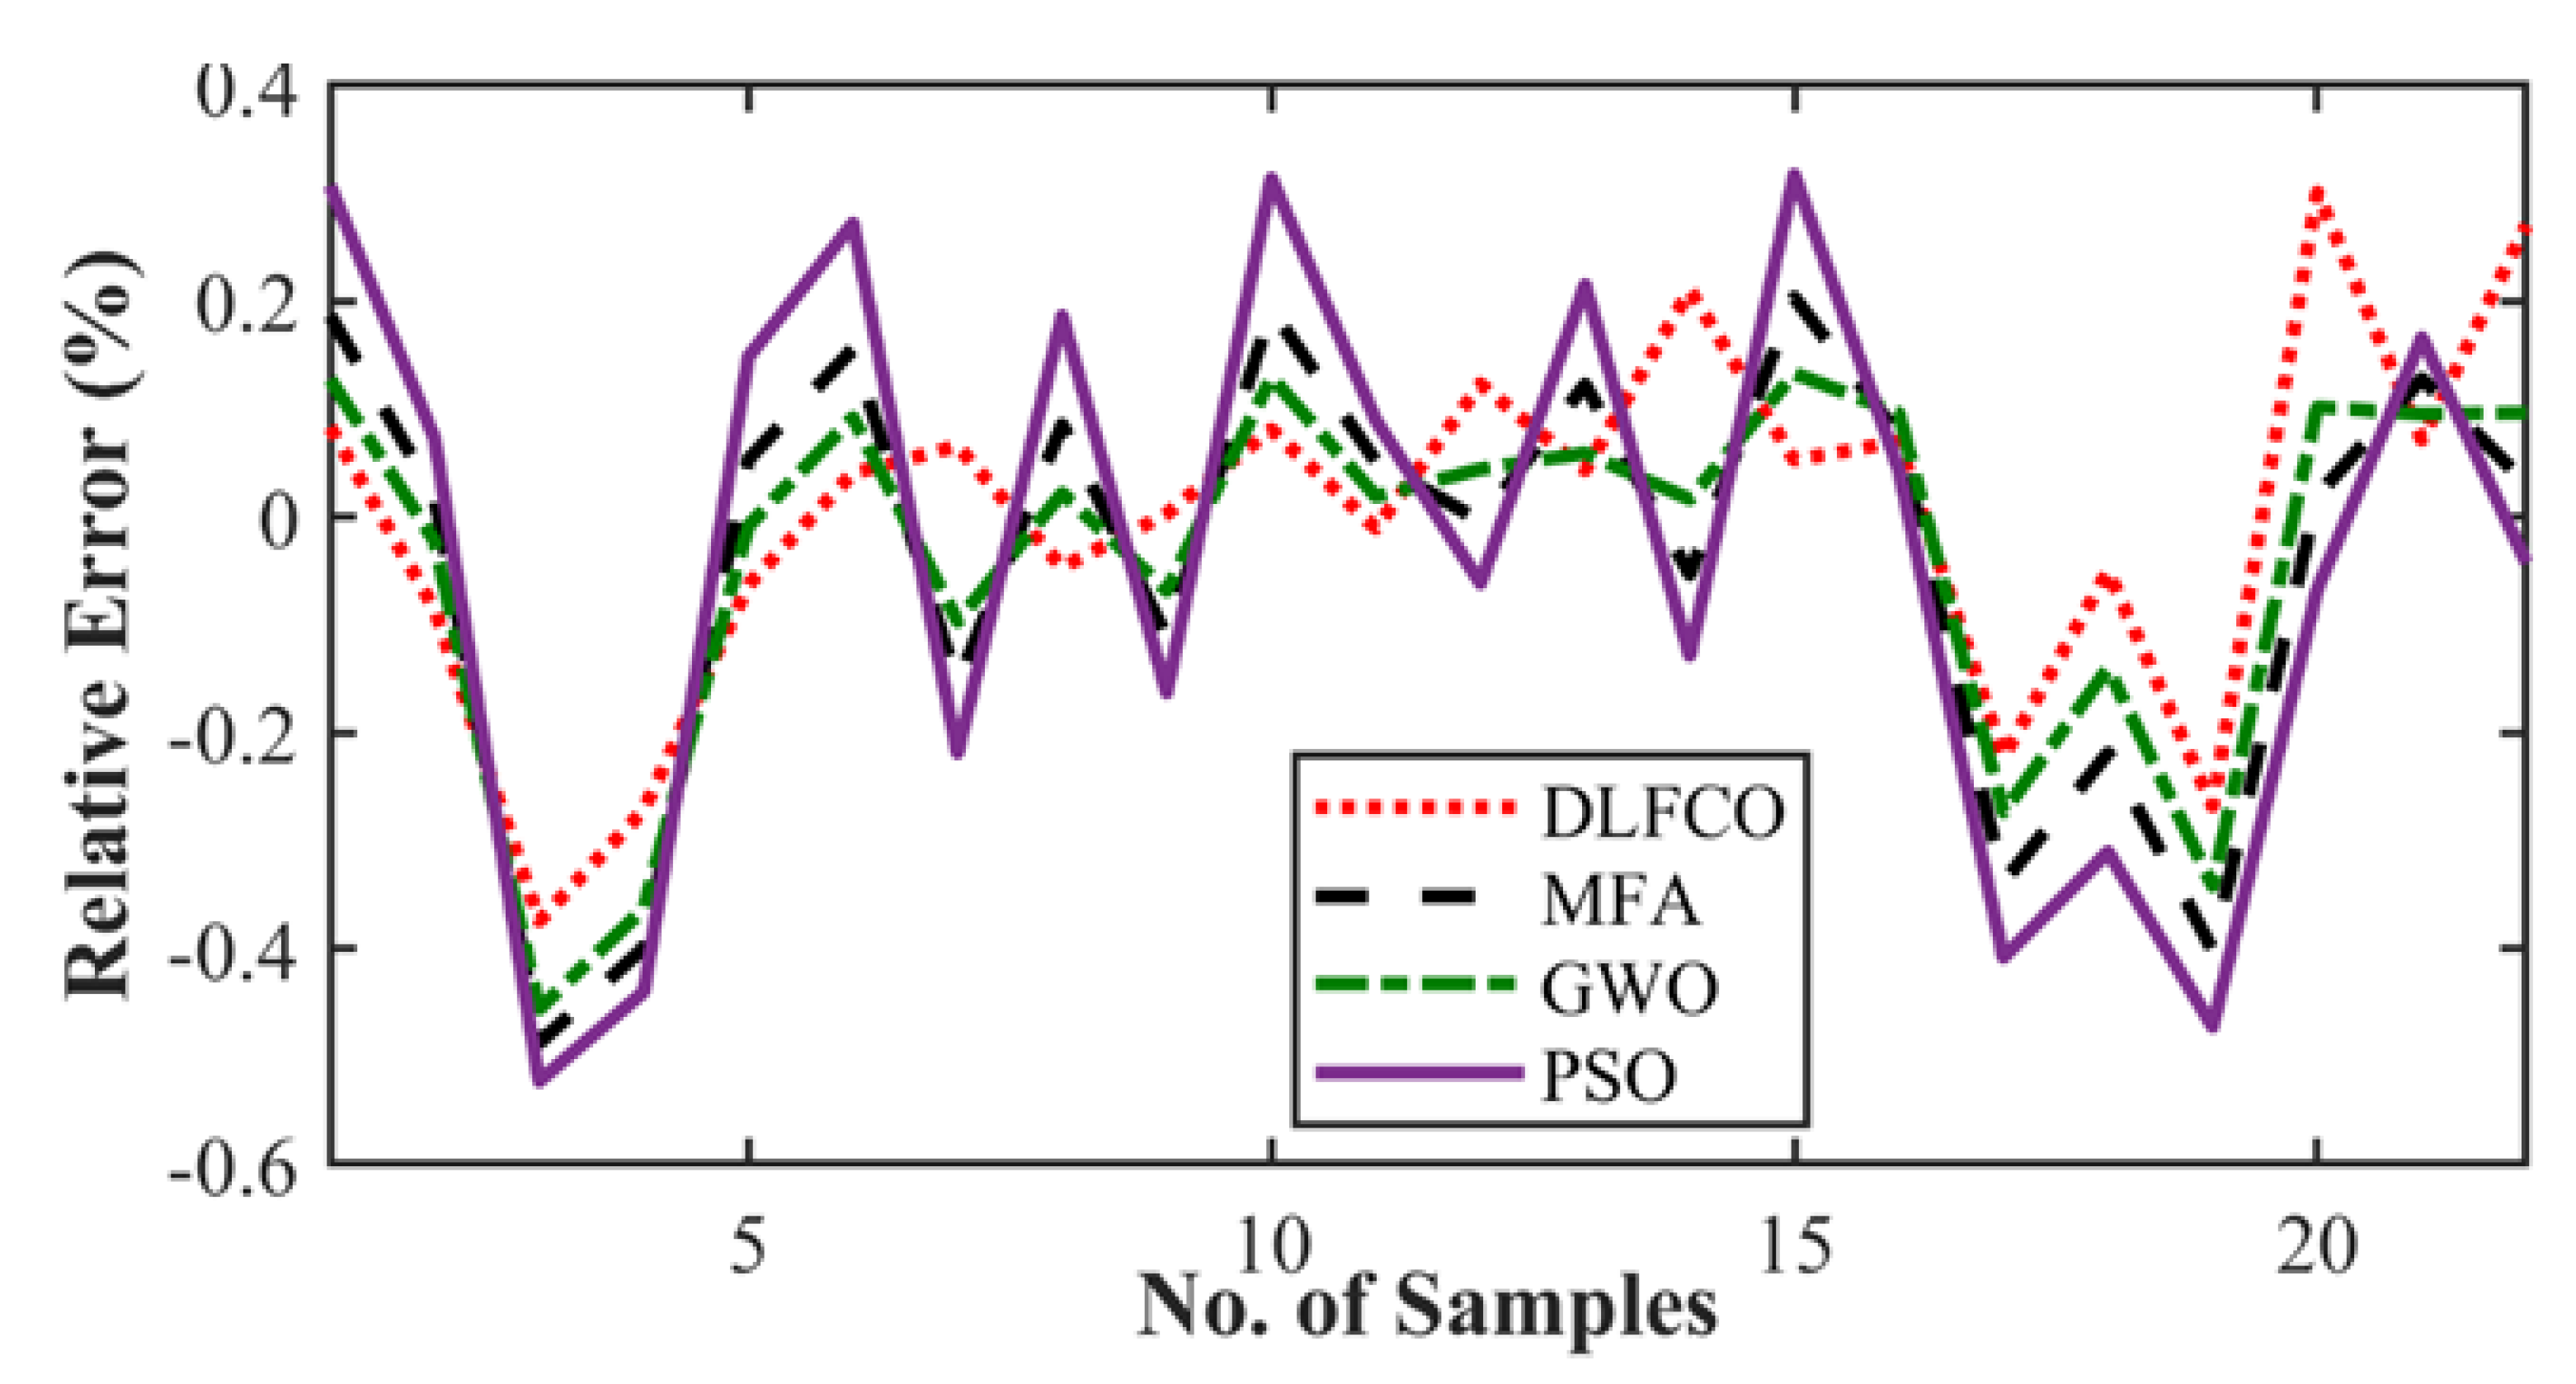
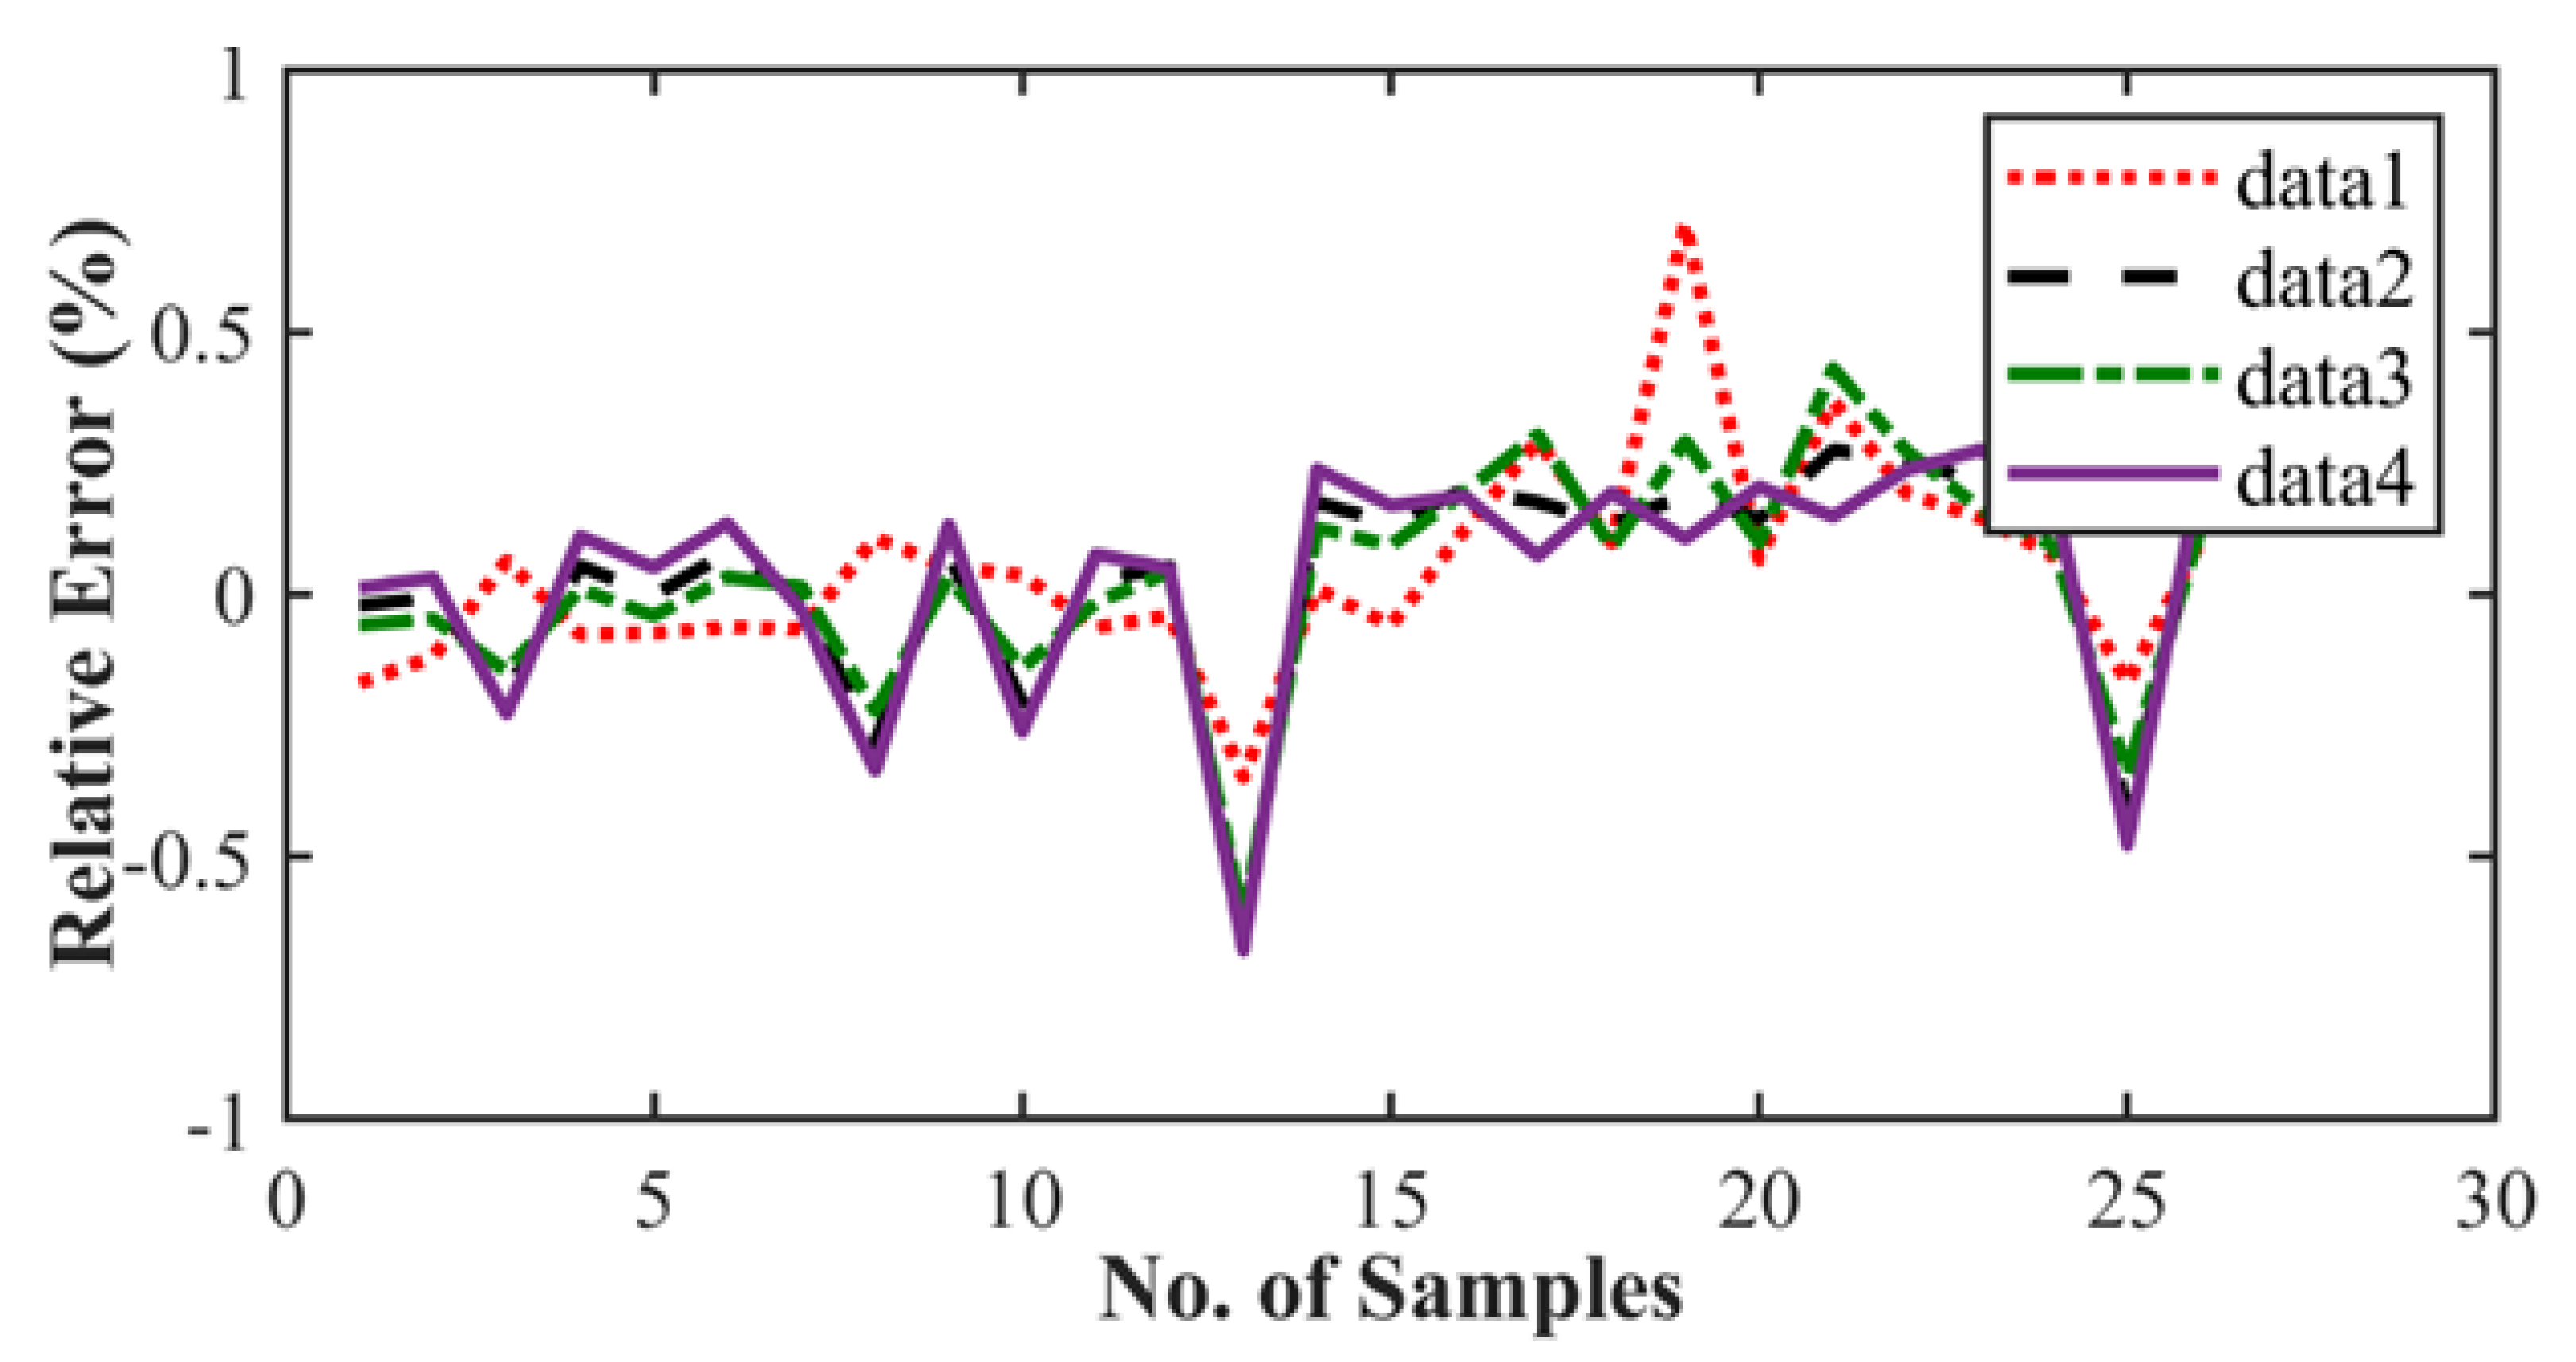
Figure 9,
Figure 11 and
Figure 13 exhibit the trained DLFCO-DNN estimate RE of predicted values at various samples with high redundancy. The lack of accuracy in competing techniques is primarily associated with over- and/or under-fitting of machine learning algorithms. The stagnation and model fitting issues arise when the predictive values show high variance and low bias due to the noise present in the data. It is avoidable through accurate selection of parameters and preprocessing of data outliers and feature mapping during the pre-processing of the data.
Table 4,
Table 5,
Table 6,
Table 7,
Table 8 and
Table 9 show a summary of the results for
rate prediction using DLFCO-DNN on three aluminum alloys. The testing and training values are compared alongside run time. The best run time has been achieved by a simple criterion that defines the boundary of the small-scale yielding regime, to avoid invalid use of the LEFM parameter, Δ
K, as the characterizing parameter for the fatigue crack growth rate [
32].
While in uniform amplitude loading, the FCG graph—crack growth rate
against SIF (Δ
K) in log–log measure—normally comprises three portions. Region I denotes the earlier crack propagation. In this region, the crack normally grows in the order of
span. This section of the curve is subjective to the micro-structural appearances, the
R-ratio (lowest useful stress divided by maximum useful stress), plus the ecological circumstances. In general, it is believed that there subsists a SIF at threshold
. Under this point, fatigue crack propagation does not take place [
33]. Speedy and unsteady fatigue crack growth takes place in Region III of the curve before fracture. A crack progression rate of the order of
is ordinary in the case of metals and is asymptotic when crack growth reaches the threshold of fracture toughness
of the material [
34]. This is even though it is mostly dominated by the stress ratio effect, substance micro-cracks, and the specimen width. Moreover, crack growth in the third region of the curve is usually overlooked as a result of trivial leftover fatigue life while arriving in the region. Stable crack growth is observed in Region II of the FCG curve, typically in the range of
in the case of metals [
35].
It is pertinent to mention that in the case of a hole in the crack route, the crack growth rate in Region I reduces considerably, while in Region II, it elevates [
36]. It is noticeable in the trajectory of crack propagation; in a straight line crack progression, KI escalates, but upon the change in direction, KII escalates [
37]. The preceding graphs of SIF reveal that all simulated specimen testing data exhibit almost similar numbers for KI and KII throughout crack progression intervals. These insignificant deviations in the final values are dominated by the quantity of phases employed in every package and the mathematical methodology applied. The quantity of phases applied in ANSYS software for model simulation range between 11 and 20, with the total amount of percentage increase organized with the help of software. In FRANC2D/L, the steps are between 32 and 92 with a 0.1 to 0.13 increment per step.
Figure 8,
Figure 10 and
Figure 12 show comparisons of MFA-DNN, GWO-DNN, PSO-DNN, and DLFCO-DNN fatigue life simulations with experimental outcomes for 6013 T651, 7055 T7511, and 2324 T39. The simulated fatigue crack growth life using the proposed method comes to an impeccable agreement, while the experimental results are provided by Gomes and Miranda [
38]. Moreover, the present study outcomes came out to be much more accurate for prediction of fatigue life as linked to the arithmetical results achieved by means of the software. The outcomes of such a study are carefully compared with Quera2D instead of BemCracker2D. Such results, moreover, establish the impact of the opening location regarding the fatigue life of the samples in various areas of impact with
stress intensity range on a log scale [
39]. Care must be taken while taking into account the use of
, which is usable for high strength alloys as well [
32]. The deterioration caused by the operational, environmental, and climate conditions quantitation should be improvised [
40].

 ,
, 


