
Incorporation of Mixing Microbial Induced Calcite Precipitation (MICP) with Pretreatment Procedure for Road Soil Subgrade Stabilization


Abstract
:1. Introduction
2. Materials and Methods
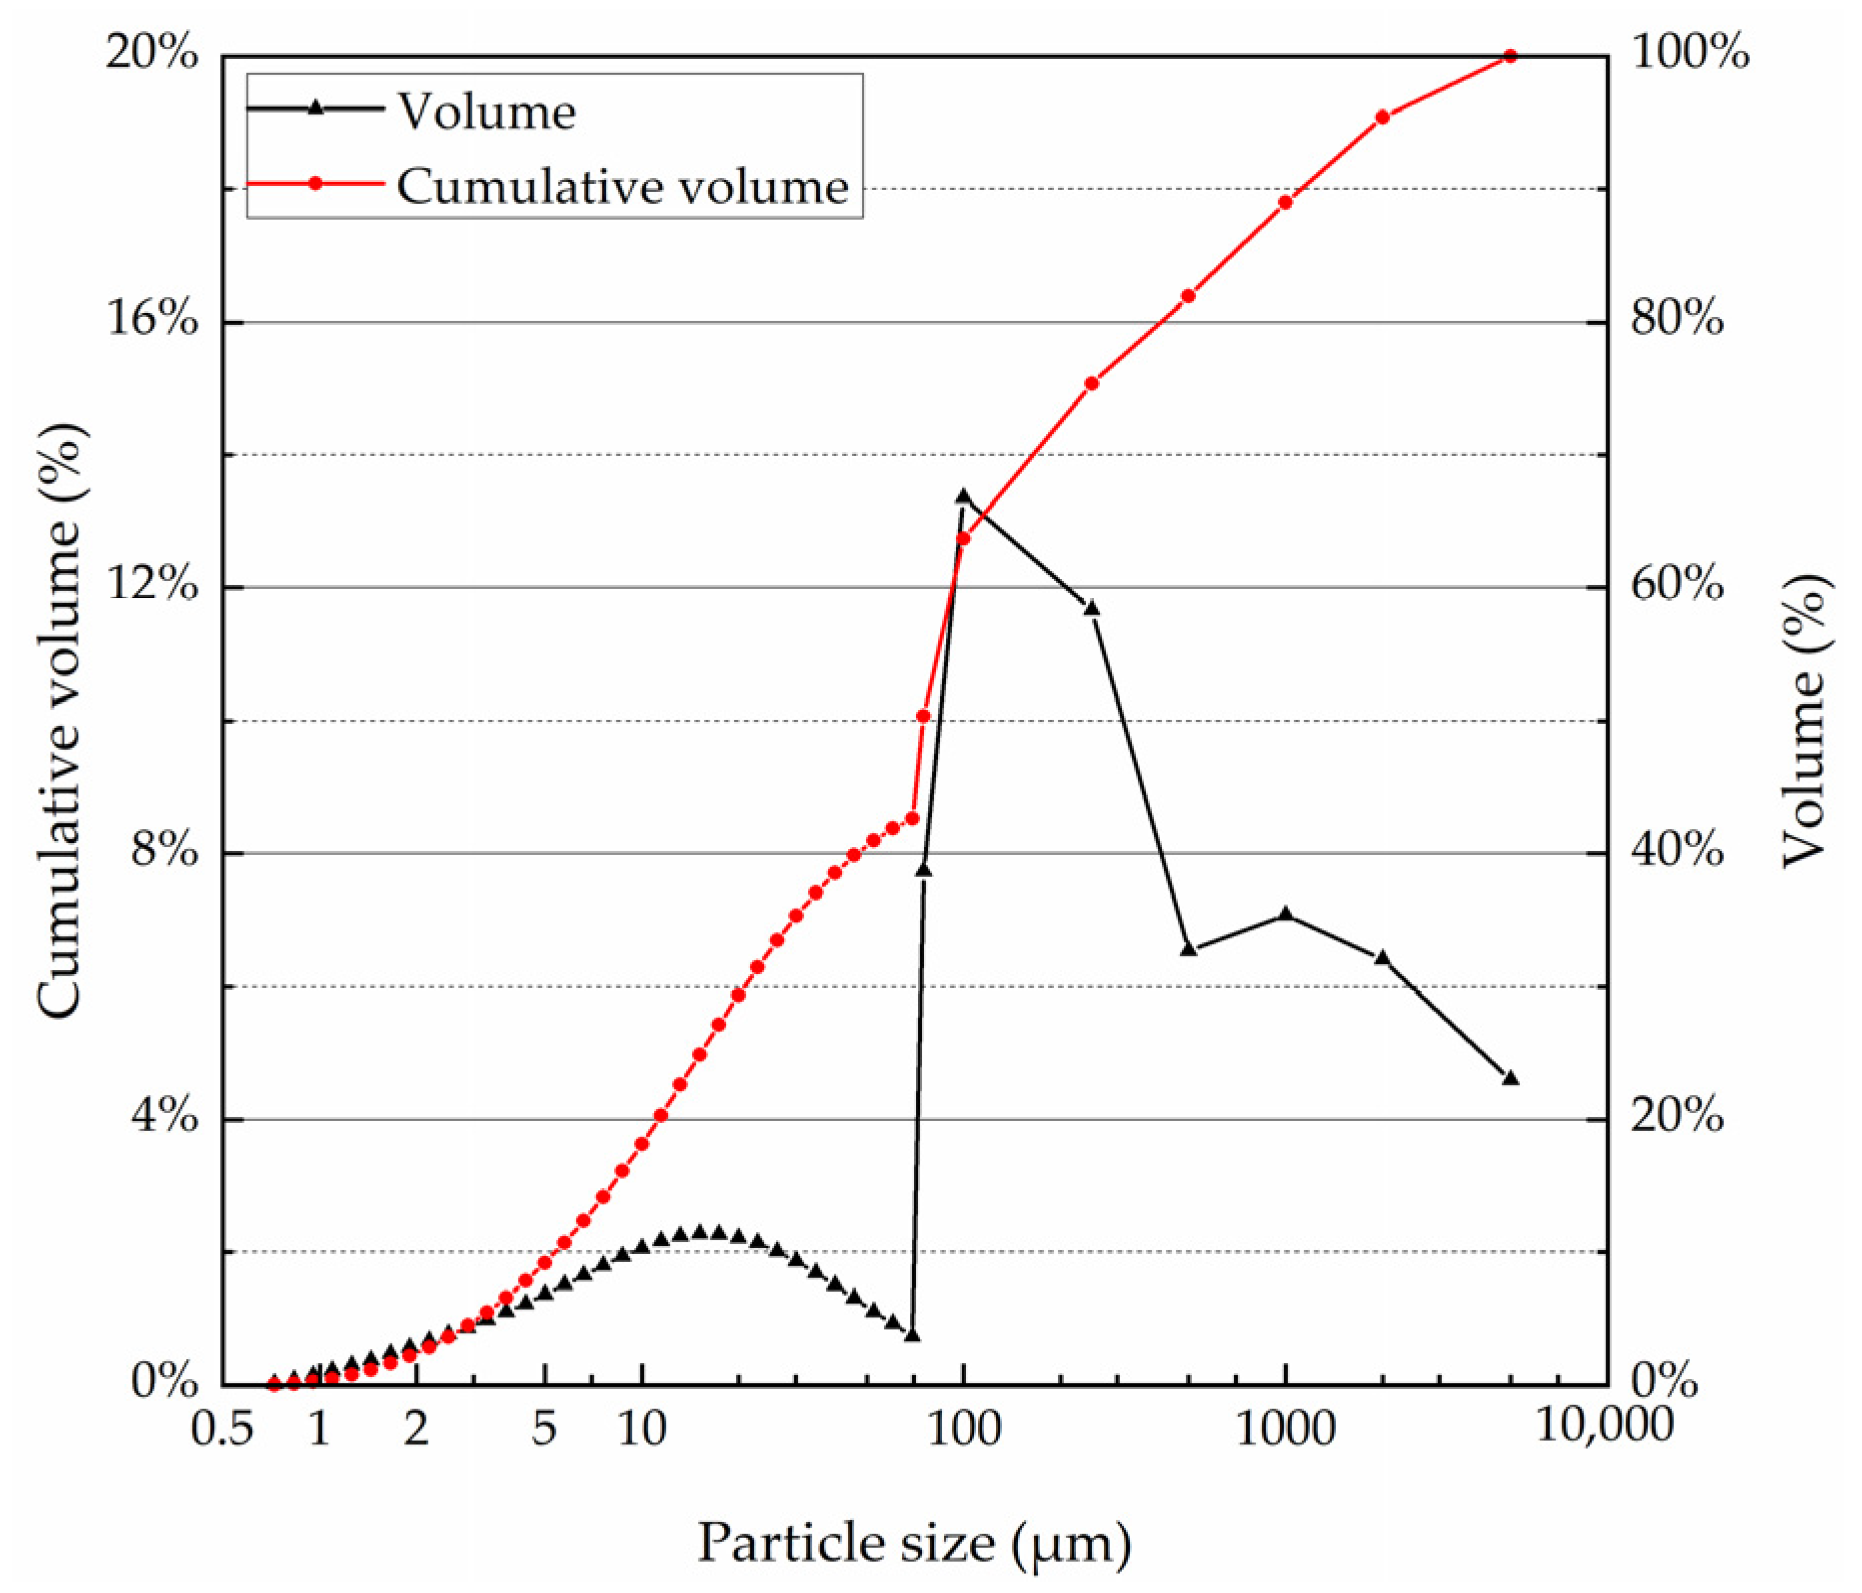
2.1. Soil
2.2. Bacteria Culture for MICP
2.3. Cementation Solution and Water
2.4. Sample Preparation
2.4.1. Soil Pretreatment
2.4.2. Specimen Preparation and Curing
2.5. Test Method
2.5.1. Unconfined Compressive Strength (UCS)
2.5.2. Undrained–Unconsolidated (UU) Triaxial Test
2.5.3. Content and Distribution of CaCO3
2.5.4. X-ray Diffraction (XRD)
2.5.5. Field Emission Scanning Electron Microscope (FESEM)
2.5.6. Mercury Injection Apparatus (MIA)
2.6. Orthogonal Experiment Design
3. Results and Discussion
3.1. Orthogonal Experiment Results
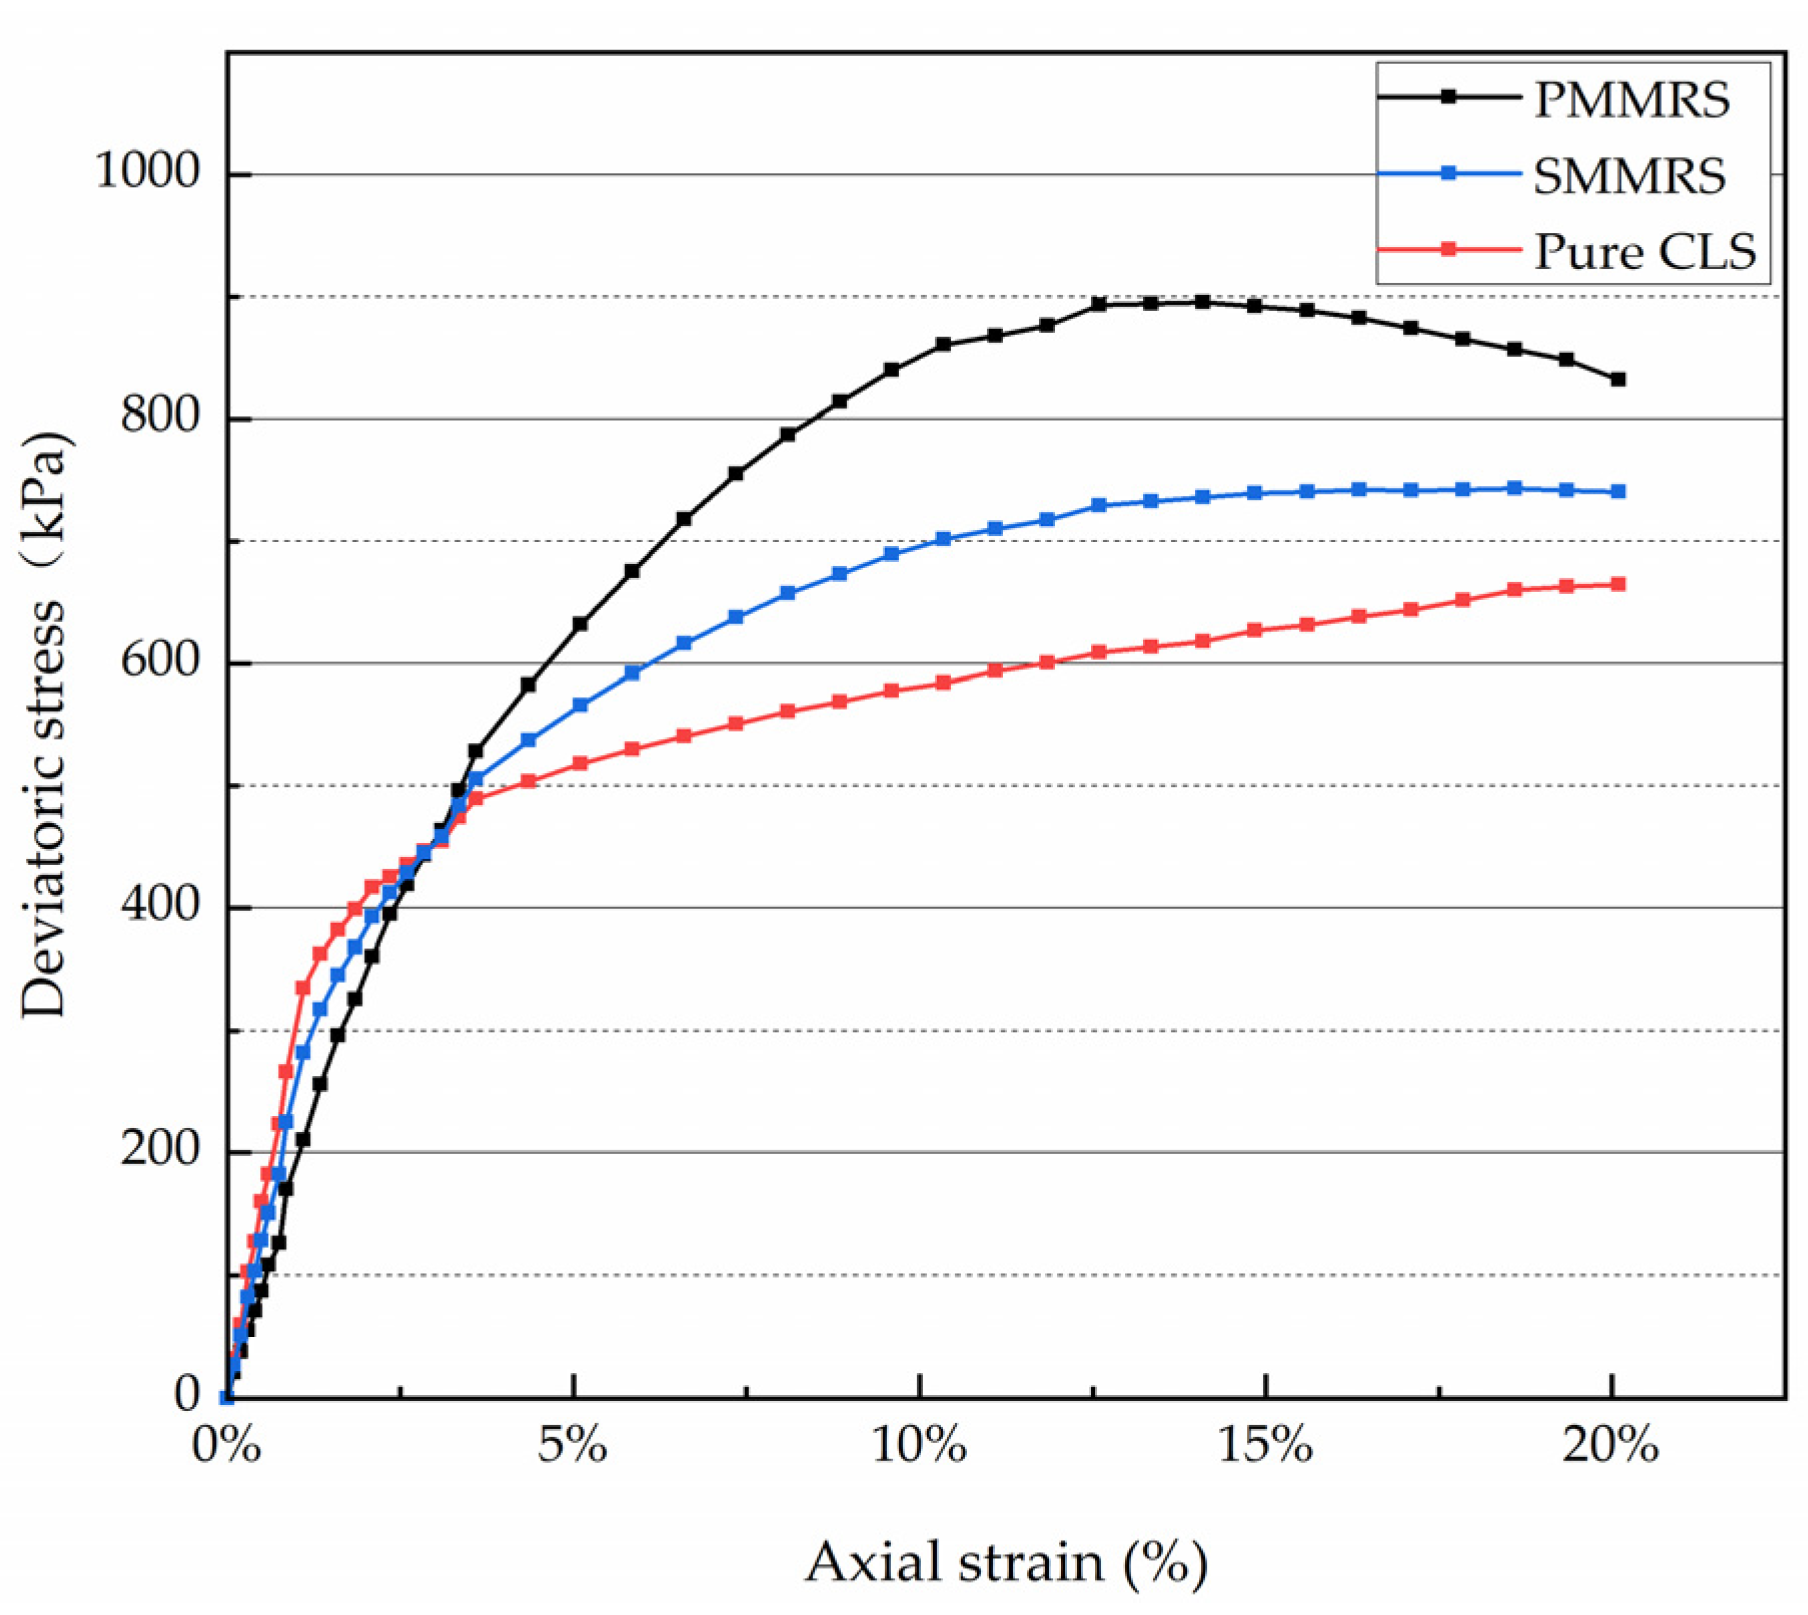
3.2. Stress-Strain Characteristics of PMMRS in UCS Test
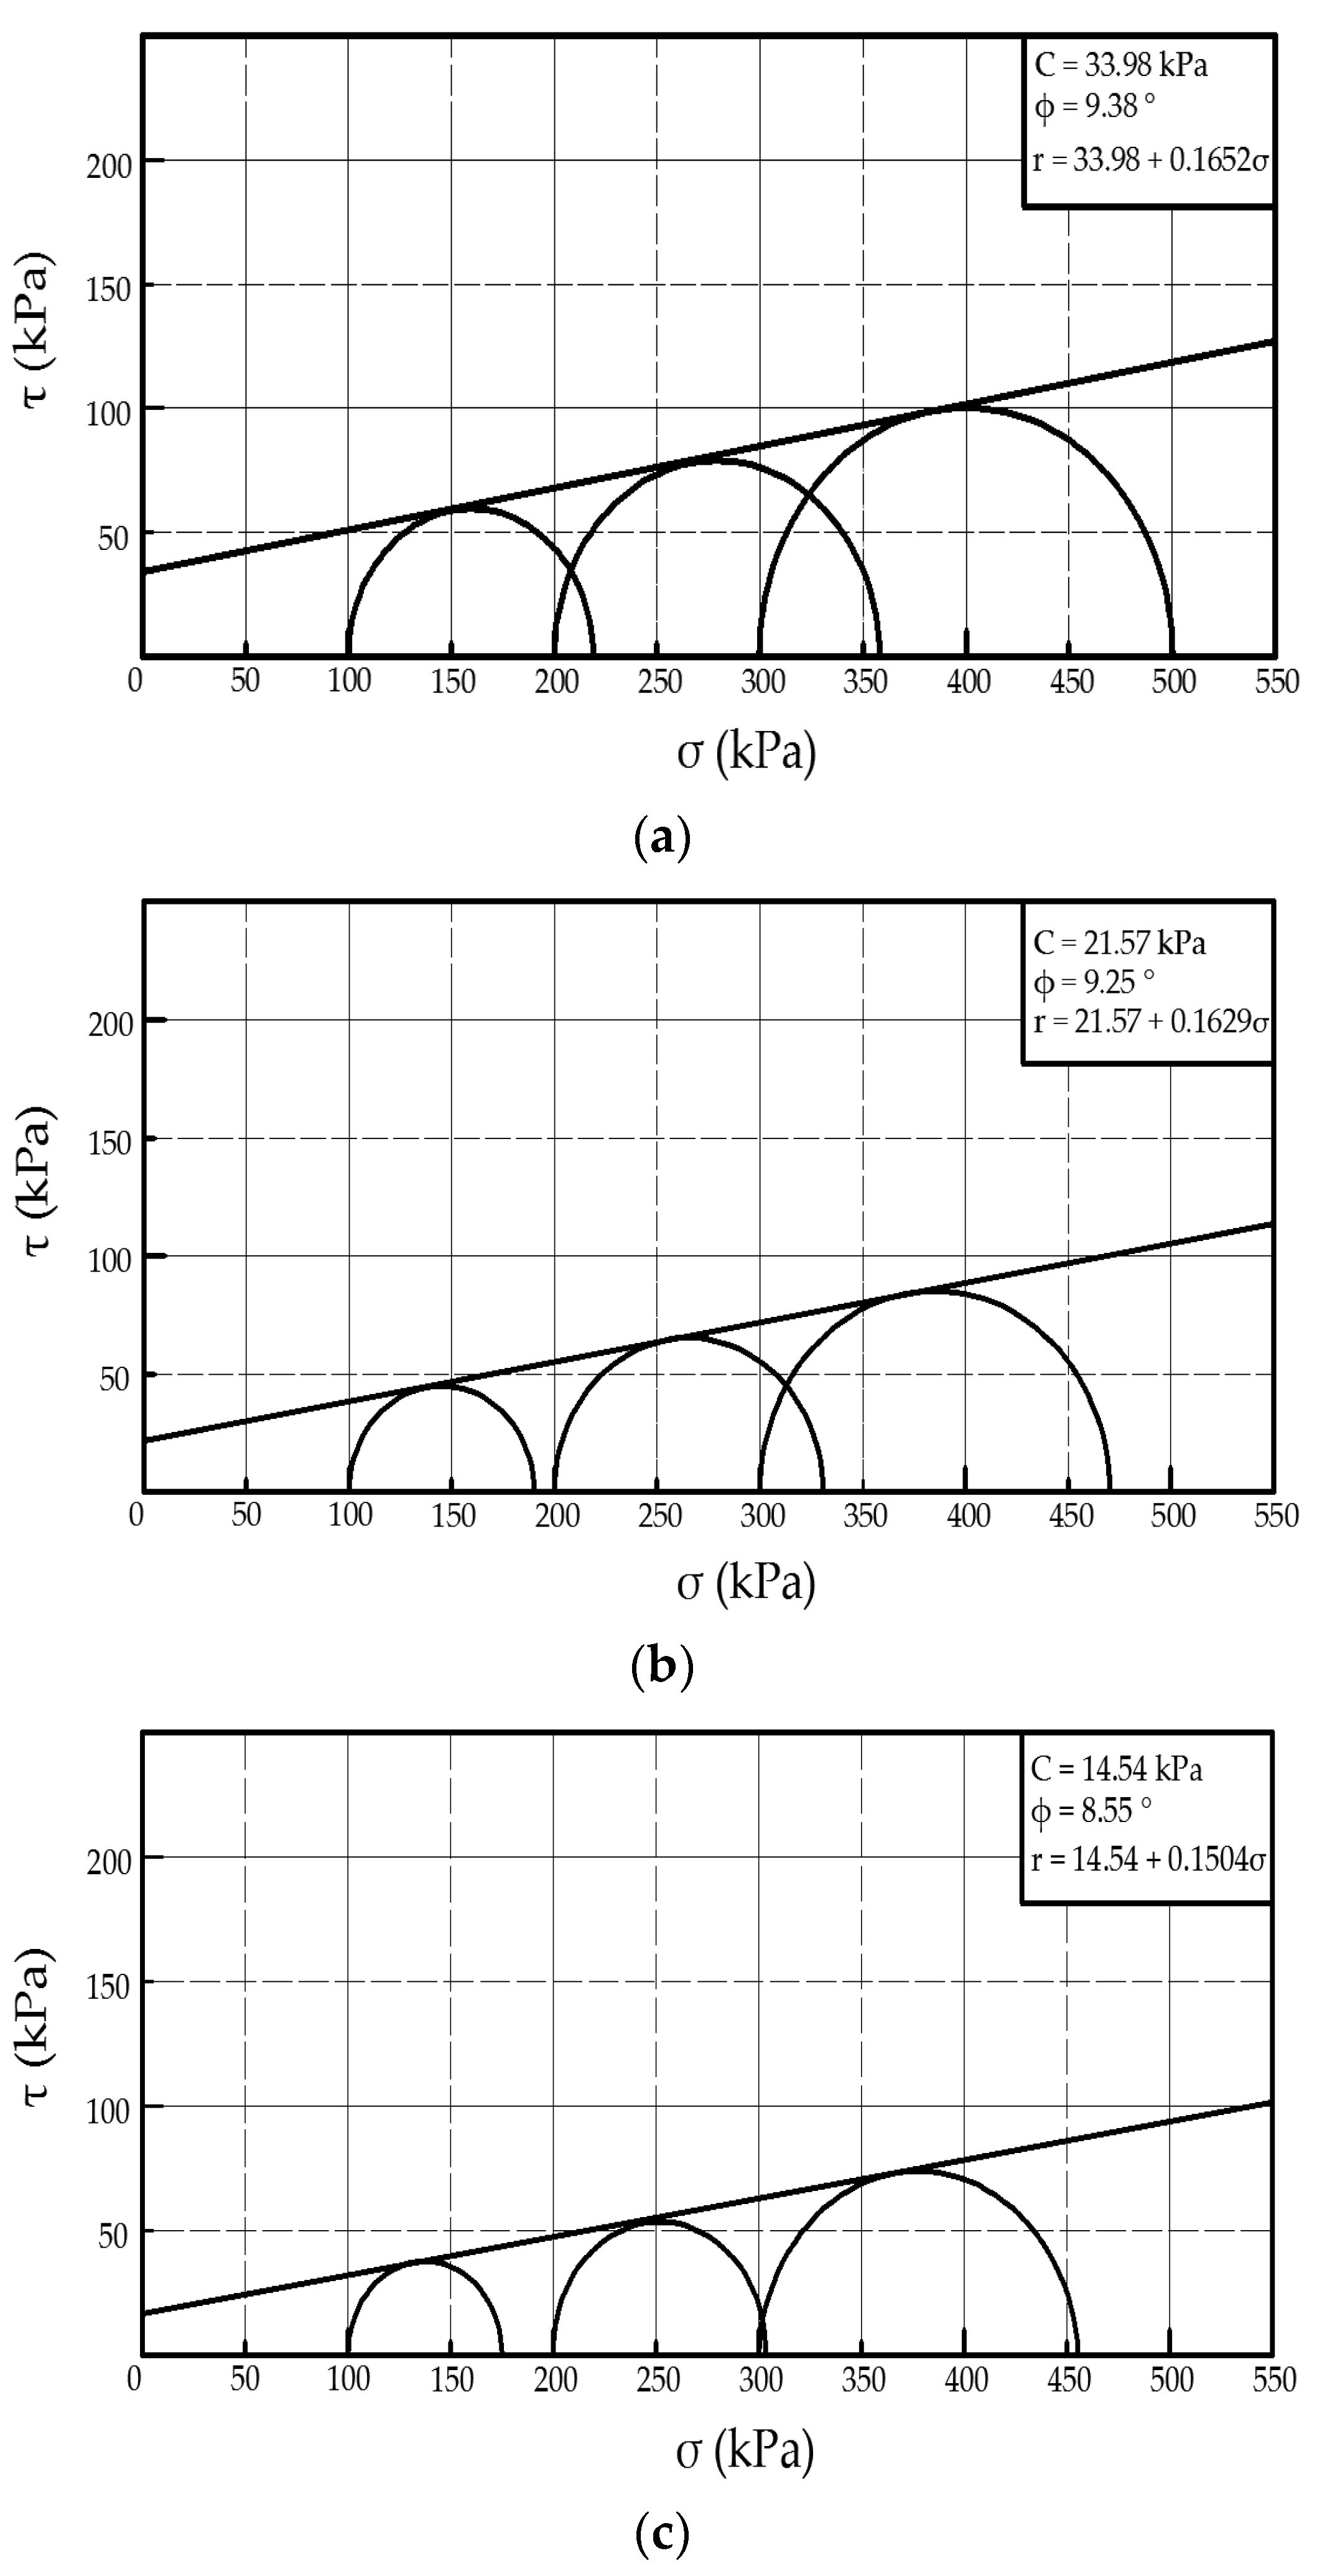
3.3. UU Test
3.4. CaCO3 Distribution Characteristics
3.5. Curing Time
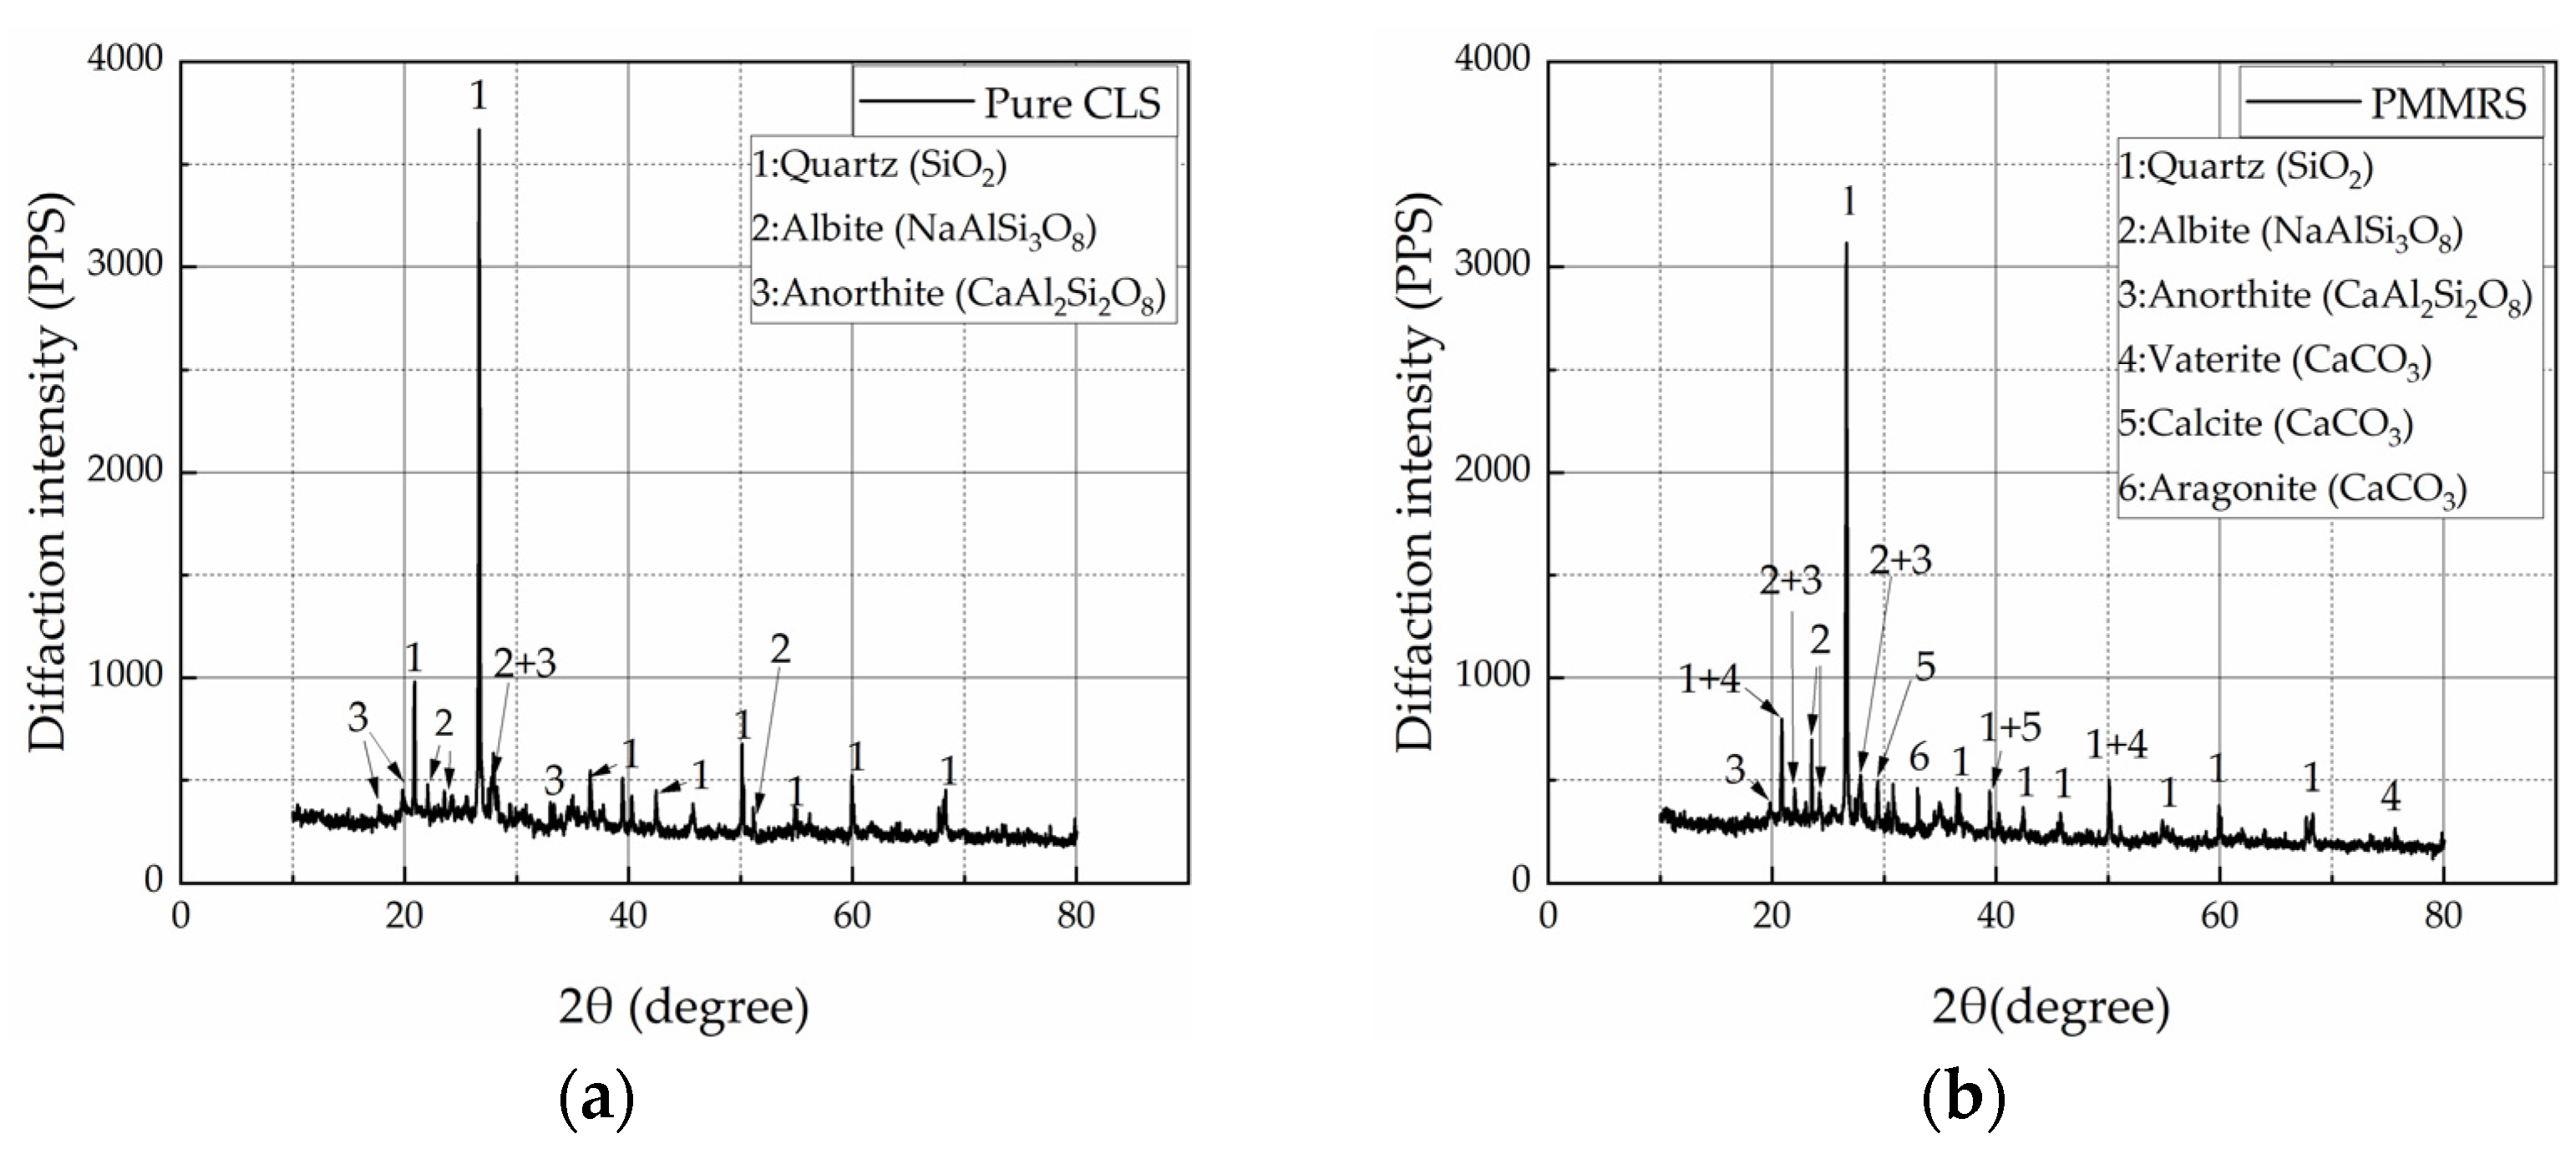
3.6. XRD Test
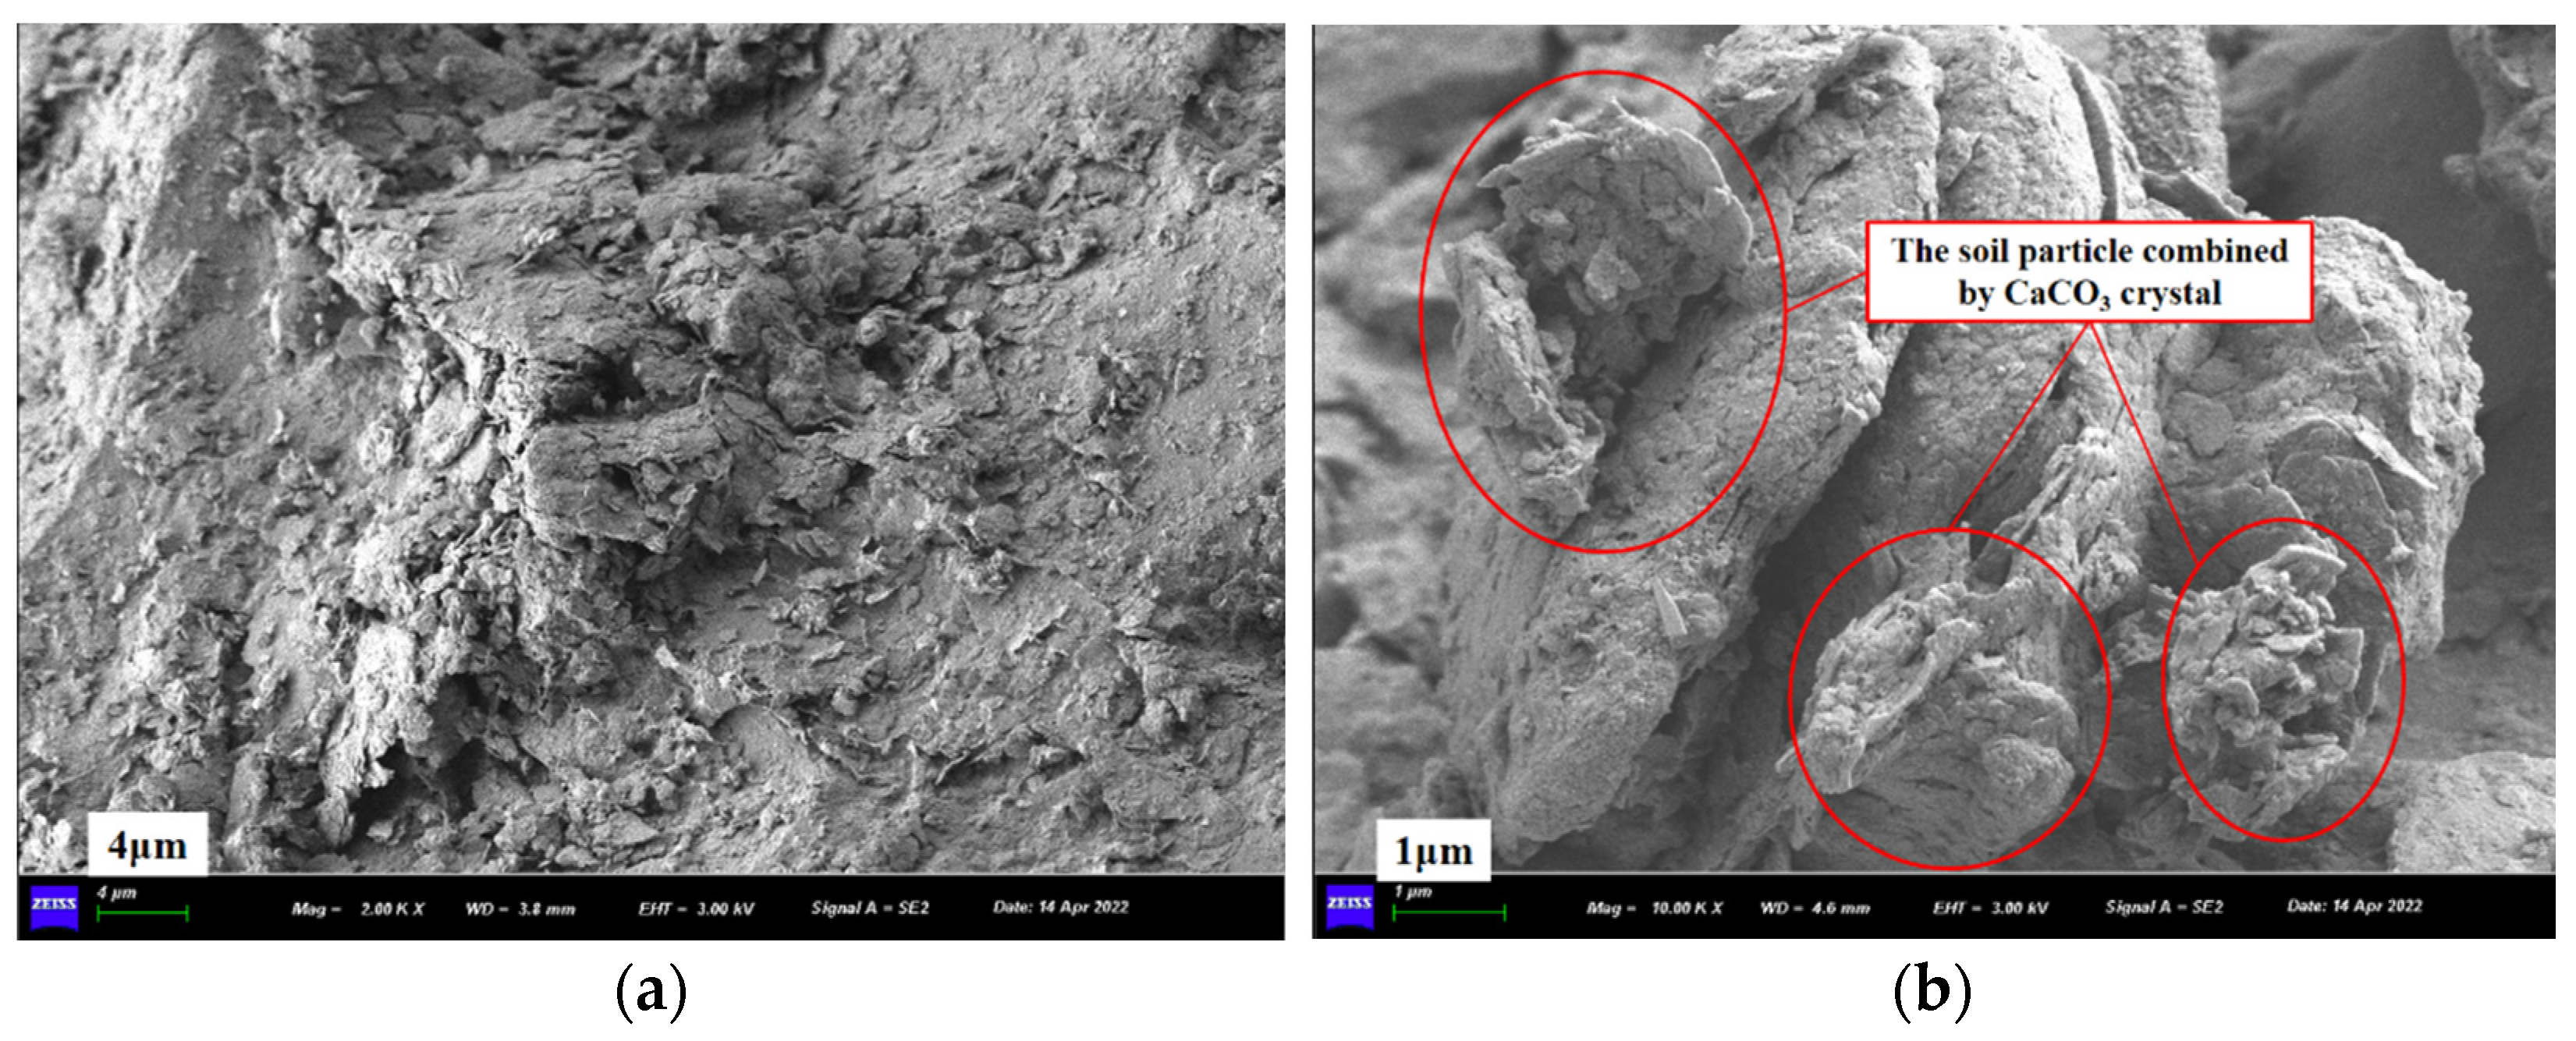
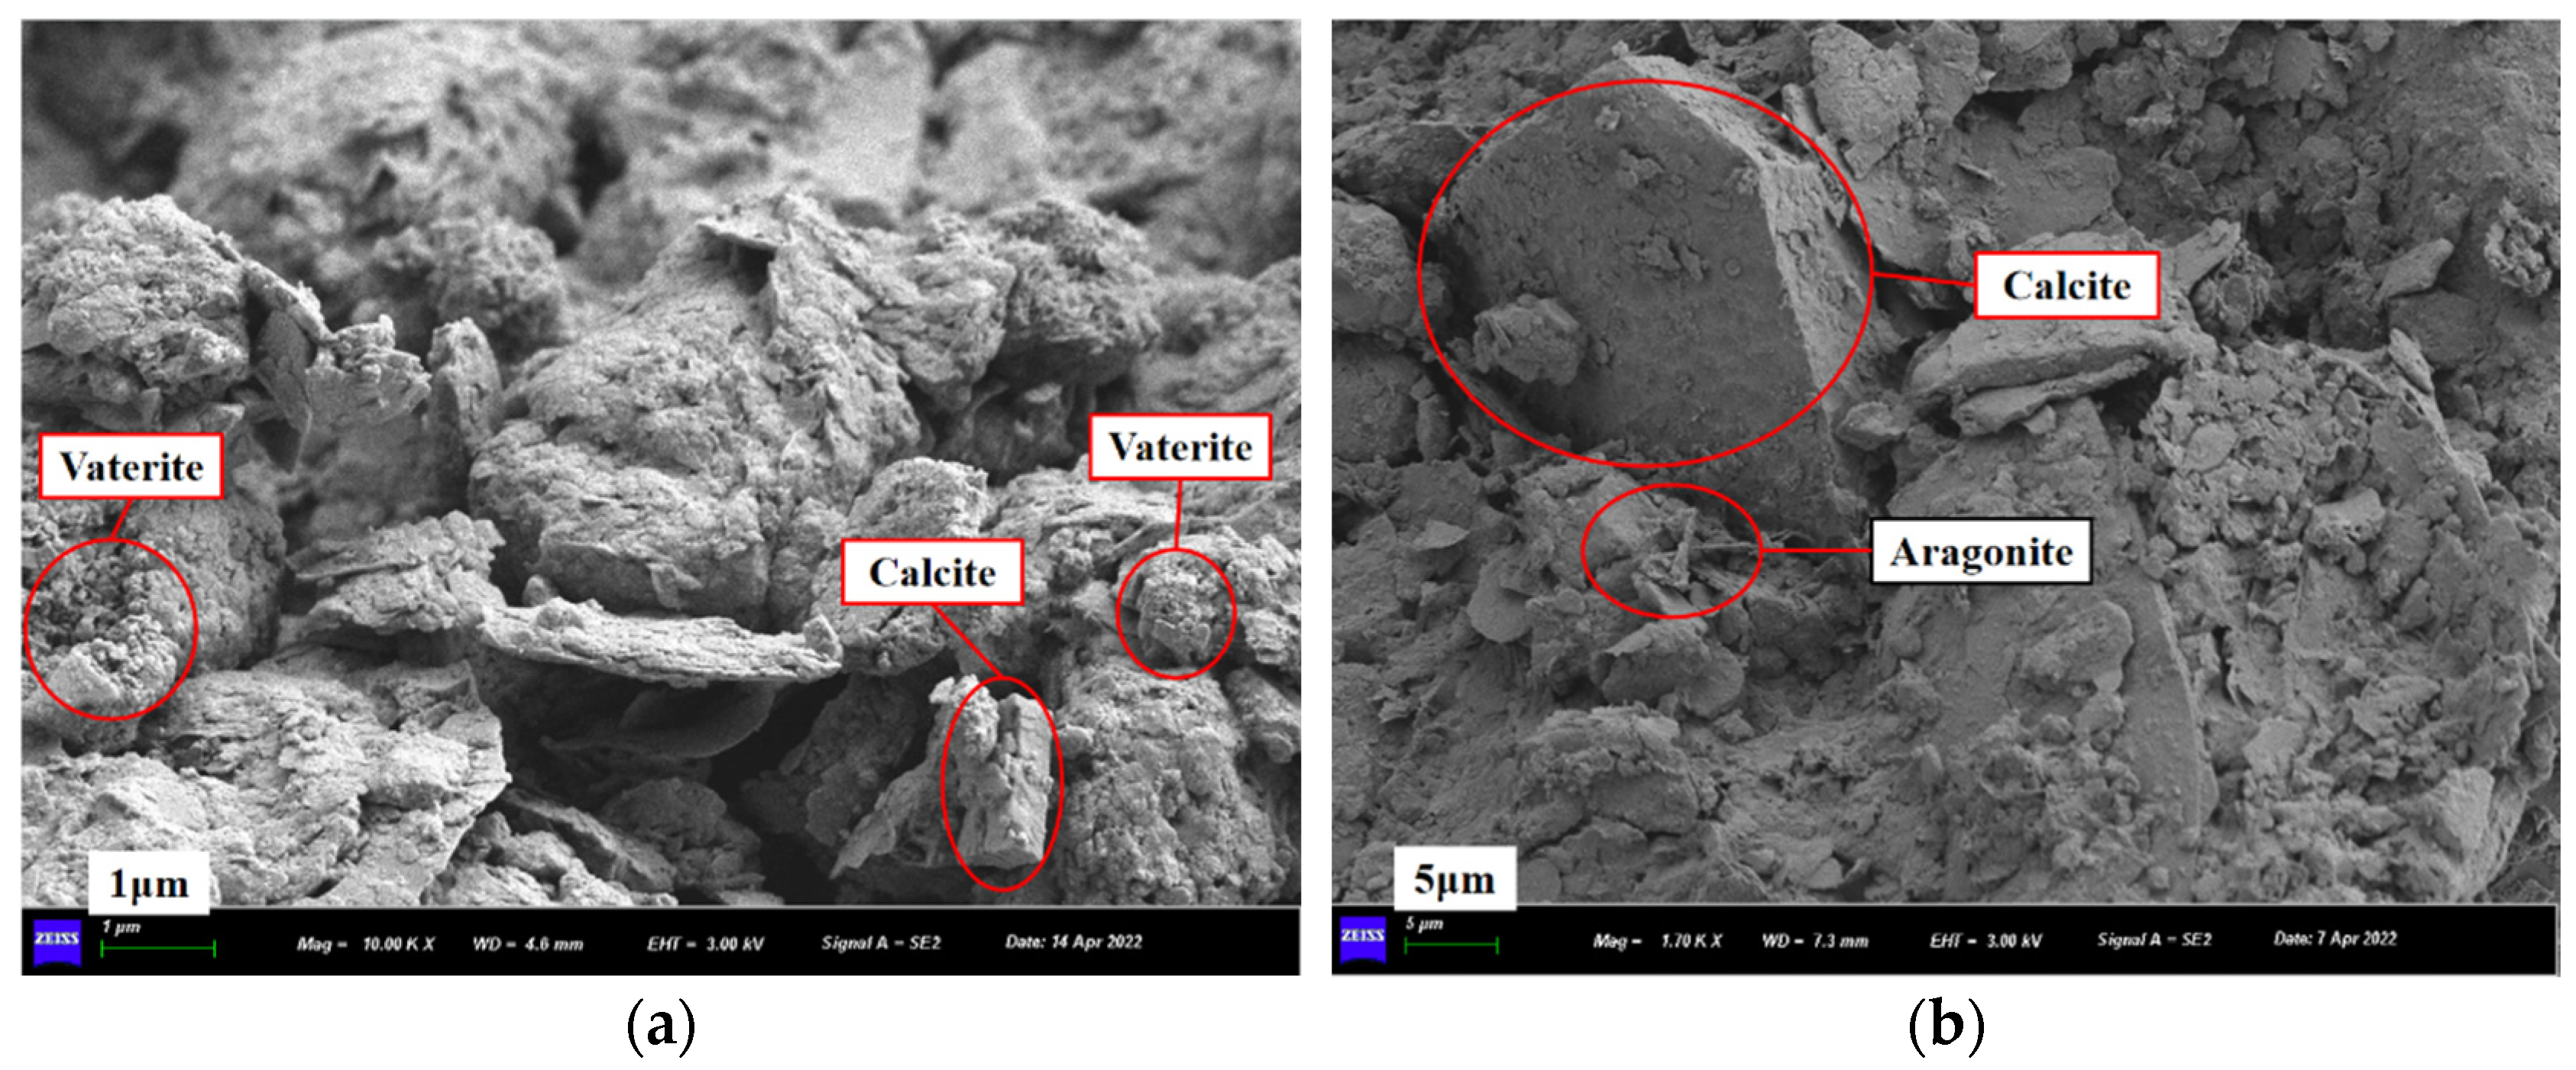
3.7. FESEM Test
3.8. MIA Test
4. Conclusions
- (1)
- The orthogonal experiment results determined the optimum parameters for preparing PMMRS, i.e., moisture content of 9%, the concentration of CaCl2 3.0 mol/L, and the concentration ratio of CaCl2 to urea 1:1. The moisture content and the concentration of CaCl2 showed the significant effect on the UCS of PMMRS. In contrast, the effect of the concentration ratio of CaCl2 to urea was relatively low.
- (2)
- The pretreatment procedure could significantly improve the reinforcement effect of mixing MICP method on the CLS. Compared to the pure CLS and SMMRS specimen, the UCS of PMMRS specimen was increased by 198% and 78%, respectively. The reinforcement effect could be attributed to improvement of cohesion of the soil. Moreover, the mineralization reaction would affect the pore structure of the soil, which was highly related to the reinforcement effect of MICP reinforced soil.
- (3)
- After 3 days of curing, the UCS growth rate of the specimens increased rapidly to 85% of the specimens cured for 28 days. Therefore, 3 days was recommended as the curing time for PMMRS specimen before performing the test.
- (4)
- The CaCO3 distribution inside the specimen was not even no matter the lateral or vertical direction. The CCC of edge part was the greatest in the lateral direction while it decreased from the top to the bottom in the vertical direction. The reason might be attributed to the effect of oxygen on the mineralized bacteria. However, the strength of PMMRS was not monotonously positively related to the CCC with the increment of the CaCl2 concentration.
Author Contributions
Funding
Institutional Review Board Statement
Informed Consent Statement
Data Availability Statement
Acknowledgments
Conflicts of Interest
References
- Zadehmohamad, M.; Luo, N.; Abu-Farsakh, M.; Voyiadjis, G. Evaluating long-term benefits of geosynthetics in flexible pavements built over weak subgrades by finite element and Mechanistic-Empirical analyses. Geotext. Geomembr. 2022, 50, 455–469. [Google Scholar] [CrossRef]
- Gowthaman, S.; Nakashima, K.; Kawasaki, S. A state-of-the-art review on soil reinforcement technology using natural plant fiber materials: Past findings, present trends and future directions. Materials 2018, 11, 553. [Google Scholar]
- Abdizadeh, D.; Pakbaz, M.S.; Nadi, B. Numerical Modeling of Lateral Dynamic Compaction on the Slope in Dry Sand. KSCE J. Civ. Eng. 2020, 25, 398–403. [Google Scholar] [CrossRef]
- Farah, R.E.; Nalbantoglu, Z. Behavior of Geotextile-Encased Single Stone Column in Soft Soils. Arab. J. Sci. Eng. 2020, 45, 3877–3890. [Google Scholar] [CrossRef]
- Saleh, S.; Yunus, N.Z.M.; Ahmad, K.; Ali, N. Improving the strength of weak soil using polyurethane grouts: A review. Constr. Build. Mater. 2019, 202, 738–752. [Google Scholar] [CrossRef]
- Yoon, K.B.; Ryu, H.M.; Lee, G.H.; Gopalan, A.I.; Sai-anand, G.; Lee, D.E. Enhanced compressive strength of rammed earth walls stabilized with eco-friendly multi-functional polymeric system. Renew. Sust. Energ. Rev. 2021, 152, 111681. [Google Scholar] [CrossRef]
- Liu, L.; Deng, T.; Deng, Y.; Zhan, L.; Horpibulsuk, S.; Wang, Q. Stabilization nature and unified strength characterization for cement-based stabilized soils. Constr. Build. Mater. 2022, 336, 127544. [Google Scholar] [CrossRef]
- Miraki, H.; Shariatmadari, N.; Ghadir, P.; Jahandari, S.; Tao, Z.; Siddique, R. Clayey soil stabilization using alkali-activated volcanic ash and slag. J. Rock Mech. Geotech. Eng. 2022, 14, 576–591. [Google Scholar] [CrossRef]
- Lu, Y.; Liu, S.; Zhang, Y.; Li, Z.; Xu, L. Freeze-thaw performance of a cement-treated expansive soil. Cold Reg. Sci. Technol. 2020, 170, 102926. [Google Scholar] [CrossRef]
- Benhelal, E.; Zahedi, G.; Shamsaei, E.; Bahadori, A. Global strategies and potentials to curb CO2 emissions in cement industry. J. Clean. Prod. 2013, 51, 142–161. [Google Scholar] [CrossRef]
- Eliasson, B.; Riemer, P.; Wokaun, A. Greenhouse Gas Control Technologies; Elsevier: Amsterdam, The Netherlands, 1999. [Google Scholar]
- Mahasenan, N.; Smith, S.; Humphreys, K. The cement industry and global climate change: Current and potential future cement industry CO2 emissions. In Proceedings of the Greenhouse Gas Control Technologies-6th International Conference, Kyoto, Japan, 1–4 October 2002; pp. 995–1000. [Google Scholar]
- Worrell, E.; Price, L.; Martin, N.; Hendriks, C.; Meida, L.O. Carbon dioxide emissions from the global cement industry. Annu. Rev. Energy Environ. 2001, 26, 303–329. [Google Scholar] [CrossRef]
- Konstantinou, C.; Wang, Y.; Biscontin, G.; Soga, K. The role of bacterial urease activity on the uniformity of carbonate precipitation profiles of bio-treated coarse sand specimens. Sci. Rep. 2021, 11, 6161. [Google Scholar] [CrossRef] [PubMed]
- Mwandira, W.; Nakashima, K.; Kawasaki, S. Bioremediation of lead-contaminated mine waste by Pararhodobacter sp. based on the microbially induced calcium carbonate precipitation technique and its effects on strength of coarse and fine grained sand. Ecol. Eng. 2017, 109, 57–64. [Google Scholar] [CrossRef]
- Peng, S.; Zhang, K.; Fan, L.; Kang, J.; Peng, K.; Wang, F. Permeability reduction and electrochemical impedance of fractured rock grouted by microbial-induced calcite precipitation. Geofluids 2020, 2020, 8876400. [Google Scholar] [CrossRef]
- Peng, S.; Di, H.; Fan, L.; Fan, W.; Qin, L. Factors affecting permeability reduction of MICP for fractured rock. Front. Earth Sci. 2020, 8, 217. [Google Scholar] [CrossRef]
- Liu, K.-W.; Jiang, N.-J.; Qin, J.-D.; Wang, Y.-J.; Tang, C.-S.; Han, X.-L. An experimental study of mitigating coastal sand dune erosion by microbial-and enzymatic-induced carbonate precipitation. Acta Geotech. 2021, 16, 467–480. [Google Scholar] [CrossRef]
- Xiao, Y.; Ma, G.; Wu, H.; Lu, H.; Zaman, M. Rainfall-Induced Erosion of Biocemented Graded Slopes. Int. J. Geomech. 2022, 22, 04021256. [Google Scholar] [CrossRef]
- Liu, S.; Du, K.; Huang, W.; Wen, K.; Amini, F.; Li, L. Enhanced erosion resistance of cement-treated bricks using multiple biological surface treatments. Adv. Cem. Res. 2021, 33, 540–549. [Google Scholar] [CrossRef]
- Liu, S.; Wang, R.; Yu, J.; Peng, X.; Cai, Y.; Tu, B. Effectiveness of the anti-erosion of an MICP coating on the surfaces of ancient clay roof tiles. Constr. Build. Mater. 2020, 243, 118202. [Google Scholar] [CrossRef]
- Liu, J.; Li, G.; Li, X.a. Geotechnical engineering properties of soils solidified by microbially induced CaCO3 precipitation (MICP). Adv. Civ. Eng. 2021, 2021, 6683930. [Google Scholar] [CrossRef]
- Chen, P.; Zheng, H.; Xu, H.; Gao, Y.-x.; Ding, X.-q.; Ma, M.-l. Microbial induced solidification and stabilization of municipal solid waste incineration fly ash with high alkalinity and heavy metal toxicity. PLoS ONE 2019, 14, e0223900. [Google Scholar] [CrossRef] [PubMed] [Green Version]
- Van Paassen, L.A.; Daza, C.M.; Staal, M.; Sorokin, D.Y.; van der Zon, W.; van Loosdrecht, M.C. Potential soil reinforcement by biological denitrification. Ecol. Eng. 2010, 36, 168–175. [Google Scholar] [CrossRef]
- Wang, H.; Miao, L.; Sun, X.; Wu, L.; Fan, G. Experimental Study of Enzyme-Induced Carbonate Precipitation for High Temperature Applications by Controlling Enzyme Activity. Geomicrobiol. J. 2022, 39, 1–13. [Google Scholar] [CrossRef]
- Song, M.; Ju, T.; Meng, Y.; Han, S.; Lin, L.; Jiang, J. A review on the applications of microbially induced calcium carbonate precipitation in solid waste treatment and soil remediation. Chemosphere 2022, 290, 133229. [Google Scholar] [CrossRef] [PubMed]
- Tiwari, N.; Satyam, N.; Sharma, M. Micro-mechanical performance evaluation of expansive soil biotreated with indigenous bacteria using MICP method. Sci. Rep. 2021, 11, 1–12. [Google Scholar] [CrossRef]
- Wang, L.; Wang, X.; Li, F.; Cui, M.; Yang, X.; Yang, M.; Yan, Y. Advances of enzymes related to microbial cement. Chin. J. Biotechnol. 2022, 38, 506–517. [Google Scholar] [CrossRef]
- DeJong, J.T.; Fritzges, M.B.; Nüsslein, K. Microbially induced cementation to control sand response to undrained shear. J. Geotech. Geoenvironmental Eng. 2006, 132, 1381–1392. [Google Scholar] [CrossRef]
- Kannan, K.; Bindu, J.; Vinod, P. Engineering behaviour of MICP treated marine clays. Mar. Georesources Geotechnol. 2020, 38, 761–769. [Google Scholar] [CrossRef]
- Xiao, Y.; Xiao, W.; Ma, G.; He, X.; Wu, H.; Shi, J. Mechanical Performance of Biotreated Sandy Road Bases. J. Perform. Constr. Facil. 2022, 36, 04021111. [Google Scholar] [CrossRef]
- Liu, S.; Wen, K.; Armwood, C.; Bu, C.; Li, C.; Amini, F.; Li, L. Enhancement of MICP-treated sandy soils against environmental deterioration. J. Mater. Civil. Eng. 2019, 31, 04019294. [Google Scholar] [CrossRef]
- Porter, H.; Dhami, N.K.; Mukherjee, A. Sustainable road bases with microbial precipitation. Proc. Inst. Civ. Eng. -Constr. Mater. 2018, 171, 95–108. [Google Scholar] [CrossRef]
- Xiao, J.; Wei, Y.; Cai, H.; Wang, Z.; Yang, T.; Wang, Q.; Wu, S. Microbial-induced carbonate precipitation for strengthening soft clay. Adv. Mater. Sci. Eng. 2020, 2020, 8140724. [Google Scholar] [CrossRef]
- Lu, T.; Wei, Z.; Wang, W.; Yang, Y.; Cao, G.; Wang, Y.; Liao, H. Experimental Investigation of sample preparation and grouting technology on microbially reinforced tailings. Constr. Build. Mater. 2021, 312, 125458. [Google Scholar] [CrossRef]
- Zamani, A.; Montoya, B. Undrained monotonic shear response of MICP-treated silty sands. J. Geotech. Geoenvironmental Eng. 2018, 144, 04018029. [Google Scholar] [CrossRef]
- Rebata-Landa, V. Microbial Activity in Sediments: Effects on Soil Behavior. Ph.D. Thesis, Georgia Institute of Technology, Atlanta, GA, USA, 2007. [Google Scholar]
- Choi, S.-G.; Park, S.-S.; Wu, S.; Chu, J. Methods for calcium carbonate content measurement of biocemented soils. J. Mater. Civil. Eng. 2017, 29, 06017015. [Google Scholar] [CrossRef]
- Montoya, B.M.; Do, J.; Gabr, M.A. Distribution and Properties of Microbially Induced Carbonate Precipitation in Underwater Sand Bed. J. Geotech. Geoenvironmental Eng. 2021, 147, 04021098. [Google Scholar] [CrossRef]
- Cui, M.-J.; Zheng, J.-J.; Zhang, R.-J.; Lai, H.-J.; Zhang, J. Influence of cementation level on the strength behaviour of bio-cemented sand. Acta Geotech. 2017, 12, 971–986. [Google Scholar] [CrossRef]
- Ivanov, V.; Chu, J. Applications of microorganisms to geotechnical engineering for bioclogging and biocementation of soil in situ. Rev. Environ. Sci. Bio/Technol. 2008, 7, 139–153. [Google Scholar] [CrossRef]
- Jain, S.; Arnepalli, D. Biochemically induced carbonate precipitation in aerobic and anaerobic environments by Sporosarcina pasteurii. Geomicrobiol. J. 2019, 36, 443–451. [Google Scholar] [CrossRef]
- Li, M.; Wen, K.; Li, Y.; Zhu, L. Impact of oxygen availability on microbially induced calcite precipitation (MICP) treatment. Geomicrobiol. J. 2018, 35, 15–22. [Google Scholar] [CrossRef]


| Indexes | Results | Indexes | Results |
|---|---|---|---|
| Classification | Clayey Sand (CLS) | Clay | 2.20% |
| Liquid limit | 46.52% | Silt | 7.00% |
| Plastic limit | 25.61% | Sand | 86.20% |
| Plastic index | 20.91 | d10 | 0.0054 mm |
| Specific gravity | 2.71 | d30 | 0.0209 mm |
| Maximum dry density | 2.09 g/cm3 | d60 | 0.9801 mm |
| Optimum moisture content | 9.2% | Cu | 181.3474 |
| pH | 6.87 | Cs | 0.0821 |
| Group Number | Moisture Content (%) | Concentration of CaCl2 (mol/L) | Ratio of CaCl2 to Urea | Empty Column | Empty Column | Empty Column |
|---|---|---|---|---|---|---|
| 1 | (1) 13% | (1) 2.0 | (1) 1:2 | (1) - | (1) - | (1) - |
| 2 | (1) 13% | (2) 4.0 | (3) 2:1 | (4) - | (5) - | (2) - |
| 3 | (1) 13% | (3) 3.0 | (5) 1:3 | (2) - | (4) - | (3) - |
| 4 | (1) 13% | (4) 5.0 | (2) 1:1 | (5) - | (3) - | (4) - |
| 5 | (1) 13% | (5) 1.0 | (4) 3:1 | (3) - | (2) - | (5) - |
| 6 | (2) 10% | (1) 2.0 | (5) 2:1 | (4) - | (3) - | (5) - |
| 7 | (2) 10% | (2) 4.0 | (2) 1:3 | (2) - | (2) - | (1) - |
| 8 | (2) 10% | (3) 3.0 | (4) 1:1 | (5) - | (1) - | (2) - |
| 9 | (2) 10% | (4) 5.0 | (1) 3:1 | (3) - | (5) - | (3) - |
| 10 | (2) 10% | (5) 1.0 | (3) 1:2 | (1) - | (4) - | (4) - |
| 11 | (3) 11% | (1) 2.0 | (4) 1:3 | (2) - | (5) - | (4) - |
| 12 | (3) 11% | (2) 4.0 | (1) 1:1 | (5) - | (4) - | (5) - |
| 13 | (3) 11% | (3) 3.0 | (3) 3:1 | (3) - | (3) - | (1) - |
| 14 | (3) 11% | (4) 5.0 | (5) 1:2 | (1) - | (2) - | (2) - |
| 15 | (3) 11% | (5) 1.0 | (2) 2:1 | (4) - | (1) - | (3) - |
| 16 | (4) 9% | (1) 2.0 | (3) 1:1 | (5) - | (2) - | (3) - |
| 17 | (4) 9% | (2) 4.0 | (5) 3:1 | (3) - | (1) - | (4) - |
| 18 | (4) 9% | (3) 3.0 | (2) 1:2 | (1) - | (5) - | (5) - |
| 19 | (4) 9% | (4) 5.0 | (4) 2:1 | (4) - | (4) - | (1) - |
| 20 | (4) 9% | (5) 1.0 | (1) 1:3 | (2) - | (3) - | (2) - |
| 21 | (5) 12% | (1) 2.0 | (2) 3:1 | (3) - | (4) - | (2) - |
| 22 | (5) 12% | (2)4.0 | (4) 1:2 | (1) - | (3) - | (3) - |
| 23 | (5) 12% | (3) 3.0 | (1) 2:1 | (4) - | (2) - | (4) - |
| 24 | (5) 12% | (4) 5.0 | (3) 1:3 | (2) - | (1) - | (5) - |
| 25 | (5) 12% | (5) 1.0 | (5) 1:1 | (5) - | (5) - | (1) - |
| Group Number | Average UCS (MPa) | Group Number | Average UCS (MPa) |
|---|---|---|---|
| 1 | 3.43 | 14 | 5.92 |
| 2 | 5.22 | 15 | 2.46 |
| 3 | 6.02 | 16 | 8.89 |
| 4 | 9.31 | 17 | 12.14 |
| 5 | 4.32 | 18 | 12.92 |
| 6 | 5.43 | 19 | 9.42 |
| 7 | 8.62 | 20 | 7.65 |
| 8 | 9.88 | 21 | 4.90 |
| 9 | 6.56 | 22 | 6.04 |
| 10 | 4.32 | 23 | 10.20 |
| 11 | 5.15 | 24 | 3.25 |
| 12 | 8.11 | 25 | 4.06 |
| 13 | 6.97 |
| Group Number | Moisture Content | Concentration of CaCl2(mol/L) | Ratio of CaCl2 to Urea |
|---|---|---|---|
| K1 | (13%) 28.30 | (2.0) 27.80 | (1:2) 35.95 |
| K2 | (10%) 34.81 | (4.0) 40.13 | (1:1) 38.21 |
| K3 | (11%) 28.61 | (3.0) 45.99 | (2:1) 28.65 |
| K4 | (9%) 51.02 | (5.0) 34.46 | (3:1) 34.81 |
| K5 | (12%) 28.45 | (1.0) 22.81 | (1:3) 33.57 |
| R | 22.72 | 23.18 | 9.56 |
| Source of Variation | Sum of Squares of Separation | Degree of Freedom | Mean Square | F-Value |
|---|---|---|---|---|
| Moisture content | 76.48 | 4 | 19.12 | 7.65 (*) |
| Concentration of CaCl2 | 68.98 | 4 | 17.25 | 6.90 (*) |
| Ratio of CaCl2 to urea | 10.14 | 4 | 2.54 | 1.01 |
| Errors | 29.99 | 12 | 2.50 |
| Direction | Lateral | ||
|---|---|---|---|
| Location | Edge | Middle | |
| Vertical | Upside | 1 | 2 |
| Middle | 4 | 5 | |
| Downside | 7 | 8 |
Publisher’s Note: MDPI stays neutral with regard to jurisdictional claims in published maps and institutional affiliations. |
© 2022 by the authors. Licensee MDPI, Basel, Switzerland. This article is an open access article distributed under the terms and conditions of the Creative Commons Attribution (CC BY) license (https://creativecommons.org/licenses/by/4.0/).
Share and Cite
Hu, X.; Fu, X.; Pan, P.; Lin, L.; Sun, Y. Incorporation of Mixing Microbial Induced Calcite Precipitation (MICP) with Pretreatment Procedure for Road Soil Subgrade Stabilization. Materials 2022, 15, 6529. https://0-doi-org.brum.beds.ac.uk/10.3390/ma15196529
Hu X, Fu X, Pan P, Lin L, Sun Y. Incorporation of Mixing Microbial Induced Calcite Precipitation (MICP) with Pretreatment Procedure for Road Soil Subgrade Stabilization. Materials. 2022; 15(19):6529. https://0-doi-org.brum.beds.ac.uk/10.3390/ma15196529
Chicago/Turabian StyleHu, Xiaodi, Xiongzheng Fu, Pan Pan, Lirong Lin, and Yihan Sun. 2022. "Incorporation of Mixing Microbial Induced Calcite Precipitation (MICP) with Pretreatment Procedure for Road Soil Subgrade Stabilization" Materials 15, no. 19: 6529. https://0-doi-org.brum.beds.ac.uk/10.3390/ma15196529