
The Wavelength-Dependent SERS Template Based on a Nanopillar Array

1
School of Optoelectronic Engineering and Instrumentation Science, Dalian University of Technology, Dalian 116024, China
2
College of Physics, Dalian University of Technology, Dalian 116024, China
3
PipeChina Group, Beijing Pipe Co., Ltd., Beijing 100020, China
4
Department of Photonics, National Cheng Kung University, Tainan 70101, Taiwan
*
Authors to whom correspondence should be addressed.
Materials 2022, 15(21), 7446; https://0-doi-org.brum.beds.ac.uk/10.3390/ma15217446
Submission received: 17 September 2022
/
Revised: 2 October 2022
/
Accepted: 20 October 2022
/
Published: 24 October 2022
(This article belongs to the Special Issue Advances in Surface-Enhanced Raman Spectroscopy and Materials Characterization)
Abstract
:Surface-enhanced Raman spectroscopy (SERS) can be regarded as a powerful tool for probing chemical molecules by effectively enhancing Raman signals. However, the enhancement factors depend on the SERS template, the probed molecular structures, and the excitation laser wavelength. Herein, we proposed a simple and easily fabricated nanostructured template for SERS and analyzed the wavelength-dependent factors. Three types of golden nanopillar arrays on silicon wafers were designed and manufactured. The SERS signals of the Rhodamine 6G (R6G) molecules were extracted. Three laser sources, a blue 17 mW 458 nm diode laser, a green 20 mW 532 nm laser, and a red 6 mW 633 nm laser, were employed as the excitation laser sources. The 458 nm laser was located far from the resonate spectrum of R6G. The optical intensity distributions for the different SERS templates excited by three laser beams were also simulated. The enhancement factors (EFs) of R6G on the three nanostructured templates were measured and compared. The photoluminescence spectrum of the nanostructured templates and SERS signals of R6G were also measured. In addition, the experimental results concerned optical simulations. The analysis tool that was used was a convolution profile of multiple Lorentzian line shapes with a Gaussian profile. It is helpful to understand the SERS signals when the excitation laser wavelength is located out of the resonance region of molecules. It can also provide a new design approach to fabricate an SERS Template with a nanopillar array for different excitation wavelengths.
1. Introduction
Surface-enhanced Raman-scattering (SERS) spectroscopy is a powerful analytical tool and has vast potential applications in many fields such as chemical and biological sensing [1] due to the process of Raman Signal enhancement. In 1974, M. Fleischmann observed the significant Raman scattering of pyridine on coarse-silver for the first time [2]. Subsequently, George C. Schatz [3] and Lasse Jensen [4] described the electromagnetic enhancement mechanism and chemical enhancement mechanism, respectively.
The SERS substrate is the most important factor, and it can determine the intensity of SERS signals. In the past, the choice of the SERS substrate included nanoparticle (NPs) materials [5,6] or three-dimensional (3D) structures [7,8]. Herrera et al. [9] achieved an excellent SERS result by using gold and silver NPs prepared by laser ablation as the substrate. Freeman et al. [10] used monodisperse gold and silver colloidal NPs to self-assemble monolayers on polymer-coating substrates to generate macroscopic surfaces, which are highly active for SERS. Sanchez-Iglesias et al. [11] used block copolymer micelle nanolithography to generate arrays of Ag NPs containing high-density hot spots. The degree of SERS enhanced by NPs depends on many factors, such as the size, shape, and material of the NPs [12,13]. Three-dimensionally structured SERS substrates have been fabricated with Ag or Au films. Different types of 3D structures can be designed, such as Ag-decorated Si nanocone arrays [14], Ag nanosheet-assembled micro-hemispheres [15], and Ag NP-grafted PAN-nanohump array films [16]. The fabrication processes include electron-beam lithography [17], integrating photolithographic microstructures and self-assembly [18], soft lithography, and nano-sphere lithography [19]. Other 3D structures have been reported, including regular hexagonal arrays [20], 3D flower-like gold microstructures [21], and Au-coated ZnO nanorods [22].
In the consequent studies, some materials had some unique advantages when they were used as SERS substrates [23,24,25,26]. Two-dimensional (2D) materials have increasingly become research objects due to their excellent performance [27,28,29]. In addition, non-novel metallic NPs or nanostructures have also been used in SERS applications, such as semiconductor nanostructures [30] and carbon nanostructures [31]. To date, the SERS substrates have had broad application prospects in biomedicine [32,33], art protection [34], molecular detection [35,36], food safety [37], and other fields.
In this work, we proposed a simple and easily fabricated nanostructured template for SERS. The three types of golden nanopillar arrays on silicon wafers were designed and fabricated. We extracted the photoluminescence (PL) spectra and the SERS signals of Rhodamine 6G (R6G) molecules on these nanostructured templates produced by a 458 nm laser, a 532 nm laser, and a 633 nm laser. In addition, the optical intensity distributions for the different SERS templates excited by the three laser beams were simulated using the finite-difference-time-domain (FDTD) method according to Maxwell’s equations. Eventually, we investigated the sample effect for the enhancement factors (EFs). R6G is a cationic dye with strong absorption in the visible and a high fluorescence yield. When R6G molecules with an SERS substrate are excited with visible light, they show a molecular resonance Raman effect in addition to the SERS effect that comes from the localized surface plasmon resonance (LSPR) [38]. The SERS performance is largely dependent on the LSPR of the substrate at a given excitation wavelength. The laser excitation at 458 nm has the best SERS performance for the substrate specially designed [39].
2. Materials and Methods
2.1. Sample Preparations
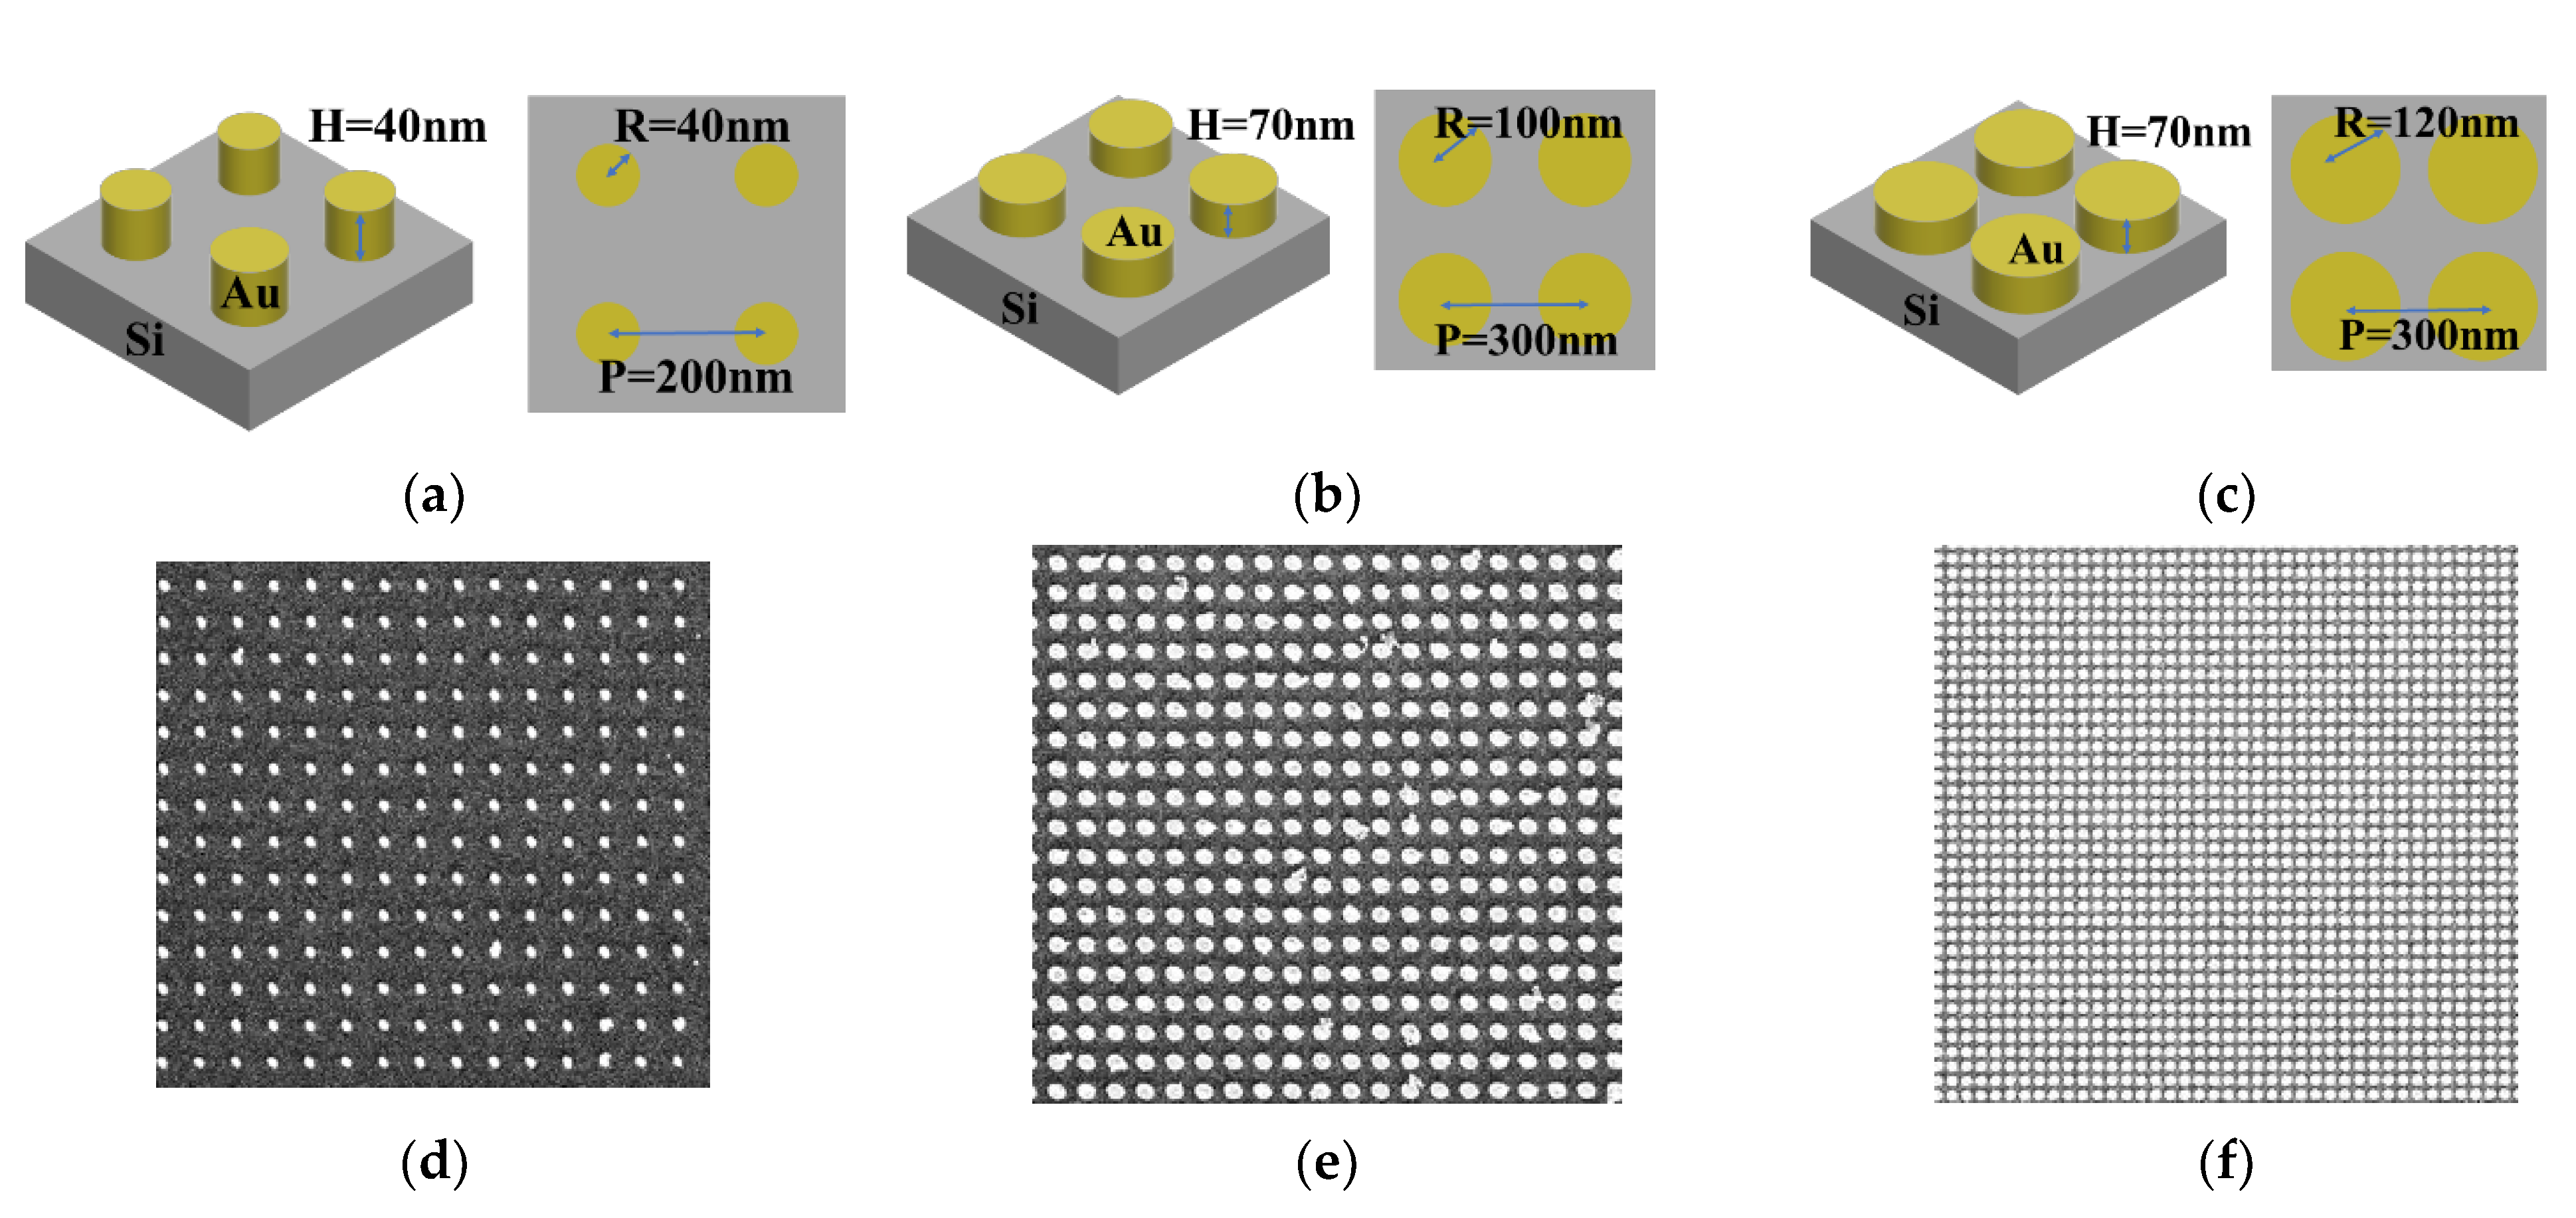
The nanostructured templates were designed as a nanopillar array with three different nanopillar sizes on silicon wafer. The radius and the height of the nanopillars and the pitch between two nanopillars of the nanostructured templates are shown in Figure 1a–c. The samples were named according to the nanopillar sizes, e.g., the R40 sample, as shown in Figure 1a, corresponds to the 40 nm radius nanopillars. The R100 and R120 samples were also named by this rule. The samples were prepared by an electron beam evaporation system and an electron beam writer (ELS-7500EX, Elionix Inc., Tokyo, Japan). These samples were prepared by Center for Micro/Nano Science and Technology, National Cheng Kung University. The SEM images for the SERS templates are shown in Figure 1d–f.
At the same time, 500 mL 10−3 M R6G solutions were prepared. The 0.24 g R6G powder was dissolved in a 10 mL of 99% alcohol, and then diluted in 500 mL of deionized water. In addition, three types of samples were soaked in the solution for 1 h. The Raman spectra were measured immediately after the samples were removed from the solution.
2.2. Micro Raman Spectroscopy System
The optical layout of Raman system is a confocal microscopy configuration with a 17 mW 458 nm diode laser, a 19 mW 532 nm frequency-doubling Nd: YAG laser, and a 6 mW 633 nm He-Ne Laser. A laser beam was focused by a 100 X objective lens (NA = 0.9) on the sample plate with a 2 μm spot size. A high-resolution spectrometer (Jobin Yon iHR550, HORIBA Ltd., Tokyo, Japan) was utilized to collect the Raman signals. The spectral resolution was 0.7 cm−1. The integration time constant was 0.5 s. The lateral spatial resolution was estimated was 0.7 μm, and the axial spatial resolution was calculated as 4.2 μm.
2.3. The Simluations of the Optical Intensity Distributions
The related research works regarding the SERS enhancement mechanism were reported [40,41,42,43]. Typically, the researchers have focused on its surface roughness. However, as a uniform property of the reflective surface, the electromagnetic (EM) field enhancement effect generated by the surface roughness is also even in the SERS plane. The local strong enhancement effect in a certain area cannot be defined. These designed nanopillar structures can provide large, strong EM field enhancement around the nanostructured area and boost the generations of the SERS signals. So, the optical intensity distributions for the different SERS templates excited by three laser beams were simulated using FDTD method according to Maxwell’s equations.
3. Experimental Results
3.1. Photoluminescence Spectra
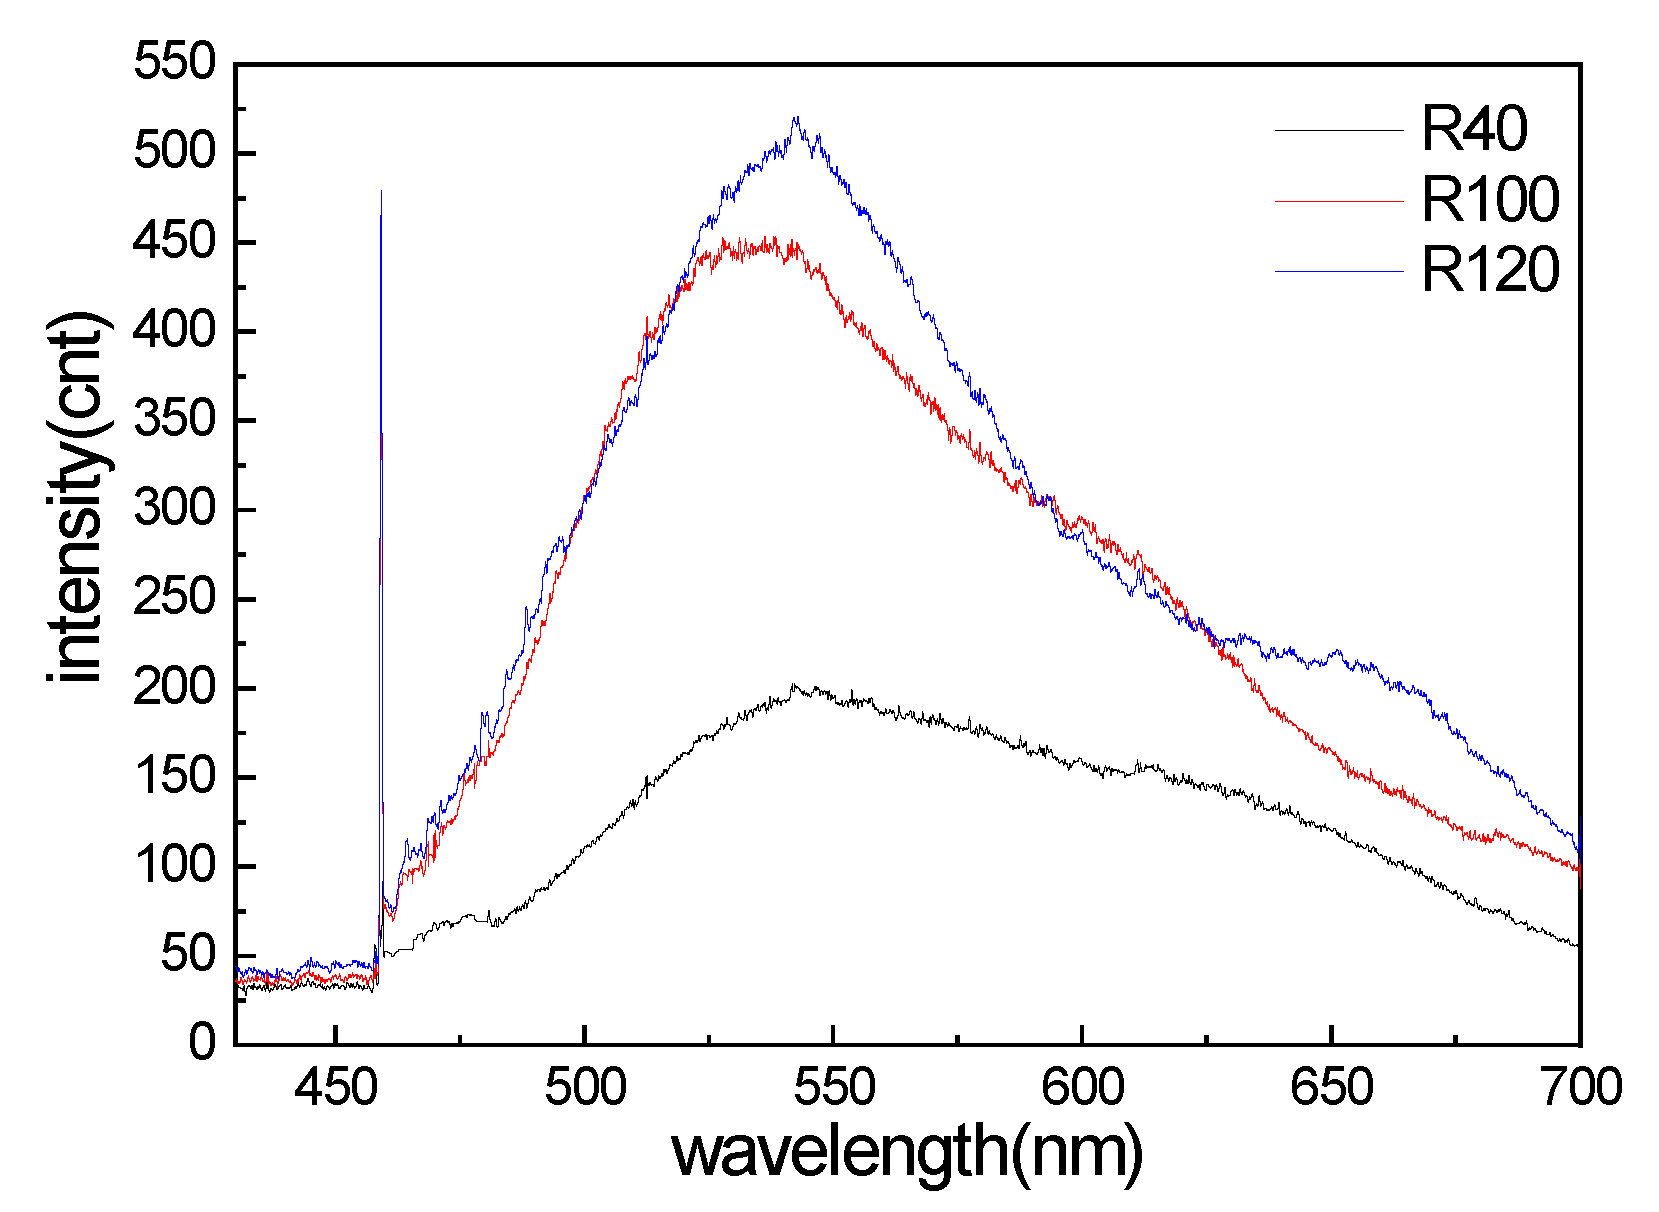
The PL spectra of R6G on the three nanostructured templates are shown in Figure 2. The PL peak was found around 547 nm. Compared with the PL signal intensities, the Raman signals could be estimated on the order of −3 to −6 times lower than the PL signals. The 458 nm laser excitation can excite the unique Raman spectrum, which is located far from the PL spectrum around 547 nm.
3.2. The SERS Signals
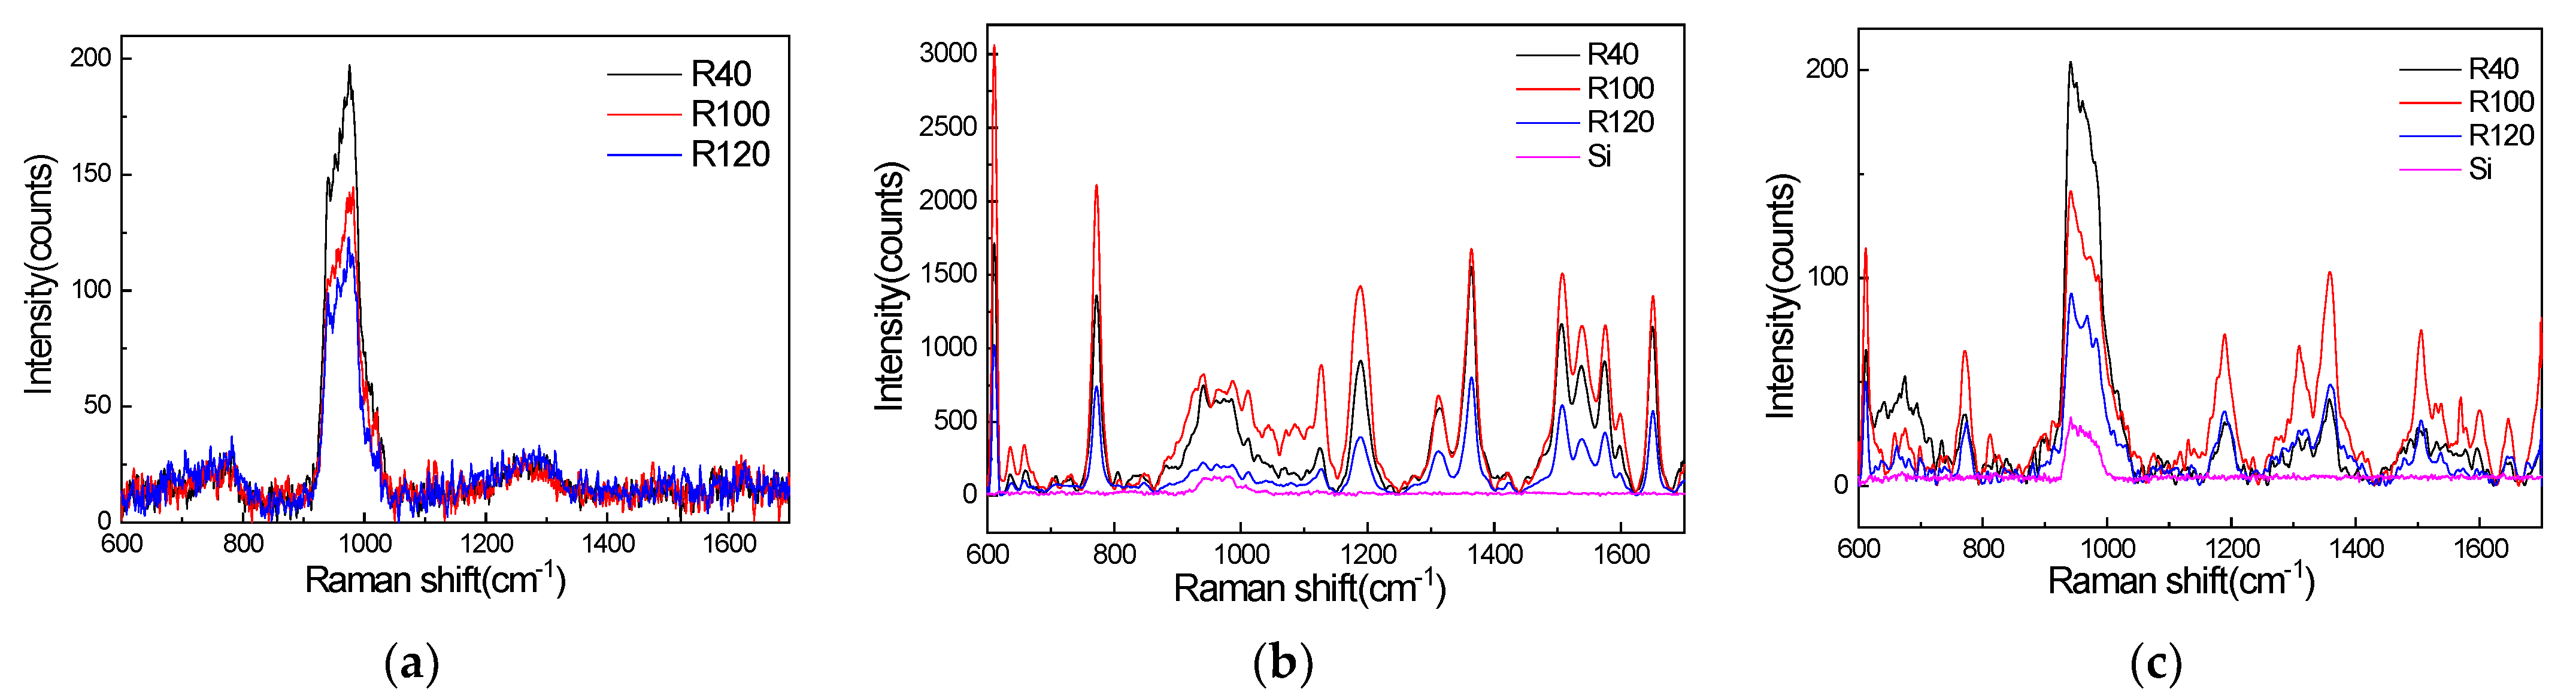
Figure 3 shows that the SERS signals of R6G on the three nanostructured templates and a silicon wafer were excited by a 458 nm laser, 532 nm laser, and a 633 nm laser. Shown in Figure 3a, we compared the peak height and peak position of SERS signals produced by the 458 nm laser and concluded that the R40 sample exhibits the greatest enhancement of the SERS signal of R6G. In addition, weaker enhancement factors were obtained for the R100 and R120 samples. As shown in Figure 3b, the SERS signals produced by the 532 nm laser have a strong intensity, and the R100 sample has the greatest enhancement, while the R120 sample has the worst enhancement. The SERS signals excited by the 633 nm laser are shown in Figure 3c. The R40 nanopillar array has the greatest enhancement at the peak at 772 cm−1, and the R100 nanopillar array has the greatest enhancement at the other peaks.
4. Results and Discussions
4.1. The Light Intensity Distribution Due to the SERS Templates
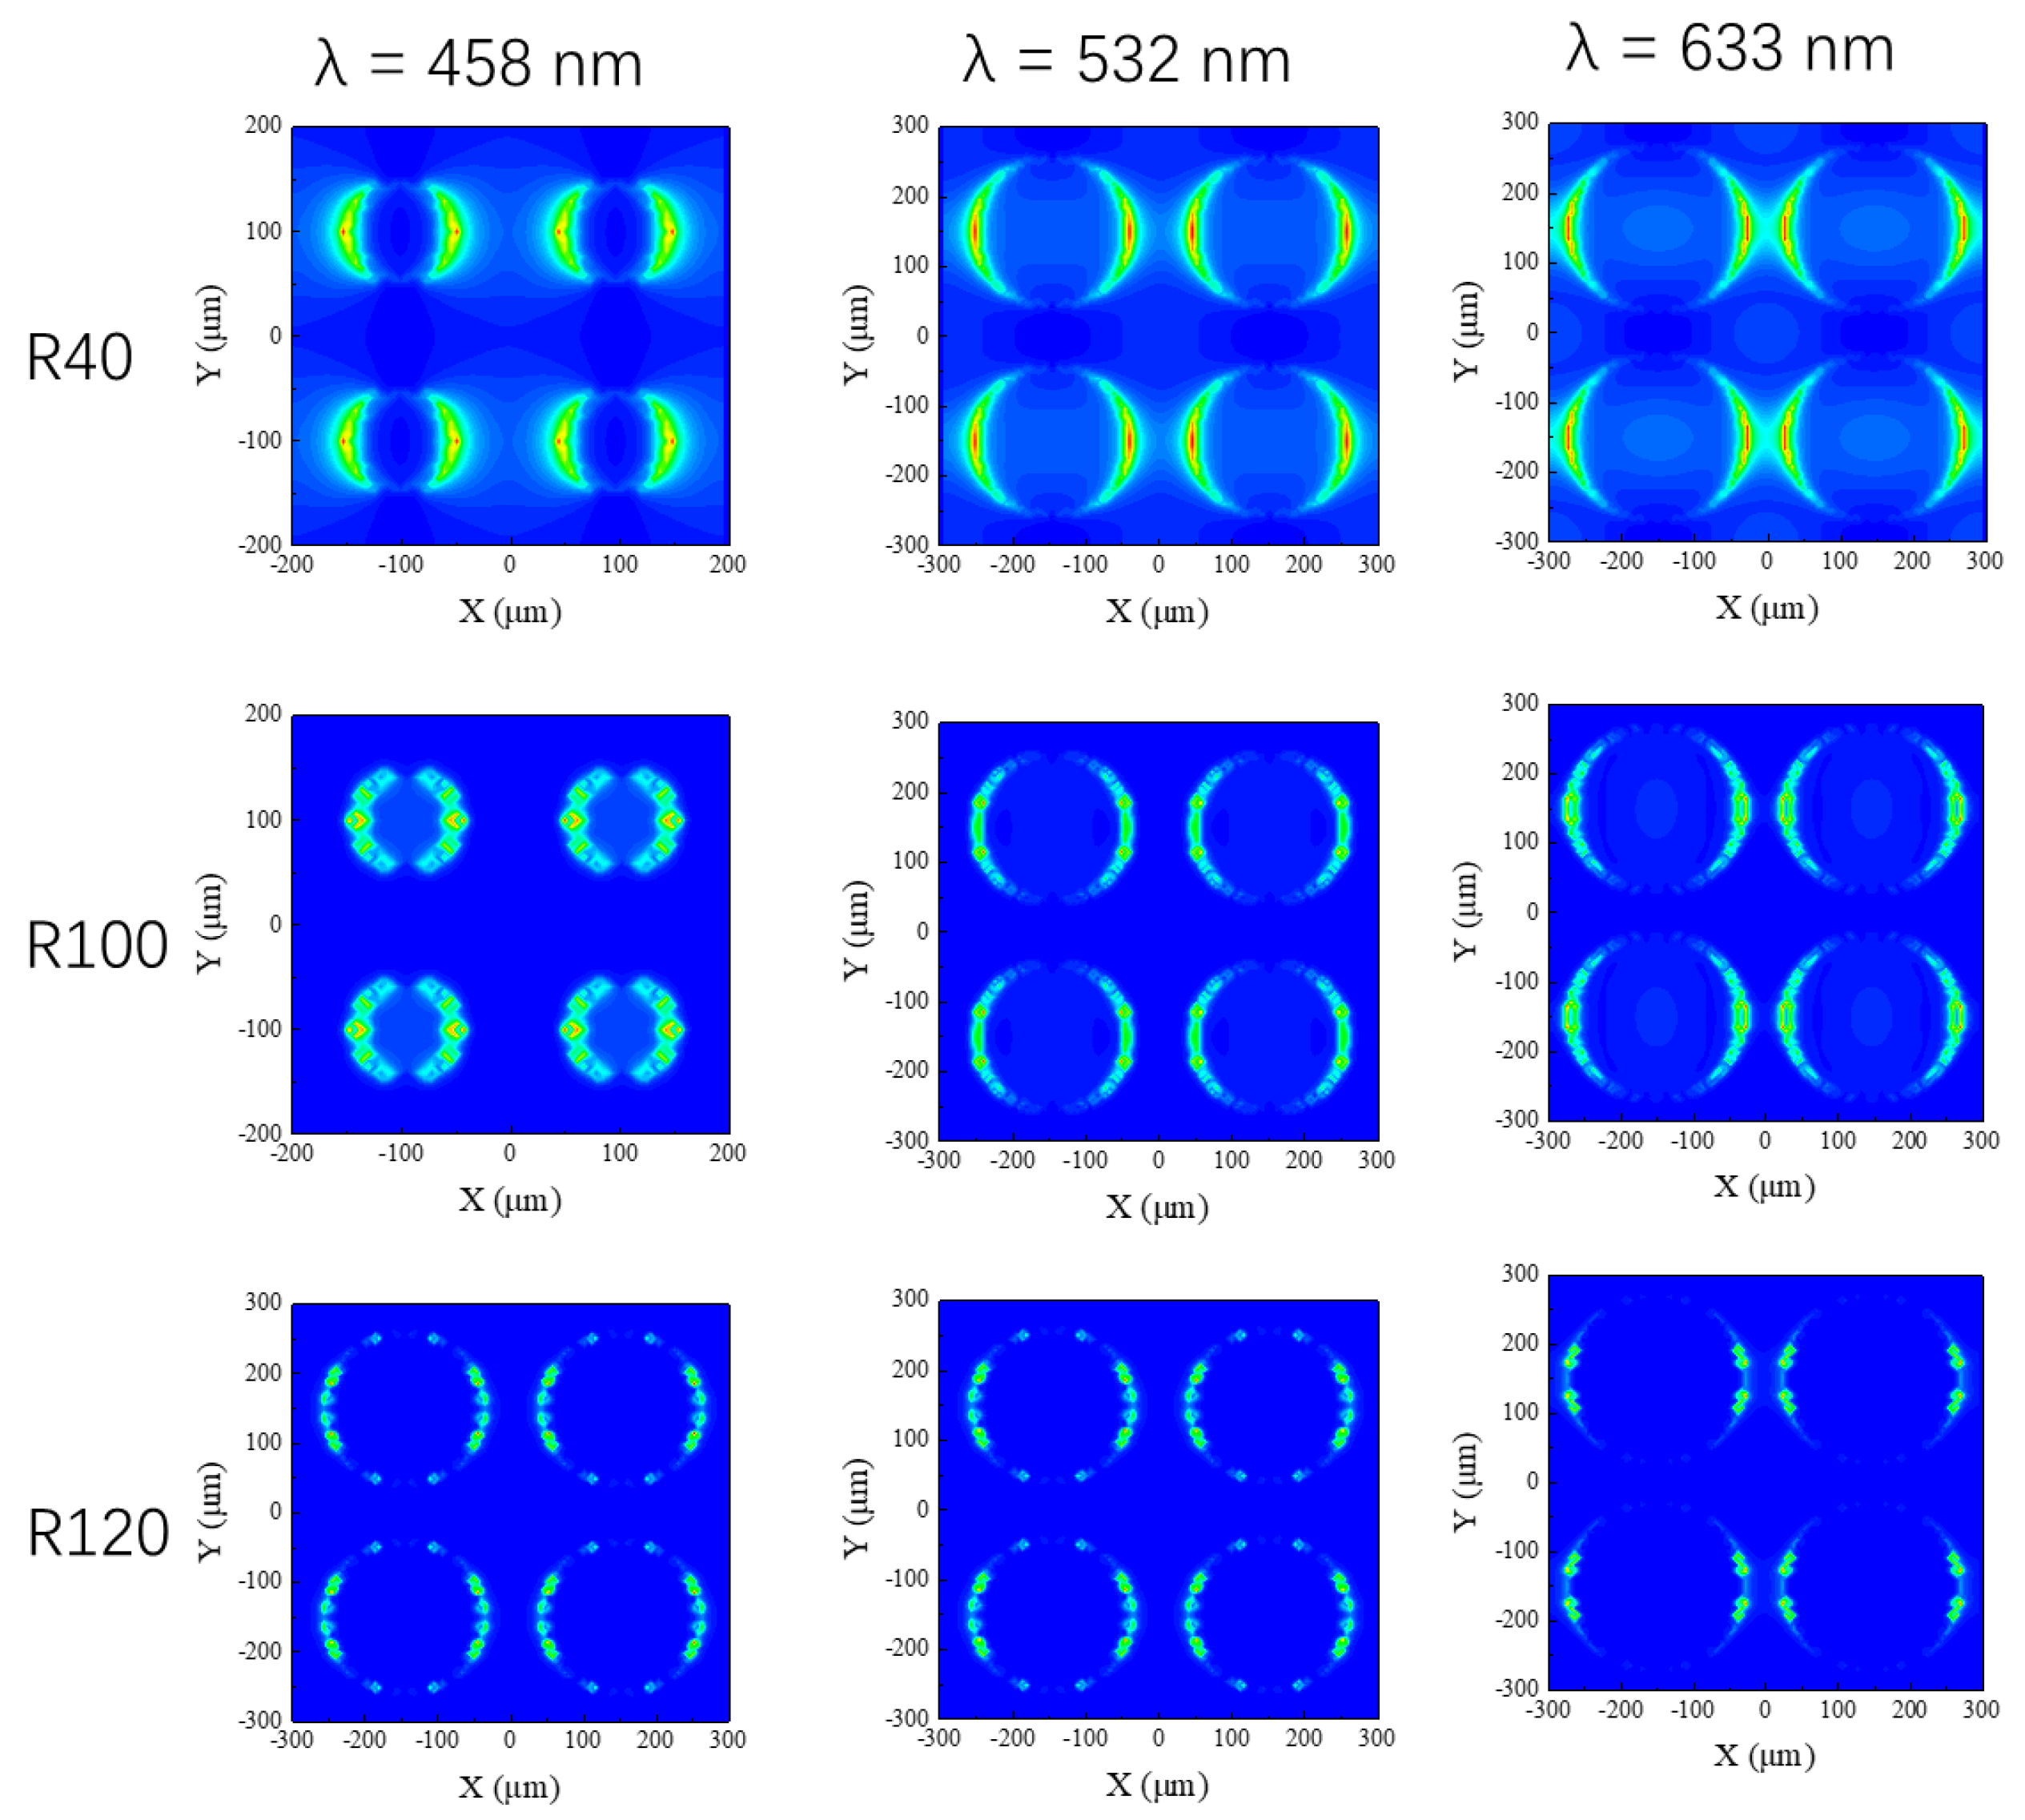
In order to verify this enhancement effect with respect to the SERS templates, simulation procedures were performed using the FDTD method according to Maxwell’s equations. The optical intensity distributions for the different SERS templates (R40, R100, and R120) under three excitation wavelengths (λ = 458 nm, 532 nm, and 633 nm) are shown in Figure 4. One can observe that the three nanostructured SERS templates also have better enhancement at a short wavelength (λ = 458 nm). Comparing the enhancement effect of the three nanostructured SERS templates at the same wavelength, one can find that the EM field enhancement effect of R40 at the three wavelengths is the strongest, and the EM field enhancement effects of R100 and R120 are almost the same, which matches the experimental data in which the R40 SERS template has the best enhancement effect on the R6G signals.
4.2. Linewidth Analysis
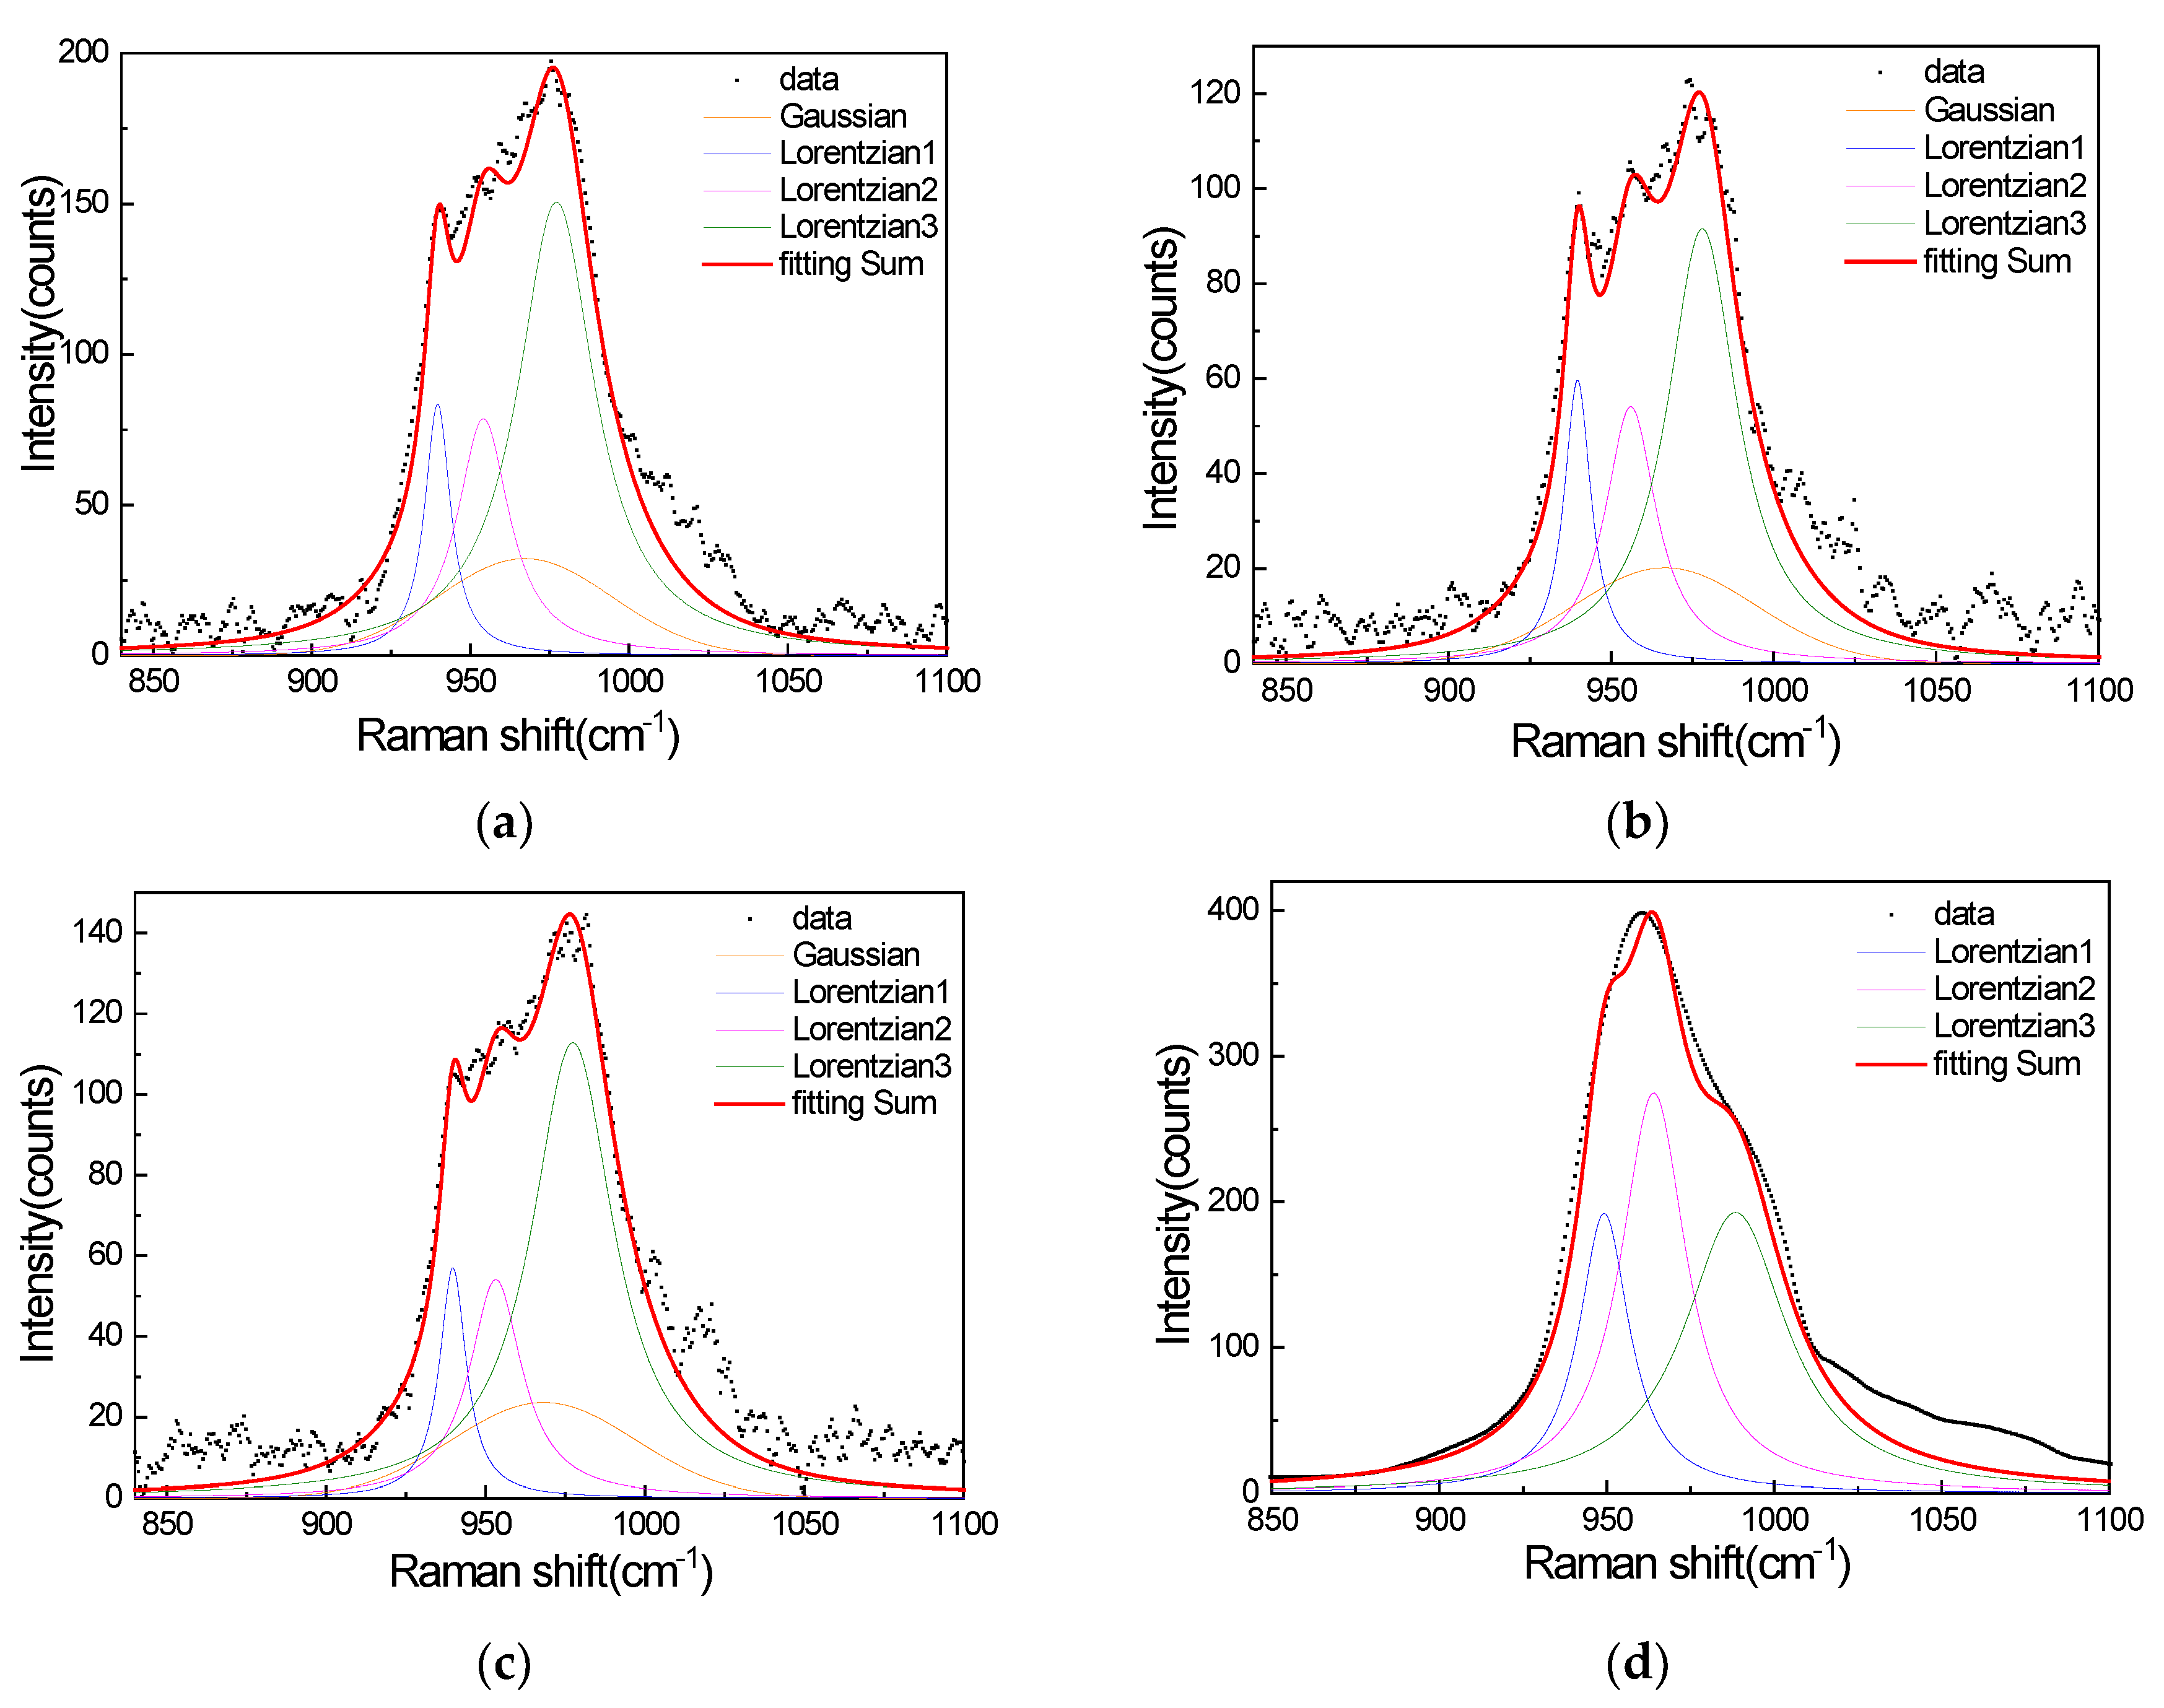
From the Raman spectra excited by the 458 nm laser, we found a significant peak in the range of the Raman shift from 840 cm−1 to 1060 cm−1, in which the peak is apparently superimposed by multiple peaks. This significant peak could also be found when the samples were excited by the 532 nm and 633 nm lasers, which is in accordance with the results reported by Tan et al. [39]. We tried to fit and decompose this overlapping peak signal and obtain a few peaks of different Raman shifts. Further analysis was achieved by comparing the intensity of each peak of different types of Au nanopillar arrays.
The Peakfit program embedded inside MATLAB was chosen here. The Peakfit algorithm relies on the first derivative to find peaks and resolve signals [5]. Using the Peakfit algorithm, the SERS spectra of the performed background subtraction were fitted to three Lorentzian line shapes and a Gaussian, and the Raman spectrum of R6G on a silicon wafer was fitted to three Lorentzian line shapes. The result of the fitting is shown in Figure 5a–d.
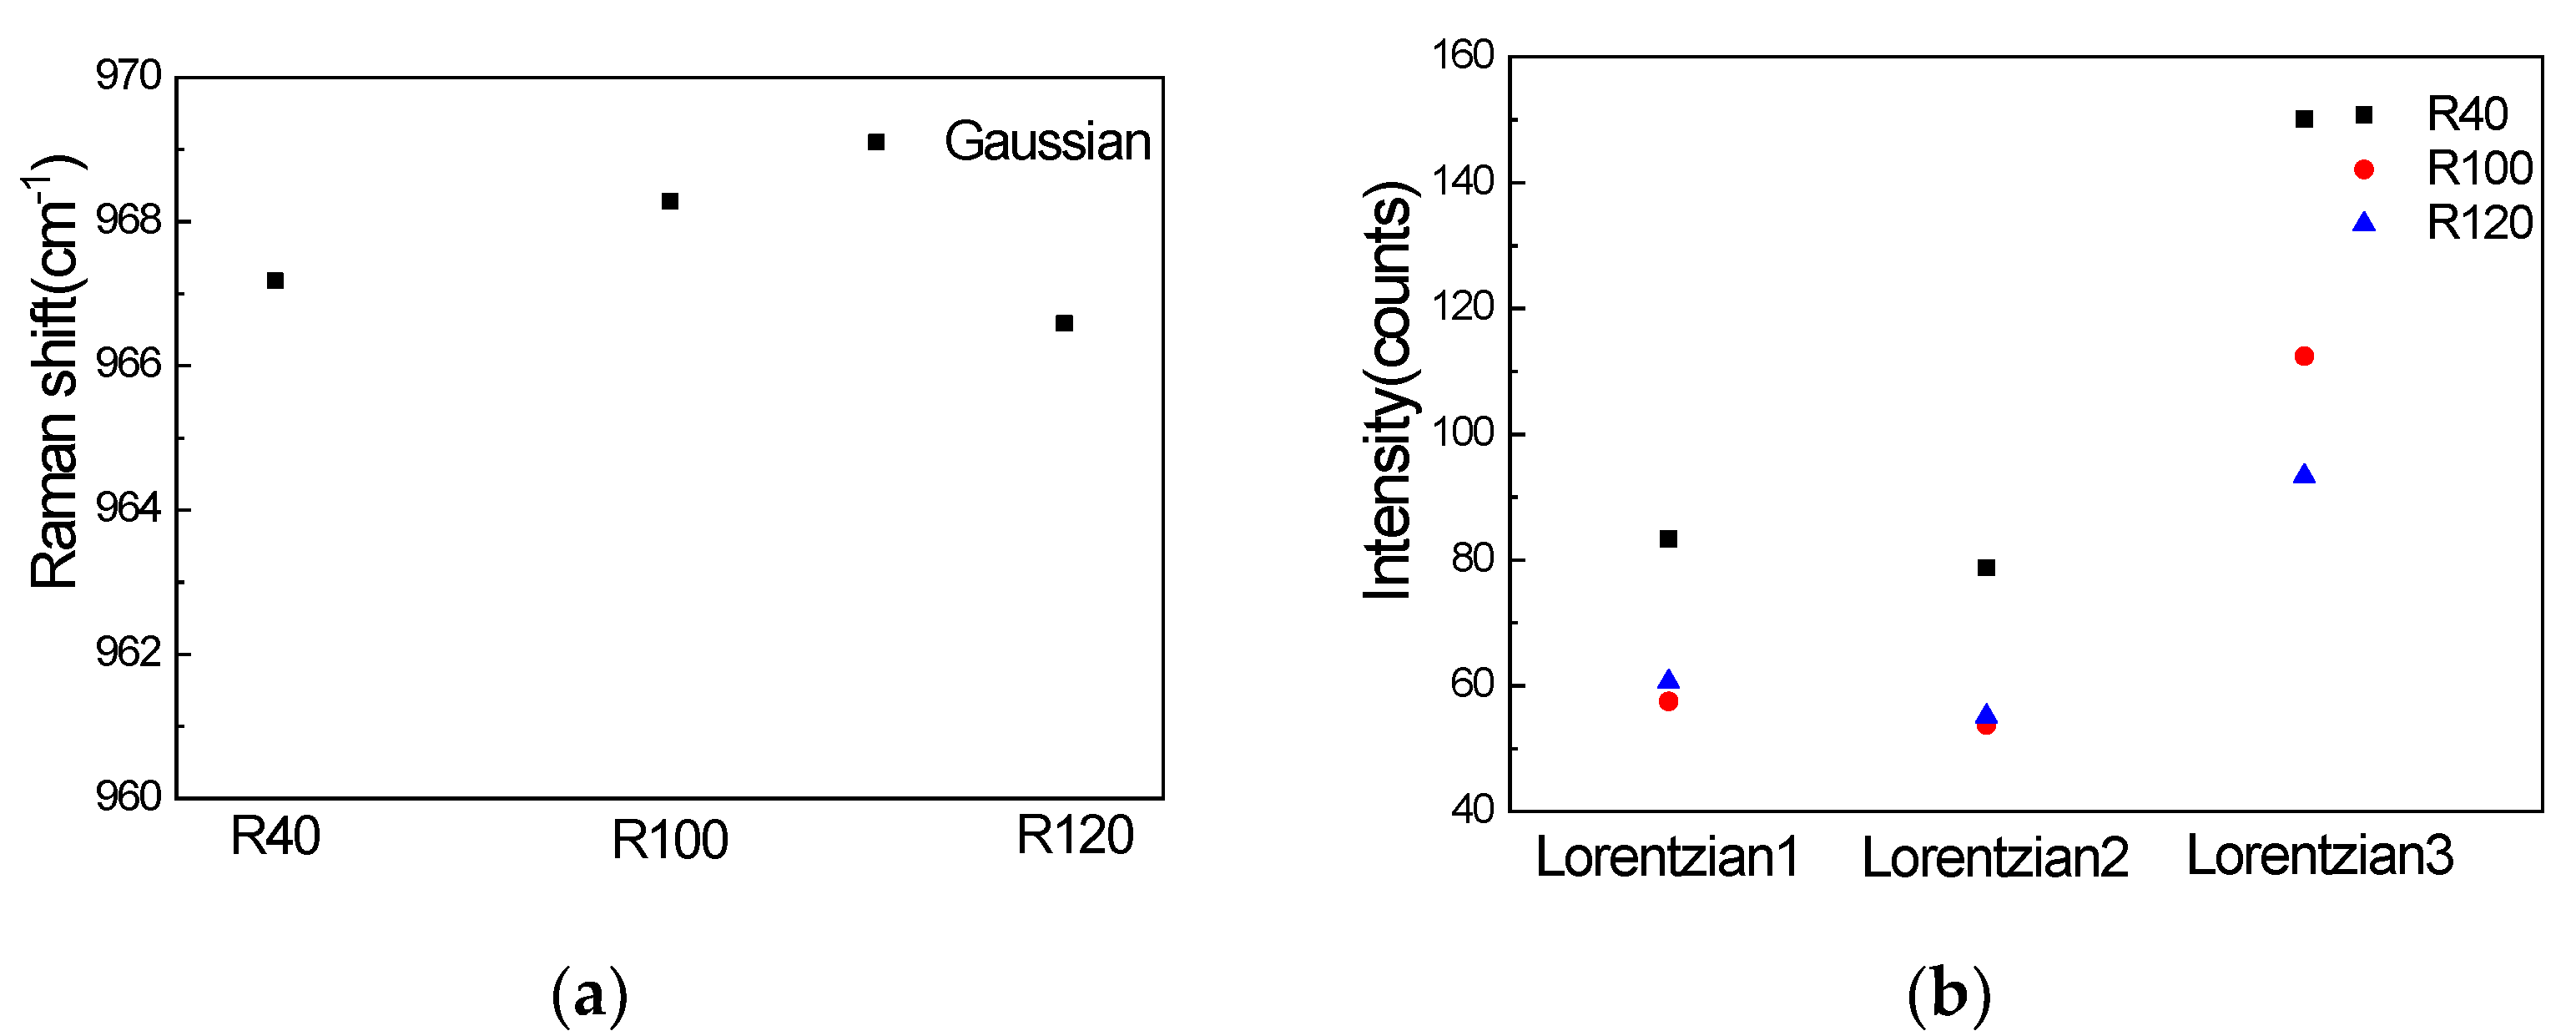
Comparing the peak positions of the Gaussian signal, which are shown in Figure 6a, it can be concluded that under the same laser (458 nm) and other conditions, the difference in the nanopillar array will not affect the peak positions of the Gaussian signal. Figure 6b shows the peak height of the three fitted Lorentzian profiles. By comparing the peak heights of the three nanopillar arrays, we can see that the intensity of the three peak heights of R40 is the strongest, the intensity of Lorentzian1 and Lorentzian2 of R100 and R120 are almost the same, and the intensity of Lorentzian3 of R100 is stronger than R120.
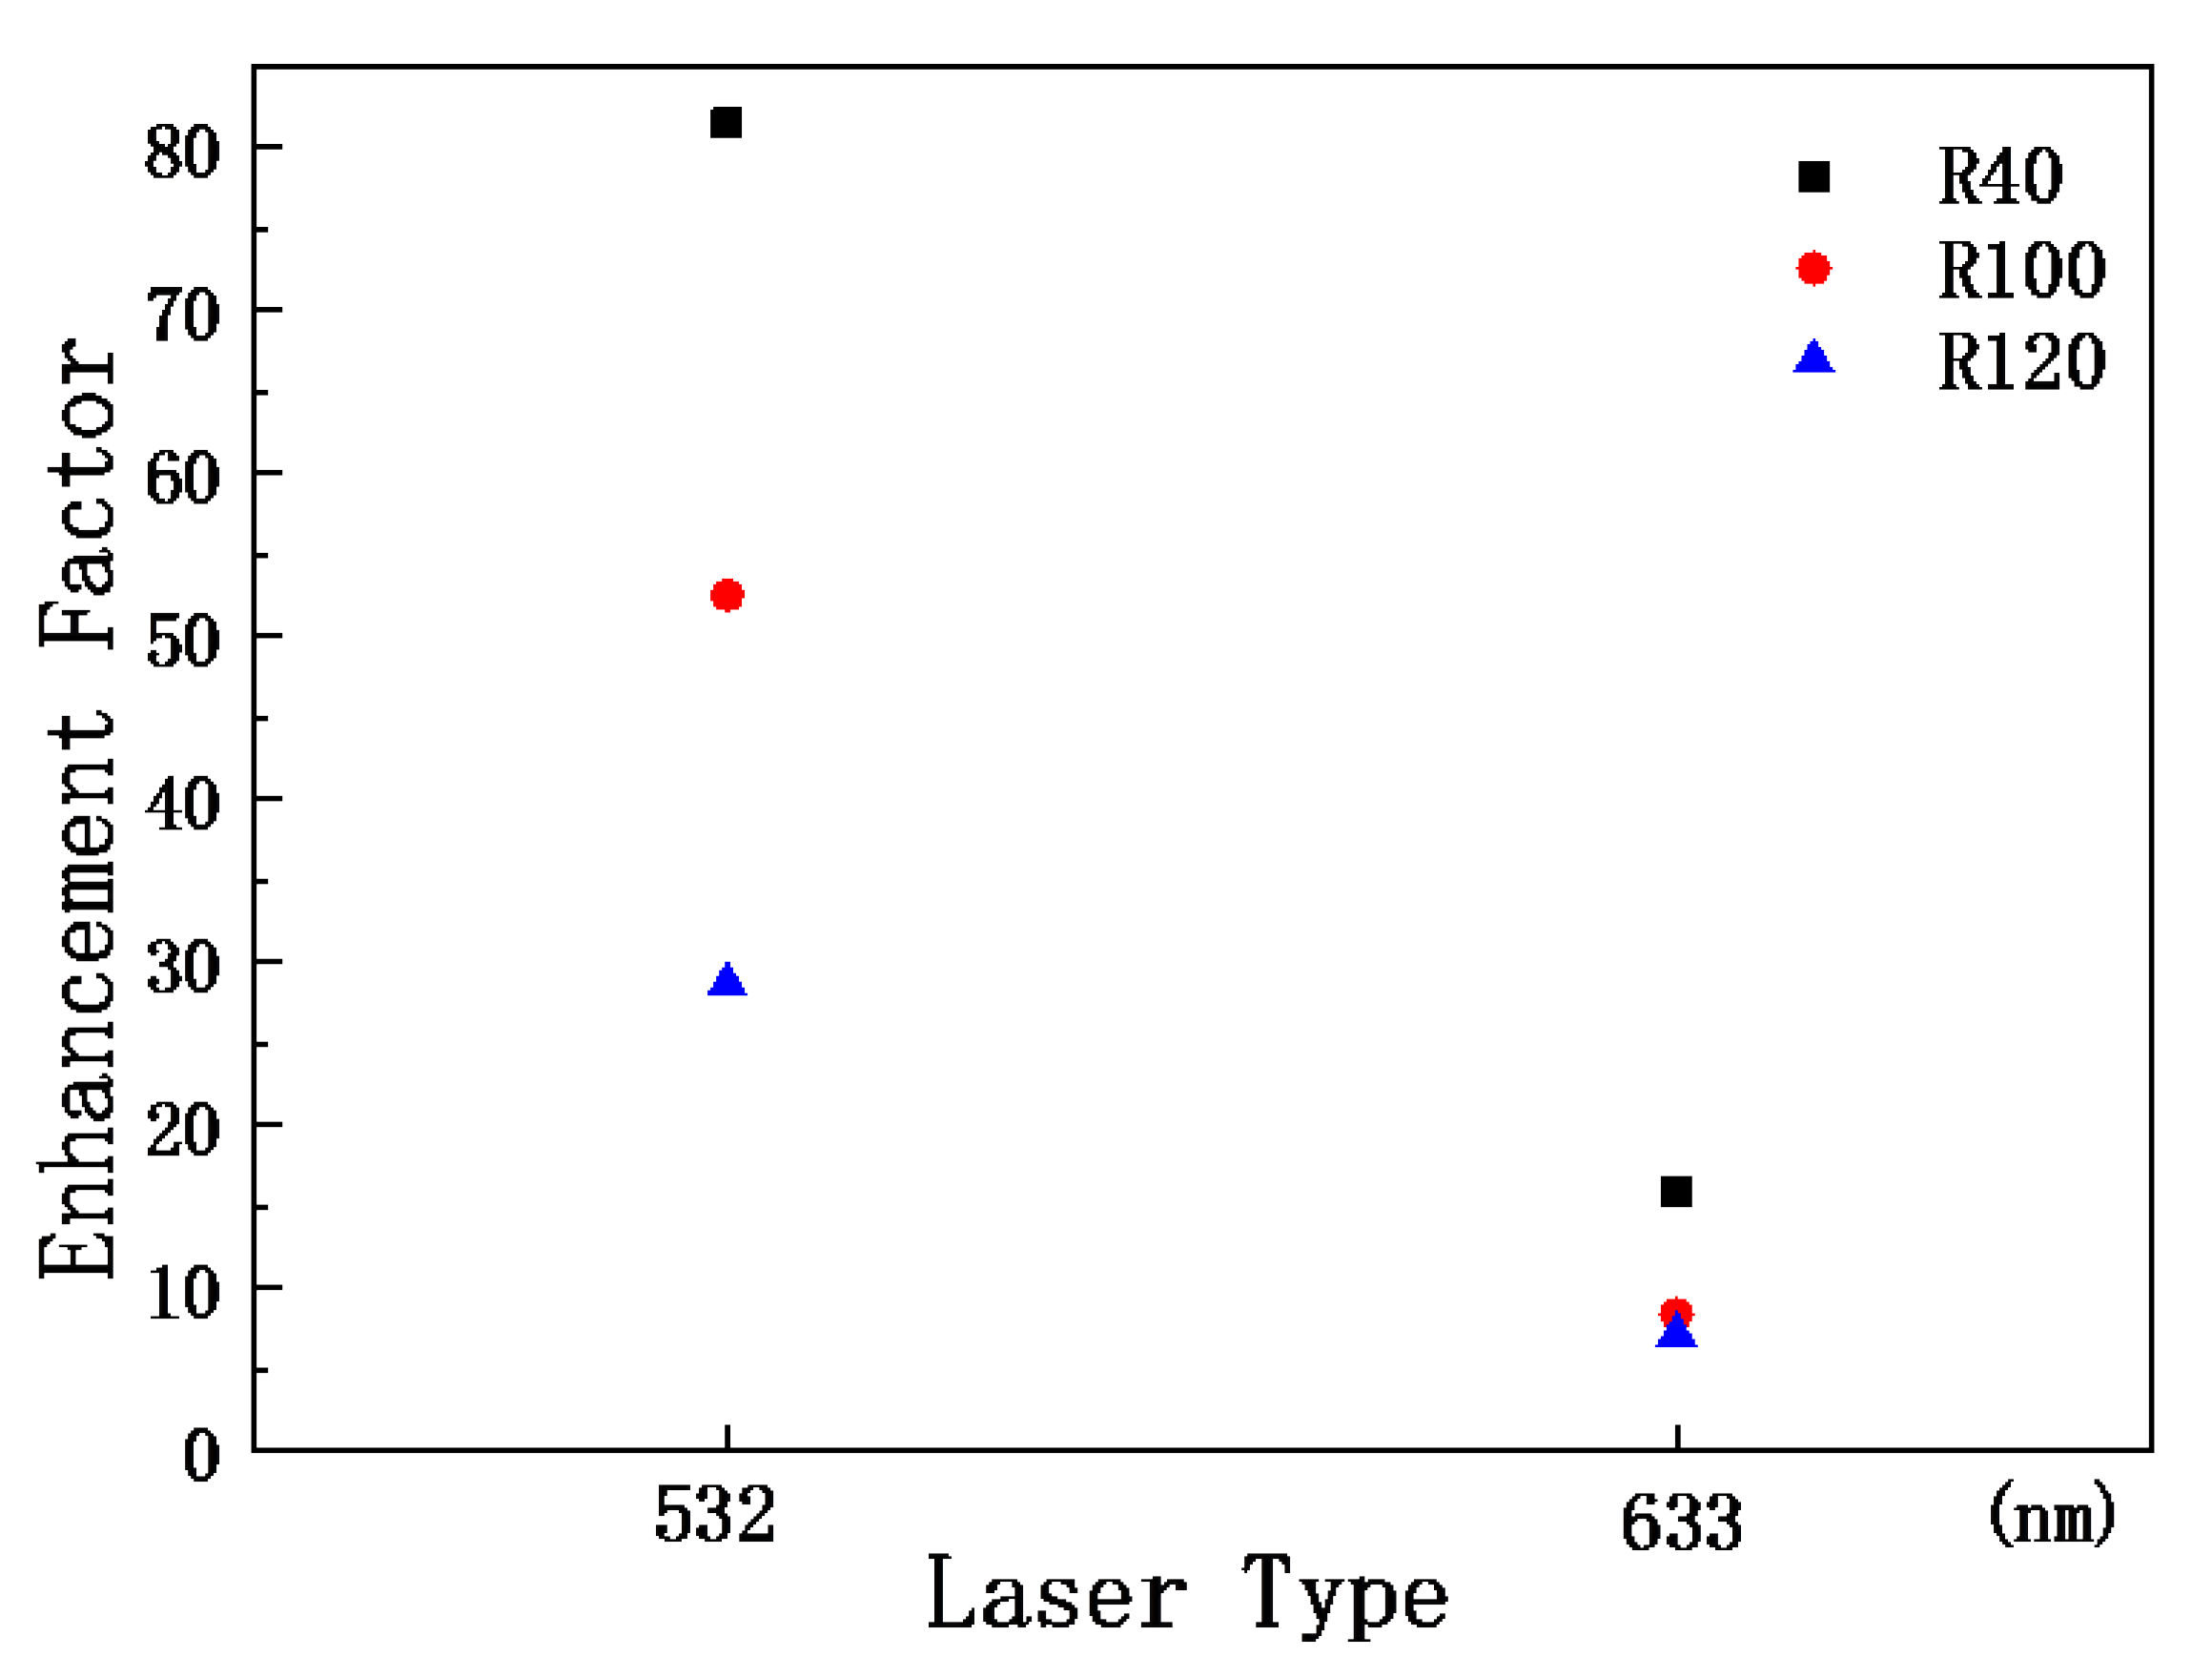
4.3. Enhancement Factors
To quantify the SERS enhancement using the three samples, the peak at 772 cm−1 was used to calculate the SERS EFs using the following equation:
where INR and ISERS are the peak intensities for the Raman spectra of R6G from the silicon wafer and the nanostructured template.
Figure 7 shows the EFs of three nanostructures at 772 cm−1. By comparing the EFs, it can be determined that the R100 nanopillar array has the greatest enhancement with respect to the Raman signal of R6G.
5. Conclusions
In this work, the SERS signals of R6G adsorbed on three nanostructured templates and a silicon wafer were measured, which were excited by the 458 nm, 532 nm, and 633 nm laser beams. The photoluminescence spectra of R6G on the three samples produced by a 458 nm laser beam were recorded. The EFs of the three nanostructures at 772 cm−1 were obtained. Comparing the intensity of the SERS signals, the R40 sample has the strongest signal excited by the 458 nm laser, the R100 sample has the strongest signal excited by the 532 nm laser, and the R40 sample has the strongest signal excited by the 633 nm laser. The EF of the R40 sample is the maximum among the three nanostructured templates. The SERS spectra of the performed background subtraction were fitted to three Lorentzian line shapes and a Gaussian. The difference in the nanopillar array has no effect on the peak positions of the Gaussian signal. The optical measurements of the SERS signal enhancements using our designed SERS templates for other dyes will be performed soon. The enhancement factors and the limit-of-detection values for various concentrations with the R6G dye will also be investigated. Nanostructured templates at 785 nm for biological samples will be prepared in the near future. The proposed nanostructured template can be applied to biological samples and this research is ongoing.
Author Contributions
Conceptualization, J.L., X.C. and H.-C.C.; Data Measurement, J.L. and Y.X.; Data Analysis, J.L., X.X. and R.L.; Writing and Supervision, H.-C.C. All authors have read and agreed to the published version of the manuscript.
Funding
Fundamental Research Funds for the Central Universities, China (DUT18RC(3)047 and DUT20RC(5)028).
Institutional Review Board Statement
Not applicable.
Informed Consent Statement
Not applicable.
Data Availability Statement
The data presented in this study are available on request from the corresponding author.
Conflicts of Interest
The authors declare no conflict of interest.
References
- Li, A.; Lin, J.; Huang, Z.; Wang, X.; Guo, L. Surface-Enhanced Raman Spectroscopy on Amorphous Semiconducting Rhodium Sulfide Microbowl Substrates. Iscience 2018, 10, 1–10. [Google Scholar] [CrossRef] [PubMed] [Green Version]
- Fleischmann, M.; Hendra, P.J.; McQuillan, A.J. Raman spectra of pyridine adsorbed at a silver electrode. Chem. Phys. Lett. 1974, 26, 163–166. [Google Scholar] [CrossRef]
- Schatz, G.C.; Van Duyne, R.P. Electromagnetic mechanism of surface-enhanced spectroscopy. Handb. Vib. Spectrosc. 2002, 1, 759–774. [Google Scholar]
- Jensen, L.; Aikens, C.M.; Schatz, G.C. Electronic structure methods for studying surface-enhanced Raman scattering. Chem. Soc. Rev. 2008, 37, 1061–1073. [Google Scholar] [CrossRef] [PubMed]
- Hakonen, A.; Svedendahl, M.; Ogier, R.; Yang, Z.-J.; Lodewijks, K.; Verre, R.; Shegai, T.; Andersson, P.O.; Käll, M.J. Dimer-on-mirror SERS substrates with attogram sensitivity fabricated by colloidal lithography. Nanoscale 2015, 7, 9405–9410. [Google Scholar] [CrossRef] [Green Version]
- Yan, B.; Thubagere, A.; Premasiri, W.R.; Ziegler, L.D.; Dal Negro, L.; Reinhard, B.M. Engineered SERS substrates with multiscale signal enhancement: Nanoparticle cluster arrays. ACS Nano 2009, 3, 1190–1202. [Google Scholar] [CrossRef]
- Zhu, Z.; Yu, M.; Jin, Y. Surface-enhanced Raman scattering sensor based on the Ag-Zn (OH) F network. Chem. Lett. 2016, 45, 595–597. [Google Scholar] [CrossRef]
- Yang, H.; He, L.Q.; Hu, Y.W.; Lu, X.; Li, G.R.; Liu, B.; Ren, B.; Tong, Y.; Fang, P.P. Quantitative detection of photothermal and photoelectrocatalytic effects induced by SPR from Au@ Pt nanoparticles. Angew. Chem. Int. Ed. 2015, 54, 11462–11466. [Google Scholar] [CrossRef]
- Herrera, G.M.; Padilla, A.C.; Hernandez-Rivera, S.P. Surface enhanced Raman scattering (SERS) studies of gold and silver nanoparticles prepared by laser ablation. Nanomaterials 2013, 3, 158–172. [Google Scholar] [CrossRef] [Green Version]
- Freeman, R.G.; Grabar, K.C.; Allison, K.J.; Bright, R.M.; Davis, J.A.; Guthrie, A.P.; Hommer, M.B.; Jackson, M.A.; Smith, P.C.; Walter, D.G. Self-assembled metal colloid monolayers: An approach to SERS substrates. Science 1995, 267, 1629–1632. [Google Scholar] [CrossRef]
- Sánchez-Iglesias, A.; Aldeanueva-Potel, P.; Ni, W.; Pérez-Juste, J.; Pastoriza-Santos, I.; Alvarez-Puebla, R.A.; Mbenkum, B.N.; Liz-Marzán, L.M. Chemical seeded growth of Ag nanoparticle arrays and their application as reproducible SERS substrates. Nano Today 2010, 5, 21–27. [Google Scholar] [CrossRef]
- Israelsen, N.D.; Hanson, C.; Vargis, E. Nanoparticle properties and synthesis effects on surface-enhanced Raman scattering enhancement factor: An introduction. Sci. World J. 2015, 2015, 124582. [Google Scholar] [CrossRef] [Green Version]
- Tian, F.; Bonnier, F.; Casey, A.; Shanahan, A.E.; Byrne, H.J. Surface enhanced Raman scattering with gold nanoparticles: Effect of particle shape. Anal. Methods 2014, 6, 9116–9123. [Google Scholar] [CrossRef] [Green Version]
- Zuo, Z.; Zhu, K.; Ning, L.; Cui, G.; Qu, J.; Cheng, Y.; Wang, J.; Shi, Y.; Xu, D.; Xin, Y. Highly sensitive surface enhanced Raman scattering substrates based on Ag decorated Si nanocone arrays and their application in trace dimethyl phthalate detection. Appl. Surf. Sci. 2015, 325, 45–51. [Google Scholar] [CrossRef]
- Zhu, C.; Meng, G.; Huang, Q.; Zhang, Z.; Xu, Q.; Liu, G.; Huang, Z.; Chu, Z. Ag nanosheet-assembled micro-hemispheres as effective SERS substrates. Chem. Commun. 2011, 47, 2709–2711. [Google Scholar] [CrossRef]
- Li, Z.; Meng, G.; Huang, Q.; Hu, X.; He, X.; Tang, H.; Wang, Z.; Li, F. Ag Nanoparticle-Grafted PAN-Nanohump Array Films with 3D High-Density Hot Spots as Flexible and Reliable SERS Substrates. Small 2015, 11, 5452–5459. [Google Scholar] [CrossRef]
- Yue, W.; Wang, Z.; Yang, Y.; Chen, L.; Syed, A.; Wong, K.; Wang, X.J. Electron-beam lithography of gold nanostructures for surface-enhanced Raman scattering. J. Micromech. Microeng. 2012, 22, 125007. [Google Scholar] [CrossRef]
- Zhang, Q.; Lee, Y.H.; Phang, I.Y.; Lee, C.K.; Ling, X.Y. Hierarchical 3D SERS Substrates Fabricated by Integrating Photolithographic Microstructures and Self-Assembly of Silver Nanoparticles. Small 2014, 10, 2703–2711. [Google Scholar] [CrossRef]
- Kahraman, M.; Daggumati, P.; Kurtulus, O.; Seker, E.; Wachsmann-Hogiu, S. Fabrication and characterization of flexible and tunable plasmonic nanostructures. Sci. Rep. 2013, 3, 1–9. [Google Scholar] [CrossRef] [Green Version]
- Cintra, S.; Abdelsalam, M.E.; Bartlett, P.N.; Baumberg, J.J.; Kelf, T.A.; Sugawara, Y.; Russell, A.E. Sculpted substrates for SERS. Faraday Discuss. 2006, 132, 191–199. [Google Scholar] [CrossRef]
- Lu, S.; You, T.; Gao, Y.; Yang, N.; Zhang, C.; Yin, P. Rapid fabrication of three-dimensional flower-like gold microstructures on flexible substrate for SERS applications. Spectrochim. Acta Part A Mol. Biomol. Spectrosc. 2019, 212, 371–379. [Google Scholar] [CrossRef] [PubMed]
- Sinha, G.; Depero, L.E.; Alessandri, I. Recyclable SERS substrates based on Au-coated ZnO nanorods. ACS Appl. Mater. Interfaces 2011, 3, 2557–2563. [Google Scholar] [CrossRef] [PubMed]
- Liu, B.; Bai, C.; Zhao, D.; Liu, W.-L.; Ren, M.-M.; Liu, Q.-Z.; Yang, Z.-Z.; Wang, X.-Q.; Duan, X.-L. Novel ferroferric oxide/polystyrene/silver core–shell magnetic nanocomposite microspheres as regenerable substrates for surface-enhanced Raman scattering. Appl. Surf. Sci. 2016, 364, 628–635. [Google Scholar] [CrossRef]
- Cong, S.; Wang, Z.; Gong, W.; Chen, Z.; Lu, W.; Lombardi, J.R.; Zhao, Z. Electrochromic semiconductors as colorimetric SERS substrates with high reproducibility and renewability. Nat. Commun. 2019, 10, 1–10. [Google Scholar] [CrossRef] [PubMed]
- Zhou, Q.; Meng, G.; Wu, N.; Zhou, N.; Chen, B.; Li, F.; Huang, Q. Dipping into a drink: Basil-seed supported silver nanoparticles as surface-enhanced Raman scattering substrates for toxic molecule detection. Sensors Actuators B Chem. 2016, 223, 447–452. [Google Scholar] [CrossRef] [Green Version]
- Li, Z.; Huang, X.; Lu, G.J. Recent developments of flexible and transparent SERS substrates. J. Mater. Chem. C 2020, 8, 3956–3969. [Google Scholar] [CrossRef]
- Guo, J.; Xu, S.; Liu, X.; Li, Z.; Hu, L.; Li, Z.; Chen, P.; Ma, Y.; Jiang, S.; Ning, T. Graphene oxide-Ag nanoparticles-pyramidal silicon hybrid system for homogeneous, long-term stable and sensitive SERS activity. Appl. Surf. Sci. 2017, 396, 1130–1137. [Google Scholar] [CrossRef]
- Zhao, Y.; Yang, D.; Li, X.; Liu, Y.; Hu, X.; Zhou, D.; Lu, Y. Toward highly sensitive surface-enhanced Raman scattering: The design of a 3D hybrid system with monolayer graphene sandwiched between silver nanohole arrays and gold nanoparticles. Nanoscale 2017, 9, 1087–1096. [Google Scholar] [CrossRef]
- Ouyang, L.; Hu, Y.; Zhu, L.; Cheng, G.J.; Irudayaraj, J. A reusable laser wrapped graphene-Ag array based SERS sensor for trace detection of genomic DNA methylation. Biosens. Bioelectron. 2017, 92, 755–762. [Google Scholar] [CrossRef] [Green Version]
- Keshavarz, M.; Tan, B.; Venkatakrishnan, K. Label-Free SERS Quantum Semiconductor Probe for Molecular-Level and in Vitro Cellular Detection: A Noble-Metal-Free Methodology. ACS Appl. Mater. Interfaces 2018, 10, 34886–34904. [Google Scholar] [CrossRef]
- Keshavarz, M.; Chowdhury, A.K.M.R.H.; Kassanos, P.; Tan, B.; Venkatakrishnan, K. Self-assembled N-doped Q-dot carbon nanostructures as a SERS-active biosensor with selective therapeutic functionality. Sens. Actuators B Chem. 2020, 323, 128703. [Google Scholar] [CrossRef]
- Benford, M.E.; Chou, I.-H.; Beier, H.T.; Wang, M.; Kameoka, J.; Good, T.A.; Coté, G.L. In vitro detection of beta amyloid exploiting surface enhanced Raman scattering (SERS) using a nanofluidic biosensor. In Proceedings of the SPIE BiOS, San Jose, CA, USA, 19–24 January 2008; p. 68690W. [Google Scholar]
- Lyandres, O.; Yuen, J.M.; Shah, N.C.; VanDuyne, R.P.; Walsh Jr, J.T.; Glucksberg, M.R. Progress toward an in vivo surface-enhanced Raman spectroscopy glucose sensor. Diabetes Technol. Ther. 2008, 10, 257–265. [Google Scholar] [CrossRef] [Green Version]
- Brosseau, C.L.; Casadio, F.; Van Duyne, R.P. Revealing the invisible: Using surface-enhanced Raman spectroscopy to identify minute remnants of color in Winslow Homer’s colorless skies. J. Raman Spectrosc. 2011, 42, 1305–1310. [Google Scholar] [CrossRef]
- Carron, K.; Peitersen, L.; Lewis, M. Octadecylthiol-modified surface-enhanced Raman spectroscopy substrates: A new method for the detection of aromatic compounds. Environ. Sci. Technol. 1992, 26, 1950–1954. [Google Scholar] [CrossRef]
- Zhou, Z.; Lu, J.; Wang, J.; Zou, Y.; Liu, T.; Zhang, Y.; Liu, G.; Tian, Z. Trace detection of polycyclic aromatic hydrocarbons in environmental waters by SERS. Spectrochim. Acta Part A Mol. Biomol. Spectrosc. 2020, 234, 118250. [Google Scholar] [CrossRef]
- Xu, M.-L.; Gao, Y.; Han, X.X.; Zhao, B. Detection of pesticide residues in food using surface-enhanced Raman spectroscopy: A review. Agric. Food Chem. 2017, 65, 6719–6726. [Google Scholar] [CrossRef]
- Jensen, L.; Schatz, G.C. Resonance Raman scattering of rhodamine 6G as calculated using time-dependent density functional theory. J. Phys. Chem. A 2006, 110, 5973–5977. [Google Scholar] [CrossRef]
- Tan, T.; Tian, C.; Ren, Z.; Yang, J.; Chen, Y.; Sun, L.; Li, Z.; Wu, A.; Yin, J.; Fu, H. LSPR-dependent SERS performance of silver nanoplates with highly stable and broad tunable LSPRs prepared through an improved seed-mediated strategy. Phys. Chem. Chem. Phys. 2013, 15, 21034–21042. [Google Scholar] [CrossRef]
- Gersten, J.I. The effect of surface roughness on surface enhanced Raman scattering. J. Chem. Phys. 1980, 72, 5779–5780. [Google Scholar] [CrossRef]
- Gonçalves, M.; Marti, O. Influence of the roughness of metal templates on surface enhanced Raman scattering. In Proceedings of the Conference on nanophotonics III, Brussels, Belgium, 10 May 2010; p. 77120L. [Google Scholar]
- Mo, Y.; Mörke, I.; Wachter, P. Surface enhanced Raman scattering of pyridine on silver surfaces of different roughness. Surf. Sci. 1983, 133, L452–L458. [Google Scholar] [CrossRef]
- Zhang, Y.; Wang, L.-M.; Tan, E.-Z.; Yang, S.-H.; Li, L.-D.; Guo, L. Uniform arrays of gold nanoparticles with different surface roughness for surface enhanced Raman scattering. J. Chin. Chem. Lett. 2015, 26, 1426–1430. [Google Scholar] [CrossRef]
Figure 1.
(a) The design of R40 sample, (b) the structure of R100 sample, (c) the structure of R120 sample, (d) the SEM images of R40 sample, (e) the SEM images of R100 sample, and (f) the SEM images of R120 sample.
Figure 1.
(a) The design of R40 sample, (b) the structure of R100 sample, (c) the structure of R120 sample, (d) the SEM images of R40 sample, (e) the SEM images of R100 sample, and (f) the SEM images of R120 sample.

Figure 2.
The photoluminescence spectrum of R6G on three nanostructured templates (laser beam is 458 nm).
Figure 2.
The photoluminescence spectrum of R6G on three nanostructured templates (laser beam is 458 nm).

Figure 3.
(a) SERS signals of R6G adsorbed on three structures, which were excited by the 458 nm laser; (b) SERS signals of R6G adsorbed on four structures, which were excited by the 532 nm laser; (c) SERS signals of R6G adsorbed on four structures, which were excited by the 633 nm laser.
Figure 3.
(a) SERS signals of R6G adsorbed on three structures, which were excited by the 458 nm laser; (b) SERS signals of R6G adsorbed on four structures, which were excited by the 532 nm laser; (c) SERS signals of R6G adsorbed on four structures, which were excited by the 633 nm laser.

Figure 4.
The optical intensity distributions for different SERS templates (R40, R100, and R120) under three excitation wavelengths (λ = 458 nm, 532 nm, and 633 nm).
Figure 4.
The optical intensity distributions for different SERS templates (R40, R100, and R120) under three excitation wavelengths (λ = 458 nm, 532 nm, and 633 nm).

Figure 5.
(a) SERS signals of R40 with three Lorentzian line shapes and a Gaussian, (b) SERS signals of R100 with three Lorentzian line shapes and a Gaussian, (c) SERS signals of R120 with three Lorentzian line shapes and a Gaussian, and (d) the Raman spectrum of R6G on a silicon wafer with three Lorentzian line shapes.

Figure 6.
(a) Gaussian peak positions of three types of nanopillar array; (b) peak height of three fitting Lorentzian profiles.
Figure 6.
(a) Gaussian peak positions of three types of nanopillar array; (b) peak height of three fitting Lorentzian profiles.

Figure 7.
The enhancement factors 772 cm−1 peak of R6G on three nanostructured templates.

Publisher’s Note: MDPI stays neutral with regard to jurisdictional claims in published maps and institutional affiliations. |
© 2022 by the authors. Licensee MDPI, Basel, Switzerland. This article is an open access article distributed under the terms and conditions of the Creative Commons Attribution (CC BY) license (https://creativecommons.org/licenses/by/4.0/).
Share and Cite
MDPI and ACS Style
Li, J.; Li, R.; Xu, Y.; Xue, X.; Chen, X.; Chui, H.-C. The Wavelength-Dependent SERS Template Based on a Nanopillar Array. Materials 2022, 15, 7446. https://0-doi-org.brum.beds.ac.uk/10.3390/ma15217446
AMA Style
Li J, Li R, Xu Y, Xue X, Chen X, Chui H-C. The Wavelength-Dependent SERS Template Based on a Nanopillar Array. Materials. 2022; 15(21):7446. https://0-doi-org.brum.beds.ac.uk/10.3390/ma15217446
Chicago/Turabian StyleLi, Jiayi, Rui Li, Ying Xu, Xiaojun Xue, Xiaoming Chen, and Hsiang-Chen Chui. 2022. "The Wavelength-Dependent SERS Template Based on a Nanopillar Array" Materials 15, no. 21: 7446. https://0-doi-org.brum.beds.ac.uk/10.3390/ma15217446
Note that from the first issue of 2016, this journal uses article numbers instead of page numbers. See further details here.