
SAW Hydrogen Sensors with Pd/SnO2 Layers

1
Laser Department, National Institute for Laser, Plasma and Radiation Physics, Atomistilor 409, RO-077125 Magurele, Romania
2
Faculty of Chemical Engineering and Biotechnologies, University Politehnica of Bucharest, RO-011061 Bucharest, Romania
*
Author to whom correspondence should be addressed.
Materials 2022, 15(22), 8012; https://0-doi-org.brum.beds.ac.uk/10.3390/ma15228012
Submission received: 12 October 2022
/
Revised: 8 November 2022
/
Accepted: 11 November 2022
/
Published: 13 November 2022
(This article belongs to the Special Issue Thin Layers Synthesis by Laser Methods)
Abstract
:Pd/SnO2 bilayers for surface acoustic wave (SAW) sensors were obtained using pulsed laser deposition (PLD). Bilayers were made at several deposition pressures in order to observe the influence of the morphology of the sensitive films on the response of the sensors. The morphological properties were analyzed by scanning electron microscopy (SEM). The SnO2 monolayers were initially deposited on quartz substrates at 100, 400 and 700 mTorr, to observe their morphology at these pressures. The Pd/SnO2 bilayer depositions were made at 100 and 700 mTorr. The sensors realized with these sensitive films were tested at different hydrogen concentrations, in the range of 0.2–2%, at room temperature. In order to establish selectivity, tests for hydrogen, nitrogen, oxygen and carbon dioxide were carried out with SnO2-700, Pd-100/SnO2-700 and Pd-700/SnO2-700 sensors. The sensor with the most porous sensitive film (both films deposited at 700 mTorr) had the best results: a sensitivity of 0.21 Hz/ppm and a limit of detection (LOD) of 142 ppm. The morphology of the SnO2 film is the one that has the major influence on the sensor results, to the detriment of the Pd morphology. The use of Pd as a catalyst for hydrogen improved the sensitivity of the film considerably and the selectivity of the sensors for hydrogen.
1. Introduction
Hydrogen is considered a viable alternative for replacing fossil fuels, which have harmful effects on the environment [1]. However, for hydrogen applications in the automotive field and beyond, it is necessary to take safety measures, since at concentrations over 4% it becomes flammable and explosive [1,2]. Hydrogen is an odorless and colorless gas, which makes it difficult to detect [2,3,4]. Also, hydrogen gas leaks easily, its inflammability being explained by its ultra-small molecule size and high chemical activity [3]. Consequently, the control of hydrogen concentration in the installations that use it, as well as in surrounding areas, is an important aspect for its integration as a fuel. There is a need for devices such as sensors, which can monitor the concentration of hydrogen where it is likely to accumulate, keeping its concentration as low as possible and thus avoiding dangerous incidents [5].
A wide range of sensors for hydrogen detection have been developed to date: resistive, conductometric, chemoresistive, metal-oxide semiconductor, surface acoustic wave (SAW) sensors, etc. [6,7,8,9,10]. Each of these types of sensor has advantages and disadvantages that influence important parameters such as sensitivity, limit of detection (LOD) and response time, as well as costs of production and consumption.
Surface acoustic wave sensors stand out due to their good sensitivity, satisfactory stability, possibility of wireless operation, ease of manufacture and small size [3,11,12]. They were developed both for hydrogen and for other gases such as volatile organic compounds, ammonia and other toxic and explosive substances [11,13,14]. A SAW sensor consists in a piezoelectric substrate, two pairs of interdigital transducers, and a sensitive film placed between the interdigital transducers [5,15]. Their operating principle is based on converting an electrical input into mechanical waves, which propagate over the sensitive film surface, and are subsequently converted back into an electrical signal. In the presence of the analyte at the surface of the sensitive film, a shift in the frequency of the waves occurs, due mainly to mass accumulations or acoustoelectric interactions. Thus, the nature and the type of sensitive film are very important aspects in the design of a SAW sensor for a certain type of gas [5,15].
Semiconductor metal oxides are widely used in sensors, including hydrogen sensors. Among the advantages they present in this domain are high sensitivity due to the wide bandgap, the possibility of miniaturization, reliability and ease of processing into sensor devices [16]. ZnO, TiO2, SnO2, WO3, In2O3, are some of the semiconductor oxides with very good sensing properties [16,17,18].
SnO2 is well known for its sensing properties, making it one of the most used oxides in this field [19]. This results from the fact that it is an n-type wide band-gap semiconductor (Eg = 3.6 eV at 300 K), with excellent electrical properties and chemical stability [17,20]. Some of the disadvantages of SnO2 are the difficulty of room-temperature detection, and the lack of selectivity, since it has very good sensitivity to a wide range of materials [2,19]. One of the methods used to obtain results with a SnO2 sensor at the lowest possible concentrations is to heat the sensor and use the temperature as an energy source to increase the interaction between the film and the analyte [21]. However, this method requires a heat source. In addition, detecting hydrogen at high temperatures becomes dangerous, since it can trigger an explosion at high hydrogen concentrations. Considering previous experience in the development of sensitive materials for hydrogen detection and other results from the literature, we found that optimizing the morphology of sensitive films for sensors (in this case, SAW sensors), leads to obtaining sensors capable of detecting hydrogen at room temperature [20,22,23]. This method is based on the principle of increasing the interaction surface between the analyte and the sensitive layer [19,20]. The larger the interaction surface, the lower the LOD and the shorter the response time [2,24].
The very low selectivity of SnO2 can be compensated by combining it with a selective material [2]. In the case of hydrogen detection, it is known that metals such as Pd or Pt have catalytic properties for hydrogen [25,26,27,28,29]. Thus, in their presence, the hydrogen molecule is dissociated and its subsequent penetration into the volume of the film is favored [16,30].
One morphology suitable for obtaining good sensitivity is the porous one [2,31,32]. Pulsed laser ablation (PLD) is a deposition method allowing good control of the morphology of the deposited film [22,33]. Pulsed laser ablation permits the control of many deposition parameters: deposition pressure, laser wavelength and power, pulse repetition rate, substrate temperature, target-substrate distance, etc. [33,34]. Among the other advantages of this method are maintaining the target stoichiometry in the deposited film, the possibility of making deposits from a large category of materials and at low temperatures, ensuring purity and good film adhesion [35,36,37]. Taking these considerations into account, PLD becomes a suitable method for developing hydrogen SAW sensors with optimal porous morphology.
In previous work, we developed SAW sensors for hydrogen using PLD with different types of sensitive materials: ZnO, TiO2, WO3, Pd [18,22,23]. All these sensors were tested with good results at room temperature. It could be observed that in order to obtain sensibility for hydrogen, Pd/oxide (ZnO, TiO2, WO3) bilayer sensors have much better sensitivity and detection limits than sensors with monolayer oxide film. This improvement comes from the use of Pd as a catalyst layer for hydrogen molecules. We also observed that the porous morphology of the sensitive film improves the response of the sensors, offering better sensitivity and a shorter response time, based on the previously discussed principle [18,22,23]. Based on the above-mentioned results, and on the very good sensor properties of SnO2 presented in the literature, we proposed to develop SAW sensors for hydrogen with a bilayer structure of Pd and SnO2.
The present paper presents research on the behavior of SnO2 and Pd in different PLD deposition conditions, and the influence of these conditions on SAW sensor results in hydrogen detection. The contribution of Pd to the improvement of the sensibility and selectivity of the SAW sensors at different gas concentrations was also investigated.
2. Materials and Methods
2.1. Film Deposition and Characterization
The sensitive films were deposited using the PLD method. A Nd-YVO4 laser was used, at stable parameters of 10 ps pulse duration, 0.2 W laser power and a repetition rate of 10 kHz.
In order to study the effect of various parameters on the morphology of the sensitive film, the depositions were initially made onto quartz substrates (without interdigital transducers). Commercial SnO2 and Pd targets were used (Goodfellow, Huntingdon, UK), which were placed on computer-controlled x-y tables whose movement avoided target erosion. The substrates were placed parallel to the target, at a distance of 4 cm; the depositions were made at room temperature. The sensor substrate was positioned in a special mask, in order to limit the film deposition to the area between the interdigital transducers, and protect them from the deposition process. The depositions were carried out in two types of gas: oxygen for SnO2, and argon for Pd. Their pressure and flow were controlled by means of a system attached to the PLD deposition chamber. A throttle valve (MKS 253B) controlled by a pressure controller (MKS 600) mounted on a preliminary vacuum pump (Agilent Varian—DS602, Leini, Italy) adjusts the deposition pressure, and a mass-flow control system (MKS multigas 647, Munchen, Germany) controls the flow from the gas cylinders. The sensors and the deposition conditions are given in Table 1. The morphology of the films was analyzed by scanning electron microscopy (SEM) using a FEI QUANTA microscope (Hillsboro, OR, USA).
2.2. Sensor Structure and Testing
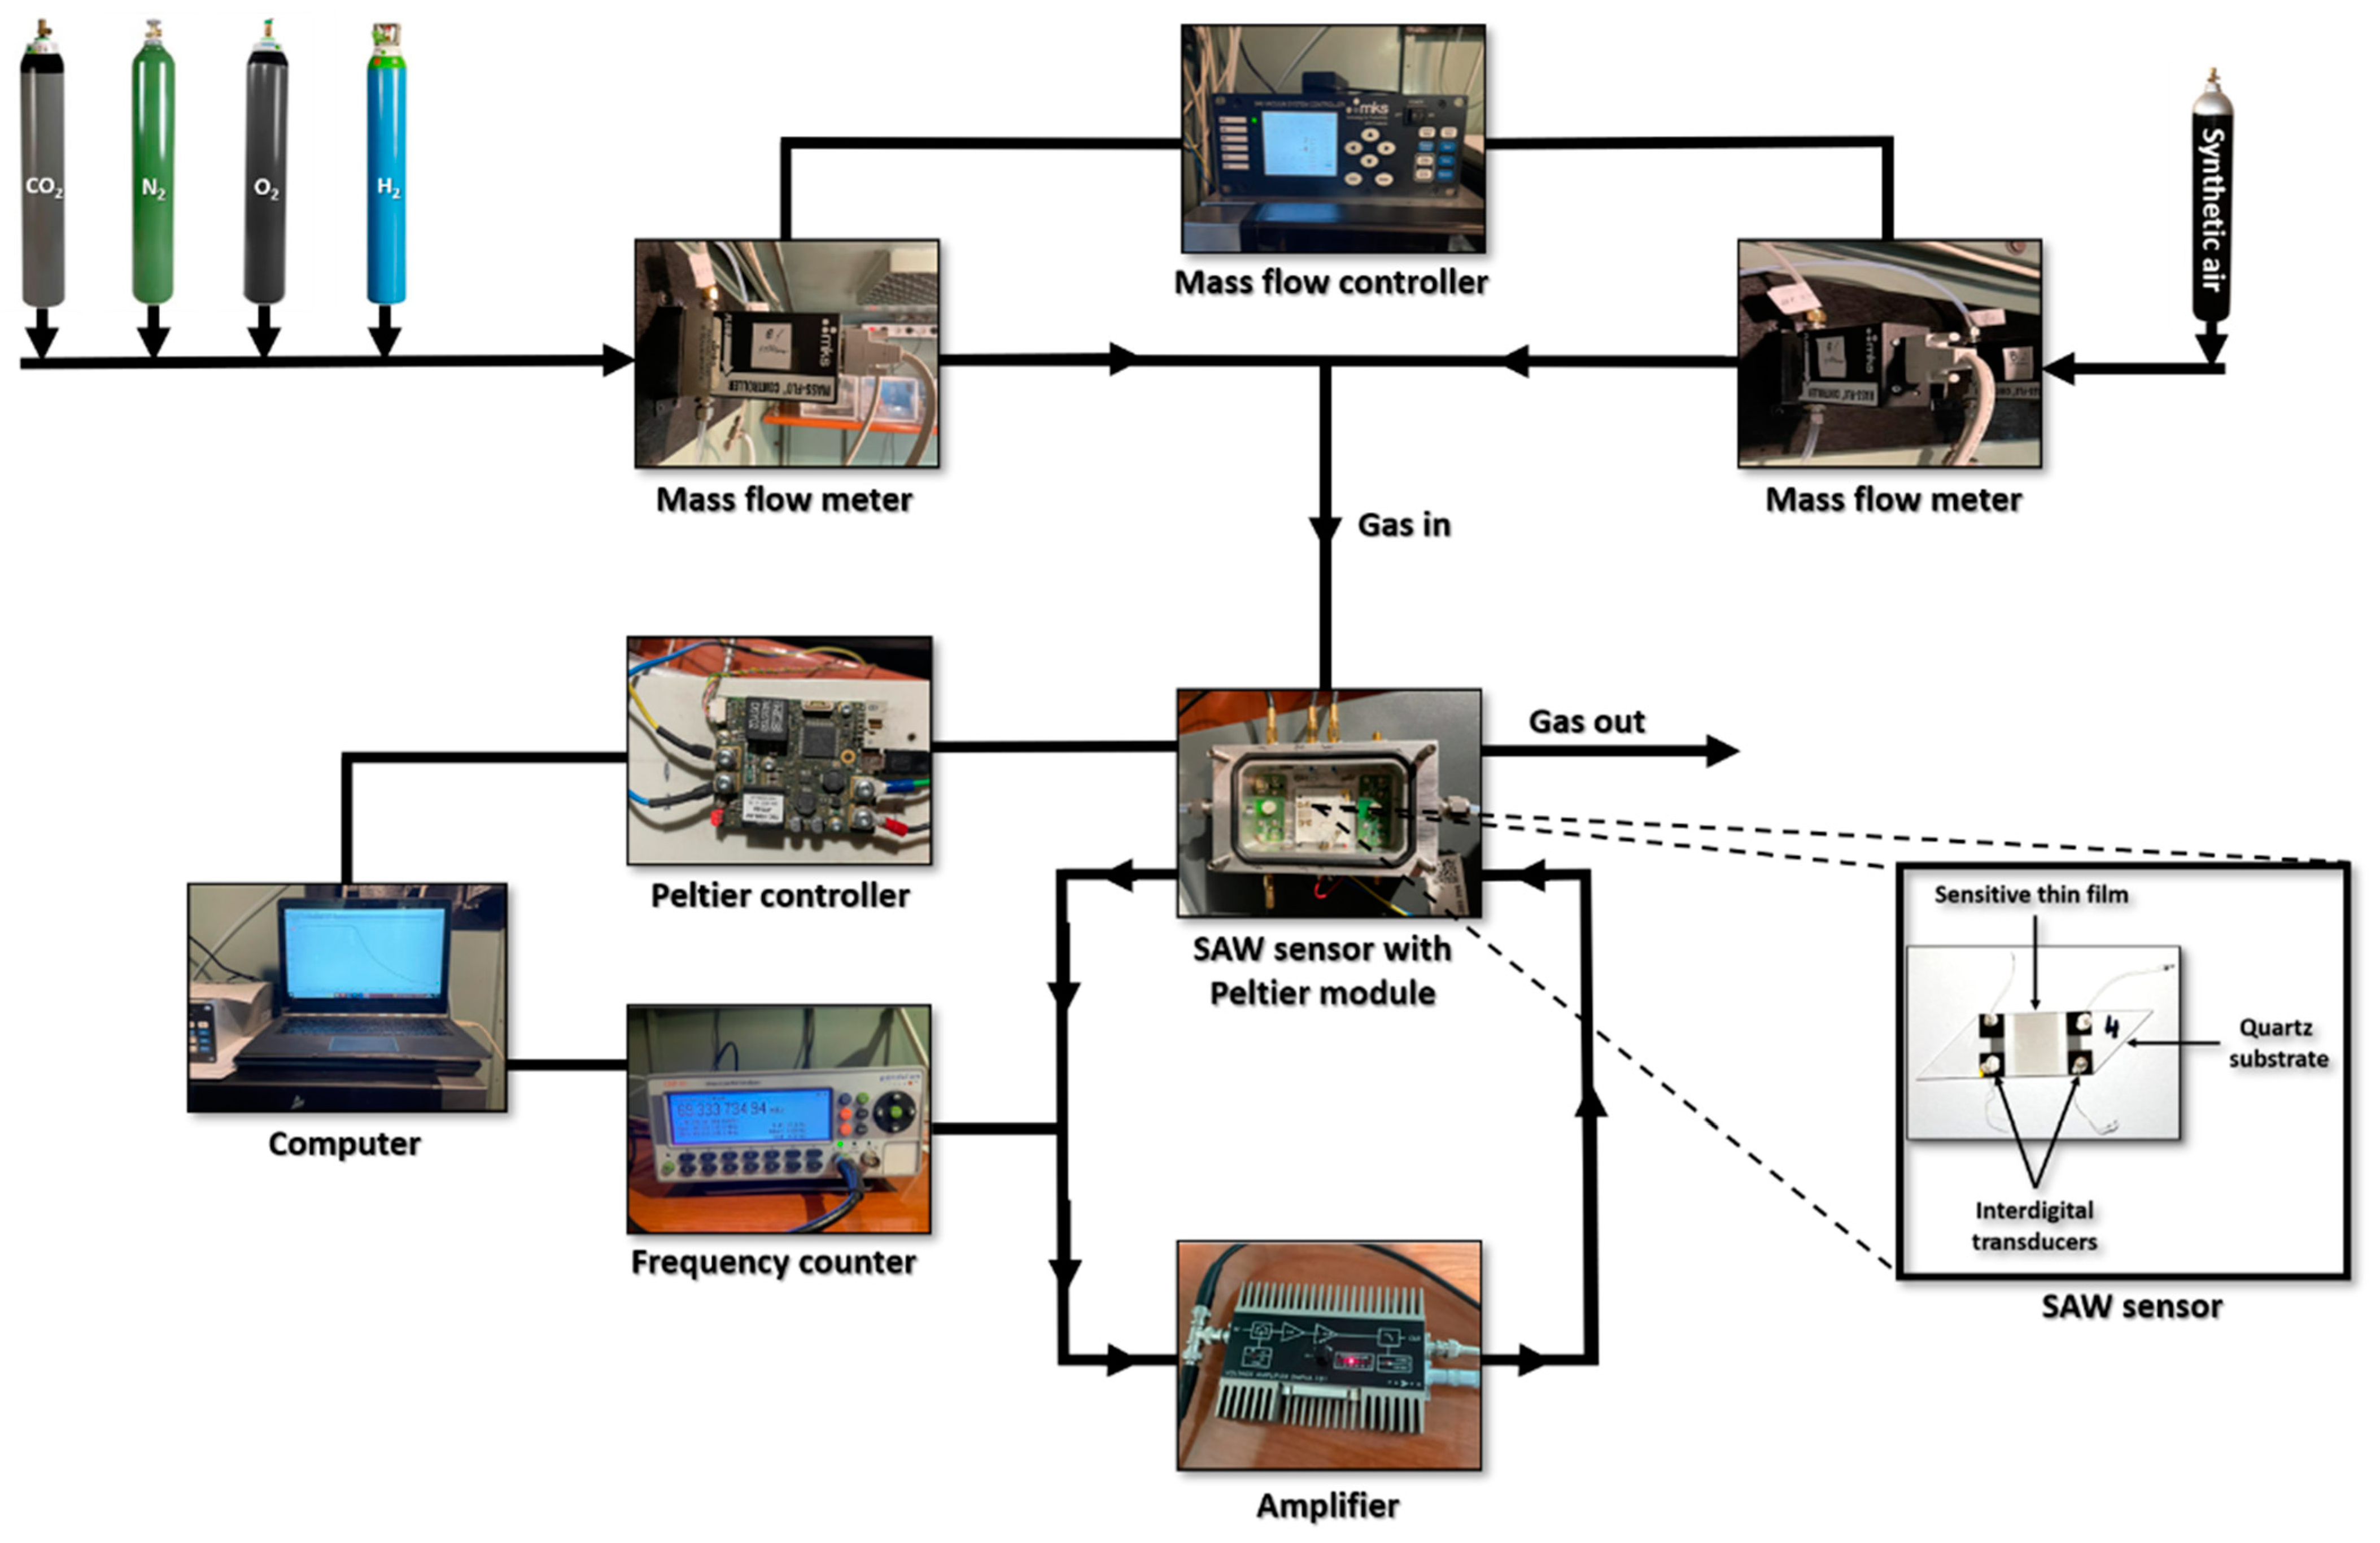
A ST-X quartz substrate was used for the SAW sensor, with a parallelogram geometry, in order to reduce unwanted reflections. There are several types of piezoelectric materials used for SAW sensors, but one advantage of the quartz substrate is its relatively low temperature coefficient in comparison to other piezoelectric materials [15]. The dimensions of the piezoelectric quartz are: 38 mm long, 10 mm wide and 0.5 mm thick. The SAW sensor is a delay-line type with the gold interdigital transducers in a double-comb configuration fabricated by photolithography. The oscillation frequency of the SAW sensors is about 69 MHz. The entire test system is presented in Figure 1. The oscillating system consists in a DHPVA amplifier (MessTechnik GmbH, Berlin, Germany) connected to a CNT-91 Pendulum frequency counter (Spectracom Corp, Rochester, NY, USA). The SAW sensors were tested at gas concentrations between 0.2% and 2%. For testing, we used a system consisting of gas cylinders, one with 100% artificial air, and the others with carbon dioxide (CO2), nitrogen (N2), oxygen (O2) and 2% H2 in synthetic air. The gas concentration in the test chamber was controlled with two mass flow meters connected to a mass flow controller. Throughout the experiments, the gas flow from the cylinders was maintained at a value of 0.5 L/min. The tests were initially carried out at room temperature, but tests were also carried out at different temperatures of the sensors. The temperature was varied in the range of 20–60 °C. The test system consisted in a Peltier element (70 W), bidirectional thermoelectric controller (TEC-1089-SV), temperature sensor for support (Pt100), computer, software interface, voltage source. This assembly allows the sensor temperature to be controlled with a precision greater than 0.01 °C.
3. Results and Discussion
3.1. Film Morphology
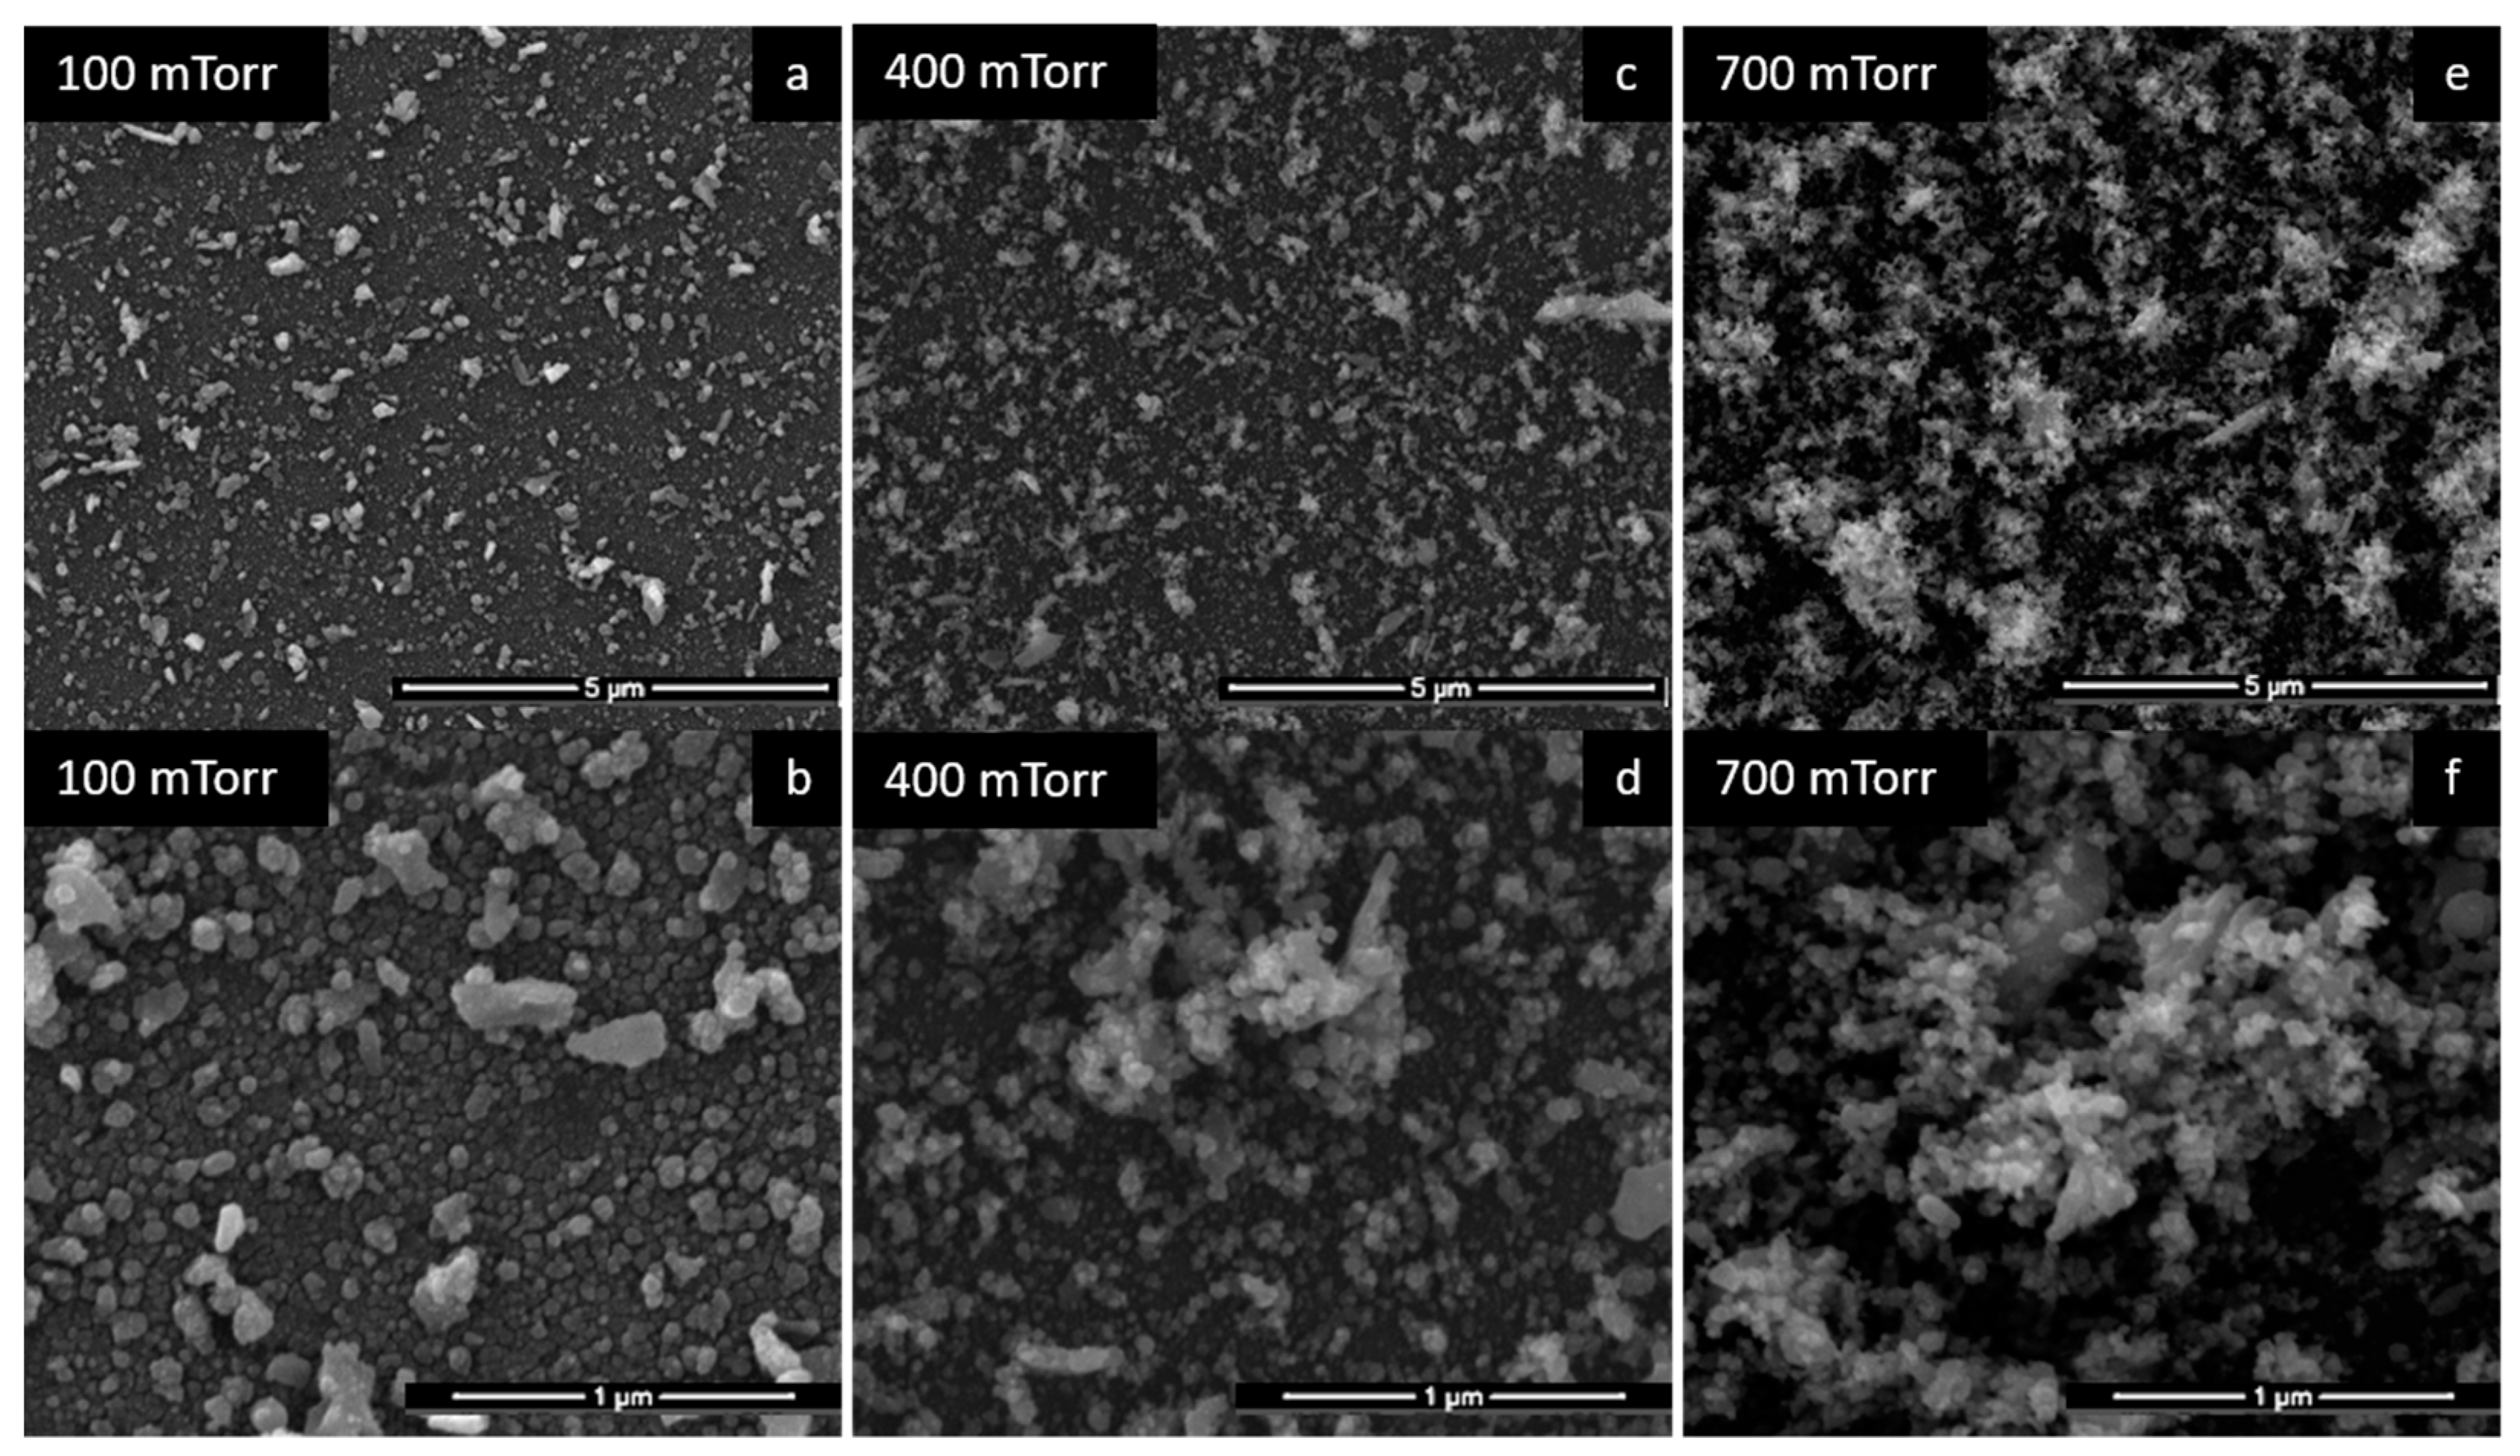
Initially, the SnO2 and Pd monolayer films were analyzed through SEM images. The variation of the gas pressure (100, 400 and 700 mTorr) during the PLD deposition of the SnO2 thin films for 2 h led to different film morphologies. The SEM images in Figure 2 show the results of the variation of deposition gas pressure on the SnO2 layer. The increase in the degree of porosity with the increase in the deposition pressure can be observed. At the pressure of 100 mTorr (Figure 2a,b), the film is denser and presents granules of different shapes and sizes on the surface; however, these can induce a high level of noise in the sensors. Increasing the pressure to 400 mTorr (Figure 2c,d), the granules become smaller and are more numerous. When the gas pressure is higher, the interactions between the species in the plasma and the gas molecules are more pronounced. In these conditions, increased gas-phase nucleation occurs in the region between the target and the substrate. Increasing the pressure up to 700 mTorr, the morphology becomes much more porous, which is visible even at low magnifications of the SEM images (Figure 2e). It consists of spherical granules with dimensions of tens to hundreds of nm. A sensor with such morphology is expected to have the best results. The explanation is related to the fact that the more porous morphology implies a larger specific surface, therefore a larger surface of interaction between the analyte molecules and the sensitive film [2,3,4,5,6,7,8,9,10,11,12,13,14,15,16,17,18,19,20,21,22,23,24]. Thus, detection can be performed at lower concentrations, with a shorter response time and at room temperature.
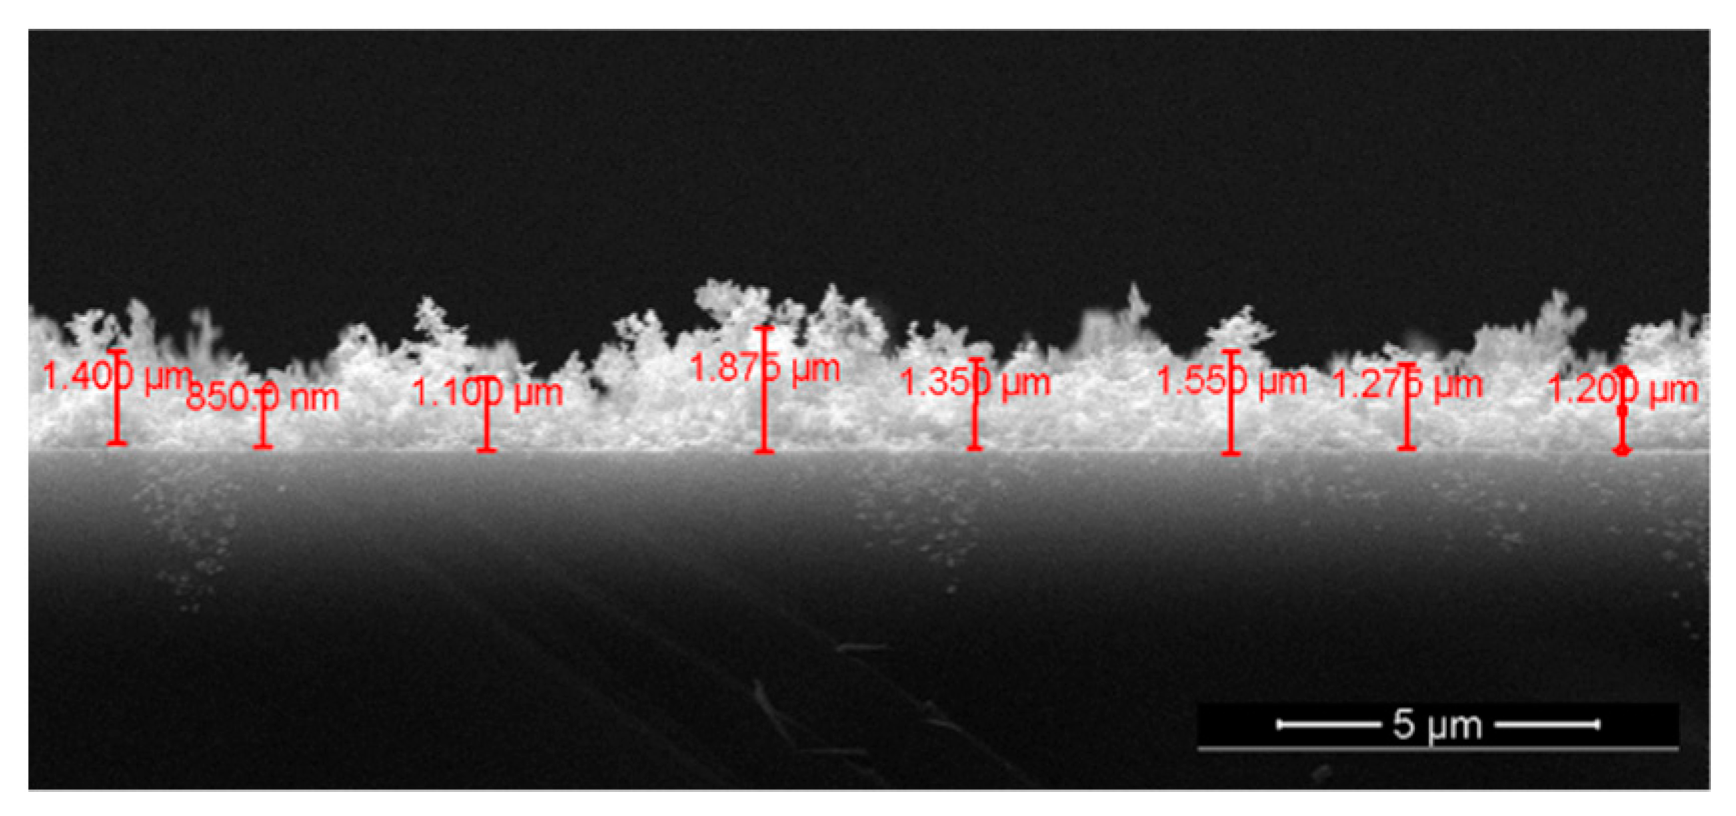
The high porosity of the film deposited at 700 mTorr is confirmed by the cross-section SEM image in Figure 3. From the measurements made on several SEM cross-section images, the average thickness of the SnO2 film deposited at 700 mTorr oxygen was approximately 1400 nm.
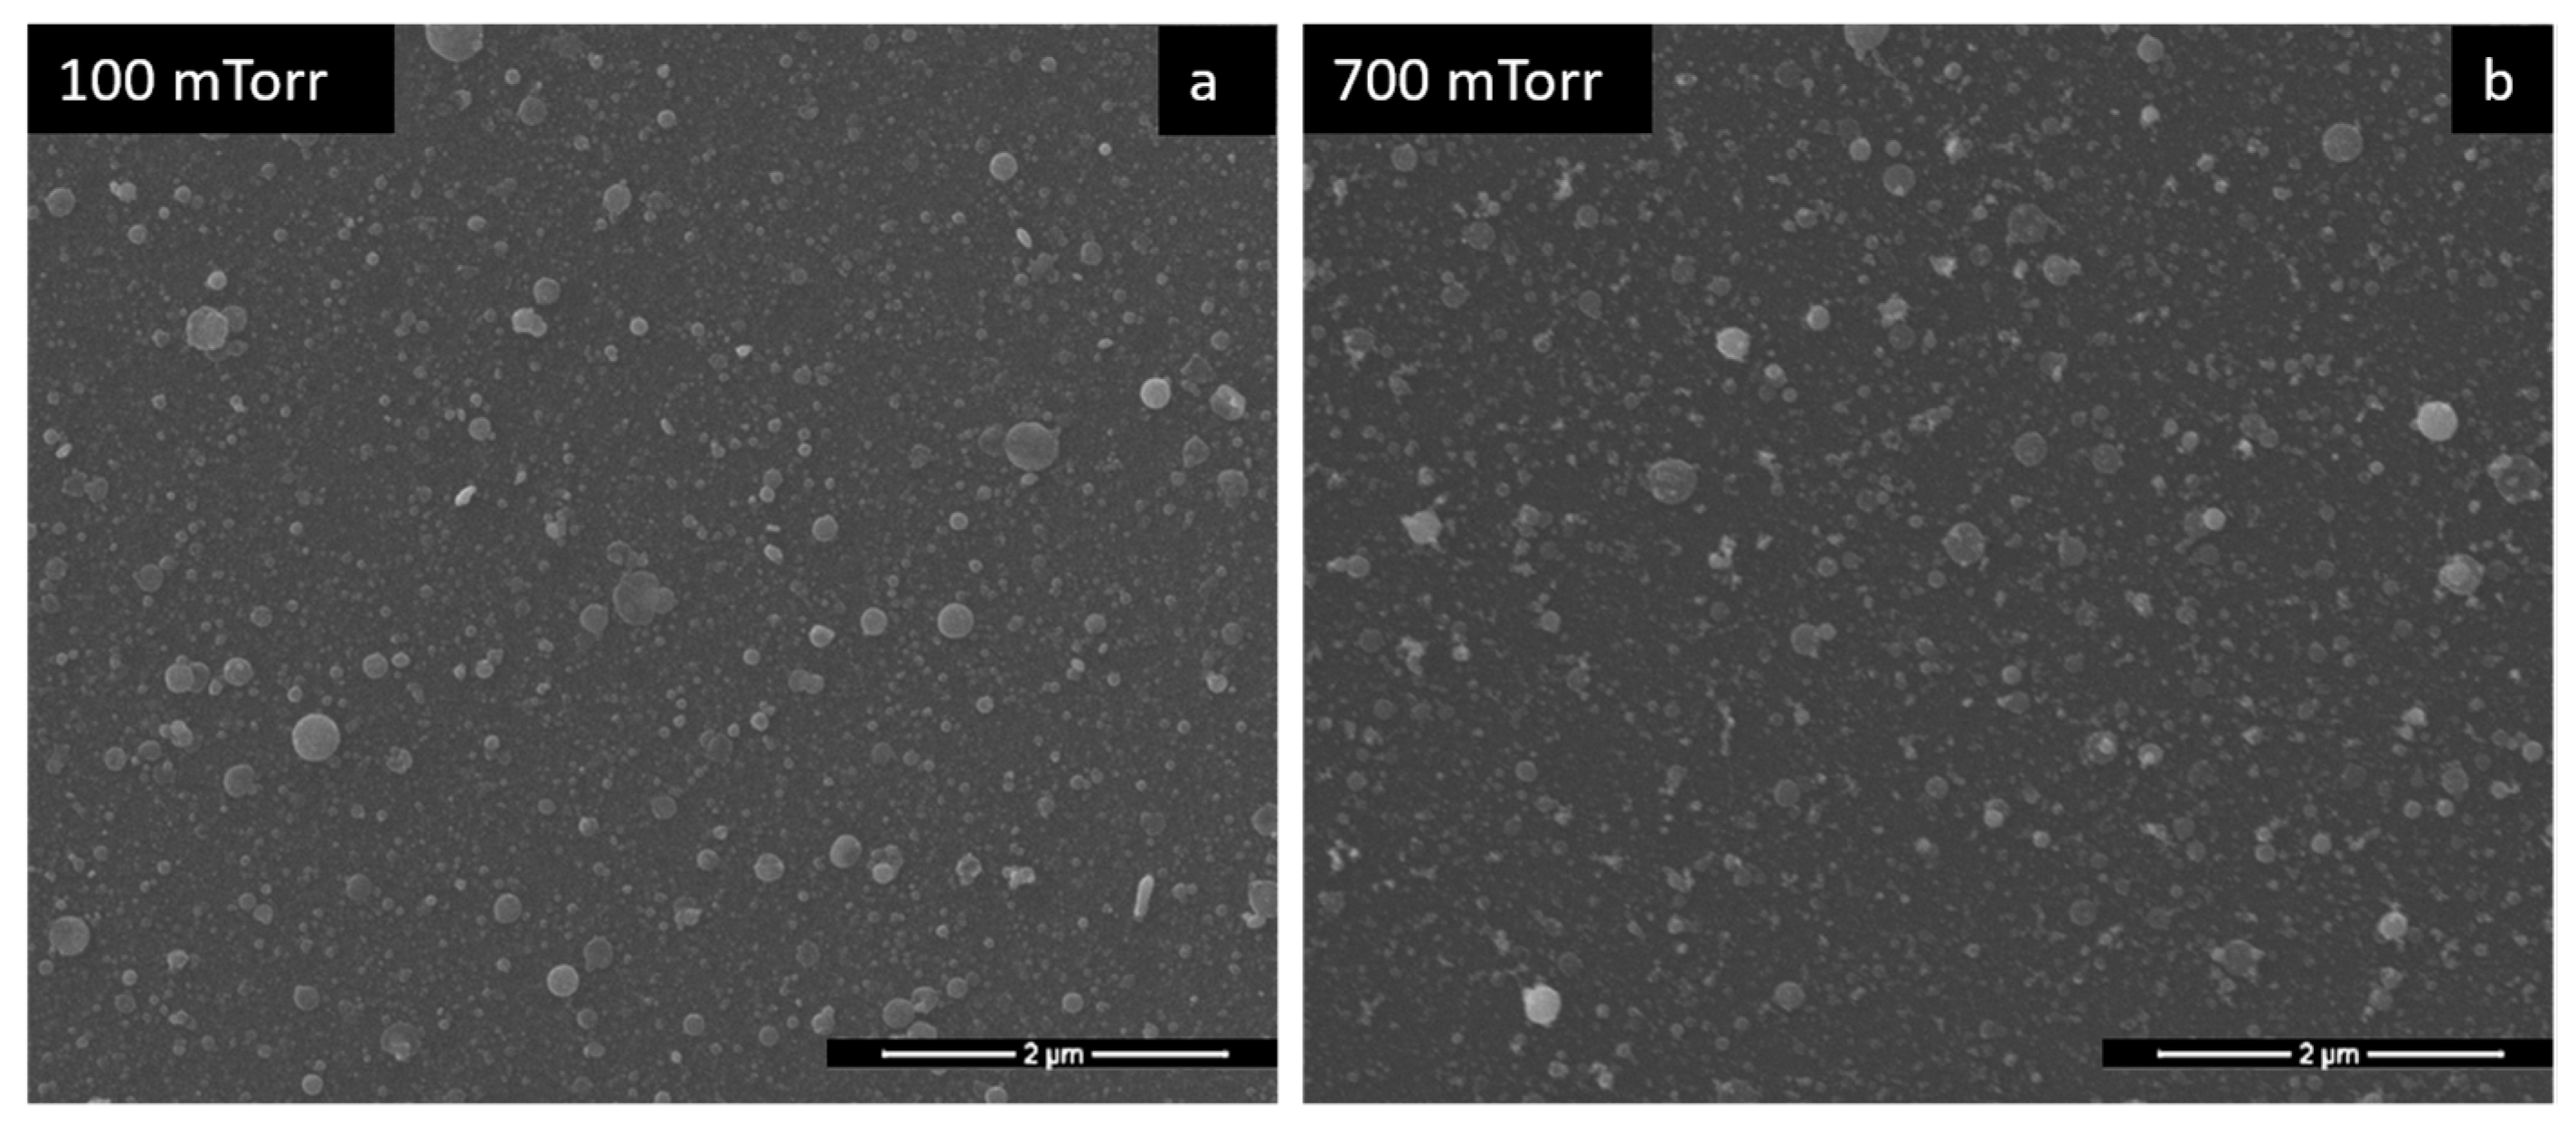
The role of Pd in the bilayer structure of the sensitive film is as a catalyst for hydrogen molecules, thus improving both the sensitivity and the selectivity of the sensor. It was found that with the increase in the thickness of the Pd film, its catalytic activity on hydrogen molecules is decreased [3]. Therefore, the Pd layer must have a very small thickness, compared to the sensitive base layer. Thus, in the present case, PLD depositions of 2′23″ were carried out, at 100 and 700 mTorr, to observe the influence of pressure on Pd morphology. Both SEM images in Figure 4 of Pd layers, described above, indicate the formation of continuous Pd layers with spherical formations of different sizes on the surface. No major difference can be identified between 100 and 700 mTorr deposition pressure, considering the very small amount of deposited material. Therefore, regarding the performance of the sensors depending on the Pd deposition pressure, we did not expect that the Pd deposition pressure would have a significant influence.
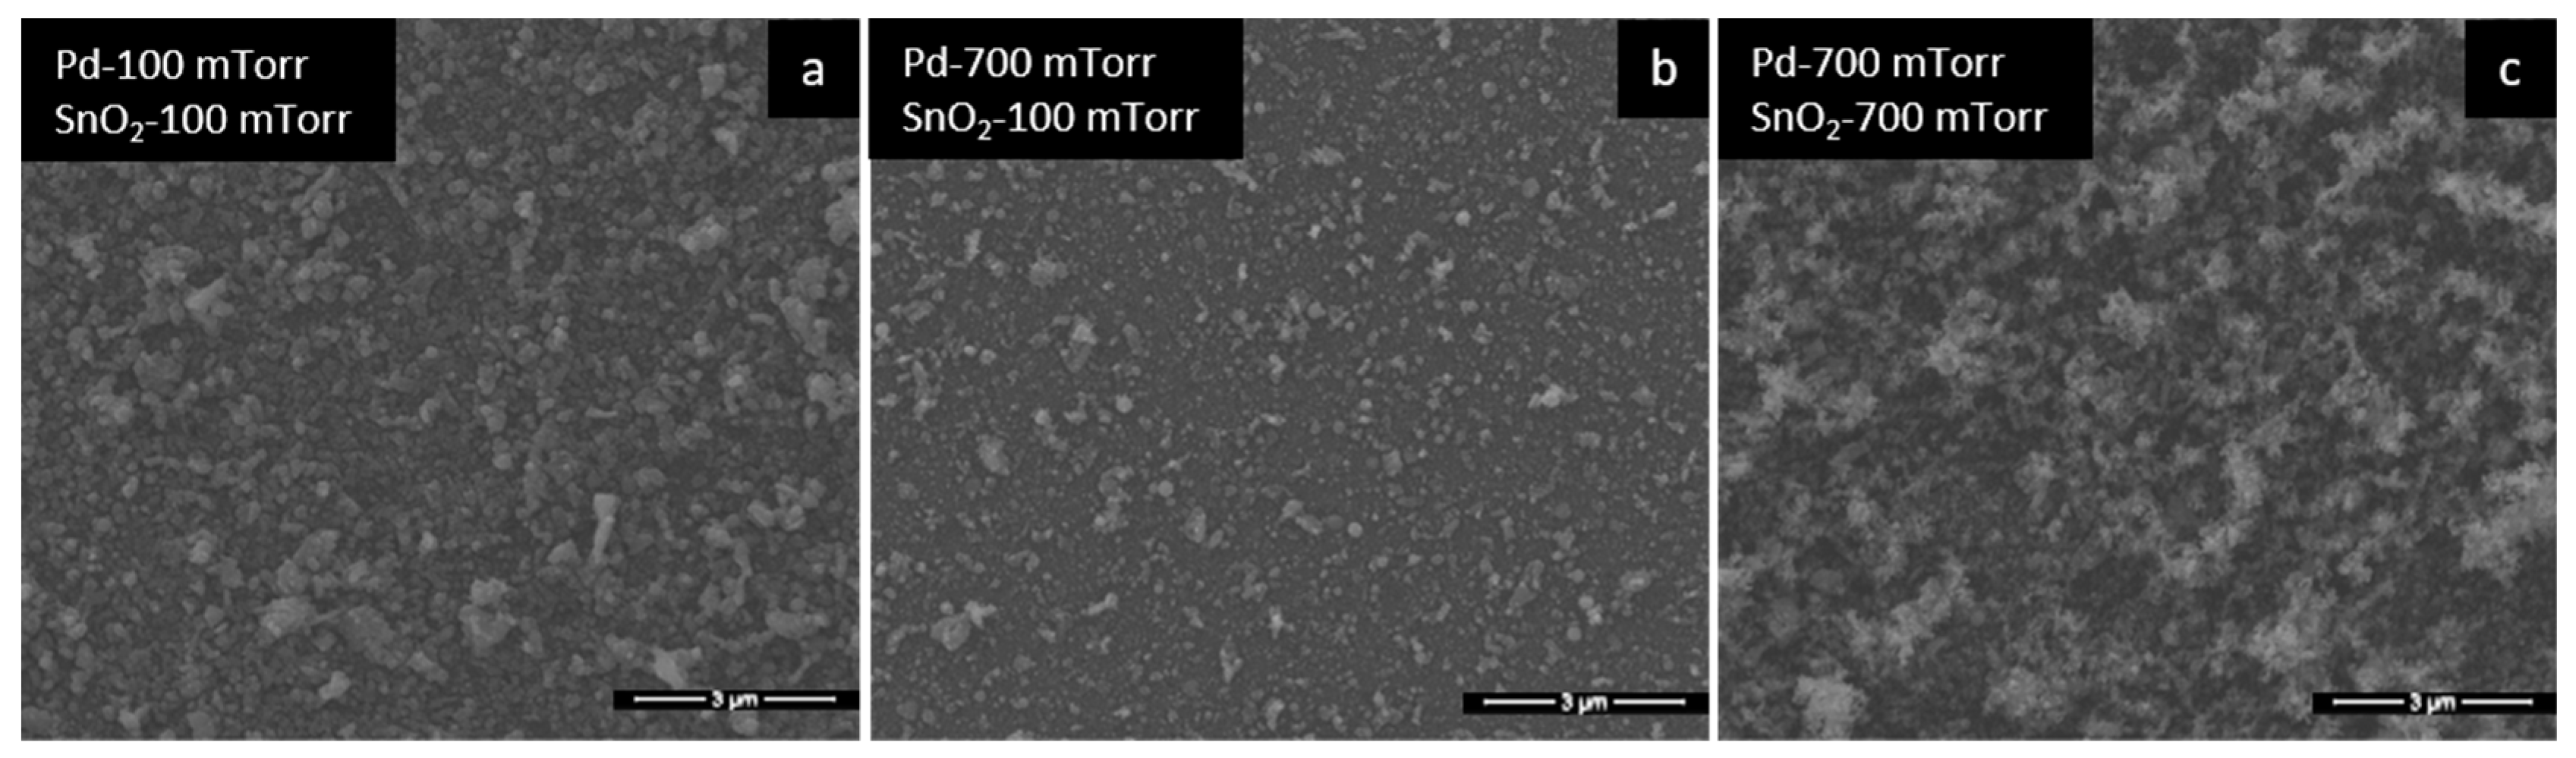
The bilayer films were deposited at 100 and 700 mTorr, both for SnO2 and Pd (Table 1). These pressures were chosen because they form considerably different morphologies, so that the influence of the morphology on the sensor results can be highlighted. Comparing the SEM images from Figure 2 (images with only SnO2 films), with the corresponding ones from Figure 5 (only with bilayer films), we notice that the morphology is similar. Thus, the presence of Pd is not decisive for a change in the morphology of the bilayer films, neither at 100 mTorr nor at 700 mTorr. This is due to the small amount of Pd deposited on the surface of the SnO2 films, as explained previously. In conclusion, we observe that the morphology of Pd/SnO2 bilayer thin films is dictated by the morphology of SnO2 films.
3.2. Sensor Properties
Following the tests carried out at different hydrogen concentrations, all the sensors responded at room temperature. The tests were carried out at hydrogen concentrations between 0.2 and 2%. Taking into account that over a concentration of 4% hydrogen becomes flammable and explosive, the sensors must be able to detect lower concentrations.
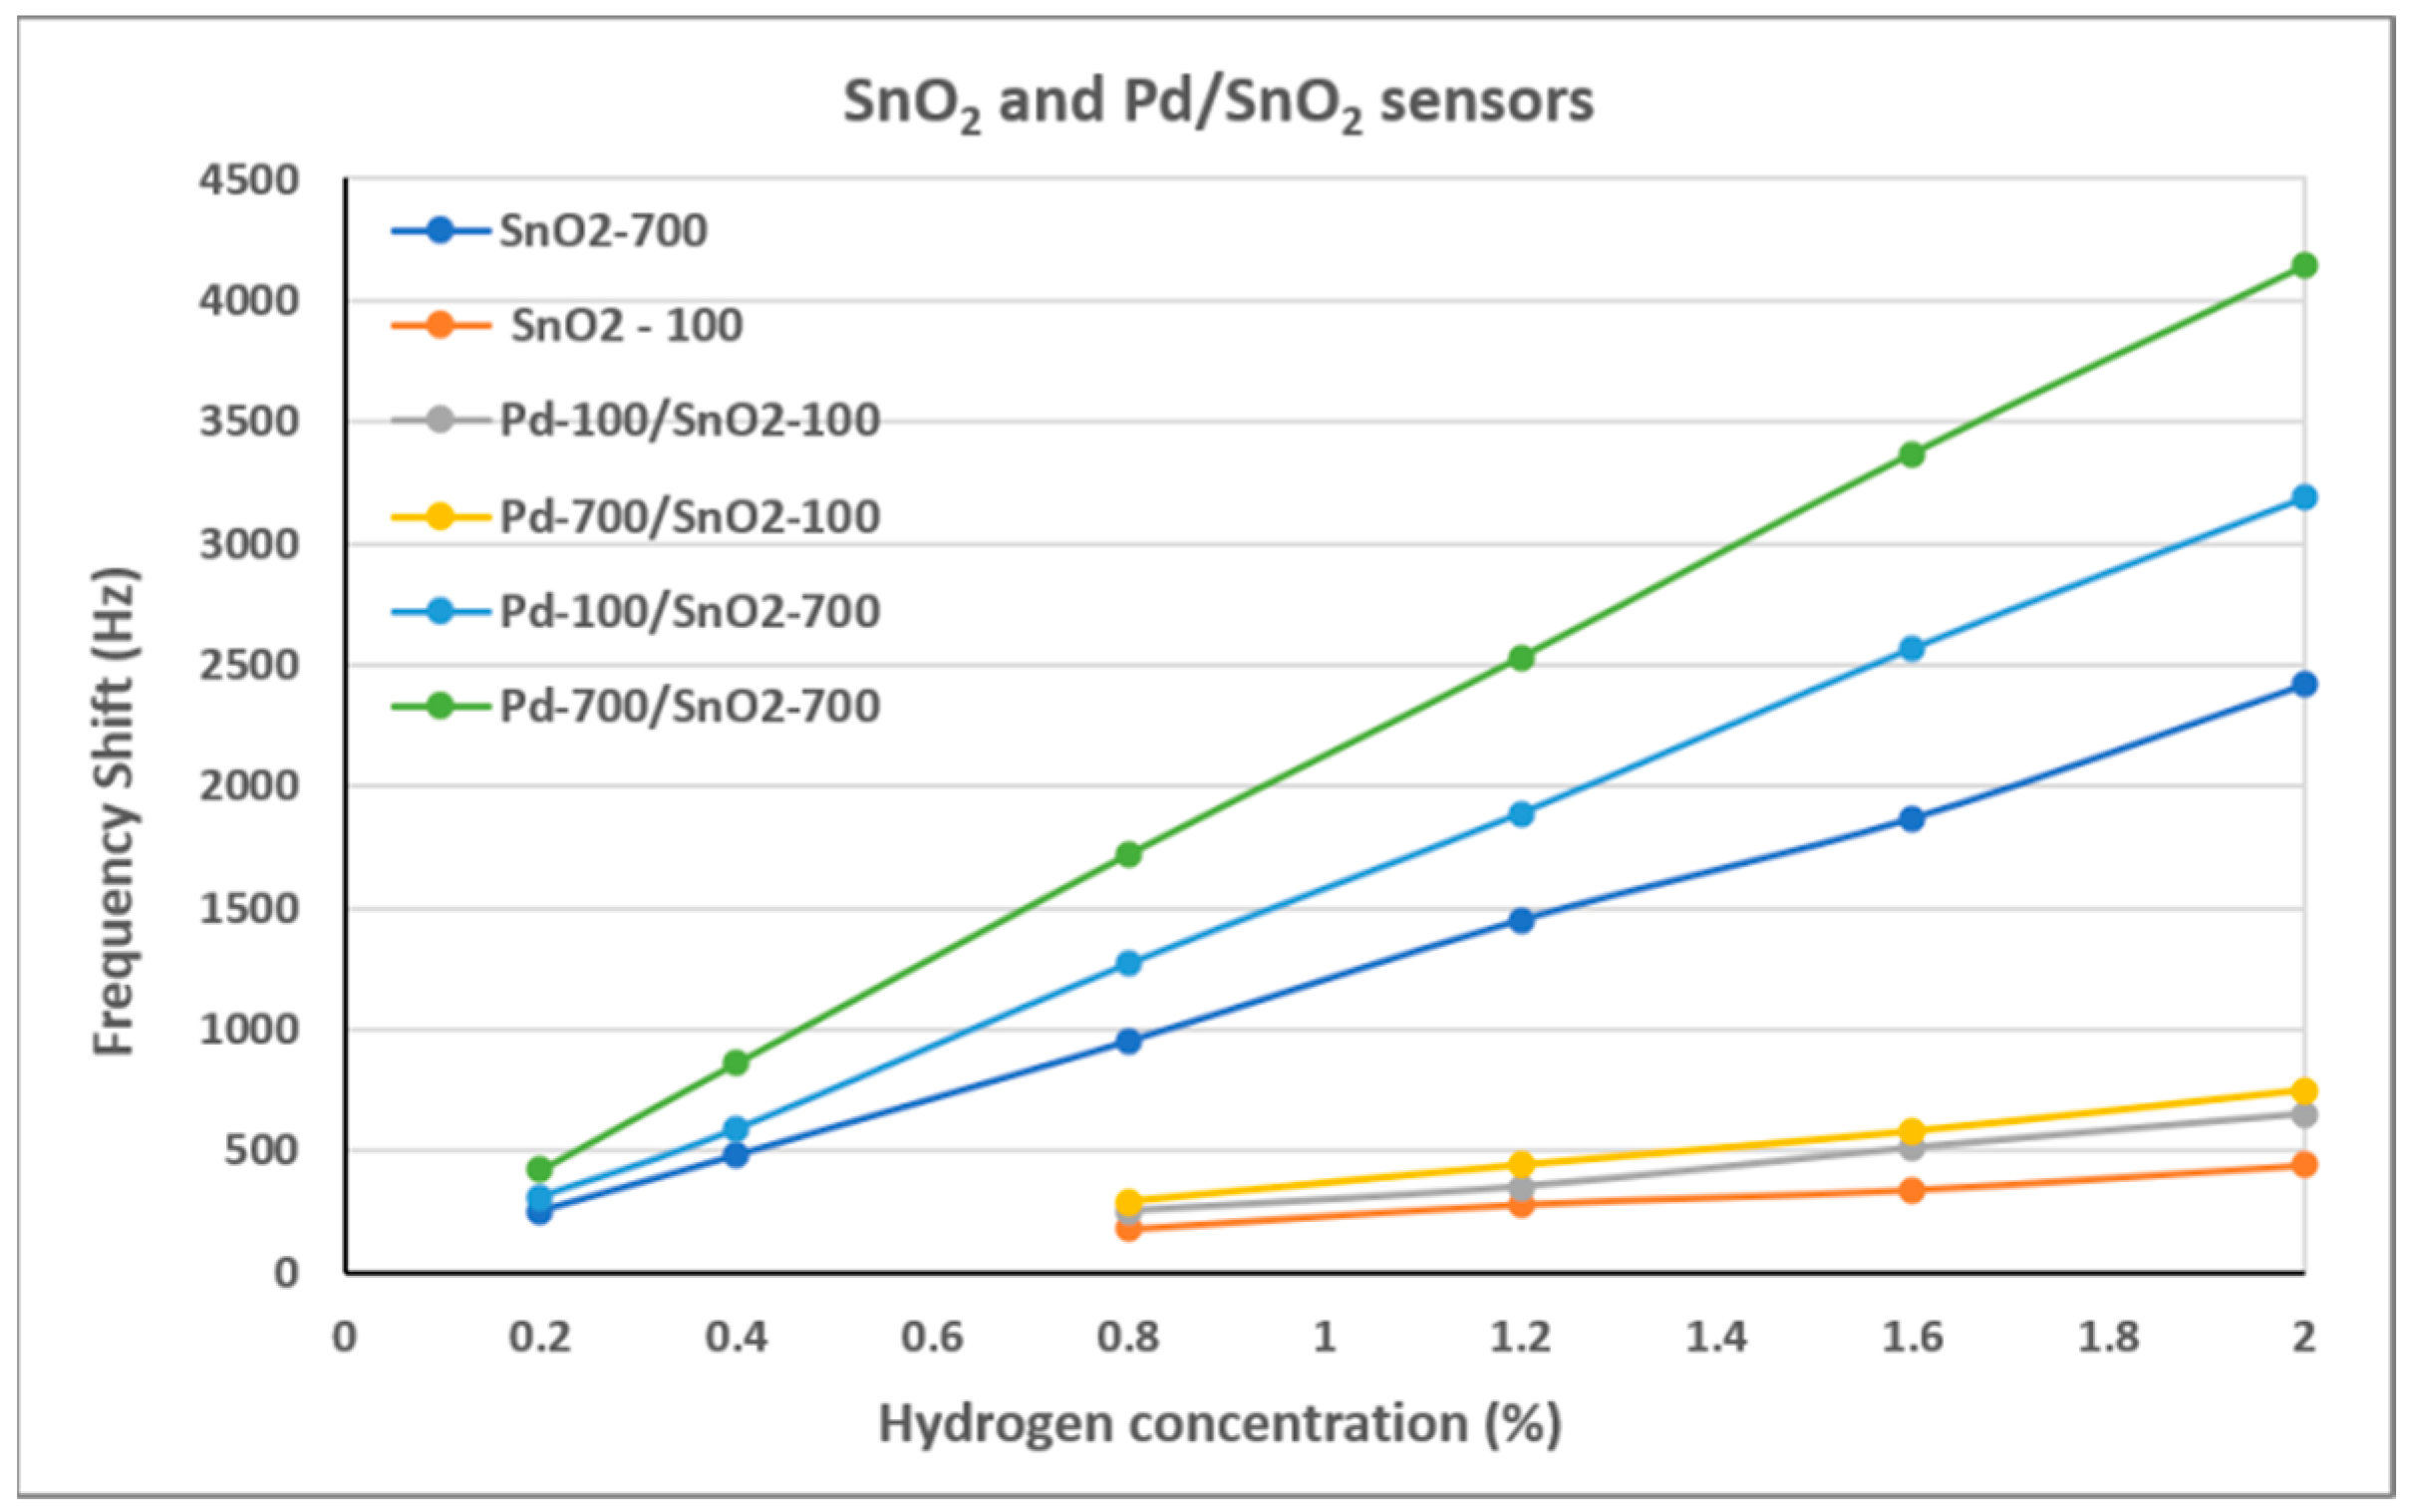
Figure 6 shows the frequency shifts of the SAW sensors tested at different hydrogen concentrations. It can be observed that there is a clear delimitation between the sensor results for SnO2 films deposited at different pressures. The sensors with the SnO2 films deposited at 700 mTorr (more porous) recorded frequency shifts approximately six times higher than those with SnO2 deposited at 100 mTorr for the same hydrogen concentration. This confirms that the morphology of SnO2 is the major influence on the sensor results. However, the presence of Pd also makes a difference in the sensor results. It can be observed that both bilayer films with SnO2 films deposited at 700 mTorr (Pd-100/SnO2-700 and Pd-700/SnO2-700) led to better results than the single layer SnO2-700 sensor. The same observation is true for sensors with SnO2 deposited at 100 mTorr. However, there is a relatively small difference between the sensors with different deposition pressures of the Pd films, those with Pd deposited at 700 mTorr having a slightly higher frequency shift than those deposited at 100 mTorr.
An important aspect in the characterization of sensors is selectivity. When the sensitive material of the sensor has sensitive properties for several types of gases, it is necessary to use a selective element for the gas of interest. Semiconductor metal oxides, especially SnO2, are good sensing materials for a wide range of gases.
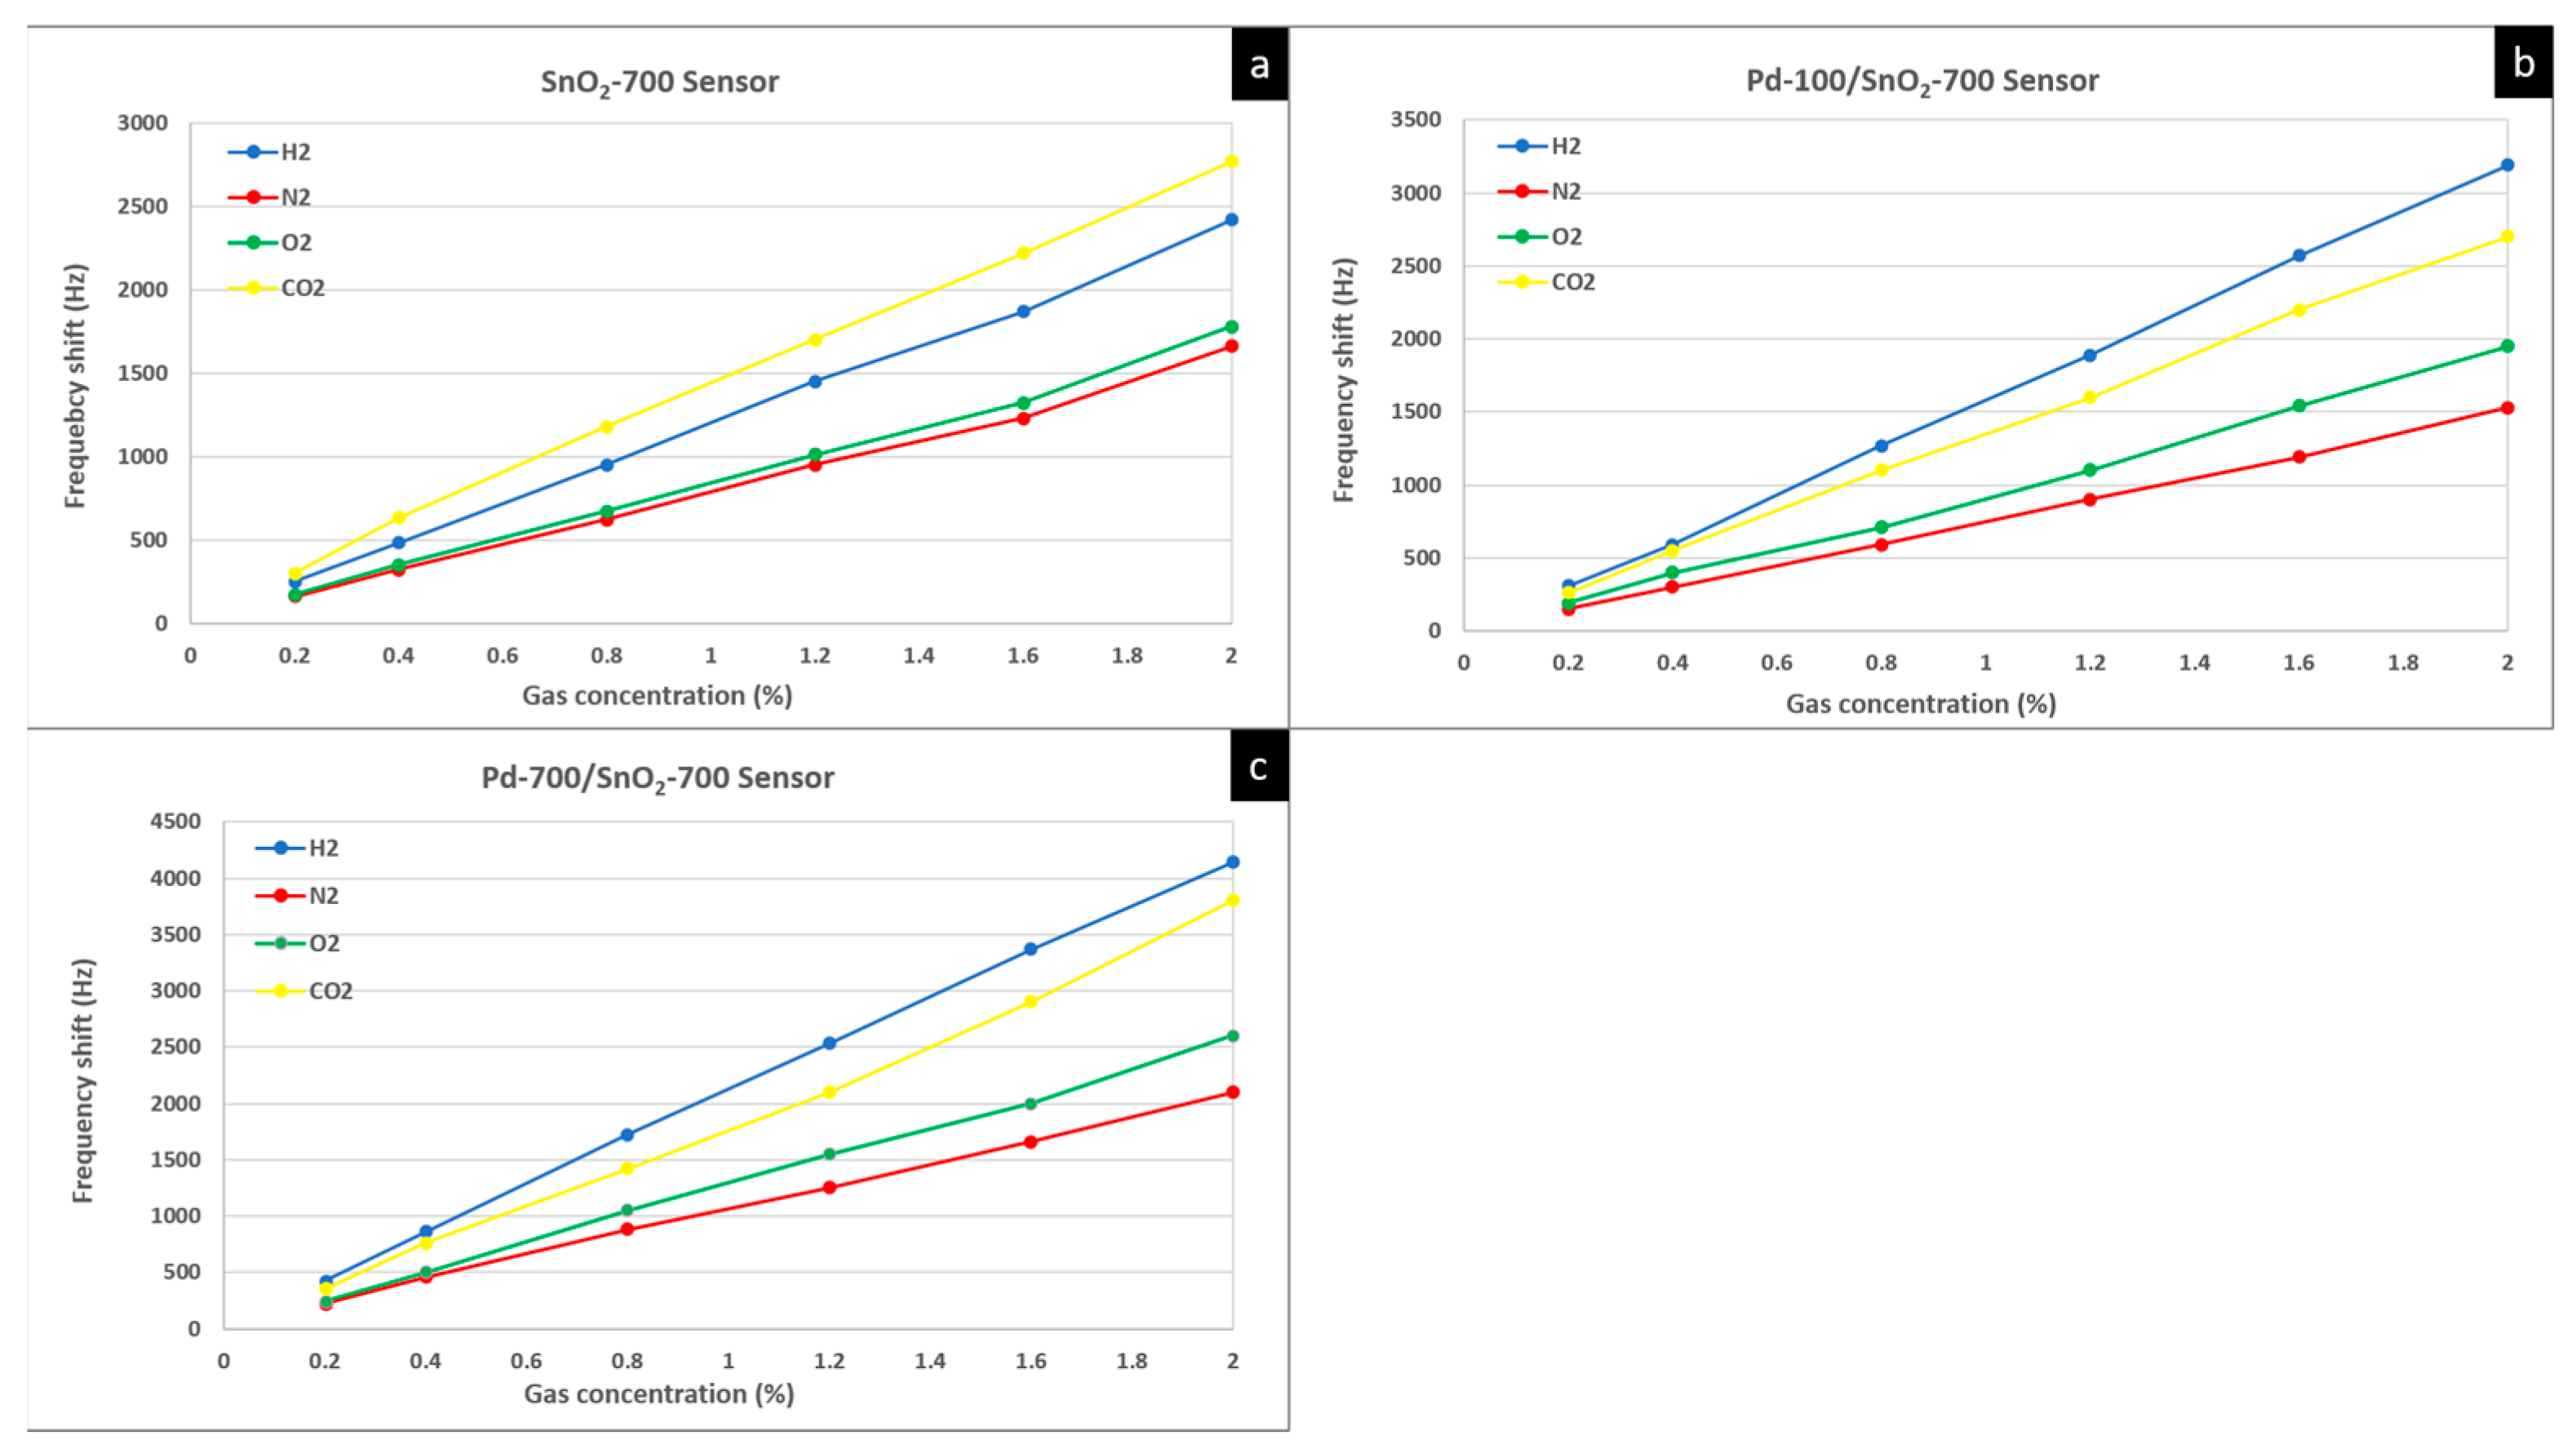
In order to determine the degree of selectivity, the three sensors that obtained the best hydrogen sensitivity (SnO2-700 sensor, Pd-100/SnO2-700 sensor and SnO2-700/Pd-700 sensor) were chosen for tests on several gases: hydrogen (H2), nitrogen (N2), oxygen (O2) and carbon dioxide (CO2). The frequency shifts recorded by these sensors are presented in the graphs in Figure 7. All sensors had results in the gas concentration range of 0.2–2%.
The tests showed that the best result of the SnO2-700 sensor was for CO2 gas. The Pd-100-SnO2-700 sensor and Pd-700/SnO2-700 sensor, on the other hand, had the best results for hydrogen. The major difference between the mentioned sensors is given by the presence of Pd. Thus, we can state that the use of Pd represents an important point for obtaining sensors with an important degree of hydrogen selectivity. The mechanism of action of Pd was explained previously, and through these tests it was confirmed.
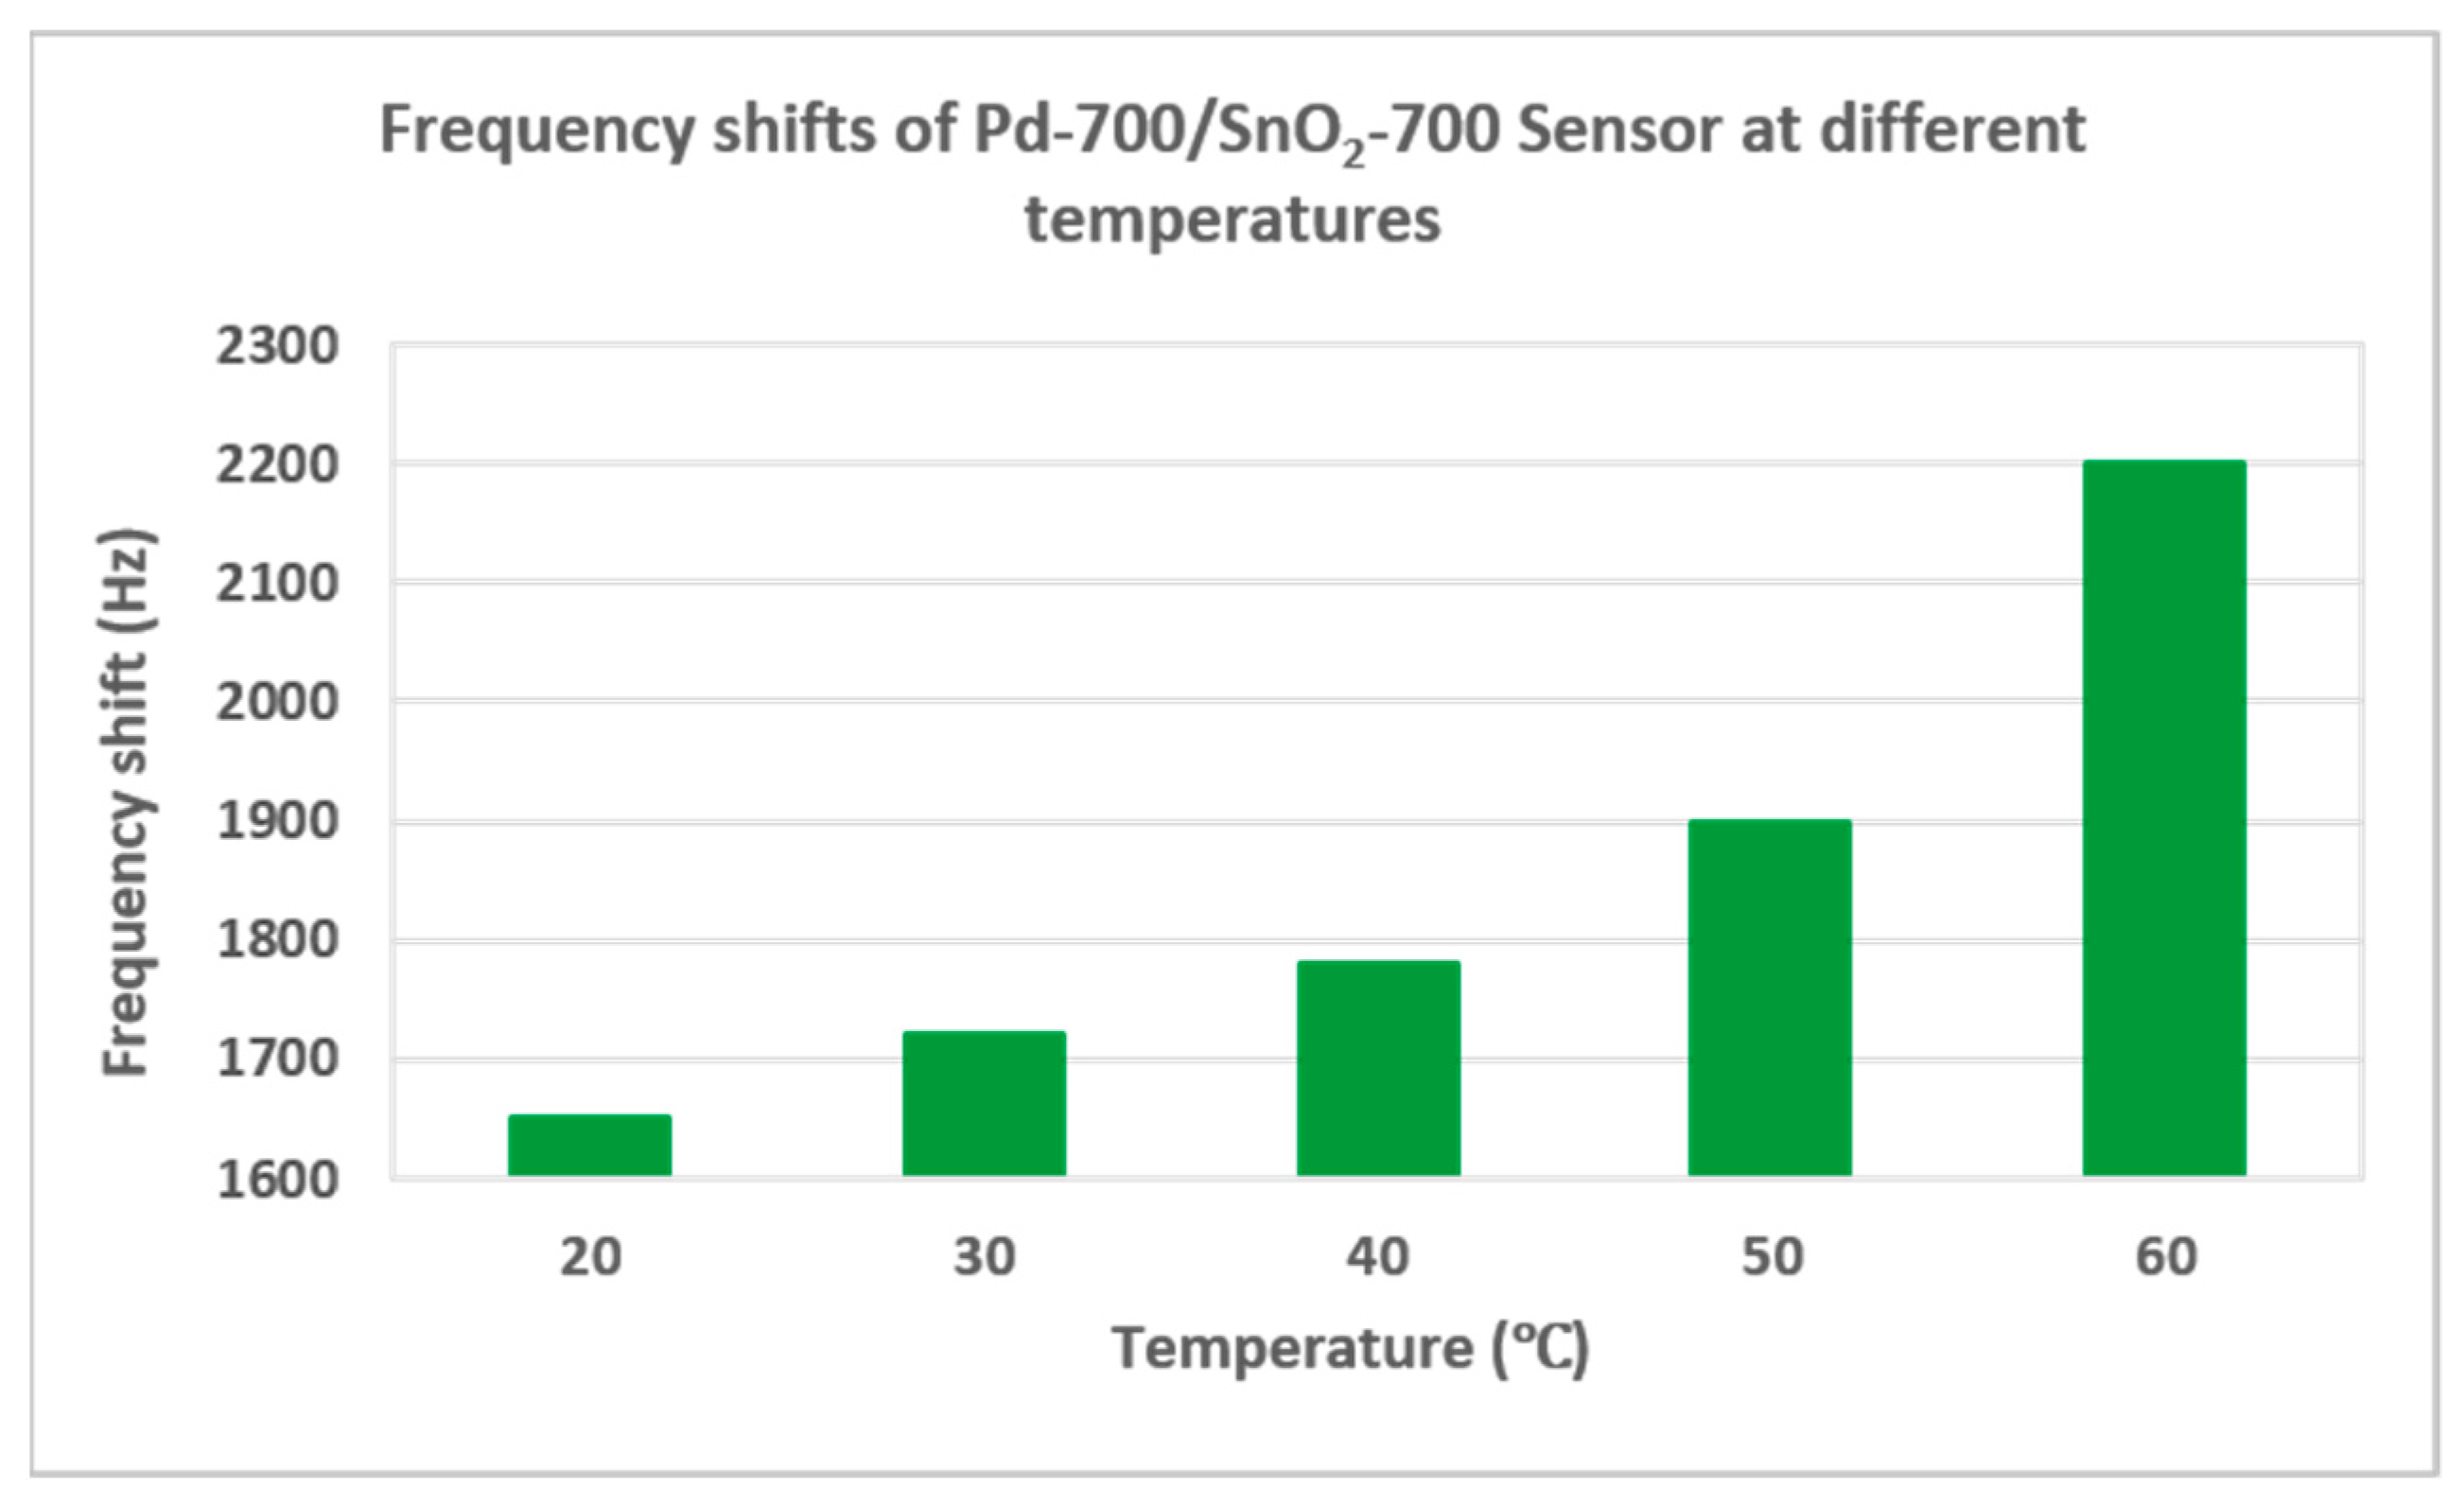
For a wide category of sensors, the use of thermal energy during detection improves sensor properties. The tests were carried out after the sensors reached the set temperature, which was kept constant with a Peltier controller. According to the graph in Figure 8, as the sensor temperature increases, the frequency shift is greater. In addition, considering the pronounced danger of explosion that hydrogen presents at an accumulation of only 4% in the environment, the temperature factor coming from the sensor can be the catalyst of the explosion reaction in an emergency situation, because the reactivity increases with temperature.
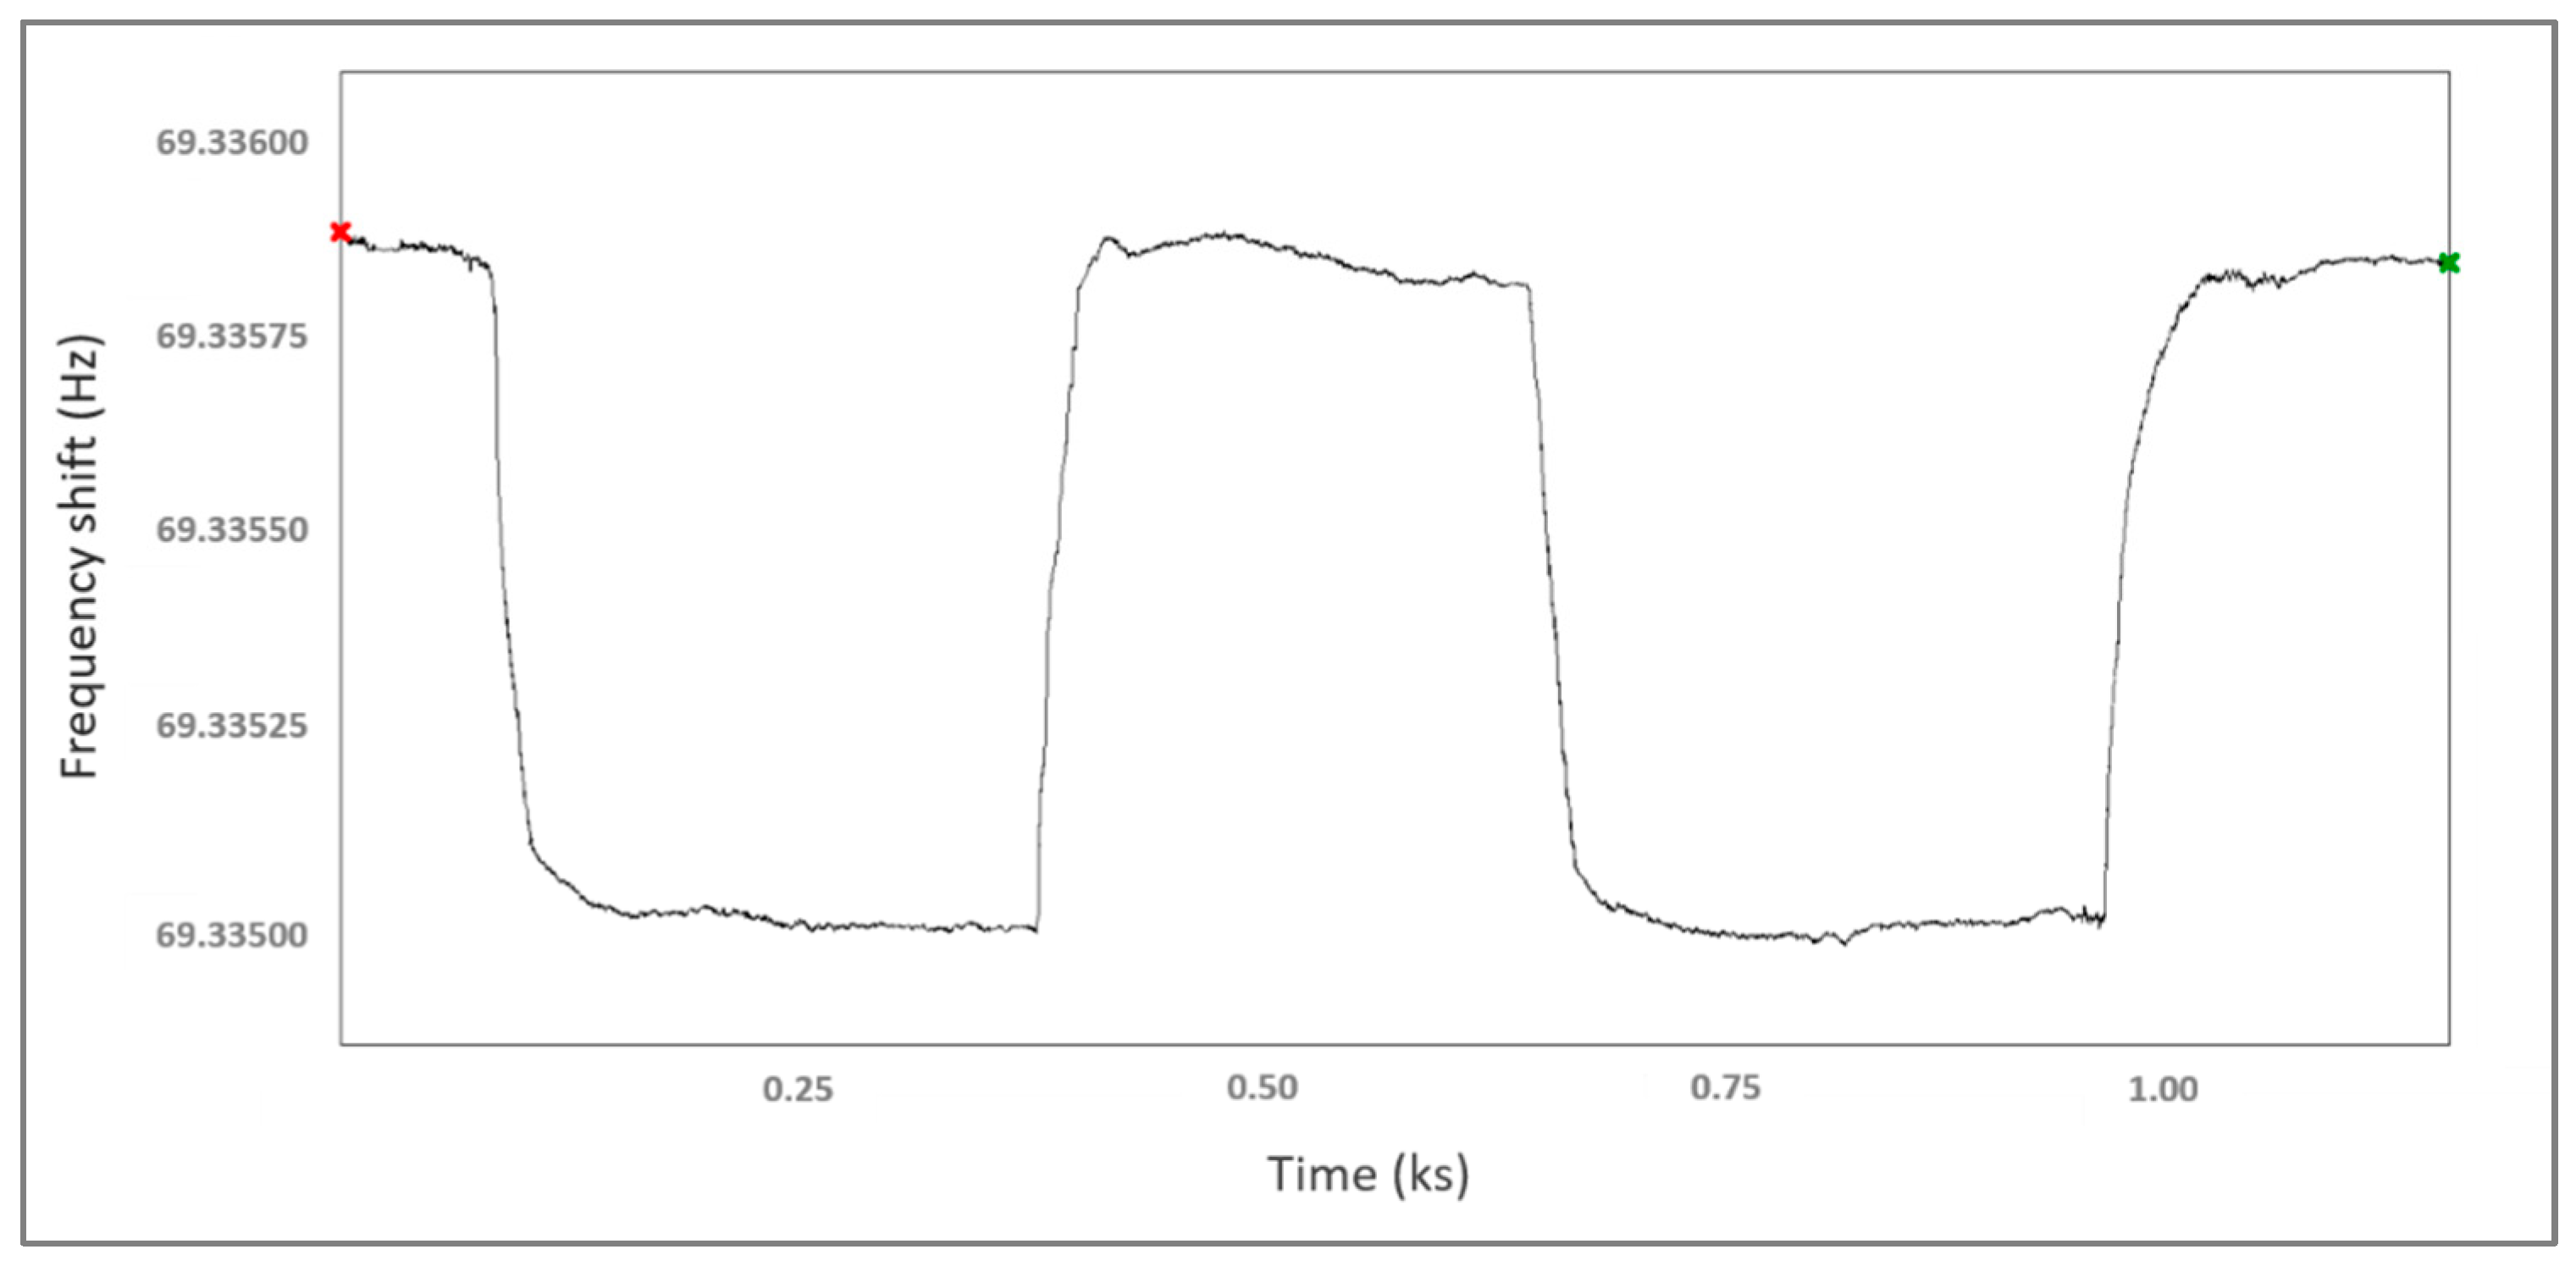
One of the important advantages of SAW sensors is repeatability. This is ensured by using a sensitive film that does not irreversibly interact with the gas molecules, allowing their desorption. The sensitive films obtained in this work present this property, the reversibility being proven by the dynamic response of the Pd-700/SnO2-700 sensor in Figure 9, at 0.4% hydrogen concentration. Ten consecutive measurements were made for Pd-700/SnO2-700 and Pd-100/SnO2-700 sensors. After the tests, a relative error of ±4% was determined. From the same graph, the response and recovery times were calculated, which were approximately 24 s and 30 s, respectively. The intervals of these times for all sensors were 20–30 s for the response time and 25–40 s for the recovery time.
The sensitivity is defined as the frequency shift in Hz per unit analyte concentration in ppm; it was determined from an average sensitivity value of the determinations at each gas concentration [15]. The LOD is defined as three times the noise level divided by the sensitivity [15]. The noise level was estimated at 10 Hz. Table 2 shows the results of the calculations for sensitivity and LOD for all sensors. It can be observed that the best results were obtained by the sensors with sensitive films deposited at 700 mTorr (more porous), both for SnO2 and Pd (Pd-700/SnO2-700). These results are comparable or better than other results from the literature and from our previous experiments [18,22,23,38,39]. In our previous work [22], we developed Pd/TiO2 sensors for hydrogen detection. The best sensitivity obtained in that case was of 0.10 Hz/ppm, with the sensor with the highest porosity in those experiments, which was two times less than the best sensitivity obtained in this work (0.21 Hz/ppm). The LOD for this best Pd/TiO2 sensor was 1210 ppm, eight times higher than the one obtained in the present work for Pd/SnO2 (142 ppm). An important factor for this result is the much lower level of noise recorded in the present work (10 Hz, compared to 40 Hz in [22]).
These results are a consequence of the mechanism of interactions between the sensitive film and the hydrogen molecules. The mechanism consists in several stages, as shown in the equations below (R1–R8) [3]. First of all, when the sensor is exposed to air, oxygen molecules accumulate at the level of the sensitive film. Upon their interaction with Pd, they are dissociated into oxygen atoms, which will capture electrons from the SnO2 layer and become species such as . They spill over to the SnO2 film and accumulate at the intergranular boundaries.
When hydrogen molecules appear at the level of the sensitive film, some of them react with the oxygen species accumulated at the level of the sensitive film, forming water molecules in vapor state. The rest of the hydrogen molecules are dissociated upon interaction with Pd into atomic hydrogen and spill over to the SnO2. At this point, hydrogen atoms and oxygen species adsorbed at the SnO2 layer interact, forming water vapor.
According to the reactions above, this whole process leads to the release of electrons in the conduction band of SnO2, thus increasing its conductivity. This increase in conductivity slows the speed of the SAW waves and reduces the central frequency of the gas sensor. Although the interaction that causes the change of SnO2 conductivity takes place at the SnO2 film, the presence of the Pd layer plays a role as well. The SnO2-modified layer with Pd leads to an improvement of its sensitivity, by facilitating the interaction of hydrogen with oxygen species, resulting in changes in the conductivity of the film. It is very important to monitor the uniformity of the Pd film and, of course, its thickness, to allow the complete dissociation reaction.
4. Summary and Conclusions
Thin films of SnO2 and Pd/SnO2 were deposited by PLD onto quartz substrates. Different pressures of oxygen and argon were used for depositing SnO2 and Pd, respectively, and their influence on the morphology of the film was discussed based on SEM images. It was observed that as pressure increases, the degree of porosity of the films increases. Surface acoustic wave sensors were realized with single layer SnO2 and bilayer Pd/SnO2 sensitive films with different morphologies, deposited at 100 and 700 mTorr. The sensors were tested at different hydrogen concentrations (0.2–2%) at room temperature. The best results were obtained for the sensor with a bilayer sensitive film, when the depositions were made at 700 mTorr, both in the case of SnO2 and in the case of Pd. The sensitivity of this sensor (Pd-700/SnO2-700) was 0.21 Hz/ppm, with a LOD of 142 ppm. The weakest result was of the sensor with only SnO2 film, deposited at 100 mTorr. Thus, we see the importance of both the morphology and the presence of Pd in order to obtain sensors with the best possible results. The importance of Pd in the detection of hydrogen was also highlighted after the tests on several gases, when the best result of the sensor without Pd was for CO2 and the best results for the sensors with Pd were for hydrogen. Tests at temperatures in the 20–60 ℃ range showed an increase in the frequency shift with the increase in temperature, but not with a considerable value.
These results were better than previous results obtained for sensors with Pd/TiO2 layers (LOD for this best Pd/TiO2 sensor was 1210 ppm, eight times higher than the one obtained in the present work for Pd/SnO2 (142 ppm)) [22] and represent a good and important direction of study for the development of SAW sensors with better performances. Also, the importance of Pd and its influence depending on the thickness for such structures represents a subject of interest for study.
Author Contributions
Conceptualization, I.C. and C.V.; methodology, I.C. and D.M.; formal analysis, I.C. and C.V.; investigation, I.C., D.M. and C.V.; writing—original draft preparation, I.C.; writing—review and editing, I.C., D.M. and C.V.; funding acquisition, C.V. All authors have read and agreed to the published version of the manuscript.
Funding
This research was supported by the National Authority for Research and Innovation in the framework of the Nucleus Programme—LAPLAS VI (grant 16N/08.02.2019).
Conflicts of Interest
The authors declare no conflict of interest.
References
- Kim, H.B.; Cheon, M.W. Characteristics Analysis of Hydrogen Sensors Using SnO2 Thin Film Fabricated by Using Electron Beam Evaporation. Trans. Electr. Electron. Mater. 2022, 23, 313–317. [Google Scholar] [CrossRef]
- Wang, F.; Hu, K.; Liu, H.; Zhao, Q.; Wang, K.; Wang, Y. Low temperature and fast response hydrogen gas sensor with Pd coated SnO2 nanofiber rods. Int. J. Hydrogen Energy 2020, 45, 7234–7242. [Google Scholar] [CrossRef]
- Yang, L.; Yin, C.; Zhang, Z.; Zhou, J.; Xu, H. The investigation of hydrogen gas sensing properties of SAW gas sensor based on palladium surface modified SnO2 thin film. Mater. Sci. Semicond. Process. 2017, 60, 16–28. [Google Scholar] [CrossRef]
- Lu, S.; Zhang, Y.; Liu, J.; Li, H.Y.; Hu, Z.; Luo, X.; Gao, N.; Zhang, B.; Jiang, J.; Zhong, A.; et al. Sensitive H2 gas sensors based on SnO2 nanowires. Sens. Actuators B Chem. 2021, 345, 130334. [Google Scholar] [CrossRef]
- Kumar, A.; Prajesh, R. The potential of acoustic wave devices for gas sensing applications. Sens. Actuators A Phys. 2022, 339, 113498. [Google Scholar] [CrossRef]
- Hashtroudi, H.; Atkin, P.; Mackinnon, I.D.R.; Shafiei, M. Low-operating temperature resistive nanostructured hydrogen sensors. Int. J. Hydrogen Energy 2019, 44, 26646–26664. [Google Scholar] [CrossRef]
- Li, Z.; Yao, Z.; Haidry, A.A.; Plecenik, T.; Xie, L.; Sun, L.; Fatima, Q. Resistive-type hydrogen gas sensor based on TiO2: A review. Int. J. Hydrogen Energy 2018, 43, 21114–21132. [Google Scholar] [CrossRef]
- Ferlazzo, A.; Espro, C.; Iannazzo, D.; Moulaee, K.; Neri, G. A novel yttria-doped ZrO2 based conductometric sensor for hydrogen leak monitoring. Int. J. Hydrogen Energy 2022, 47, 9819–9828. [Google Scholar] [CrossRef]
- Prakash, R.; Kumar, A.; Kaur, D. Pd capped W2N nano porous thin films for remarkable room temperature hydrogen gas sensing performance. Sens. Actuator B Chem. 2018, 277, 665–672. [Google Scholar] [CrossRef]
- Zhang, S.; Yin, C.; Yang, L.; Zhang, Z.; Han, Z. Investigation of the H2 sensing properties of multilayer mesoporous pure and Pd-doped SnO2 thin film. Sens. Actuator B Chem. 2019, 283, 399–406. [Google Scholar] [CrossRef]
- Devkota, J.; Mao, E.; Greve, D.W.; Ohodnicki, P.R.; Baltrus, J. A surface acoustic wave hydrogen sensor with tin doped indium oxide layers for intermediate temperatures. Sens. Actuators B Chem. 2022, 354, 131229. [Google Scholar] [CrossRef]
- Sju, L.; Wang, X.; Yan, D.; Fan, L.; Wu, W. The investigation of high-temperature SAW oxygen sensor based on ZnO films. Materials 2019, 12, 1235. [Google Scholar]
- Ghosh, A.; Zhang, C.; Shi, S.; Zhang, H. High temperature CO2 sensing and its cross-sensitivity towards H2 and CO gas using calcium doped ZnO thin film coated langasite SAW sensor. Sens. Actuators B Chem. 2019, 301, 126958. [Google Scholar] [CrossRef]
- Chen, C.; Jin, J. Surface Acoustic Wave Vapor Sensor with Graphene Interdigital Transducer for TNT Detection. Sens. Imaging 2020, 21, 24. [Google Scholar] [CrossRef]
- Ballantine, D.S.; White, R.M.; Martin, S.J.; Ricco, A.J.; Zellers, E.T.; Frye, G.C.; Wohtjen, H. Acoustic Wave Sensors, Theory, Design, and Physico-Chemical Applications; Academic Press: San Diego, CA, USA, 1997. [Google Scholar]
- Dinu, L.A.; Buiculescu, V.; Baracu, A.M. Recent progress on nanomaterials for NO2 surface acoustic waves. Nanomaterials 2022, 12, 2120. [Google Scholar] [CrossRef]
- Khudiar, A.I.; Oufi, A.M. Influence of the aluminium doping on the physical and gas sensing properties of SnO2 for H2 gas detection. Sens. Actuators B Chem. 2021, 340, 129633. [Google Scholar] [CrossRef]
- Miu, D.; Birjega, R.; Viespe, C. Surface Acoustic Wave Hydrogen Sensors Based on Nanostructured Pd/WO3 Bilayers. Sensors 2018, 18, 3636. [Google Scholar] [CrossRef] [PubMed] [Green Version]
- Pippara, R.K.; Chauhan, P.S.; Yadav, A.; Kishnani, V.; Gupta, A. Room temperature hydrogen sensing with polyaniline/SnO2/Pd nanocomposites. Micro Nano Eng. 2021, 12, 100086. [Google Scholar] [CrossRef]
- Fedorenko, G.; Oleksenko, L.; Maksymovych, N. Oxide Nanomaterials Based on SnO2 for Semiconductor Hydrogen Sensors. Adv. Mater. Sci. Eng. 2019, 2019, 5190235. [Google Scholar] [CrossRef] [Green Version]
- Drmosh, Q.A.; Yamani, Z.H.; Mohamedkhair, A.K.; Hendi, A.H.Y.; Ibrahim, A. Room-temperature detection of hydrogen by platinum-decorated tin oxide thin films augmented by heat-treatment. Vacuum 2018, 156, 68–77. [Google Scholar] [CrossRef]
- Constantinoiu, I.; Viespe, C. Development of Pd/TiO2 Porous Layers by Pulsed Laser Deposition for Surface Acoustic Wave H2 Gas Sensor. Nanomaterials 2020, 10, 760. [Google Scholar] [CrossRef] [PubMed]
- Miu, D.; Constantinoiu, I.; Enache, C.; Viespe, C. Effect of Pd/ZnO Morphology on Surface Acoustic Wave Sensor Response. Nanomaterials 2021, 11, 2598. [Google Scholar] [CrossRef] [PubMed]
- Kwoka, M.; Comini, E.; Zappa, D.; Szuber, J. Flower-like ZnO nanostructures local surface morphology and chemistry. Nnaomaterials 2022, 12, 2666. [Google Scholar] [CrossRef] [PubMed]
- Wang, M.; Sun, B.; Jiang, Z.; Liu, Y.; Wang, X.; Tang, Z.; Wang, Y.; Chen, W. Preparation and extraordinary room-temperature CO sensing capabilities of Pd-SnO2 composite nanoceramics. J. Nanosci. Nanotechnol. 2018, 18, 4176–4181. [Google Scholar] [CrossRef] [PubMed]
- Wang, Z.Y.; Zhang, T.; Zhao, C.; Han, T.Y.; Fei, T.; Liu, S.; Lu, G.Y. Anchoring ultrafine Pd nanoparticles and SnO2 nanoparticles on reduced graphene oxide for high-performance room temperature NO2 sensing. J. Colloid Interface Sci. 2018, 514, 599–608. [Google Scholar] [CrossRef]
- Chang, C.-H.; Lin, K.-W.; Lu, H.-H.; Liu, R.-C.; Liu, W.-C. Hydrogen sensing performance of a Pd/HfO2/GaOx/GaN based metal oxide-semiconductor type Schottky diode. Int. J. Hydrogen Energy 2018, 43, 19816–19824. [Google Scholar] [CrossRef]
- Cai, S.; Hu, W.; Liu, Y.; Ning, J.; Feng, S.; Jin, C.; Huang, L.; Li, X. Optical fiber hydrogen sensor metasurfaces composed of palladium. Chin. Opt. Lett. 2022, 20, 5. [Google Scholar] [CrossRef]
- Zhou, Q.; Xu, L.; Umar, A.; Chen, W.; Kumar, R. Pt nanoparticles decorated SnO2 nanoneedles for efficient CO gas sensing applications. Sens. Actuators B Chem. 2018, 256, 656–664. [Google Scholar] [CrossRef]
- Nguyen, K.; Hung, C.M.; Ngoc, T.M.; Le DT, T.; Nguyen, D.H.; Van, D.N.; Van, H.N. Low-temperature prototype hydrogen sensors using Pd-decorated SnO2 nanowires for exhaled breath applications. Sens. Actuators B Chem. 2017, 253, 156–163. [Google Scholar] [CrossRef]
- Zhu, L.; Zeng, W.; Li, Y.Q. A non-oxygen adsorption mechanism for hydrogen detection of nanostructured SnO2 based sensors. Mater. Res. Bull. 2019, 109, 108–116. [Google Scholar] [CrossRef]
- Kwoka, M.; Lyson-Sypien, B.; Kulis, A.; Maslyk, M.; Borysiewicz, M.A.; Kaminska, E.; Szuber, J. Surface Properties of Nanostructured, Porous ZnO Thin Films Prepared by Direct Current Reactive Magnetron Sputtering. Materials 2018, 11, 131. [Google Scholar] [CrossRef] [PubMed]
- Atanasova, G.; Dikovska, A.O.; Dilova, T.; Georgieva, B.; Avdeev, G.V.; Stefanov, P.; Nedyalkov, N.N. Metal-oxide nanostructures produced by PLD in open air for gas sensor applications. Appl. Surf. Sci. 2019, 470, 861–869. [Google Scholar] [CrossRef]
- Haider, J.A.; Alawsi, T.; Haider, M.J.; Taha, B.A.; Marhoon, H.A. A comprehensive review on pulsed laser deposition technique to effective nanostructure production: Trends and challenges. Opt. Quantum Electron. 2022, 54, 488. [Google Scholar] [CrossRef]
- Cheng, P.; Wang, L.; Pan, Y.; Yan, H.; Gao, D.; Wang, J.; Zhang, H. Fiber Bragg grating temperature sensor of cladding with SrTiO3 thin film by pulsed laser deposition. Laser Phys. 2019, 29, 25107. [Google Scholar] [CrossRef]
- Slaiby, Z.E.; Ramizy, A. Synthesis gallium nitride thin films by pulsed laser deposition as ammonia (NH3) gas sensor. J. Optoelectron. Biomed. Mater. 2020, 12, 17–23. [Google Scholar]
- Vakulov, Z.; Khakhulin, D.; Zamburg, E.; Mikhaylichenko, A.; Smirnov, V.A.; Tominov, R.; Klimin, V.S.; Ageev, O.A. Towards scalable large-area pulsed laser deposition. Materials 2021, 14, 4854. [Google Scholar] [CrossRef] [PubMed]
- Marcu, A.; Viespe, C. Surface Acoustic Wave sensors for hydrogen and deuterium detection. Sensors 2017, 17, 1417. [Google Scholar] [CrossRef] [PubMed] [Green Version]
- Marcu, A.; Viespe, C. Laser-grown ZnO nanowires for room-temperature SAW-sensor applications. Sens. Actuators B Chem. 2015, 208, 1–6. [Google Scholar] [CrossRef]
Figure 1.
Experimental setup for SAW sensor measurements.

Figure 2.
SEM images of SnO2 films deposited at different gas pressures.

Figure 3.
Cross-section SEM image of the SnO2 film deposited at 700 mTorr.

Figure 4.
SEM images of Pd films at different gas pressures.

Figure 5.
SEM images of Pd/SnO2 films at different gas pressures.

Figure 6.
Frequency shift of the SnO2 and Pd/SnO2 sensors at different hydrogen concentrations.

Figure 7.
Frequency shifts of: (a) SnO2 sensor, (b) Pd-100/SnO2-700 sensor and (c) Pd-700/SnO2-700 sensor, at different concentrations of H2, N2, O2 and CO2.
Figure 7.
Frequency shifts of: (a) SnO2 sensor, (b) Pd-100/SnO2-700 sensor and (c) Pd-700/SnO2-700 sensor, at different concentrations of H2, N2, O2 and CO2.

Figure 8.
Frequency shifts of Pd-700/SnO2-700 sensor, at different temperatures, for a concentration of 0.8% hydrogen.
Figure 8.
Frequency shifts of Pd-700/SnO2-700 sensor, at different temperatures, for a concentration of 0.8% hydrogen.

Figure 9.
Dynamic response of sensor Pd-700/SnO2-700 at 0.4% hydrogen concentration.


Table 1.
The sensors and the thin film deposition characteristics.
| Sensor | Composition of the Sensitive Layer | Deposition Pressure (mTorr) | |
|---|---|---|---|
| O2 | Ar | ||
| SnO2-100 | SnO2 | 100 | - |
| SnO2-700 | 700 | - | |
| Pd-100/SnO2-100 | Pd/SnO2 | 100 | 100 |
| Pd-100/SnO2-700 | 700 | 100 | |
| Pd-700/SnO2-100 | 100 | 700 | |
| Pd-700/SnO2-700 | 700 | 700 | |
Table 2.
Sensitivity and limit of detection (LOD) of the sensors (Δf-frequency change; c-hydrogen concentration, n-noise level).
Table 2.
Sensitivity and limit of detection (LOD) of the sensors (Δf-frequency change; c-hydrogen concentration, n-noise level).
| Sensor | Sensitivity (Δf/c) (Hz/ppm) | LOD (3 × n)/(Δf/c) (ppm) |
|---|---|---|
| SnO2-100 | 0.02 | 1349 |
| SnO2-700 | 0.12 | 251 |
| Pd-100/SnO2-100 | 0.03 | 963 |
| Pd-100/SnO2-700 | 0.16 | 189 |
| Pd-700/SnO2-100 | 0.04 | 818 |
| Pd-700/SnO2-700 | 0.21 | 142 |
Publisher’s Note: MDPI stays neutral with regard to jurisdictional claims in published maps and institutional affiliations. |
© 2022 by the authors. Licensee MDPI, Basel, Switzerland. This article is an open access article distributed under the terms and conditions of the Creative Commons Attribution (CC BY) license (https://creativecommons.org/licenses/by/4.0/).
Share and Cite
MDPI and ACS Style
Constantinoiu, I.; Miu, D.; Viespe, C. SAW Hydrogen Sensors with Pd/SnO2 Layers. Materials 2022, 15, 8012. https://0-doi-org.brum.beds.ac.uk/10.3390/ma15228012
AMA Style
Constantinoiu I, Miu D, Viespe C. SAW Hydrogen Sensors with Pd/SnO2 Layers. Materials. 2022; 15(22):8012. https://0-doi-org.brum.beds.ac.uk/10.3390/ma15228012
Chicago/Turabian StyleConstantinoiu, Izabela, Dana Miu, and Cristian Viespe. 2022. "SAW Hydrogen Sensors with Pd/SnO2 Layers" Materials 15, no. 22: 8012. https://0-doi-org.brum.beds.ac.uk/10.3390/ma15228012
Note that from the first issue of 2016, this journal uses article numbers instead of page numbers. See further details here.