
Mechanical Properties of Reactive Powder Concrete with Coal Gangue as Sand Replacement


Abstract
:1. Introduction
2. Materials and Methods
2.1. Raw Materials
2.1.1. Binders and Fibers
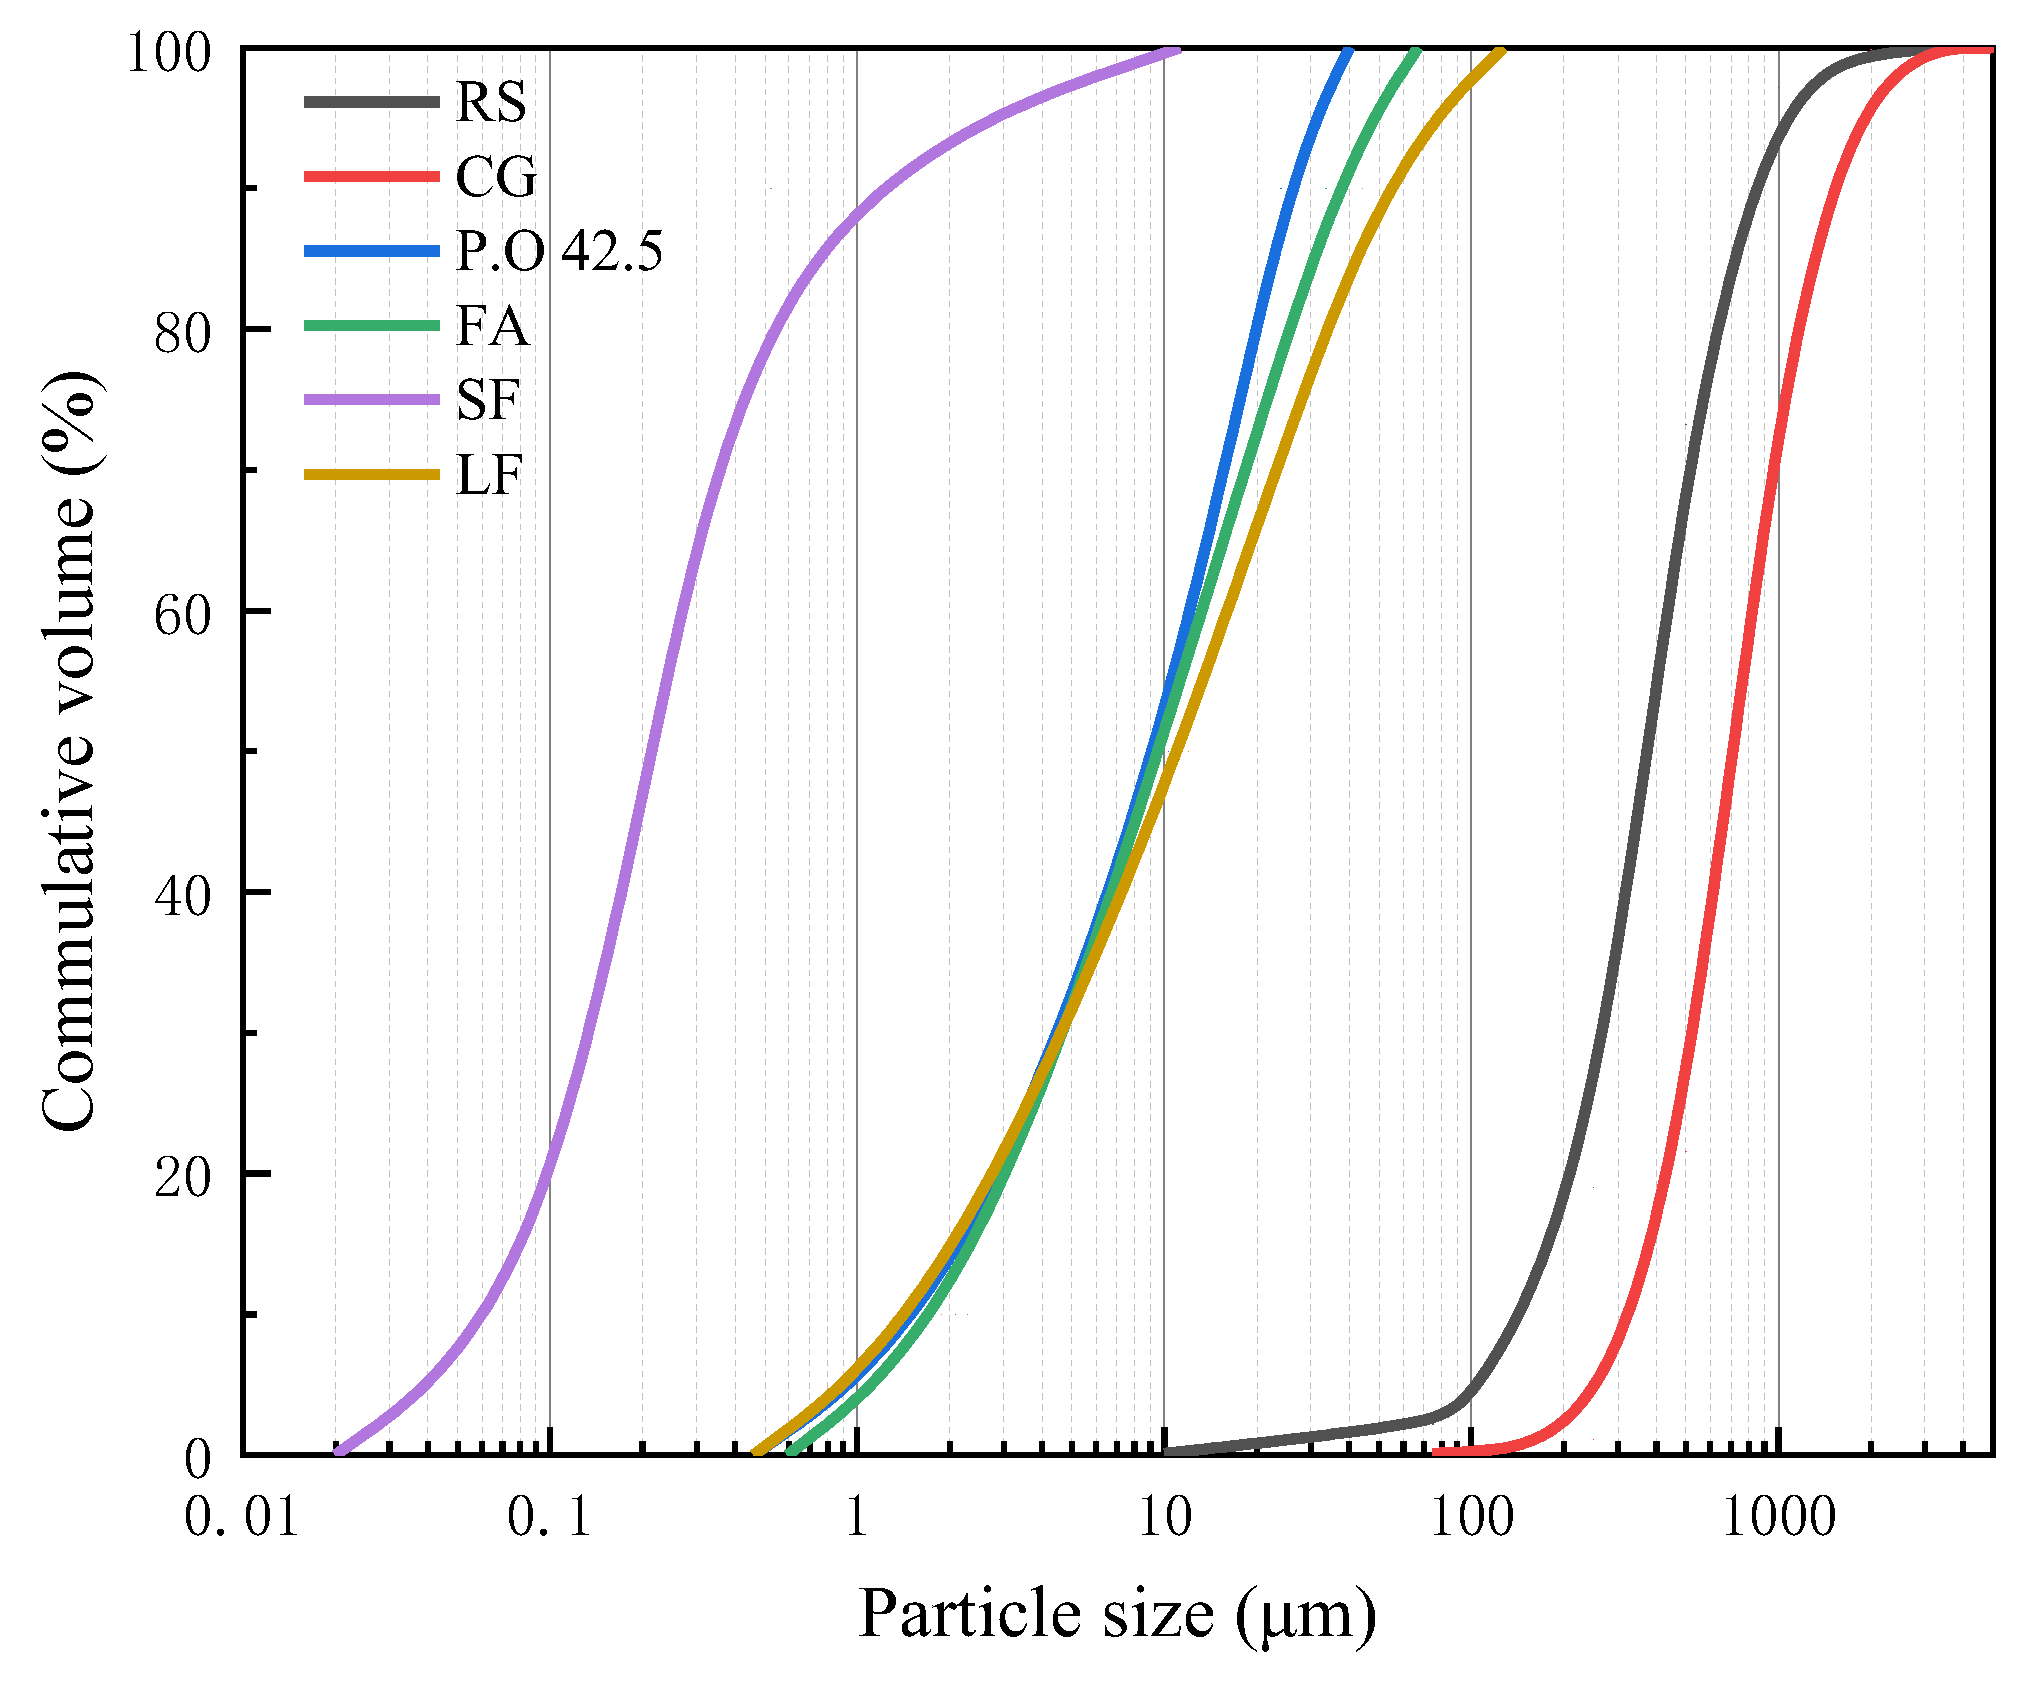
2.1.2. Fine Aggregates
2.2. Mix Proportions
2.2.1. Mixture with Different CG/RS Ratios
2.2.2. Mixture with Different Fiber Content
2.3. Specimen Preparation
2.4. Test Methods
2.4.1. Packing Density
2.4.2. Fluidity Test
2.4.3. Mechanical Test and Water Absorption
2.4.4. SEM and XRD
3. Results and Discussion
3.1. Mixture with Different CG/RG Ratios
3.1.1. Packing Density
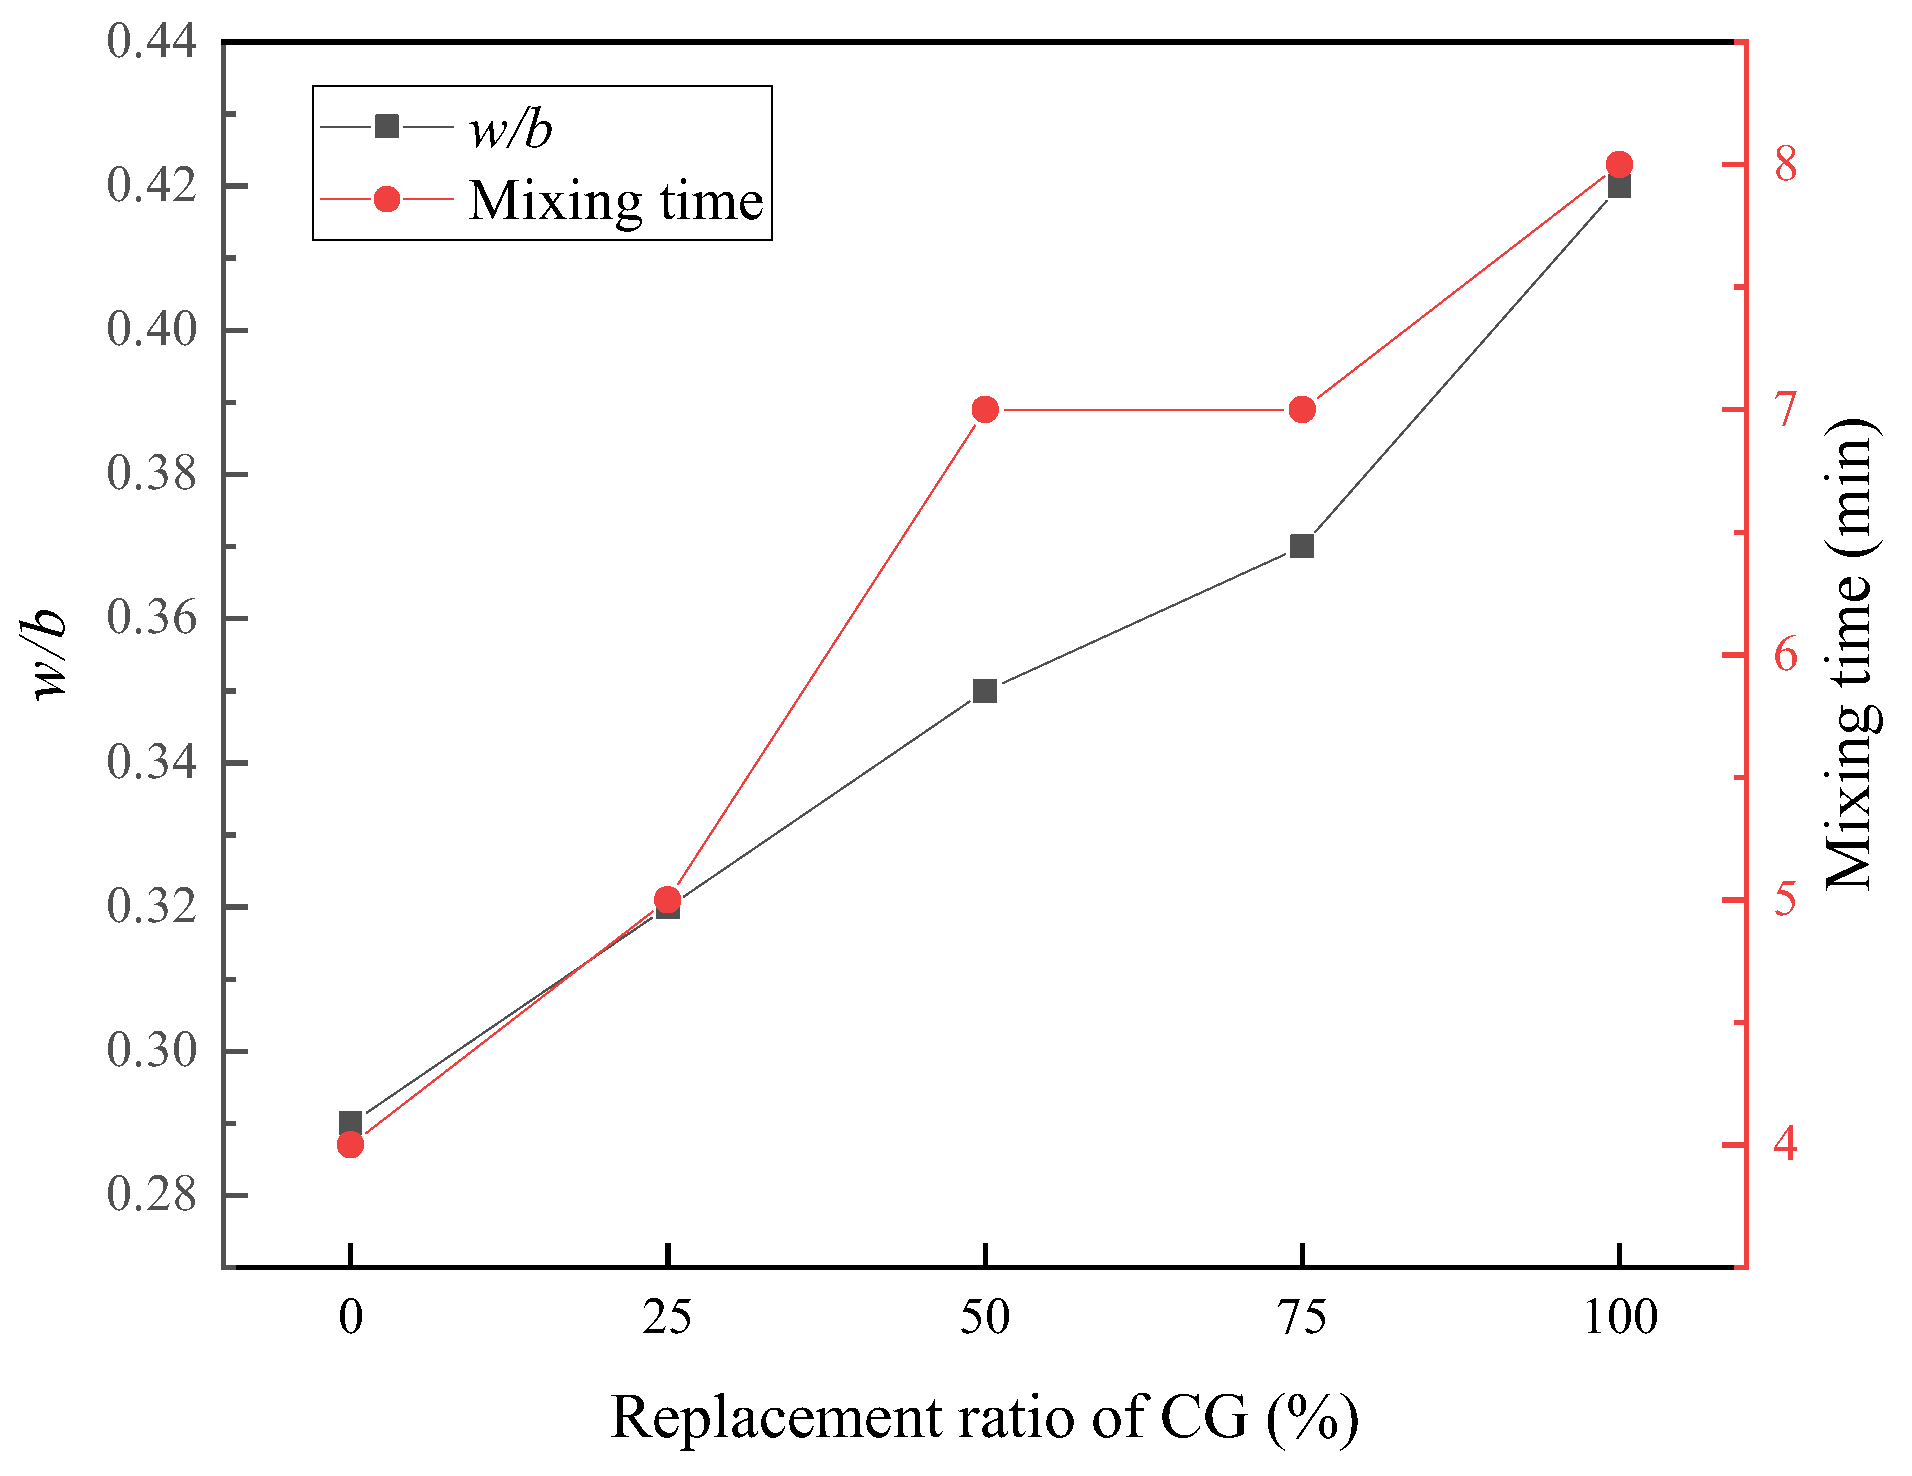
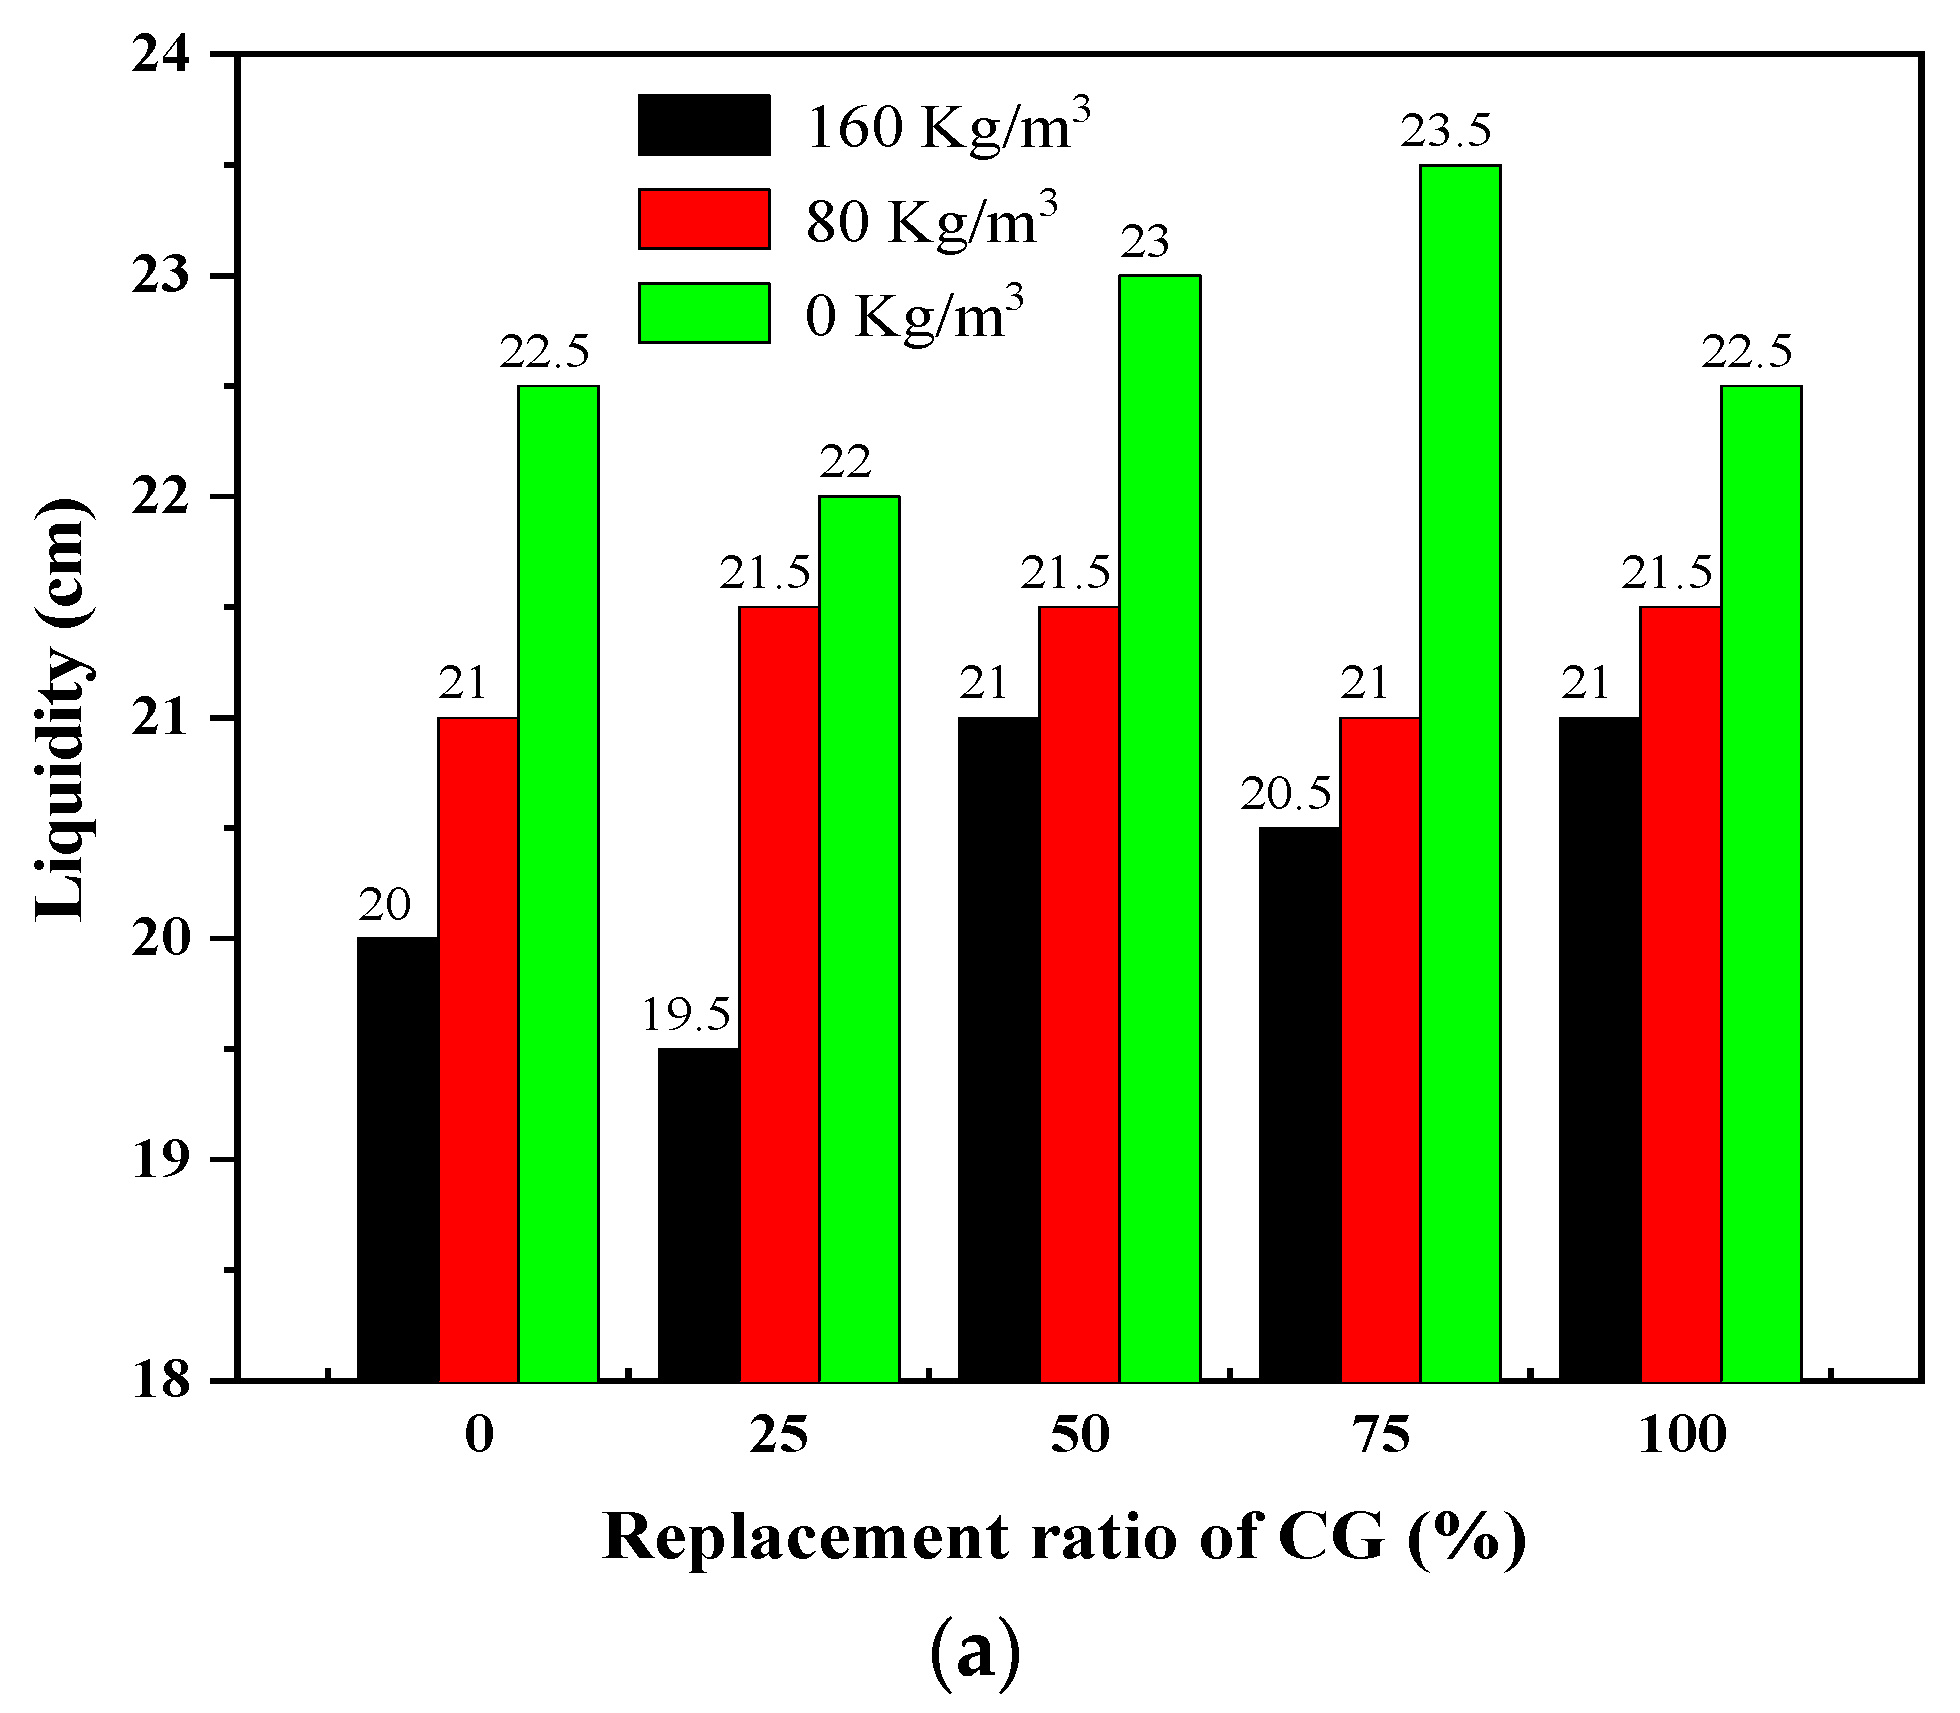
3.1.2. Fluidity
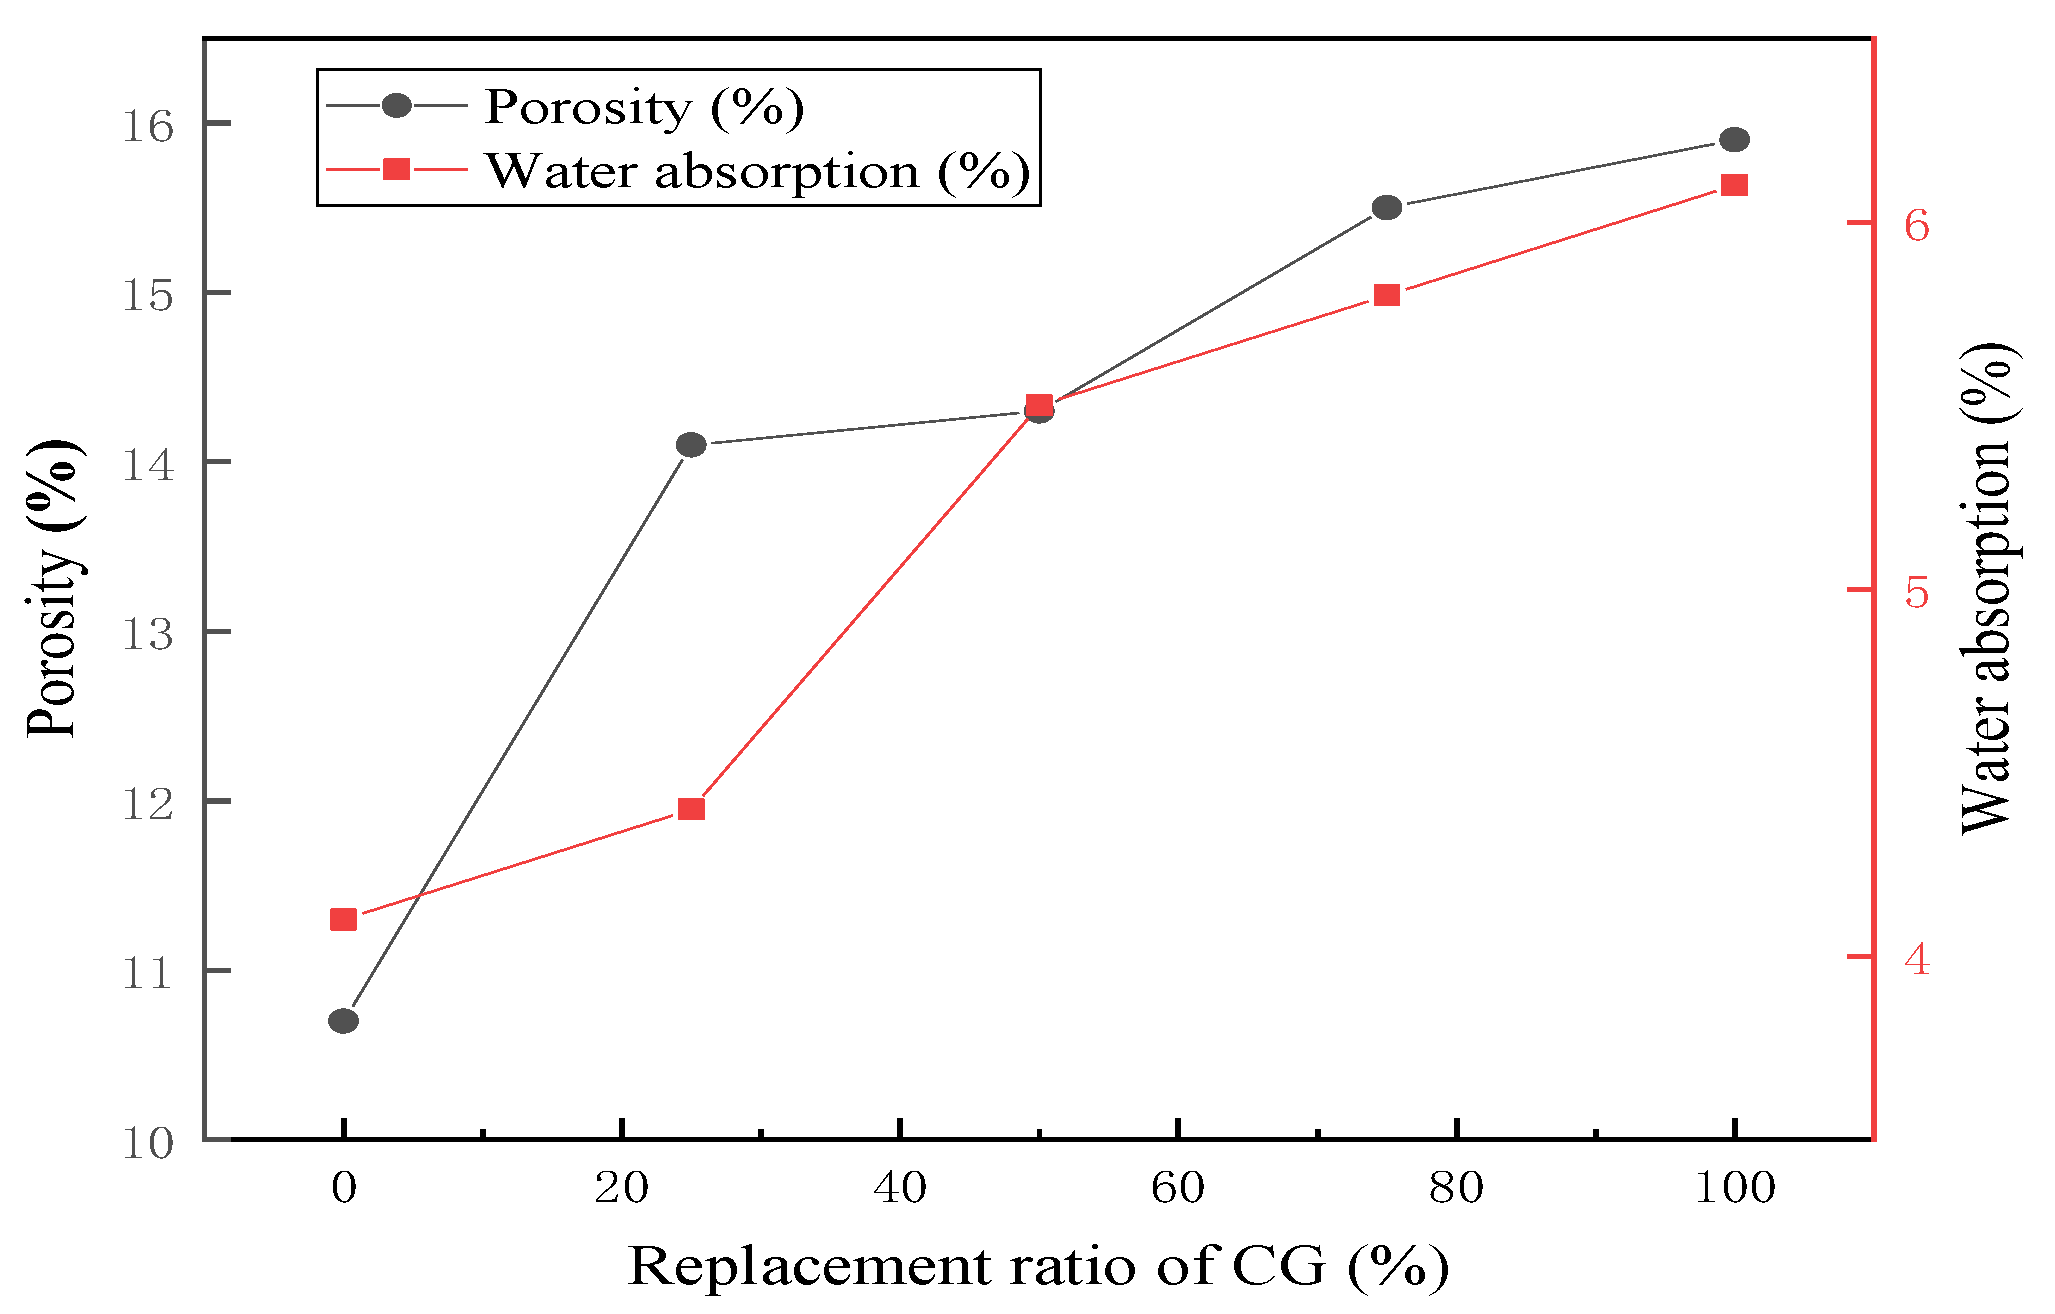
3.1.3. Mechanical Test and Water Absorption
3.2. Mixes with Different Fiber Ratios
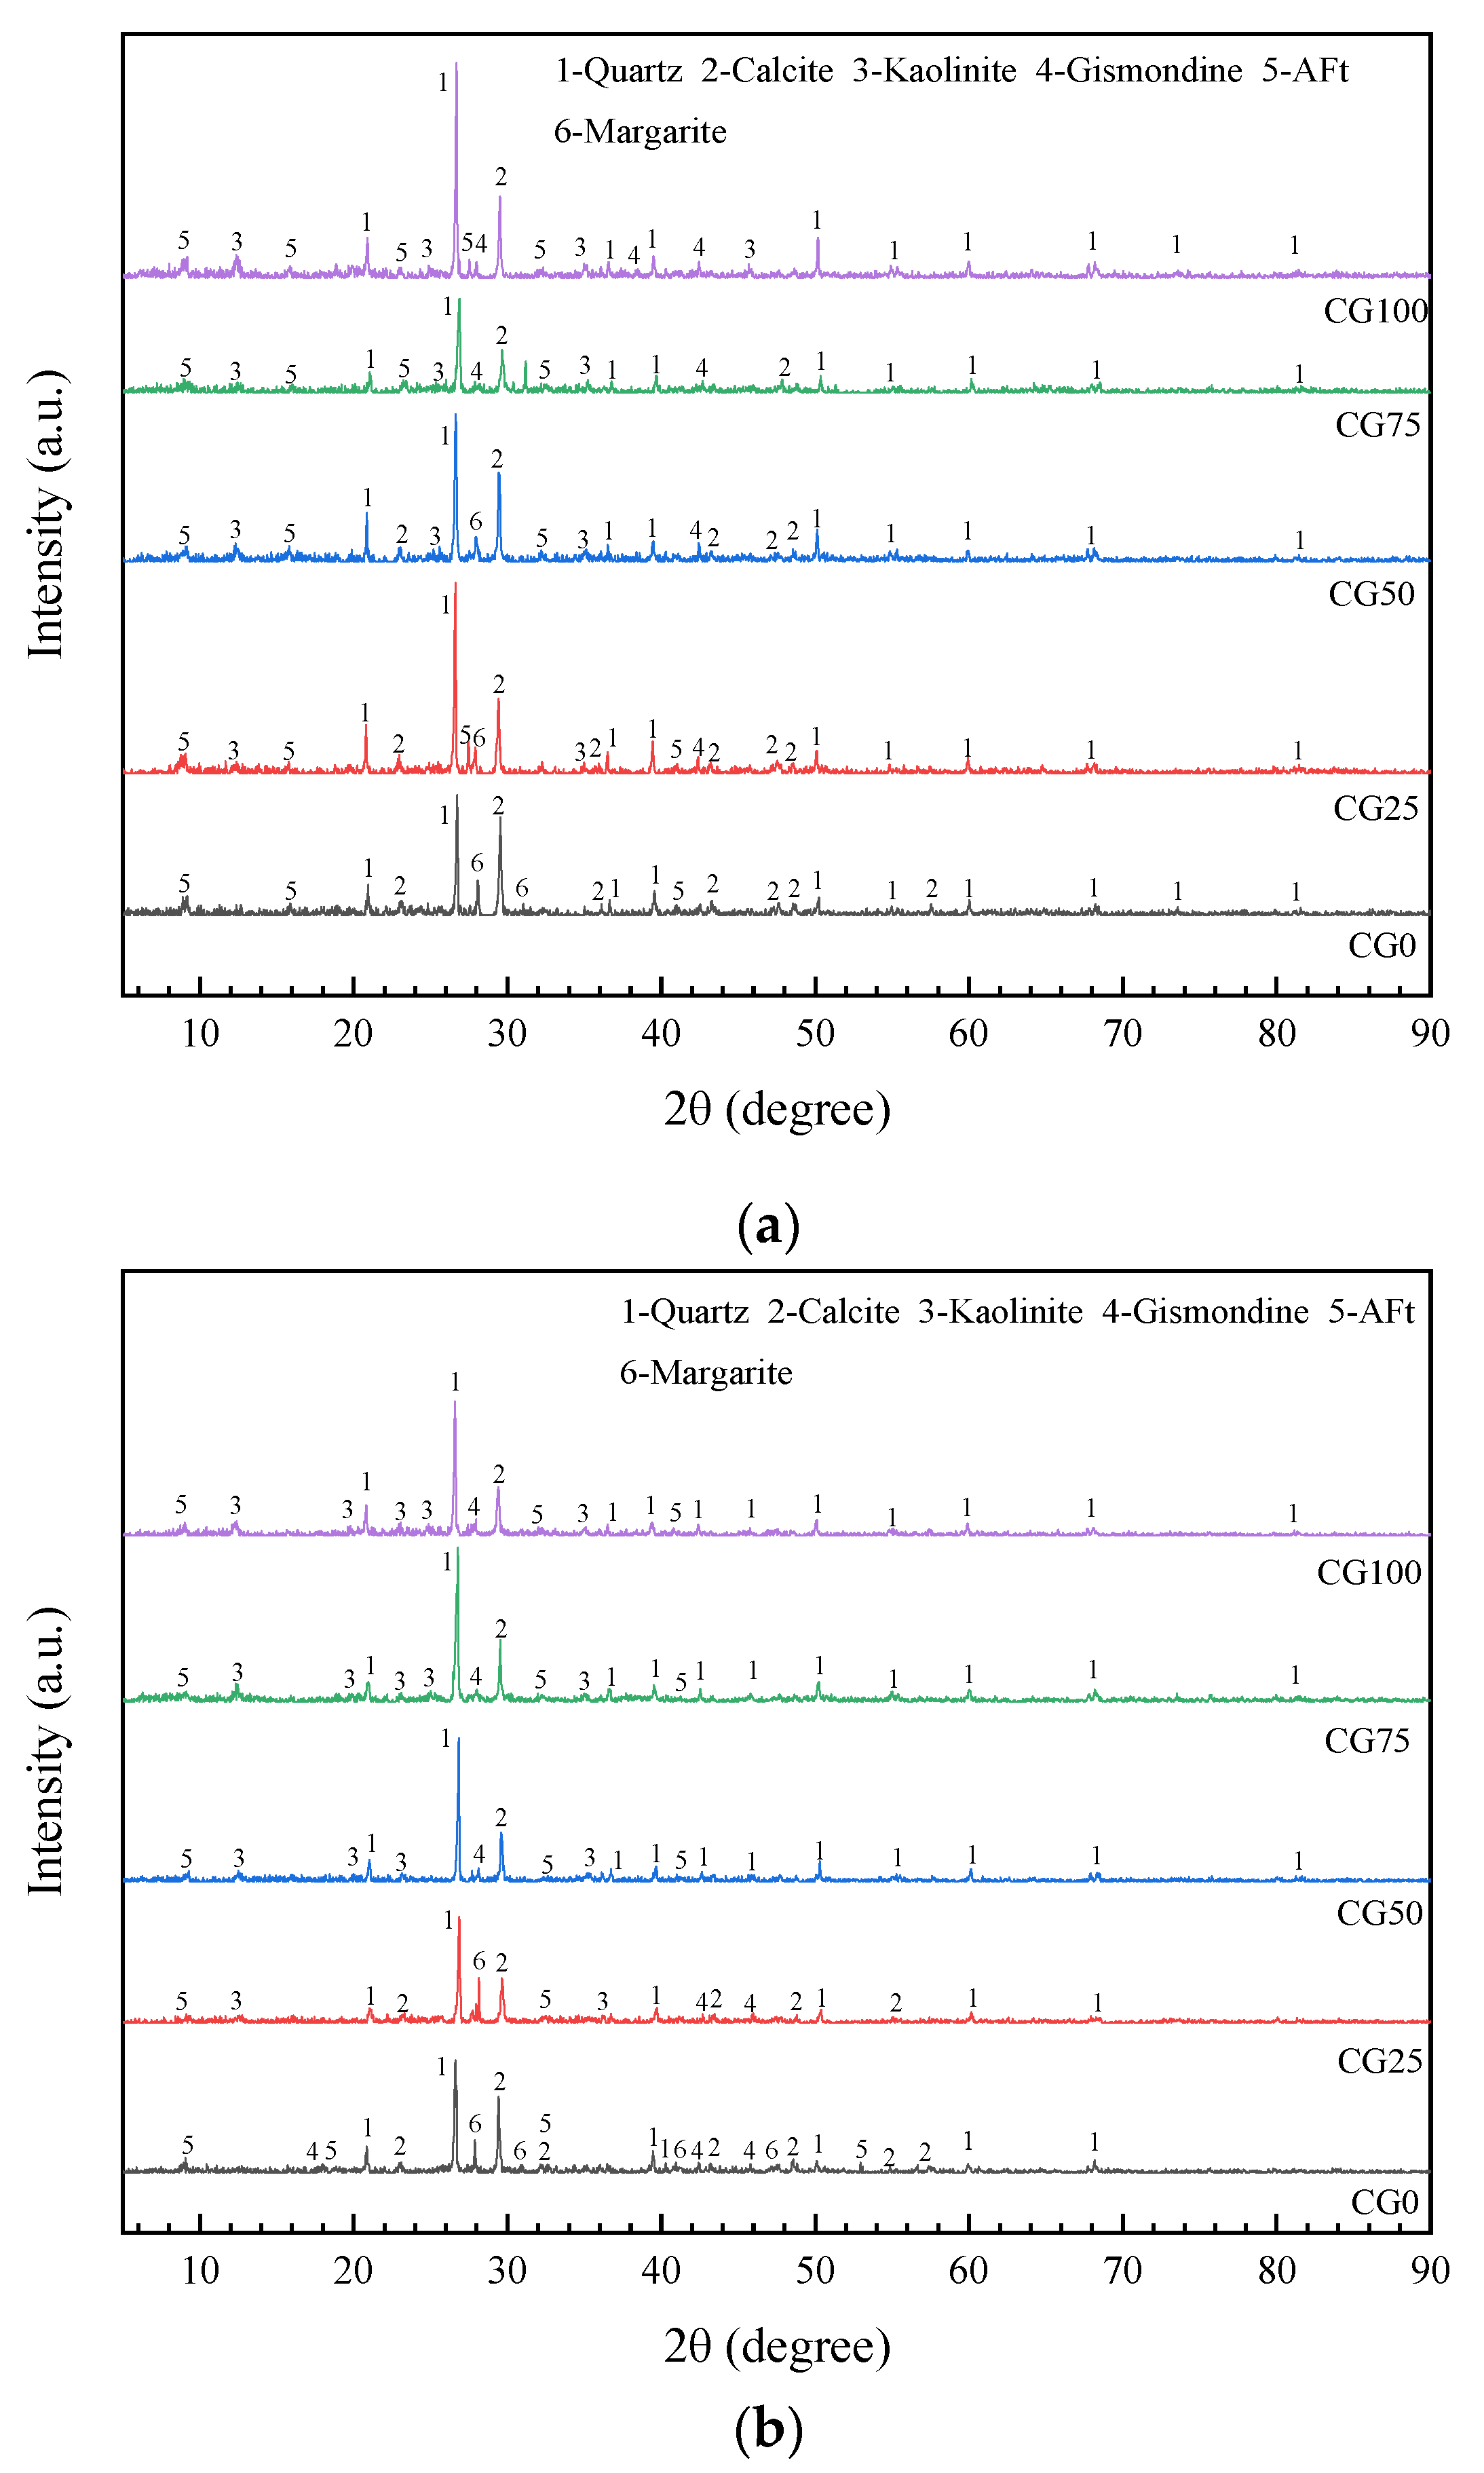
3.3. Hydration
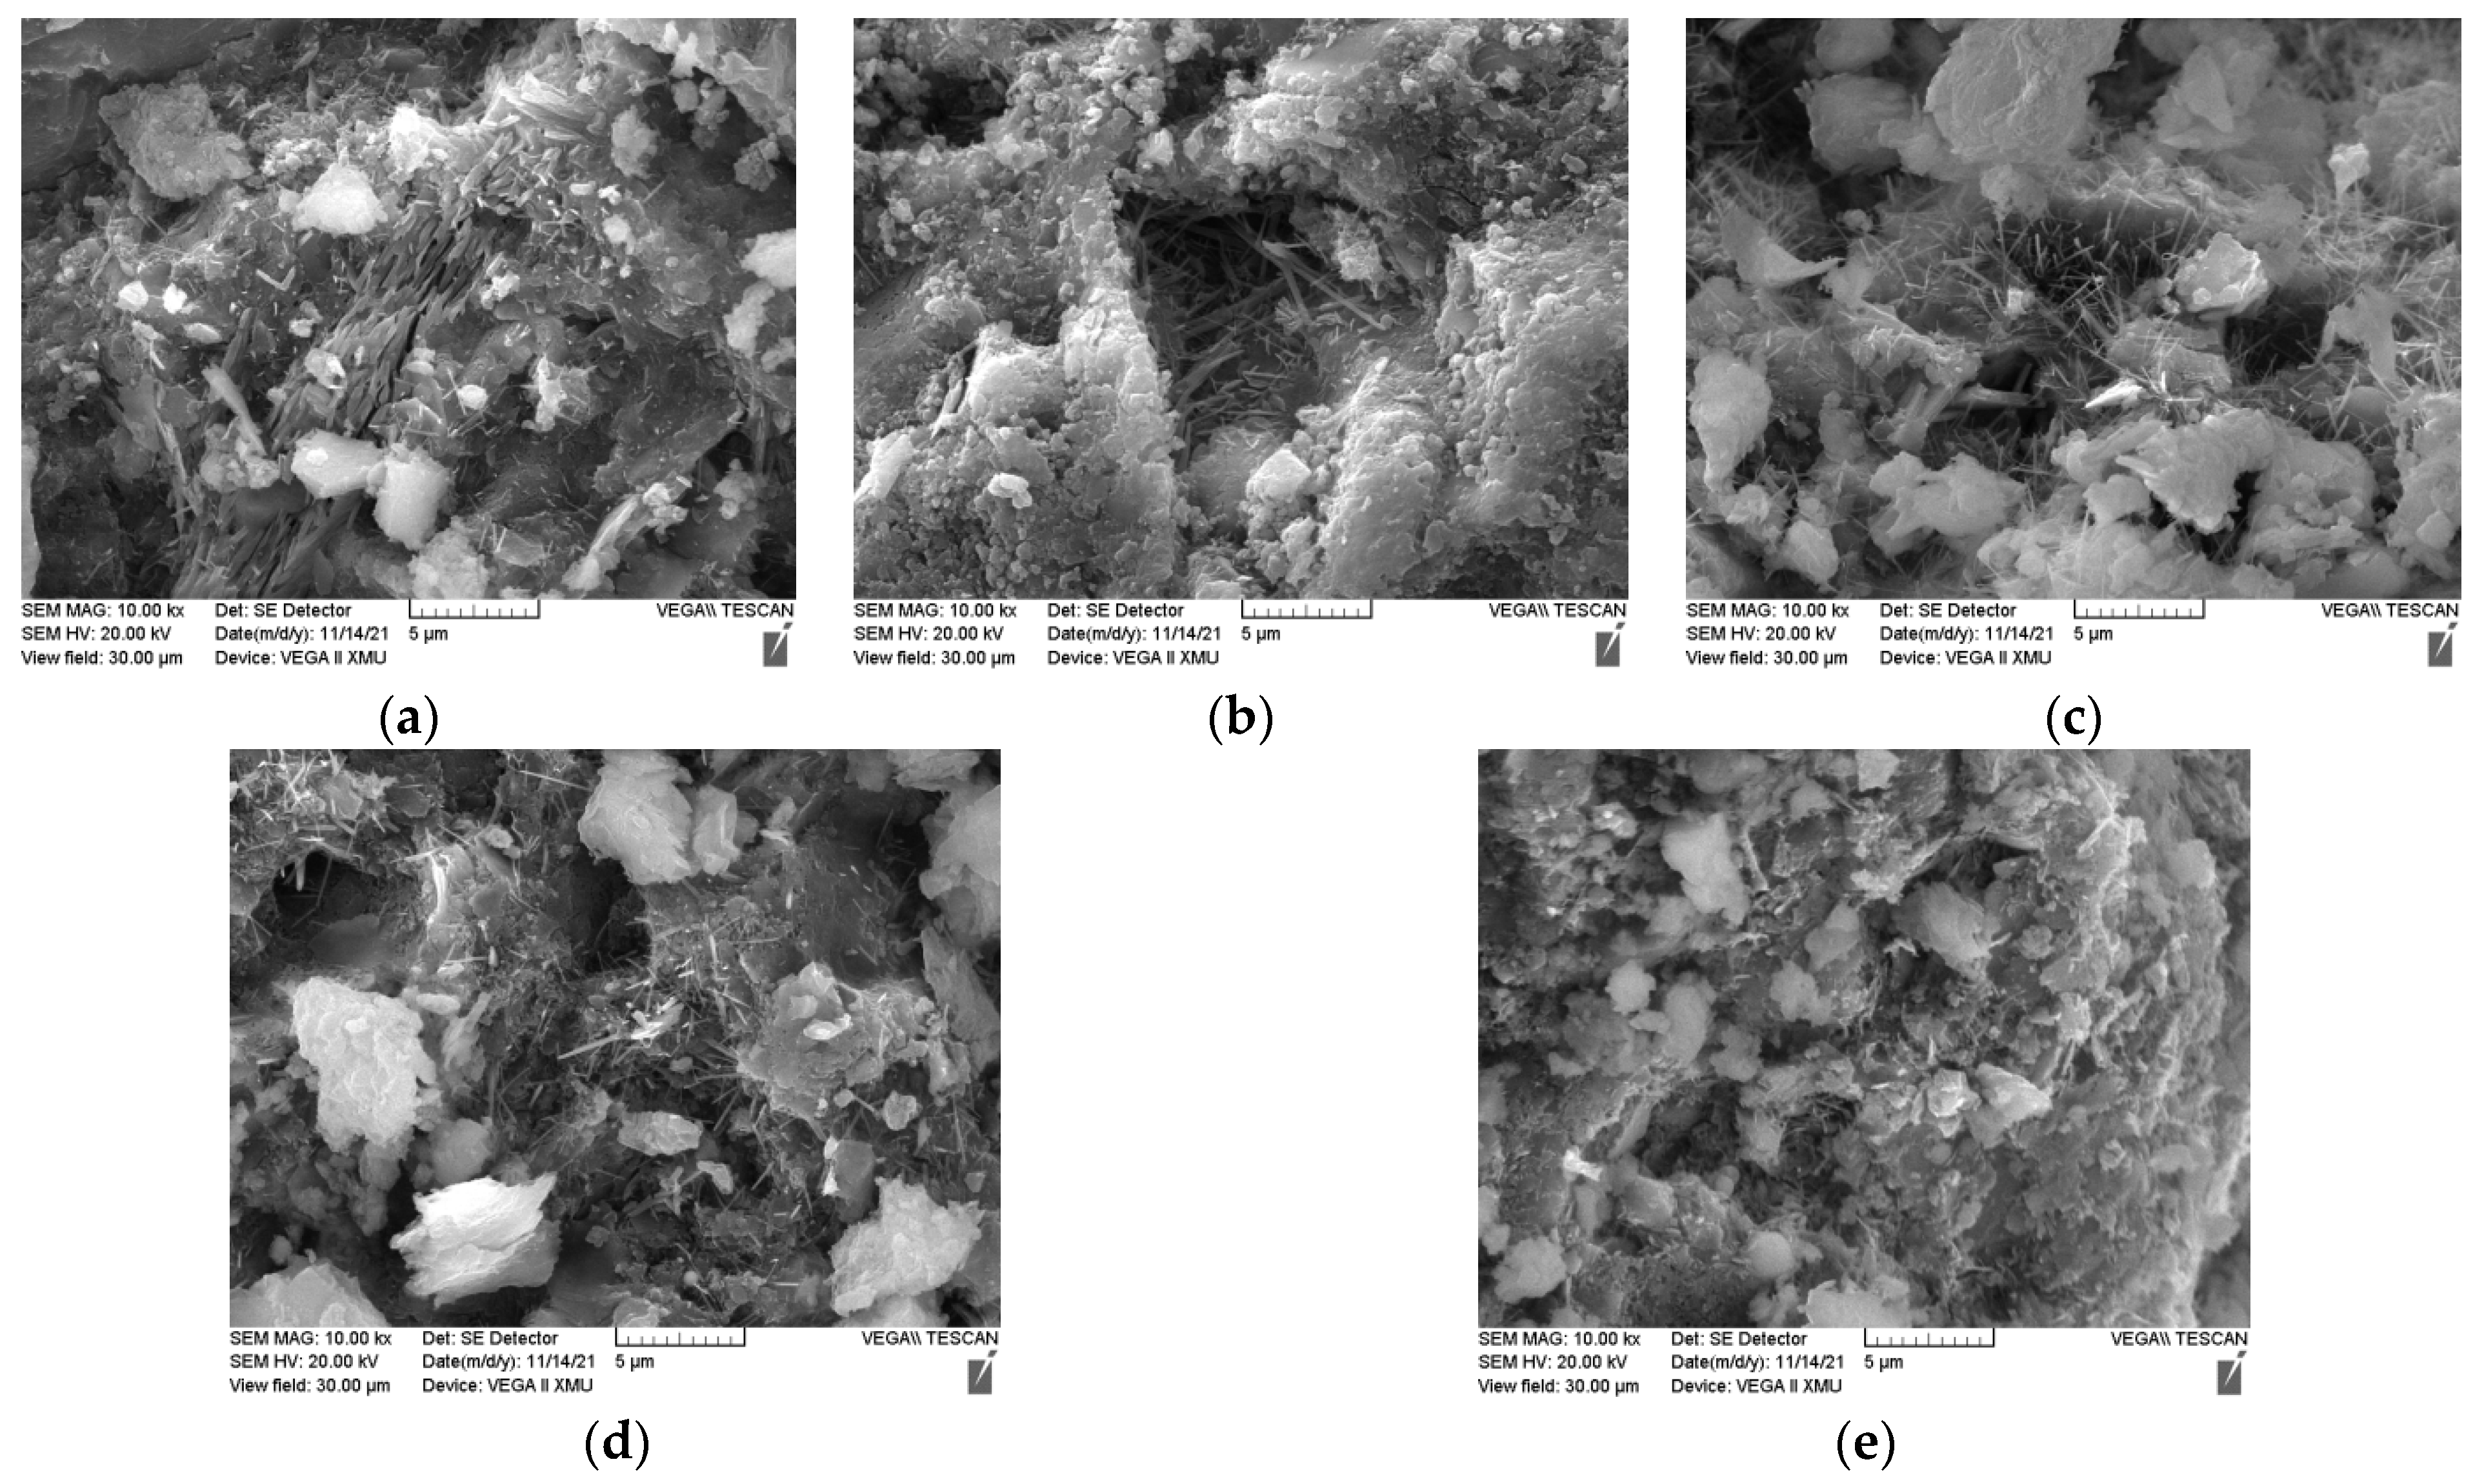
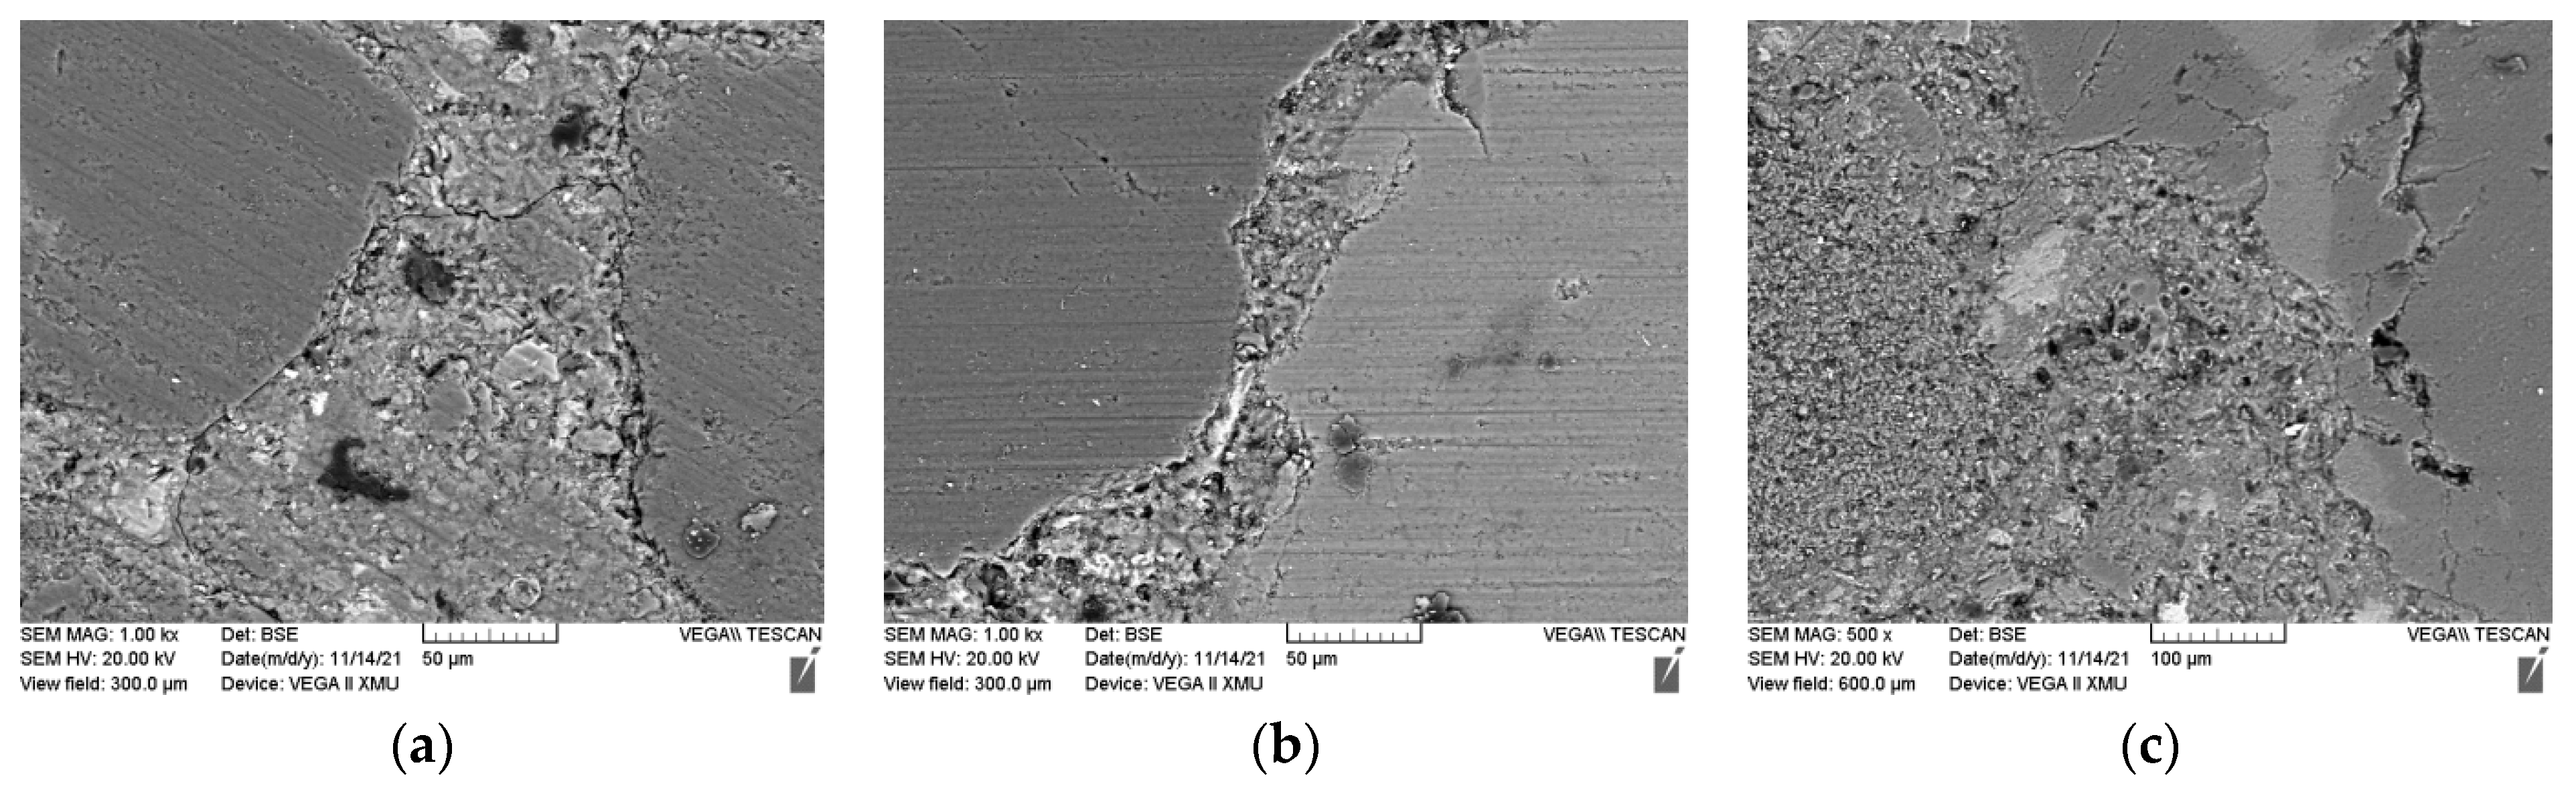
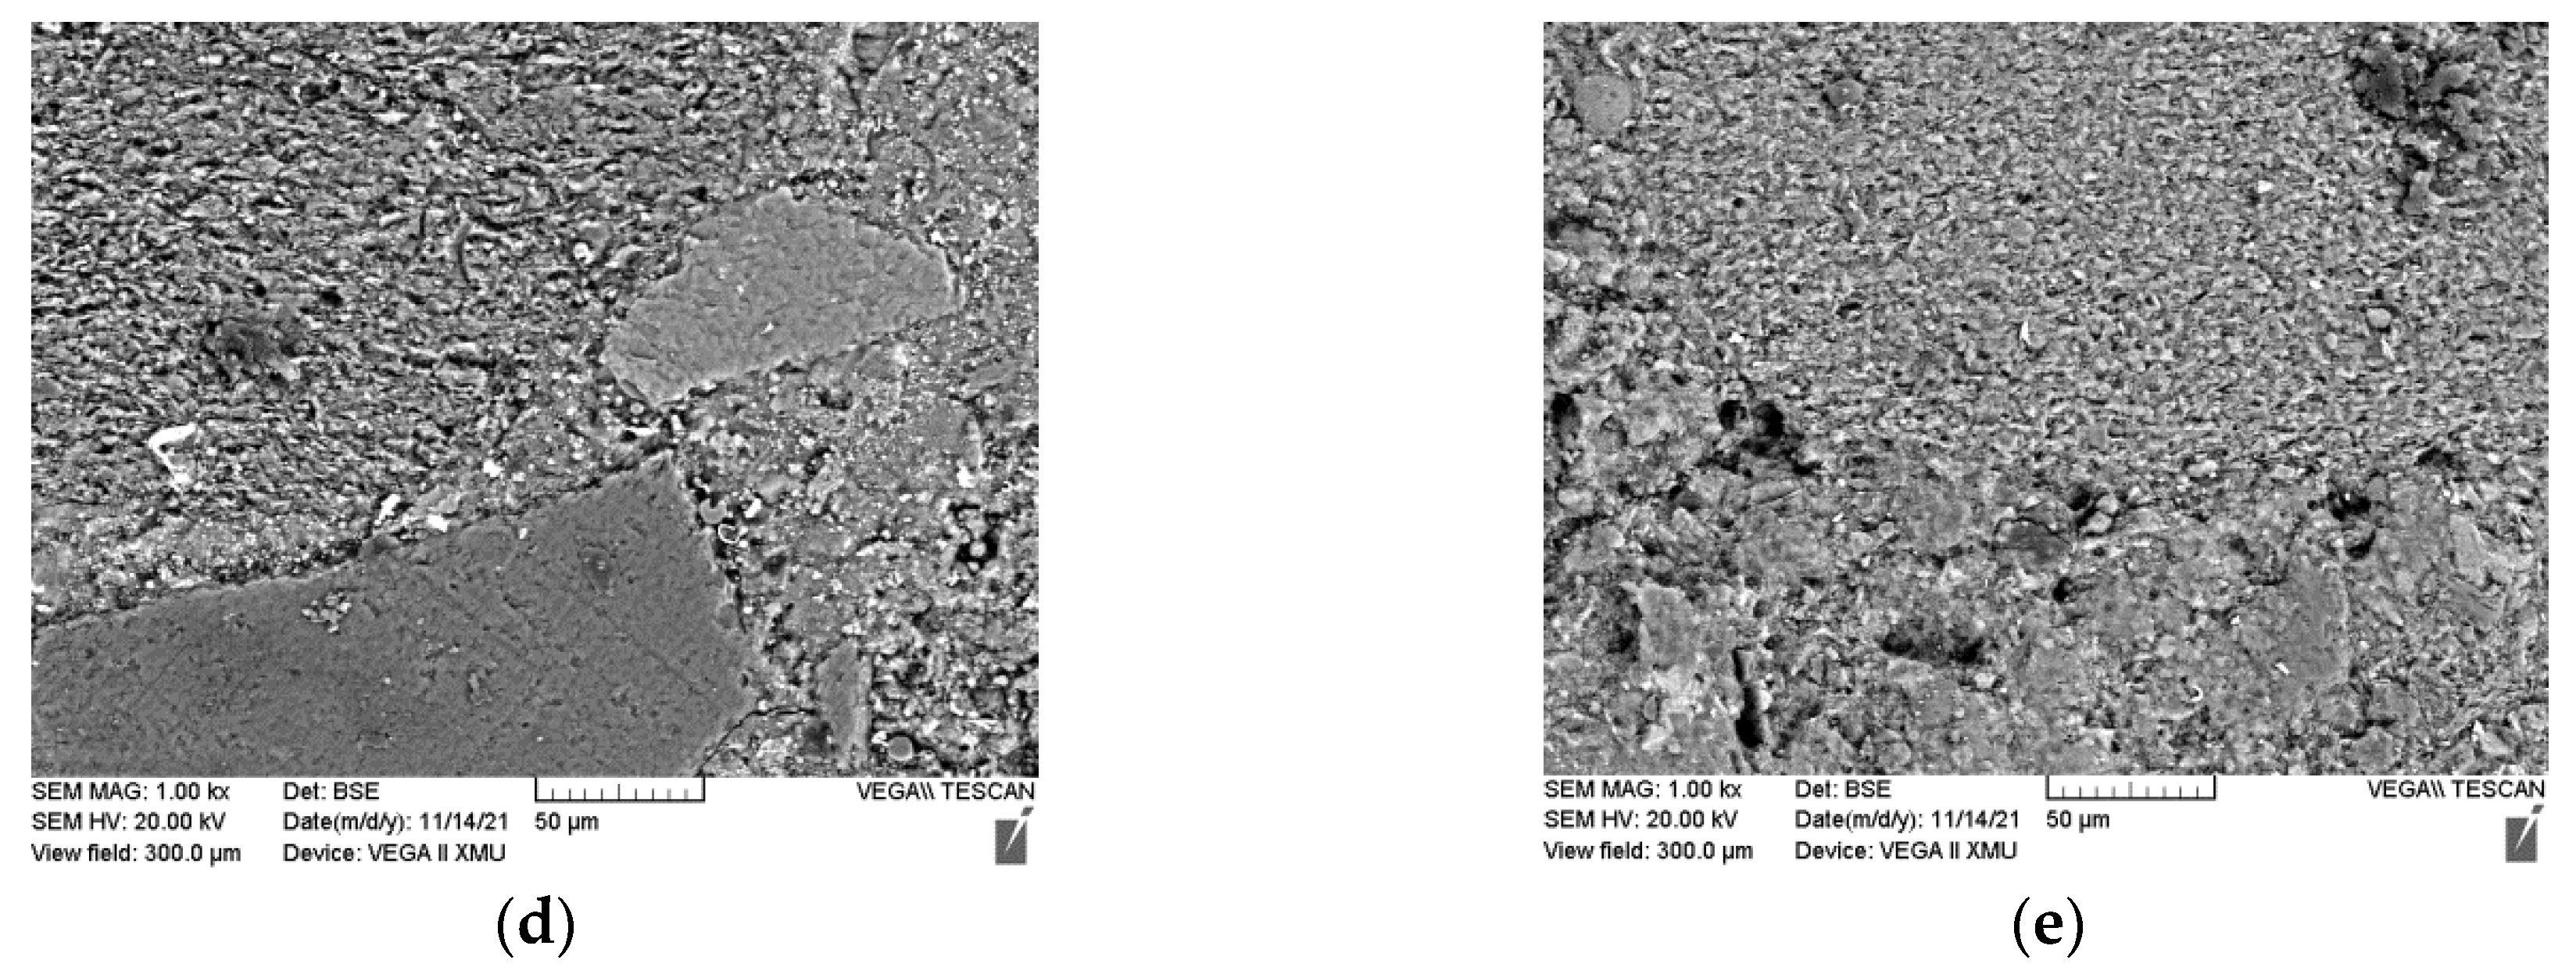
3.4. Microstructure
4. Conclusions
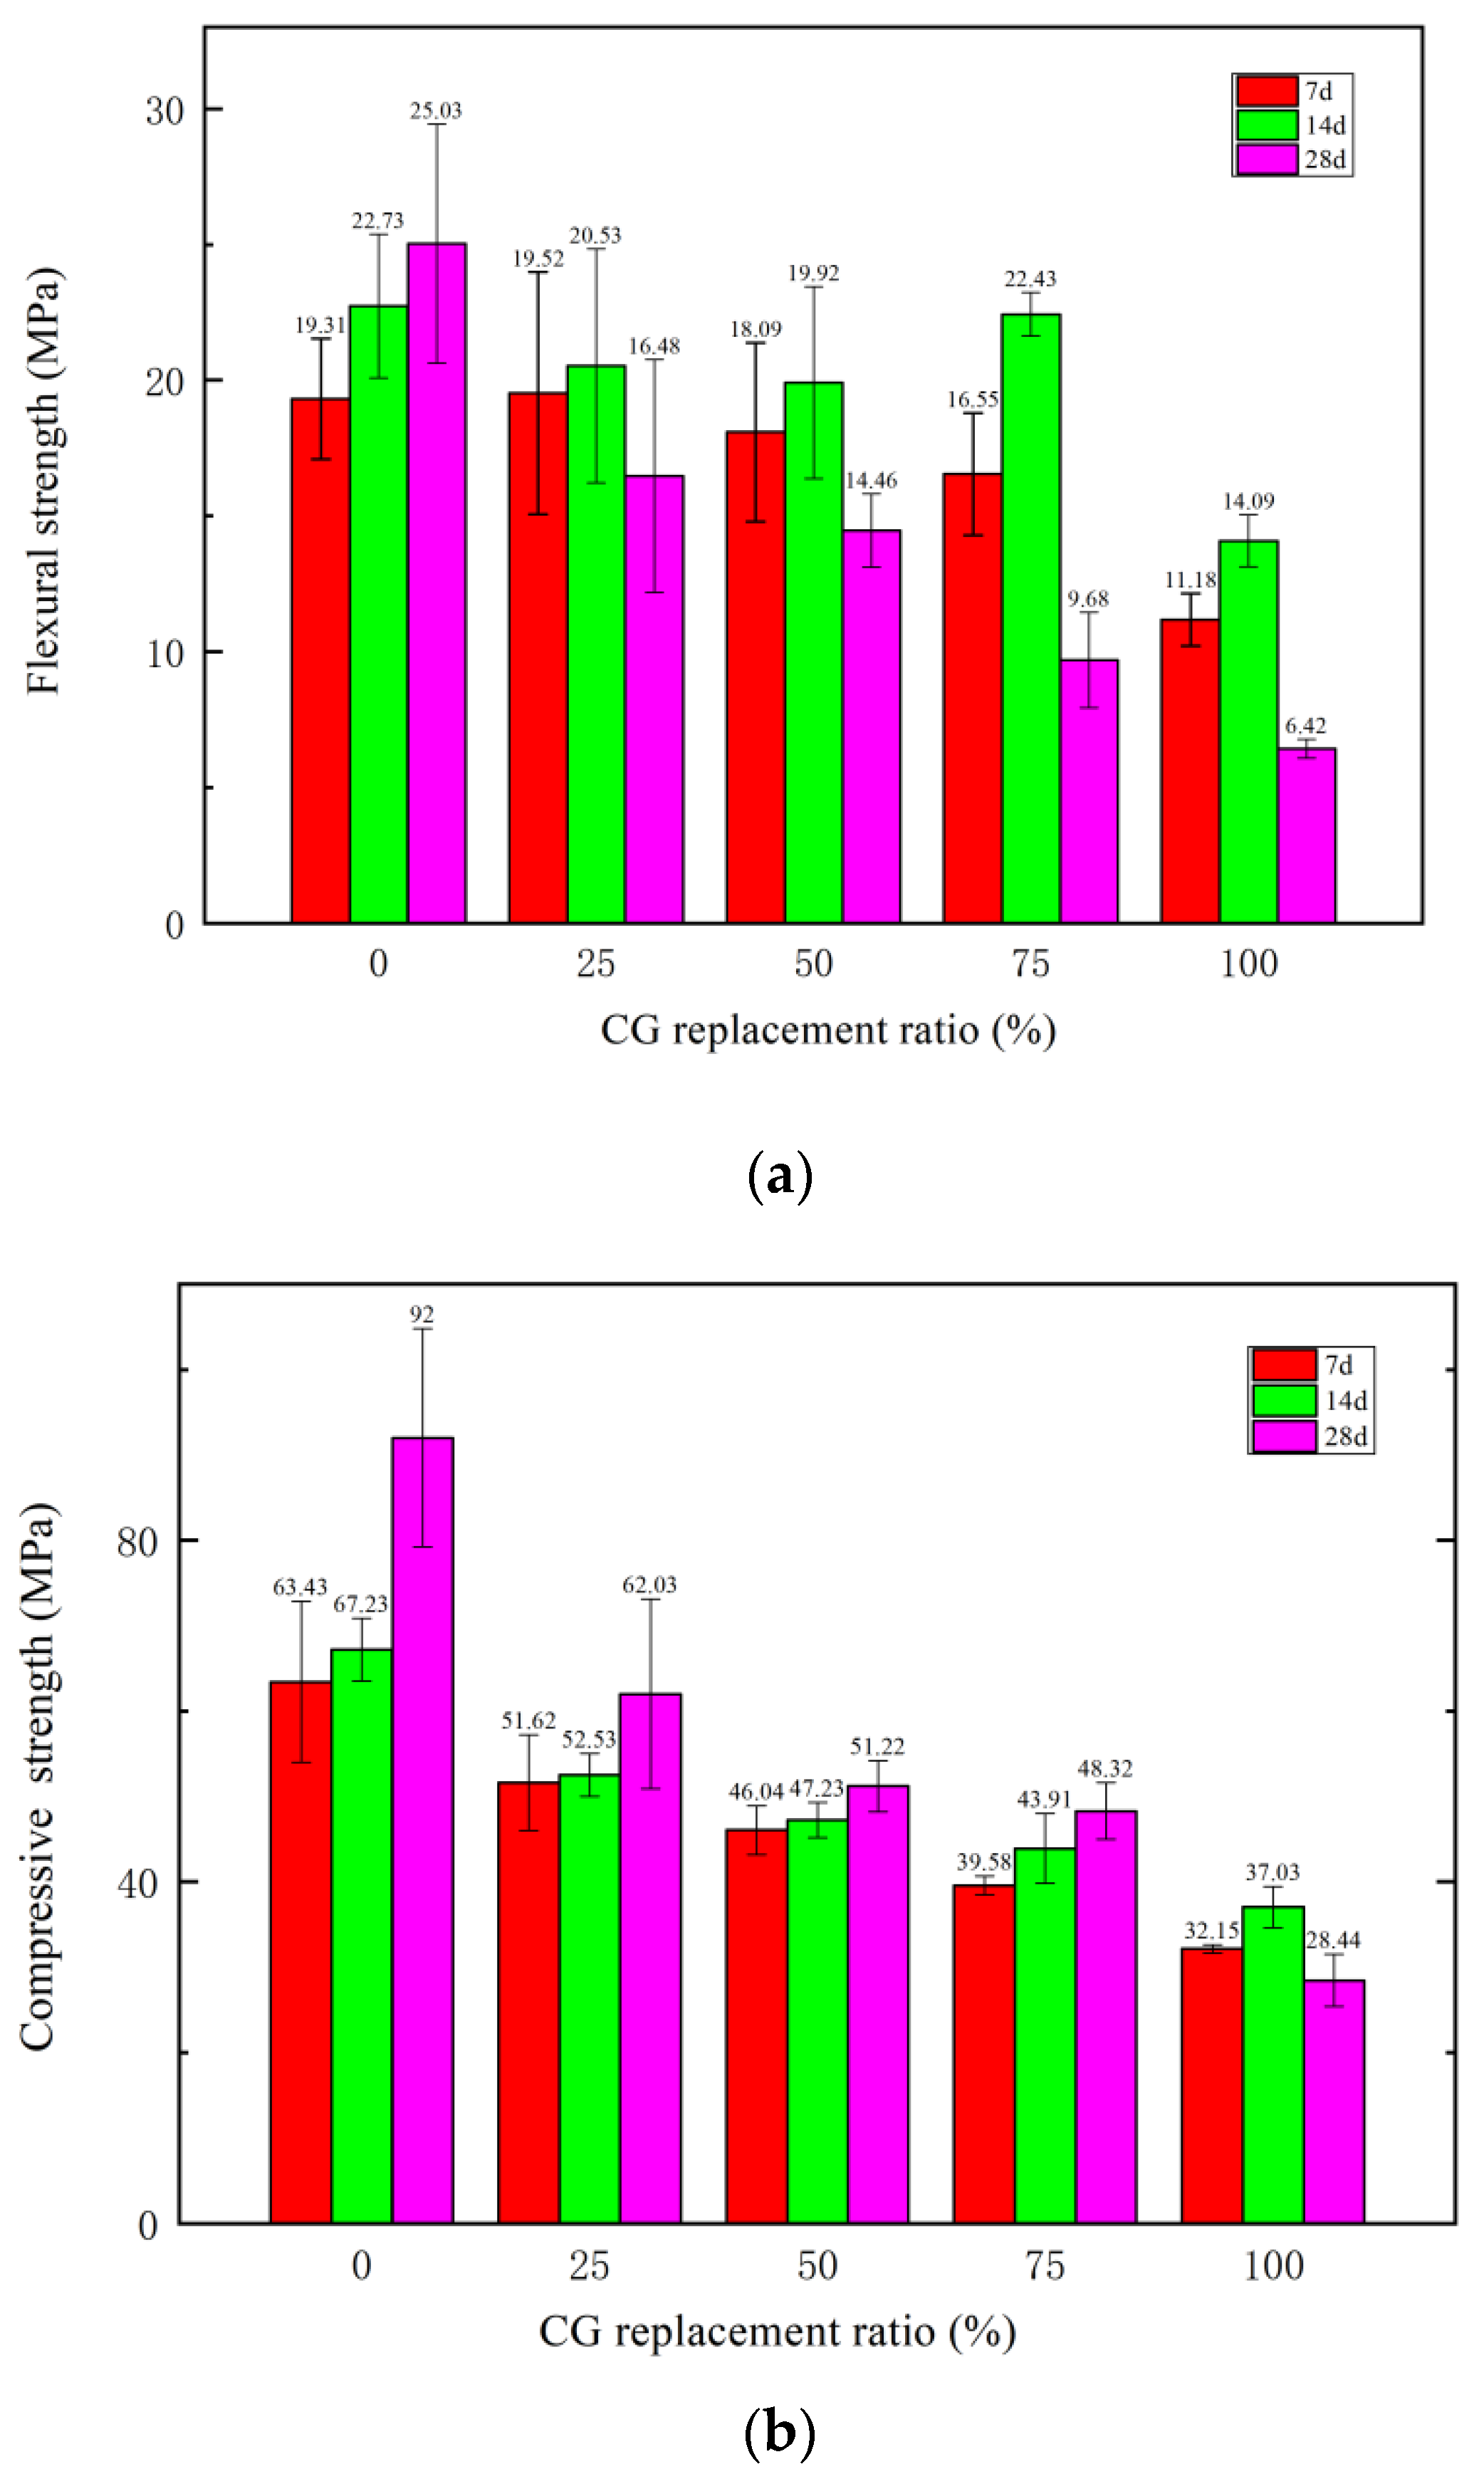
- On days 7 and 14, the flexural strengths of samples with CG/RS weight ratios of 0–75% fluctuated around the mean value. Strengths of samples with CG/RS weight ratios of 100% dropped off. On day 28, the flexural strengths of samples containing CG were all lower than the strengths of samples on days 7 and 14. The flexural strengths of the RPC with a CG/RS replacement ratio of 100% on days 7 and day 14 were 11.18 MPa and 14.09 MPa, respectively, and decreased to 6.42 MPa on day 28.
- The compressive strength of the RPC with a CG/RS ratio of 100% on day 14 was 37.03 MPa, meeting the design requirements of C35 strength grade concrete, but on day 28, the compressive strength had decreased to 28.44 MPa.
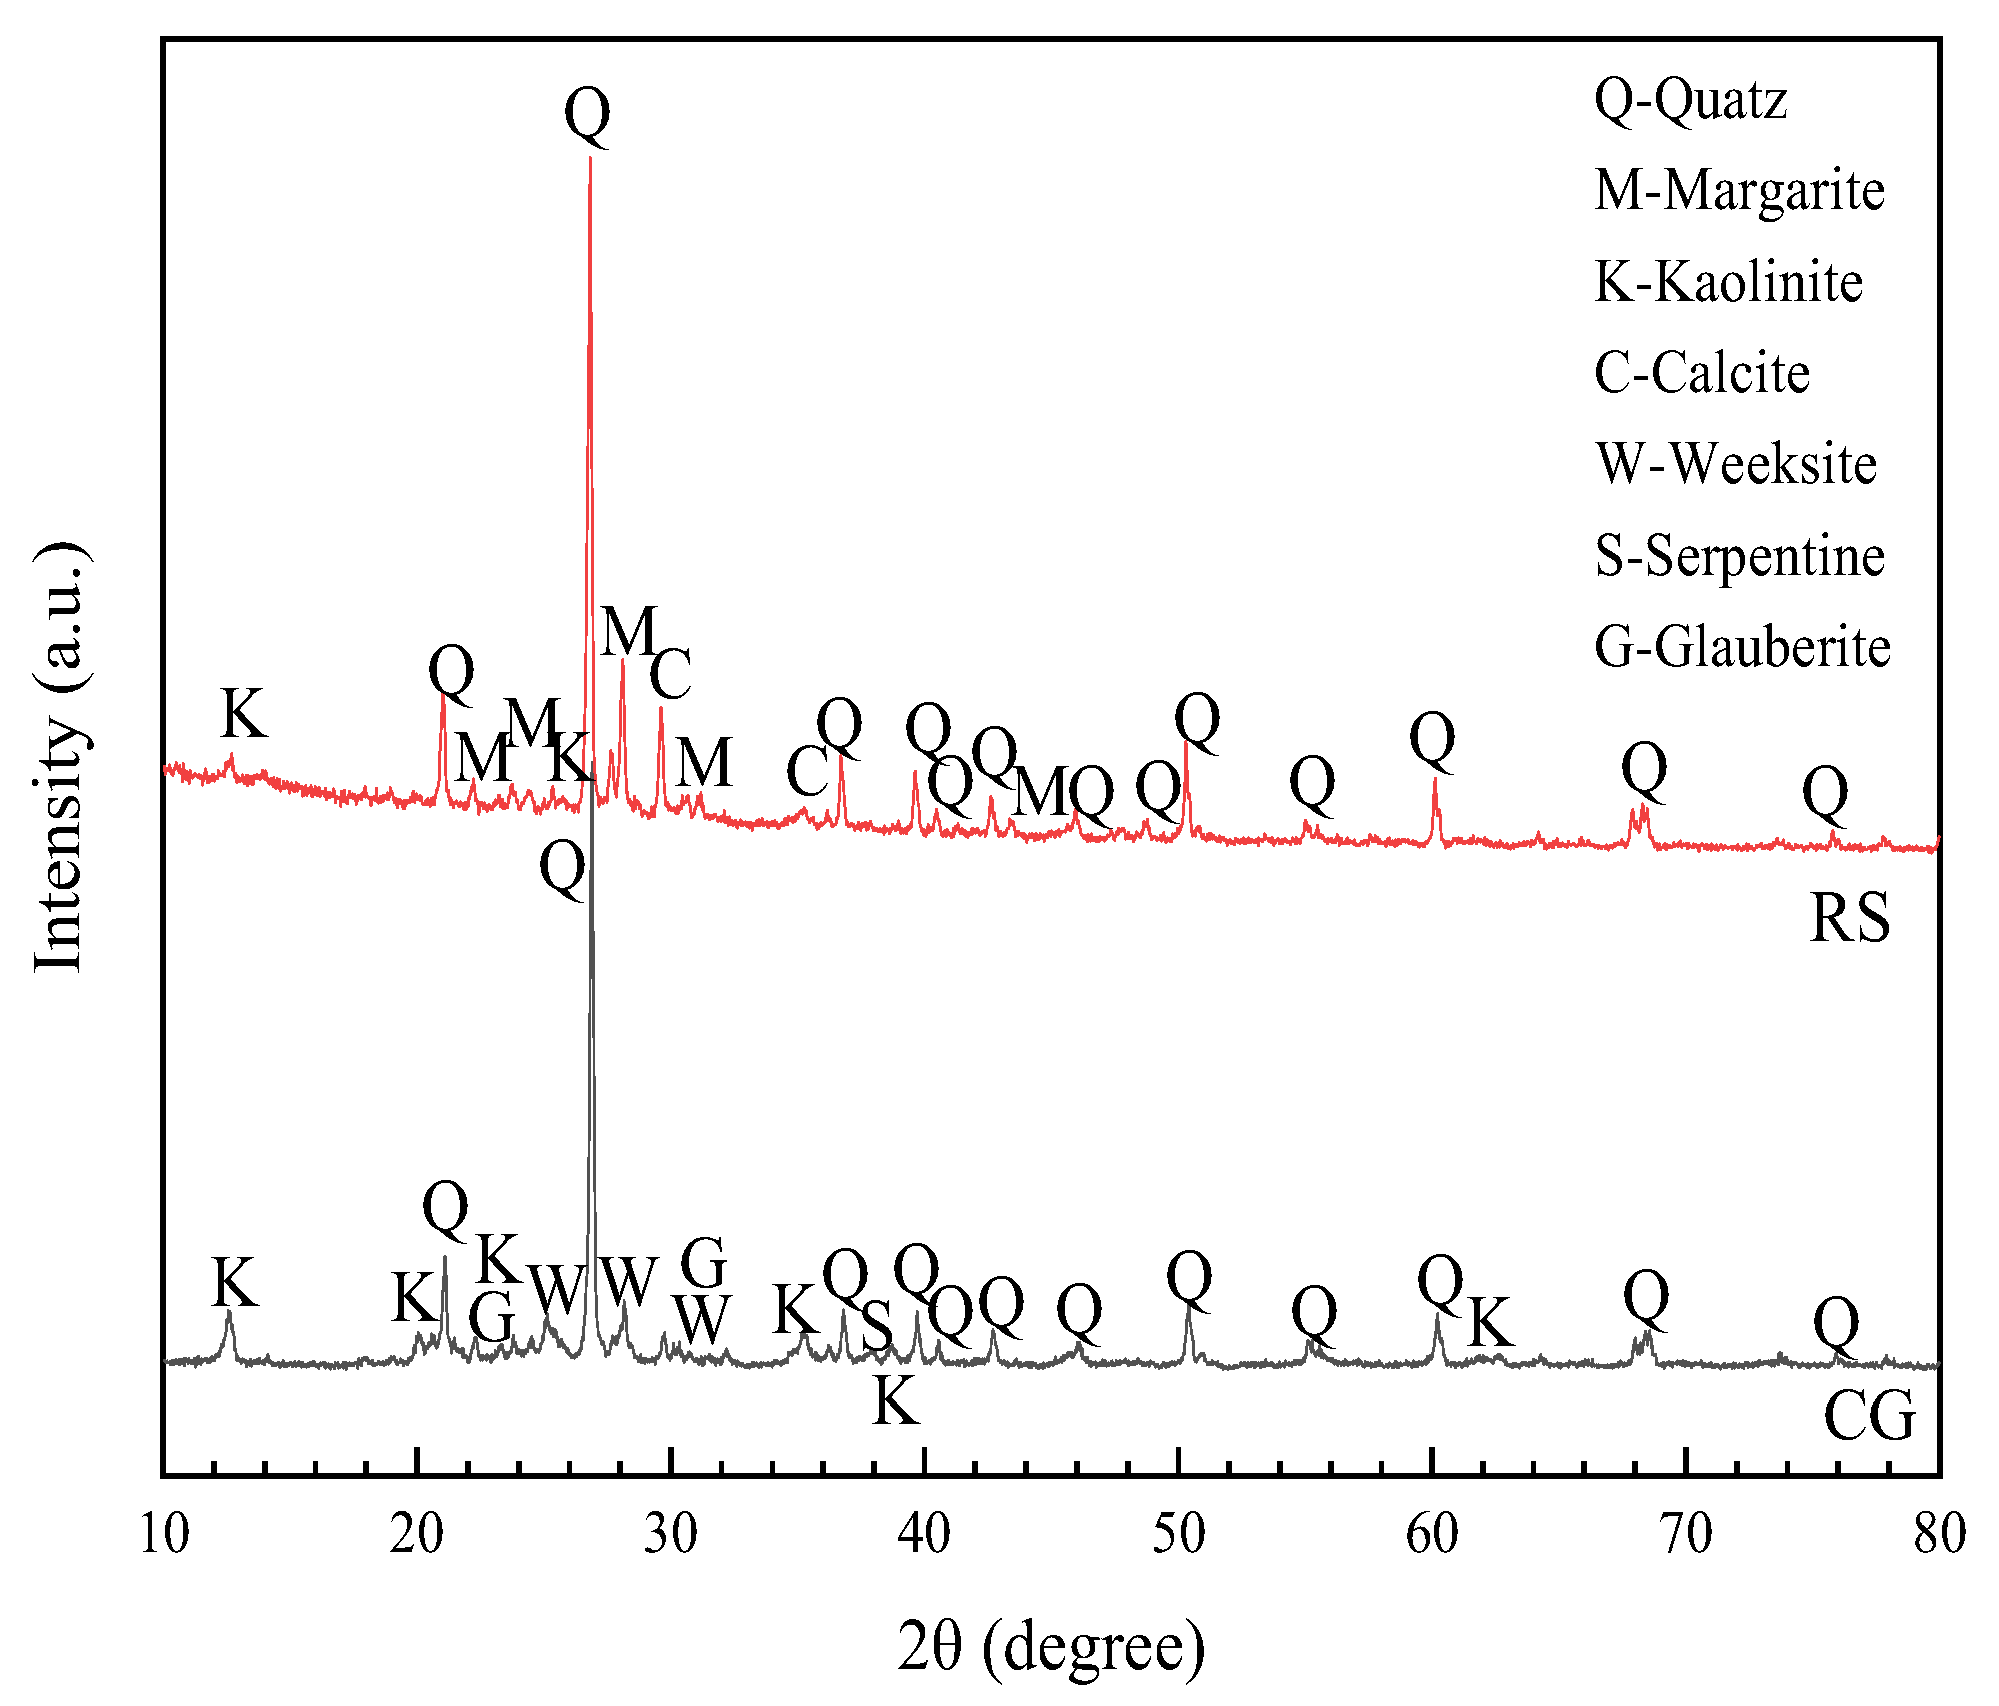
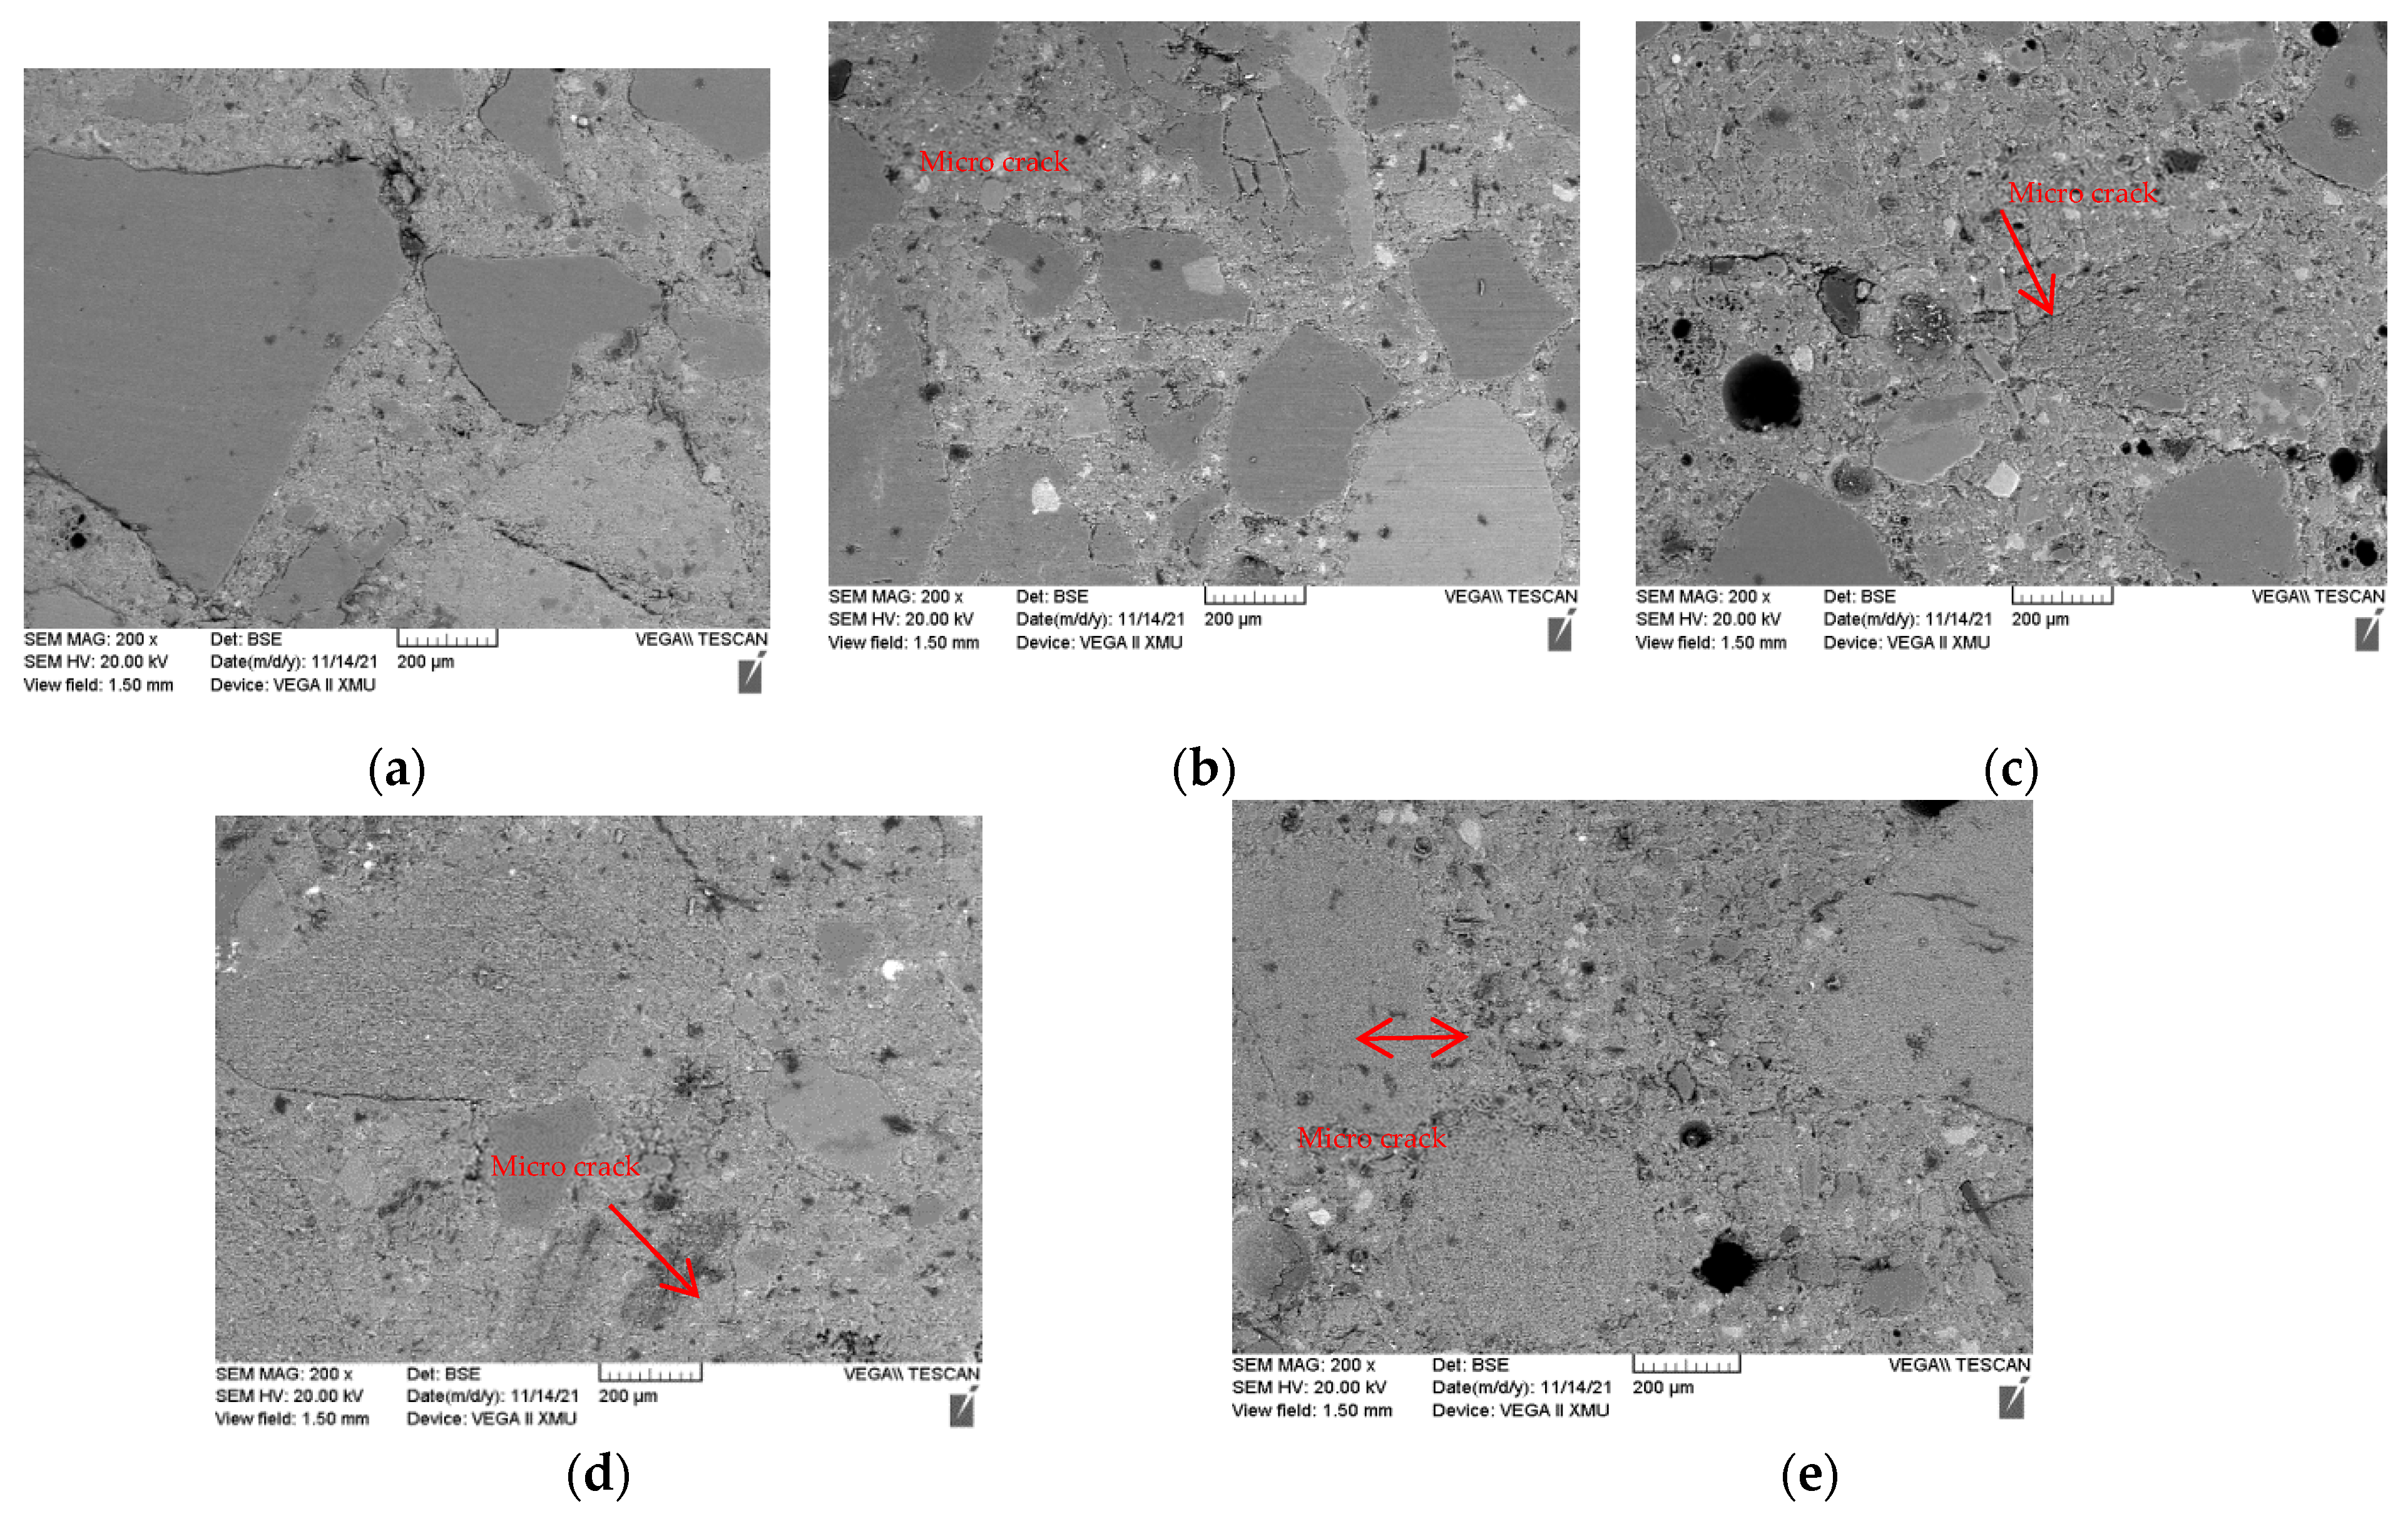
- Strong back shrinkage of strength existed. A low water-to-binder (W/B) ratio caused some microcracks in the hardened cement paste due to its volume expansion, resulting in a degradation in the properties of the RPC matrix. More flexural strength loss than compressive strength loss occurred. Kaolinite participated in the hydration reaction to generate partially hydrated kaolin, which could have been the cause of the back shrinkage of strength.
- Steel fibers greatly improved the compressive strength and tensile strength of the RPC; however, they also decreased the fluidity. With the increasing CG replacement ratio, the main observed hydration products were transferred from AFt to AFt and gismondine. The CG inhibited the hydration reaction in the CG100 compared with that in the CG0.
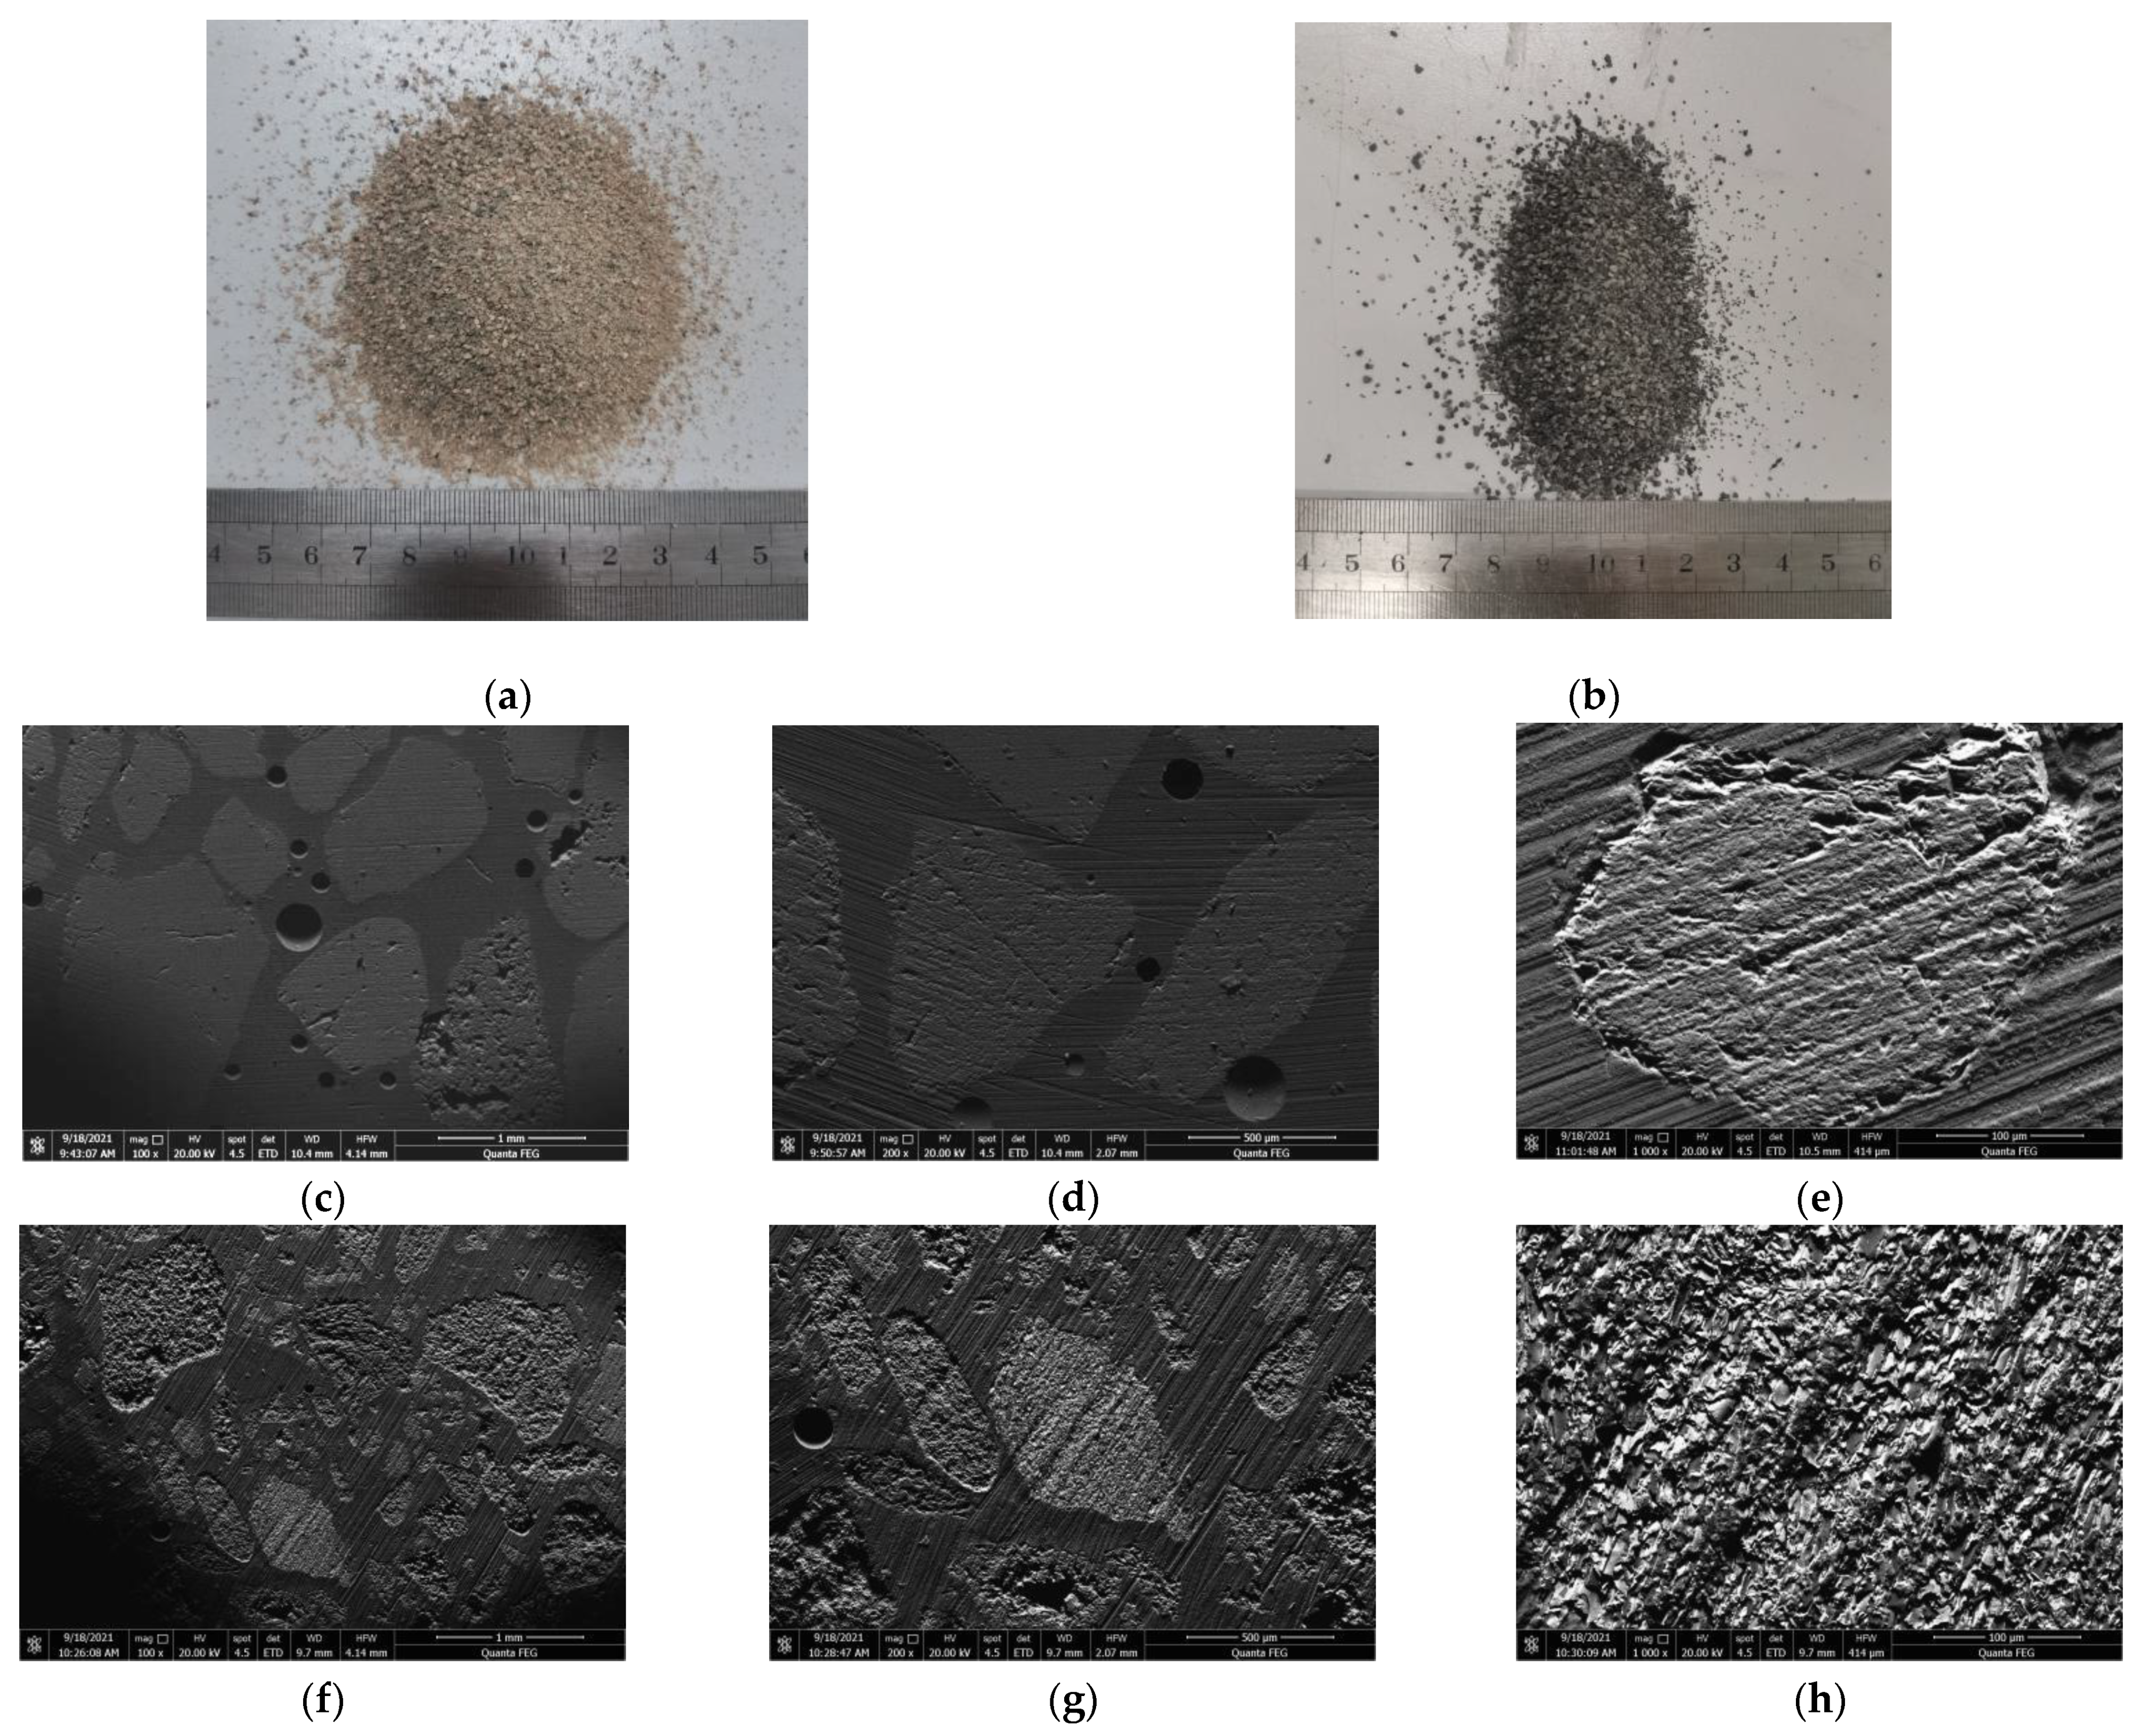
- Compared with natural river sand, the CG sand reduced the working performance, compressive strength, and flexural strength of the RPC. A microscopic analysis showed that on day 28, increasing the CG ratio inhibited cement hydration, weakened the interface transition zone, and led to the degradation in RPC performance. Modification of the CG sand would be helpful to obtain higher-strength concrete.
Author Contributions
Funding
Institutional Review Board Statement
Informed Consent Statement
Data Availability Statement
Conflicts of Interest
References
- Haibin, L.; Zhenling, L. Recycling utilization patterns of coal mining waste in China. Resour. Conserv. Recycl. 2010, 54, 1331–1340. [Google Scholar] [CrossRef]
- Zhou, C.; Liu, G.; Wu, D.; Fang, T.; Wang, R.; Fan, X. Mobility behavior and environmental implications of trace elements associated with coal gangue: A case study at the Huainan Coalfield in China. Chemosphere 2014, 95, 193–199. [Google Scholar]
- Wu, H.; Wen, Q.; Hu, L.; Gong, M.; Tang, Z. Feasibility study on the application of coal gangue as landfill liner material. Waste Manag. 2017, 63, 161–171. [Google Scholar] [CrossRef]
- Gao, S.; Zhao, G.; Guo, L.; Zhou, L.; Yuan, K. Utilization of coal gangue as coarse aggregates in structural concrete. Constr. Build. Mater. 2021, 268, 121212. [Google Scholar] [CrossRef]
- Zhou, M.; Dou, Y.; Zhang, Y.; Zhang, Y.; Zhang, B. Effects of the variety and content of coal gangue coarse aggregate on the mechanical properties of concrete. Constr. Build. Mater. 2019, 220, 386–395. [Google Scholar] [CrossRef]
- Li, Y.; Liu, S.; Guan, X. Multitechnique investigation of concrete with coal gangue. Constr. Build. Mater. 2021, 301, 124114. [Google Scholar] [CrossRef]
- Lee, M.-G.; Wang, Y.-C.; Chiu, C.-T. A preliminary study of reactive powder concrete as a new repair material. Constr. Build. Mater. 2007, 21, 182–189. [Google Scholar] [CrossRef]
- Yazıcı, H.; Yardımcı, M.Y.; Aydın, S.; Karabulut, A.Ş. Mechanical properties of reactive powder concrete containing mineral admixtures under different curing regimes. Constr. Build. Mater. 2009, 23, 1223–1231. [Google Scholar] [CrossRef]
- Zhang, Y.; Ling, T.-C. Reactivity activation of waste coal gangue and its impact on the properties of cement-based materials–a review. Constr. Build. Mater. 2020, 234, 117424. [Google Scholar] [CrossRef]
- Li, J.; Yue, C.; Zhang, M.; Wang, X.; Zhang, Z. Facile and economical preparation of SiAlON-based composites using coal gangue: From fundamental to industrial application. Energies 2015, 8, 7428–7440. [Google Scholar] [CrossRef] [Green Version]
- Yazıcı, H.; Yiğiter, H.; Karabulut, A.Ş.; Baradan, B. Utilization of fly ash and ground granulated blast furnace slag as an alternative silica source in reactive powder concrete. Fuel 2008, 87, 2401–2407. [Google Scholar] [CrossRef]
- Richard, P.; Cheyrezy, M. Composition of reactive powder concretes. Cem. Concr. Res. 1995, 25, 1501–1511. [Google Scholar] [CrossRef]
- Liu, T.; Wei, H.; Zou, D.; Zhou, A.; Jian, H. Utilization of waste cathode ray tube funnel glass for ultra-high performance concrete. J. Clean. Prod. 2020, 249, 119333. [Google Scholar] [CrossRef]
- Jiao, Y.; Zhang, Y.; Guo, M.; Zhang, L.; Ning, H.; Liu, S. Mechanical and fracture properties of ultra-high performance concrete (UHPC) containing waste glass sand as partial replacement material. J. Clean. Prod. 2020, 277, 123501. [Google Scholar] [CrossRef]
- Kim, H.; Koh, T.; Pyo, S. Enhancing flowability and sustainability of ultra high performance concrete incorporating high replacement levels of industrial slags. Constr. Build. Mater. 2016, 123, 153–160. [Google Scholar] [CrossRef]
- Shi, Y.-X.; Matsui, I.; Guo, Y.-J. A study on the effect of fine mineral powders with distinct vitreous contents on the fluidity and rheological properties of concrete. Cem. Concr. Res. 2004, 34, 1381–1387. [Google Scholar] [CrossRef]
- Liu, B.; Xie, Y.; Zhou, S.; Yuan, Q. Influence of ultrafine fly ash composite on the fluidity and compressive strength of concrete. Cem. Concr. Res. 2000, 30, 1489–1493. [Google Scholar] [CrossRef]
- Zhang, N.; Sun, H.; Liu, X.; Zhang, J. Early-age characteristics of red mud–coal gangue cementitious material. J. Hazard. Mater. 2009, 167, 927–932. [Google Scholar] [CrossRef]
- Yazıcı, H.; Yardımcı, M.Y.; Yiğiter, H.; Aydın, S.; Türkel, S. Mechanical properties of reactive powder concrete containing high volumes of ground granulated blast furnace slag. Cem. Concr. Compos. 2010, 32, 639–648. [Google Scholar] [CrossRef]
- Yazıcı, H.; Deniz, E.; Baradan, B. The effect of autoclave pressure, temperature and duration time on mechanical properties of reactive powder concrete. Constr. Build. Mater. 2013, 42, 53–63. [Google Scholar] [CrossRef]
- Yang, L.; Liu, G.; Gao, D.; Zhang, C. Experimental study on water absorption of unsaturated concrete: w/c ratio, coarse aggregate and saturation degree. Constr. Build. Mater. 2021, 272, 121945. [Google Scholar] [CrossRef]
- Demakos, C.B.; Repapis, C.C.; Drivas, D.P. Experimental Investigation of Shear Strength for Steel Fibre Reinforced Concrete Beams. Open Constr. Build. Technol. J. 2021, 15, 81–92. [Google Scholar] [CrossRef]
- Cao, Z.; Cao, Y.; Dong, H.; Zhang, J.; Sun, C. Effect of calcination condition on the microstructure and pozzolanic activity of calcined coal gangue. Int. J. Miner. Process. 2016, 146, 23–28. [Google Scholar] [CrossRef]
- Dong, Z.; Xia, J.; Fan, C.; Cao, J. Activity of calcined coal gangue fine aggregate and its effect on the mechanical behavior of cement mortar. Constr. Build. Mater. 2015, 100, 63–69. [Google Scholar] [CrossRef] [Green Version]
- Plank, J.; Sakai, E.; Miao, C.; Yu, C.; Hong, J. Chemical admixtures—Chemistry, applications and their impact on concrete microstructure and durability. Cem. Concr. Res. 2015, 78, 81–99. [Google Scholar] [CrossRef]
- Sunayana, S.; Barai, S.V. Partially fly ash incorporated recycled coarse aggregate based concrete: Microstructure perspectives and critical analysis. Constr. Build. Mater. 2021, 278, 122322. [Google Scholar] [CrossRef]


| Material | SiO2 | Al2O3 | Fe2O3 | CaO | MgO | Na2O | K2O | TiO2 | SO3 | P2O5 | Loss |
|---|---|---|---|---|---|---|---|---|---|---|---|
| P•O 42.5 | 23.04 | 4.5 | 4.78 | 64.81 | 2.02 | 0.31 | 0.22 | - | 0.636 | - | 2.34 |
| FA | 42.43 | 21.83 | 12.81 | 15.12 | 2.12 | 2.04 | 1.02 | - | - | - | 0.42 |
| SF | 95.19 | - | 0.13 | - | 0.80 | - | - | - | - | - | 2.81 |
| LF | 3.45 | 1.47 | 0.24 | 52.12 | 0.77 | - | - | - | - | - | 40.22 |
| Material | SiO2 | Al2O3 | Fe2O3 | CaO | MgO | Na2O | K2O | TiO2 | SO3 | P2O5 | Loss |
|---|---|---|---|---|---|---|---|---|---|---|---|
| RS | 68.46 | 15.65 | 5.45 | 3.69 | 0.05 | 1.75 | 2.42 | 0.86 | 0.22 | 0.30 | 1.87 |
| CG | 68.32 | 17.42 | 4.43 | 2.31 | 1.25 | 1.50 | 2.50 | 0.84 | 0.31 | 0.16 | 10.79 |
| Material | Apparent Particle Density (kg/m3) | Bulk Density (kg/m3) | Porosity (%) |
|---|---|---|---|
| RS | 2647 | 1577 | 40.4 |
| CG | 2357 | 1189 | 49.6 |
| Mixture | RS | CG | P•O 42.5 | FA | SF | LF | Steel Fiber |
|---|---|---|---|---|---|---|---|
| CG0 | 1234 | 0 | 312 | 223 | 125 | 89 | 160/80/0 |
| CG25 | 925 | 309 | 312 | 223 | 125 | 89 | 160/80/0 |
| CG50 | 617 | 617 | 312 | 223 | 125 | 89 | 160/80/0 |
| CG75 | 309 | 925 | 312 | 223 | 125 | 89 | 160/80/0 |
| CG100 | 0 | 1234 | 312 | 223 | 125 | 89 | 160/80/0 |
Publisher’s Note: MDPI stays neutral with regard to jurisdictional claims in published maps and institutional affiliations. |
© 2022 by the authors. Licensee MDPI, Basel, Switzerland. This article is an open access article distributed under the terms and conditions of the Creative Commons Attribution (CC BY) license (https://creativecommons.org/licenses/by/4.0/).
Share and Cite
Luo, W.; Wang, H.; Li, X.; Wang, X.; Wu, Z.; Zhang, Y.; Lian, X.; Li, X. Mechanical Properties of Reactive Powder Concrete with Coal Gangue as Sand Replacement. Materials 2022, 15, 1807. https://0-doi-org.brum.beds.ac.uk/10.3390/ma15051807
Luo W, Wang H, Li X, Wang X, Wu Z, Zhang Y, Lian X, Li X. Mechanical Properties of Reactive Powder Concrete with Coal Gangue as Sand Replacement. Materials. 2022; 15(5):1807. https://0-doi-org.brum.beds.ac.uk/10.3390/ma15051807
Chicago/Turabian StyleLuo, Wen, Haijun Wang, Xiongwei Li, Xiaolong Wang, Zhang Wu, Yuan Zhang, Xiaoqing Lian, and Xiaojun Li. 2022. "Mechanical Properties of Reactive Powder Concrete with Coal Gangue as Sand Replacement" Materials 15, no. 5: 1807. https://0-doi-org.brum.beds.ac.uk/10.3390/ma15051807