
The Effect of Heat Input, Annealing, and Deformation Treatment on Structure and Mechanical Properties of Electron Beam Additive Manufactured (EBAM) Silicon Bronze

 , ,
, ,
Abstract
:1. Introduction
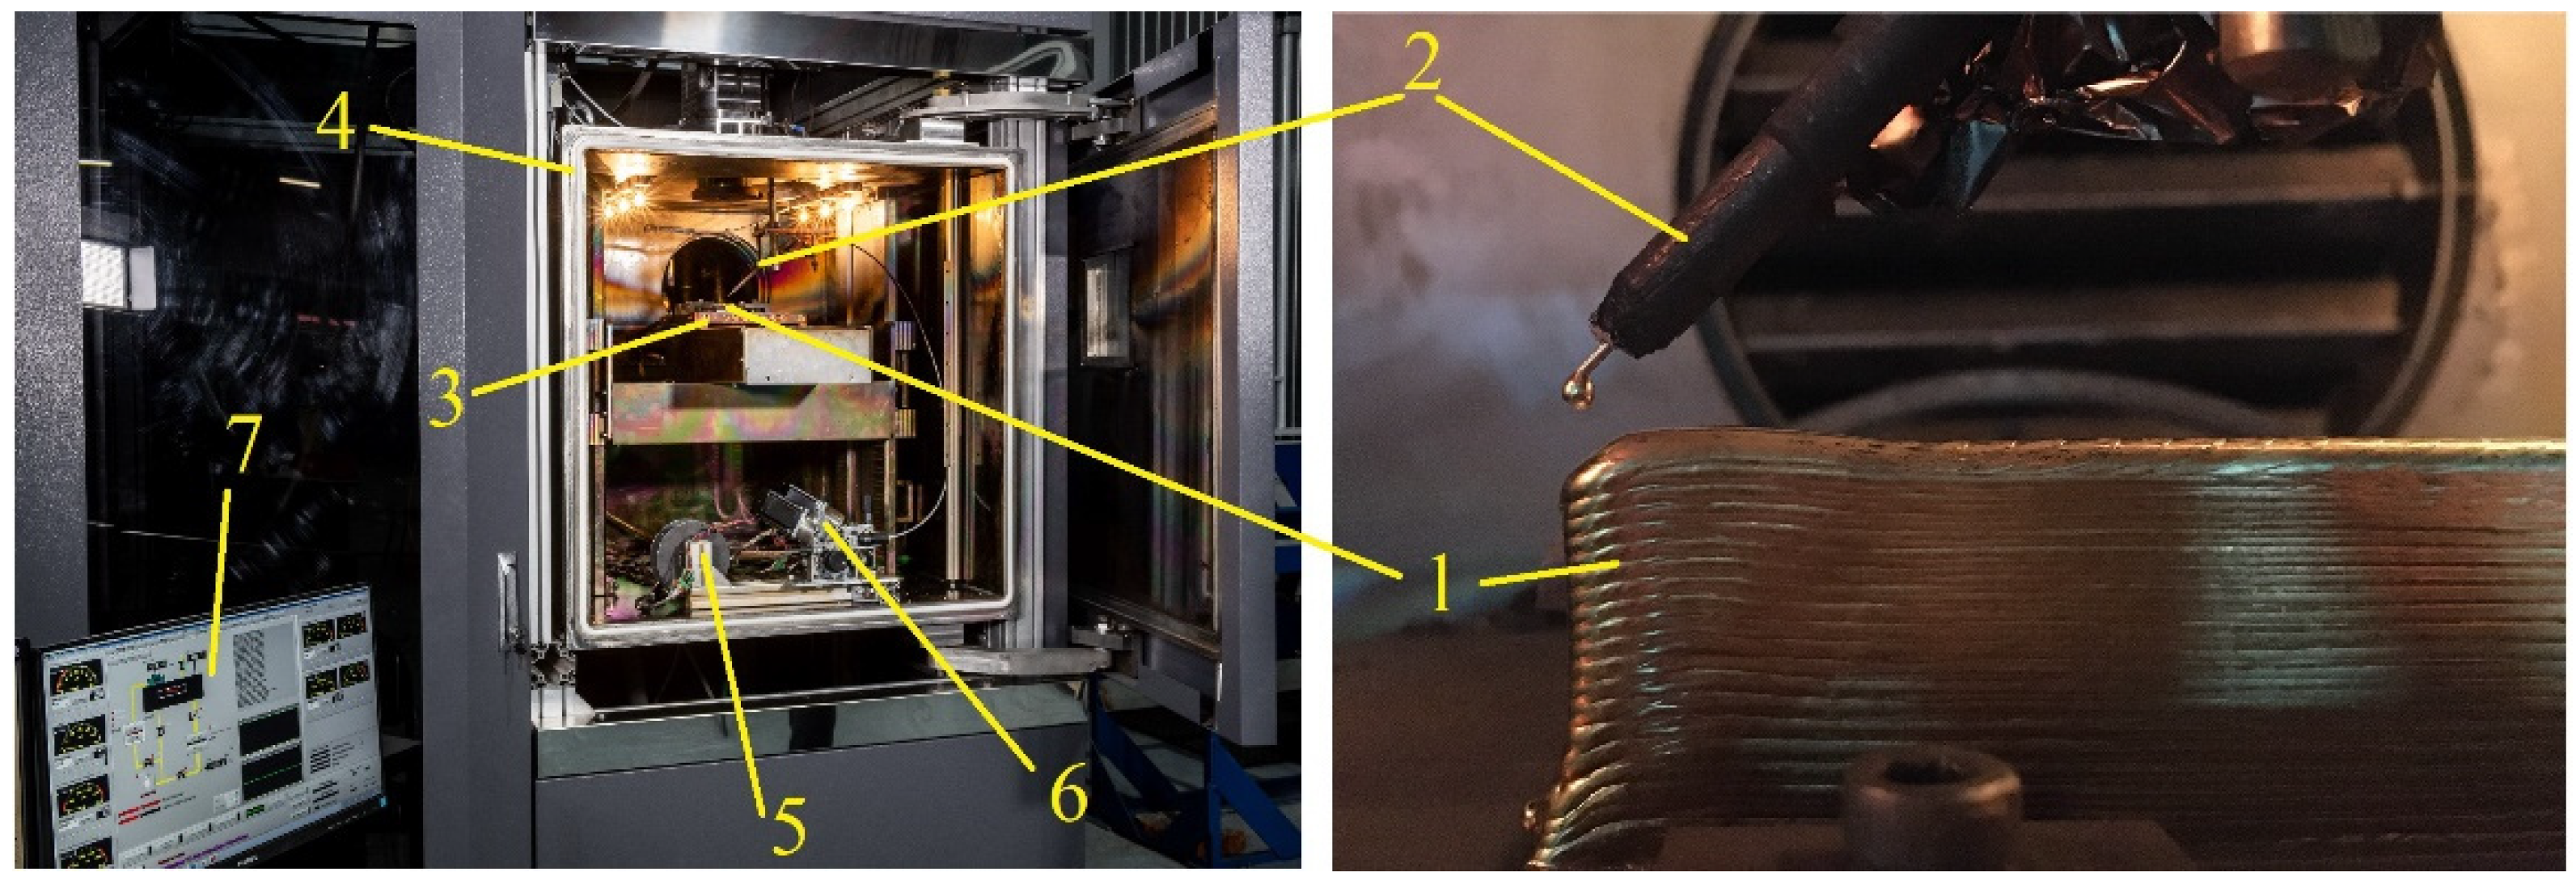
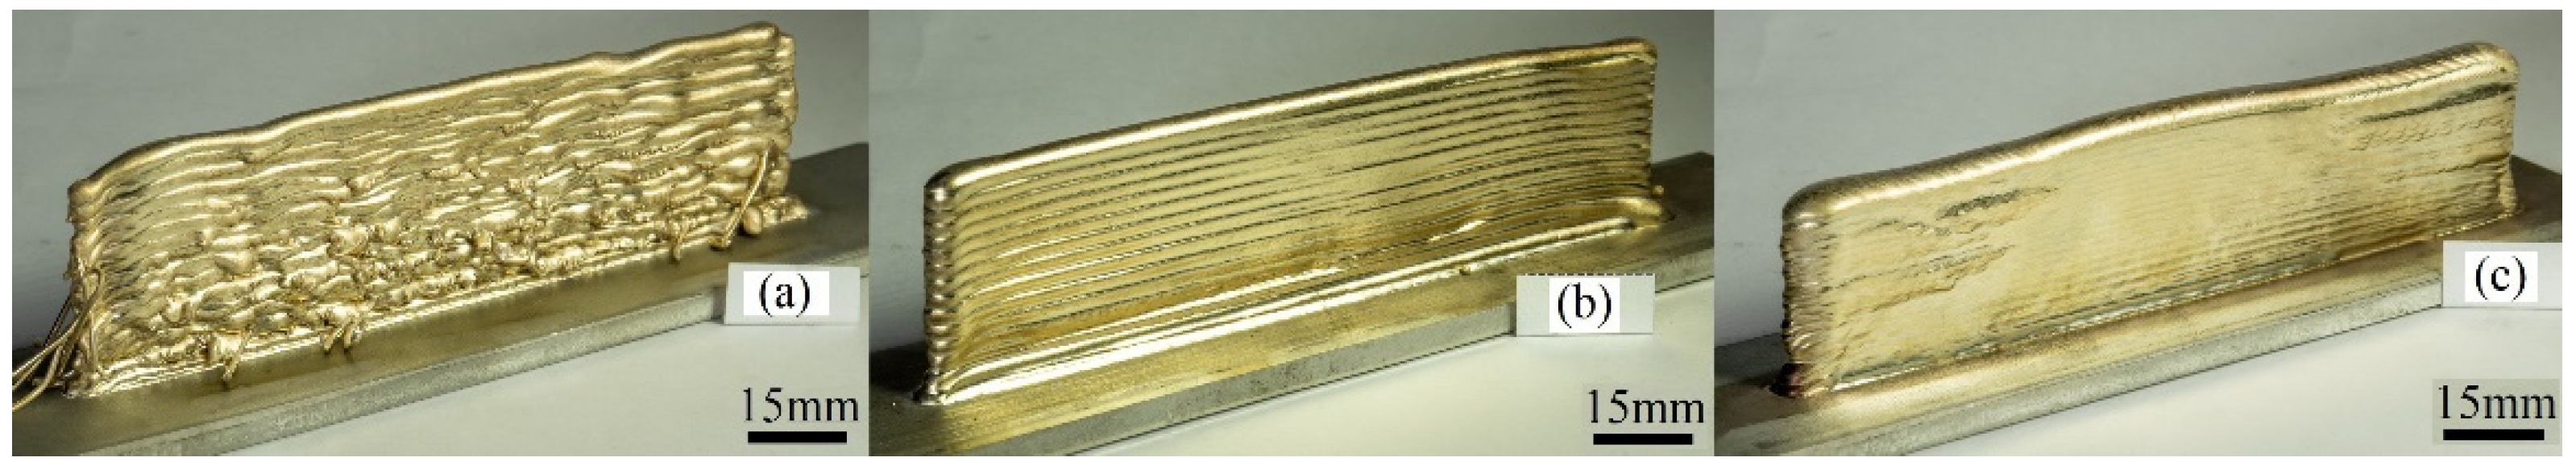
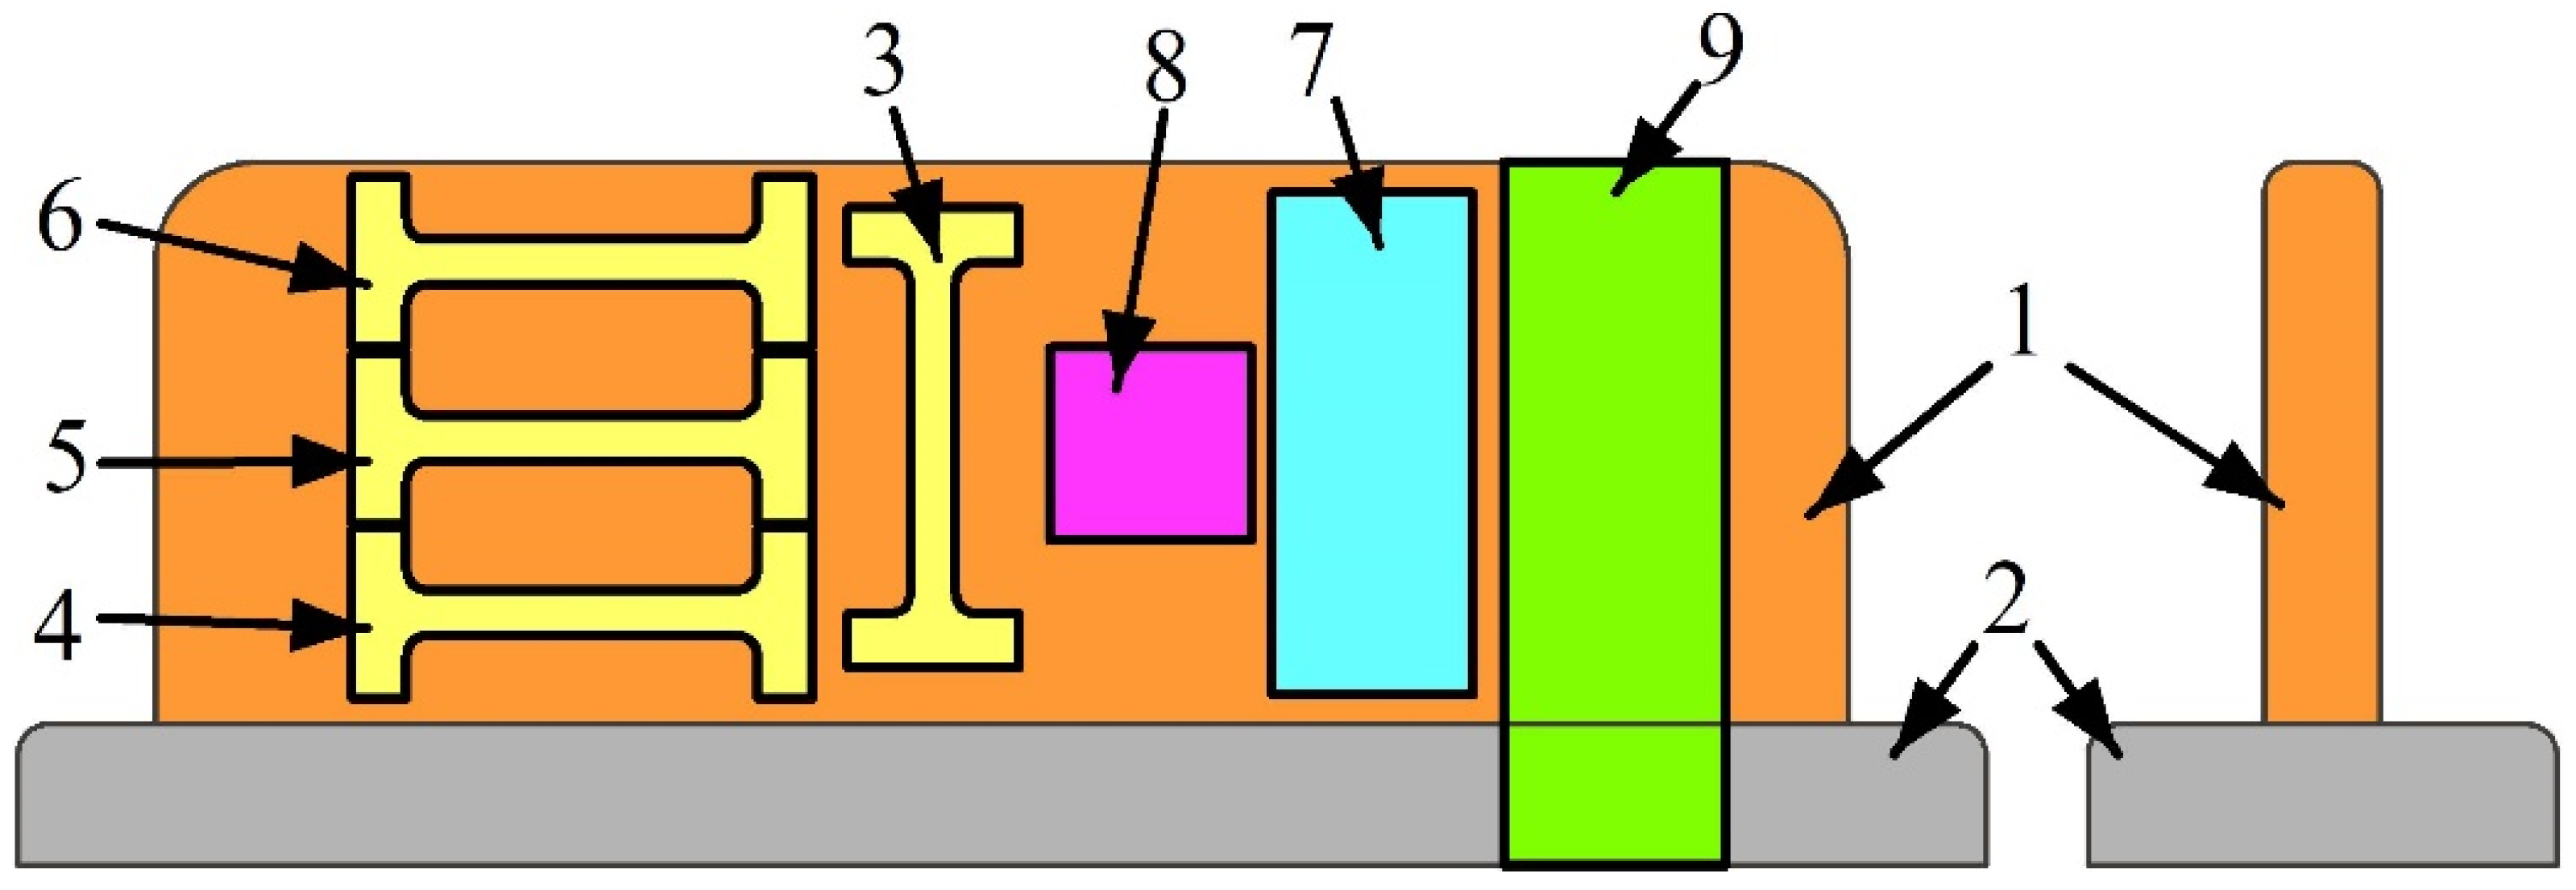
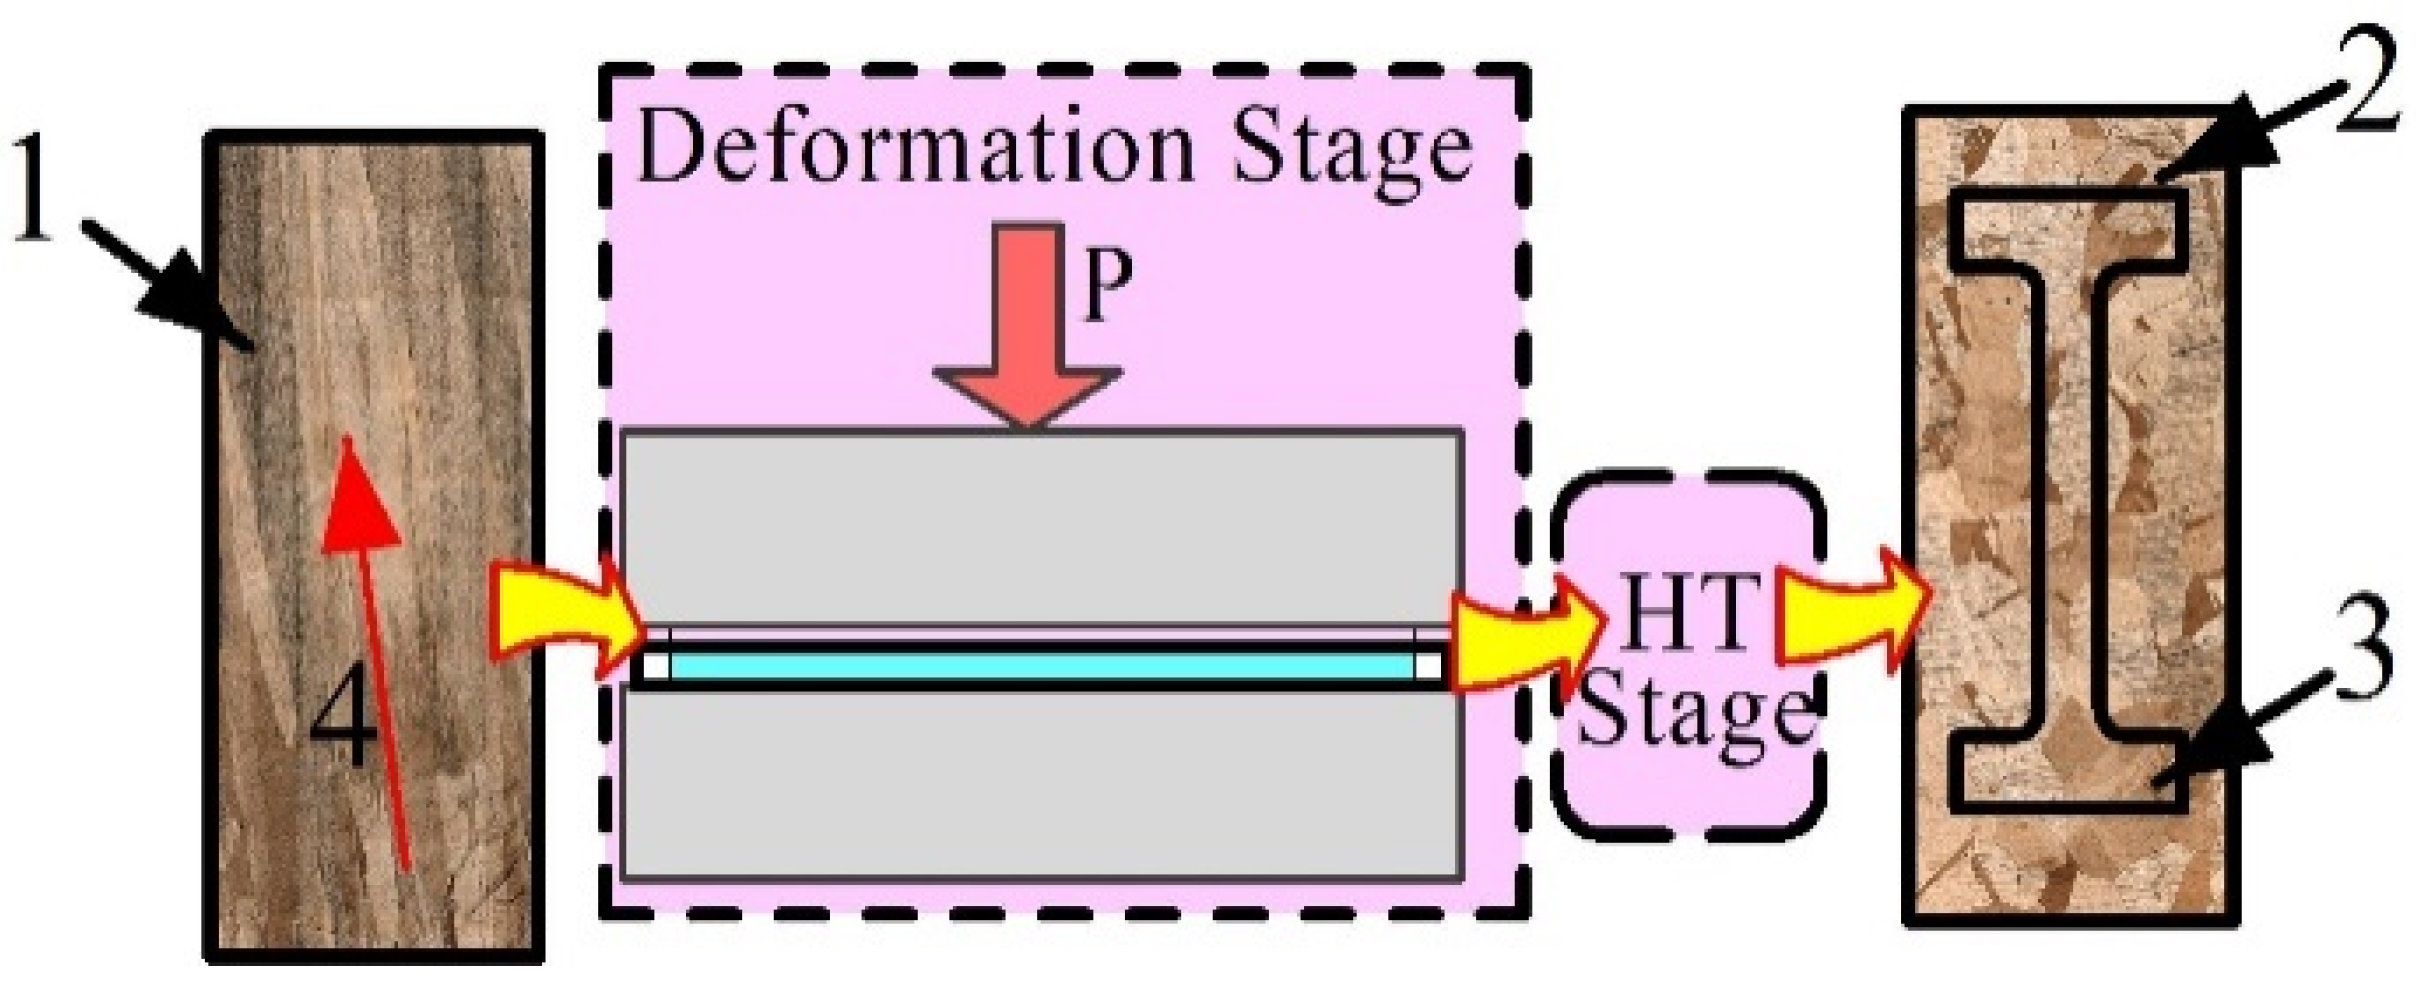
2. Materials and Methods
3. Results
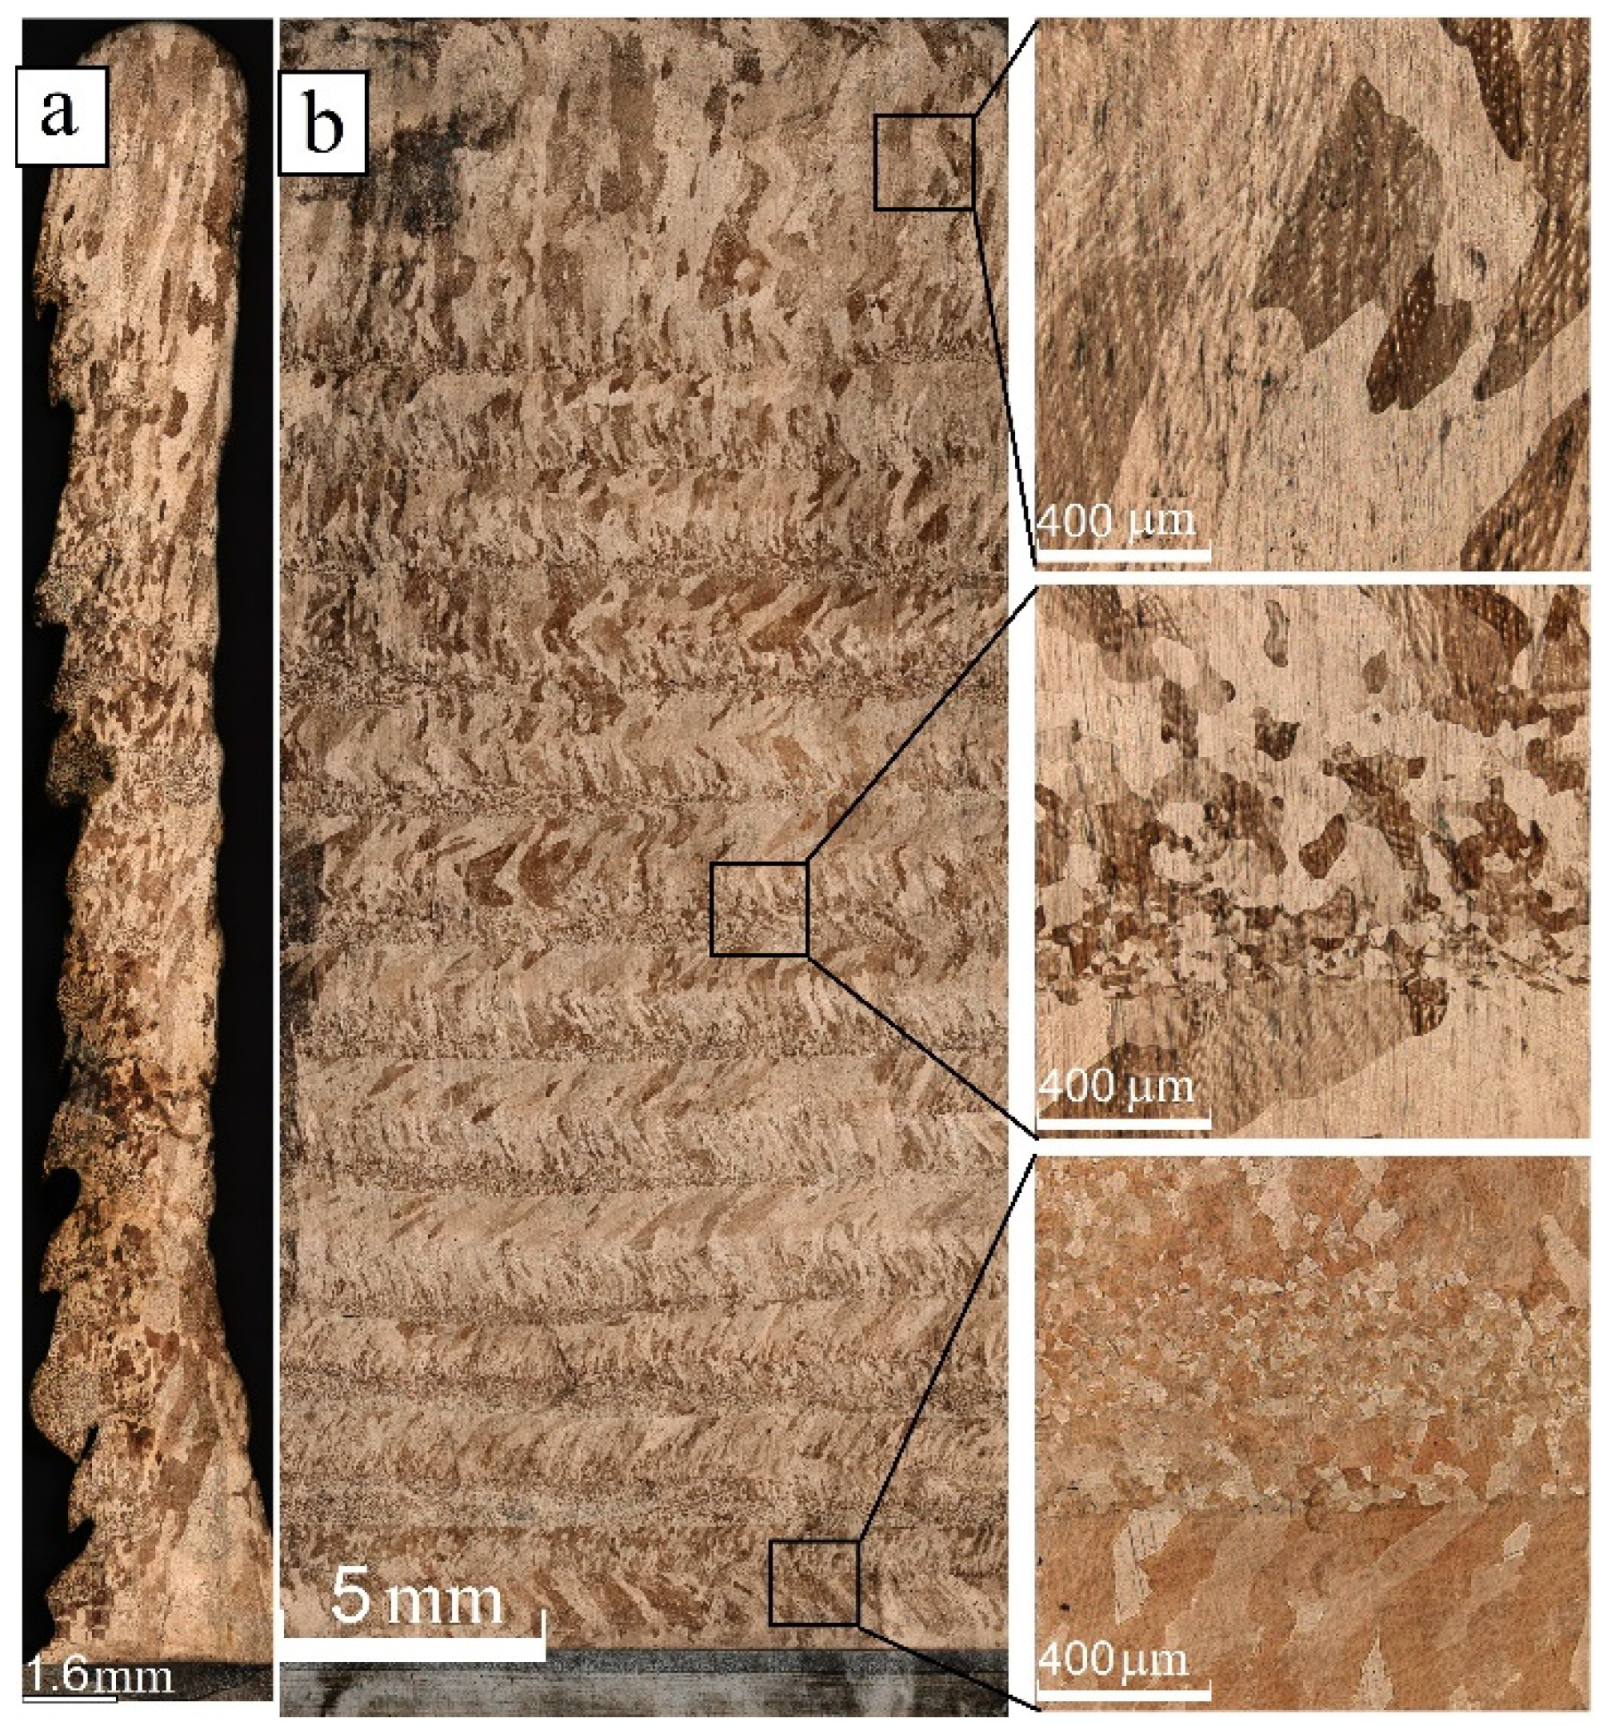
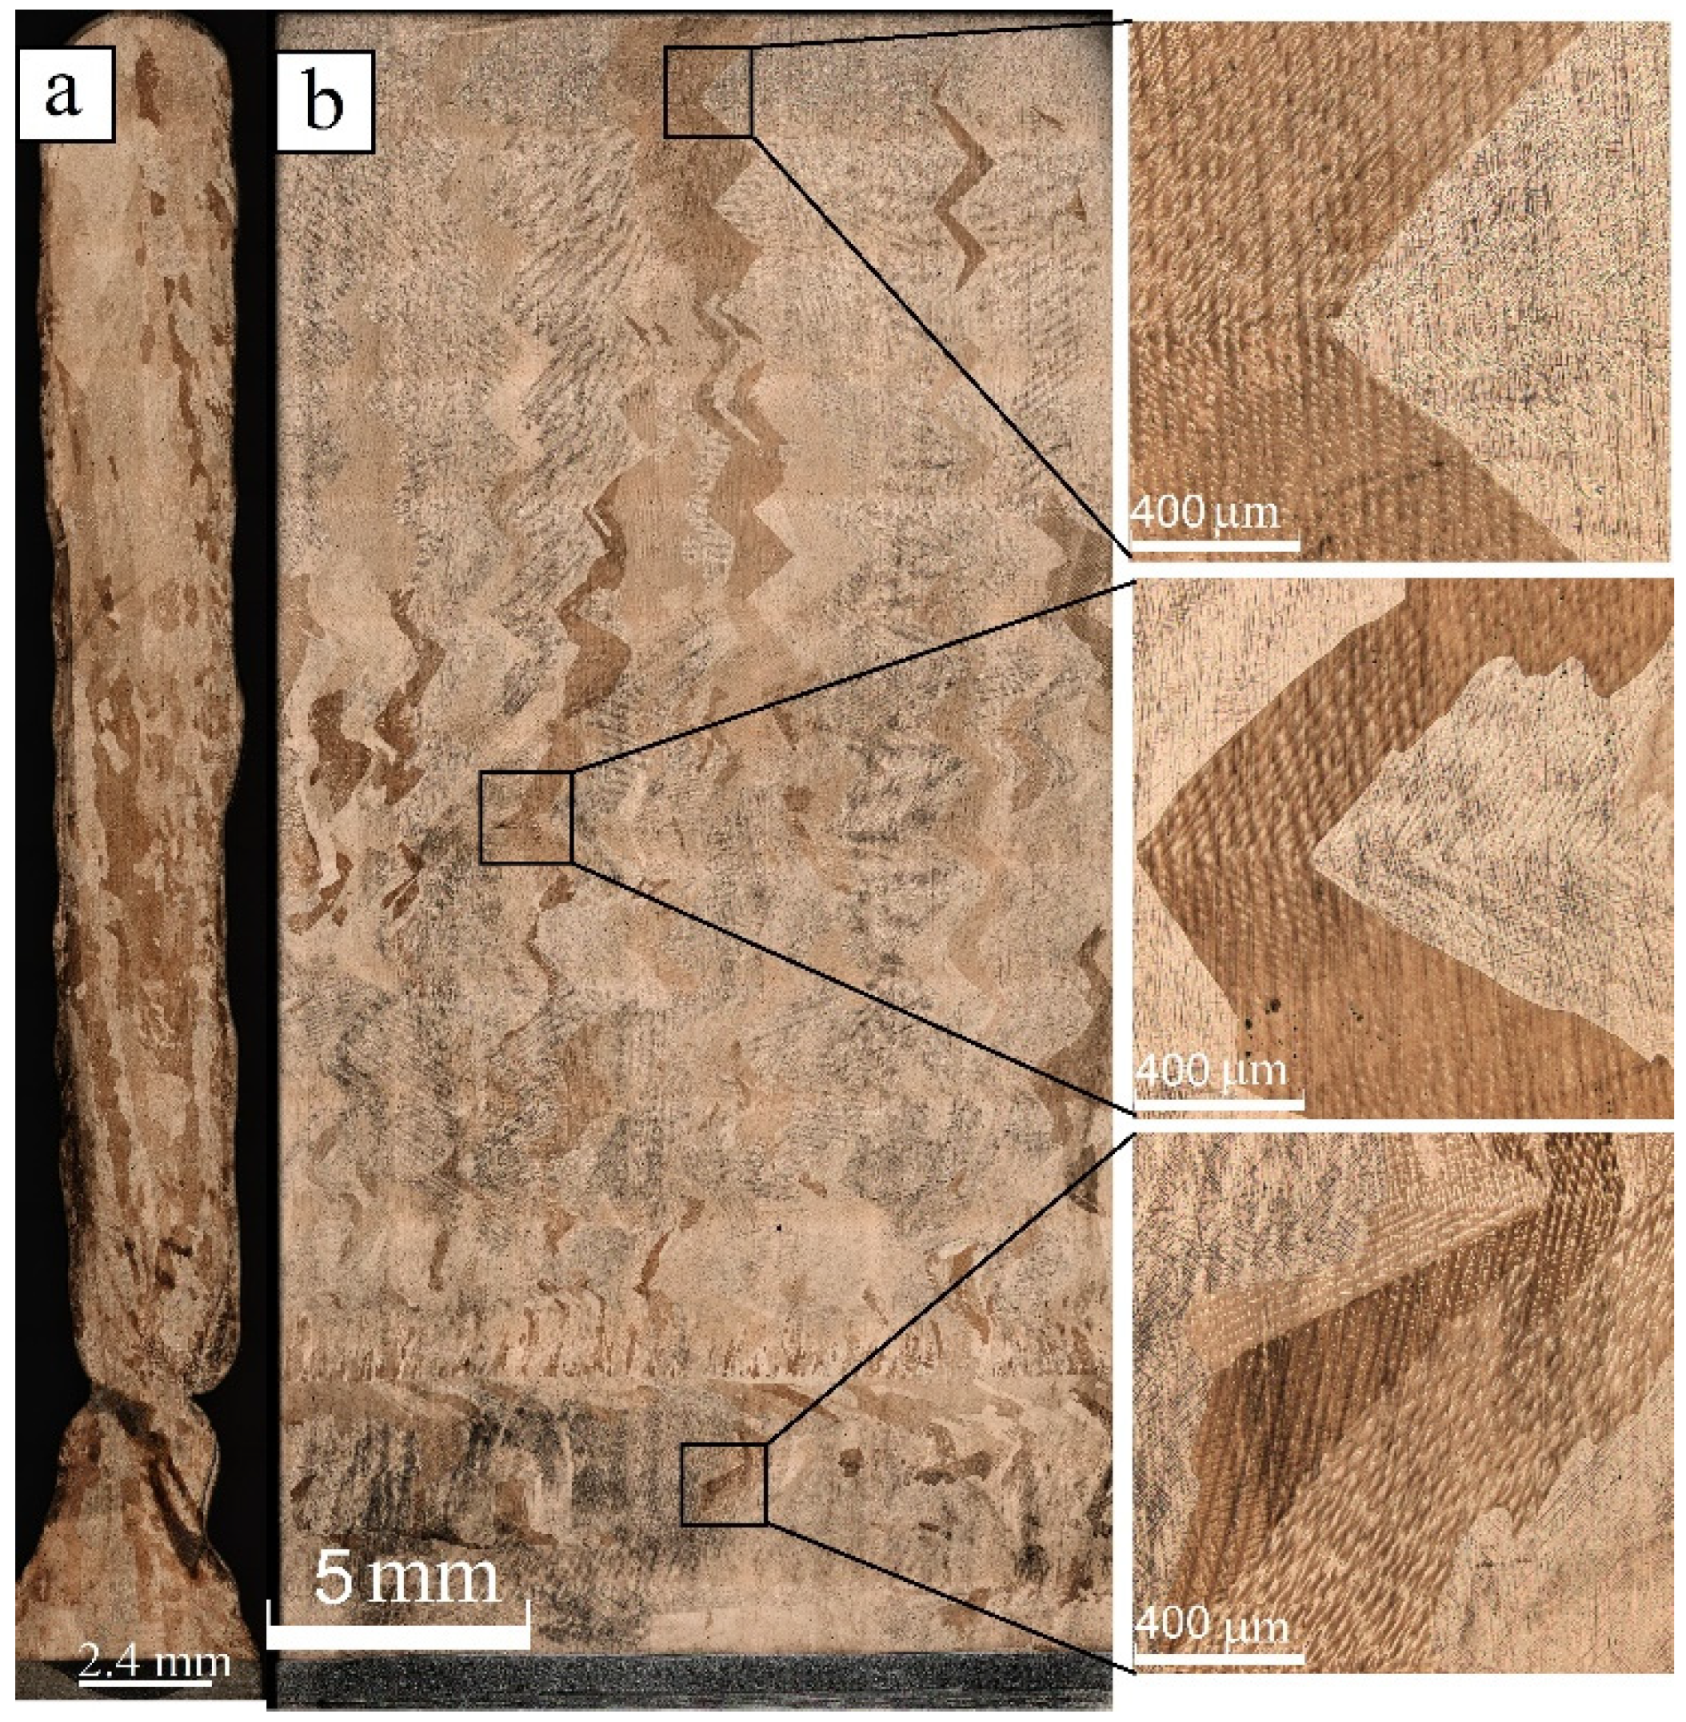
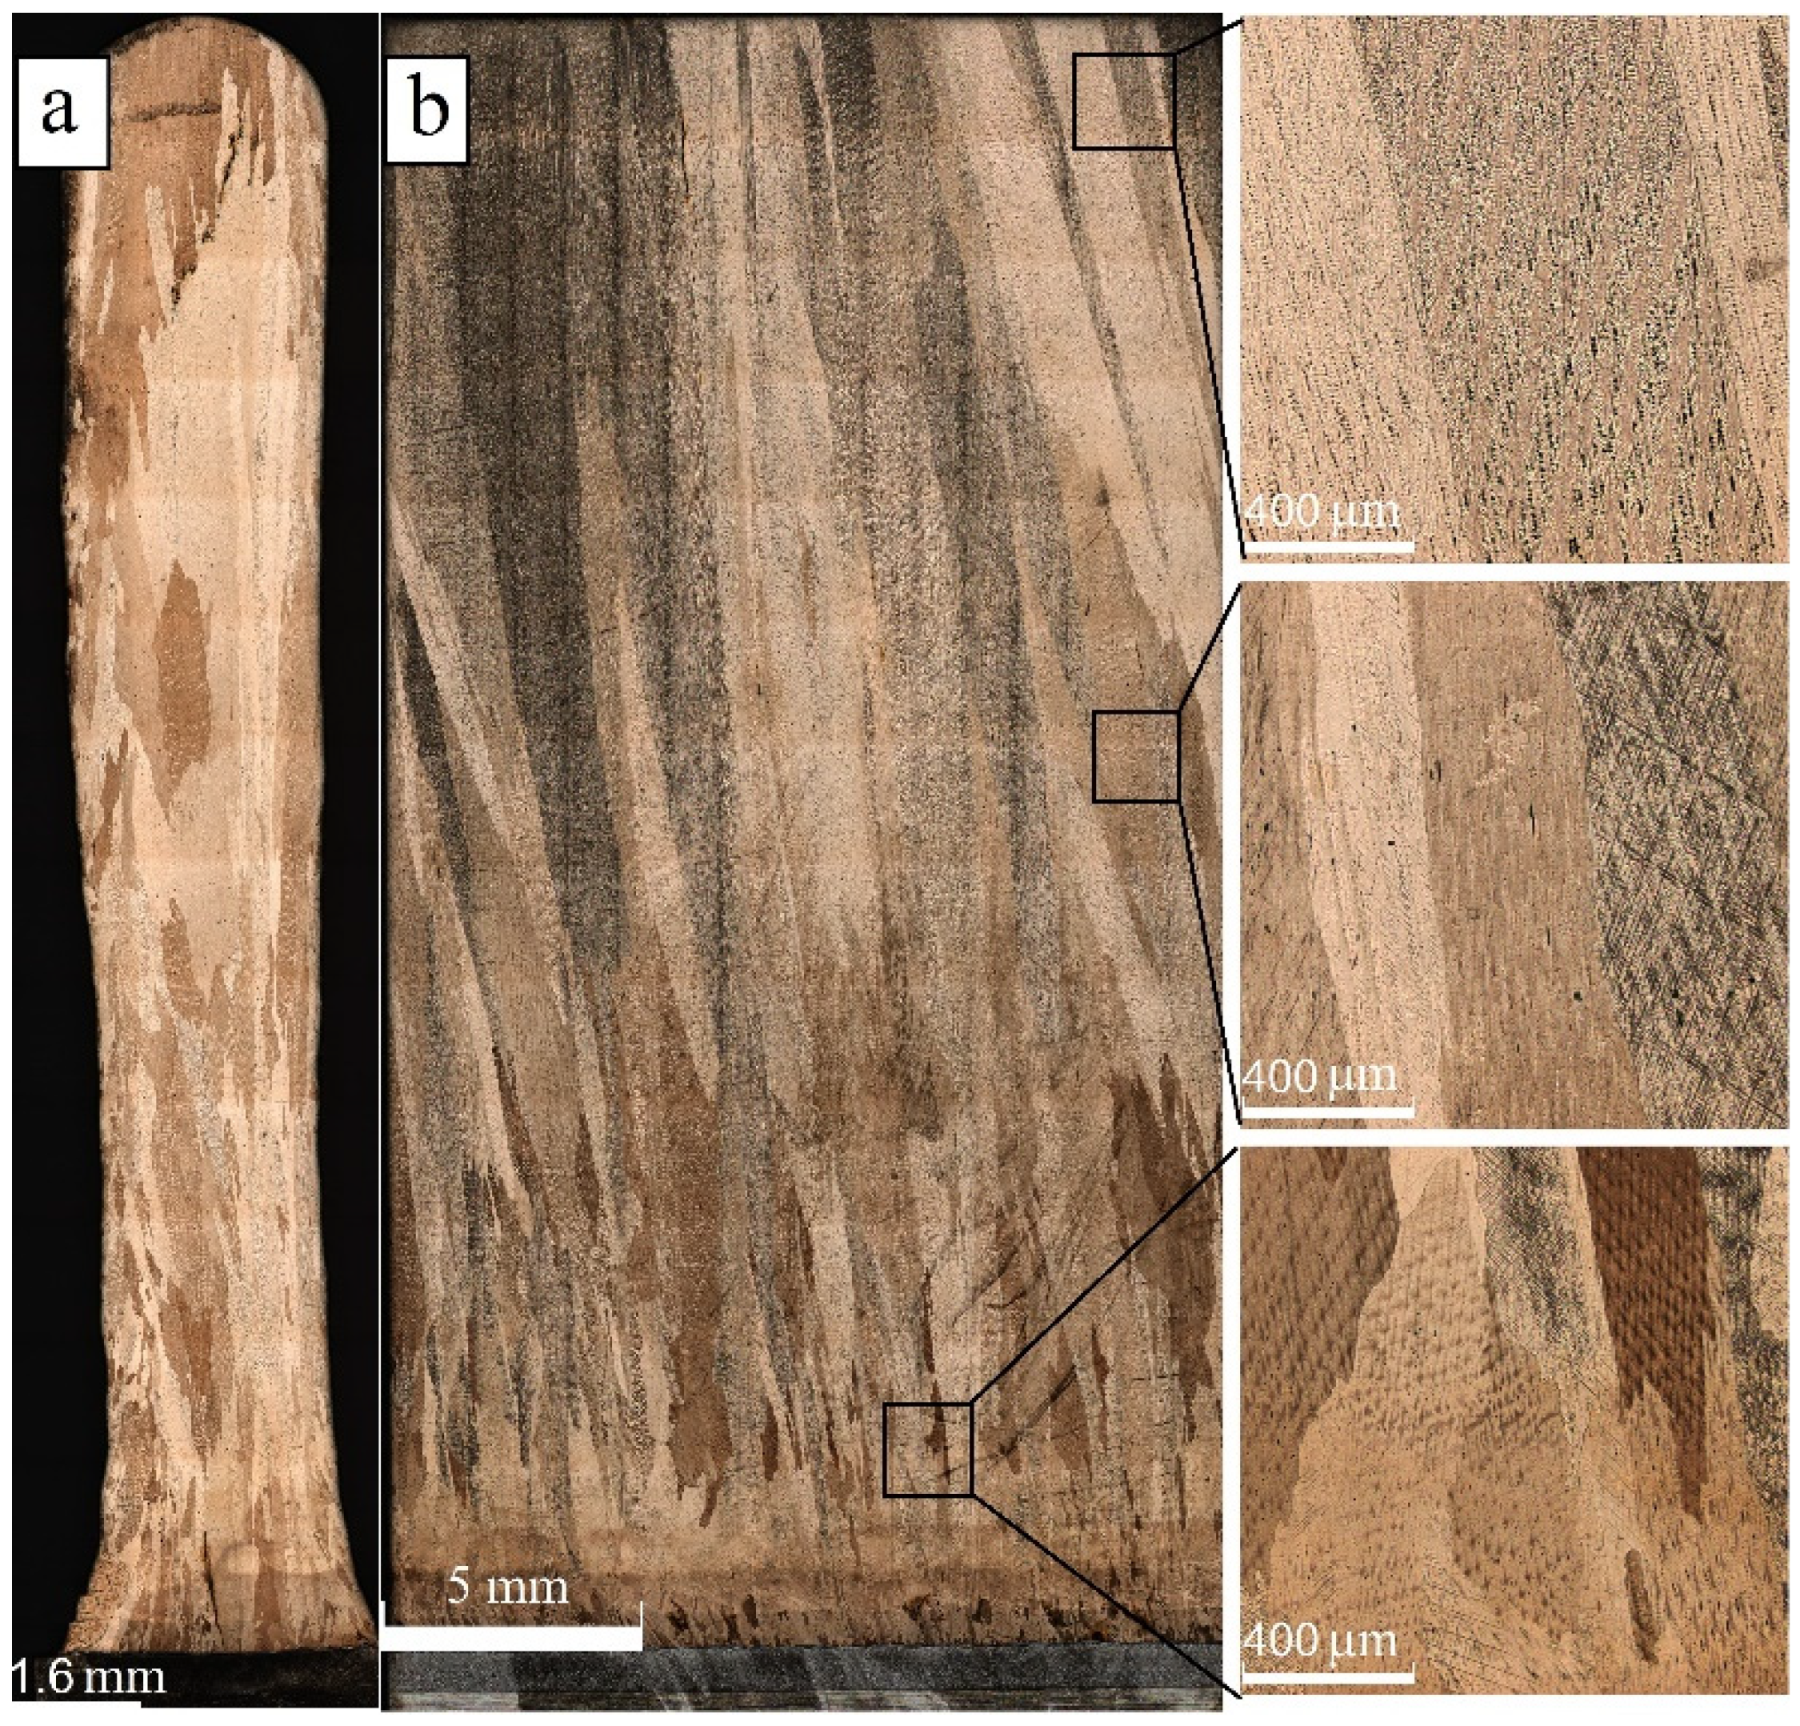
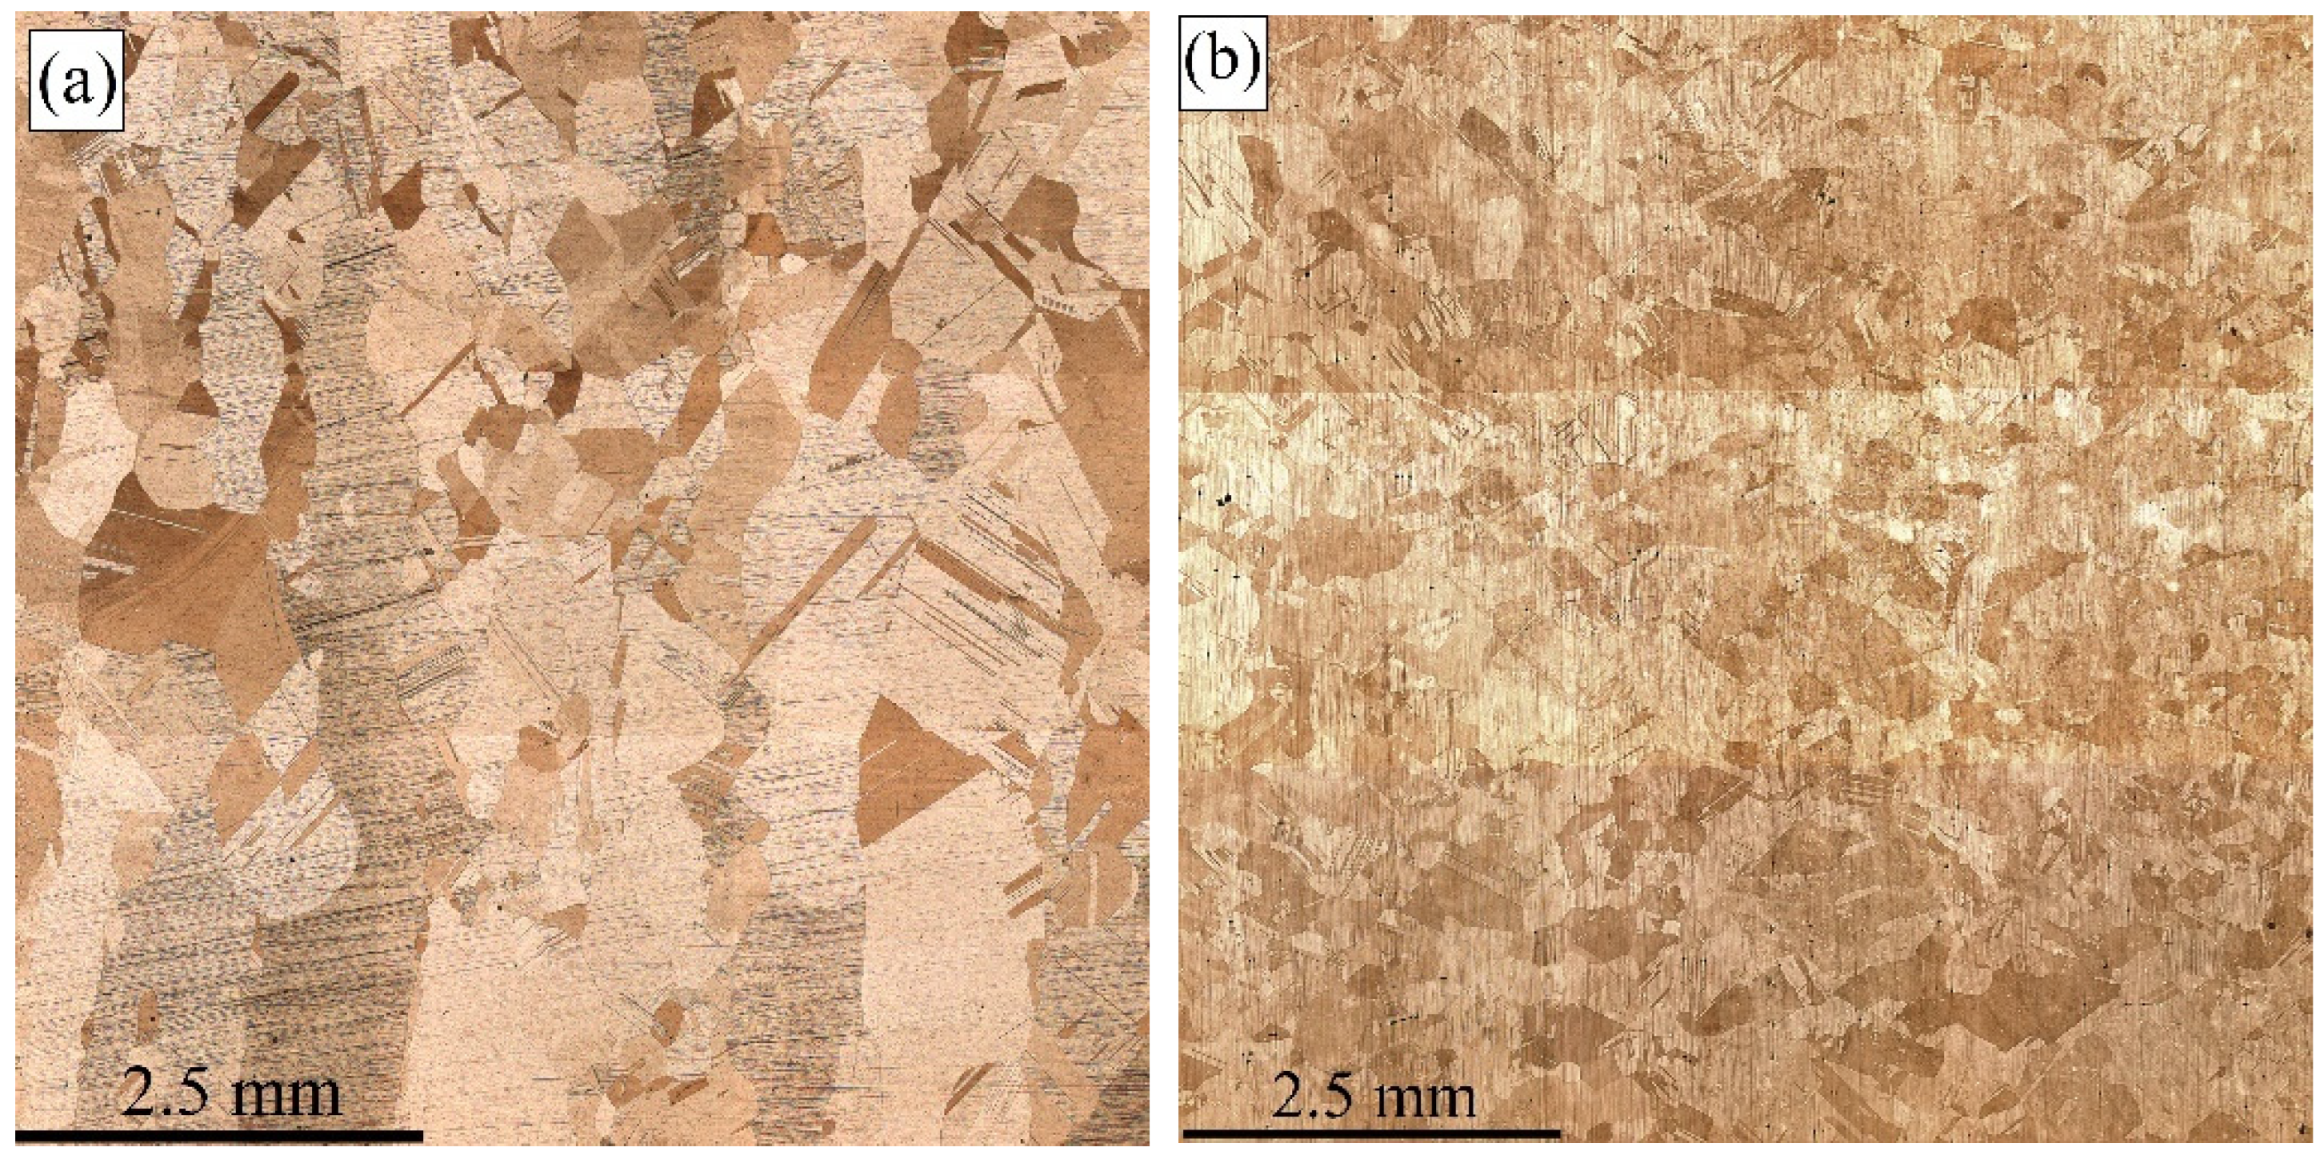
3.1. Metallography
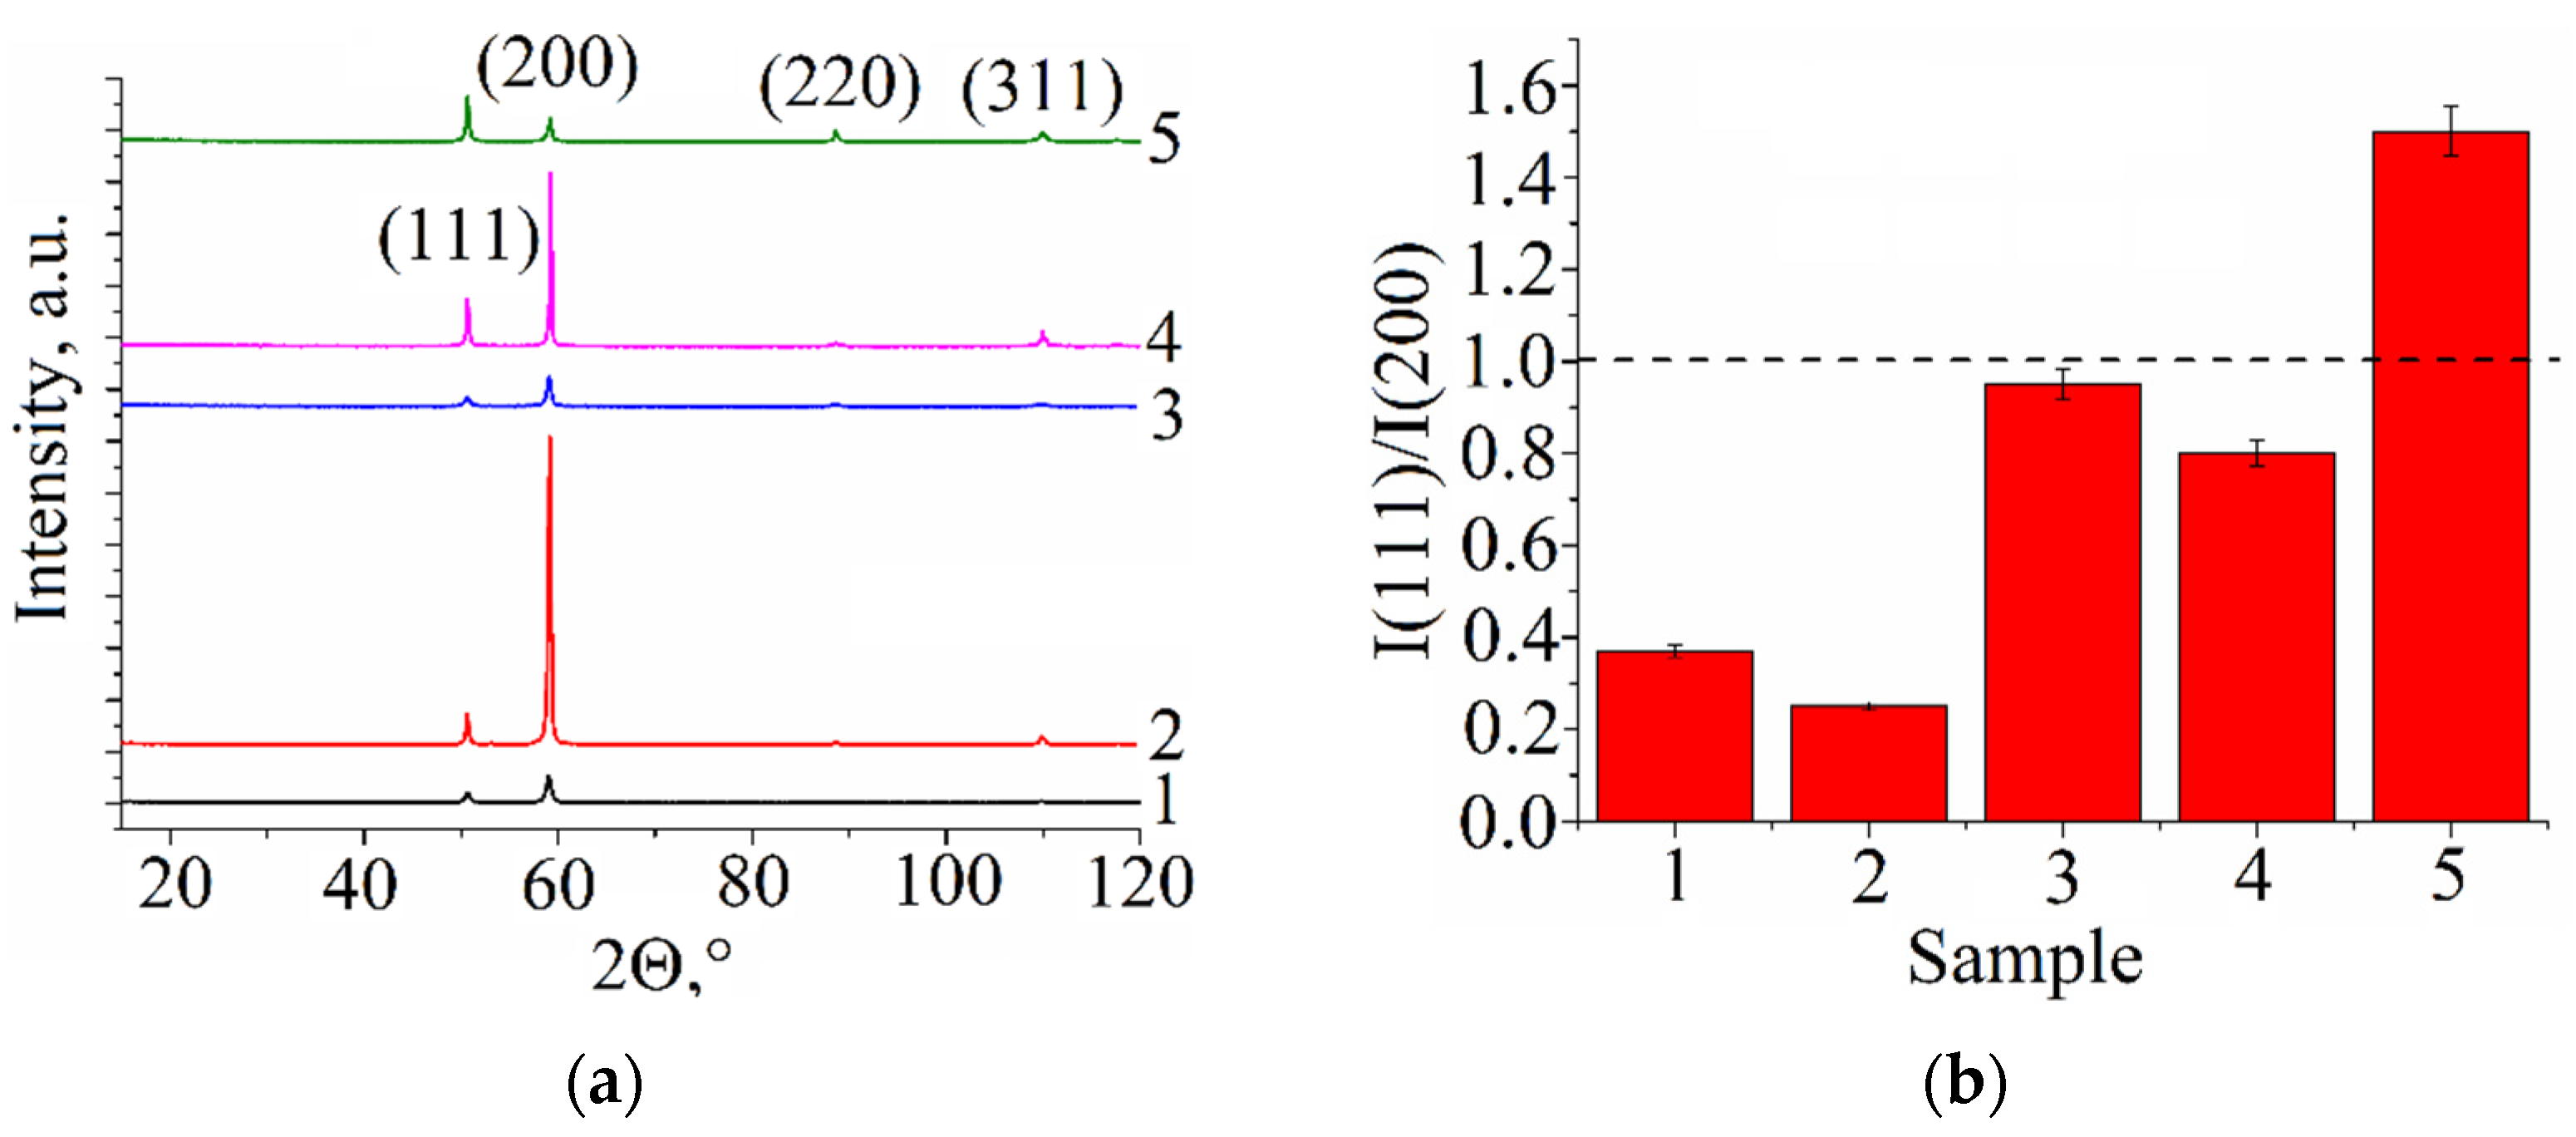
3.2. XRD
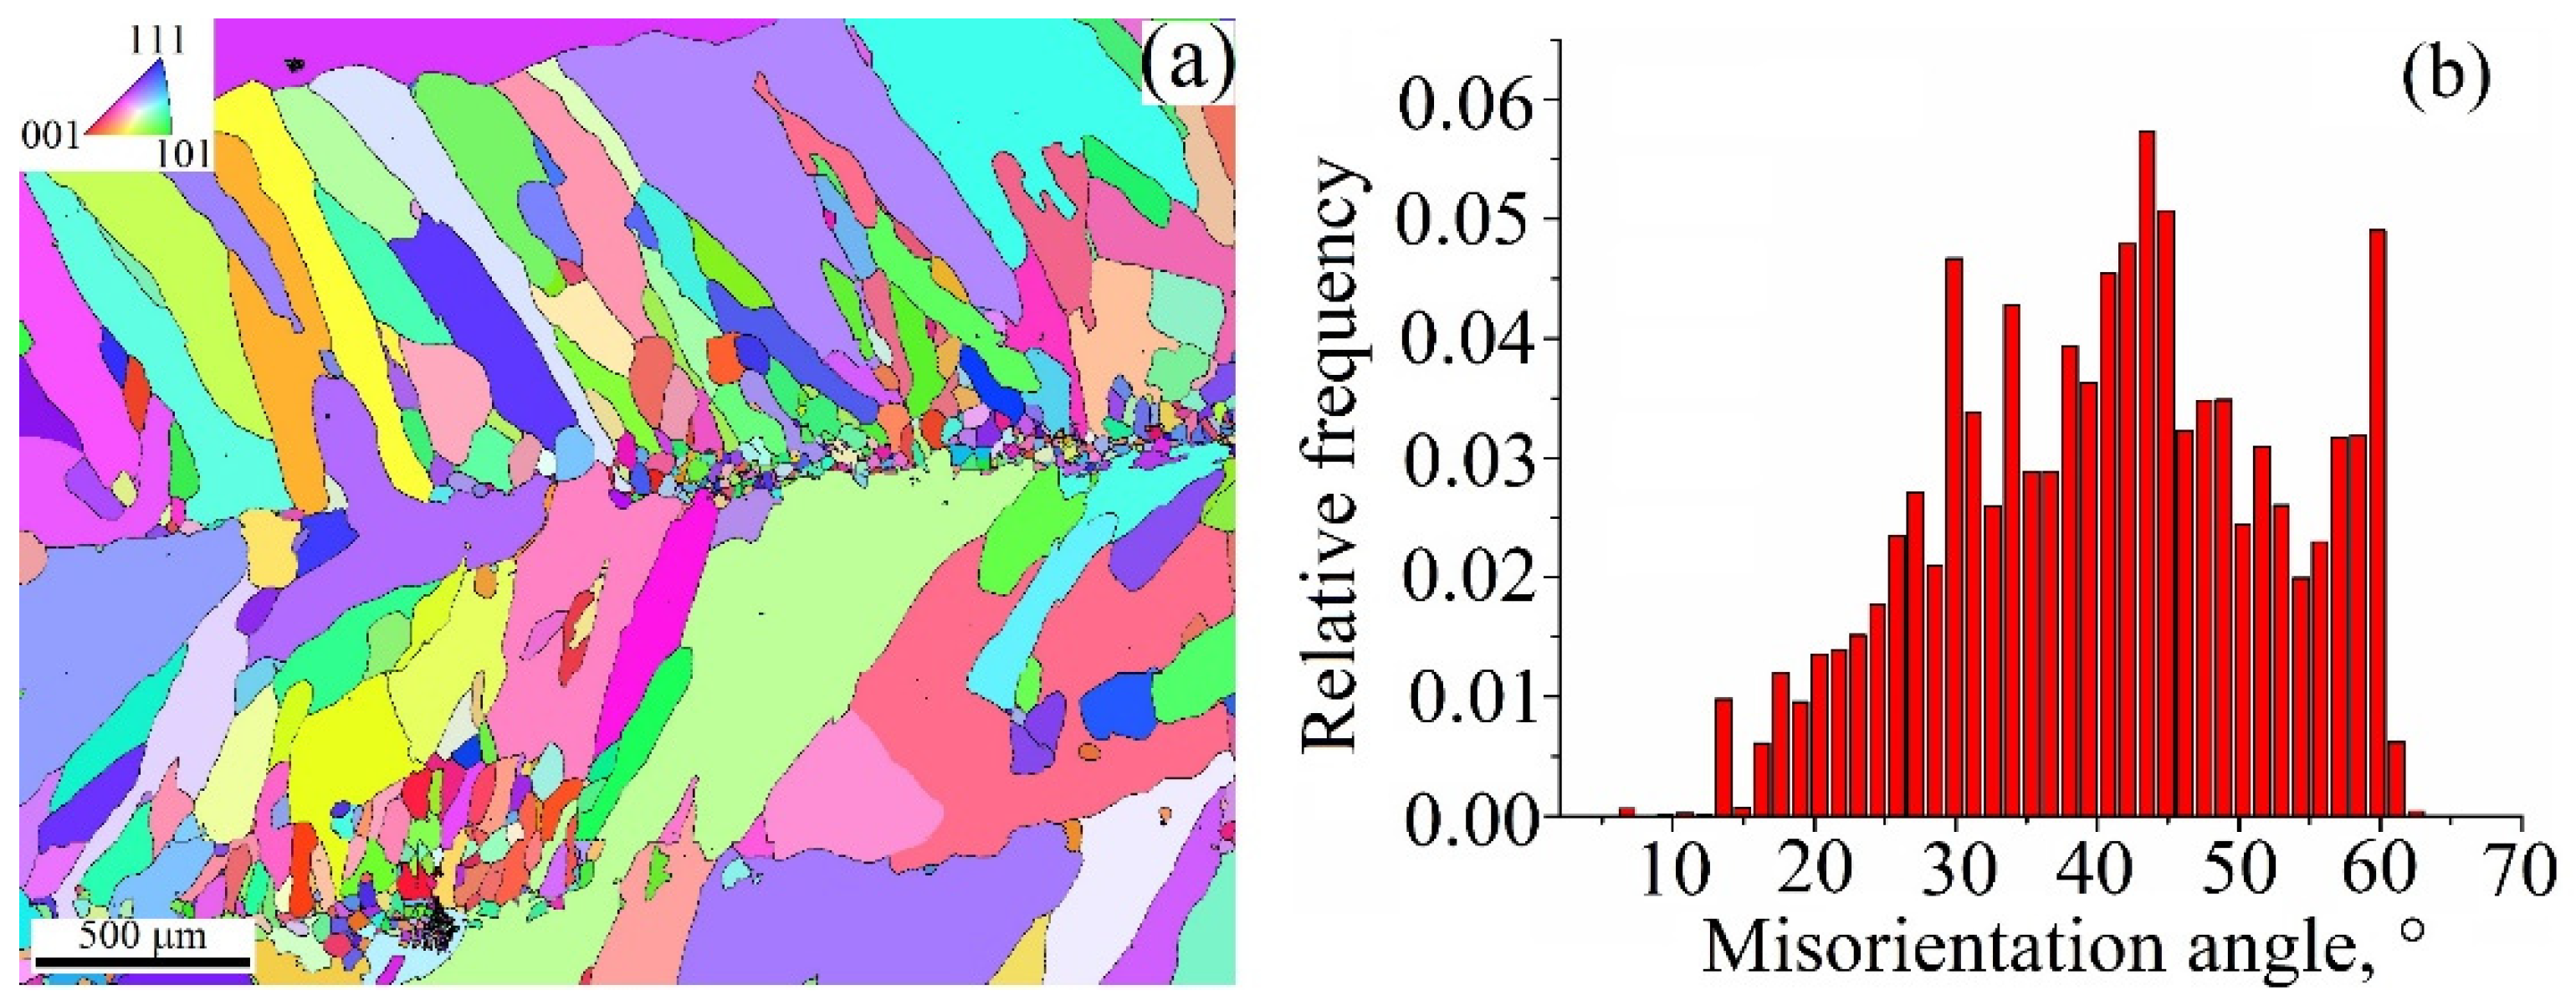
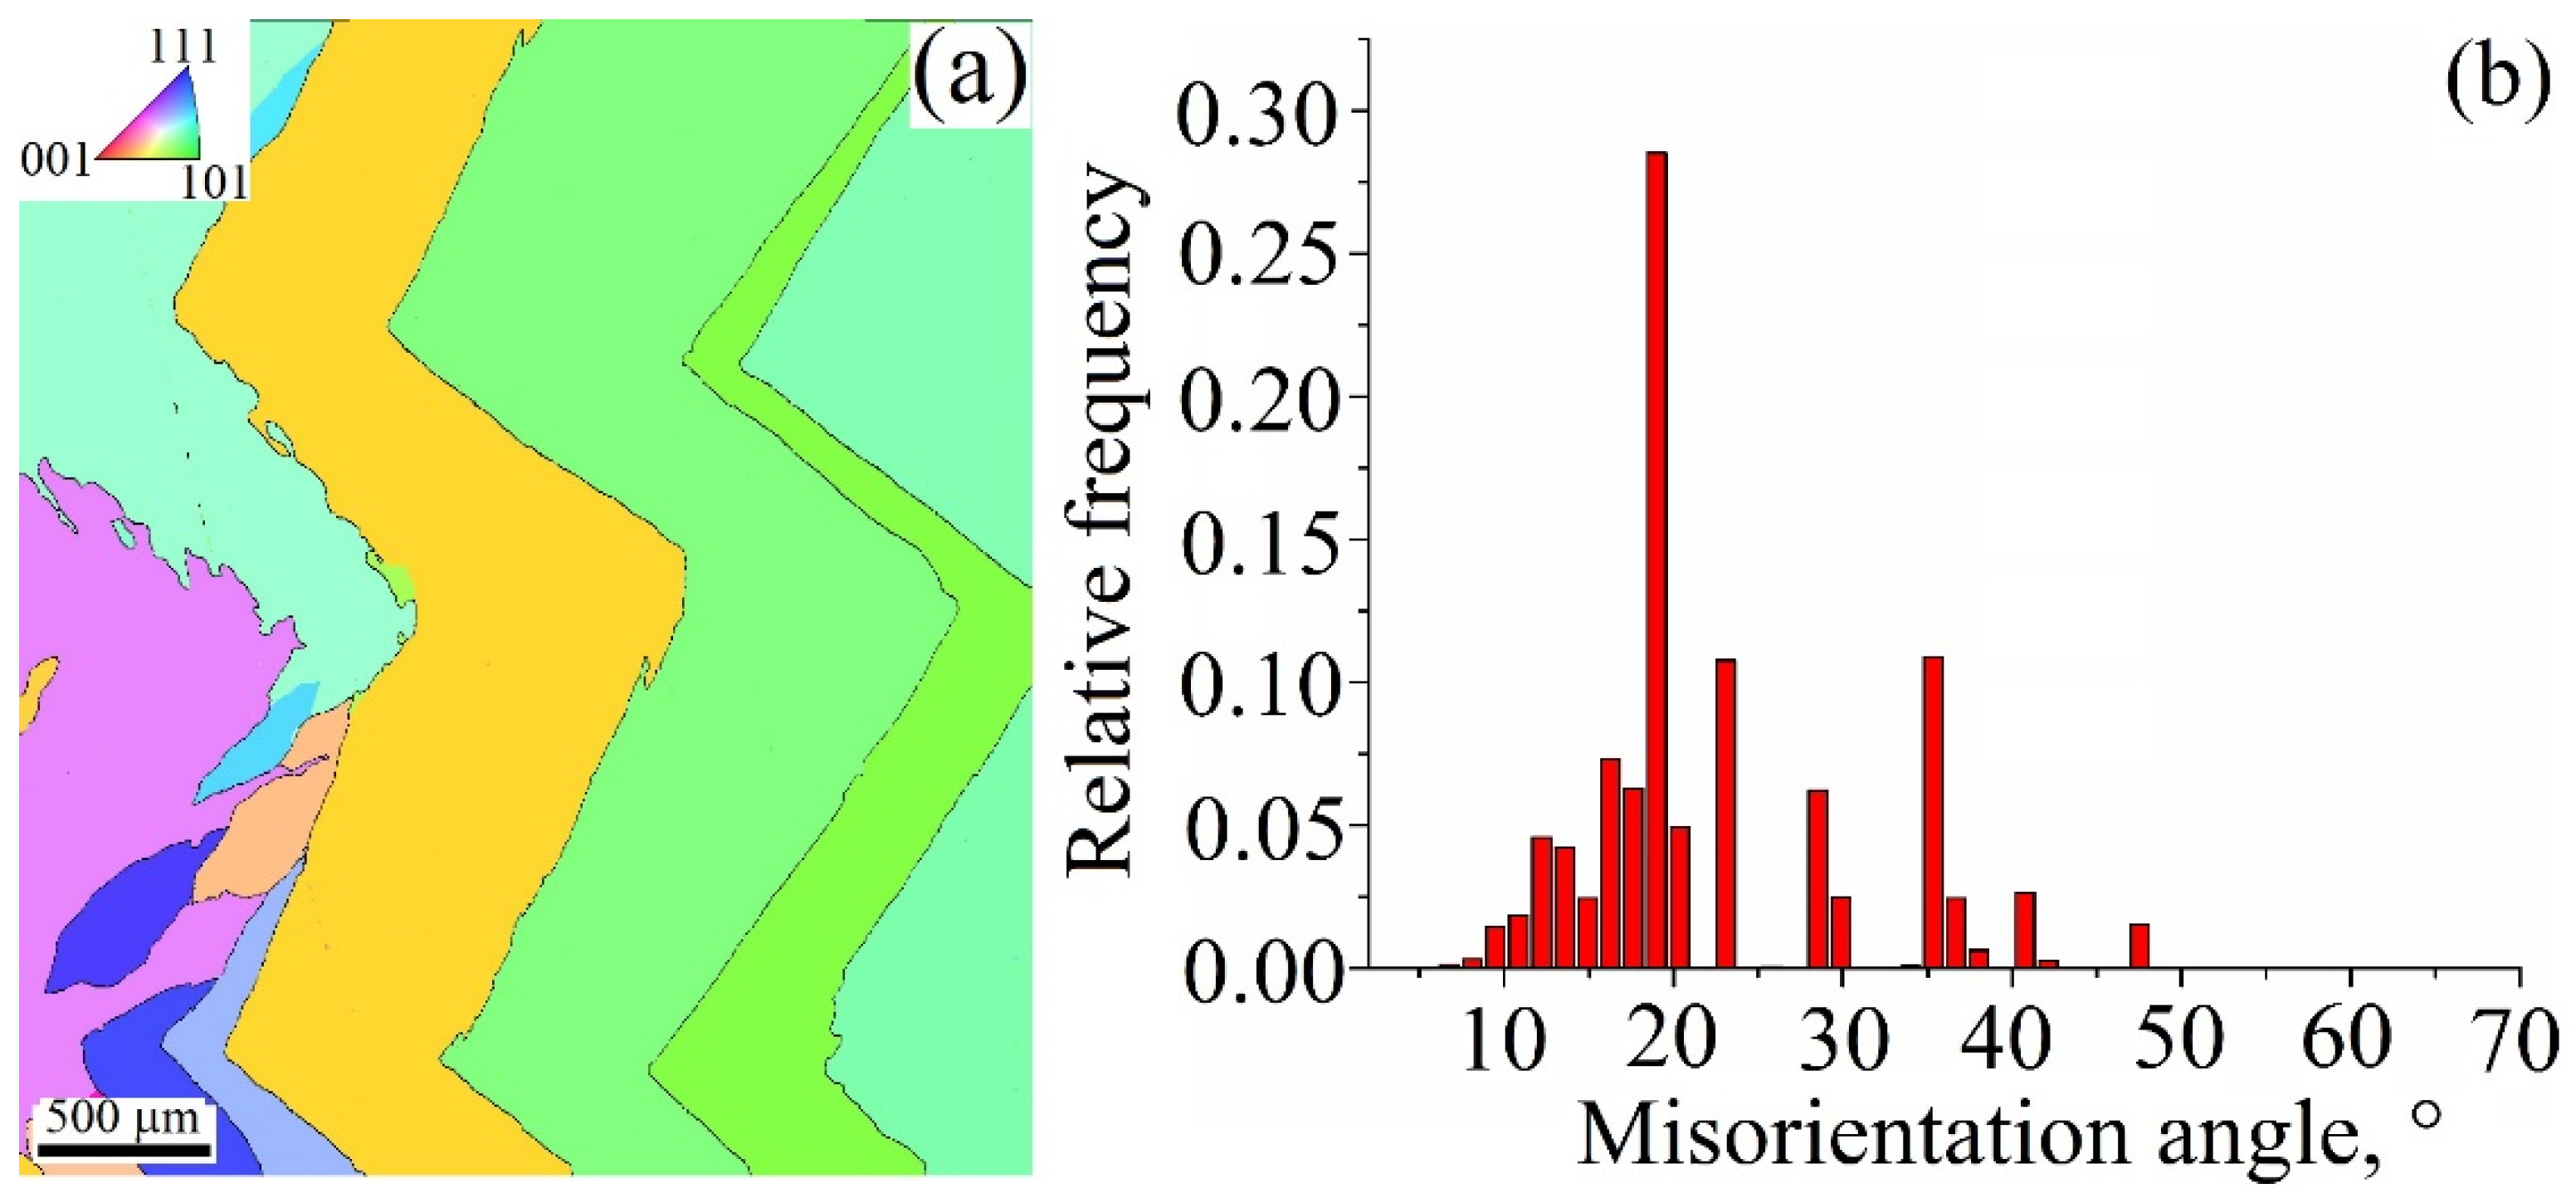
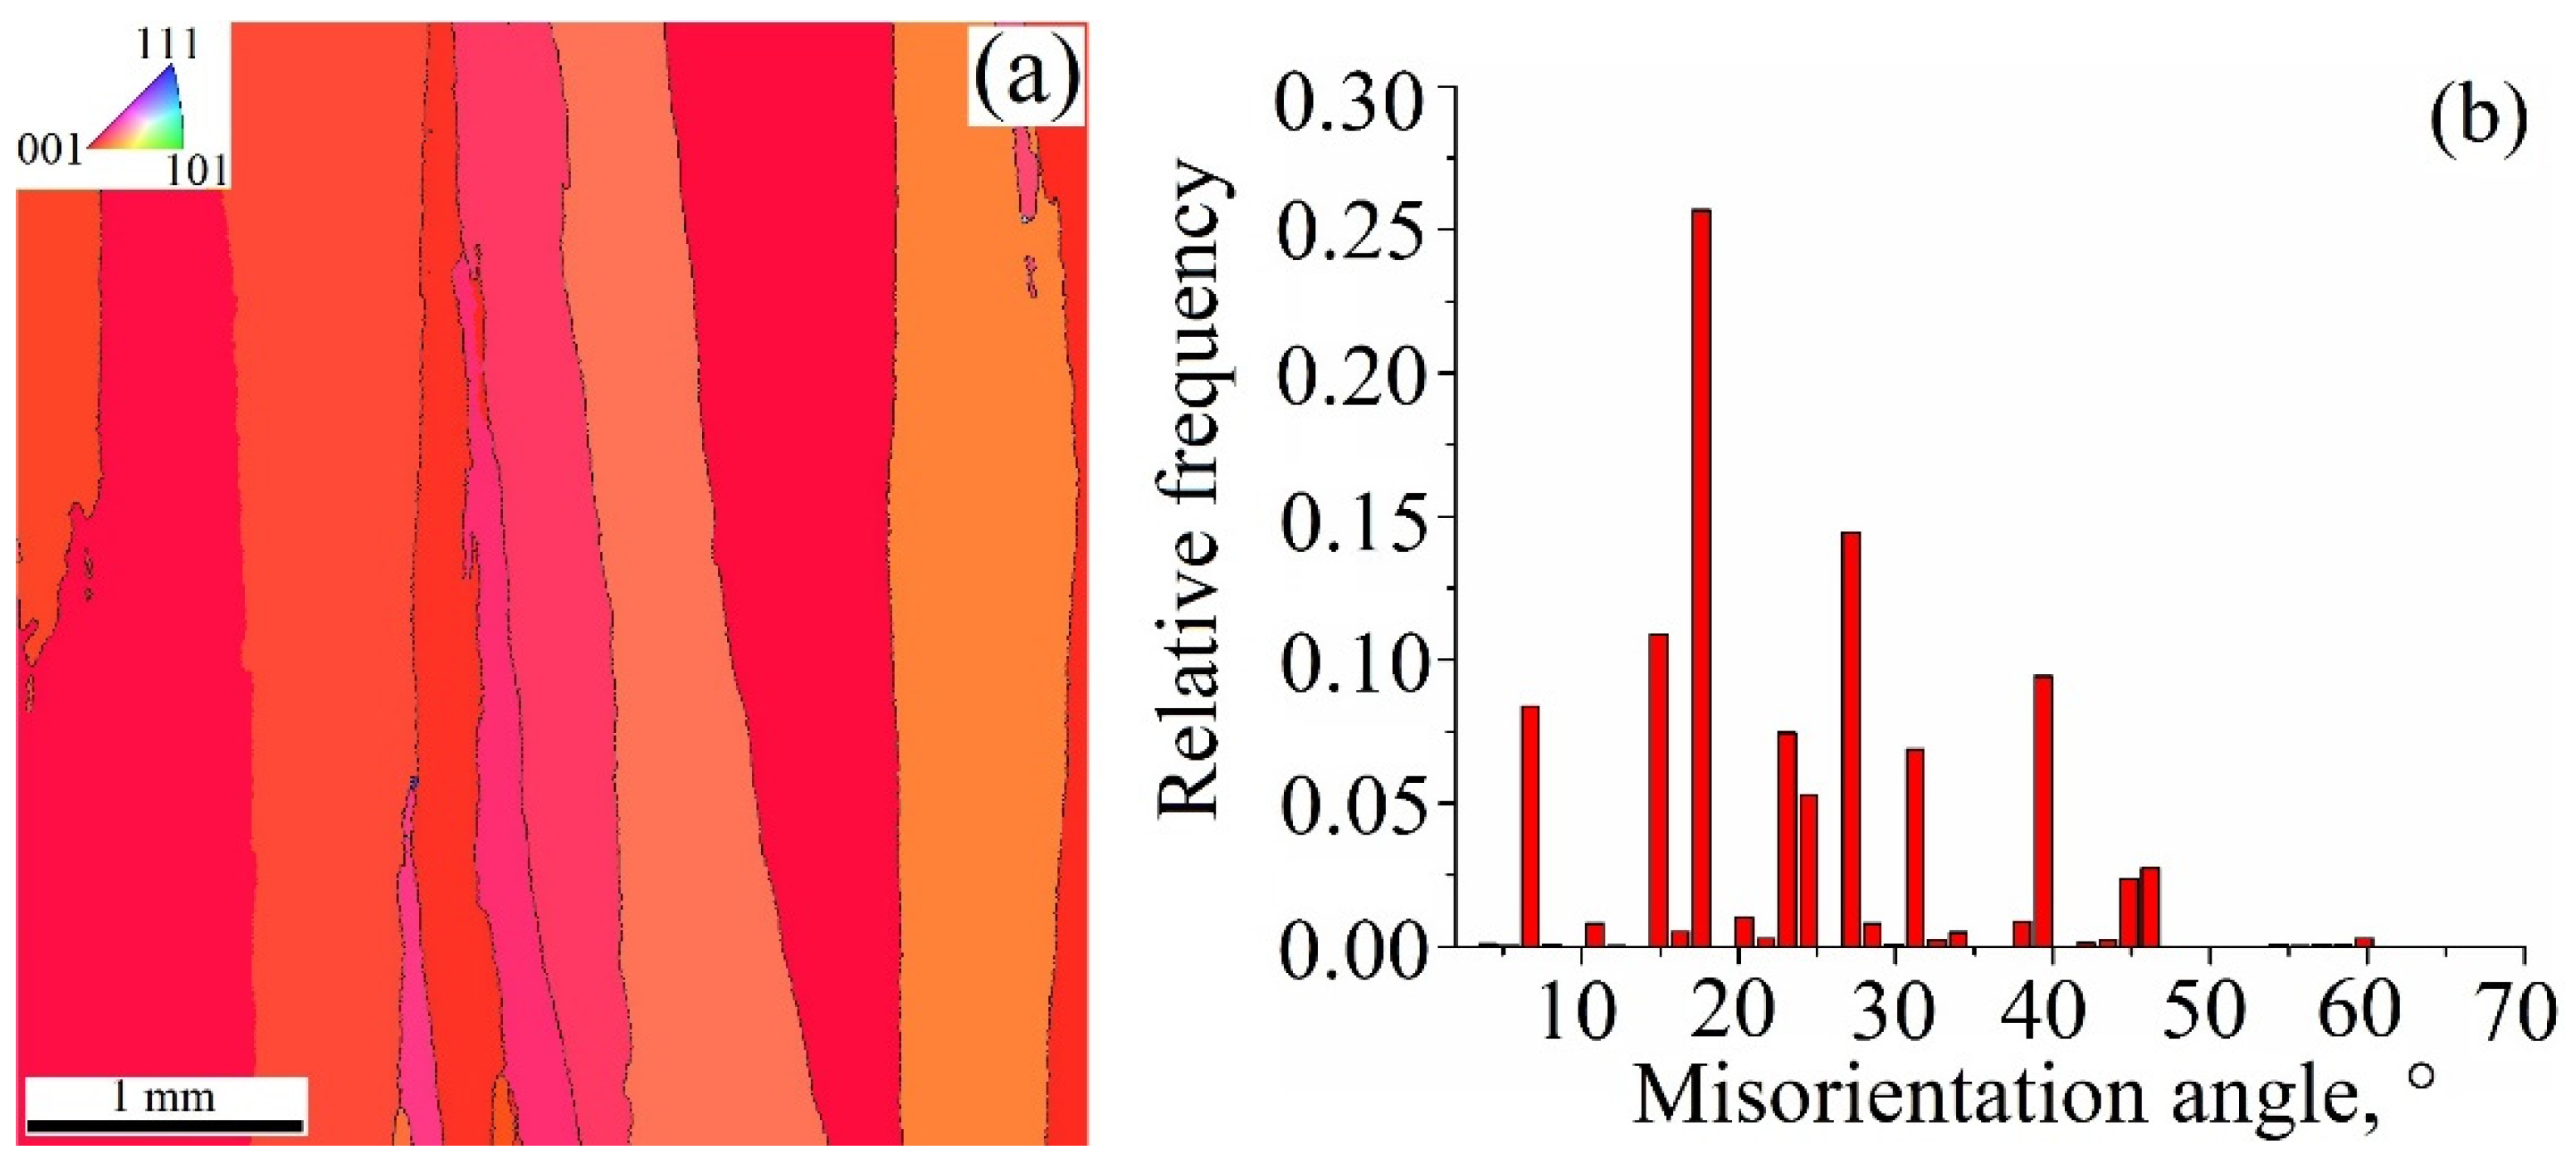
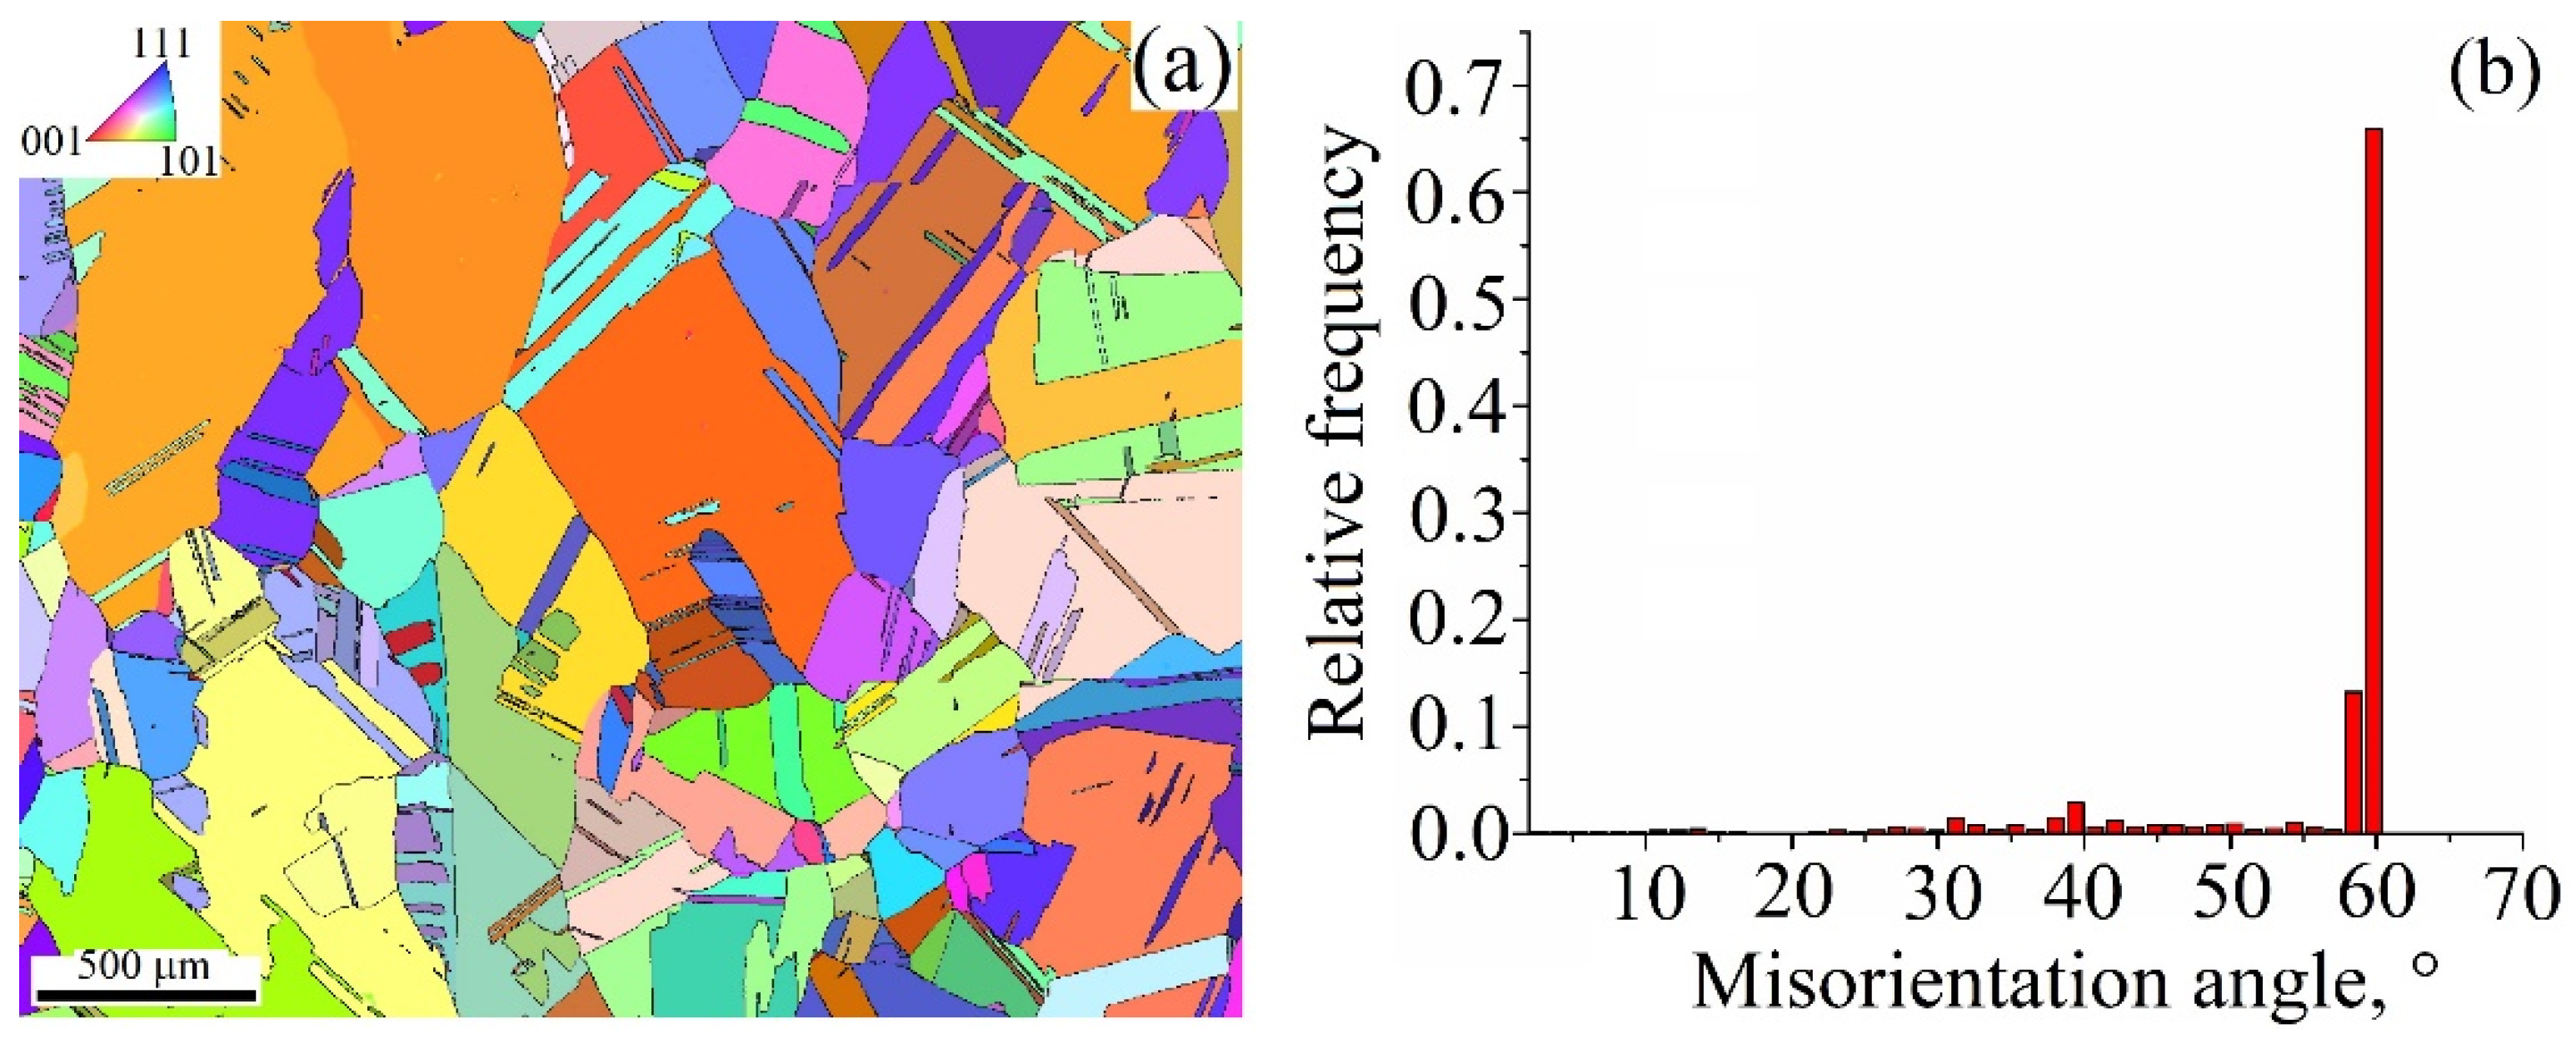
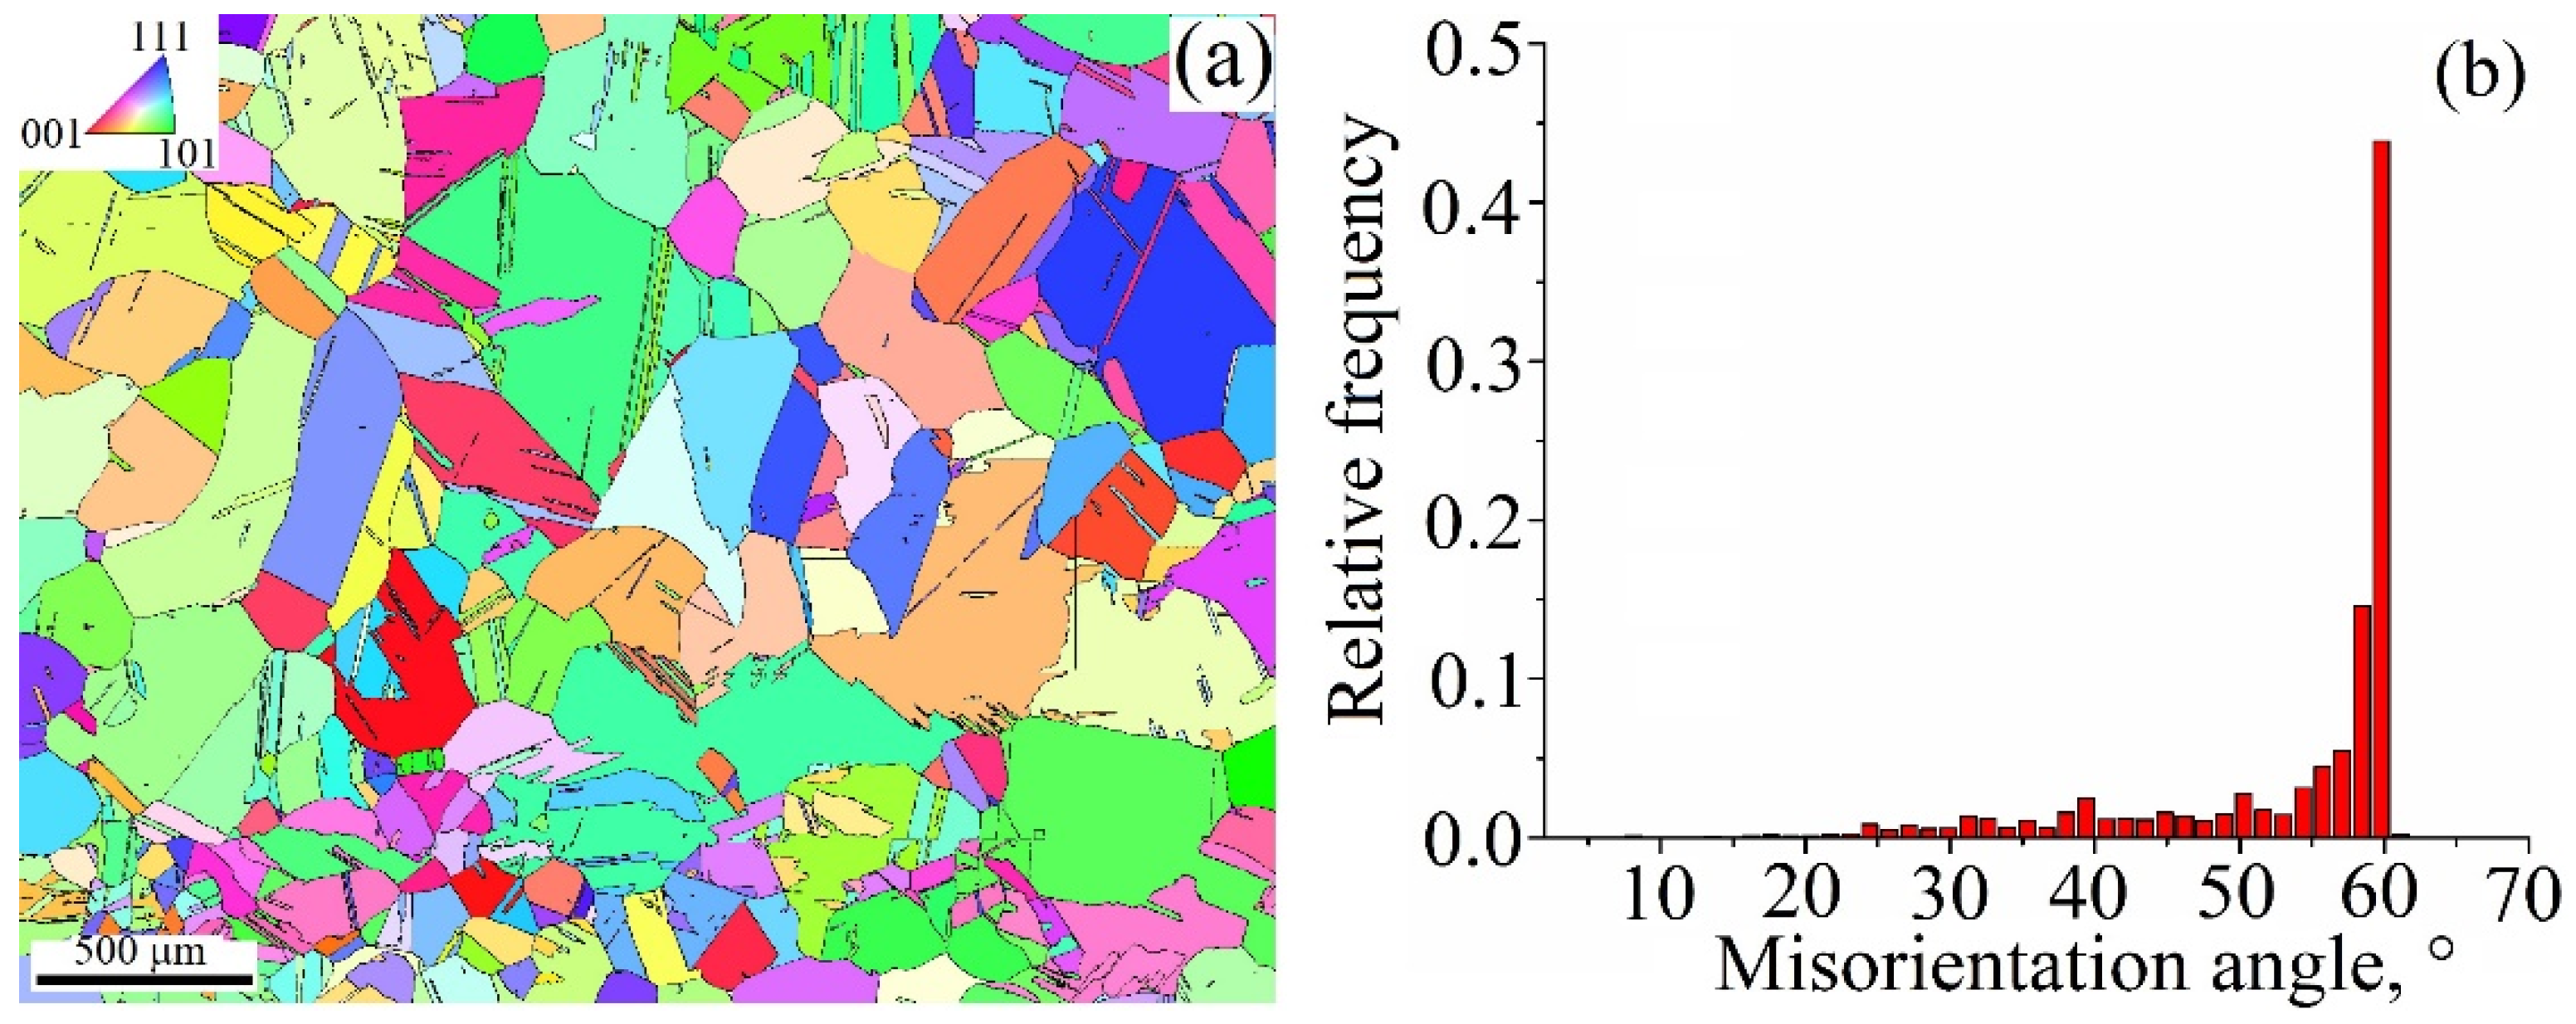
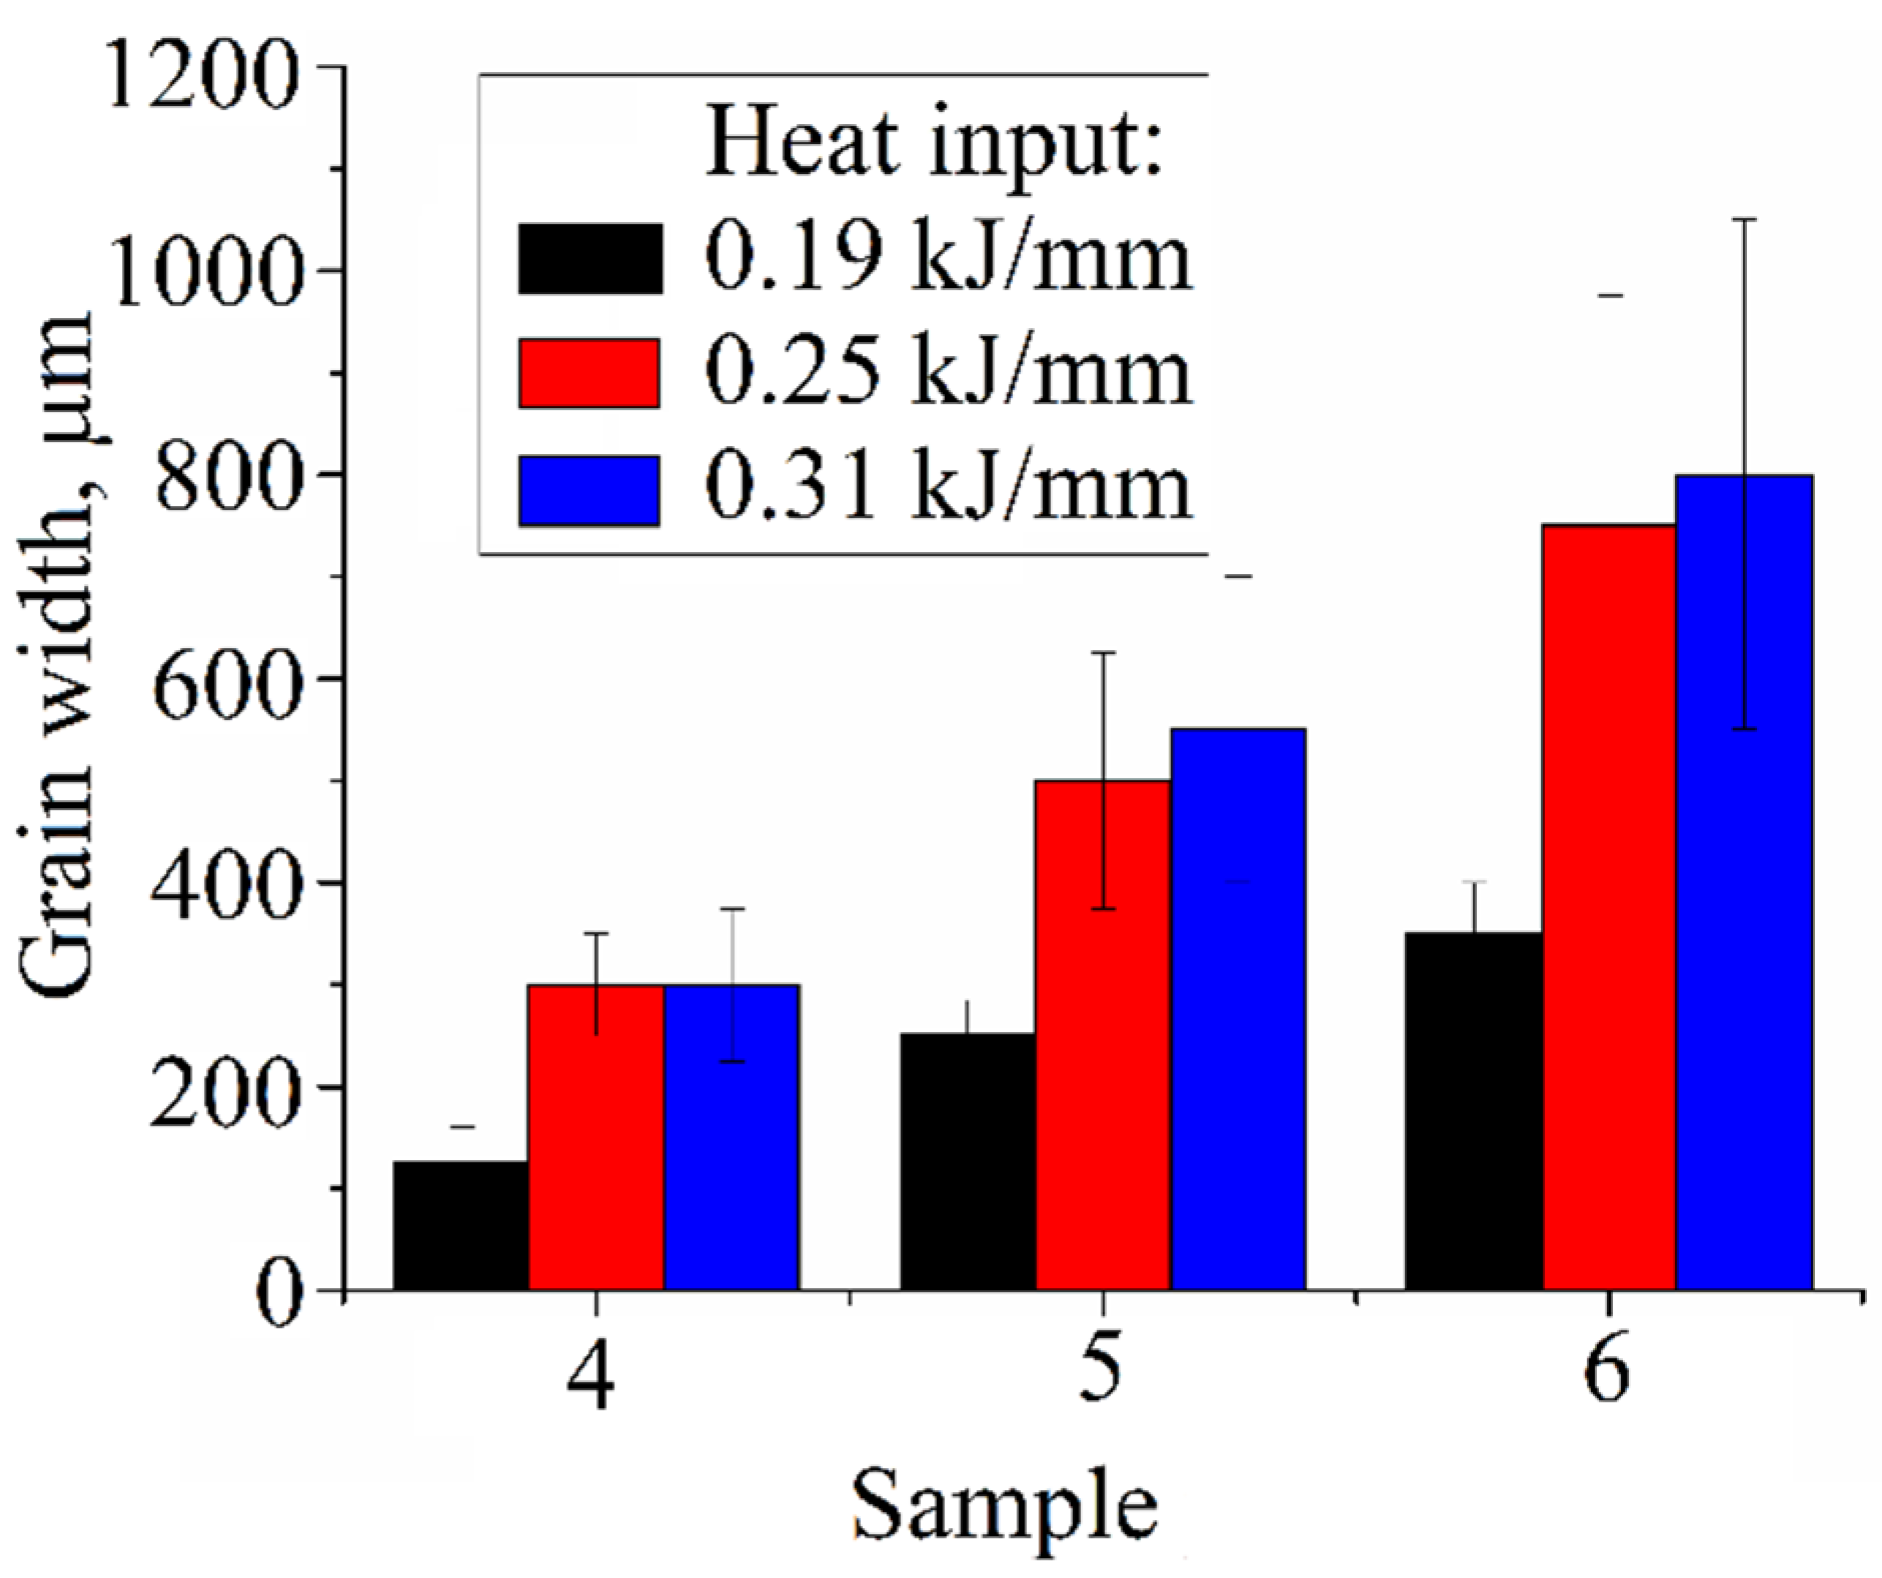
3.3. Grain Orientation Maps
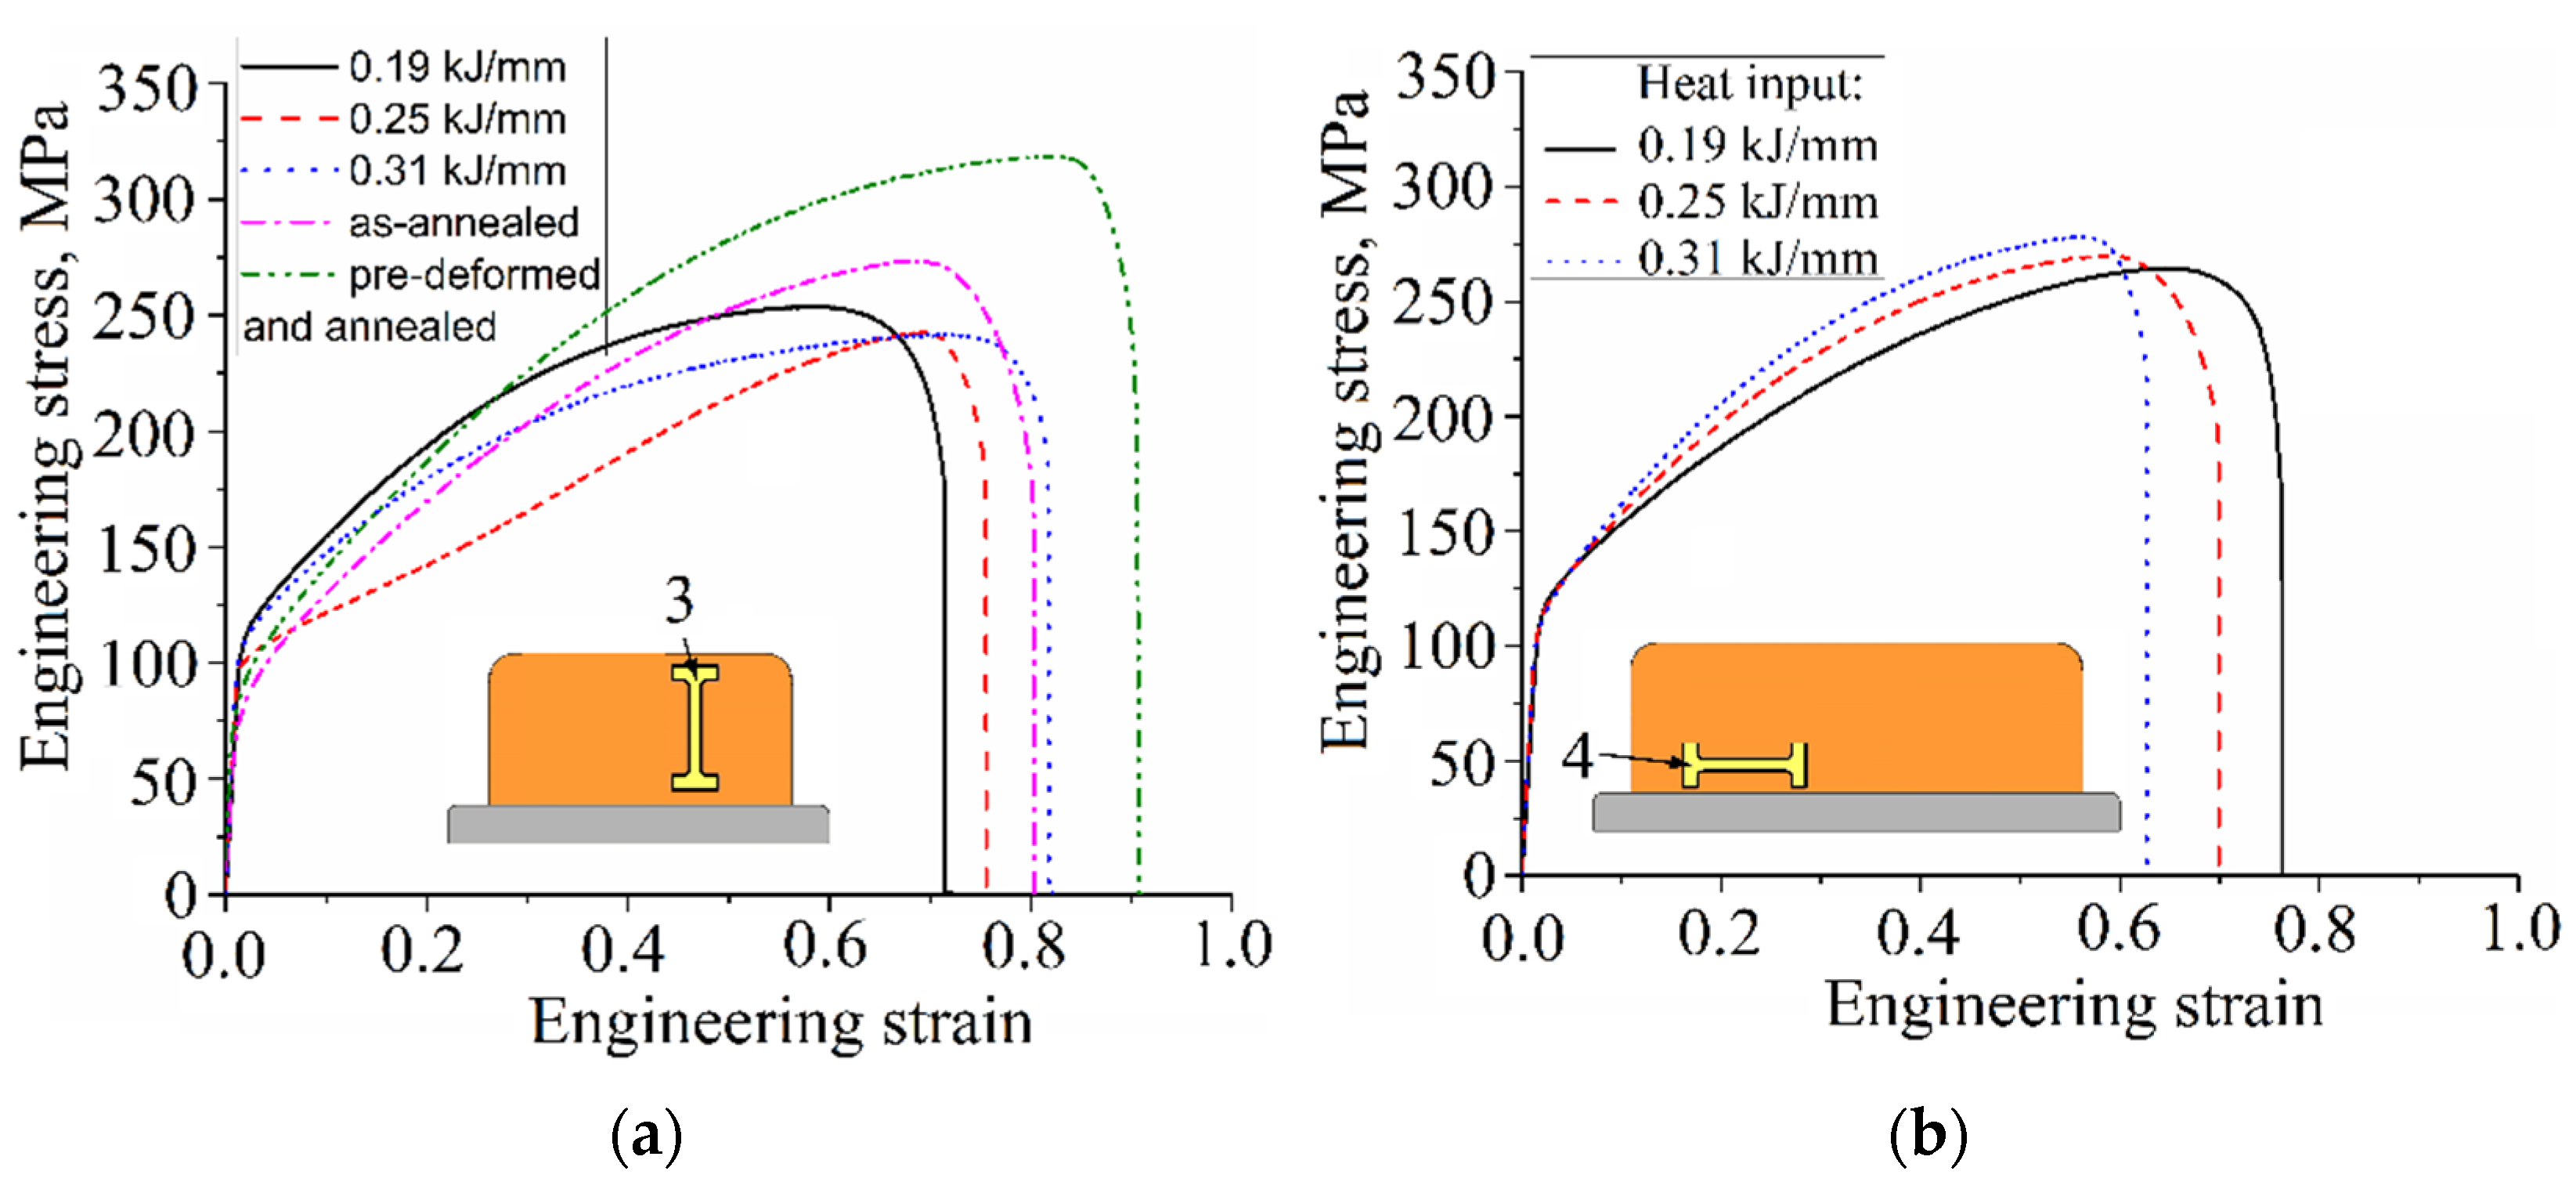
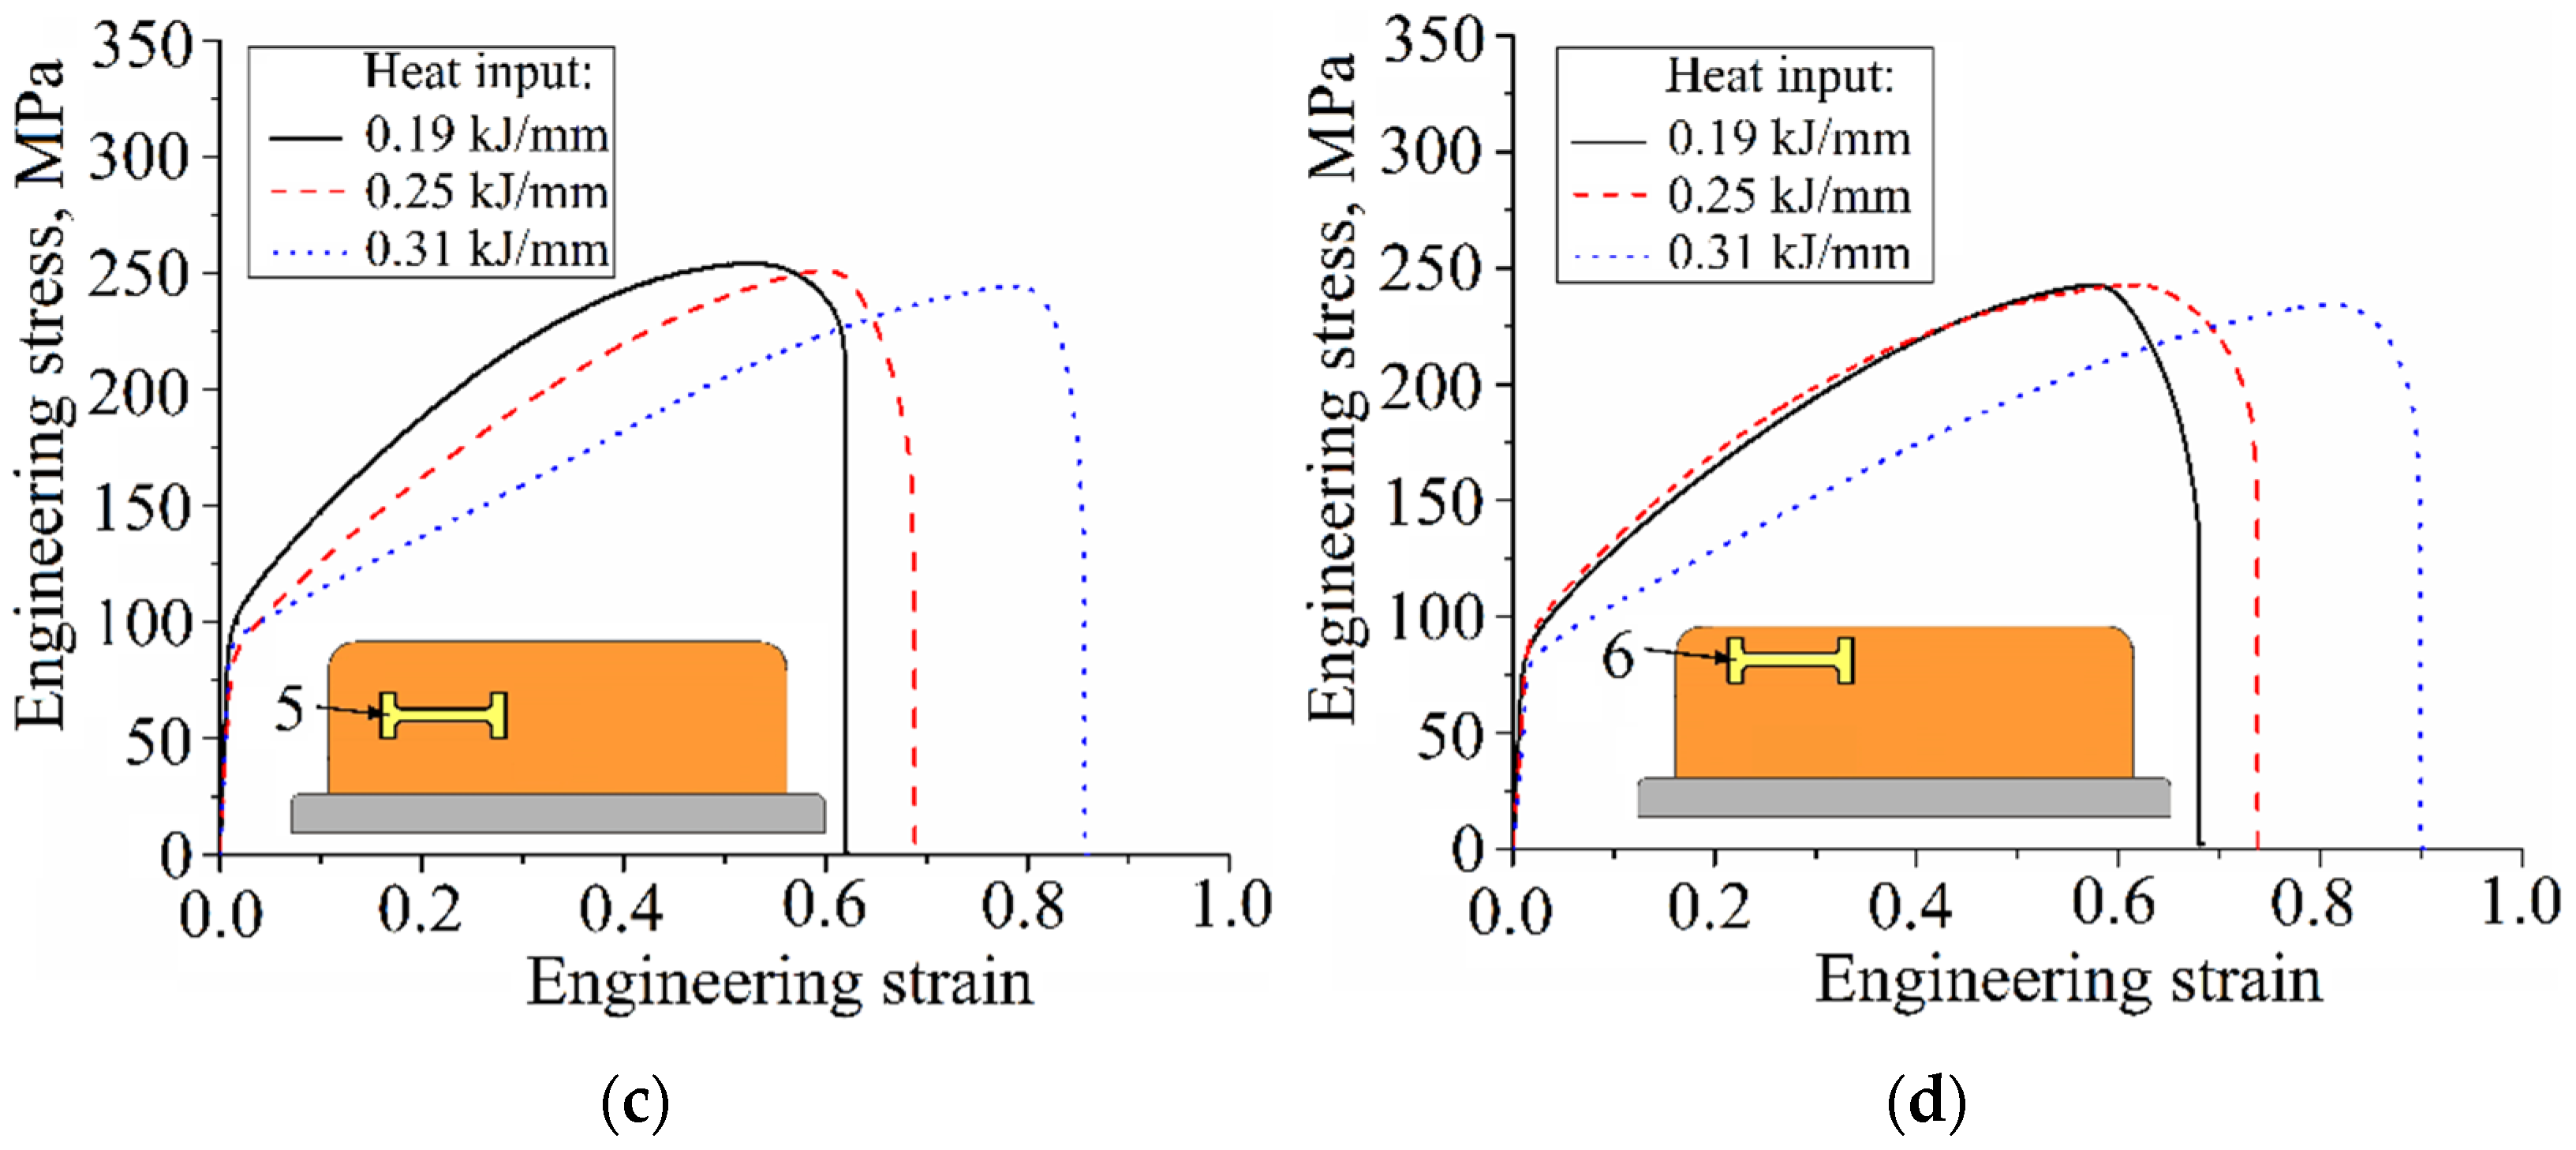
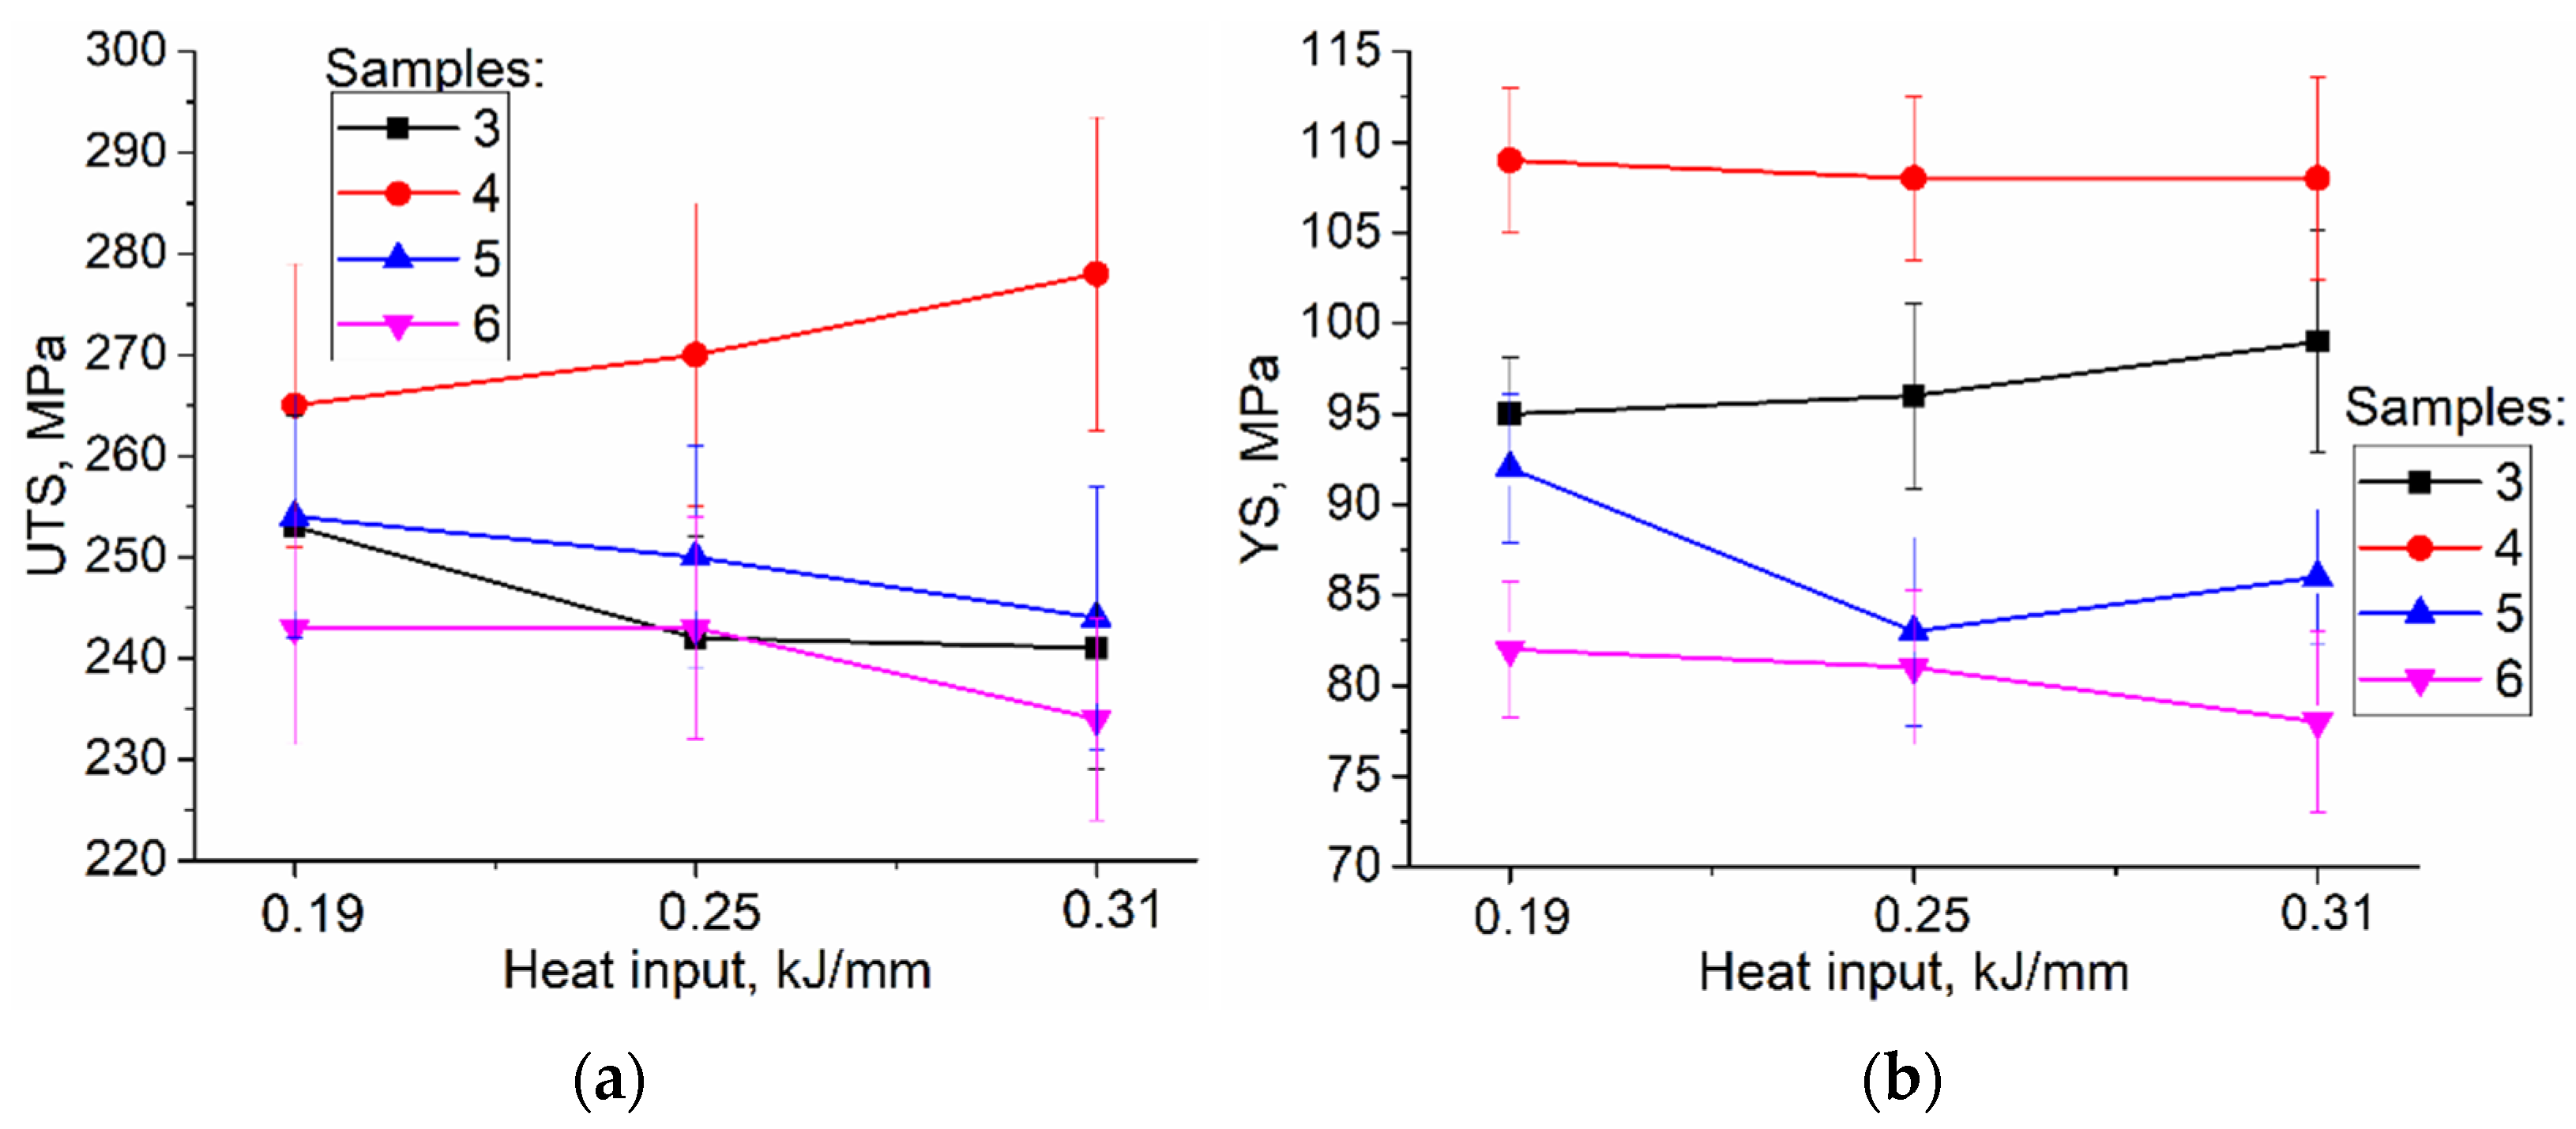
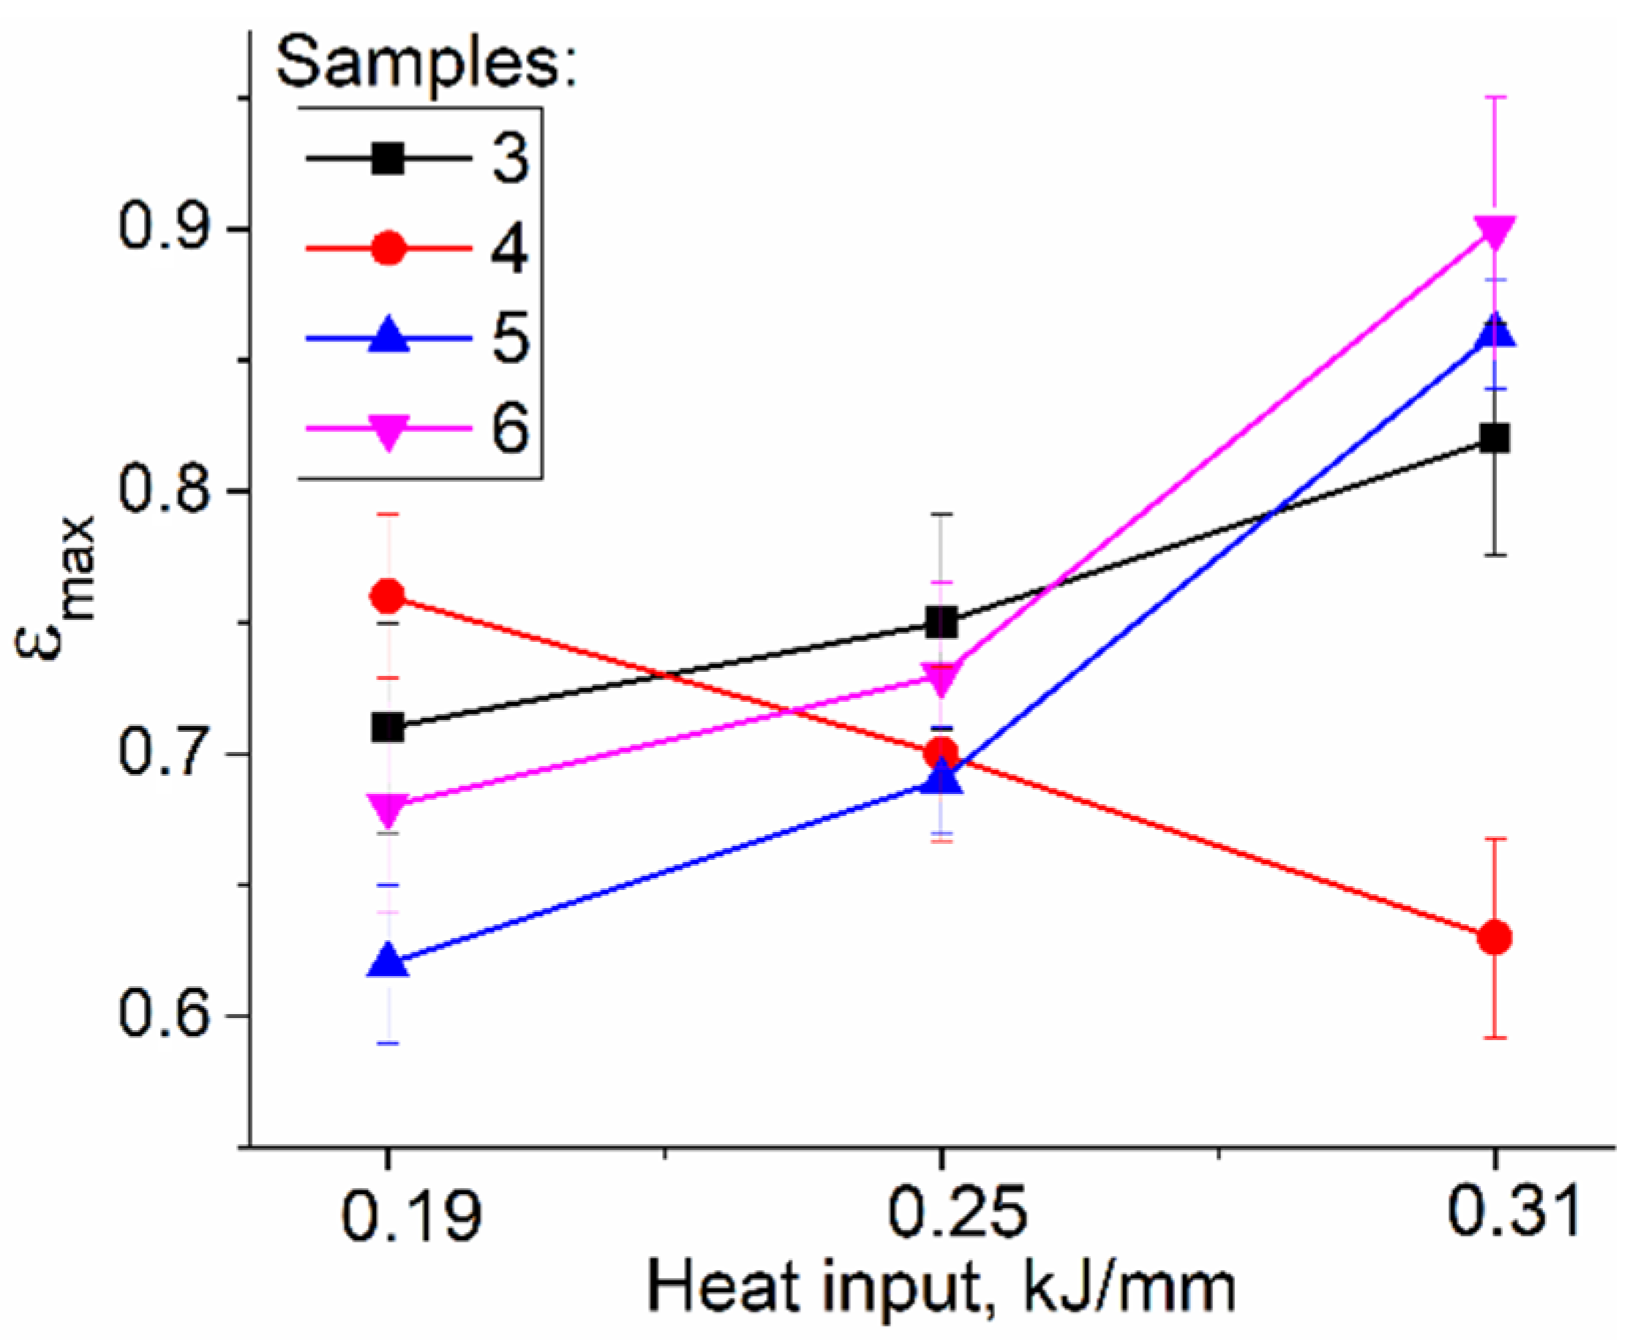
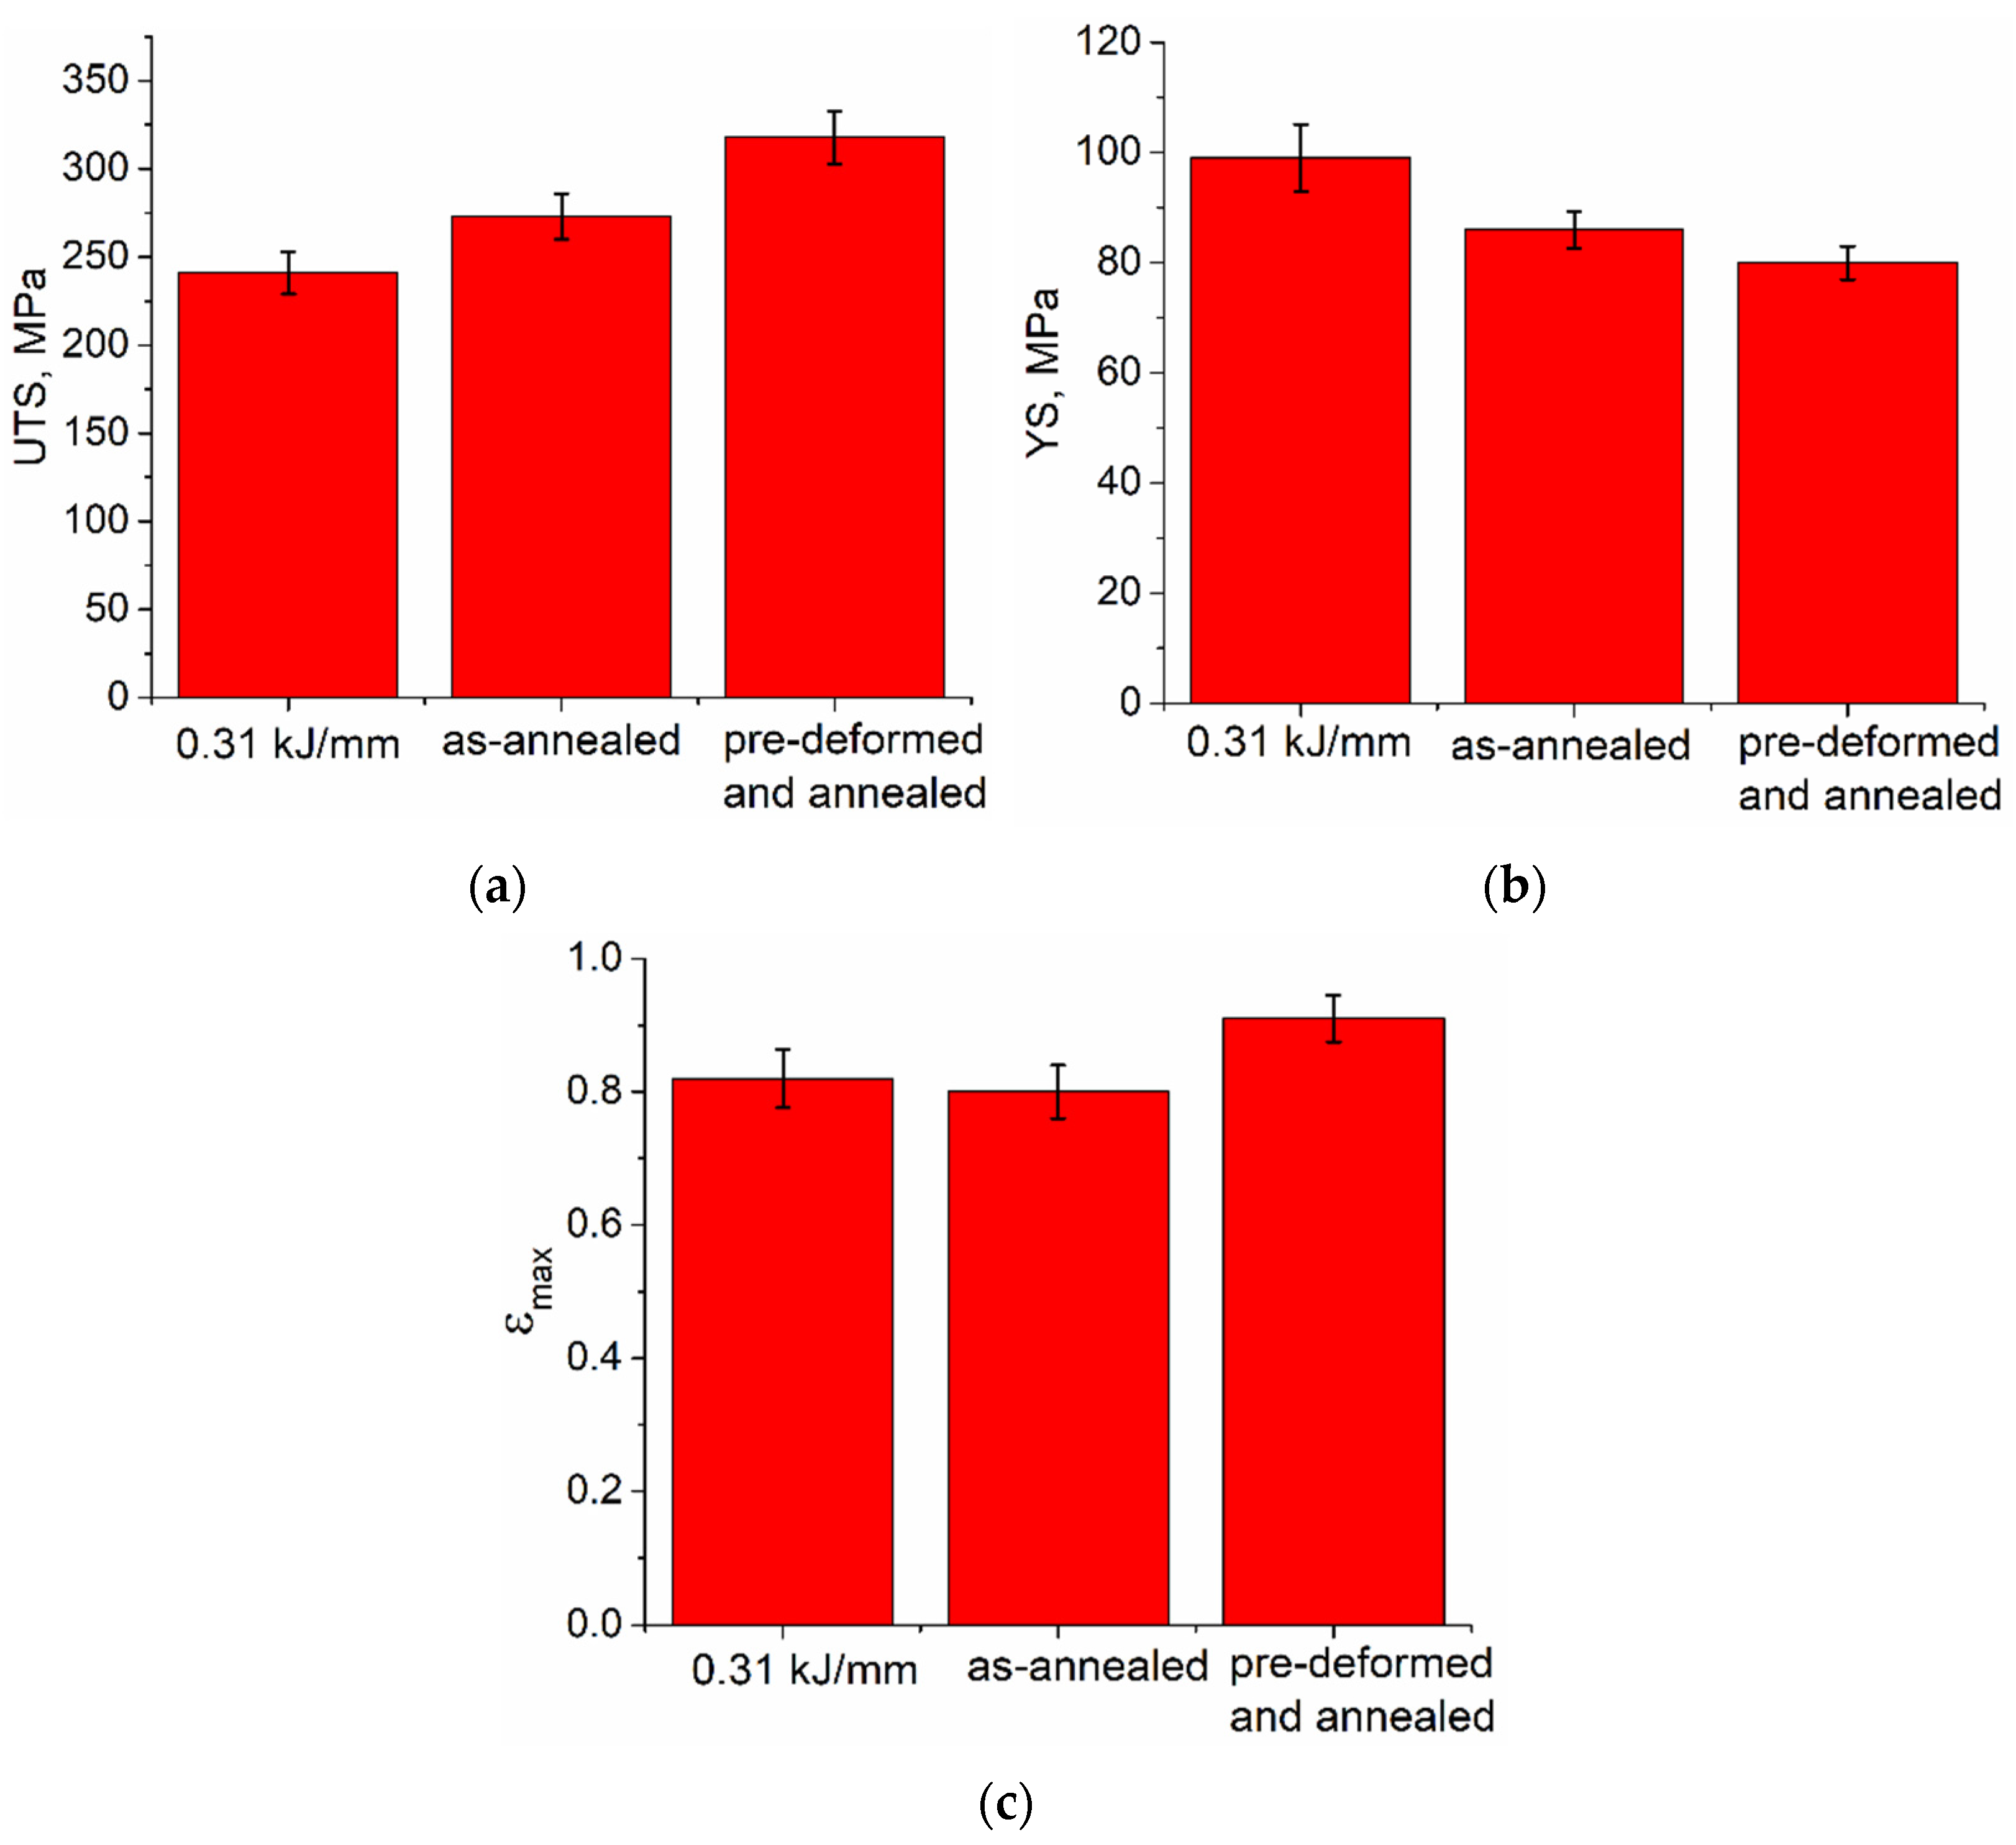
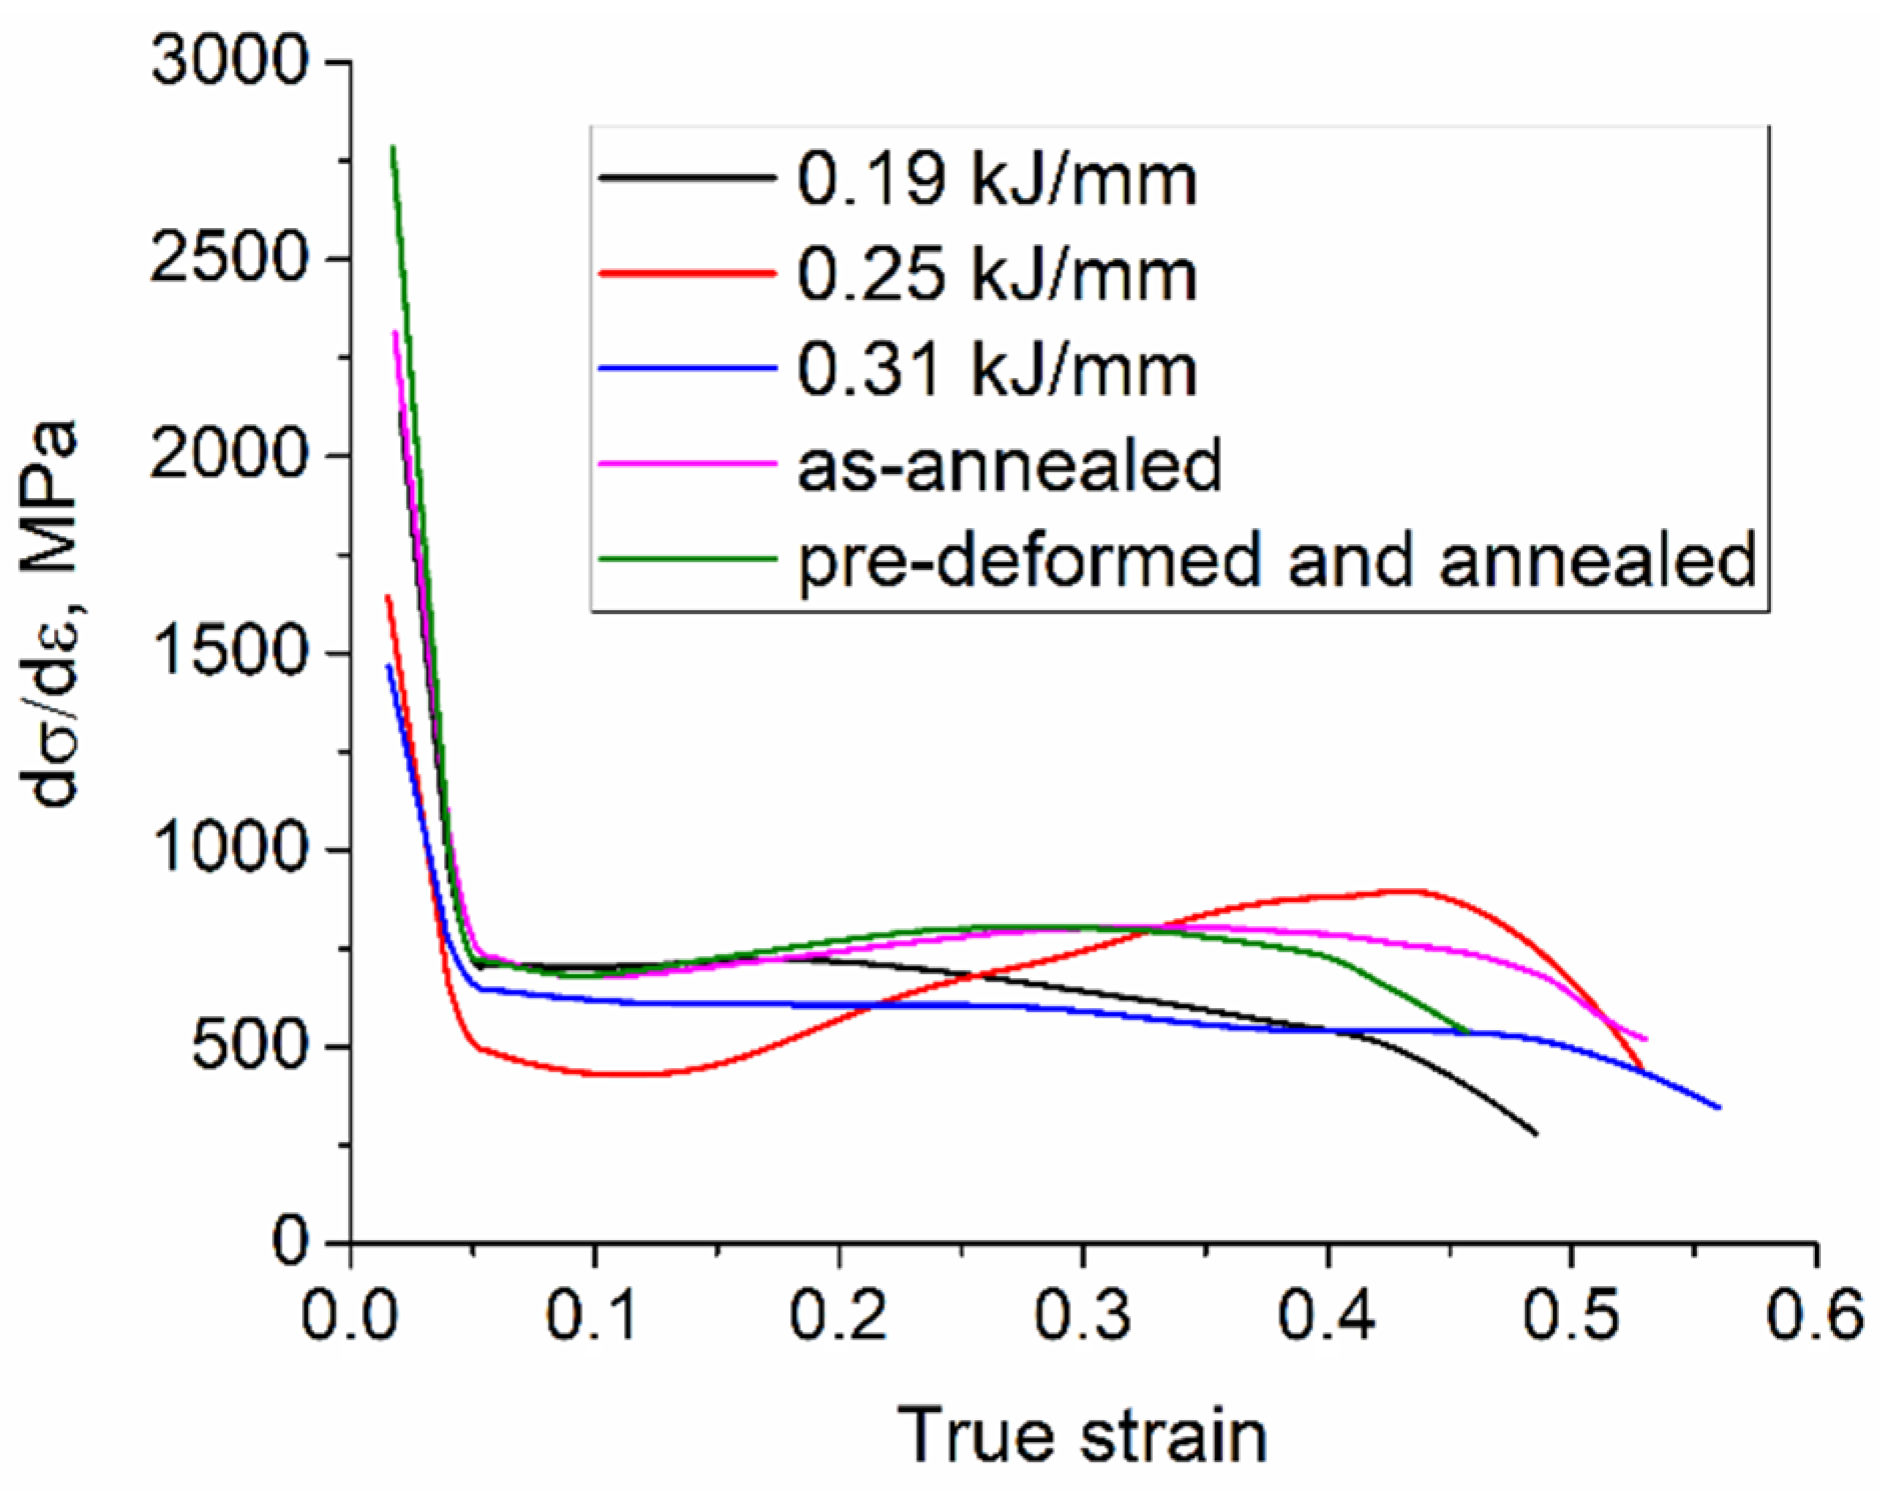
3.4. Mechanical Characteristics
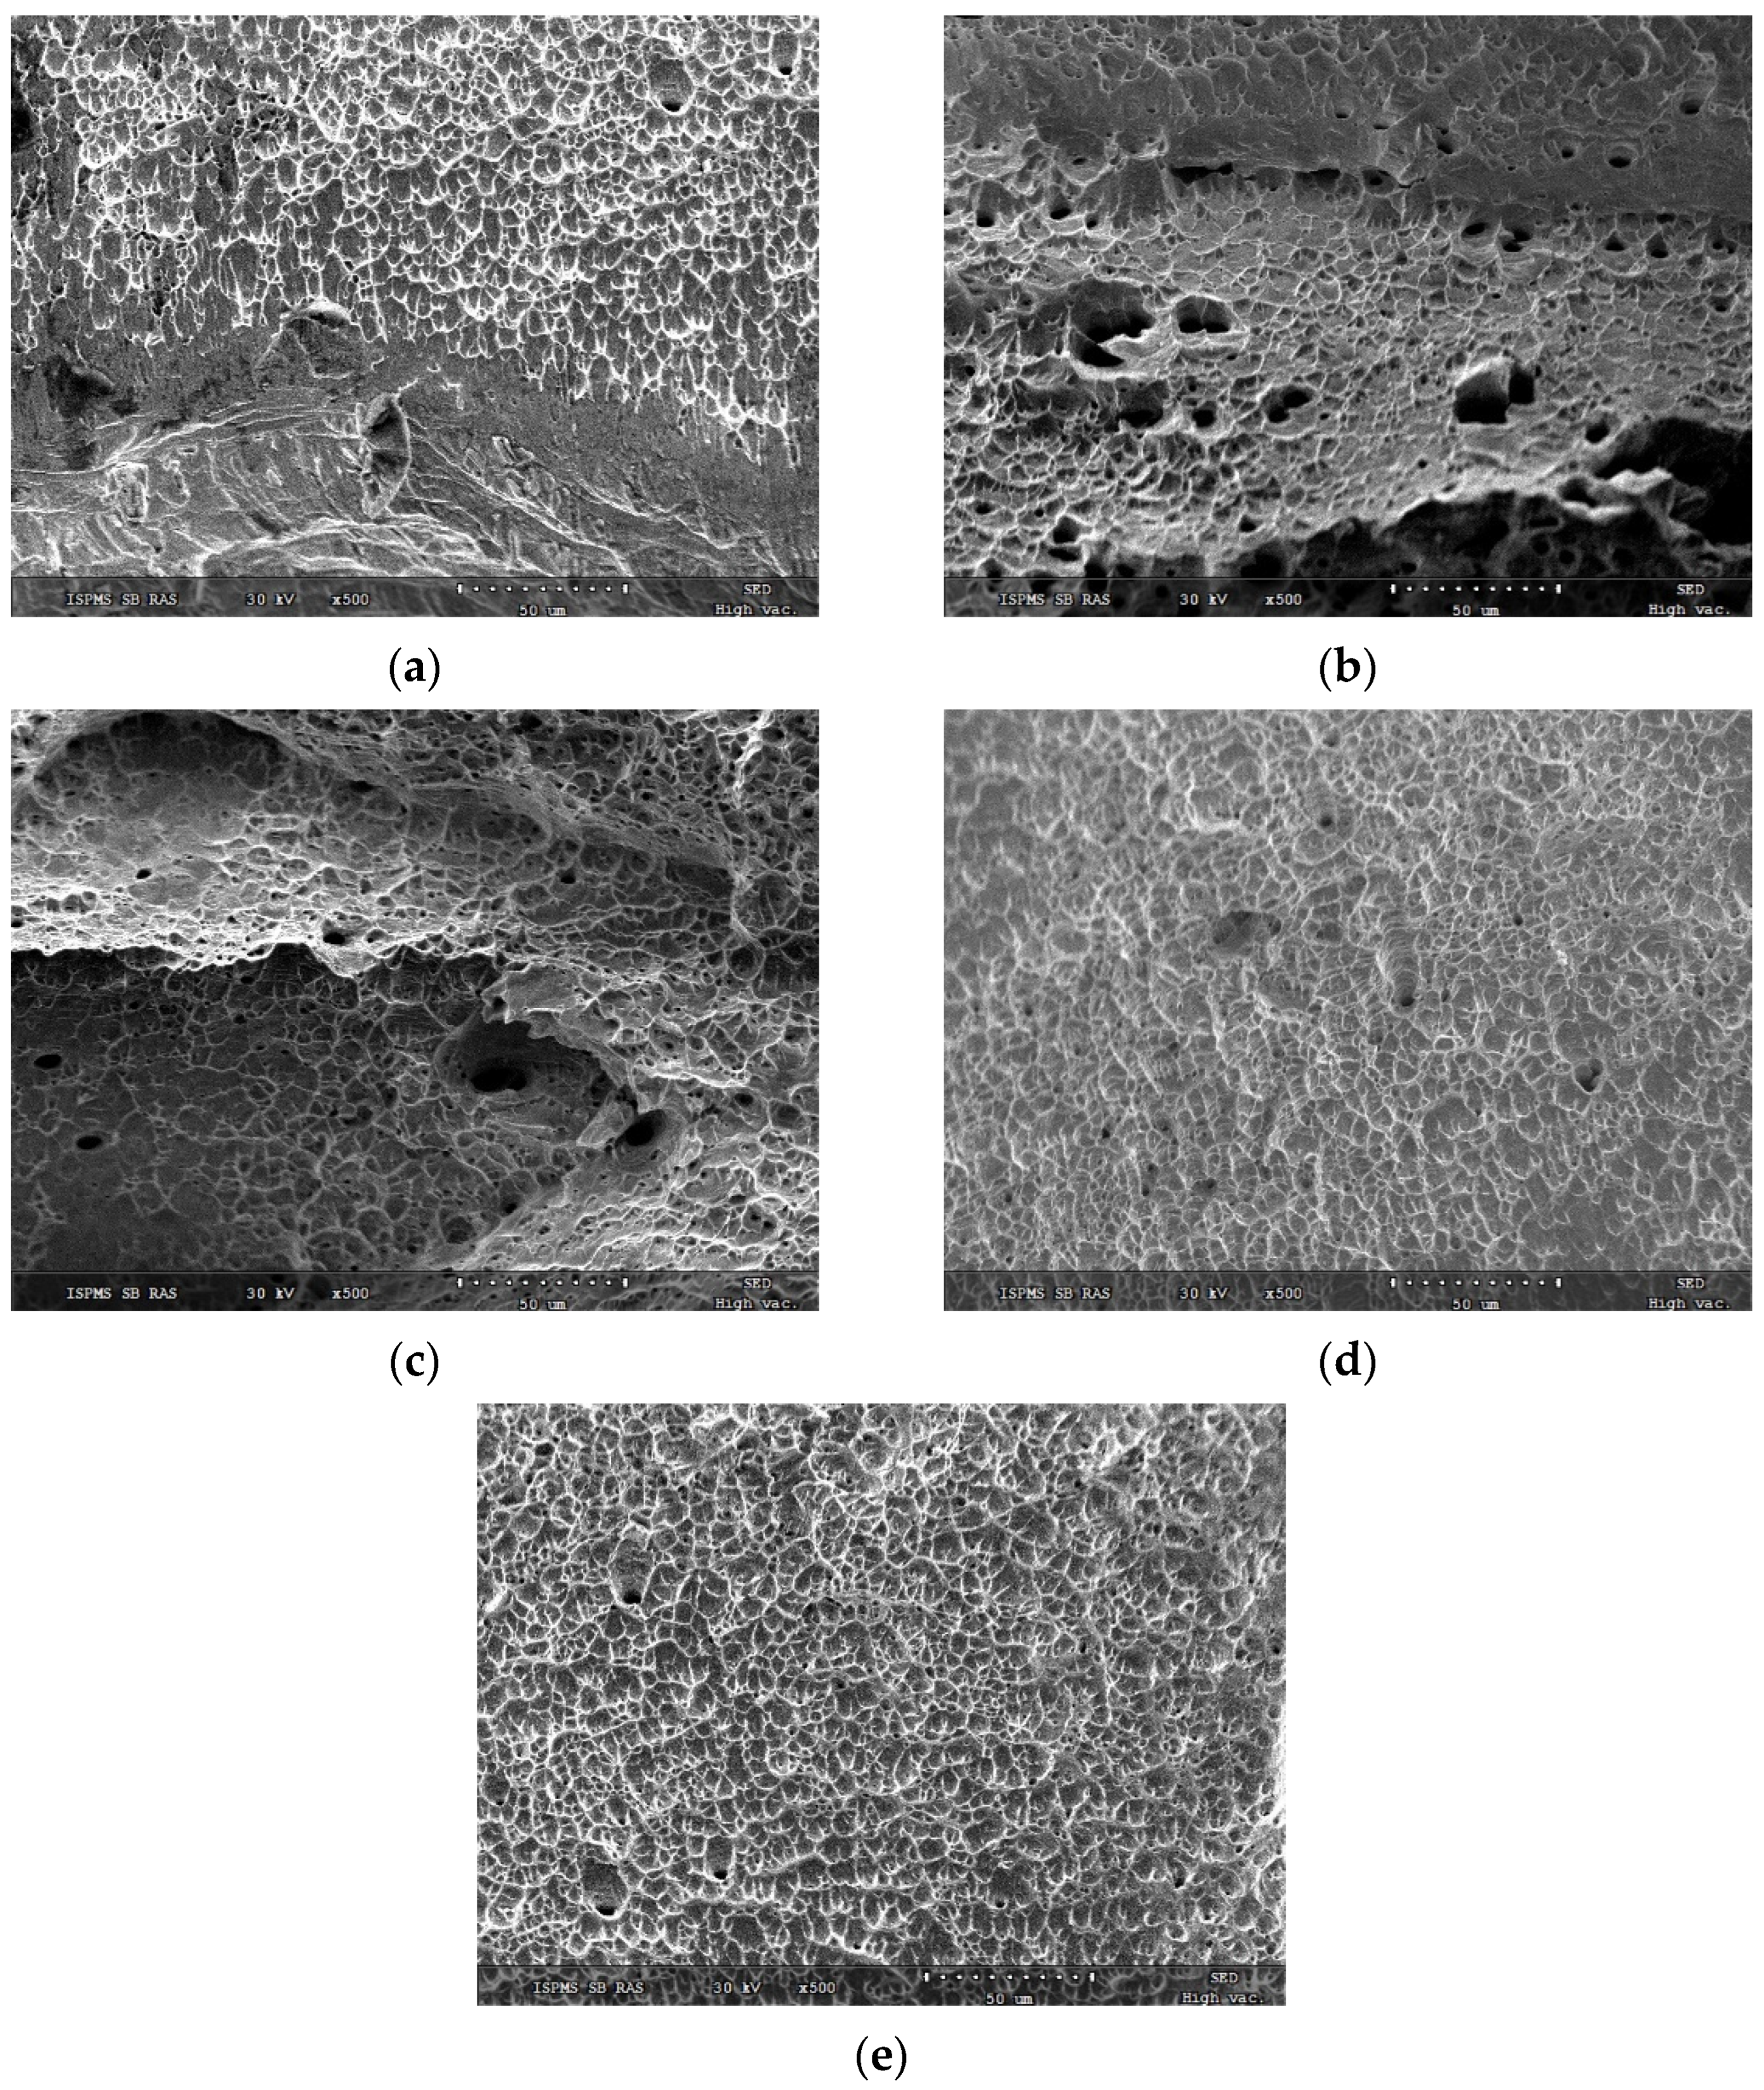
3.5. Fractography
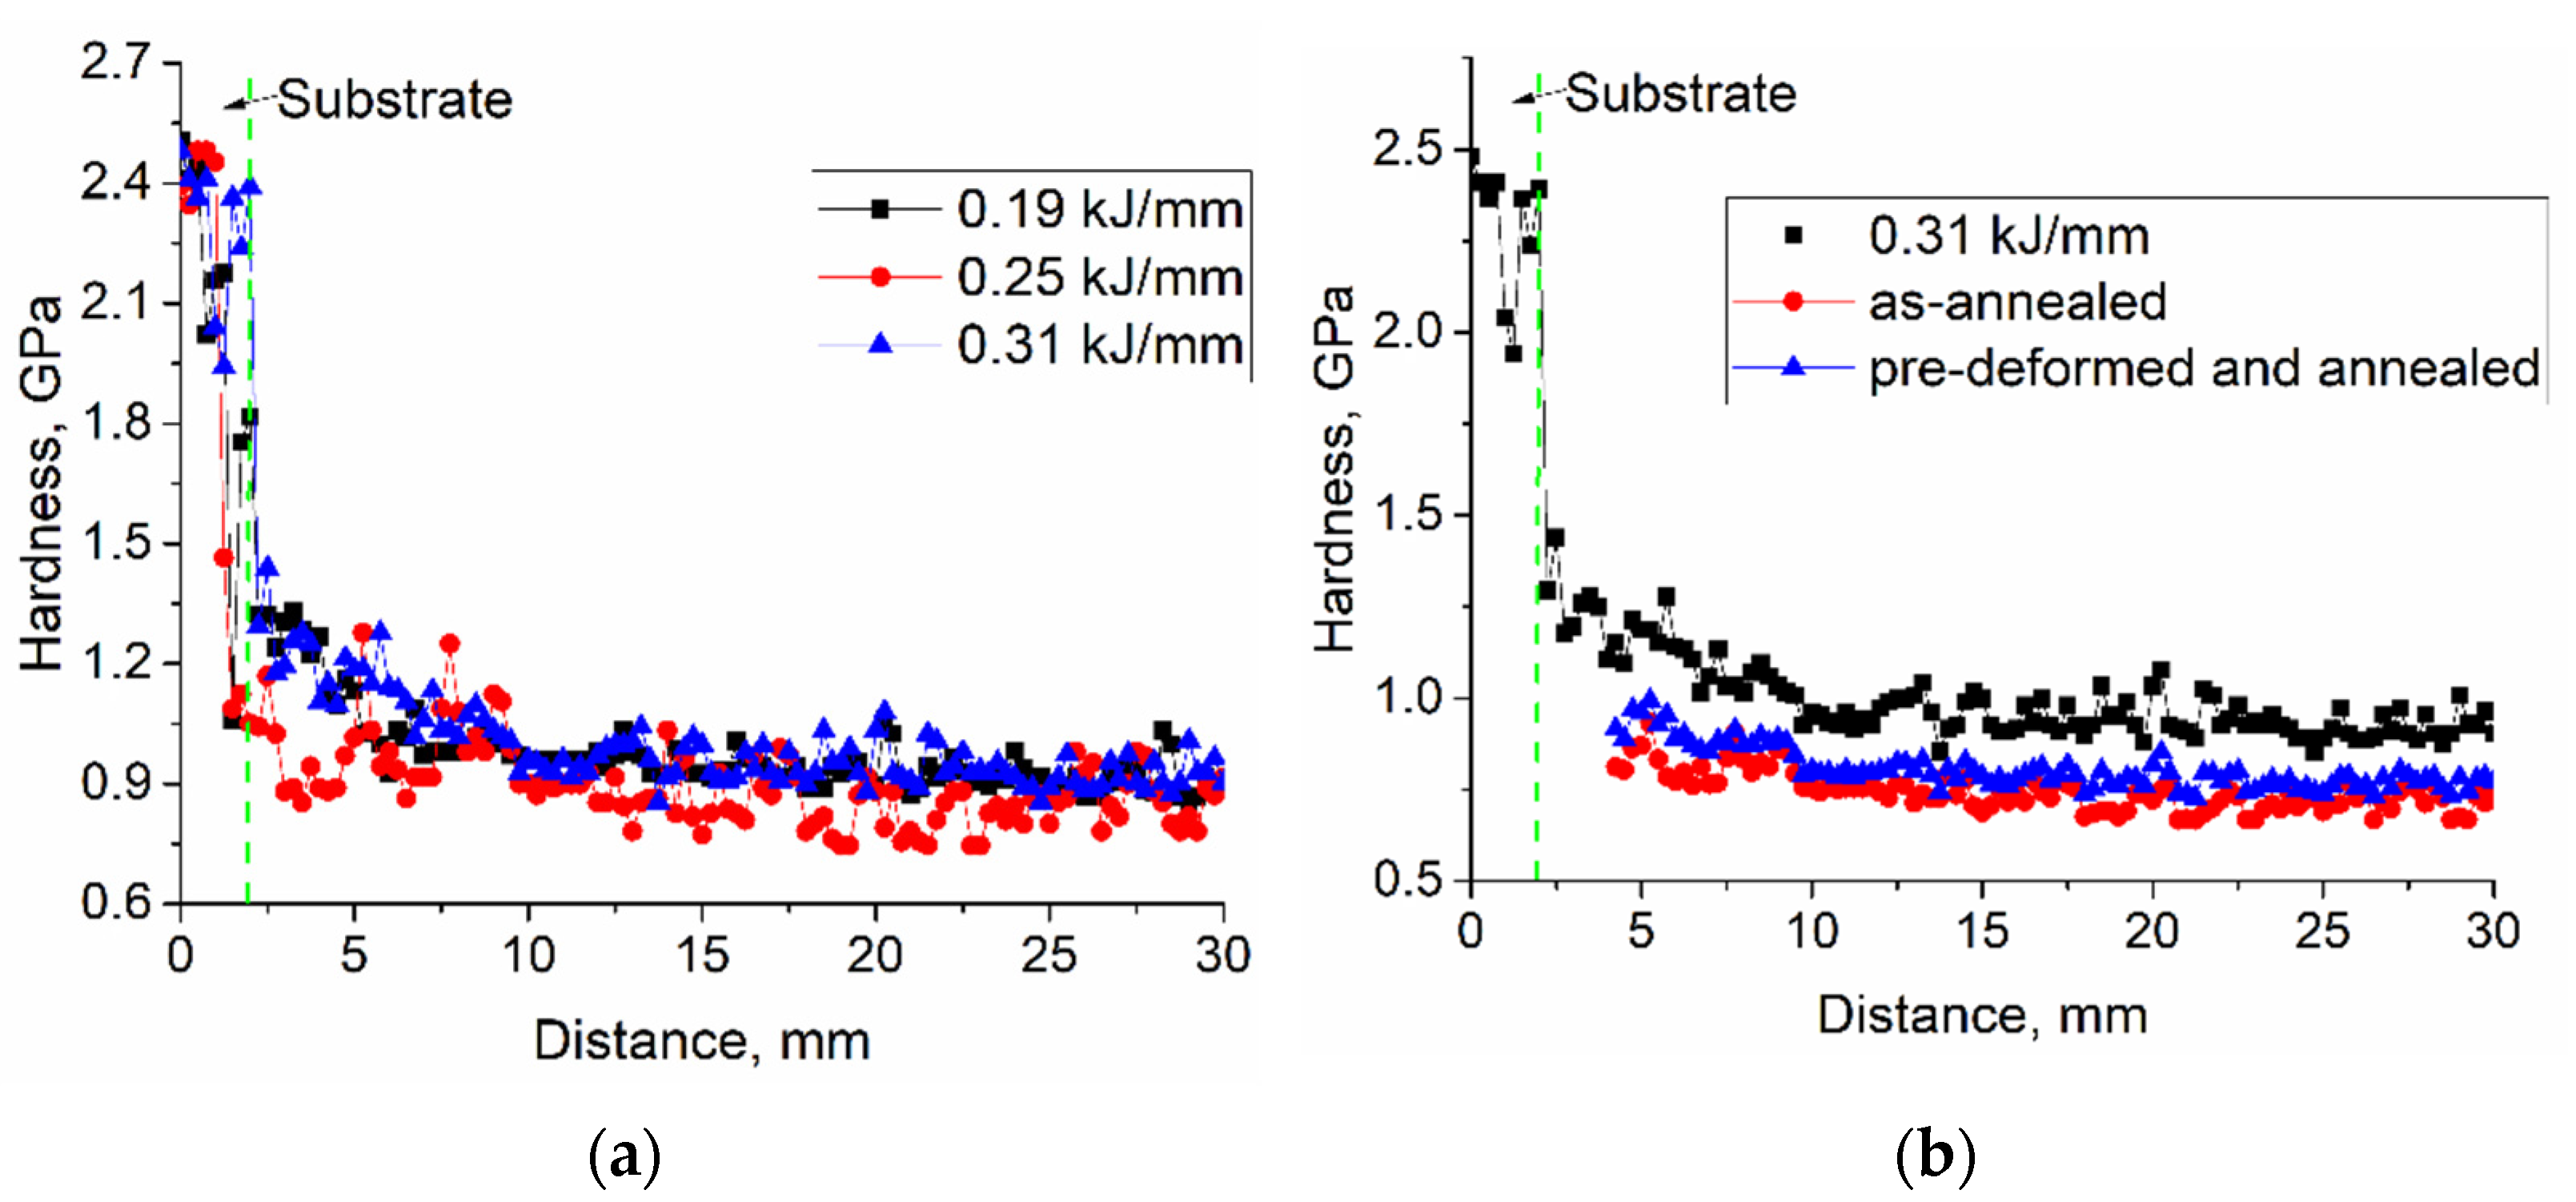
3.6. Microhardness
4. Discussion
5. Conclusions
Author Contributions
Funding
Institutional Review Board Statement
Informed Consent Statement
Data Availability Statement
Conflicts of Interest
References
- Casting of Copper and Copper Alloys, Casting. In ASM Handbook; Viswanathan, S.; Apelian, D.; Donahue, R.J.; DasGupta, B.; Gywn, M.; Jorstad, J.L.; Monroe, R.W.; Sahoo, M.; Prucha, T.E.; Twarog, D. (Eds.) ASM International: Cleavelend, OH, USA, 2008; Volume 15, pp. 1026–1048. [Google Scholar] [CrossRef]
- Masi, G.; Josse, C.; Esvan, J.; Chiavari, C.; Bernardi, E.; Martini, C.; Bignozzi, M.C.; Monticelli, C.; Zanotto, F.; Balbo, A.; et al. Evaluation of the protectiveness of an organosilane coating on patinated Cu-Si-Mn bronze for contemporary art. Prog. Org. Coat. 2019, 127, 286–299. [Google Scholar] [CrossRef] [Green Version]
- Kunimine, T.; Fujii, T.; Onaka, S.; Tsuji, N.; Kato, M. Effects of Si addition on mechanical properties of copper severely deformed by accumulative roll-bonding. J. Mater. Sci. 2011, 46, 4290–4295. [Google Scholar] [CrossRef]
- Han, W.Z.; Zhang, Z.F.; Wu, S.D.; Li, S.X. Combined effects of crystallographic orientation, stacking fault energy and grain size on deformation twinning in fcc crystals. Phil. Mag. 2008, 88, 3011–3029. [Google Scholar] [CrossRef]
- Asaolu, A.O.; Omotoyinbo, J.A.; Oke, S.R.; Falodun, O.E.; Olubambi, P.A. Effect of nickel addition on microstructure, tensile and corrosion properties of cold rolled silicon bronze. Mater. Today Proc. 2021, 38, 1147–1151. [Google Scholar] [CrossRef]
- Zeng, Y.; Yang, F.; Chen, Z.; Guo, E.; Gao, M.; Wang, X.; Kang, H.; Wang, T. Enhancing mechanical properties and corrosion resistance of nickel-aluminum bronze via hot rolling process. J. Mater. Sci. Technol. 2021, 61, 186–196. [Google Scholar] [CrossRef]
- Kaiser, S.; Kaiser, M.S. Impact of cold plastic deformation and thermal posttreatment on the physical properties of copper based alloys al-bronze and α-brass. Acta Metall. Slov. 2021, 27, 114–121. [Google Scholar] [CrossRef]
- Aravind, A.; Saravanan, R. Improvement in hardness, wear rate and corrosion resistance of silicon bronze using gas tungsten arc. Mater. Today Proc. 2020, 24, 406–414. [Google Scholar] [CrossRef]
- Bragov, A.M.; Konstantinov, A.Y.; Lomunov, A.K.; Stolyarov, V.V.; Kuznetsov, A.V.; Smakovsky, M.S.; Savenkov, G.G. Features of Dynamic Deformation and Failure of Aluminum Bronze Processed by Laser Surface Treatment. J. Dyn. Behav. Mater. 2022, 8, 122–136. [Google Scholar] [CrossRef]
- Ding, D.; Pan, Z.; Cuiuri, D.; Li, H. Wire-feed additive manufacturing of metal components: Technologies, developments and future interests. Int. J. Adv. Manuf. Technol. 2015, 81, 465–481. [Google Scholar] [CrossRef]
- Huang, W.; Chen, S.; Xiao, J.; Jiang, X.; Jia, Y. Laser wire-feed metal additive manufacturing of the Al alloy. Opt. Las. Technol. 2021, 134, 106627. [Google Scholar] [CrossRef]
- Manoj, A.; Rao, M.A.; Basha, M.M.; Basha, S.M.; Sankar, M.R. State of art on wire feed additive manufacturing of Ti-6Al-4V alloy. Mater. Today Proc. 2020, 26, 2608–2615. [Google Scholar] [CrossRef]
- Yao, M.; Yao, Z.; Tao, X.; Huang, C.; Zhang, S. Alleviating plastic anisotropy of boron modified titanium alloy by constructing layered structure via electron beam directed energy deposition. Addit. Manuf. 2022, 50, 102561. [Google Scholar] [CrossRef]
- Osipovich, K.; Vorontsov, A.; Chumaevskii, A.; Moskvichev, E.; Zakharevich, I.; Dobrovolsky, A.; Sudarikov, A.; Zykova, A.; Rubtsov, V.; Kolubaev, E. Features of Microstructure and Texture Formation of Large-Sized Blocks of C11000 Copper Produced by Electron Beam Wire-Feed Additive Technology. Materials 2022, 15, 814. [Google Scholar] [CrossRef]
- Zhang, Z.; Zhang, Y.; Du, M.; Zhang, S.; Lei, L. Experimental Characterization and Microstructural Evaluation of Silicon Bronze-Alloy Steel Bimetallic Structures by Additive Manufacturing. Metall. Mater. Trans. A 2021, 52, 4664–4674. [Google Scholar] [CrossRef]
- Fortuna, S.V.; Gurianov, D.A.; Kalashnikov, K.N.; Chumaevskii, A.V.; Mironov, Y.P.; Kolubaev, E.A. Directional Solidification of a Nickel-Based Superalloy Product Structure Fabricated on Stainless Steel Substrate by Electron Beam Additive Manufacturing. Metall. Mater. Trans. A 2021, 52, 857–870. [Google Scholar] [CrossRef]
- Kalashnikov, K.N.; Rubtsov, V.E.; Savchenko, N.L.; Kalashnikova, T.A.; Osipovich, K.S.; Eliseev, A.A.; Chumaevskii, A.V. The effect of wire feed geometry on electron beam freeform 3D printing of complex-shaped samples from Ti-6Al-4V alloy. Int. J. Adv. Manuf. Technol. 2019, 105, 3147–3156. [Google Scholar] [CrossRef]
- Osipovich, K.S.; Astafurova, E.G.; Chumaevskii, A.V.; Kalashnikov, K.N.; Astafurov, S.V.; Maier, G.G.; Melnikov, E.V.; Moskvina, V.A.; Panchenko, M.Y.; Tarasov, S.Y.; et al. Gradient transition zone structure in “steel–copper” sample produced by double wire-feed electron beam additive manufacturing. J. Mater. Sci. 2020, 55, 9258–9272. [Google Scholar] [CrossRef]
- Khoroshko, E.S.; Filippov, A.V.; Shamarin, N.N.; Moskvichev, E.N.; Utyaganova, V.R.; Tarasov, S.Y.; Savchenko, N.L.; Kolubaev, E.A.; Rubtsov, V.E.; Lychagin, D.V. Structure and Mechanical Properties of Cu–Al–Si–Mn System-Based Copper Alloy Obtained by Additive Manufacturing. Russ. Phys. J. 2021, 64, 333–339. [Google Scholar] [CrossRef]
- Dutkiewicz, J.; Rogal, Ł.; Kalita, D.; Kawałko, J.; Węglowski, M.S.; Kwieciński, K.; Śliwiński, P.; Danielewski, H.; Antoszewski, B.; Cesari, E. Microstructure, Mechanical Properties, and Martensitic Transformation in NiTi Shape Memory Alloy Fabricated Using Electron Beam Additive Manufacturing Technique. J. Mater. Eng. Perform. 2021, 31, 1609–1621. [Google Scholar] [CrossRef]
- Dutkiewicz, J.; Rogal, Ł.; Kalita, D.; Węglowski, M.; Błacha, S.; Berent, K.; Czeppe, T.; Antolak-Dudka, A.; Durejko, T.; Czujko, T. Superelastic Effect in NiTi Alloys Manufactured Using Electron Beam and Focused Laser Rapid Manufacturing Methods. J. Mater. Eng. Perform. 2020, 29, 4463–4473. [Google Scholar] [CrossRef]
- Khoroshko, E.; Filippov, A.; Tarasov, S.; Shamarin, N.; Moskvichev, E.; Fortuna, S.; Lychagin, D.; Kolubaev, E. Strength and Ductility Improvement through Thermomechanical Treatment of Wire-Feed Electron Beam Additive Manufactured Low Stacking Fault Energy (SFE) Aluminum Bronze. Metals 2020, 10, 1568. [Google Scholar] [CrossRef]
- Filippov, A.; Shamarin, N.; Moskvichev, E.; Savchenko, N.; Kolubaev, E.; Khoroshko, E.; Tarasov, S. Heat Input Effect on Microstructure and Mechanical Properties of Electron Beam Additive Manufactured (EBAM) Cu-7.5wt.%Al Bronze. Materials 2021, 14, 6948. [Google Scholar] [CrossRef]
- Ma, S.; Fu, L.; Shan, A. Enhancing strength-ductility of the aluminum bronze alloy by generating high-density ultrafine annealing twins. Mater. Charact. 2021, 177, 111057. [Google Scholar] [CrossRef]
- Liu, K.; Chen, X.; Zhang, Y.; Pan, Z.; Singh, R.A.; Jayalakshmi, S.; Konovalov, S. Location dependence of microstructure and mechanical properties of Cu–Al alloy fabricated by dual wire CMT. Mater. Res. Express 2019, 6, 126567. [Google Scholar] [CrossRef]
- Liu, K.; Chen, X.; Shen, Q.; Pan, Z.; Singh, R.A.; Jayalakshmi, S.; Konovalov, S. Microstructural evolution and mechanical properties of deep cryogenic treated Cu–Al–Si alloy fabricated by Cold Metal Transfer (CMT) process. Mater. Charact. 2020, 159, 110011. [Google Scholar] [CrossRef]
- Wang, Y.; Chen, X.; Konovalov, S.; Su, C.; Siddiquee, A.N.; Gangil, N. In-situ wire-feed additive manufacturing of Cu-Al alloy by addition of silicon. Appl. Surf. Sci. 2019, 487, 1366–1375. [Google Scholar] [CrossRef]
- Li, B.; Zheng, H.; Han, C.; Zhou, K. Nanotwins-containing microstructure and superior mechanical strength of a Cu-9Al-5Fe-5Ni alloy additively manufactured by laser metal deposition. Addit. Manuf. 2021, 39, 101825. [Google Scholar] [CrossRef]
- Dharmendra, C.; Amirkhiz, B.S.; Lloyd, A.; Janaki Ram, G.D.; Mohammadi, M. Wire-arc additive manufactured nickel aluminum bronze with enhanced mechanical properties using heat treatments cycles. Addit. Manuf. 2020, 36, 101510. [Google Scholar] [CrossRef]
- Dharmendra, C.; Rice, K.P.; Amirkhiz, B.S.; Mohammadi, M. Atom probe tomography study of κ-phases in additively manufactured nickel aluminum bronze in as-built and heat-treated conditions. Mater. Des. 2021, 202, 109541. [Google Scholar] [CrossRef]
- Sufryd, K.; Ponweiser, N.; Riani, P.; Richter, K.W.; Cacciamani, G. Experimental investigation of the Cu–Si phase diagram at x(Cu)>0.72. Intermetallics 2011, 19, 1479–1488. [Google Scholar] [CrossRef] [Green Version]
- Olesinski, R.W.; Abbaschian, G.J. The Cu−Si (Copper-Silicon) system. Bull. Alloy Phase Diagr. 1986, 7, 170–178. [Google Scholar] [CrossRef]
- Yan, X.; Chang, Y.A. A thermodynamic analysis of the Cu–Si system. J. Alloys Compd. 2000, 308, 221–229. [Google Scholar] [CrossRef]
- Soldi, L.; Laplace, A.; Roskosz, M.; Gosse, S. Phase diagram and thermodynamic model for the Cu-Si and the Cu-Fe-Si systems. J. Alloys Compd. 2019, 803, 61–70. [Google Scholar] [CrossRef]
- Collins, P.C.; Brice, D.A.; Samimi, P.; Ghamarian, I.; Fraser, H.L. Microstructural Control of Additively Manufactured Metallic Materials. Annu. Rev. Mater. Res. 2016, 46, 63–91. [Google Scholar] [CrossRef]


| Regime | Beam Current, mA | Layer Deposition Rate, mm/min | Accelerating Voltage, kV | Heat Input, kJ/mm |
|---|---|---|---|---|
| 1 | 25 | 240 | 30 | 0.19 |
| 2 | 33 | 240 | 30 | 0.25 |
| 3 | 41 | 240 | 30 | 0.31 |
Publisher’s Note: MDPI stays neutral with regard to jurisdictional claims in published maps and institutional affiliations. |
© 2022 by the authors. Licensee MDPI, Basel, Switzerland. This article is an open access article distributed under the terms and conditions of the Creative Commons Attribution (CC BY) license (https://creativecommons.org/licenses/by/4.0/).
Share and Cite
Filippov, A.; Shamarin, N.; Moskvichev, E.; Savchenko, N.; Kolubaev, E.; Khoroshko, E.; Tarasov, S. The Effect of Heat Input, Annealing, and Deformation Treatment on Structure and Mechanical Properties of Electron Beam Additive Manufactured (EBAM) Silicon Bronze. Materials 2022, 15, 3209. https://0-doi-org.brum.beds.ac.uk/10.3390/ma15093209
Filippov A, Shamarin N, Moskvichev E, Savchenko N, Kolubaev E, Khoroshko E, Tarasov S. The Effect of Heat Input, Annealing, and Deformation Treatment on Structure and Mechanical Properties of Electron Beam Additive Manufactured (EBAM) Silicon Bronze. Materials. 2022; 15(9):3209. https://0-doi-org.brum.beds.ac.uk/10.3390/ma15093209
Chicago/Turabian StyleFilippov, Andrey, Nikolay Shamarin, Evgeny Moskvichev, Nikolai Savchenko, Evgeny Kolubaev, Ekaterina Khoroshko, and Sergei Tarasov. 2022. "The Effect of Heat Input, Annealing, and Deformation Treatment on Structure and Mechanical Properties of Electron Beam Additive Manufactured (EBAM) Silicon Bronze" Materials 15, no. 9: 3209. https://0-doi-org.brum.beds.ac.uk/10.3390/ma15093209