
Phase Transformations Caused by Heat Treatment and High-Pressure Torsion in TiZrHfMoCrCo Alloy

 and
and
Abstract
:1. Introduction
2. Materials and Methods
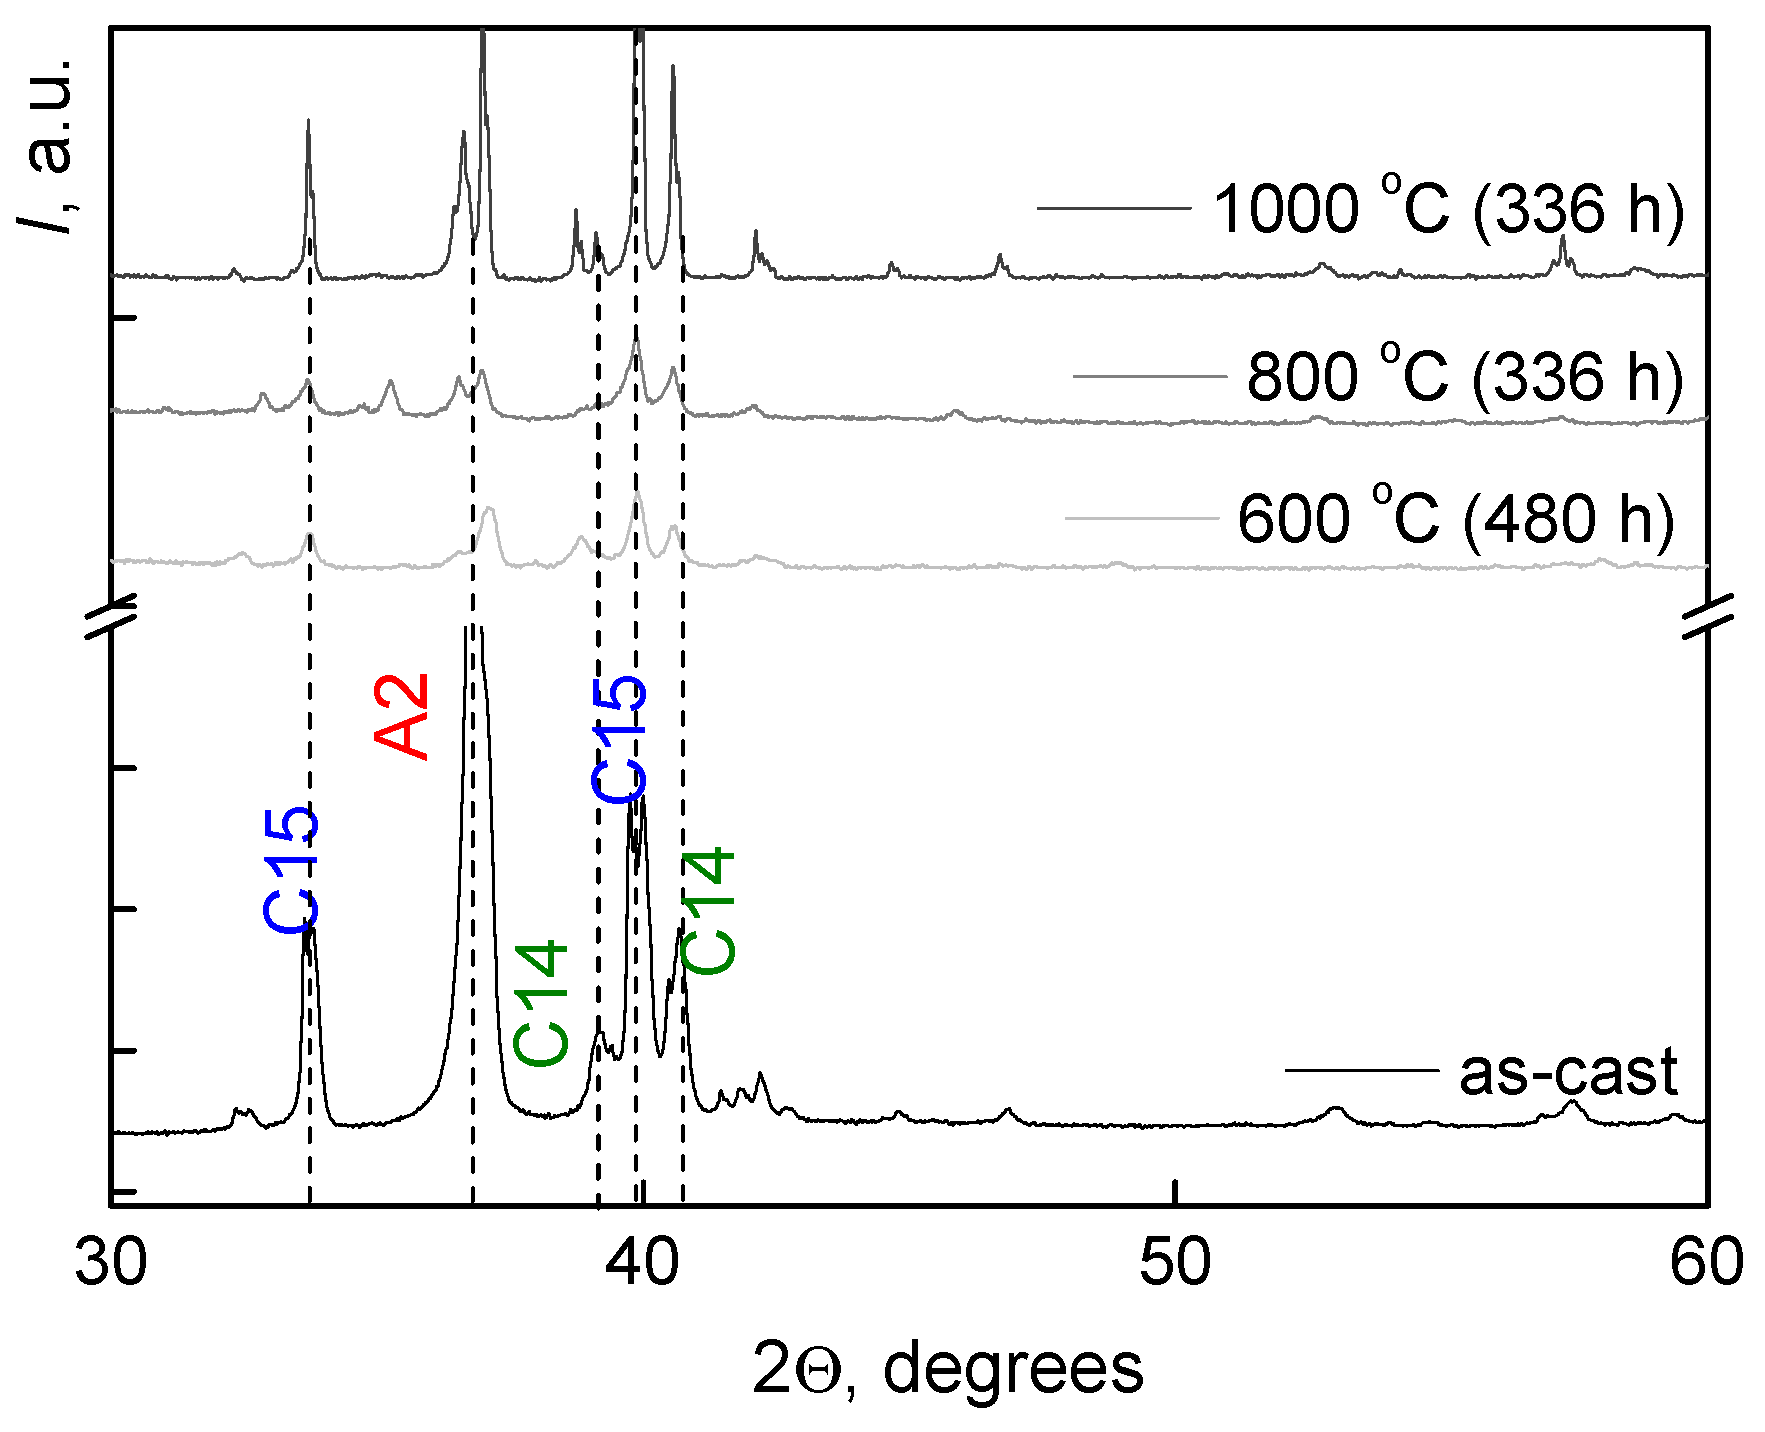
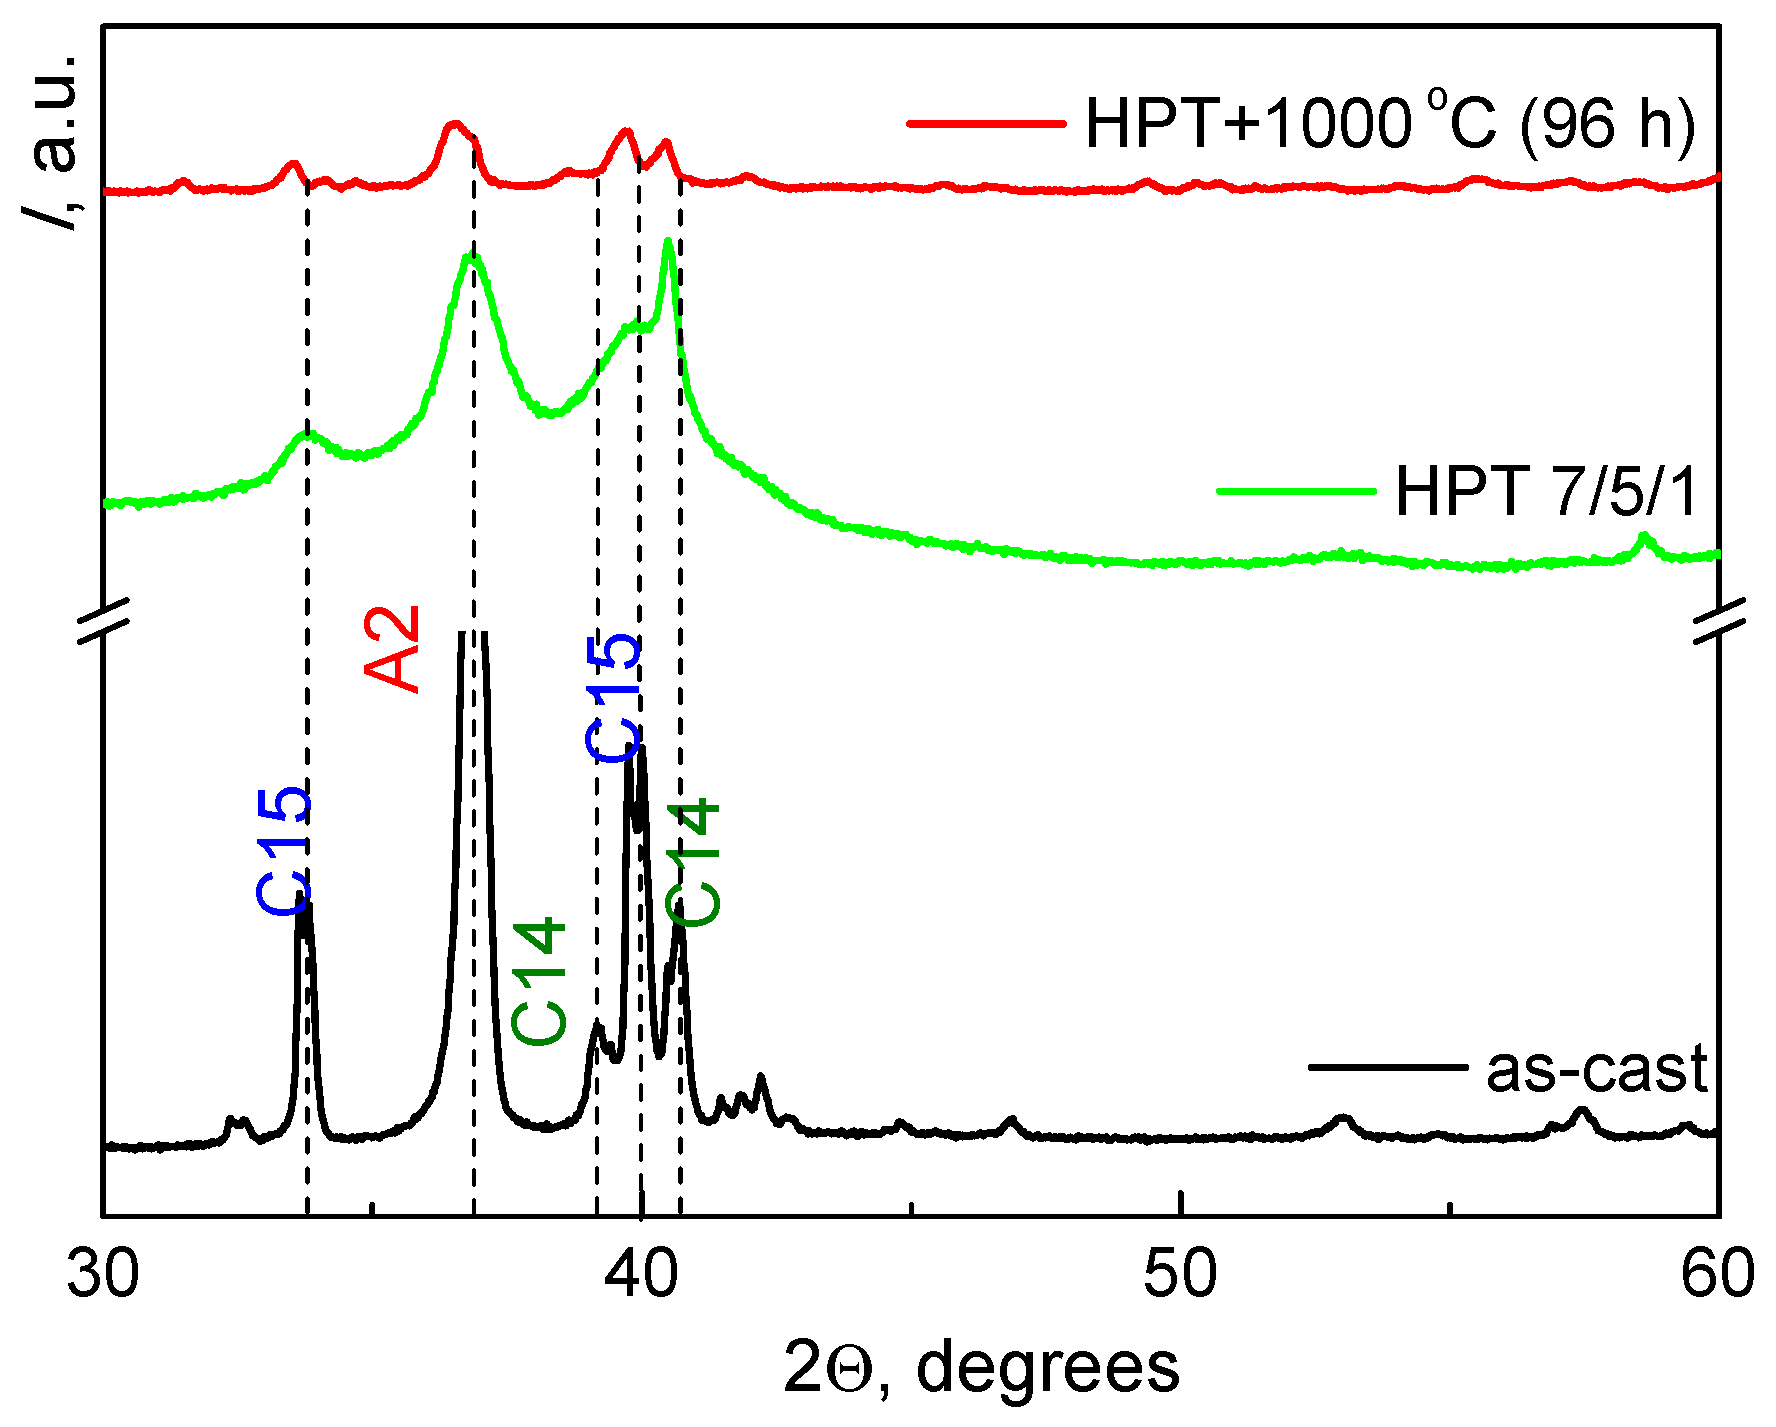
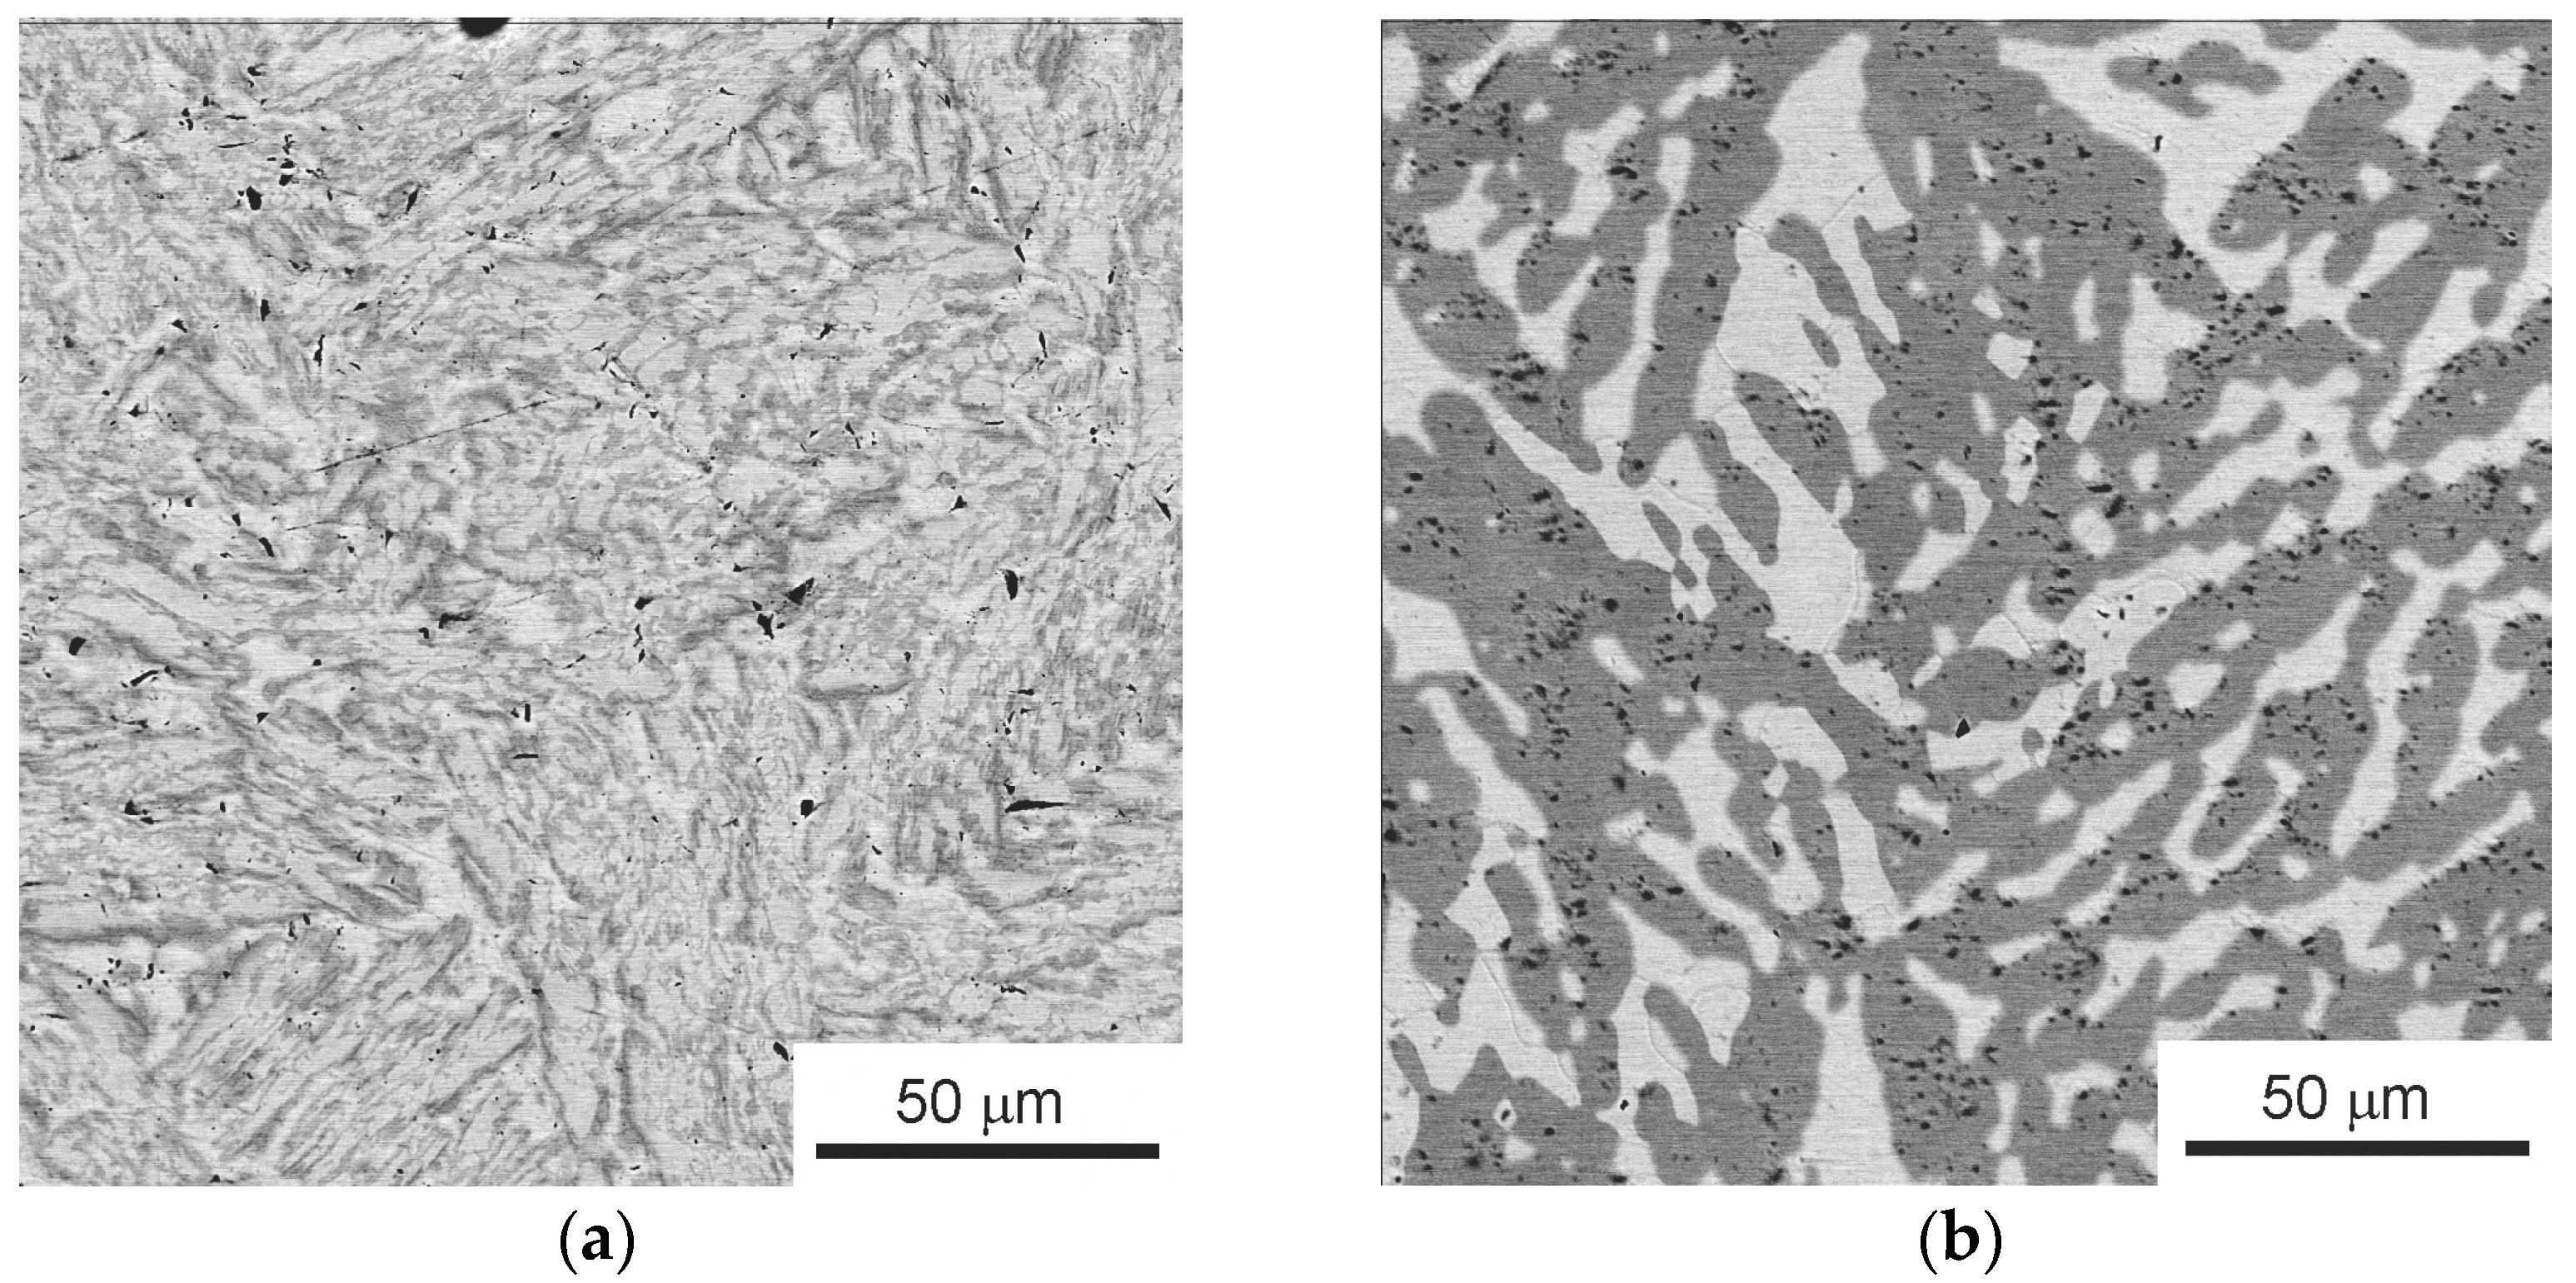
3. Results
4. Discussion
5. Conclusions
Author Contributions
Funding
Institutional Review Board Statement
Informed Consent Statement
Data Availability Statement
Acknowledgments
Conflicts of Interest
References
- Cantor, B.; Chang, I.T.H.; Knight, P.; Vincent, A.J.B. Microstructural development in equiatomic multicomponent alloys. Mater. Sci. Eng. A 2004, 375–377, 213–218. [Google Scholar] [CrossRef]
- Yeh, J.-W.; Chen, S.-K.; Lin, S.-J.; Gan, J.-Y.; Chin, T.-S.; Shun, T.-T.; Tsau, C.-H.; Chang, S.-Y. Nanostructured high-entropy alloys with multiple principal elements: Novel alloy design concepts and outcomes. Adv. Eng. Mater. 2004, 6, 299–303. [Google Scholar] [CrossRef]
- Zhu, J.M.; Fu, H.M.; Zhang, H.F.; Wang, A.M.; Li, H.; Hu, Z.Q. Synthesis and properties of multiprincipal component AlCoCrFeNiSix alloys. Mater. Sci. Eng. A 2010, 527, 7210–7214. [Google Scholar] [CrossRef]
- Hsu, C.Y.; Juan, C.C.; Wang, W.R.; Sheu, T.S.; Yeh, J.W.; Chen, S.K. On the superior hot hardness and softening resistance of AlCoCrxFeMo0.5Ni high-entropy alloys. Mater. Sci. Eng. A 2011, 528, 3581–3588. [Google Scholar] [CrossRef]
- Chuang, M.H.; Tsai, M.H.; Wang, W.R.; Lin, S.J.; Yeh, J.W. Microstructure and wear behavior of AlxCo1.5CrFeNi1.5Tiy high-entropy alloys. Acta Mater. 2011, 59, 6308–6317. [Google Scholar] [CrossRef]
- Granberg, F.; Nordlund, K.; Jin, K.; Lu, C.; Bei, H.; Wang, L.M.; Djurabekova, F.; Weber, W.J.; Zhang, Y. Mechanism of radiation damage reduction in equiatomic multicomponent single phase alloys. PRL 2016, 116, 135504. [Google Scholar] [CrossRef]
- Lach, T.G.; Silva, C.M.; Zhou, Y.; Boldman, W.L.; Rack, P.D.; Weber, W.J.; Zhang, Y. Dynamic substrate reactions during room temperature heavy ion irradiation of CoCrCuFeNi high entropy alloy thin films. Npj Mater. Degrad. 2022, 6, 1–15. [Google Scholar] [CrossRef]
- Kinsler-Fedon, C.; Nuckols, L.; Nelson, C.T.; Qi, Z.; Huang, Q.; Mandrus, D.; Zhang, Y.; Weber, W.J.; Keppens, V. Effects of Au2+ irradiation induced damage in a high-entropy pyrochlore oxide single crystal. Scr. Mater. 2022, 220, 114916. [Google Scholar] [CrossRef]
- Nagase, T.; Iijima, Y.; Matsugaki, A.; Ameyama, K.; Nakano, T. Design and fabrication of Ti–Zr-Hf-Cr-Mo and Ti–Zr-Hf-Co-Cr-Mo highentropy alloys as metallic biomaterials. Mater. Sci. Eng. C 2020, 107, 110322. [Google Scholar] [CrossRef]
- Devine, T.M.; Kummer, F.J.; Wulff, J. Wrought cobalt-chromium surgical implant alloys. J. Mater. Sci. 1972, 7, 126–128. [Google Scholar] [CrossRef]
- Devine, T.M.; Wulff, J. Cast vs. wrought cobalt-chromium surgical implant alloys. J. Biomed. Mater. Res. 1975, 9, 151–167. [Google Scholar] [CrossRef] [PubMed]
- Cohen, J.; Rose, R.M.; Wulff, J. Recommended heat treatment and alloy additions for cast Co-Cr surgical implants. J. Biomed. Mater. Res. 1978, 12, 935–937. [Google Scholar] [CrossRef]
- Kilner, T.; Pilliar, R.M.; Weatherly, G.C.; Alibert, C. Phase identification and incipient melting in a cast Co-Cr surgical implant alloy. J. Biomed. Mater. Res. 1982, 16, 63–79. [Google Scholar] [CrossRef]
- Niinomi, M. Recent metallic materials for biomedical applications. Metall. Mater. Trans. A 2002, 33, 477–486. [Google Scholar] [CrossRef]
- Niinomi, M.; Nakai, M.; Hieda, J. Development of new metallic alloys for biomedical applications. Acta Biomater. 2012, 8, 3888–3903. [Google Scholar] [CrossRef]
- Niinomi, M. Design and development of metallic biomaterials with biological and mechanical biocompatibility. J. Biomed. Mater. Res. A 2019, 107, 944–954. [Google Scholar] [CrossRef] [PubMed]
- Straumal, B.B.; Klinger, L.; Kuzmin, A.; Lopez, G.A.; Korneva, A.; Straumal, A.B.; Vershinin, N.; Gornakova, A.S. High entropy alloys coatings deposited by laser cladding: A review of grain boundary wetting phenomena. Coatings 2022, 12, 343. [Google Scholar] [CrossRef]
- Straumal, B.; Korneva, A.; Kuzmin, A.; Klinger, L.; Lopez, G.A.; Vershinin, N.; Straumal, A.; Gornakova, A. High entropy alloys for energy conversion and storage: A review of grain boundary wetting phenomena. Energies 2022, 15, 7130. [Google Scholar] [CrossRef]
- Straumal, B.; Rabkin, E.; Lopez, G.A.; Korneva, A.; Kuzmin, A.; Gornakova, A.; Straumal, A.; Baretzky, B. Grain boundary wetting phenomena in high entropy alloys containing nitrides, carbides, borides, silicides, and hydrogen: A Review. Crystals 2021, 11, 1540. [Google Scholar] [CrossRef]
- Senkov, O.N.; Semiatin, S.L. Microstructure and properties of a refractory high-entropy alloy after cold working. J. Alloys Compd. 2015, 649, 1110–1123. [Google Scholar] [CrossRef]
- Dobbelstein, H.; George, E.P.; Gurevich, E.L.; Kostka, A.; Ostendorf, A.; Laplanche, G. Laser metal deposition of refractory high-entropy alloys for high-throughput synthesis and structure-property characterization. Int. J. Extrem. Manuf. 2021, 3, 015201. [Google Scholar] [CrossRef]
- Song, H.; Lee, S.; Lee, K. Thermodynamic parameters, microstructure, and electrochemical properties of equiatomic TiMoVWCr and TiMoVNbZr high-entropy alloys prepared by vacuum arc remelting. Int. J. Refr. Met. Hard Mater. 2021, 99, 105595. [Google Scholar] [CrossRef]
- Gurel, S.; Yagci, M.B.; Canadin, D.; Gerstein, G.; Bal, B.; Maier, H.J. Fracture behavior of novel biomedical Ti-based high entropy alloys under impact loading. Mater. Sci. Eng. A 2021, 803, 140456. [Google Scholar] [CrossRef]
- Wang, S.; Wu, M.; Shu, D.; Zhu, G.; Wang, D.; Sun, B. Mechanical instability and tensile properties of TiZrHfNbTa high entropy alloy at cryogenic temperatures. Acta Mater. 2020, 201, 517–527. [Google Scholar] [CrossRef]
- He, C.-Y.; Gao, X.-H.; Dong, M.; Qiu, X.-L.; An, J.H.; Guo, H.-X.; Liu, G. Further investigation of a novel high entropy alloy MoNbHfZrTi based solar absorber coating with double antireflective layers. Sol. Energy Mater. Sol. Cells 2020, 217, 110709. [Google Scholar] [CrossRef]
- Wang, S.; Wu, D.; She, H.; Wu, M.; Shu, D.; Dong, A.; Lai, H.; Sun, B. Design of high-ductile medium entropy alloys for dental implants. Mater. Sci. Eng. C 2020, 113, 110959. [Google Scholar] [CrossRef]
- Eleti, R.R.; Chokshi, A.H.; Shibata, A.; Tsuji, N. Unique high-temperature deformation dominated by grain boundary sliding in heterogeneous necklace structure formed by dynamic recrystallization in HfNbTaTiZr BCC refractory high entropy alloy. Acta Mater. 2020, 183, 64–77. [Google Scholar] [CrossRef]
- Eleti, R.R.; Klimova, M.; Tikhonovsky, M.; Stepanov, N.; Zherebtsov, S. Exceptionally high strain-hardening and ductility due to transformation induced plasticity effect in Ti-rich high-entropy alloys. Sci. Rep. 2020, 10, 13293. [Google Scholar] [CrossRef]
- Gong, P.; Li, F.; Deng, L.; Wang, X.; Jin, J. Research on nano-scratching behavior of TiZrHfBeCu(Ni) high entropy bulk metallic glasses. J. Alloys Compd. 2020, 817, 153240. [Google Scholar] [CrossRef]
- Maresca, F.; Curtin, W.A. Mechanistic origin of high strength in refractory BCC high entropy alloys up to 1900K. Acta Mater. 2020, 182, 235–249. [Google Scholar] [CrossRef]
- Chang, S.-H.; Lin, P.-T.; Tsai, C.-W. High-temperature martensitic transformation of CuNiHfTiZr high- entropy alloys. Sci. Rep. 2019, 9, 19598. [Google Scholar] [CrossRef] [PubMed]
- Rabadia, C.D.; Liu, Y.J.; Chen, L.Y.; Jawed, S.F.; Wang, L.Q.; Sun, H.; Zhang, L.C. Deformation and strength characteristics of Laves phases in titanium alloys. Mater. Des. 2019, 179, 107891. [Google Scholar] [CrossRef]
- Straumal, B.B.; Protasova, S.G.; Mazilkin, A.A.; Rabkin, E.; Goll, D.; Schütz, G.; Baretzky, B.; Valiev, R. Deformation-driven formation of equilibrium phases in the Cu–Ni alloys. J. Mater. Sci. 2012, 47, 360–367. [Google Scholar] [CrossRef]
- Straumal, B.B.; Kilmametov, A.R.; Korneva, A.; Mazilkin, A.A.; Straumal, P.B.; Zięba, P.; Baretzky, B. Phase transitions in Cu-based alloys under high pressure torsion. J. Alloys Compd. 2017, 707, 20–26. [Google Scholar] [CrossRef]
- Straumal, B.B.; Kilmametov, A.R.; López, G.A.; López-Ferreño, I.; Nó, M.L.; San Juan, J.; Hahn, H.; Baretzky, B. High-pressure torsion driven phase transformations in Cu–Al–Ni shape memory alloys. Acta Mater. 2017, 125, 274–285. [Google Scholar] [CrossRef]
- Lukác, F.; Vilémová, M.; Klementová, M.; Minárik, P.; Chráska, T. The origin and the effect of the fcc phase in sintered HfNbTaTiZr. Mater. Lett. 2021, 286, 129224. [Google Scholar] [CrossRef]
- Mazilkin, A.; Straumal, B.; Kilmametov, A.; Straumal, P.; Baretzky, B. Phase transformations induced by severe plastic deformation. Mater. Trans. 2019, 60, 1489–1499. [Google Scholar] [CrossRef]
- Straumal, B.B.; Kilmametov, A.R.; Baretzky, B.; Kogtenkova, O.A.; Straumal, P.B.; Lityńska-Dobrzyńska, L.; Chulist, R.; Korneva, A.; Zięba, P. High pressure torsion of Cu–Ag and Cu–Sn alloys: Limits for solubility and dissolution. Acta Mater. 2020, 195, 184–198. [Google Scholar] [CrossRef]
- Straumal, B.B.; Gornakova, A.S.; Mazilkin, A.A.; Fabrichnaya, O.B.; Kriegel, M.J.; Baretzky, B.; Jiang, J.-Z.; Dobatkin, S.V. Phase transformations in the severely plastically deformed Zr–Nb alloys. Mater. Lett. 2012, 81, 225–228. [Google Scholar] [CrossRef]
- Mazilkin, A.A.; Straumal, B.B.; Kilmametov, A.R.; Boll, T.; Baretzky, B.; Kogtenkova, O.A.; Korneva, A.; Zięba, P. Competition for impurity atoms between defects and solid solution during high pressure torsion. Scr. Mater. 2019, 173, 46–50. [Google Scholar] [CrossRef]
- Straumal, B.B.; Kilmametov, A.R.; Mazilkin, A.A.; Gornakova, A.S.; Fabrichnaya, O.B.; Kriegel, M.J.; Rafaja, D.; Bulatov, M.F.; Nekrasov, A.N.; Baretzky, B. The formation of the ω phase in the titanium-iron system under shear deformation. JETP Lett. 2020, 111, 568–574. [Google Scholar] [CrossRef]
- Gornakova, A.S.; Afonikova, N.S.; Postnova, E.Y.; Nekrasov, A.N.; Straumal, B.B. Formation and growth of grain noundary (αTi) layers and their hardness in Ti–Cr Alloys. J. Surf. Investig. X-ray Synchrotron Neutron Tech. 2022, 16, 969–976. [Google Scholar] [CrossRef]
- Lukác, F.; Dudr, M.; Cížek, J.; Harcuba, P.; Vlasák, T.; Janecek, M.; Kuriplach, J.; Moon, J.; Kim, H.S.; Zýka, J.; et al. Defects in high entropy alloy HfNbTaTiZr prepared by high pressure torsion. Acta Phys. Pol. A 2018, 134, 891–894. [Google Scholar] [CrossRef]
- Gubicza, J.; Heczel, A.; Kawasaki, M.; Han, J.-K.; Zhao, Y.; Xue, Y.; Huang, S.; Labar, J.L. Evolution of microstructure and hardness in Hf25Nb25Ti25Zr25 high-entropy alloy during high-pressure torsion. J. Alloys Compd. 2019, 788, 318–328. [Google Scholar] [CrossRef]
- Schuh, B.; Volker, B.; Todt, J.; Schell, N.; Perriere, L.; Li, J.; Couzinie, J.P.; Hohenwarter, A. Thermodynamic instability of a nanocrystalline, single-phase TiZrNbHfTa alloy and its impact on the mechanical properties. Acta Mater. 2018, 142, 201–212. [Google Scholar] [CrossRef]
- Shahmir, H.; He, J.; Lu, Z.; Kawasaki, M.; Langdon, T.G. Effect of annealing on mechanical properties of a nanocrystalline CoCrFeNiMn high-entropy alloy processed by high-pressure torsion. Mater. Sci. Eng. A 2016, 676, 294–303. [Google Scholar] [CrossRef]
- Hung, P.T.; Kawasaki, M.; Han, J.-K.; Lábár, J.L.; Gubicza, J. Thermal stability of a nanocrystalline HfNbTiZr multi-principal element alloy processed by high-pressure torsion. Mater. Charact. 2020, 168, 110550. [Google Scholar] [CrossRef]
- Edalati, P.; Mohammadi, A.; Tang, Y.; Floriano, R.; Fuji, M.; Edalati, K. Phase transformation and microstructure evolution in ultrahard carbon-doped AlTiFeCoNi high-entropy alloy by high-pressure torsion. Mater. Lett. 2021, 302, 130368. [Google Scholar] [CrossRef]
- Shahmir, H.; Mousavi, T.; Hec, J.; Lu, Z.; Kawasaki, M.; Langdon, T.G. Microstructure and properties of a CoCrFeNiMn high-entropy alloy processed by equal-channel angular pressing. Mater. Sci. Eng. A 2017, 705, 411–419. [Google Scholar] [CrossRef]
- Gonzalez-Masís, J.; Cubero-Sesin, J.M.; Campos-Quiros, A.; Edalati, K. Synthesis of biocompatible high-entropy alloy TiNbZrTaHf by high-pressure torsion. Mater. Sci. Eng. A 2021, 825, 141869. [Google Scholar] [CrossRef]


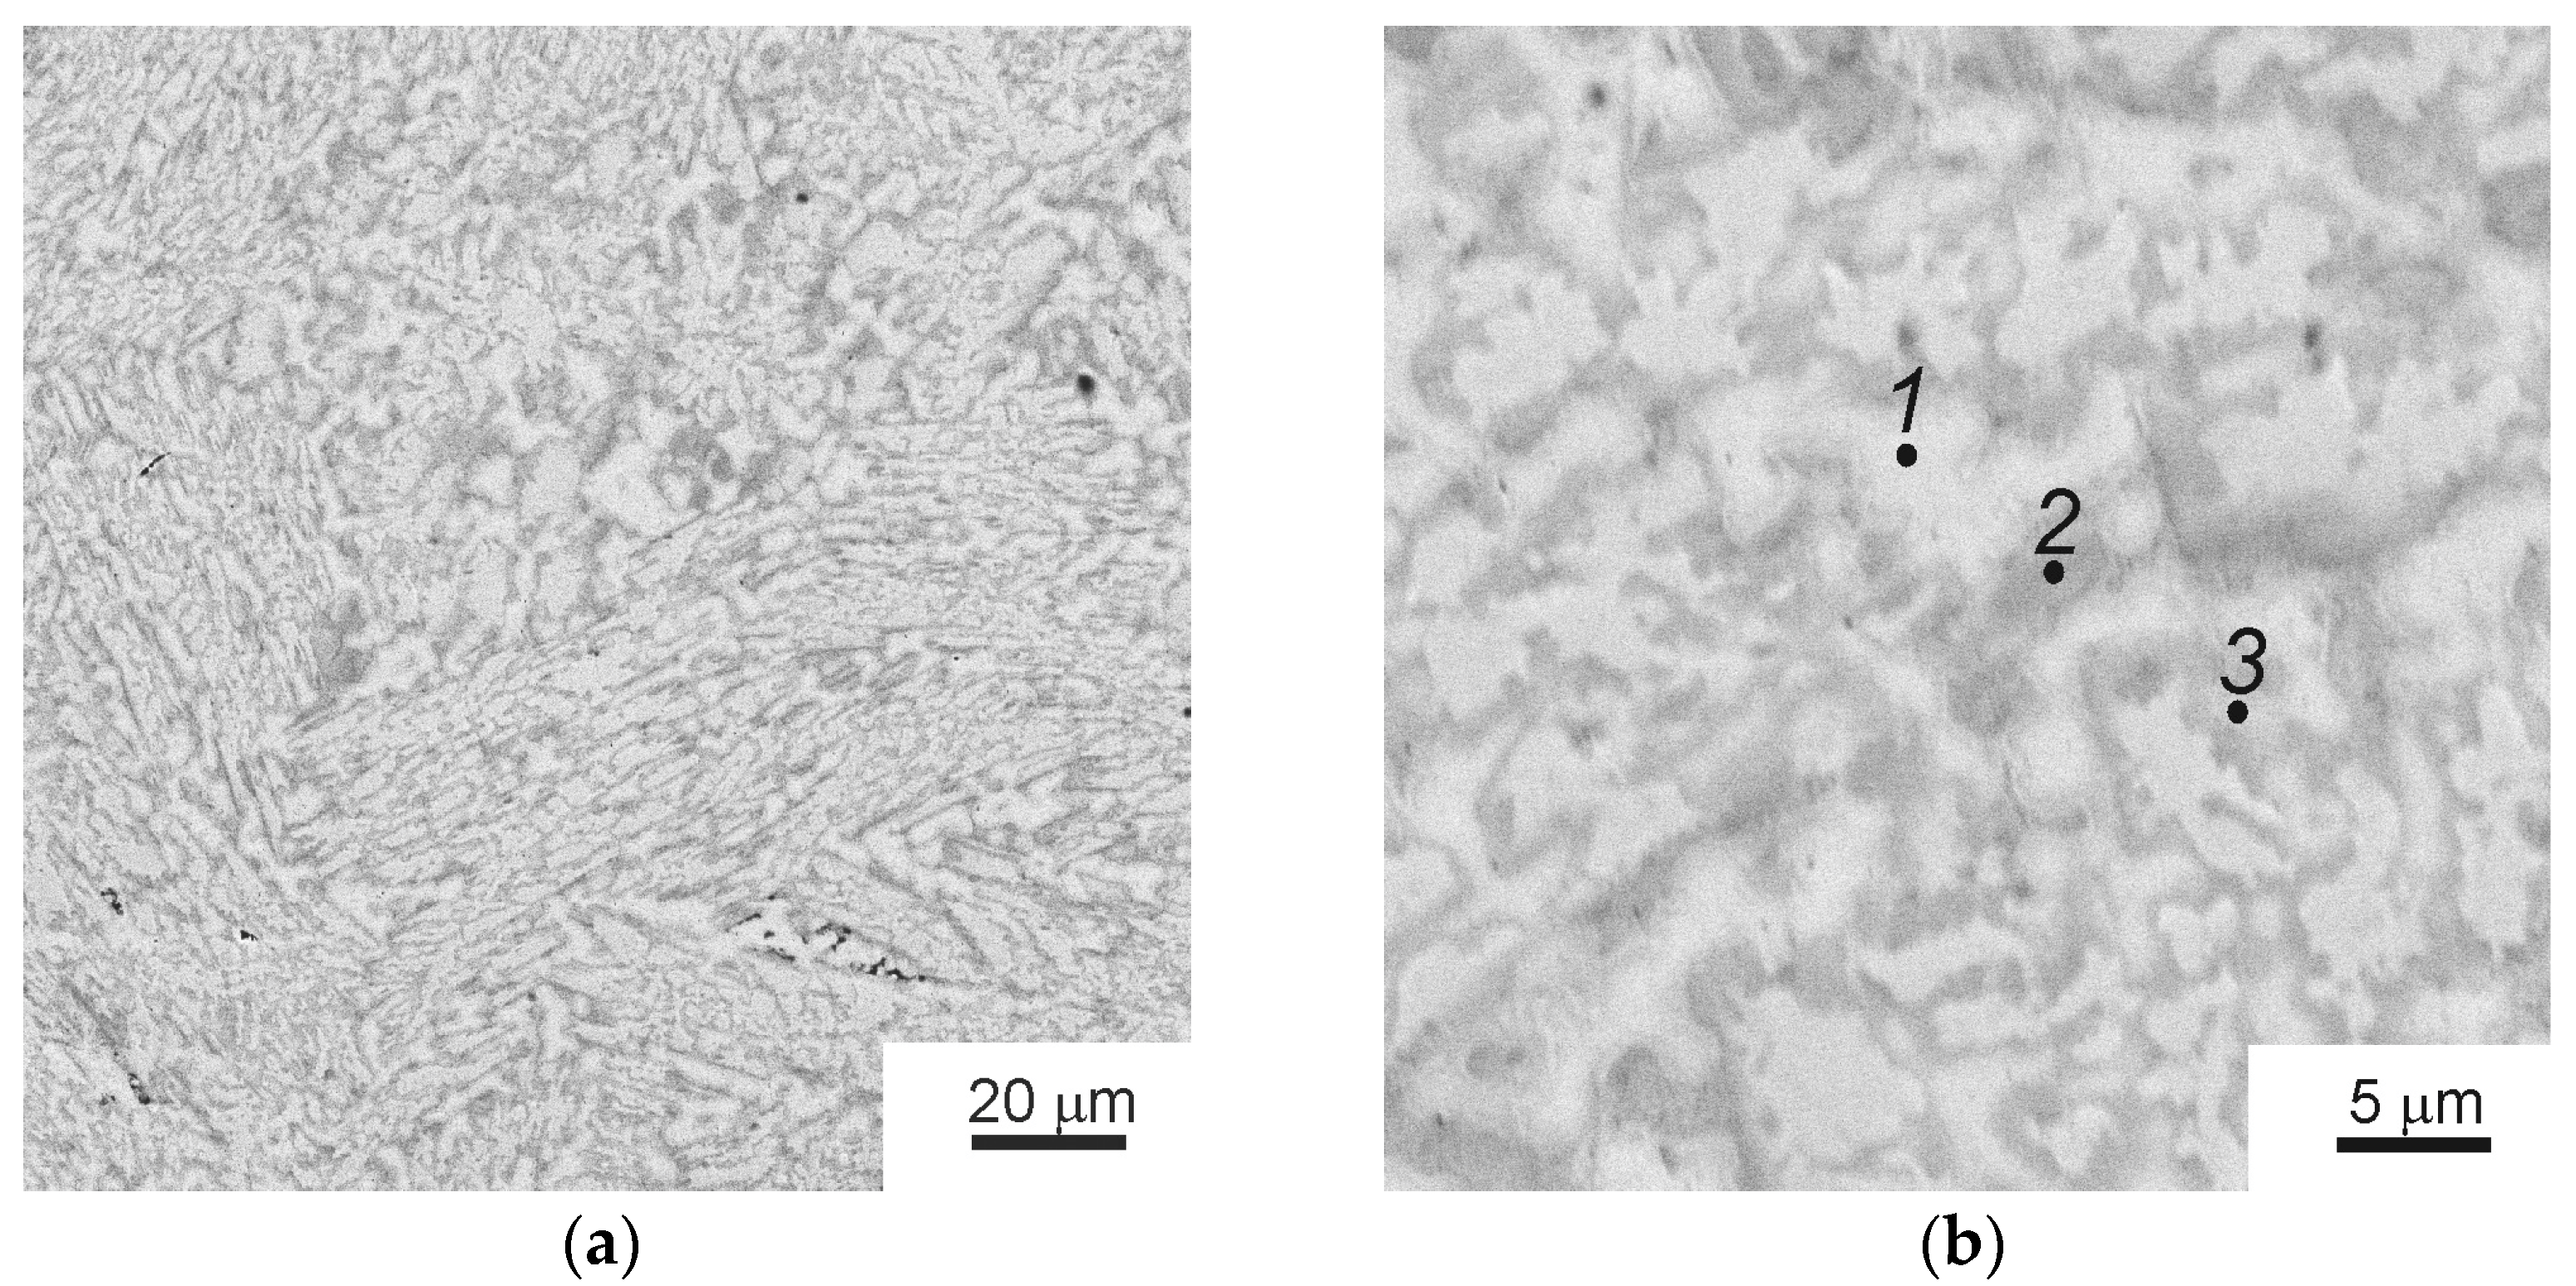
| Point | Phase | Ti | Cr | Co | Zr | Mo | Hf |
|---|---|---|---|---|---|---|---|
| 1 | (Ti,Zr,Hf)cub (A2) | 13.80 ± 0.17 | 0.54 ± 0.07 | 2.18 ± 0.90 | 30.00 ± 1.00 | 6.49 ± 0.88 | 46.98 ± 0.92 |
| 2 | (Mo,Cr)2Zr (C15) | 12.18 ± 0.47 | 5.28 ± 0.17 | 6.03 ± 1.28 | 16.21 ± 1.68 | 19.51 ± 1.10 | 40.85 ± 0.94 |
| 3 | Cr2Zr (C14) | 6.59 ± 0.12 | 5.21 ± 0.84 | 1.25 ± 0.11 | 11.56 ± 0.27 | 35.71 ± 0.27 | 39.59 ± 0.32 |
| Average Composition | 10.84 ± 3.26 | 3.82 ± 2.44 | 3.50 ± 3.21 | 18.73 ± 8.23 | 20.77 ± 12.99 | 42.34 ± 3.55 | |
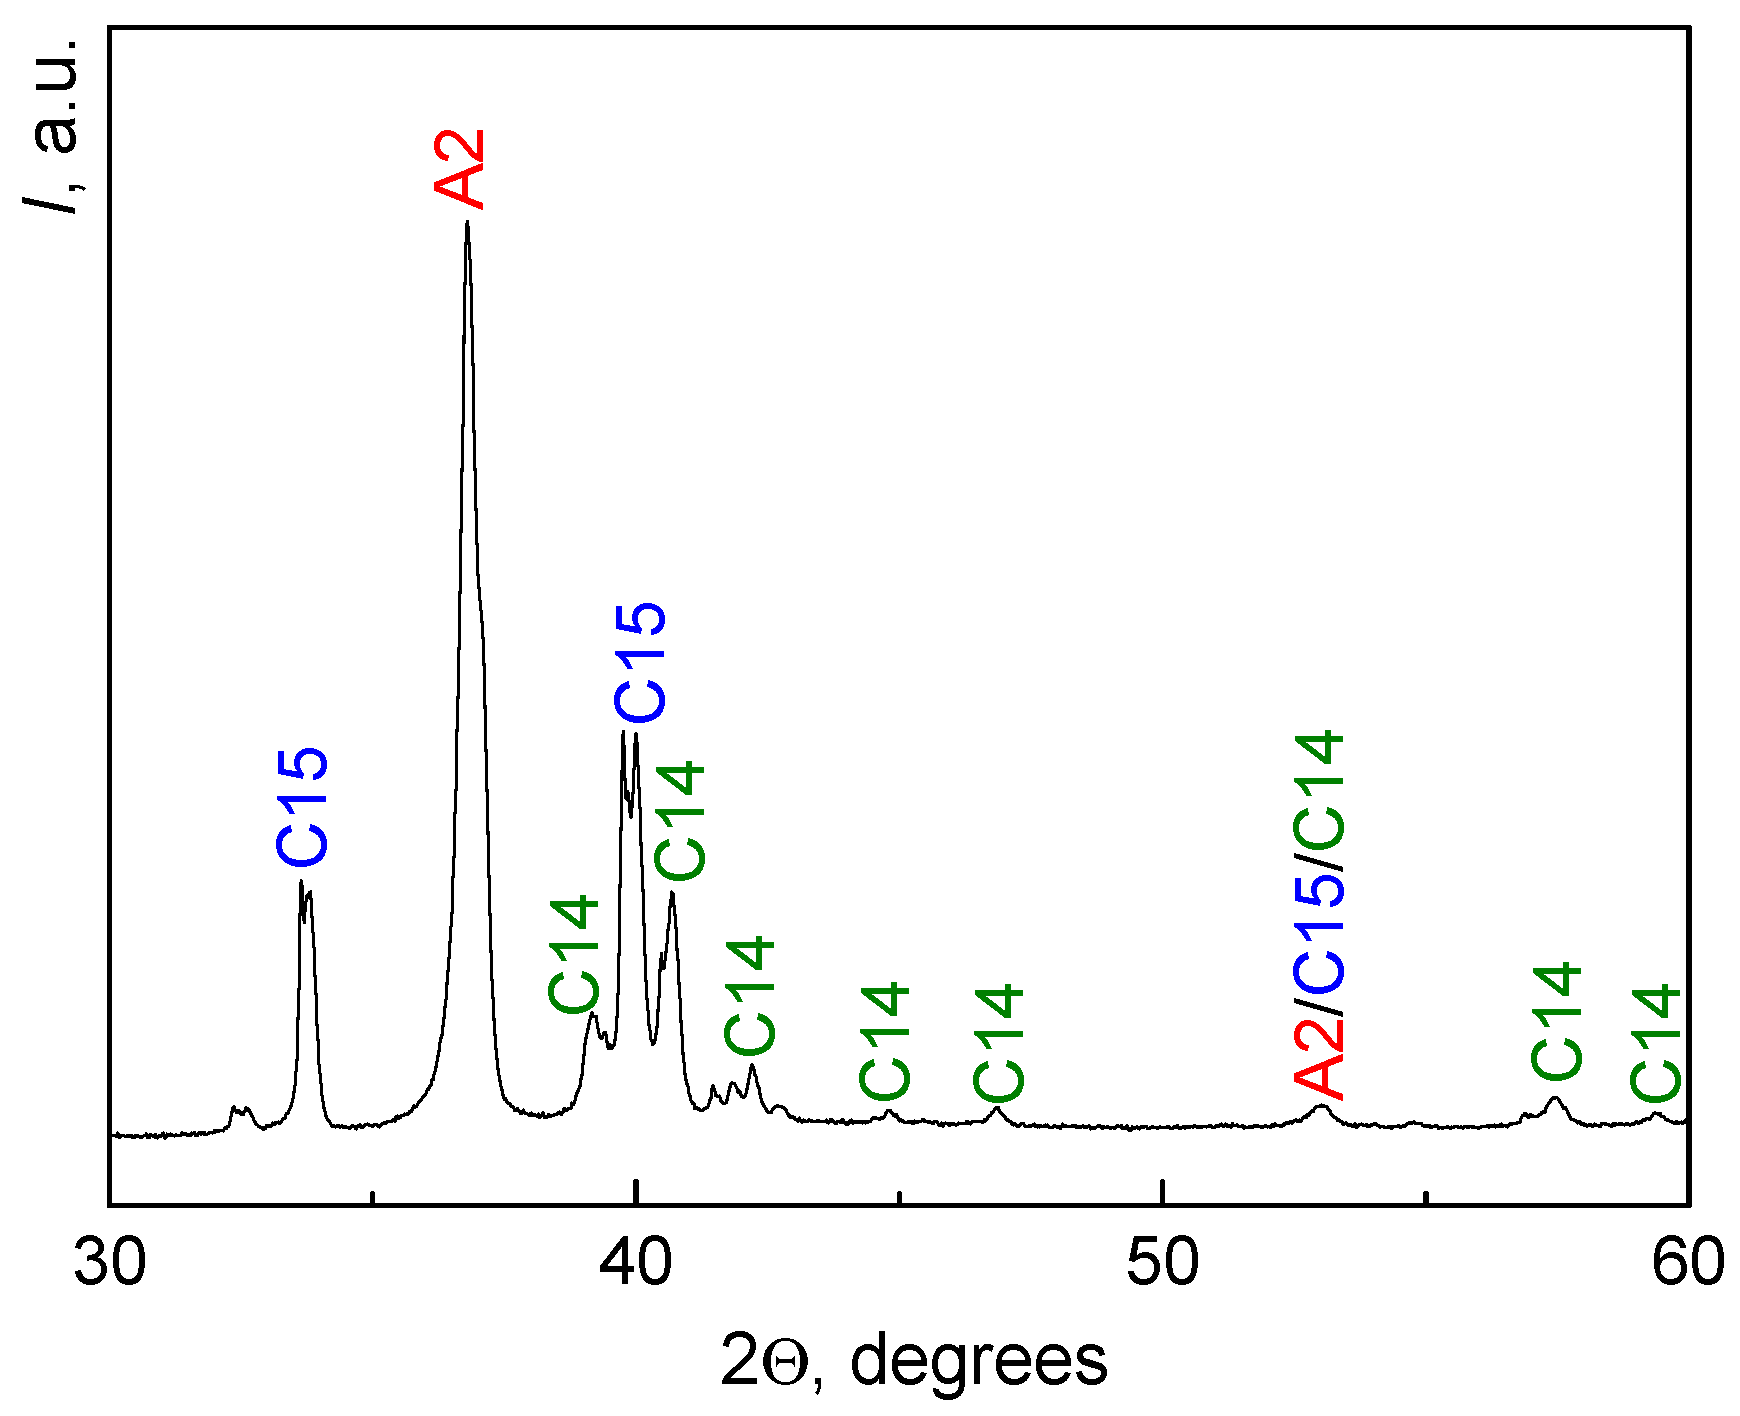
| Phase | Initial Alloy | 1000 °C 24 h | 1000 °C 336 h | |||
|---|---|---|---|---|---|---|
| a, c, nm | V, % | a, c, nm | V, % | a, c, nm | V, % | |
| (A2) | a = 0.3448 | 51 | a = 0.3460 | 10 | a = 0.3460 | 4 |
| (C15) | a = 0.7501 | 26 | a = 0.7476 | 80 | a = 0.7473 | 86 |
| (C14) | a = 0.5307 c = 0.8560 | 23 | a = 0.5307 c = 0.8560 | 10 | a = 0.5305 c = 0.8560 | 10 |
| Phase | 1000 °C, 336 h | 800 °C, 336 h | 600 °C, 480 h | |||
|---|---|---|---|---|---|---|
| a, c, nm | V, % | a, c, nm | V, % | a, c, nm | V, % | |
| (A2) | a = 0.3460 | 4 | a = 0.3477 | 3 | a = 0.3474 | 3 |
| (C15) | a = 0.7473 | 86 | a = 0.7491 | 70 | a = 0.7498 | 60 |
| (C14) | a = 0.5305 c = 0.8560 | 10 | a = 0.5307 c = 0.8560 | 10 | a = 0.5310 c = 0.8556 | 27 |
| (C14-2) | - | - | a = 0.5452 c = 0.8722 | 7 | - | - |
| (C36) | - | - | - | - | a = 0.5047 c = 1.6368 | 9 |
| Additional Phases | - | - | - | 10 | - | 1 |
| Phase | Initial Alloy | HPT | HPT + Annealing | |||
|---|---|---|---|---|---|---|
| a, c, nm | V, % | a, c, nm | V, % | a, c, nm | V, % | |
| (A2) | a = 0.3448 | 51 | a = 0.3445 | 40 | a = 0.3470 | 15 |
| (A2-2) | - | - | a = 0.3150 | 35 | - | - |
| (C15) | a = 0.7501 | 26 | a = 0.7510 | 25 | a = 0.7520 | 50 |
| (C14) | a = 0.5307 c = 0.8560 | 23 | - | - | a = 0.5348 c = 0.8580 | 30 |
| Additional Phases | - | - | - | - | - | 5 |
Disclaimer/Publisher’s Note: The statements, opinions and data contained in all publications are solely those of the individual author(s) and contributor(s) and not of MDPI and/or the editor(s). MDPI and/or the editor(s) disclaim responsibility for any injury to people or property resulting from any ideas, methods, instructions or products referred to in the content. |
© 2023 by the authors. Licensee MDPI, Basel, Switzerland. This article is an open access article distributed under the terms and conditions of the Creative Commons Attribution (CC BY) license (https://creativecommons.org/licenses/by/4.0/).
Share and Cite
Gornakova, A.S.; Straumal, B.B.; Tyurin, A.I.; Afonikova, N.S.; Druzhinin, A.V.; Davdian, G.S.; Kilmametov, A.R. Phase Transformations Caused by Heat Treatment and High-Pressure Torsion in TiZrHfMoCrCo Alloy. Materials 2023, 16, 1354. https://0-doi-org.brum.beds.ac.uk/10.3390/ma16041354
Gornakova AS, Straumal BB, Tyurin AI, Afonikova NS, Druzhinin AV, Davdian GS, Kilmametov AR. Phase Transformations Caused by Heat Treatment and High-Pressure Torsion in TiZrHfMoCrCo Alloy. Materials. 2023; 16(4):1354. https://0-doi-org.brum.beds.ac.uk/10.3390/ma16041354
Chicago/Turabian StyleGornakova, Alena S., Boris B. Straumal, Alexander I. Tyurin, Natalia S. Afonikova, Alexander V. Druzhinin, Gregory S. Davdian, and Askar R. Kilmametov. 2023. "Phase Transformations Caused by Heat Treatment and High-Pressure Torsion in TiZrHfMoCrCo Alloy" Materials 16, no. 4: 1354. https://0-doi-org.brum.beds.ac.uk/10.3390/ma16041354