Distributed Centrality Analysis of Social Network Data Using MapReduce
by
 , and
, and
Ranjan Kumar Behera
1, 
Santanu Kumar Rath
1,
Sanjay Misra
2,3,
Robertas Damaševičius
4,5,* and
Rytis Maskeliūnas
5 1
Department of Computer Science and Engineering, National Institute of Technology, Rourkela 769008, India
2
Department of Computer Engineering, Atilim University, Incek, Ankara 06836, Turkey
3
Department of Electrical and Information Engineering, Covenant University, Ota 1023, Nigeria
4
Faculty of Applied Mathematics, Silesian University of Technology, 44-100 Gliwice, Poland
5
Department of Multimedia Engineering, Kaunas University of Technology, 51368 Kaunas, Lithuania
*
Author to whom correspondence should be addressed.
Algorithms 2019, 12(8), 161; https://0-doi-org.brum.beds.ac.uk/10.3390/a12080161
Submission received: 1 July 2019
/
Revised: 4 August 2019
/
Accepted: 7 August 2019
/
Published: 9 August 2019
(This article belongs to the Special Issue Algorithms for Pattern Recognition)
Abstract
:Analyzing the structure of a social network helps in gaining insights into interactions and relationships among users while revealing the patterns of their online behavior. Network centrality is a metric of importance of a network node in a network, which allows revealing the structural patterns and morphology of networks. We propose a distributed computing approach for the calculation of network centrality value for each user using the MapReduce approach in the Hadoop platform, which allows faster and more efficient computation as compared to the conventional implementation. A distributed approach is scalable and helps in efficient computations of large-scale datasets, such as social network data. The proposed approach improves the calculation performance of degree centrality by 39.8%, closeness centrality by 40.7% and eigenvalue centrality by 41.1% using a Twitter dataset.
1. Introduction
Ongoing advances in information technology (IT), and particularly the exponential growth of social networks, are main drivers for the growing global connections of businesses and individuals [1]. Identifying key network nodes (or influencing nodes) is an important problem in network information theory [2] that helps in the analysis of complex multi-agent systems such as social networks. The main feature of social networks is that their structure develops via mutual connections between network members. The way the users are interconnected and integrated into the network defines their communication and interaction behavior.
Social network analysis (SNA) helps in the mapping relationships between network entities and identifying the patterns of behavior in a network [3], in understanding the dynamic evolution or relationships within the user community over time, which may provide a solution for non-standard analytical problems. Regularities, or patterns in relationships between social entities, can be used to characterize the social environment and even predict its further evolution [4], especially for rapidly evolving social commerce networks (e.g., Alibaba, Sina Weibo) and traditional ones [5] (e.g., Facebook, Twitter).
Centrality measures can be used to discover an influential member, such as recognizing a critical node in a network [6] or an influencer in a social network [7]. For example, a person actively involved in social networks can exert significant influence on consumer behavior of other users; therefore, understanding the structure of relations in a social network can be leveraged to predict the categories of products the consumers will buy [8]. Centrality measures can also be used to find the most reputable users in a network, which is important for many web-based platforms such as e-shopping sites, product review websites, and Q & A systems [9]. Different techniques have been applied for complete network analysis, for example, centrality analysis, equivalence analysis, motif analysis, subgroup analysis, clustering analysis [10], clique analysis [11], friend entropy and communication frequency entropy [12], community-level influence analysis [13,14], social centrality [15], and centrality-based network decomposition [16], and Word2Vector [17].
We focused on a centrality analysis of streaming data of social network users, in which the structure of the network changes continuously over time. Centrality identifies the most important vertices, or nodes, in a network, which have a big influence on the dissemination of information over the web [18], identifying key concepts in complex networks [19], analyzing and predicting factors influencing consumer purchase behavior such as trust and word-of-mouth, evaluating the stability of a social network with regard to malicious users [20], identifying potential for communication activity [21], influencing users on social media [22], or providing recommendations [23]. Identifying the main influencers in a social network using centrality measures can help in trying to increase the speed of information spreading over the network, which could be used, for example, to decrease it in case of a cyber attack by a hostile entity using misinformation or fake news [24].
The MapReduce-based approach has been employed previously for SNA of a cricket community in order to implement a ranking system based on social network metrics [25], to discover communities in social networking data by calculating k-path edge centrality [26], and to assess the closeness and betweenness centrality for comparing and merging large datasets [27].
Adoni et al. [28] deconstructed the A* algorithm into Map and Reduce tasks for performing path computation on Hadoop MapReduce, and demonstrated the application of parallel computation for real road networks. Al Aghbari et al. [29] proposed an algorithm for clustering social network users into communities based on their relationships with each other and the semantic meaning of interests, as well as described its parallel implementation using MapReduce, achieving faster computation. Bakratsas et al. [30] compared the performance of solid state drives (SSDs) with hard disk drives (HDDs) when they are employed as storage for Hadoop’s MapReduce. Li and Wang [31] proposed a distributed hybrid Bayesian network (BN) structure learning algorithm implemented in the MapReduce, which allowed us to improve the computational efficiency.
In this paper, we investigate the Twitter streaming data in which the users mention other users in their tweets. Our main contributions are summarized next. We propose parallel algorithms for the distributed calculation for degree, closeness and eigenvalue centralities using MapReduce. This was performed in linear time, and involved applying optimization techniques to decrease the number of required computations. The results of experiments using our own collected Twitter dataset demonstrated that it was up to 40% faster than other implementations.
2. Methods
2.1. Definitions
Centrality measures are based on the number of immediate connection nodes, or on the shortest communication paths in the network [32]. Centrality scores for real-world networks are different from true-centrality levels, because there is no well-defined measure of centrality that would be independent of the networks themselves [33].
Degree centrality (DC) helps in finding the nodes with the highest number of links to other nodes within a network. Hence, it measures the popularity and/or influence factor of the entity in the network. It is often used in identifying the entities that are central with respect to spreading news and influencing other entities in the network. Nodes with a high degree centrality will be those entities in a network that have the best connections to entities around them. They may be considered influential, or just as strategically important nodes for communication [34].
Closeness centrality (CC) aids in finding the nodes that are closest to the other nodes in a network. The latter is calculated by evaluating their ability to reach other network nodes. This centrality measures the speed at which a piece of information can reach other entities within the network from a given entity. Nodes with a high closeness value have a shorter distance to all the other nodes, and are therefore considered to be efficient broadcasters of information [35].
Eigenvector centrality (EC) is a method of computing the approximate importance of each node in a network [36]. The intuition behind the eigenvector centrality is that a node is thought to be more important if it is directly connected to more important nodes. This metric identifies the most influential node, which is connected to other important nodes.
2.2. Distributed Computation for Centrality Analysis
Let us have the network of the form where, refers to the number of nodes, and refers to the number of edges between the nodes.
Here denotes the nodes that are at a distance of from node . In a connected graph, the hop from one node to another can be given by the equation:
The above equation implies that nodes at a one-hop distance from node send their -hop nodes to the former and then node corroborates as to whether the nodes passed earlier are in its -hop neighbors or not. In this way, a node’s distance is calculated based on incrementing hops through the network.
2.3. Distributed Approach for Degree and Closeness Centrality
The degree is the number of nodes that area the distance of one to node , that is, nodes at one-hop distance. The driving idea behind degree centrality is that the higher number of nodes that a particular node is linked to, the higher its importance within the network is [32]. Given an edge-list, in which each line means an edge in the network, the degree of each node can be computed by calculating the number of occurrences of that node within the file (see pseudo-code 1).
Given an edge-list, with each line representing an edge in the network, the degree of each node can be computed by counting the number of occurrences of that node within the file.
The algorithm for degree centrality is illustrated in pseudo-code in Algorithm 1. Finding the shortest path that connects two nodes is the first step in calculating closeness centrality. This calculation is done in a distributed manner by using the MapReduce paradigm. Cumulative distance is calculated from node to all other nodes, and the reciprocal is taken. The reciprocal indicates the closeness of all other nodes to node . The steps illustrate the distributed computation method of degree and closeness centrality.
| Algorithm 1 Distributed Calculation for Degree and Closeness Centrality |
| Input: Twitter datasets in edge list format. Output: Centrality score of each user 1: For every , 1.1. Calculate the denoting set of nodes at one-hop distance. 2: For each node (calculated in step 1) 2.1. Identify set of neighboring nodes at hop distance using Equation (2). 3: Calculate the number of elements in traveling from node i to node j by using Equation (3): |
2.4. Distributed Approach for Eigenvector Centrality
To compute the eigenvector centrality of node one has to evaluate the importance of all the other nodes that node is connected to. Based on this relative importance, the eigenvector centrality of a node is calculated as follows (see Algorithm 2).
| Algorithm 2 Distributed approach for eigenvector centrality |
| Input: Twitter dataset in edge-list format. Output: Eigenvector Centrality for each user in the network. 1: Initialize a vector list for each node . 2: Initialize a weight list for each node . 3: For each node and for each of its neighbors , 3.1. Calculate relative importance by . 4: Update the vector list by setting . 5: Calculate sum of all numbers in vector list. 6: Divide each entry in vector list by the sum for eigenvector centrality. |
2.5. Distributed Computing Using MapReduce
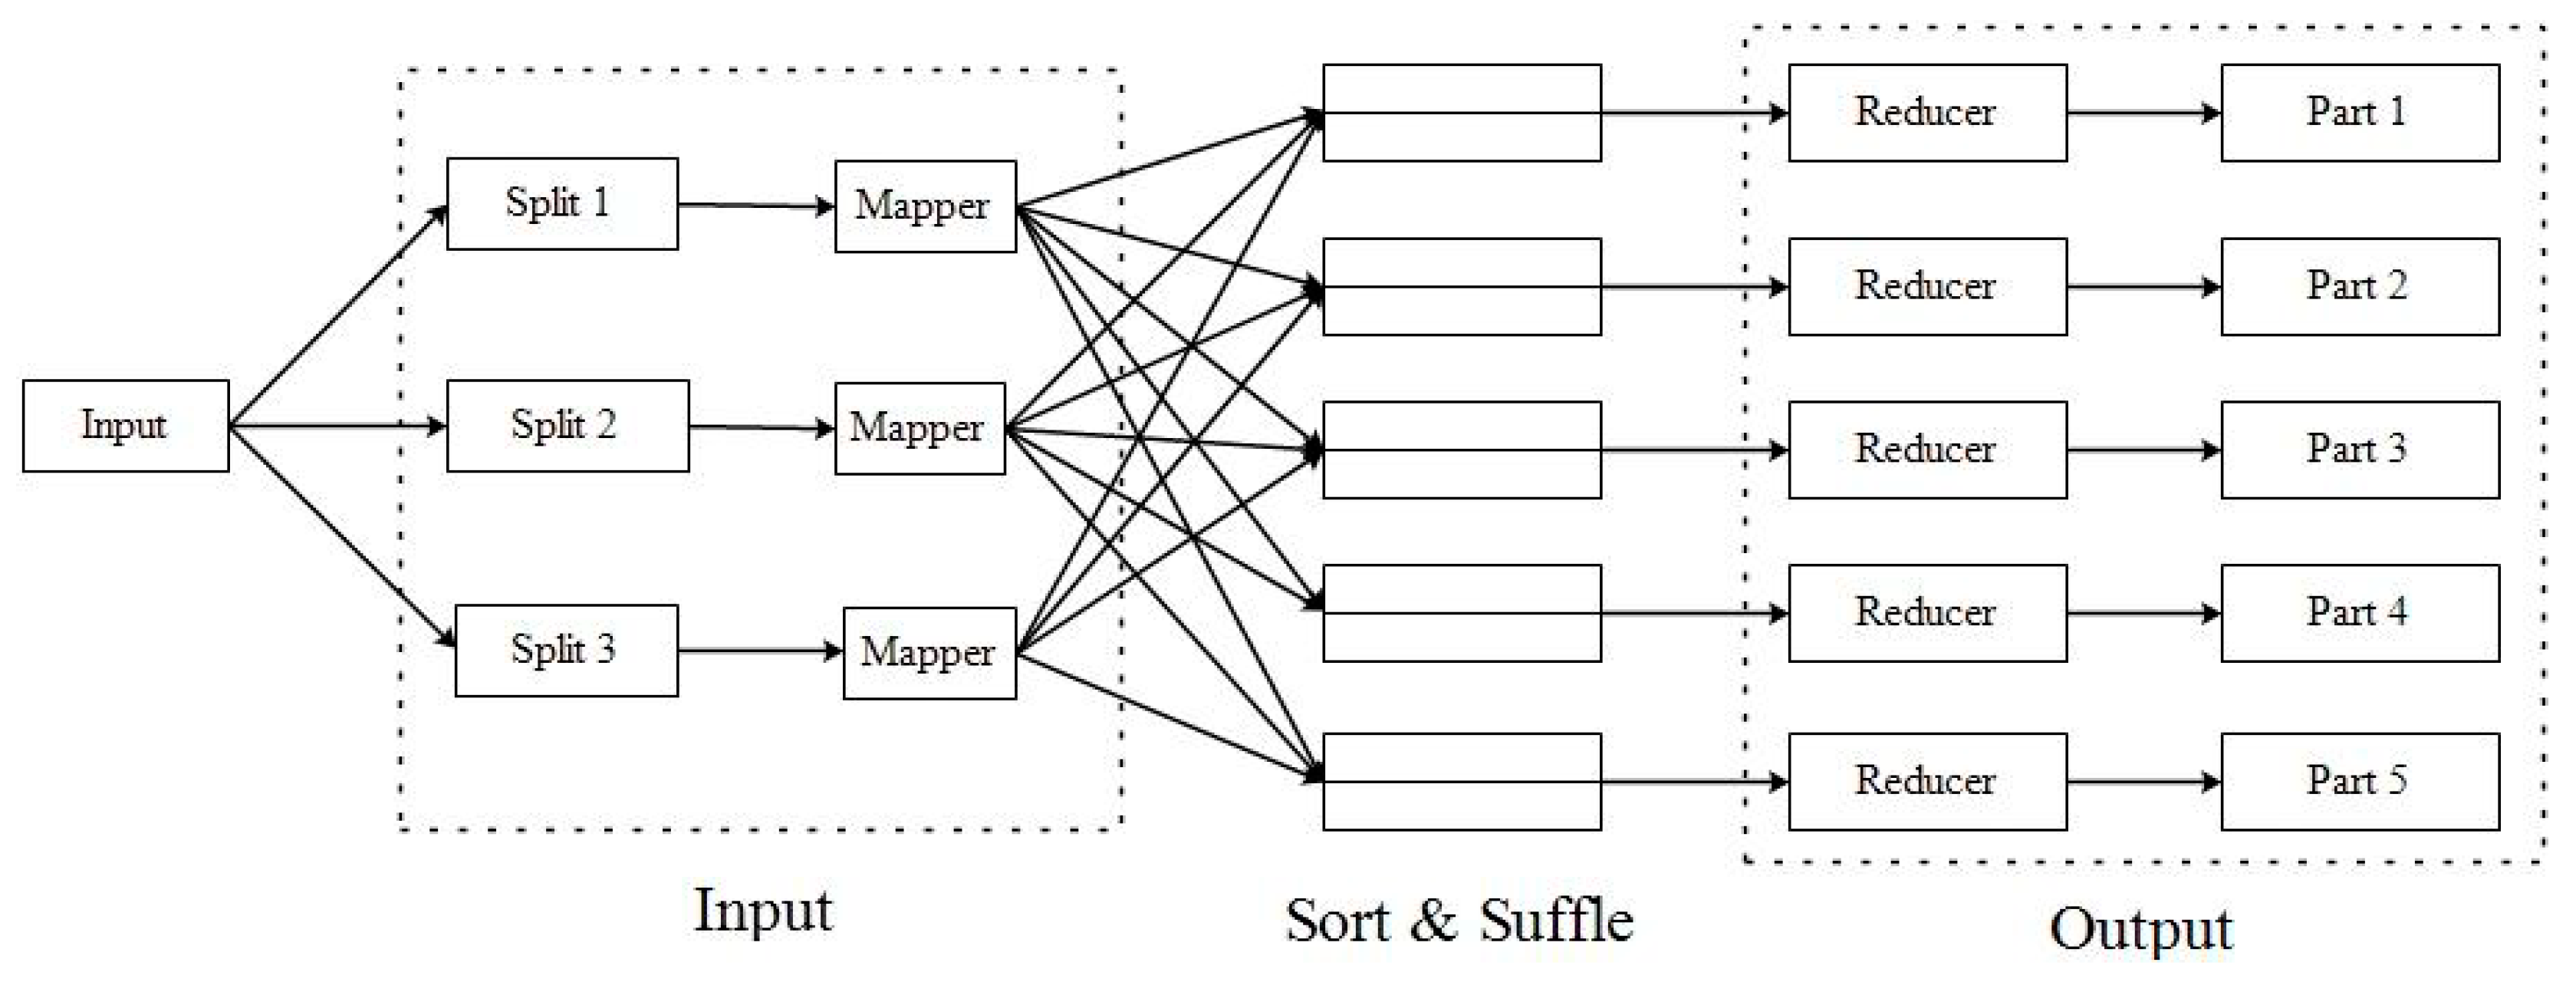
MapReduce was used as it was closely associated with the distributed processing in Hadoop [37], which has been proven to be very efficient in parallel computation and data sorting tasks [38]. The basic idea was to divide the work across a cluster of machines which have access to a shared file system. This paradigm was based on the concept of key-value pairs, and each MapReduce task can be divided into four phases: (a) map stage; (b) combine stage; (c) shuffle stage; and (d) reduce stage.
The map stage splits the input into key-value pairs and emits it for the subsequent phases. In the combine stage, the output of the map stage is collected into a memory buffer, sorted and passed on to the reducer. In the shuffle stage, each map key-value pair is sent to a reducer. Prior to the reducer stage, it merges all inputs and sorts them according to the key value provided, and then makes a list of values. A reducer program then modifies the list of values. Several iterations of the map and reduce stages take place and the final output is stored in a file in the Hadoop distributed file system (HDFS).
The flow chart in Figure 1 depicts the flow of data from the input file in HDFS to Mapper, Reducer and, finally, the output file.
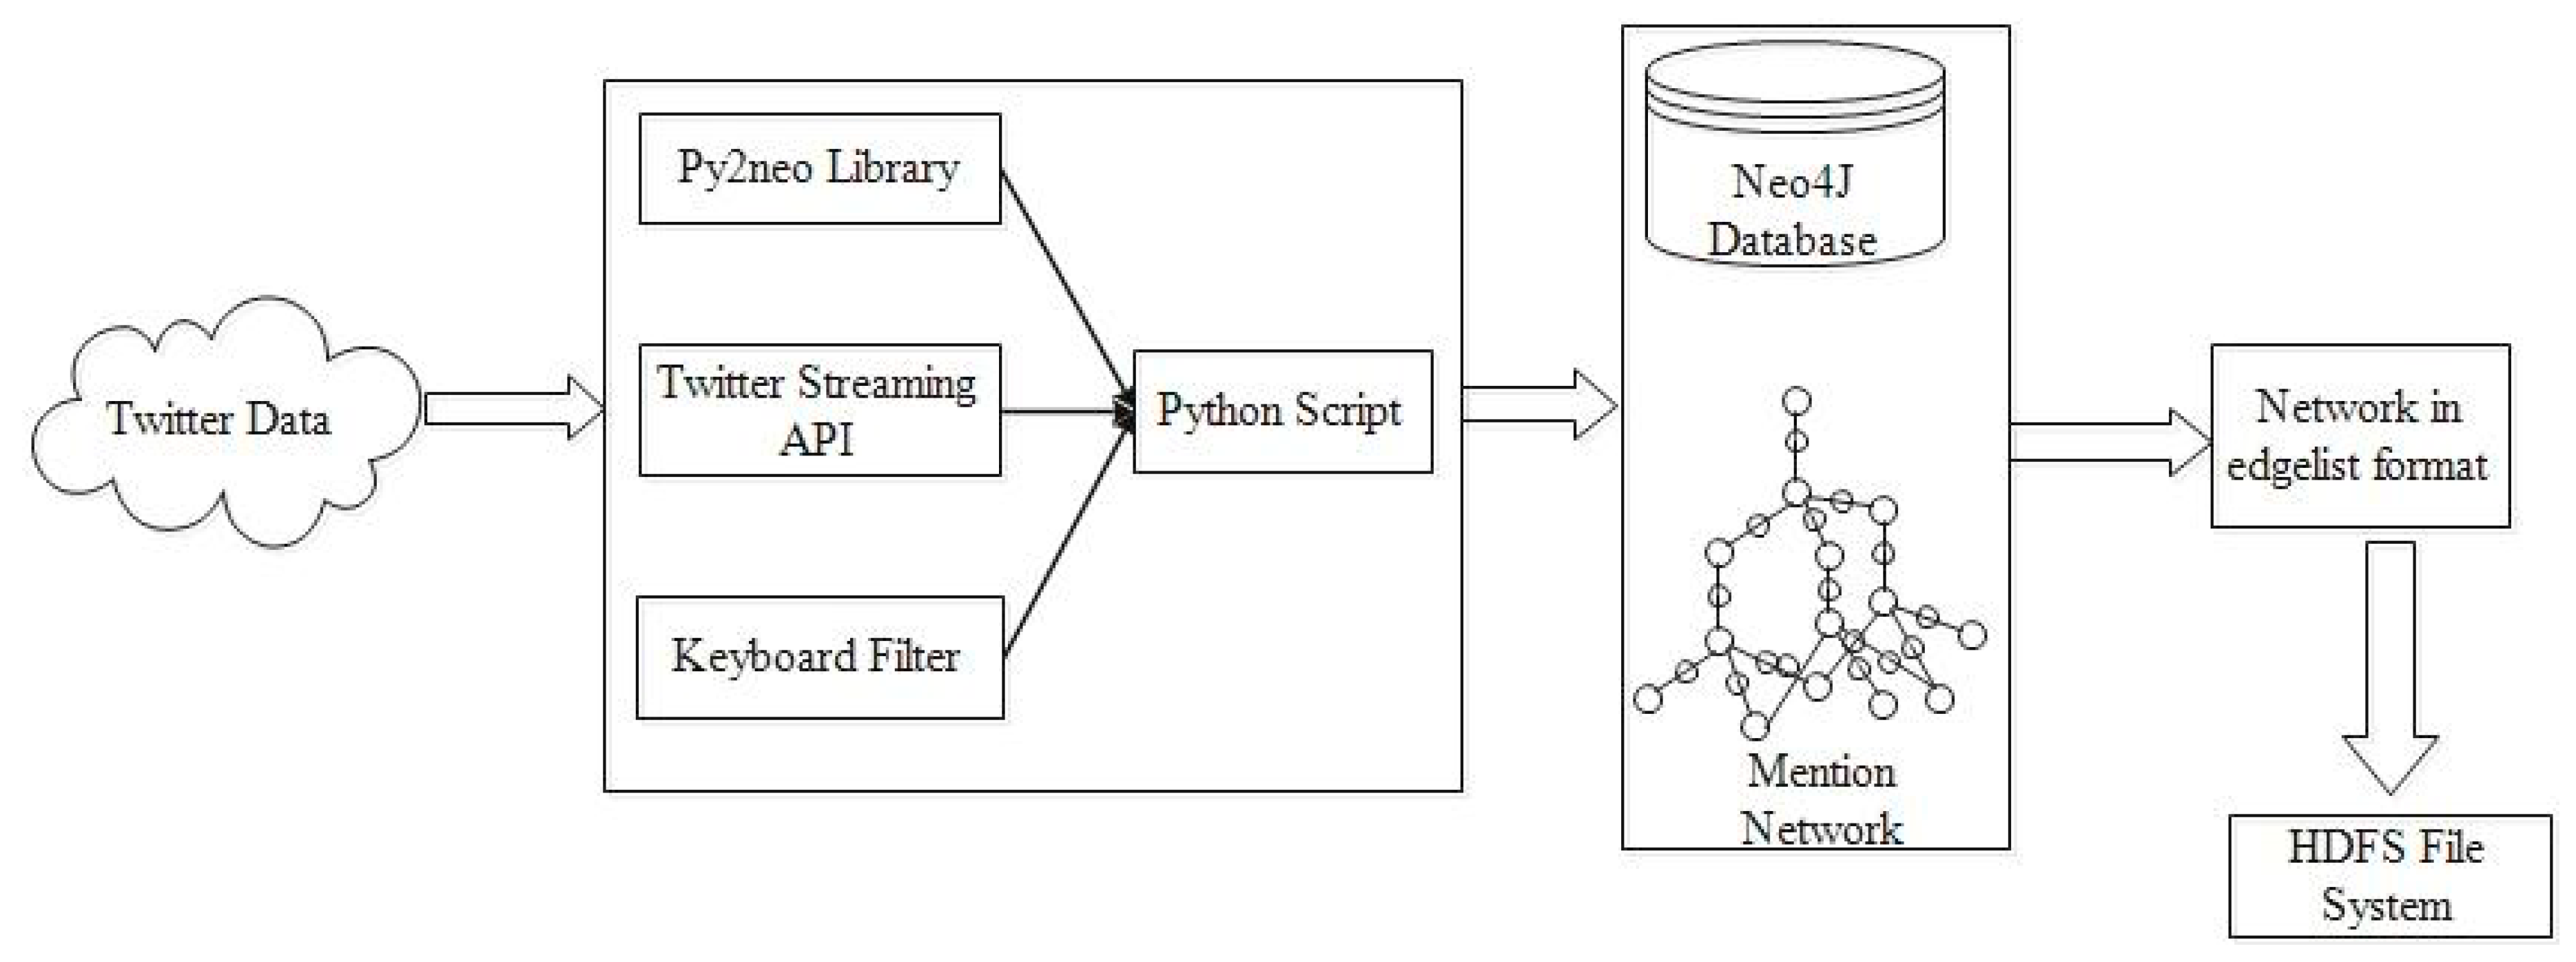
2.6. Data Collection
The architecture of the data collection system is presented in Figure 2. The collected data is then preprocessed and transformed into a mention network, which is further used for centrality analysis (see Algorithm 3).
| Algorithm 3 Twitter data collection |
| Input: Twitter Source Output: Edge-list 1: Create a Tweet developer app and generate the user key, user key (secret), access token and access token (secret) were generated. 2: Establish a persistent connection with the Twitter Streaming API. 3: Read tweets incrementally and store in Neo4j Database (Nodes and Relationships). 4: Parse tweet text incrementally and write to a new text file, if any user mentions are present. 5: Create an edge-list text file with data in the form: UserName1 UserName2, which indicates a mention relationship from UserName1 to UserName2. UserName1 has mentioned UserName2 in his/her tweet text. 6: Store this file in HDFS as input for processing. |
3. Experiments and Results
3.1. Dataset
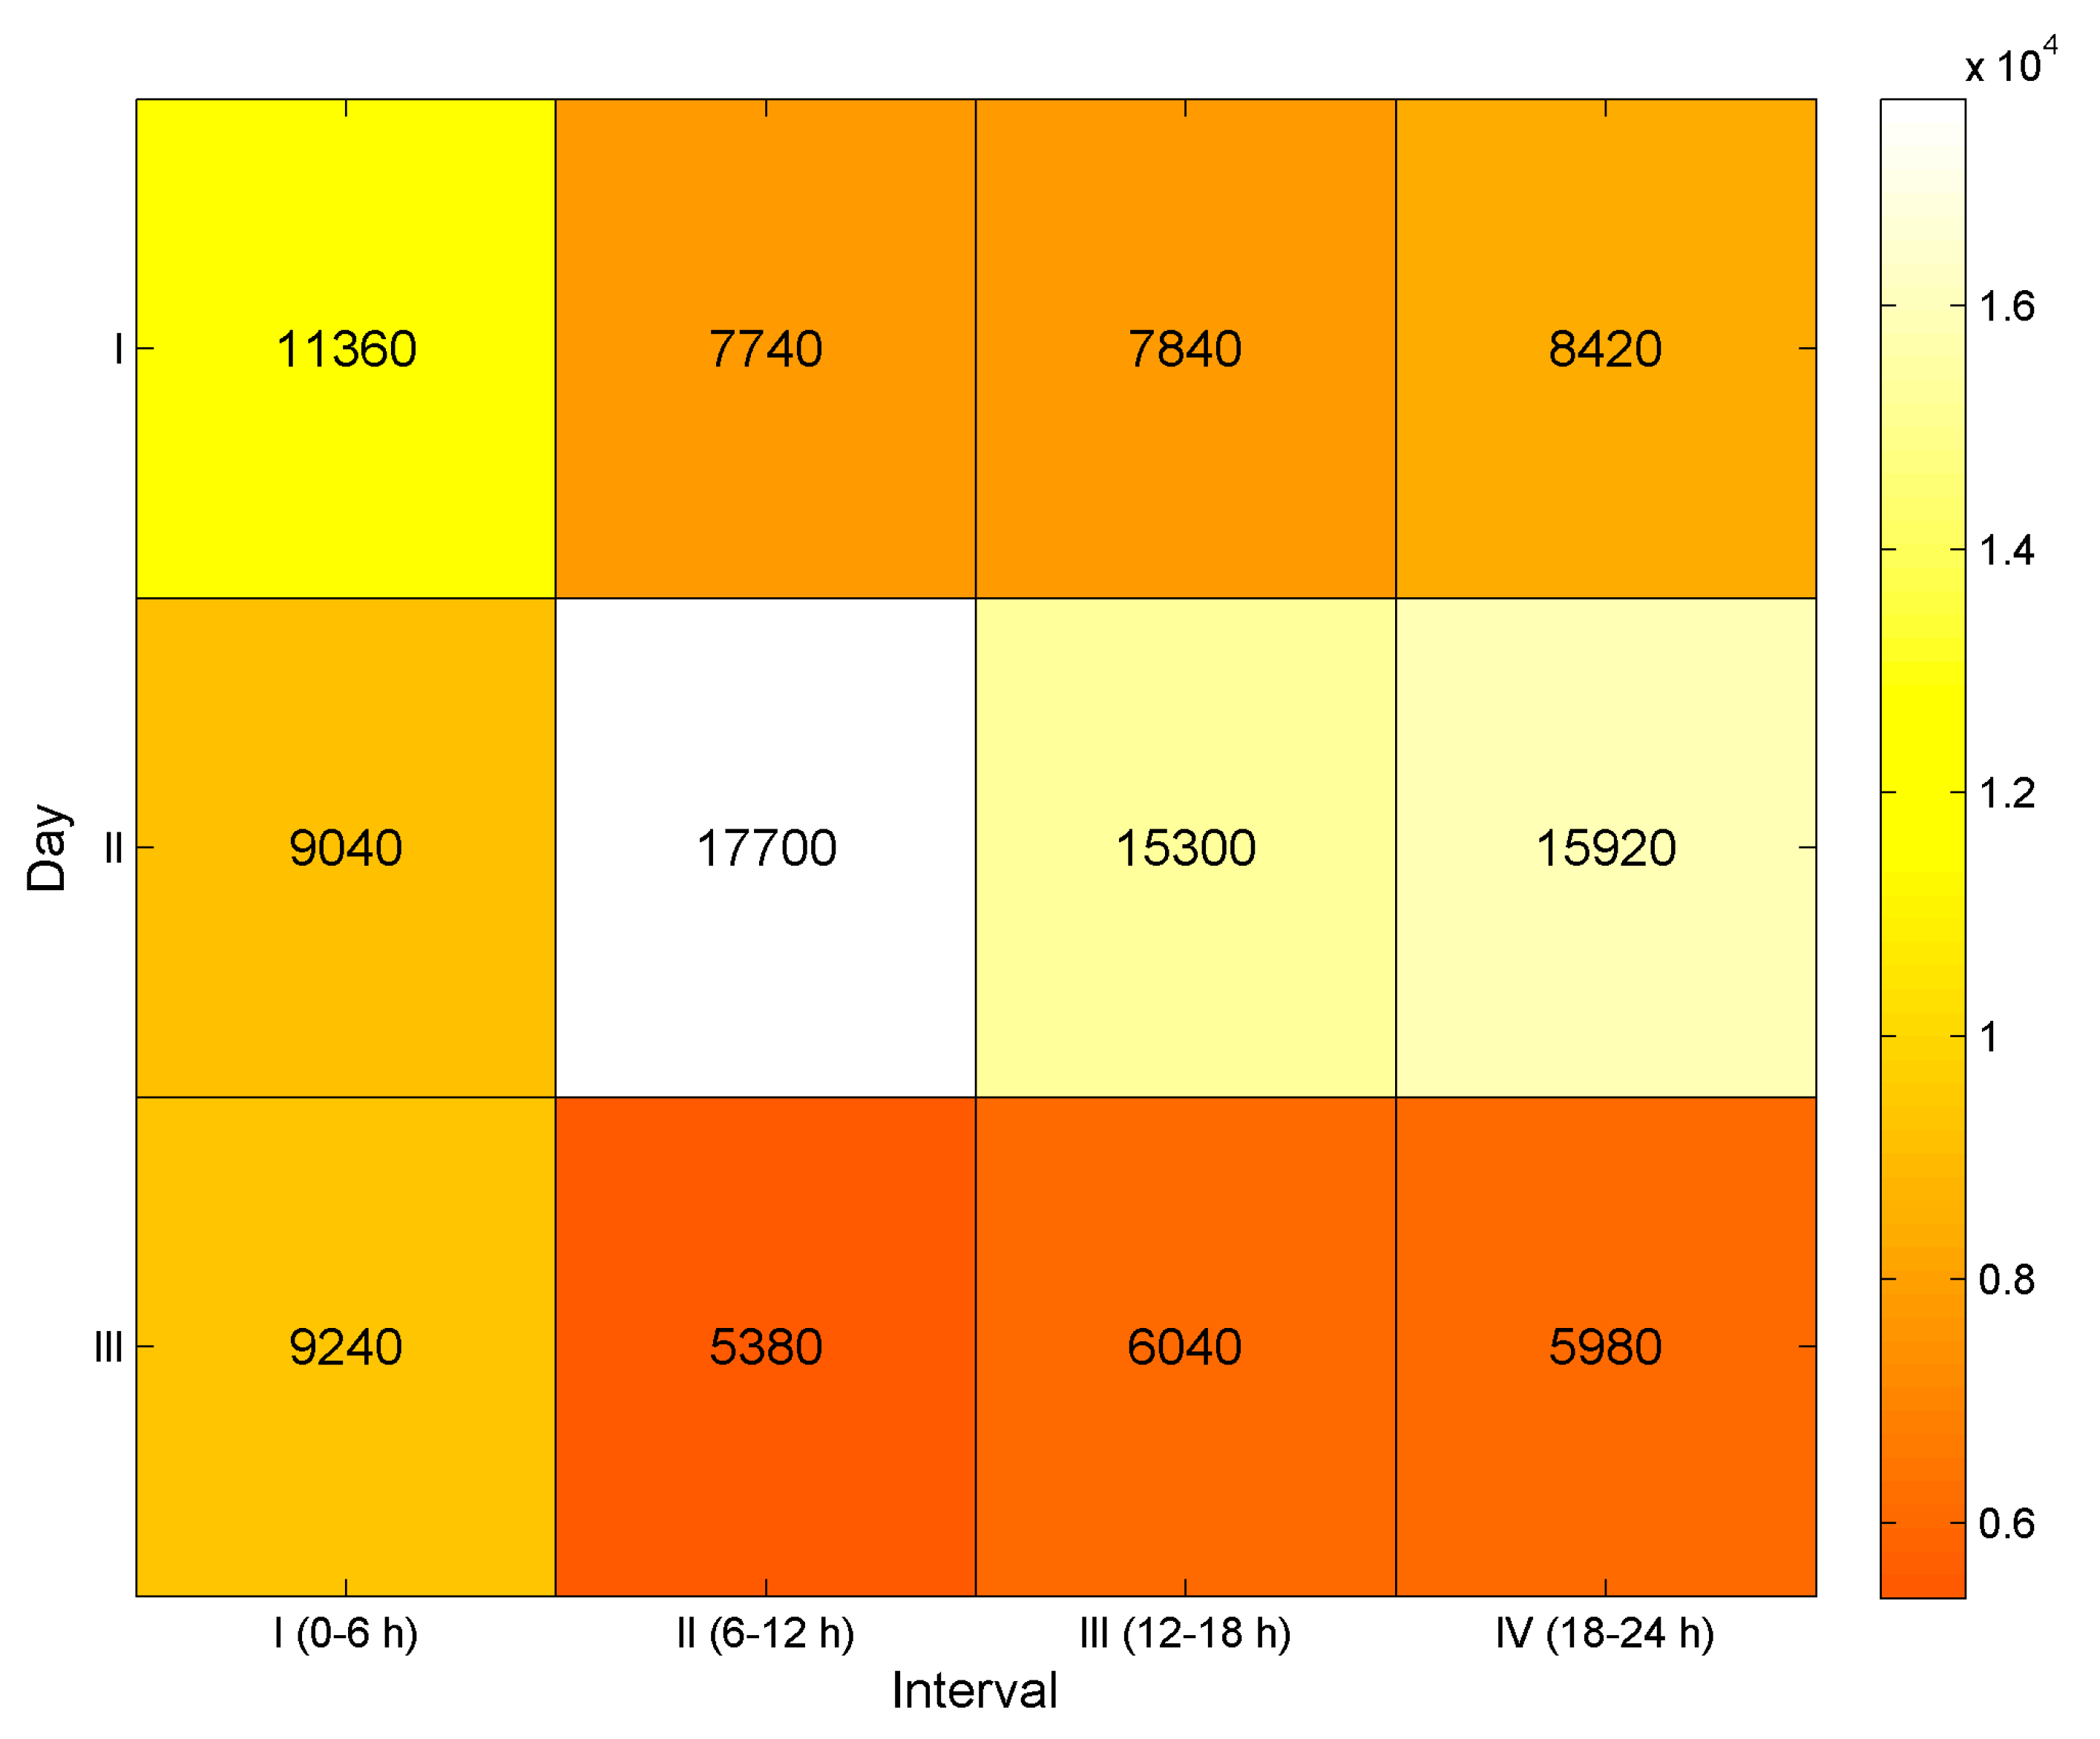
For the sake of simplicity, in the pre-processing phase the isolated nodes, that is, the nodes which have not been mentioned by any other node, were removed from the collection. The usernames or Twitter handles of users are considered as the nodes of the network. The number of tweets collected initially over the period of time is listed in Figure 3. Data was collected in the intervals of six-hour intervals. The process was repeated twice, with a total of three days of data, in which each day was likewise segmented into six hour intervals. Twelve samples are collected and stored in separate text files, which are loaded incrementally to HDFS for processing.
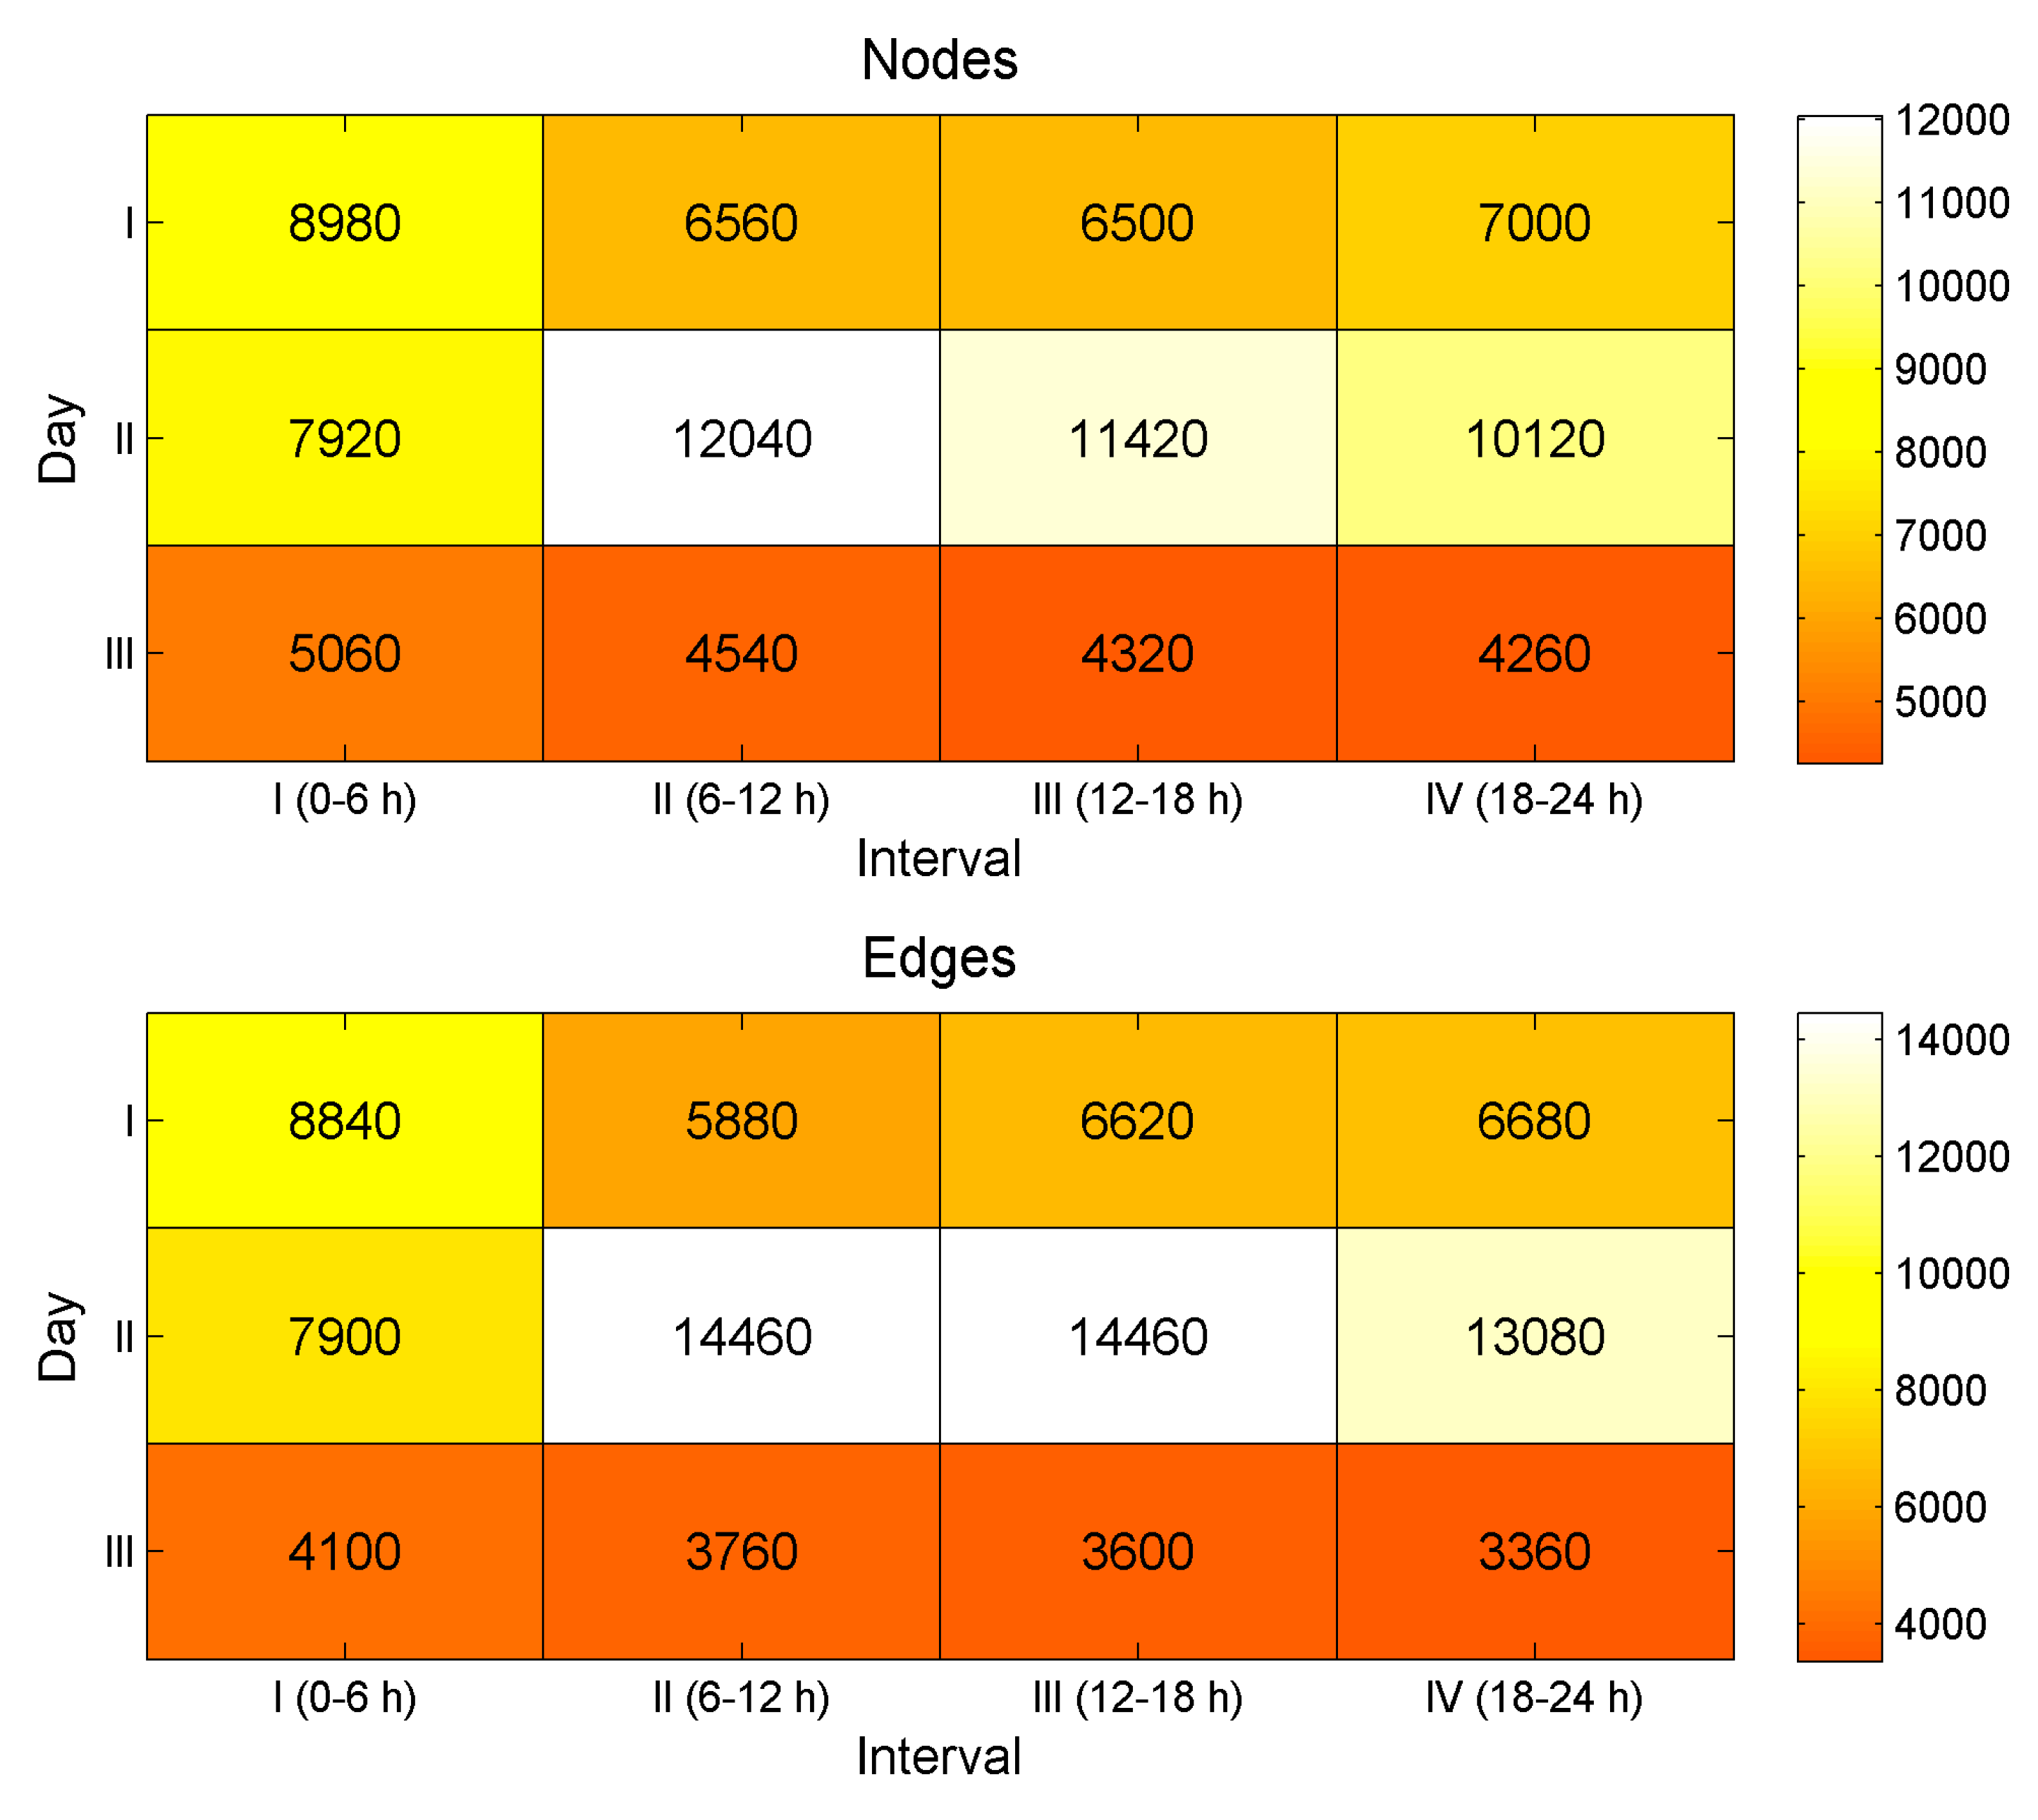
The characteristics of the mention network that had been obtained after transformation are given in Figure 4. The data collected in the first day consisted of a network with 29,040 nodes and 14,010 edges. For the second day, the network consisted of 41,500 nodes and 49,000 edges. The network for data collected during the third day had 18,180 nodes and 14,820 edges.
3.2. Hardware
The experiment was performed on a cluster of 5 computers. Each computer had 3.4 Ghz i7 CPU. The master computer had 1 TB hard disk and 10 GB RAM, and also was used for computations. Each of the other 4 nodes worked as a slave or worker node, with 1 TB HDD and 20 GB of RAM.
3.3. Results
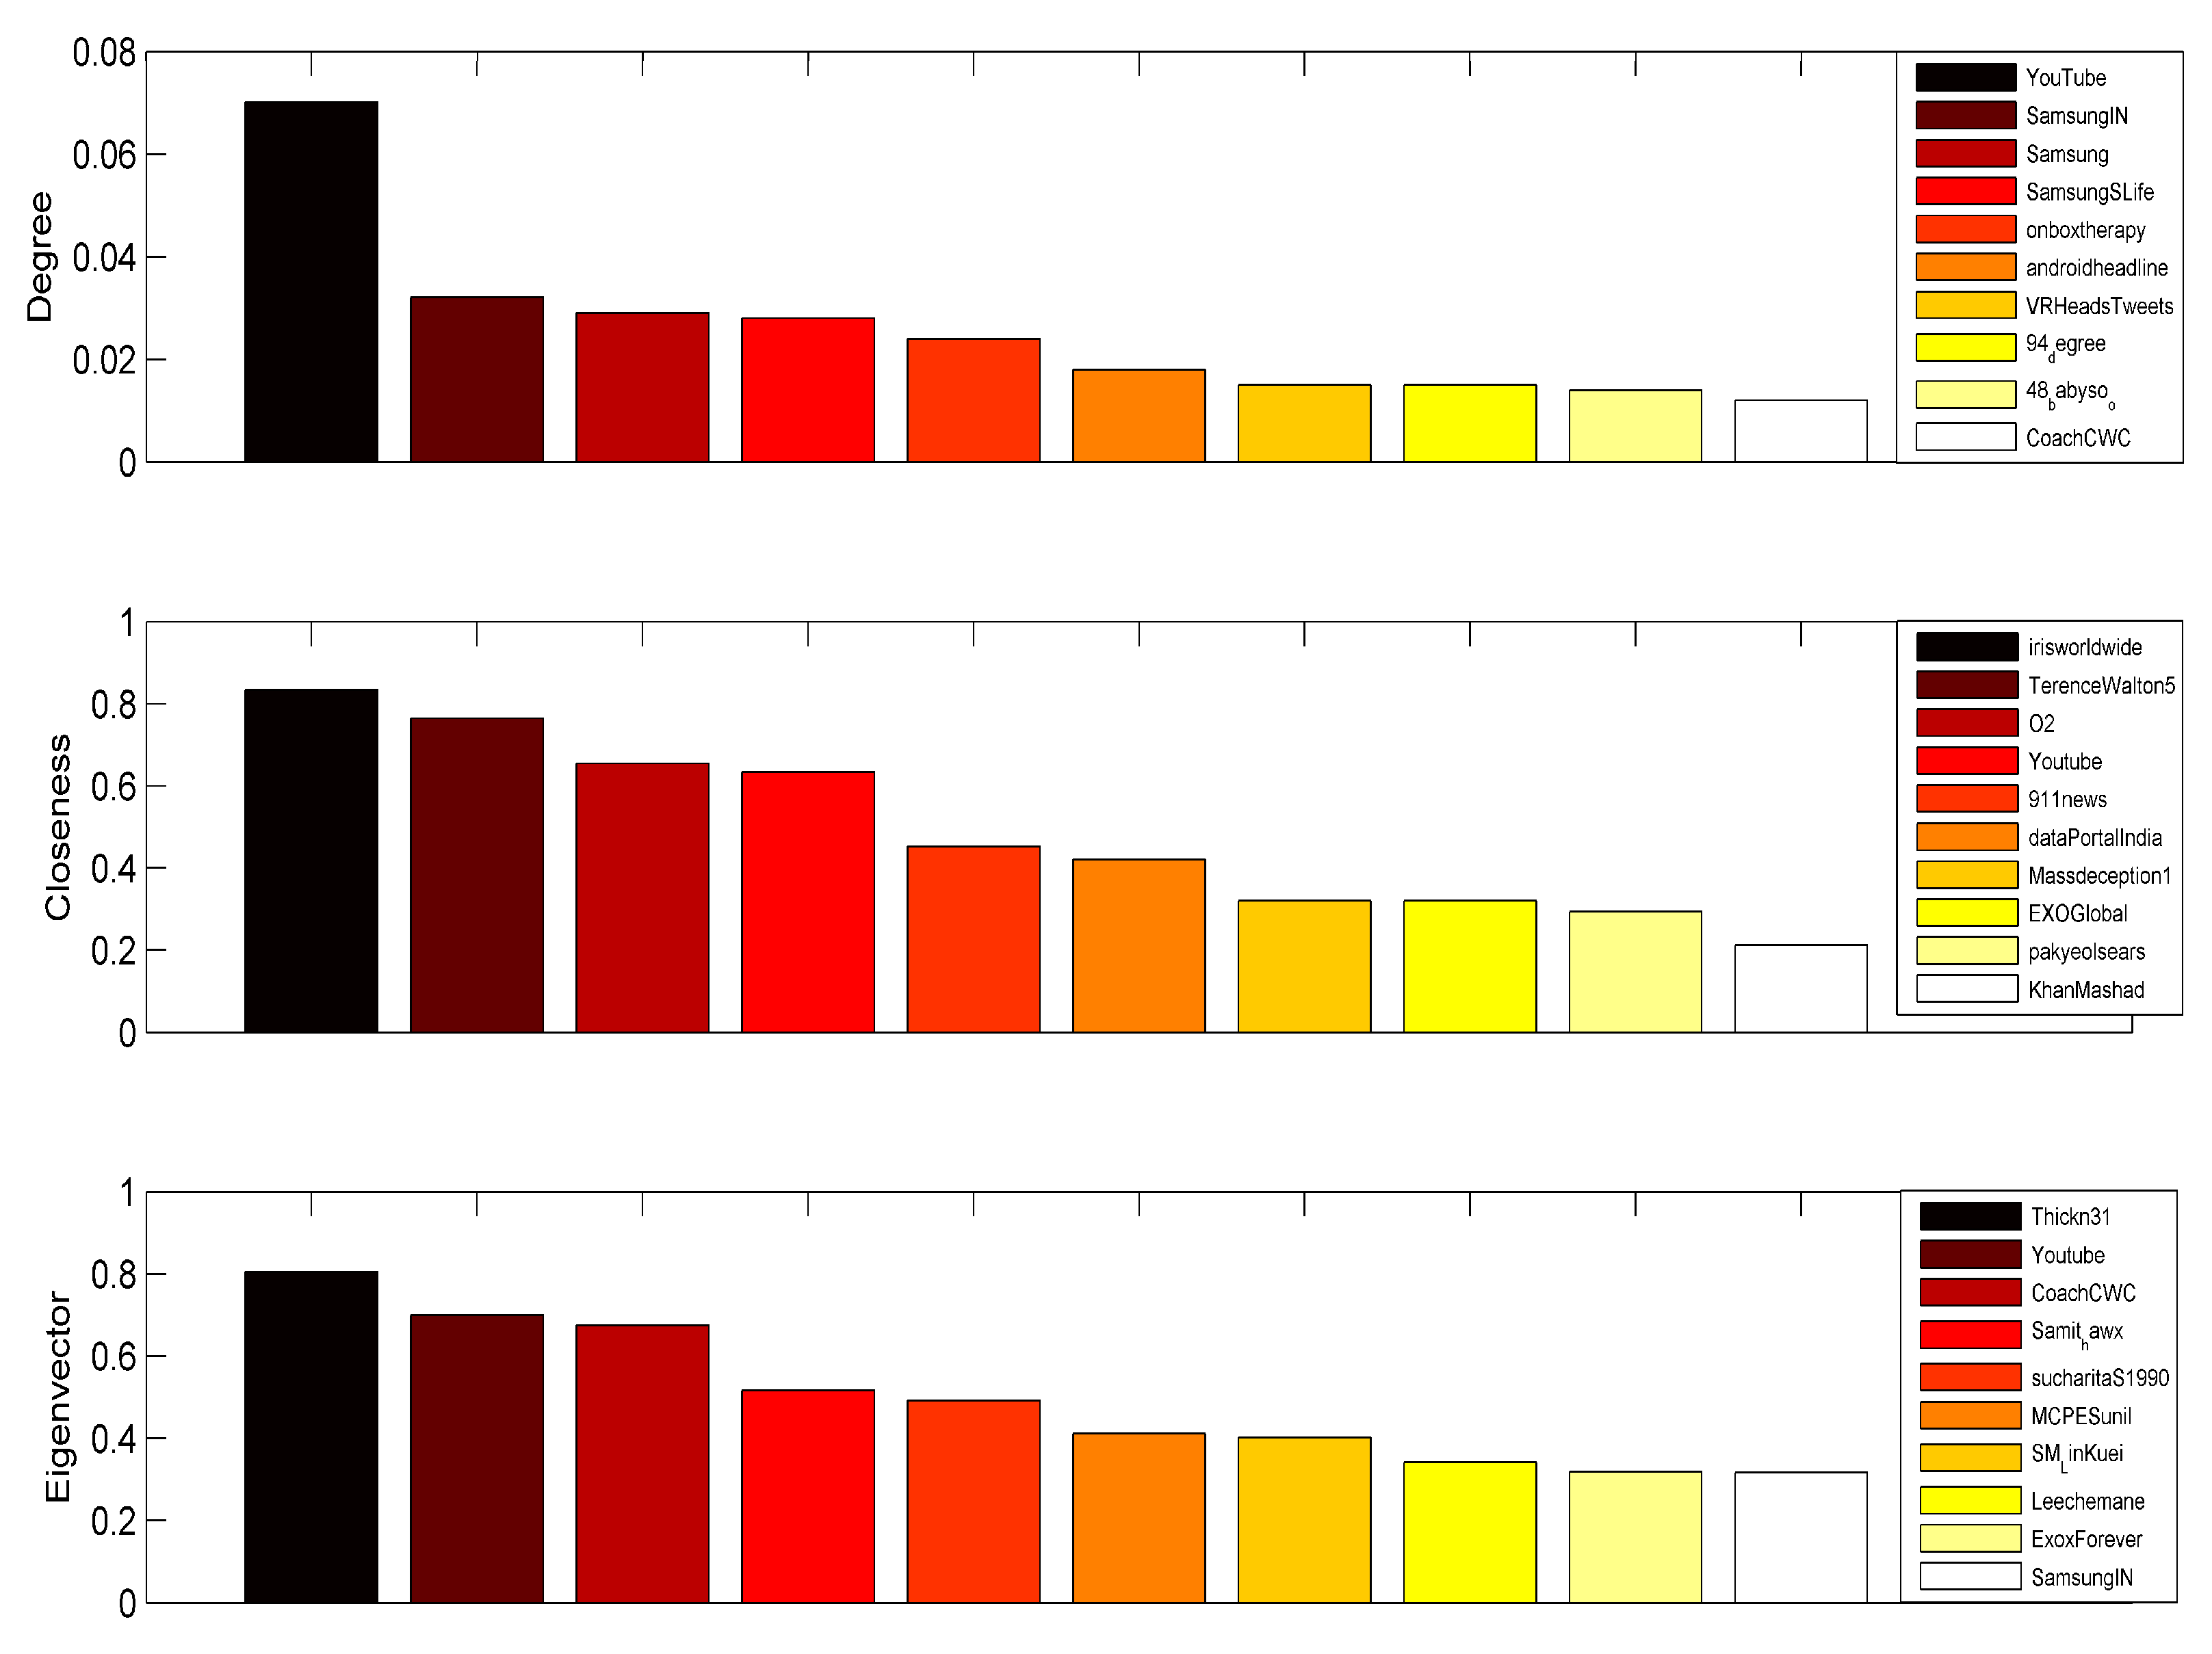
The objective of the study is to highlight the most central nodes in the Twitter mention network analyzed. A node with high degree would be the most central according to degree centrality. A node with higher closeness score, on a scale of 0 to 1, would be more central according to closeness centrality. A node with a higher eigenvalue would be more central according to eigenvector centrality, indicating that the node is connected to more important nodes. An example of the top 10 central nodes according to each of the three centrality measures are given in Figure 5.
Figure 5 represents different centrality measures of the top 10 important nodes in data from the third day. On the third day, the user YouTube was the central node according to degree, the user Irisworld was the central node according to closeness and the user Thickn31 was the central node according to eigenvector centrality. Note that different centrality measures yielded different top 10 central nodes. However, there were nodes (YouTube and Paytm), which appear in the top 10 of all three centralities. The user node EXOGlobal had the highest degree among the three, though it appeared on the lower end in the closeness and eigenvector centralities. Another important observation related to closeness centrality scores is that a number of nodes had a score of 1. This indicated that these nodes were only connected to one other node. There are several disconnected node-sets within the Twitter network, due to the fact that some users only mention another user, and this chain is not propagated further. The method used for calculating closeness centrality is therefore ineffective for the Twitter network, as it contains many disconnected nodes. Several other approaches can be worked out by taking the disconnected nodes into consideration.
The distributed approach implemented and described in this paper was compared with the conventional approach, that is, the one implemented without using parallel processing methods. Figure 6 presents the performance improvement obtained through the MapReduce approach for various centrality measures within the network collected on the first day, second day, and third day, respectively.
In the first day of data, the average improvement through a distributed approach was 32.30% for the computation of degree centrality. The average speed-up for the computation of closeness centrality in the distributed approach was 22.81%, while it was 36.64% for the computation of eigenvector centrality.
In the second day of data, the average speed up in using a distributed approach was 33.05% for the computation of degree centrality. The average improvement for the computation of closeness centrality in the distributed approach was 47.27%, whereas it was 51.32% for the computation of eigenvector centrality.
In the third day of data, the average speed-up in using a distributed approach was 54.15% for the computation of degree centrality. The average speed-up for the computation of closeness centrality in a distributed approach was 51.95%, while it was 35.46% for the computation of eigenvector centrality.
Summarizing, the proposed MapReduce based approach improved the performance of calculation of degree centrality by 39.8%, closeness centrality by 40.7%, and eigenvalue centrality by 41.1%.
Note that using MapReduce for centrality calculation lead to an improvement in execution time. In other systems, breadth first search (BFS) is used in the calculation of the distances between nodes in closeness centrality, and the time complexity of BFS is , where is the number of network nodes. However, in the distributed approach, complexity is reduced to , where refers to the diameter of the graph and possess constant value. The value of is often much smaller than the total number of network nodes.
4. Conclusions
To calculate network centrality measures, we proposed a distributed framework based on a MapReduce computation model, along with the Hadoop distributed file system (HDFS) as the storage platform. The breadth first search (BFS) algorithm was implemented in a distributed manner to collect local and global information around each node, which was then used to calculate degree and closeness centrality. We have calculated centrality measures for top 10 central nodes of a dynamic Twitter network. The comparison between the distributed and conventional approaches showed that the performance of the distributed approach was better (on average, 39.8%, for degree centrality, 40.7% for closeness centrality, and 41.1% for eigenvector centrality).
This empirical study demonstrated that the proposed distributed approach is scalable and helps in efficient computation and pattern recognition of large-scale social network datasets, such as the Twitter dataset.
Author Contributions
Conceptualization, R.K.B. and S.K.R.; Investigation, S.M.; Methodology, R.K.B. and S.K.R.; Software, R.K.B. and S.K.R.; Supervision, S.M.; Validation, R.K.B., S.K.R. and S.M.; Visualization, R.D.; Writing—original draft, R.K.B. and S.K.R.; Writing—review & editing, R.D. and R.M.
Funding
This research received no external funding.
Conflicts of Interest
The authors declare no conflict of interest.
References
- Landher, A.; Friedl, B.; Heidemann, J. A critical review of centrality measures in social networks. Wirtschaftsinformatik 2010, 52, 367–382. [Google Scholar] [CrossRef]
- El Gamal, A.; Kim, Y.H. Network Information Theory; Cambridge University Press: New York, NY, USA, 2012. [Google Scholar]
- Tang, J. Computational Models for Social Network Analysis: A Brief Survey. In Proceedings of the 26th International Conference on World Wide Web Companion (WWW ‘17 Companion), Perth, Australia, 3–7 April 2017; pp. 921–925. [Google Scholar]
- Martinčić-Ipšić, S.; Močibob, E.; Perc, M. Link prediction on Twitter. PLoS ONE 2017, 12, e0181079. [Google Scholar] [CrossRef] [PubMed]
- Hansson, L.; Wrangmo, A.; Søilen, K. Optimal ways for companies to use Facebook as a marketing channel. J. Inf. Commun. Ethics Soc. 2013, 11, 112–126. [Google Scholar] [CrossRef]
- Das, K.; Samanta, S.; Pal, M. Study on centrality measures in social networks: A survey. Soc. Netw. Anal. Min. 2018, 8. [Google Scholar] [CrossRef]
- Basaras, P.; Iosifidis, G.; Katsaros, D.; Tassiulas, L. Identifying influential spreaders in complex multilayer networks: A centrality perspective. IEEE Trans. Netw. Sci. Eng. 2019, 6, 31–45. [Google Scholar] [CrossRef]
- Zhang, Y.; Pennacchiotti, M. Predicting purchase behaviors from social media. In Proceedings of the 22nd International Conference on World Wide Web (WWW ‘13), Rio de Janeiro, Brazil, 13–17 May 2013; pp. 1521–1532. [Google Scholar]
- De Meo, P.; Musial-Gabrys, K.; Rosaci, D.; Sarne, G.M.L.; Aroyo, L. Using centrality measures to predict helpfulness-based reputation in trust networks. ACM Trans. Internet Technol. 2017, 17, 8. [Google Scholar]
- Behera, R.K.; Rath, S.K.; Misra, S.; Damaševičius, R.; Maskeliūnas, R. Large Scale Community Detection Using a Small World Model. Appl. Sci. 2017, 7, 1173. [Google Scholar] [CrossRef]
- Hao, F.; Park, D.S.; Pei, Z. Exploiting the formation of maximal cliques in social networks. Symmetry 2017, 9, 100. [Google Scholar] [CrossRef]
- Peng, S.; Yang, A.; Cao, L.; Yu, S.; Xie, D. Social influence modeling using information theory in mobile social networks. Inf. Sci. 2017, 379, 146–159. [Google Scholar] [CrossRef]
- Liu, Y.; Pi, D.; Cui, L. Mining Community—Level Influence in Microblogging Network: A Case Study on Sina Weibo. Complexity 2017. [Google Scholar] [CrossRef]
- Chamberlain, B.P.; Levy-Kramer, J.; Humby, C.; Deisenroth, M.P. Real-time community detection in full social networks on a laptop. PLoS ONE 2018, 13, e0188702. [Google Scholar] [CrossRef] [PubMed]
- Saxena, R.; Kaur, S.; Bhatnagar, V. Social centrality using network hierarchy and community structure. Data Min. Knowl. Discov. 2018, 32, 1421–1443. [Google Scholar] [CrossRef] [Green Version]
- Bröhl, T.; Lehnertz, K. Centrality-based identification of important edges in complex networks. Chaos 2019, 29. [Google Scholar] [CrossRef]
- Ji, Z.; Pi, H.; Wei, W.; Xiong, B.; Wozniak, M.; Damasevicius, R. Recommendation Based on Review Texts and Social Communities: A Hybrid Model. IEEE Access 2019, 7, 40416–40427. [Google Scholar] [CrossRef]
- Louni, A.; Subbalakshmi, K.P. Diffusion of Information in Social Networks. In Intelligent Systems Reference Library; Panda, M., Dehuri, S., Wang, G.N., Eds.; Springer: Cham, Switzerland, 2014; Volume 65, pp. 1–22. [Google Scholar]
- Matas, N.; Martinčić-Ipšić, S.; Meštrović, A. Comparing Network Centrality Measures as Tools for Identifying Key Concepts in Complex Networks: A Case of Wikipedia. J. Digit. Inf. Manag. (JDIM) 2017, 15, 203–213. [Google Scholar]
- Wei, W.; Joseph, K.; Liu, H.; Carley, K.M. The Fragility of Twitter Social Networks Against Suspended Users. In Proceedings of the IEEE/ACM International Conference on Advances in Social Networks Analysis and Mining (ASONAM ‘15), Paris, France, 25–28 August 2015; pp. 9–16. [Google Scholar]
- Qiao, T.; Shan, W.; Zhou, C. How to Identify the Most Powerful Node in Complex Networks? A Novel Entropy Centrality Approach. Entropy 2017, 19, 614. [Google Scholar] [CrossRef]
- Hall, A.; Towers, N. Understanding how millennial shoppers decide what to buy: Digitally connected unseen journeys. Int. J. Retail Distrib. Manag. 2017, 45, 498–517. [Google Scholar] [CrossRef]
- Sohn, J.-S.; Bae, U.-B.; Chung, I.-J. Contents Recommendation Method Using Social Network Analysis. Wirel. Pers. Commun. 2013, 73, 1529–1546. [Google Scholar] [CrossRef]
- Dewi, F.K.; Yudhoatmojo, S.B.; Budi, I. Identification of opinion leader on rumor spreading in online social network twitter using edge weighting and centrality measure weighting. In Proceedings of the 12th International Conference on Digital Information Management, Fukuoka, Japan, 12–14 September 2017; pp. 313–318. [Google Scholar] [CrossRef]
- Roy, S.; Dey, P.; Kundu, D. Social Network Analysis of Cricket Community Using a Composite Distributed Framework: From Implementation Viewpoint. IEEE Trans. Comput. Soc. Syst. 2018, 5, 64–81. [Google Scholar] [CrossRef]
- Guo, K.; Guo, W.; Chen, Y.; Qiu, Q.; Zhang, Q. Community discovery by propagating local and global information based on the MapReduce model. Inf. Sci. 2015, 323, 73–93. [Google Scholar] [CrossRef]
- Balkir, A.S.; Oktay, H.; Foster, I. Estimating graph distance and centrality on shared nothing architectures. Concurr. Comput. 2015, 27, 3587–3613. [Google Scholar] [CrossRef]
- Adoni, W.Y.H.; Nahhal, T.; Aghezzaf, B.; Elbyed, A. The MapReduce-based approach to improve the shortest path computation in large-scale road networks: The case of A algorithm. J. Big Data 2018, 5. [Google Scholar] [CrossRef]
- Al Aghbari, Z.; Bahutair, M.; Kamel, I. GeoSimMR: A MapReduce Algorithm for Detecting Communities based on Distance and Interest in Social Networks. Data Sci. J. 2019, 18. [Google Scholar] [CrossRef] [Green Version]
- Bakratsas, M.; Basaras, P.; Katsaros, D.; Tassiulas, L. Hadoop MapReduce Performance on SSDs for Analyzing Social Networks. Big Data Res. 2018, 11, 1–10. [Google Scholar] [CrossRef]
- Li, S.; Wang, B. Hybrid Parrallel Bayesian Network Structure Learning from Massive Data Using MapReduce. J. Signal Process. Syst. 2017, 90, 1115–1121. [Google Scholar] [CrossRef]
- Kang, U.; Papadimitriou, S.; Sun, J.; Tong, H. Centralities in large networks: Algorithms and observations. In Proceedings of the SIAM International Conference on Data Mining, Mesa, AZ, USA, 28–30 April 2011; pp. 119–130. [Google Scholar]
- Segarra, S.; Ribeiro, A. Stability and continuity of centrality measures in weighted graphs. IEEE Trans. Signal Process. 2016, 64, 543–555. [Google Scholar] [CrossRef]
- Howlader, P.; Sudeep, K.S. Degree centrality, eigenvector centrality and the relation between them in Twitter. In Proceedings of the IEEE International Conference on Recent Trends in Electronics, Information & Communication Technology (RTEICT), Bangalore, India, 20–21 May 2016; pp. 678–682. [Google Scholar]
- Borgatti, S.P.; Everett, M.G. A graph-theoretic perspective on centrality. Soc. Netw. 2006, 28, 466–484. [Google Scholar] [CrossRef]
- Bonacich, P.; Lloyd, P. Eigenvector centrality and structural zeroes and ones: When is a neighbor not a neighbor? Soc. Netw. 2015, 43, 86–90. [Google Scholar] [CrossRef]
- Dean, J.; Ghemawat, S. MapReduce: Simplified data processing on large clusters. Commun. ACM 2008, 51, 107–113. [Google Scholar] [CrossRef]
- Marszałek, Z. Parallelization of Modified Merge Sort Algorithm. Symmetry 2017, 9, 176. [Google Scholar] [CrossRef]
Figure 1.
MapReduce programming architecture consisting of Input, Sort & Shuffle and Output stages.

Figure 2.
Architecture used for Data Collection.

Figure 3.
Distribution of tweets in the Twitter dataset.

Figure 4.
Summary of the number of nodes and edges in the Twitter dataset.

Figure 5.
Top 10 central nodes under different centrality measures for day III in the Twitter dataset.
Figure 5.
Top 10 central nodes under different centrality measures for day III in the Twitter dataset.

Figure 6.
Distribution of performance improvement for calculation of Degree, Closeness and Eigenvector centralities in Twitter dataset.
Figure 6.
Distribution of performance improvement for calculation of Degree, Closeness and Eigenvector centralities in Twitter dataset.

© 2019 by the authors. Licensee MDPI, Basel, Switzerland. This article is an open access article distributed under the terms and conditions of the Creative Commons Attribution (CC BY) license (http://creativecommons.org/licenses/by/4.0/).
Share and Cite
MDPI and ACS Style
Kumar Behera, R.; Kumar Rath, S.; Misra, S.; Damaševičius, R.; Maskeliūnas, R. Distributed Centrality Analysis of Social Network Data Using MapReduce. Algorithms 2019, 12, 161. https://0-doi-org.brum.beds.ac.uk/10.3390/a12080161
AMA Style
Kumar Behera R, Kumar Rath S, Misra S, Damaševičius R, Maskeliūnas R. Distributed Centrality Analysis of Social Network Data Using MapReduce. Algorithms. 2019; 12(8):161. https://0-doi-org.brum.beds.ac.uk/10.3390/a12080161
Chicago/Turabian StyleKumar Behera, Ranjan, Santanu Kumar Rath, Sanjay Misra, Robertas Damaševičius, and Rytis Maskeliūnas. 2019. "Distributed Centrality Analysis of Social Network Data Using MapReduce" Algorithms 12, no. 8: 161. https://0-doi-org.brum.beds.ac.uk/10.3390/a12080161
Note that from the first issue of 2016, this journal uses article numbers instead of page numbers. See further details here.