A Hybrid Genetic Algorithm-Based Fuzzy Markovian Model for the Deterioration Modeling of Healthcare Facilities


1
Department of Building, Civil and Environmental Engineering, Concordia University, Montreal, QC H3G 1M8, Canada
2
Department of Building and Real Estate, the Hong Kong Polytechnic University, Hung Hom, Kowloon, Hong Kong 999077, China
*
Author to whom correspondence should be addressed.
Algorithms 2020, 13(9), 210; https://0-doi-org.brum.beds.ac.uk/10.3390/a13090210
Submission received: 23 July 2020
/
Revised: 25 August 2020
/
Accepted: 27 August 2020
/
Published: 29 August 2020
(This article belongs to the Special Issue Fuzzy Hybrid Systems for Construction Engineering and Management)
Abstract
:Healthcare facilities are constantly deteriorating due to tight budgets allocated to the upkeep of building assets. This entails the need for improved deterioration modeling of such buildings in order to enforce a predictive maintenance approach that decreases the unexpected occurrence of failures and the corresponding downtime elapsed to repair or replace the faulty asset components. Currently, hospitals utilize subjective deterioration prediction methodologies that mostly rely on age as the sole indicator of degradation to forecast the useful lives of the building components. Thus, this paper aims at formulating a more efficient stochastic deterioration prediction model that integrates the latest observed condition into the forecasting procedure to overcome the subjectivity and uncertainties associated with the currently employed methods. This is achieved by means of developing a hybrid genetic algorithm-based fuzzy Markovian model that simulates the deterioration process given the scarcity of available data demonstrating the condition assessment and evaluation for such critical facilities. A nonhomogeneous transition probability matrix (TPM) based on fuzzy membership functions representing the condition, age and relative deterioration rate of the hospital systems is utilized to address the inherited uncertainties. The TPM is further calibrated by means of a genetic algorithm to circumvent the drawbacks of the expert-based models. A sensitivity analysis was carried out to analyze the possible changes in the output resulting from predefined modifications to the input parameters in order to ensure the robustness of the model. The performance of the deterioration prediction model developed is then validated through a comparison with a state-of-art stochastic model in contrast to real hospital datasets, and the results obtained from the developed model significantly outperformed the long-established Weibull distribution-based deterioration prediction methodology with mean absolute errors of 1.405 and 9.852, respectively. Therefore, the developed model is expected to assist decision-makers in creating more efficient maintenance programs as well as more data-driven capital renewal plans.
1. Introduction
Incessantly aging healthcare facilities often experience complications regarding the estimation and quantification of the probable deterioration within asset components due to a number of reasons. First, the scarcity of condition assessments and rating data made available for research and analysis purposes imposes a difficulty in producing more relatable models and frameworks to the actual hospital building environments, and thus obscures the process of making rational renewal decisions [1]. Second, the inspection, assessment and upkeep activities of hospital building assets are frequently interrupted or delayed due to the dynamic nature of healthcare environments, the high cost associated with performing such activities as well as the shortage in nonmedical-related funding allowances, which in turn contribute to unexpected asset failures that end up costing the hospital extensive amounts of time and funding necessary to reactively respond to the occurring failures as opposed to the original values required to proactively upkeep the assets [2]. This entails the need for formulating a more efficient deterioration model and prediction framework that represent the actual condition progression of assets within healthcare facilities over time to aid decision-makers in achieving more sound maintenance and renewal verdicts [3].
A reliable and precise measurement of the current condition of building assets is considered a fundamental process to be able to accurately forecast the deterioration expected within building assets and accordingly produce reliable asset management frameworks. This is mainly achieved by involving experts and trained personnel to evaluate the condition and performance levels achieved by building assets over a certain planning horizon [4].
However, making such estimations is generally a complex task to perform especially in cases where a dearth of real evidence-based data to back up the decisions made is experienced along with the presence of relative imprecisions and uncertainties [5]. Imprecisions and uncertainties become dominant in frameworks that integrate human experts’ knowledge for the purpose of identifying, rating or ranking a number of alternative solutions to a given problem. This led to the categorization of the decision-making process by [6] into two different categories. First is the “Risk Decision-Making” where the expert playing the decision maker role can provide a single accurate estimate for the problem in hand. The other category represents the situations where the decision-maker delivers an imprecise or uncertain estimate based on their own experience, and this is called “Fuzzy Decision-Making”.
Maintenance and renewal decision-making models have been developed over the years to provide a most-likely or near-optimum estimate of the condition development pattern of assets throughout their lifecycle, with respective applications on various infrastructure categories including: sewer pipelines [7], pavements [8], buildings [9], bridges [10], water distribution pipelines [11], tunnels [12] and railways [13]. However, in comparison to infrastructure-based models that tackled the areas of condition prediction and deterioration modeling, the development of studies that are particularly tailored to healthcare facilities’ reliability, deterioration modeling and prediction remains an under-studied and a limitedly explored research area [14].
In a healthcare setting, the asset failures can be rather catastrophic given the fact that such failures can put plenty of lives at stake [15]. Therefore, this study develops a more efficient deterioration prediction framework that is capable of modeling the current condition degradation pattern in hospital building assets and forecasting the expected future asset conditions on a factual-basis rather than the subjective deterministic approaches to deterioration prediction currently utilized within healthcare facilities. This is expected to strategically help towards making more informed and reliable decisions regarding capital renewals, major repairs or rehabilitation as well as budget allocations to operations and the upkeep of hospital building assets.
Accordingly, this paper is divided into five sections that guide through the gradual developmental stages of the proposed model. This first section is an introductory section that describes the current challenges faced by healthcare facilities complicating the processes of proactive maintenance and renewal decisions. The following section is a literature review of the key studies in the fields of hospital and building deterioration predictions that help grasp the current state of knowledge and hence clarify the significance of the proposed model. The third section is the methodology followed in order to formulate the deterioration framework with an explanation provided for each of the methods utilized. The fourth section tackles the implementation stage where the model is trained and validated according to actual hospital condition datasets collected, and the performance of the model is also evaluated by comparison with a common state-of-art model. The fifth and final section includes the conclusions drawn as per the execution of the model developed as well as the identified limitations and future research direction recommendations.
2. Literature Review
Deterioration prediction is considered a fundamental process in healthcare facility management as, firstly, it helps ensure the smooth and continuous operation of the facility and its underlying assets while decreasing the number of unpredicted failures, and secondly, it is an aiding tool to prioritize the building systems and their components for capital renewal purposes [16]. An accurate deterioration prediction methodology is essential in successful and advantageous maintenance, rehabilitation and replacement (MR&R) decisions [17].
Deterioration prediction models have been priorly divided into three classes, namely: deterministic models, stochastic models, and artificial intelligence-based models [18].
The most commonly used models in healthcare facilities are the deterministic prediction ones that rely on a reference service life (RSL) for the assets under evaluation that is utilized to derive an estimated service life (ESL) by using statistics, building codes and expert surveys. Although these models are simple to develop and implement as they are not as data-intensive as other model types, they are often criticized for their involvement of high uncertainty levels which questions the robustness of the predicted estimates [19]. Several examples are available for this class of models where mathematical functions are employed to illustrate the deterioration pattern of assets ranging from straight-line extrapolation and polynomial models to more complex regression-based analyses including linear, nonlinear, multiple and step-wise regression models [20]. For instance, as part of their maintenance expenditure planning model, [21] adopted a deterministic deterioration prediction approach where they relied on expert surveys to determine the future condition of hospital building components. They suggested that concrete structural components experience a linear deterioration for 15 years in the beginning of their service life, followed by an exponential deterioration pattern for the rest of their lives. Additionally, [22] proposed a maintenance management methodology for healthcare facilities that included the deterioration prediction of hospital facility components using a deterministic approach where experts were surveyed to determine the P–F interval of each hospital building component representing the duration between the potential and functional points of failure.
Alternatively, the stochastic deterioration prediction models involve higher degrees of accuracy and practicality than deterministic methodologies, as unlike deterministic approaches, the stochastic modeling of asset deterioration does not solely rely on age as the condition depreciation indicator. This led to the choice of stochastic deterioration prediction modeling as the most appropriate method to describe the degradation experienced by building asset components [23]. Additionally, stochastic models are more favorable than the artificial intelligence approaches in the specific cases of buildings and healthcare facilities due to the lack of timely condition assessments and rating and the scarcity of extensive data collection procedures [18]. Stochastic deterioration models are classified into either time-based models, or state-based Models. To start with, time-based models predict the probability distribution of the time spent on the change of an asset condition from one state to a lower one. Time-based strategies involve the use of parametric, semiparametric and nonparametric approaches to represent such a probability distribution for the transition time [24]. Most popularly, Weibull distributions are used to model asset condition depreciation as a function of time since construction or installation. The authors of [4] utilized Weibull distribution modeling to predict the deterioration of building components over time, using current and past condition inspection records to propose a sound projection of the service life of the component. The authors of [25] fit the condition observed for community buildings into a gamma distribution curve, and accordingly developed a stochastic model that predicts the reliability of building components and gets calibrated using incremental observations. Moreover, [26] implemented a Weibull distribution model to plot the failure survival curves of heating, ventilation and air conditioning (HVAC) equipment in hospital buildings in order to contribute to a minimization of the wastage expected in the assets’ useful lives and accordingly guide facility management personnel towards decision-making on scheduling the actions to restore the condition of the equipment.
On the other hand, state-based models estimate the probability of transition of the asset components from one state to another within a specific time frame. Markov chain-based methodologies are the most widely used within state-based deterioration prediction models due to their demonstrated validity in modeling complex settings such as building facilities [27]. Markovian models are described as being “memoryless” given their sole dependence on the current observed condition level to predict the future state of the asset component regardless of the previous states experienced. The probability of a building component transforming from state to another is determined by means of expert judgement and/or the accumulation of empirical observation instances often illustrated in a matrix format. The matrix obtained from the previously described procedure is called a “Transition Probability Matrix (TPM)”. Consequently, a future condition for a building component can be deduced from the multiplication of its current condition vector and the TPM. The majority of the previously developed Markovian models assume time homogeneity to ease the design and calculations involved in developing the model, which entails that the transition probabilities remain unchanged over the service life of the asset which is not a realistic estimate. Nevertheless, a major advantage linked with the usage of Markovian models is their ability to tackle and decrease the uncertainties in the initial condition estimation as well as the errors in assessment and applied stresses on building components. Markovian models have been applied on a variety of asset types including complex hierarchical structures, such as buildings and healthcare facilities, as well as linear networks such as water networks, bridges and pavements [25]. On the contrary, drawbacks correlated with the usage of Markovian models include the subjectivity associated with the assumption of probability distributions [17], which is a limitation this study is aiming to overcome.
In a building deterioration prediction context, [28] proposed a Markovian model to estimate the deterioration experienced in community buildings in Australia. They calibrated the transition probability matrices utilized as part of their model by using a nonlinear optimization to minimize the difference between the expected and observed values of building components’ condition levels. Another model developed as part of the study by [25] uses the factors outlined in the International Standards Organization’s (ISO) method as a base for designing a Markovian model that determines the effect of several variables on the building assets’ deterioration patterns over a predetermined duration. Finally, [27] designed a semi-Markov model based on the condition assessment data gathered from the building assets owned by the U.S. Department of Defense (DoD) to estimate the future condition level anticipated, taking into account the previous observed condition state for each component as well as the time elapsed between inspections.
The previously presented diversity within the prediction models and techniques for building assets’ deterioration leads us to the conclusion proposed by [21], which suggests that the process of predicting the deterioration of building components and healthcare facility assets is a rather complicated process due to the variability of the users and stakeholders along with their varying needs, interests and measures of satisfaction that several researchers have tried to ease by using various modeling methodologies.
However, the reliance in almost all the previous models on estimates or experience of experts surveyed makes the data collected imprecise requiring the integration of fuzziness when dealing with such prediction problems. Additionally, the fact that the previous stochastic models, especially Markov models, were all initiated based on guesses and assumptions made for deriving the transition probabilities that, if not made or estimated wisely, can possibly impose errors in calibrations that can eventually lead to an inaccurate prediction of the future condition of facility system components. Moreover, the limited amount of healthcare facilities condition data available for utilization in research purposes mandated the use of a method that is less data-intensive and can be efficiently used with limited datasets and still provide an efficient prediction performance.
Considering the previously presented limitations obtained by searching the relevant literature, the main contribution of this paper is combining the analytical precision of stochastic deterioration prediction models, with the hands-on approach and practical knowledge of field experts within the facility maintenance management personnel in the healthcare sector, along with an integration of fuzzy set theory to minimize the potential uncertainties, subjectivity and imprecision pertaining to expert opinions and decisions. Another fundamental aspect of the developed model is the calibration process as per real datasets collected from hospital building assets that helps derive a more factual-based prediction methodology. Given that the deterioration of the building asset components occurs on a probabilistic and stochastic pattern, a Markovian process has been implemented in this paper to model the deterioration of hospital building components [27].
The proposed model exhibits two main functions: (1) a deterioration modeling function which starts with a fuzzy expert-based derivation of the initial transition probabilities relying on the age, condition and expected deterioration rate of hospital building components that are then fed into the Markov model in order to derive the future condition of the components under study. Moreover, a genetic algorithm is employed to train the Markov model by optimizing the transition probabilities to reflect the training datasets collected from the actual hospital building; (2) a deterioration prediction function that utilizes datasets collected for validation purposes in order to measure the capability of the developed model to estimate the future condition of hospital building components as opposed to state-of-art deterioration prediction models. These functions help in producing a more precise, relatable and representative model while preserving the advantage of not being as data-demanding as other artificial intelligence models.
3. Methodology
As previously outlined, the main objective of the current study is to develop a model that integrates expert knowledge and human reasoning into the prediction process of the expected deterioration occurring within hospital building components to overcome the dearth of data collected describing the condition of the different systems in a hospital which is mainly due to the privacy restrictions put on such datasets to preserve the interests on sponsors, investors or donators.
Therefore, this paper proposes a hybrid fuzzy Markov model that is tuned by means of a genetic algorithm to better represent the real hospital assets and facilities. The system modeled as part of this study is the oxygen gas system due to its significant importance ranking calculated as per the framework designed by [15] to measure the criticality of systems in healthcare facilities based on their relative mission dependability and associated consequences and probability of failure. In a hospital building, the safety of patients and occupants is of ultimate importance which makes a system such as the oxygen gas system a fundamental one in a healthcare facility, as it is used in critical functions such as life sustainment of the hospital’s in-patients, it can be used as a form of treatment in some acute and chronic cases, and is most frequently used as part of resuscitation and anesthesia processes [29].
3.1. Fuzzy Deterioration Framework
The fuzzy set theory was first established by [30], where it was found to overcome the shortcomings of binary logic and was mainly utilized to accommodate the uncertainties within decision-making methodologies. In the following years, various scholars have explored the concept of fuzzy sets and how they can be applied to facilitate the decision-making process of diverse types of problems.
In a traditional crisp set “A”, an element “x” is evaluated based on whether they belong inside the set or not. A typical fuzzy set extends this concept in which it illustrates the inherent relationship between an element “x” and a given set “A” by means of a fuzzy membership function “μ”, ranging from 0 to 1. The mathematical formulation representing the fuzzy set “A” in a universe “X” is illustrated in Equation (1).
where μA (∙): X → [0,1] is the membership function of elements present in “A”, all belonging to universe X, and μA (x) denotes the membership degree of element x within set A.
A membership function can take any form, but the chosen form needs to be justified by given information [31]. Membership functions are most commonly illustrated into triangular fuzzy numbers (TFN) or trapezoidal fuzzy numbers (ZFN) that are both most commonly used to demonstrate the linguistic variable used by the experts interviewed or subjective data available. A fuzzy set is typically normal, convex or of a bounded form in order to qualify as a fuzzy number. As part of the current study, TFNs are chosen to demonstrate the relative membership of the various parameters involved in the model for the sake of their relevant simplicity and applicability without imposing a declination in the generality.
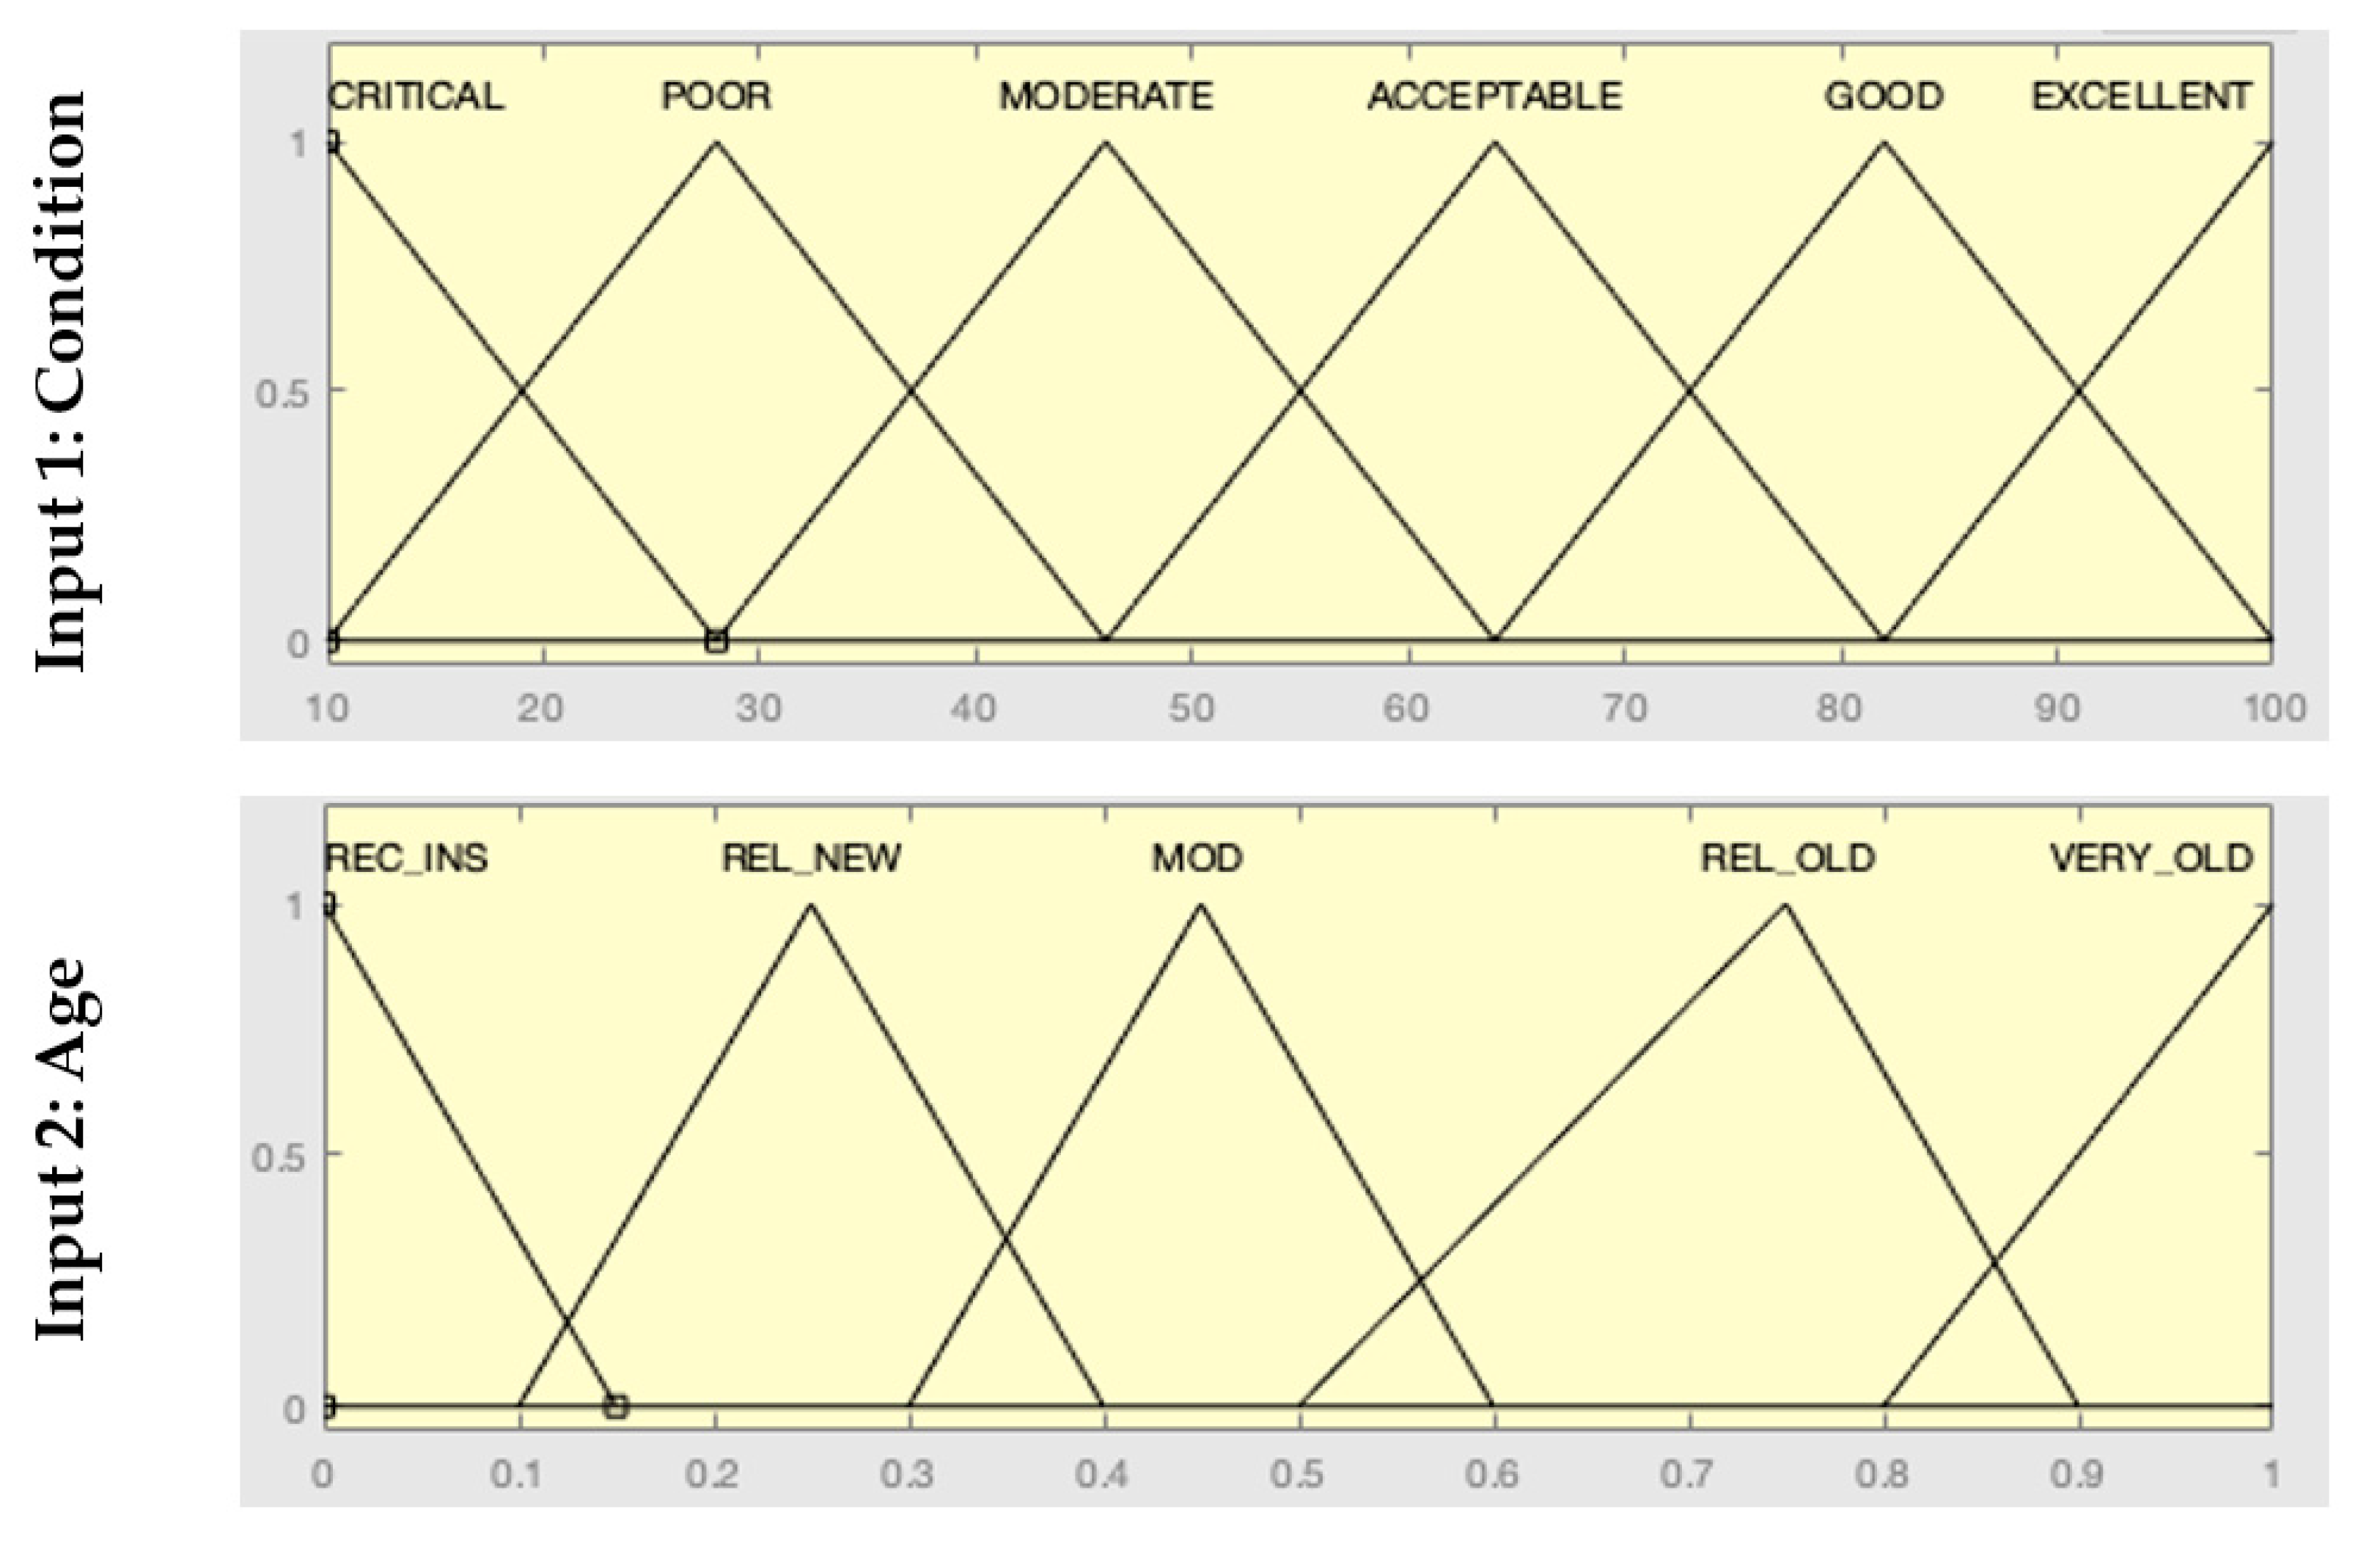
As a first step in the model design phase of this study, three parameters were involved as a foundation for the prediction process. The process of defining the inputs and outputs of a fuzzy-based framework is often referred to as the process of knowledge base creation. In the present study, the fuzzy model developed takes two inputs to derive a single output parameter as explained below.
The first input into the fuzzy model was the normalized physical condition of the assets as measured in the last preceding visual inspection of system components and is a representation of the level of defects and damage within each system. The physical condition is evaluated by specialized engineers on a six-point scale ranging from excellent to critical. A system evaluated as having an excellent condition is probably new and very recently installed and is working with near 100% performance, while the evaluation resulting in a critical condition suggests that the system is in a significant state of damage, almost working with 10% of its performance, and this in turn suggests that its replacement is due and inevitable.
The second parameter input to describe the system was its relative age since it was initially installed, compared with its life expectancy. This parameter includes five possibilities represented by a percentage value for the age divided by the design life, ranging from recently installed to very old. In the case of oxygen gas systems, the average design life is 28 years as per [32], and this was the value used in the developed model to compare the age against.
The final output parameter was the expected deterioration rate as a result of the previous two indicators, which was evaluated using a variable r that was initially assumed and then calibrated using the proposed optimization model. The five-point scale associated with this parameter was represented using multiples of r which is a variable representing the deterioration speed expected for this specific system, starting from 0 which represents a nondeteriorated system, moving on to r, 2r, 3r, and 4r which indicates a “very fast” pace of deterioration. The variable r is initially assumed to be a 10% deterioration loss from the system’s initial condition state to the following lower state. This is further calibrated as explained in Section 3.3.
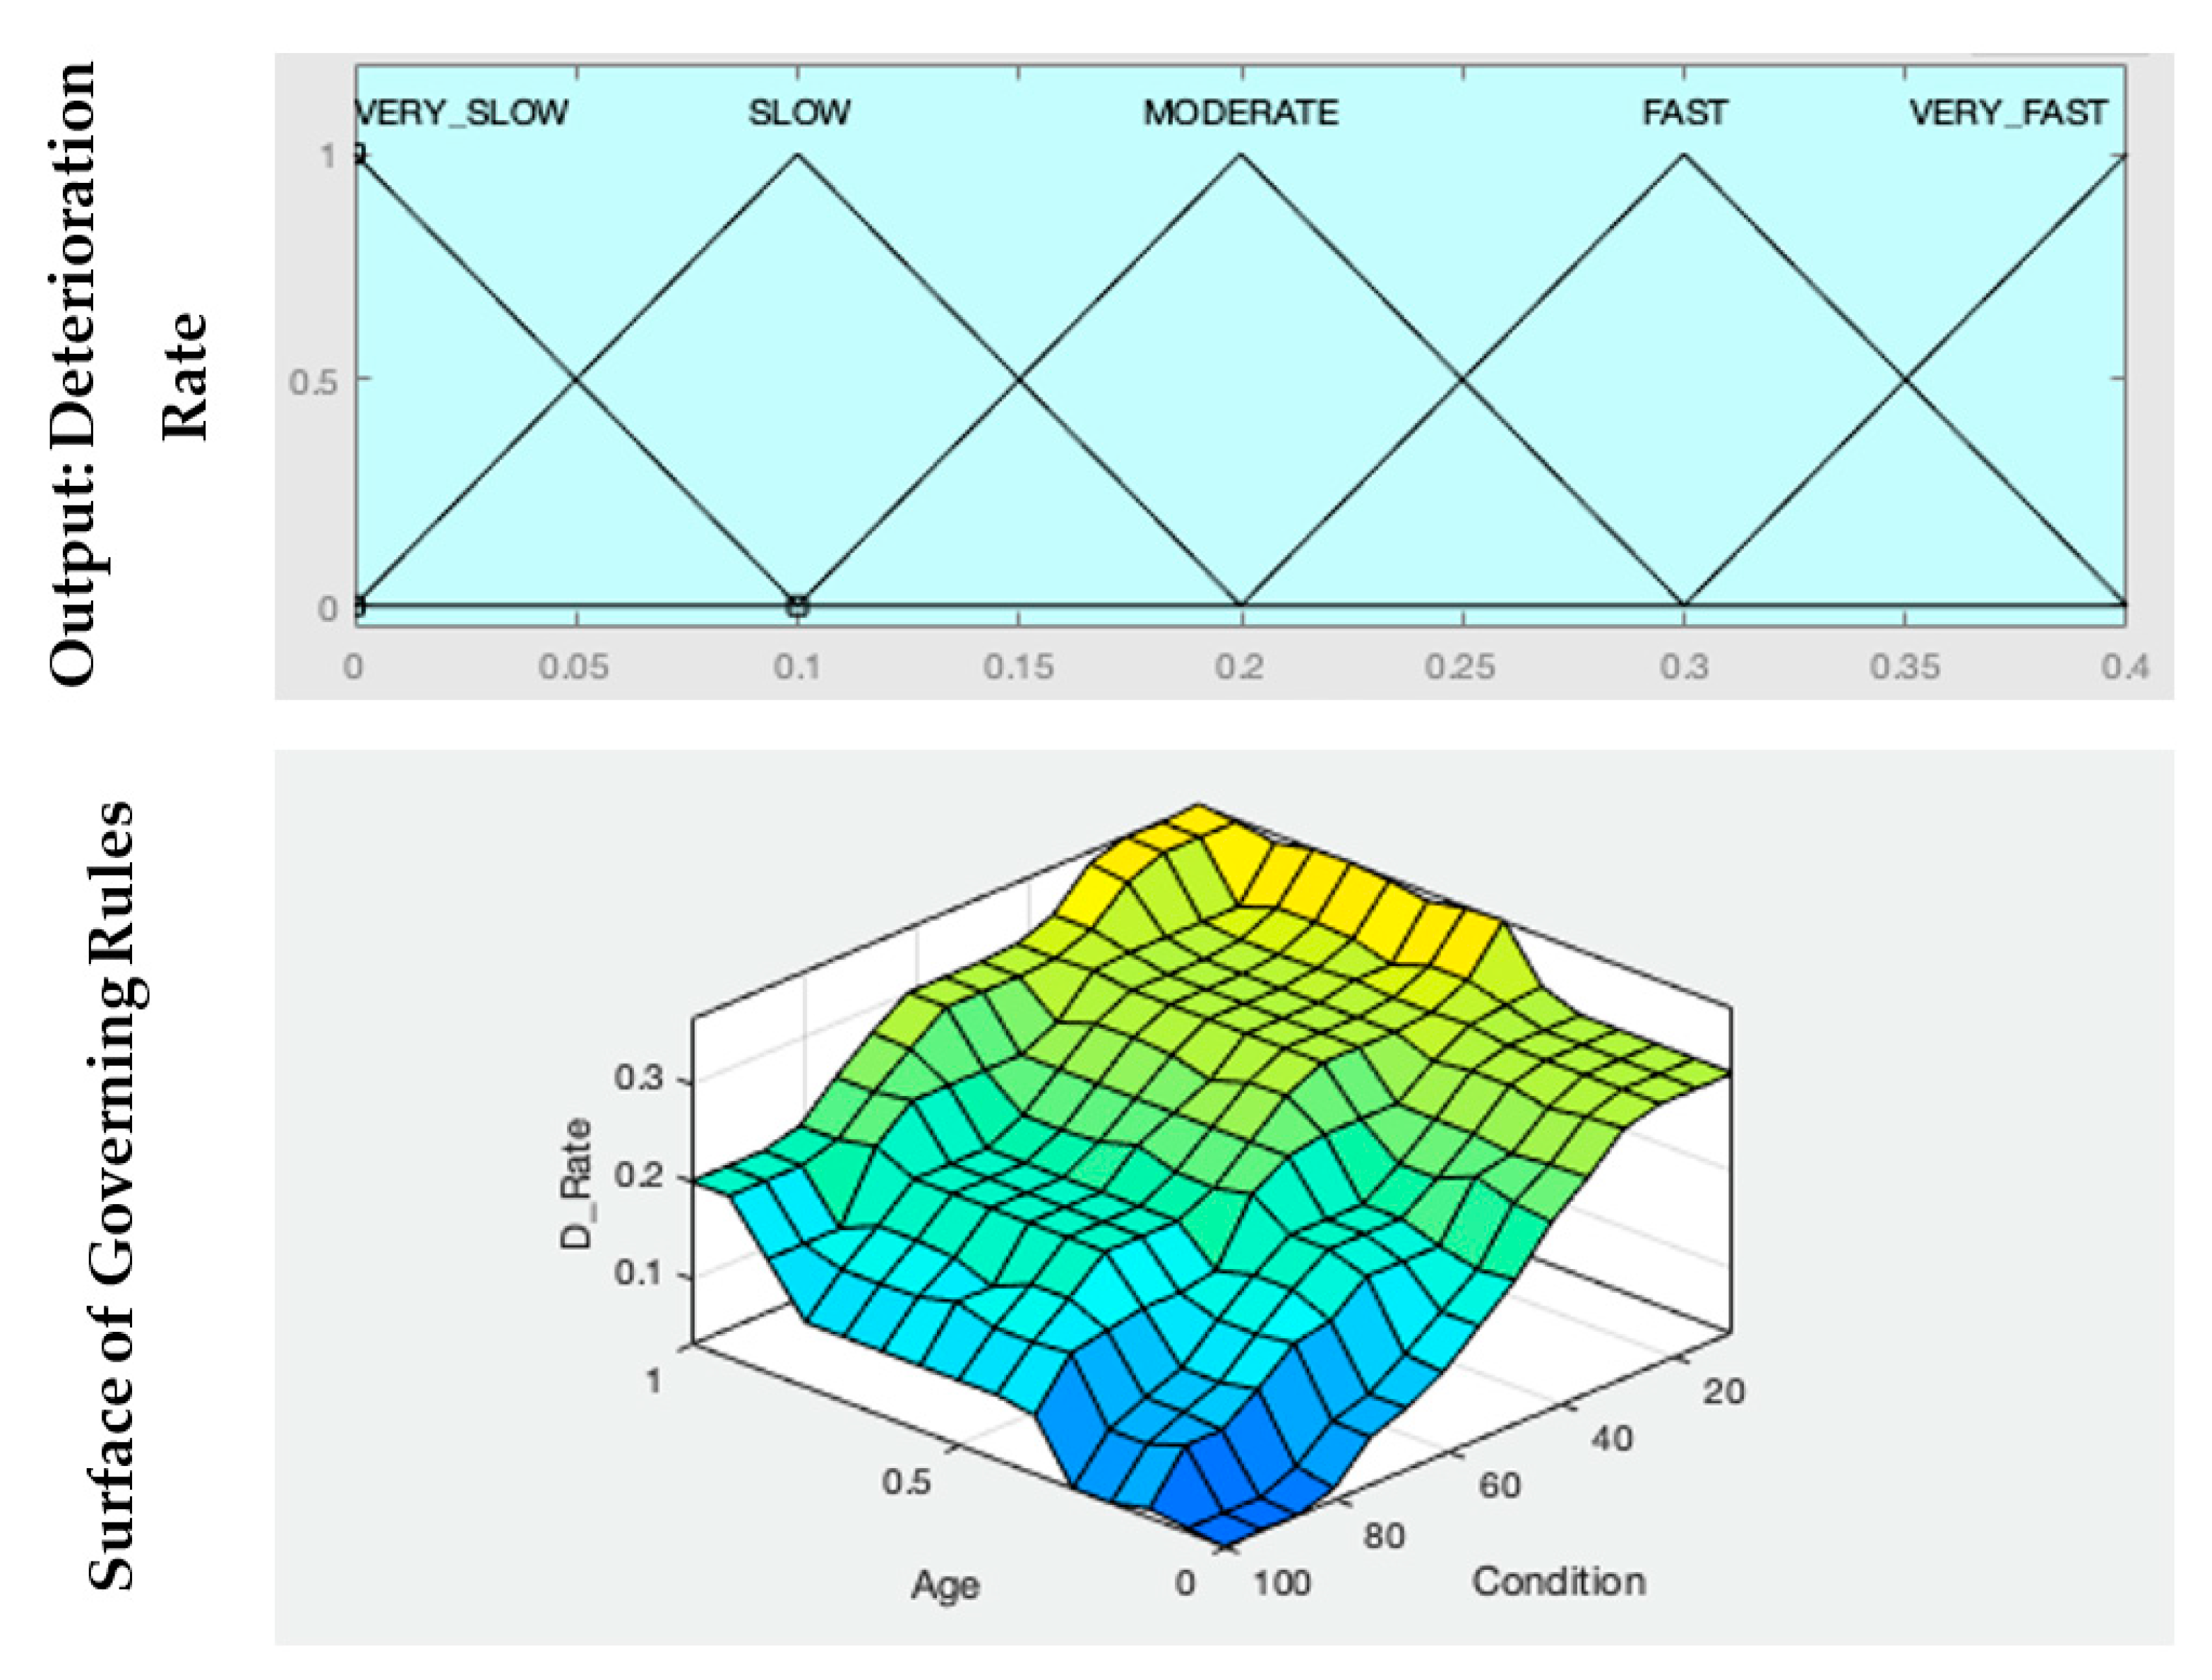
After the formation of the fuzzy knowledge base, a fuzzy set of rules was developed in order to govern the relationship and dependence between all the parameters to further calculate the expected deterioration rate of the system based on its fuzzified condition rating in the last inspection, as well as its fuzzified age. The distribution of the membership functions for the three previously presented parameters as well as an overview of the rule-based relationship between them obtained from the model execution on MATLAB® using the Fuzzy Logic Toolbox™ are illustrated in Figure 1.
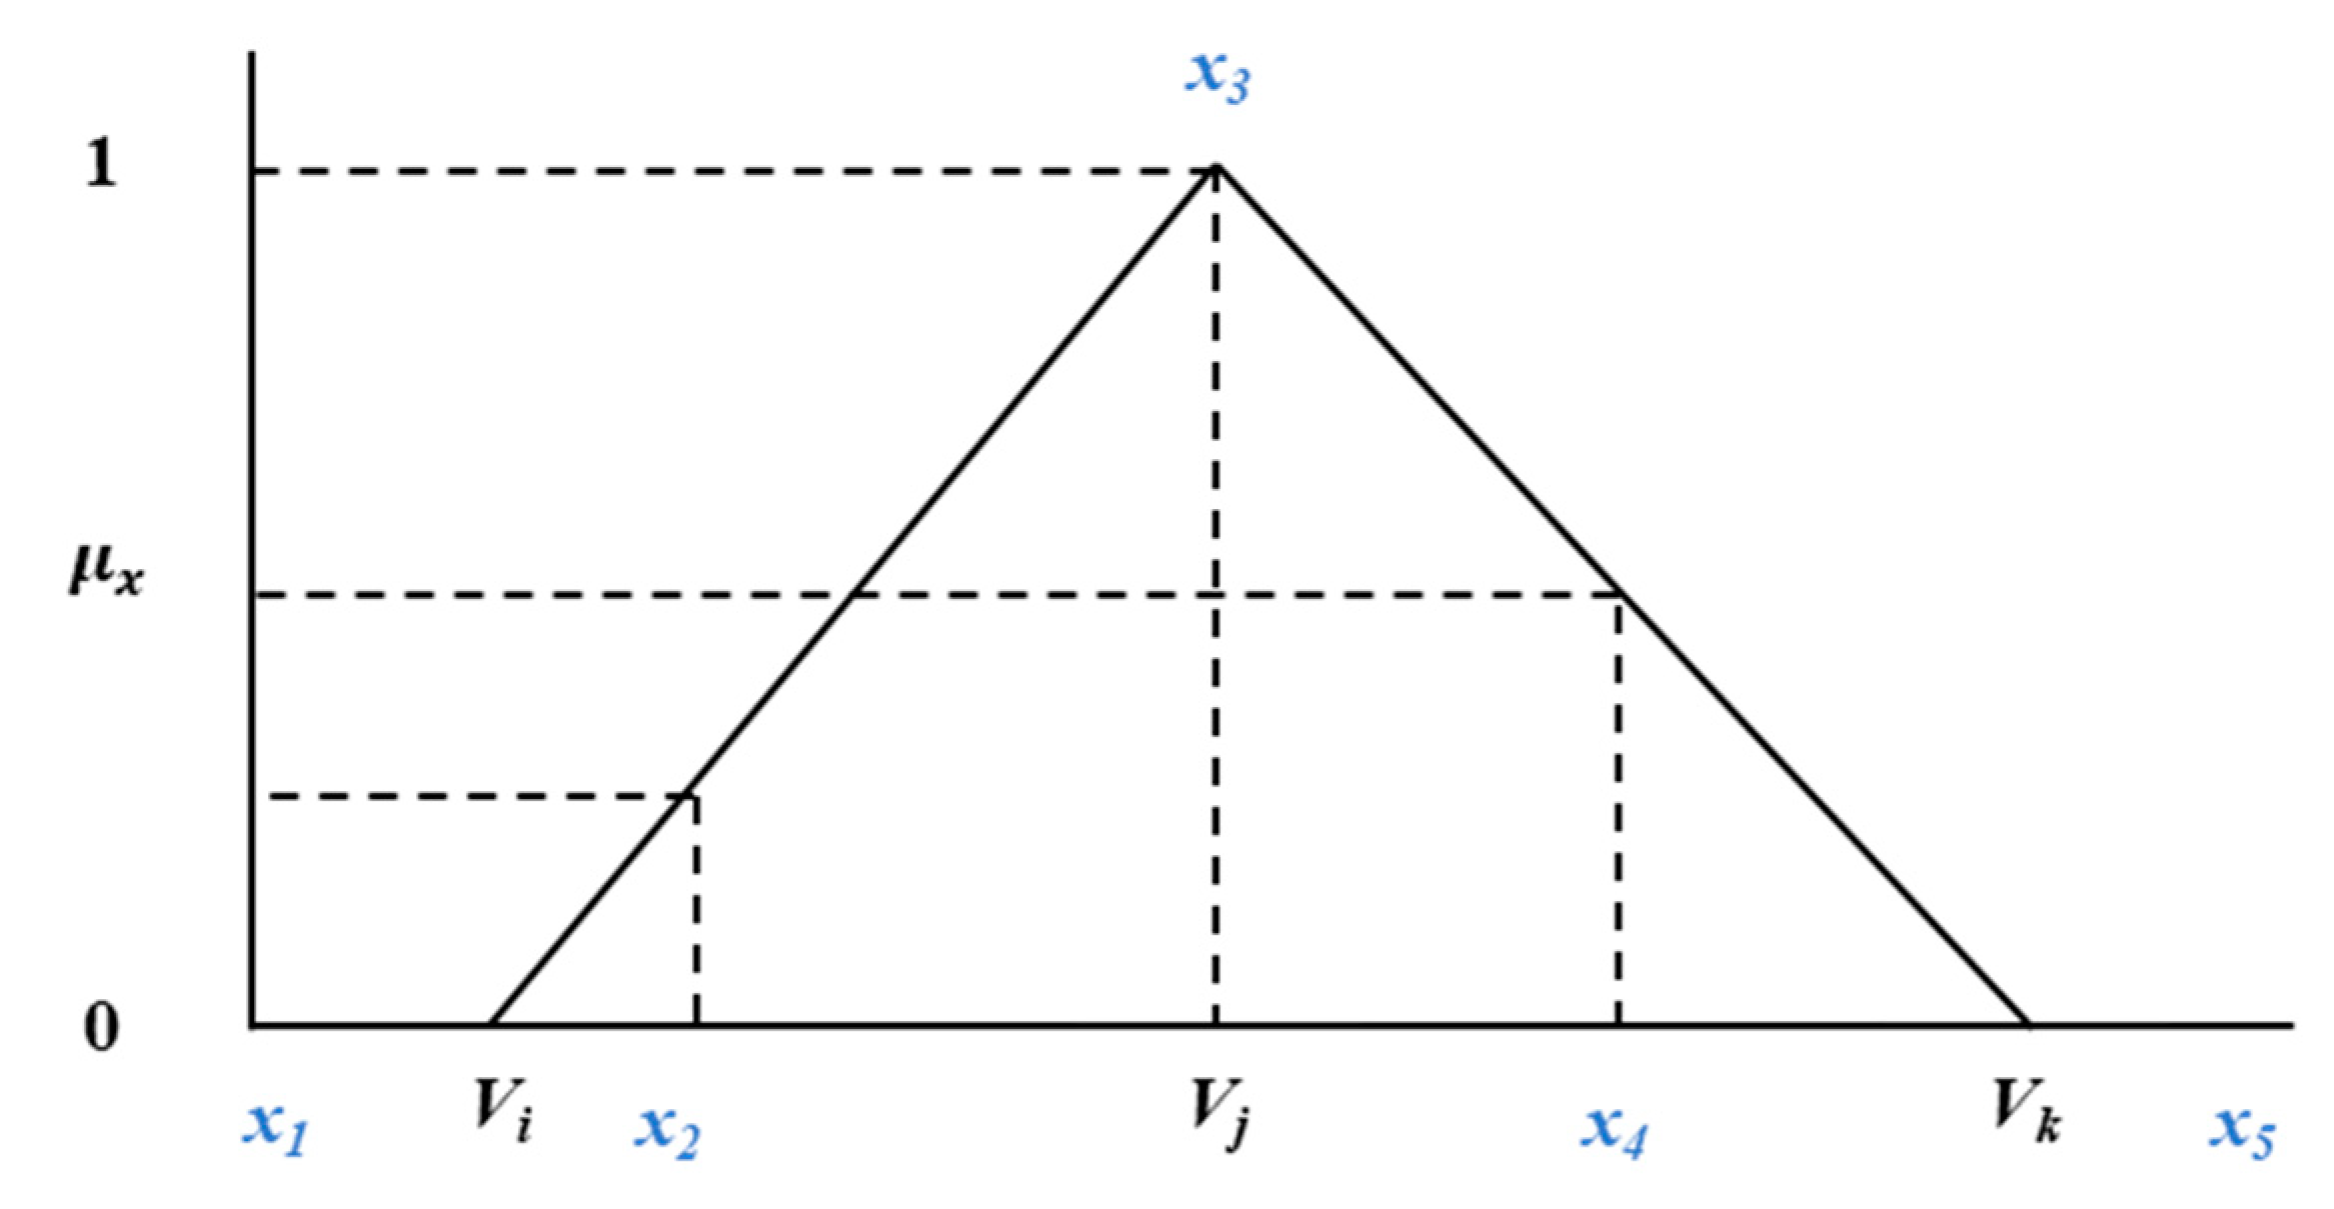
Furthermore, the fuzzification process of the condition, age and rate of deterioration parameters of the selected system was done using the following generic formula that can be adjusted to fit any number of subsets included in a triangular fuzzy set to derive their respective membership functions.
An illustration of the previous equations is presented in Figure 2 and provides a guide to calculate the membership function for different possible positions of falling within the range of a single subset.
The succeeding step after establishing the parameters, their respective membership functions as well as the governing rules, was the design of the Markov model that was used in the deterioration prediction of the future states of the system being studied. A fuzzy deterioration rate for a given system was arrived at using the previously demonstrated procedure, and was consequently defuzzied to be used in further stages of the developed model. The defuzzification methodology implemented in this study was the Mamdani inference approach where the y coordinate of the center of gravity (COG) of the area under a fuzzy set B’ was calculated using Equation (3) to obtain a de-fuzzified crisp output d [33].
where N is the total number of elements y_i in the continuous domain Y; Y needs to be discretized to allow for the calculation of the COG.
The output derived from the previously illustrated framework was fed as an initiation input to the Markovian model that was further calibrated and modified as per the procedure explained in Section 3.2.
3.2. Markovian Deterioration Prediction Model
The developmental stages of the Markov-based model and the corresponding equations used as part of this study to model and estimate the transition of a system from one condition state to a lower one within a specific time frame is elaborated in this section.
In general, according to [28], a Markov chain is a stochastic process allowing for the observation of preset variables at certain points in time, permitting the monitoring of the change in the system states from one time to another. The probability P of a system transitioning from one state m to another state n should conform to the following two conditions:
where m is the initial condition state at time t; n is the final condition state at t + 1.
On another note, the Markovian property of the conditional transition probability of a system can be given as Equation (5).
where P represents the transition probability at any point in time.
In the initial stage of the model development process, historical datasets from 48 hospital building facilities from the province of Alberta were collected and the data points and instances representing the chosen system, which was the oxygen gas piping and supply system, were identified. Eighty percent of the datasets collected were utilized for the design and structuring of the proposed model, while the remaining twenty percent were used for model validation purposes. Two cycles of inspection reports were included in this model as it was suggested by [28] that two is the minimum number of cycles required to derive a reliable and sound Markovian deterioration estimate. After that, uncensored events in the inspection reports were selected as they demonstrate the transition of the system from one state to another and this is the principal tool to build a robust and relatable Markov deterioration prediction model. Data points were then filtered and grouped according to the age of systems since installation to facilitate the further process of developing the Markovian transition matrices. The filtering process included the removal of any records showing a renewal activity conducted on building components, as well as the exclusion of any progressive record showing an improvement in the condition as this defies the deterioration theory required for developing and executing the model. The initial state, transition probabilities and final states were calculated in the form of the percentages of systems from the overall number of systems included in every combined group in this study.
A theoretical example to demonstrate the derivation of the percentages used in the Markovian model is given below. Given a set of 50 system inspection records for a certain year and with an age group of 25 years since installation, 15 of the systems were in an excellent condition state as per the visual inspection reports, 12 were in a good condition state, 10 were in an acceptable condition state, 8 were in a marginal condition state, 3 were in a poor condition state and 2 were in a critical condition state. This will end up in the initial condition state vector shown in Table 1.
The following step after calculating the initial state percentages, was the calculation of the final percentages of systems in each condition state as per the transition probabilities derived from the fuzzy-based deterioration model. In this study, it was assumed that systems can only experience a single state transition per year. This can be represented by the following a × a transition probability matrix from an initial condition at time i to a final condition state at time j = I + 1, given the total of a different condition state.
The multiplication of the initial state vector by the transition probability matrix resulted in a “Calculated” final condition state vector Cscal representing the percentage of systems in every given final condition state. This allowed for the consequent calculation of a final condition rating for each of the systems being studied on a scale from 10–100 representing the observed condition rating of the systems at the final available inspection.
3.3. Genetic Algorithm Optimization
The following stage in the developed framework was the calibration process in which the transition probabilities from each of the possible initial states to a succeeding lower state were optimized by means of a genetic algorithm (GA) in order to reflect and model the real deterioration occurring in hospital buildings. The GA was mainly chosen for its demonstrated capabilities in the process of global searching for a population of solutions as opposed to single solution algorithms and methodologies [34]. To begin with, the GA is a heuristic that was first established as a valid optimization method by [35]. It adopts and replicates the process of natural biological evolution. Evolution mainly adopts natural selection and mutation processes to advance a population of children that is more fit and more suited to the environment they are in than the parent generation. This process starts with developing an initial population that have variant genetic traits, where the better fitting members are more likely to survive and reproduce than the rest of candidate members. A member reproduction is the process of passing over the genetic traits of the parent member to their respective children. These traits mainly possess a randomized crossover of each of the parent’s traits. This is mainly followed by the preferential passing of the traits of the better suited and more fit members to their subsequent generation. The traits passed to children can some other times take forms that were not present in any of the parent generation, this is called the process of random mutation that allows the population of children to have random traits to eventually produce a fitter population that keeps evolving over numerous iterations of generations [36].
The problem presented in this paper aims at minimizing the mean absolute error between the “Calculated” final overall condition rating for hospital building assets as per the previously described procedure, and the “Actual” final condition rating experienced in hospital buildings after a certain deterioration period as shown in Equations (7) and (8).
where Cr can take two forms: either CrCal or CrAct that represent the overall “Calculated” or “Actual” condition ratings for oxygen gas systems (OGS) in hospital buildings; i is the counter for the condition states available evaluated on a scale from excellent with a value of 6 to critical with a value of 1; Csi is the percentage of the OGS in condition state i and it can be represented by the following parameters, either CsiCal or CsiAct, according to the method of condition rating collection and retrieval; CsiTR is the respective value for state i in the transpose vector of condition ratings, ranging from excellent with a value of 100 to critical with a value of 10.
where CrCal and CrAct are the values obtained from the two previous equations and are representatives of a final evaluation of the overall OGS condition; T is the total number of condition rating observations filtered for model training; MAE is the mean absolute error between each set of two values as described previously, demonstrating the efficiency of the developed framework in relation to the actual datasets utilized for model training purposes.
As per the formulated problem, the “crossover” and “mutation” processes represent the change of transition probabilities from one state to a lower state, either starting from the initial values derived from the aforementioned procedure, or through a wider expansion of the search process for candidate solutions, which are not part of the initially suggested values in order to arrive at a more globally optimal solution. A mix between both processes is required to avoid the sole dependence on one of them as this can impose drawbacks to the searching and optimization procedures. For example, solutions (or children) solely based on mutation would perform an exhaustive search, producing a less efficient algorithm as it randomly changes solutions that prove fit and therefore lack heredity. On the other hand, children solely derived from crossovers can often get trapped in a locally optimal solution as crossovers lack the ability to produce more variant genes that were not present in the original population. Therefore, a selection function was utilized as part of the genetic algorithm optimization process in order to control the production of a suitable mix between crossover and mutation functions applied to the parent population. Repeatedly, this process ends up producing a population of fitter solutions progressing towards an optimal solution. The algorithm eventually terminates when a termination criterion is fulfilled, this can be after reaching a certain number of trials or generations, or after a certain computation time because reaching the optimal solution cannot be guaranteed. Upon completion of the optimization process, the variable r presented in the fuzzy-based framework can be re-evaluated accordingly to be used for further prediction and calibration tasks.
3.4. Model Performance Evaluation
Despite the utilization of real hospital datasets within the design, which trained and calibrated the proposed deterioration prediction model, the framework had to be compared with well-established deterioration modeling techniques that have been extensively used to predict and model the degradation occurring within assets and their underlying components for numerous decades. Therefore, this section describes the verification procedure formulated in order to validate the proposed model and prove its capability of accurately predicting the future condition of hospital building assets by means of a comparison between the results obtained by employing a Weibull distribution function-based deterioration model with the results attained by the application of the proposed model. As previously outlined, 20% of the datasets collected from hospital buildings’ inspection reports were put aside in order to be used for verification and validation purposes, and the detailed procedure that followed is explained in this section.
The cumulative degradation distribution of the oxygen gas systems in hospital buildings based on the Weibull function was calculated according to Equation (9).
where is the scale parameter of the distribution function; is the shape parameter. The values assumed for and were 3.92 and 16.24, respectively [37].
Three performance indicators were used to measure the efficiency of the proposed model against the Weibull-based model, namely: the mean absolute error (mae), root-mean square error (RMSE), and mean absolute percentage error (MAPE). The three aforementioned tests were performed by means of employing the following Equations (10)–(12).
where Ai is an indicator for the actual condition value observable for component i within the hospital inspection process; Ci is an indicator for the predicted value as per the prediction methodology used, either the Weibull-based distribution function, or the proposed model for component i; N is the total number of observations available for condition values of the oxygen gas systems within different hospitals that were filtered and specified for model validation purposes.
4. Results
As previously discussed in Section 3.2, the data collected from 48 hospital buildings and healthcare facilities were filtered and screened for similar age groups and condition levels. Discontinued and replaced systems’ records were removed from the database as they can possibly impose misleading decisions. Upon filtering, a total of 112 systems were identified as having instances representing their respective installation date, first inspection condition level, second inspection condition level along with the years they were inspected in. In total, 90 of the records were used for the model training process, while the rest of the data collected were used for further verification and model performance validation testing.
The percentages of the systems were calculated to extract the initial condition and final condition vectors as per the predefined methodology. The systems’ age and condition levels were fuzzified as formerly explained and the deterioration rates were identified accordingly. These deterioration rates were fed into the Markov model as initial transition probabilities from higher to lower condition states to be further optimized as per the data collected for calibration purposes. Separate matrices were initiated for every age group available for the oxygen gas systems to allow for a distinction between their behavioral changes demonstrated by the transition probabilities of the system condition levels from each initial condition level to the next lower condition.
4.1. Fuzzy-Based Model Sensitivity Analysis
For the purpose of evaluating the robustness of the developed fuzzy-based decision making model that determines the future condition of a hospital building component taking into account its relative age, and its last observed condition rating into consideration, a sensitivity analysis was carried out to measure the fluctuation pertaining to the output parameter (deterioration rate) accompanying the modification of one of the input parameters (condition and age) which in turn evaluates the robustness of the develop framework. Fuzzy rules have been left to monitor the effect of the sole change of the membership functions associated with a single input parameter while the rest of the model-defining parameters remain unchanged. Accordingly, the following two figures were generated to show the variation of the component’s estimated life expectancy with the incrementation of a single input parameter with +5, +10, +15, and −5, −10, and −15%, respectively. Figure 3 shows the output change corresponding to incrementing the age input, while the rest of the model remain unaltered.
As illustrated in the previous graph in Figure 3, it can be noted that the positive and negative incremental changes in the fuzzy sets representing the membership functions of the age parameter of the hospital building component result in very little variation in the overall transition curve representing the building system moving from one condition state to a lower one. This also matches the initial hypothesis made about the life expectancy of the oxygen gas system in a hospital building as demonstrated in the graph.
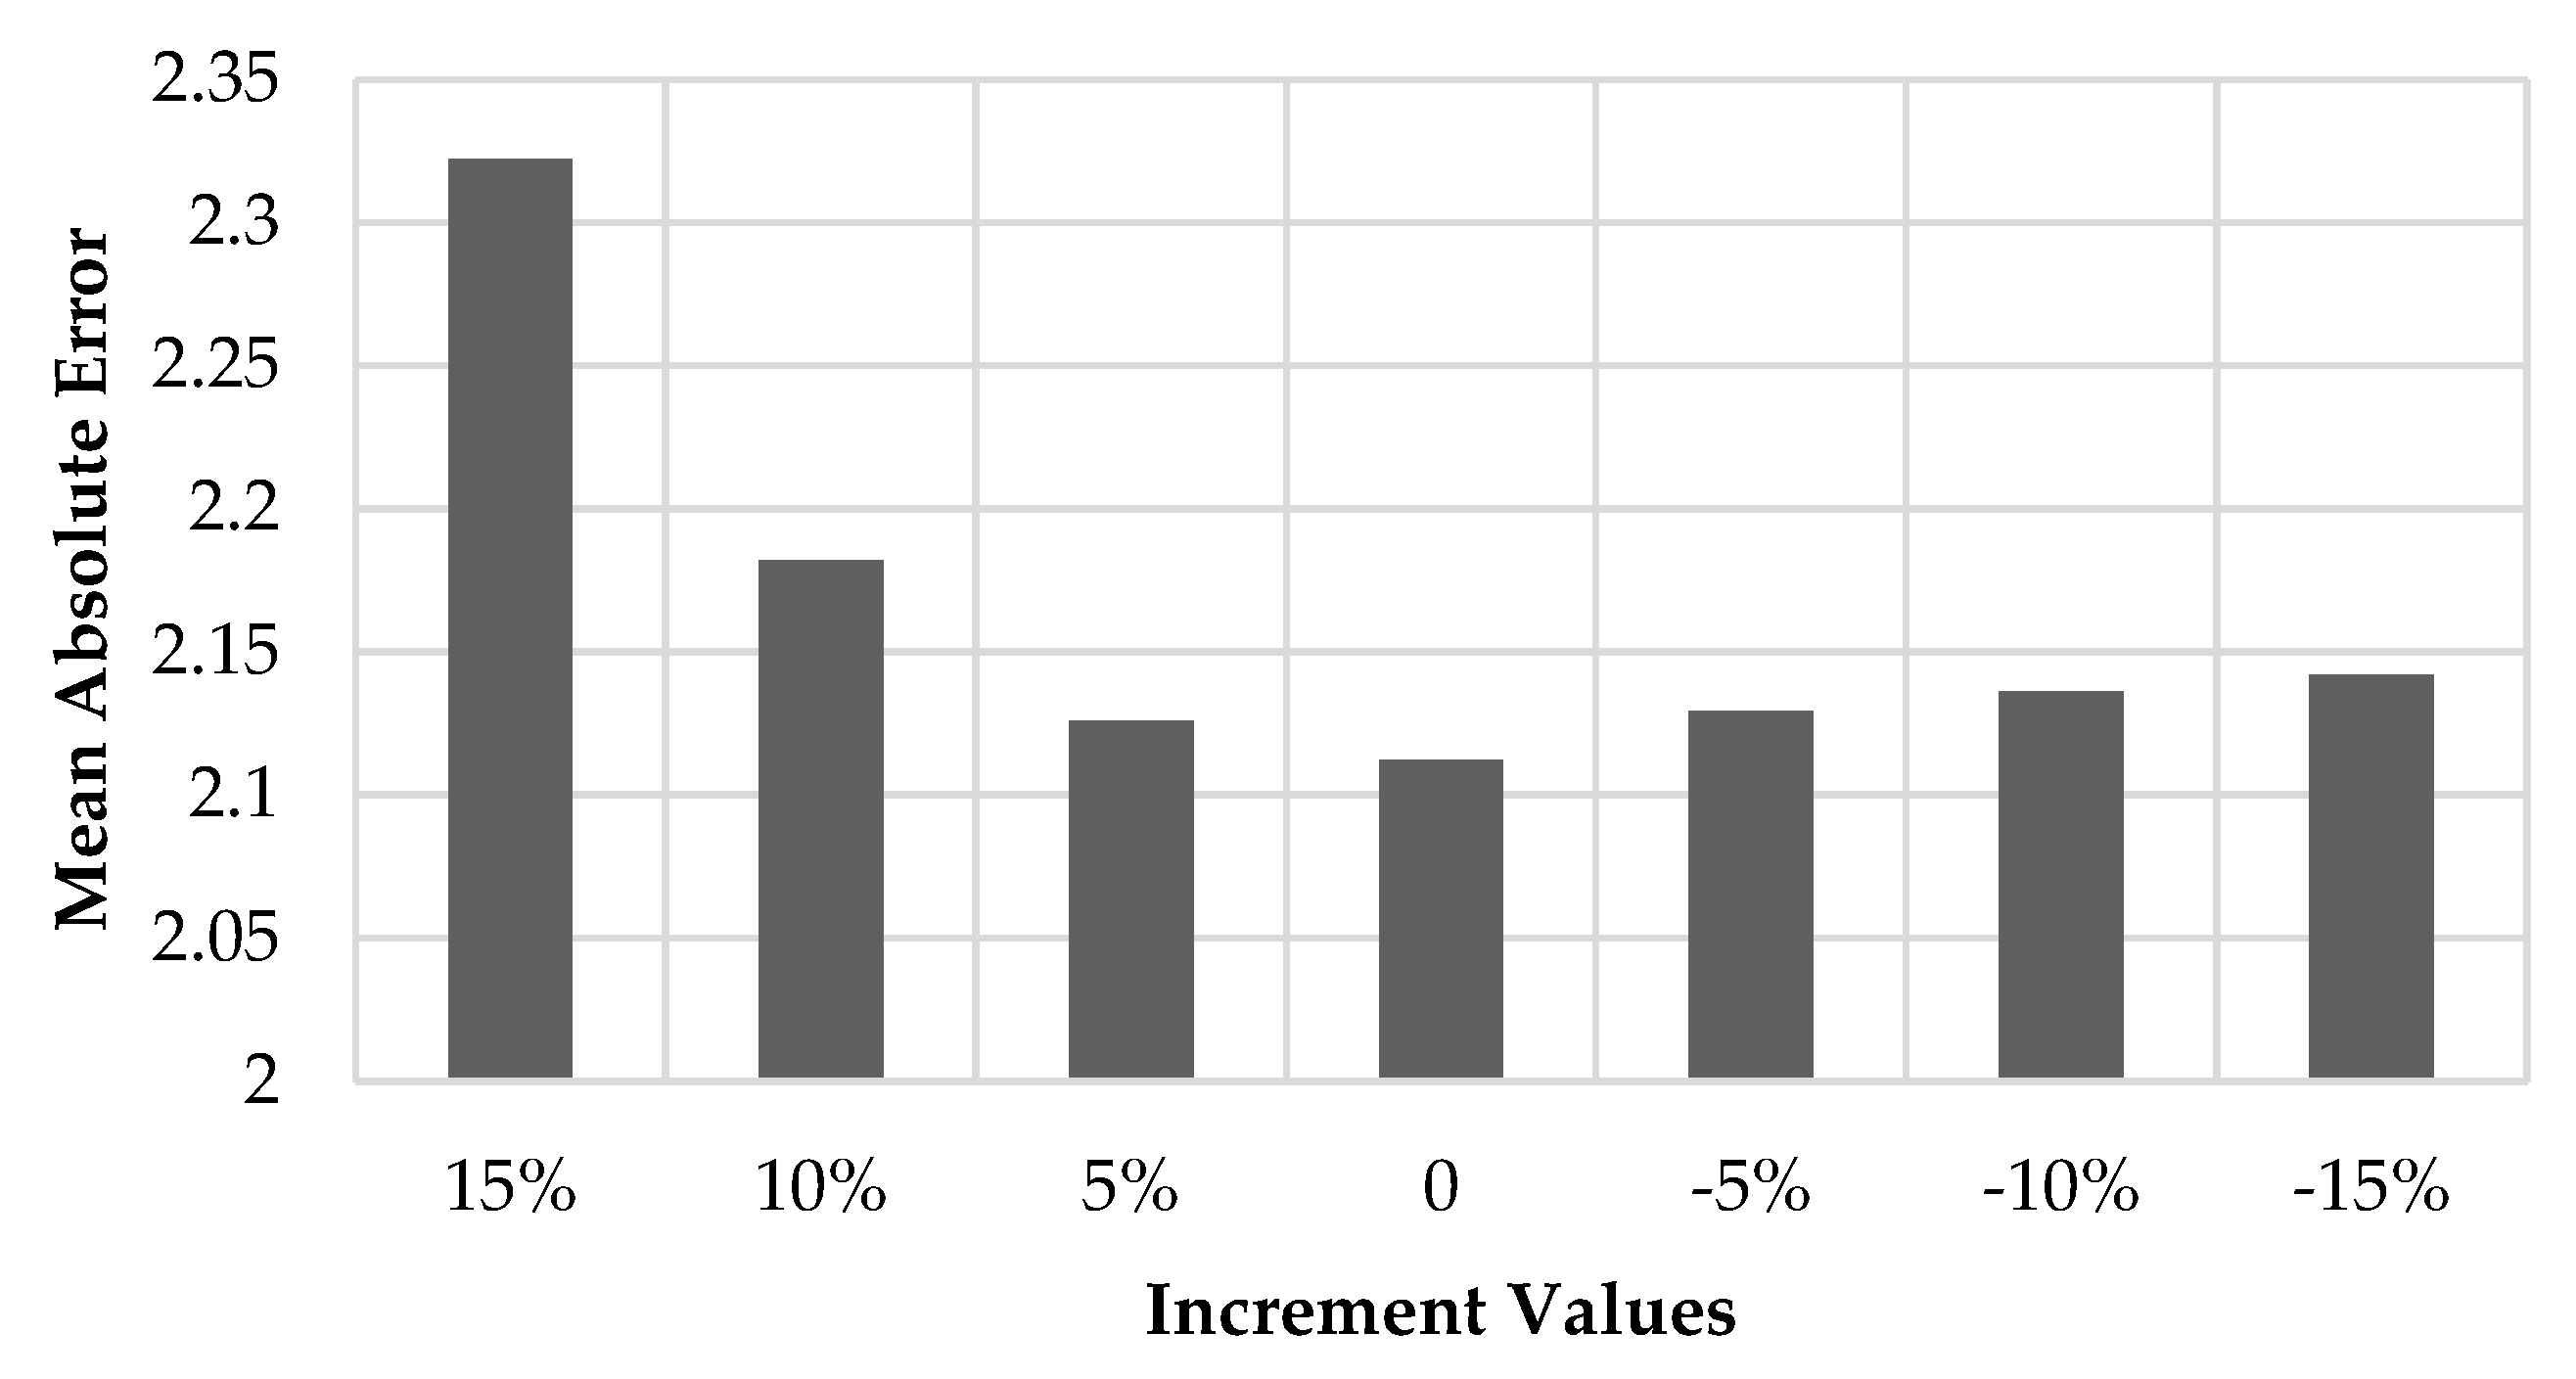
The mean absolute error (MAE) obtained from the comparison between every incremental value set applied to the age parameter, with the actual dataset of the hospital building inspection reports used for training purposes, can be visualized using the chart in Figure 4, where it can be noted that the minimum MAE is achieved by the base set that experienced no alteration nor incrementation in the age membership functions, contrarily, the maximum MAE value is obtained by the +15% incrementation set which validates the choice made for the membership functions of the age parameter.
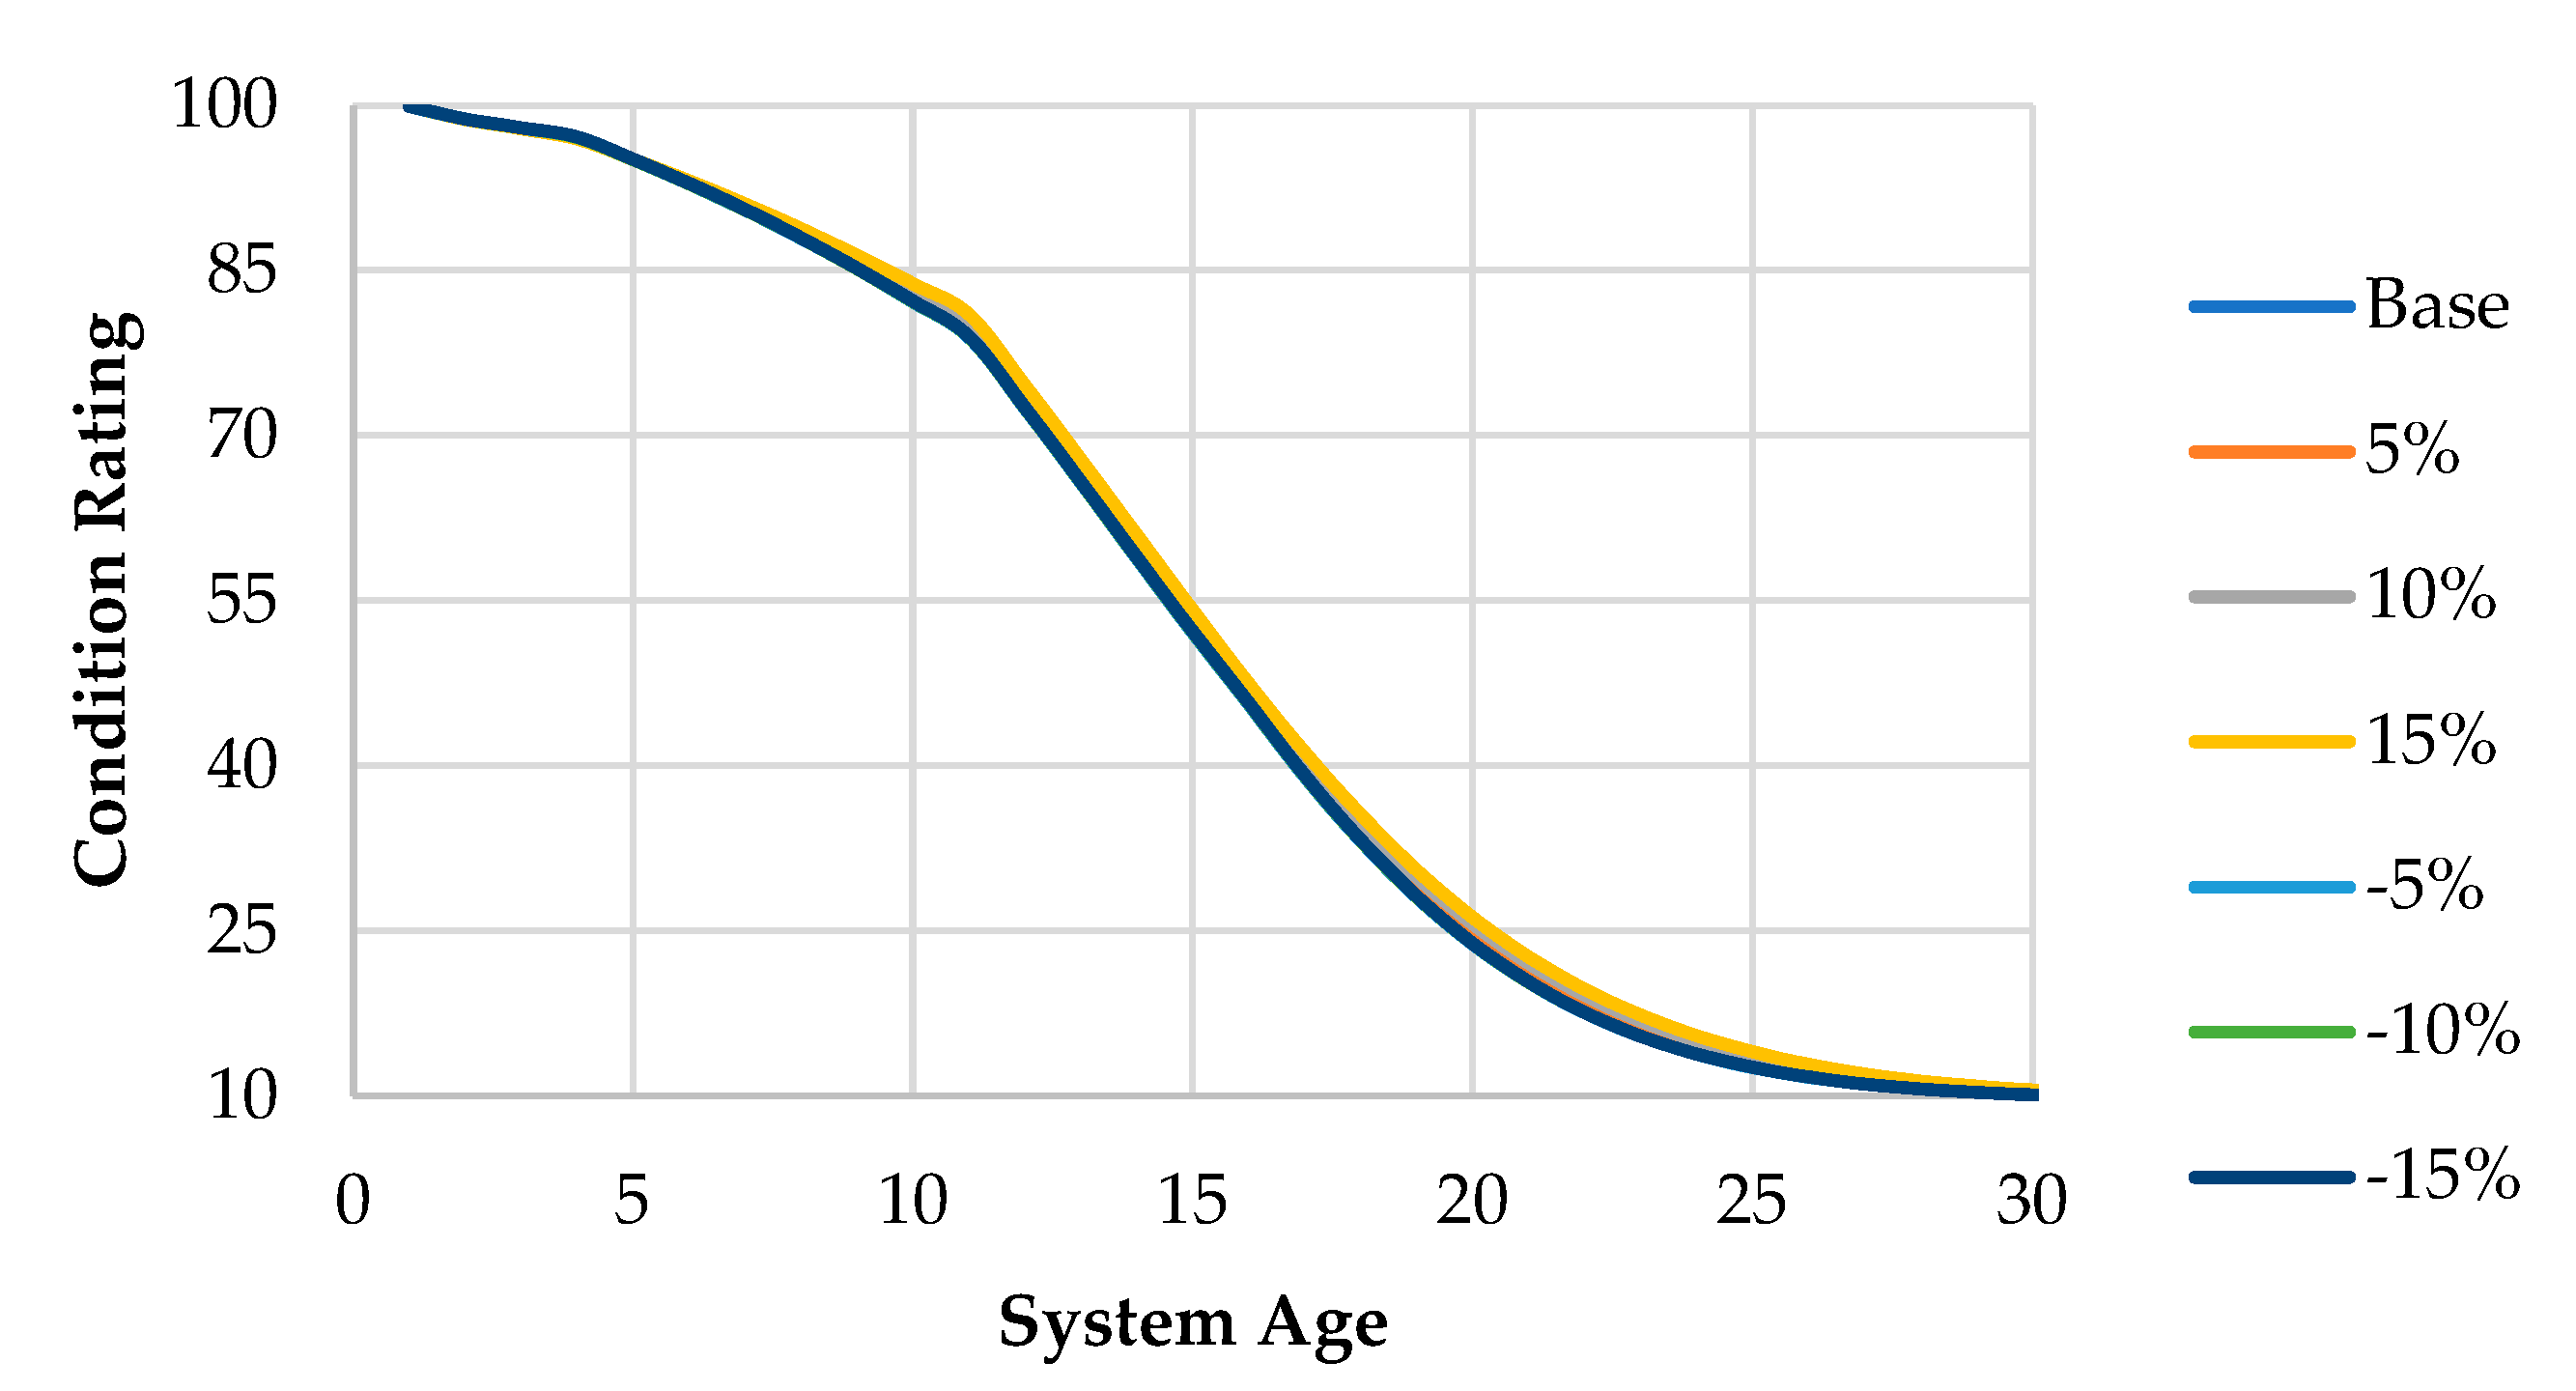
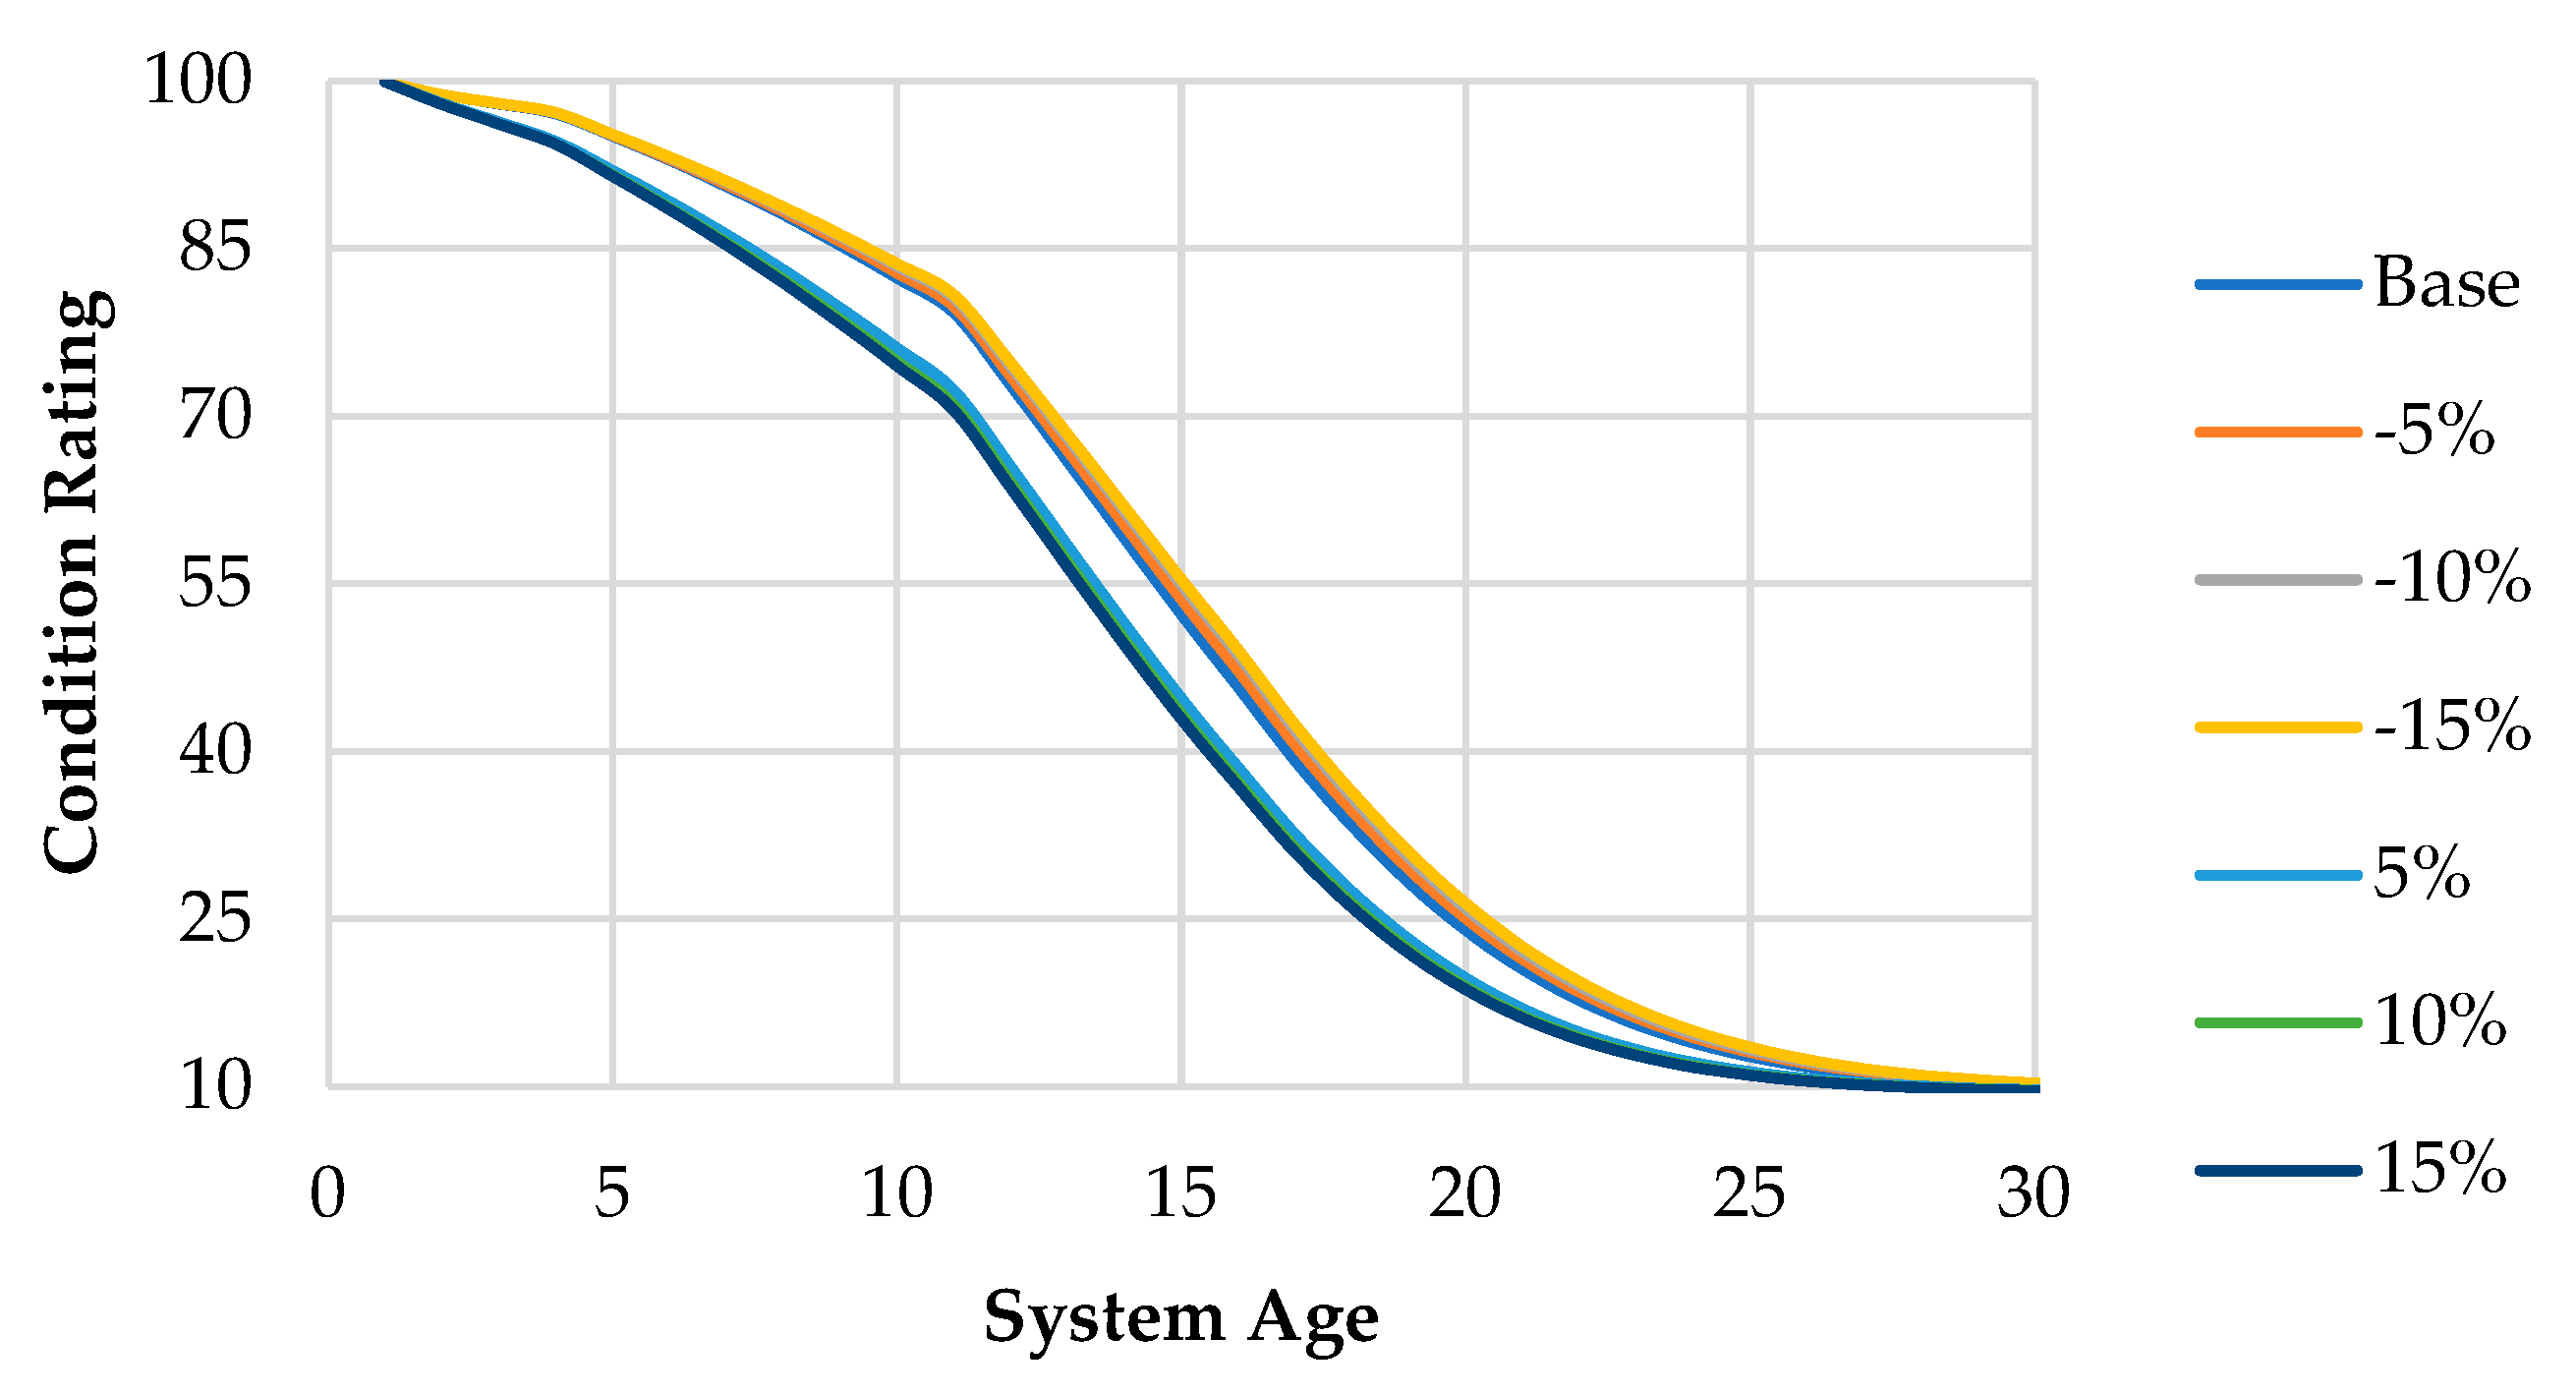
On the other hand, the life expectancy curves resulting from the positive and negative incremental changes done to the condition parameter only with the rest of the parameters as initially assumed is shown in Figure 5.
Figure 5 shows that the output parameter which is the deterioration rate of the hospital building components tend to exhibit a higher sensitivity to the condition parameter than the age parameter as depicted in the figure. The figure shows that the negative incremental changes tend to have no or minimal difference in the life expectancy of the oxygen gas systems, while the positive incremental changes tend to lower the overall component’s life expectancy as well as their respective condition ratings in different portions of their life cycle.
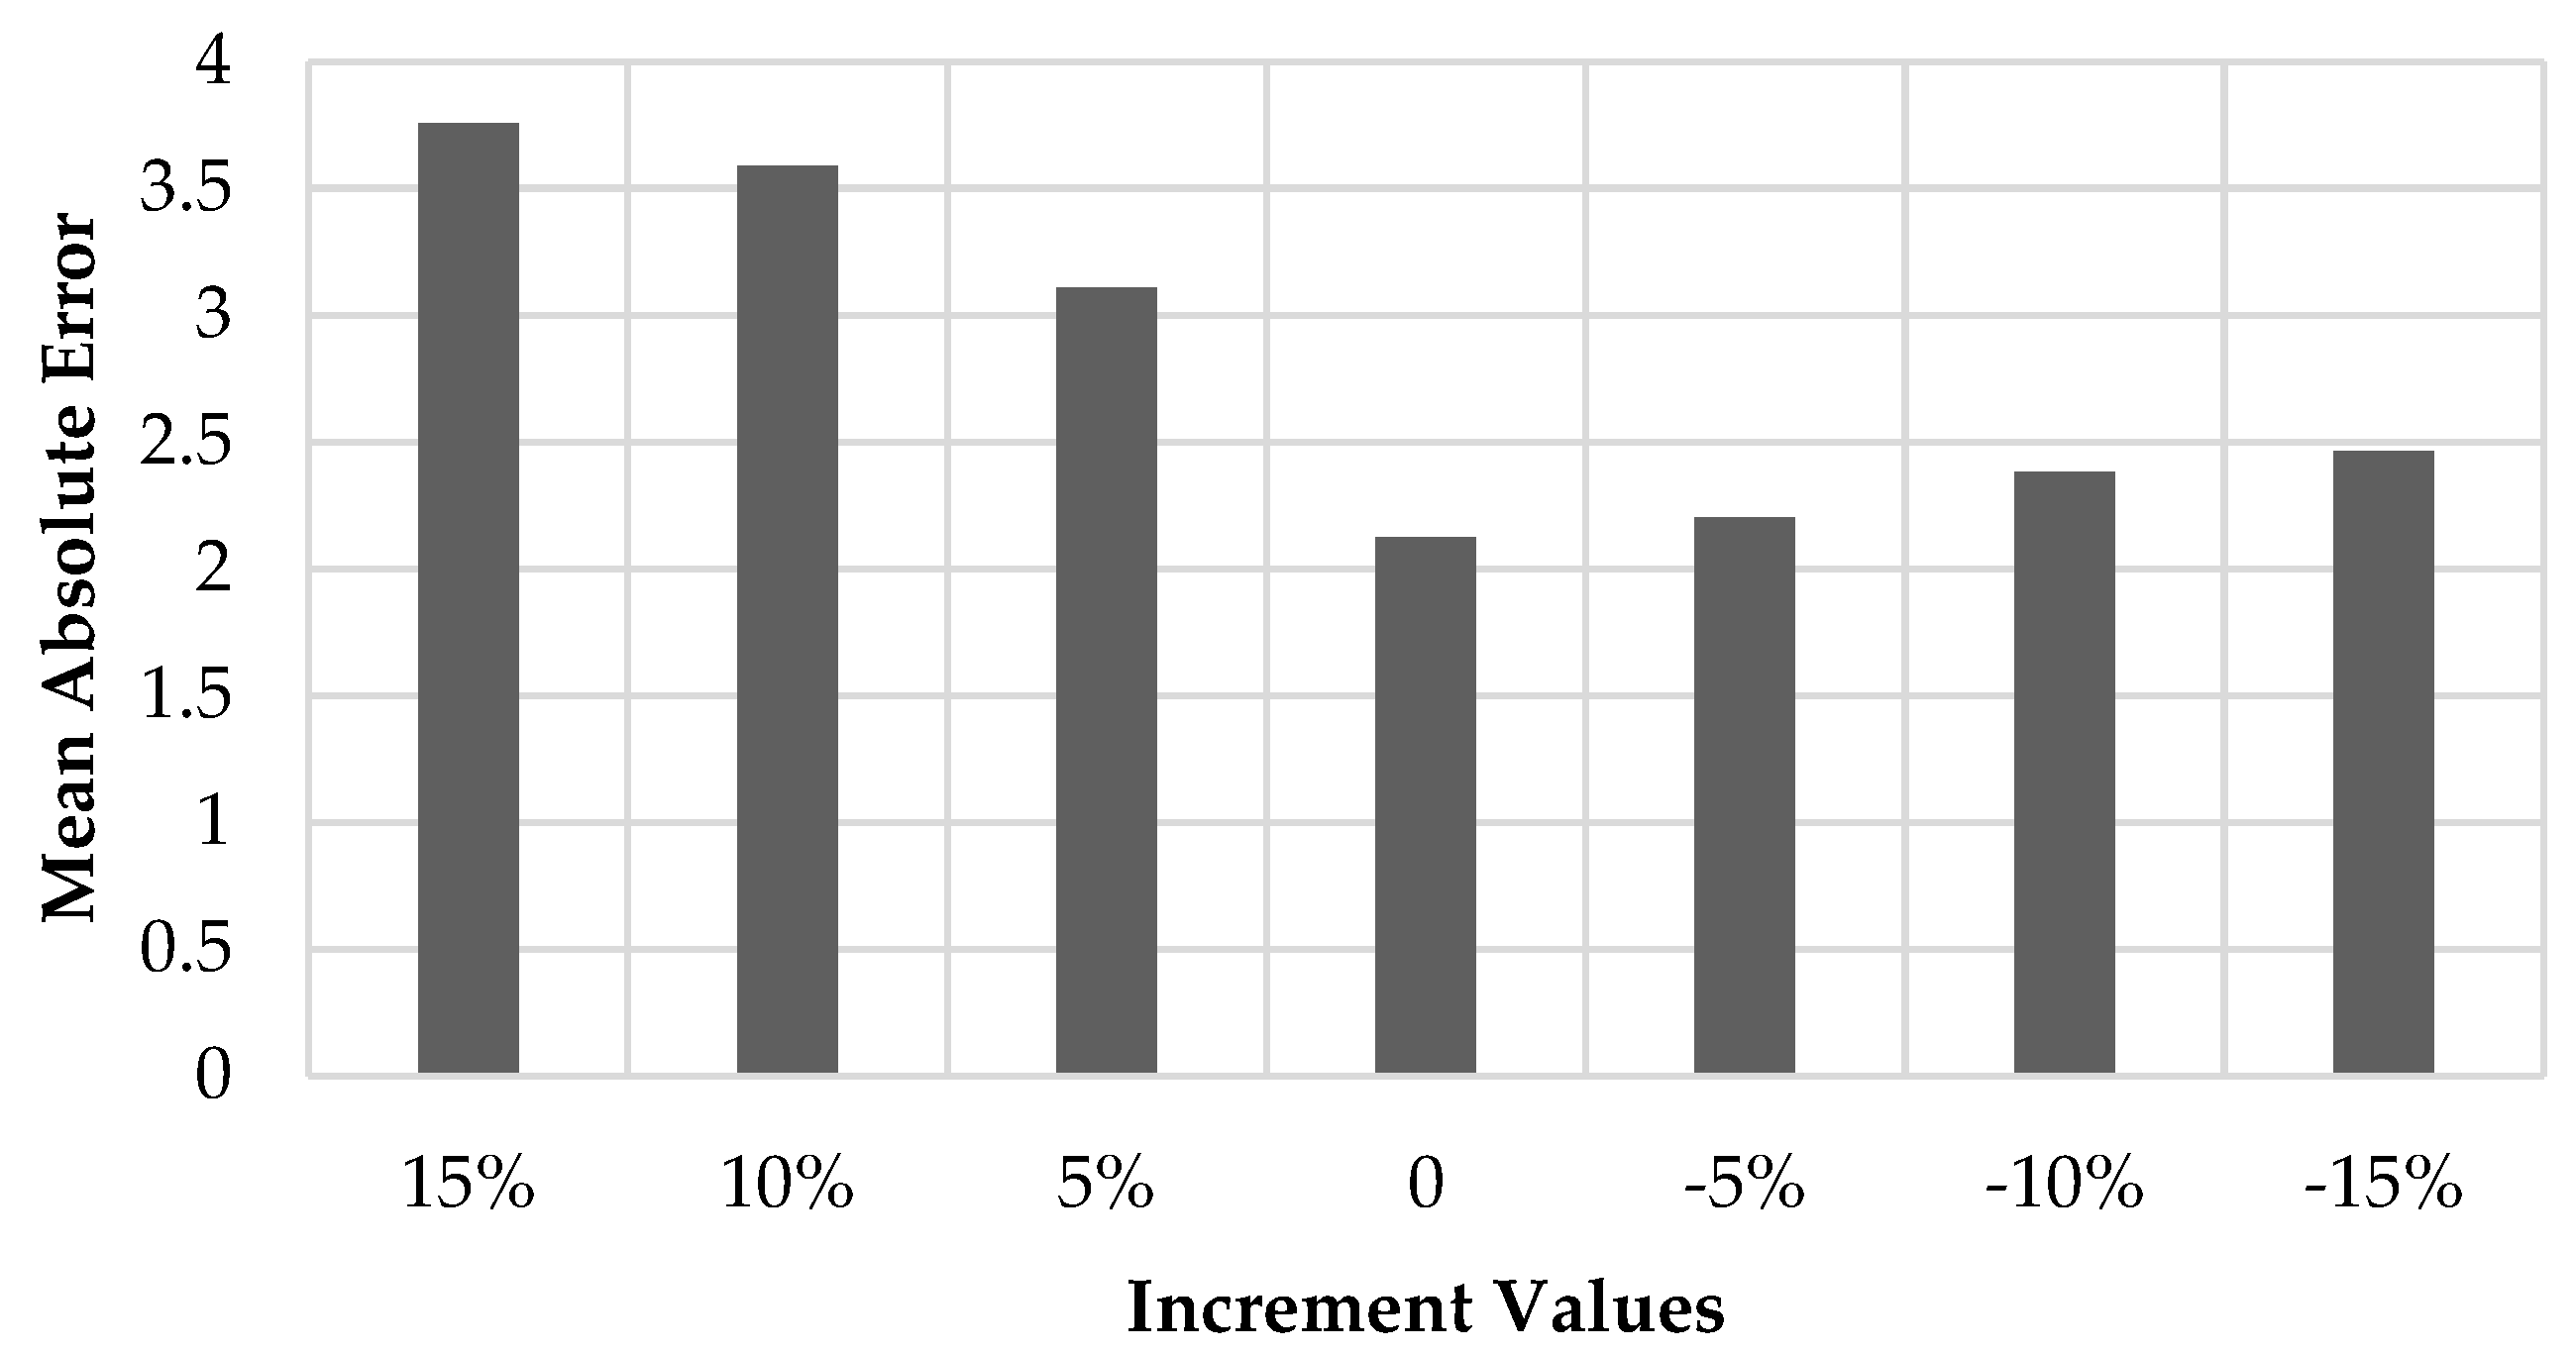
The previous conclusions can be better visualized using the following bar chart in Figure 6, that shows the results arrived at by the comparison between the condition incrementation datasets with the actual datasets from real hospital buildings, and the mean absolute error obtained by each incrementation set.
Figure 6 shows that the minimal MAE is obtained by the base initial hypothesis for the condition membership functions, while the highest MAE is associated with the positive 15% incrementation of the condition membership functions, which proves that the initial assumption is a better candidate for representing the datasets acquired from actual hospital building assets. However, the effect on the overall life expectancy of the oxygen gas systems obtained from the base assumption and the corresponding incrementations of +5, +10, +15% and −5, −10, −15% does not exceed the value of 0.07692 representing a change of less than 10% in the output resulting from the fuzzy-based analysis framework, which validates the robustness of the developed framework against variations and fluctuations arrived at by the alteration of any of the included parameters.
4.2. GA Optimization Results
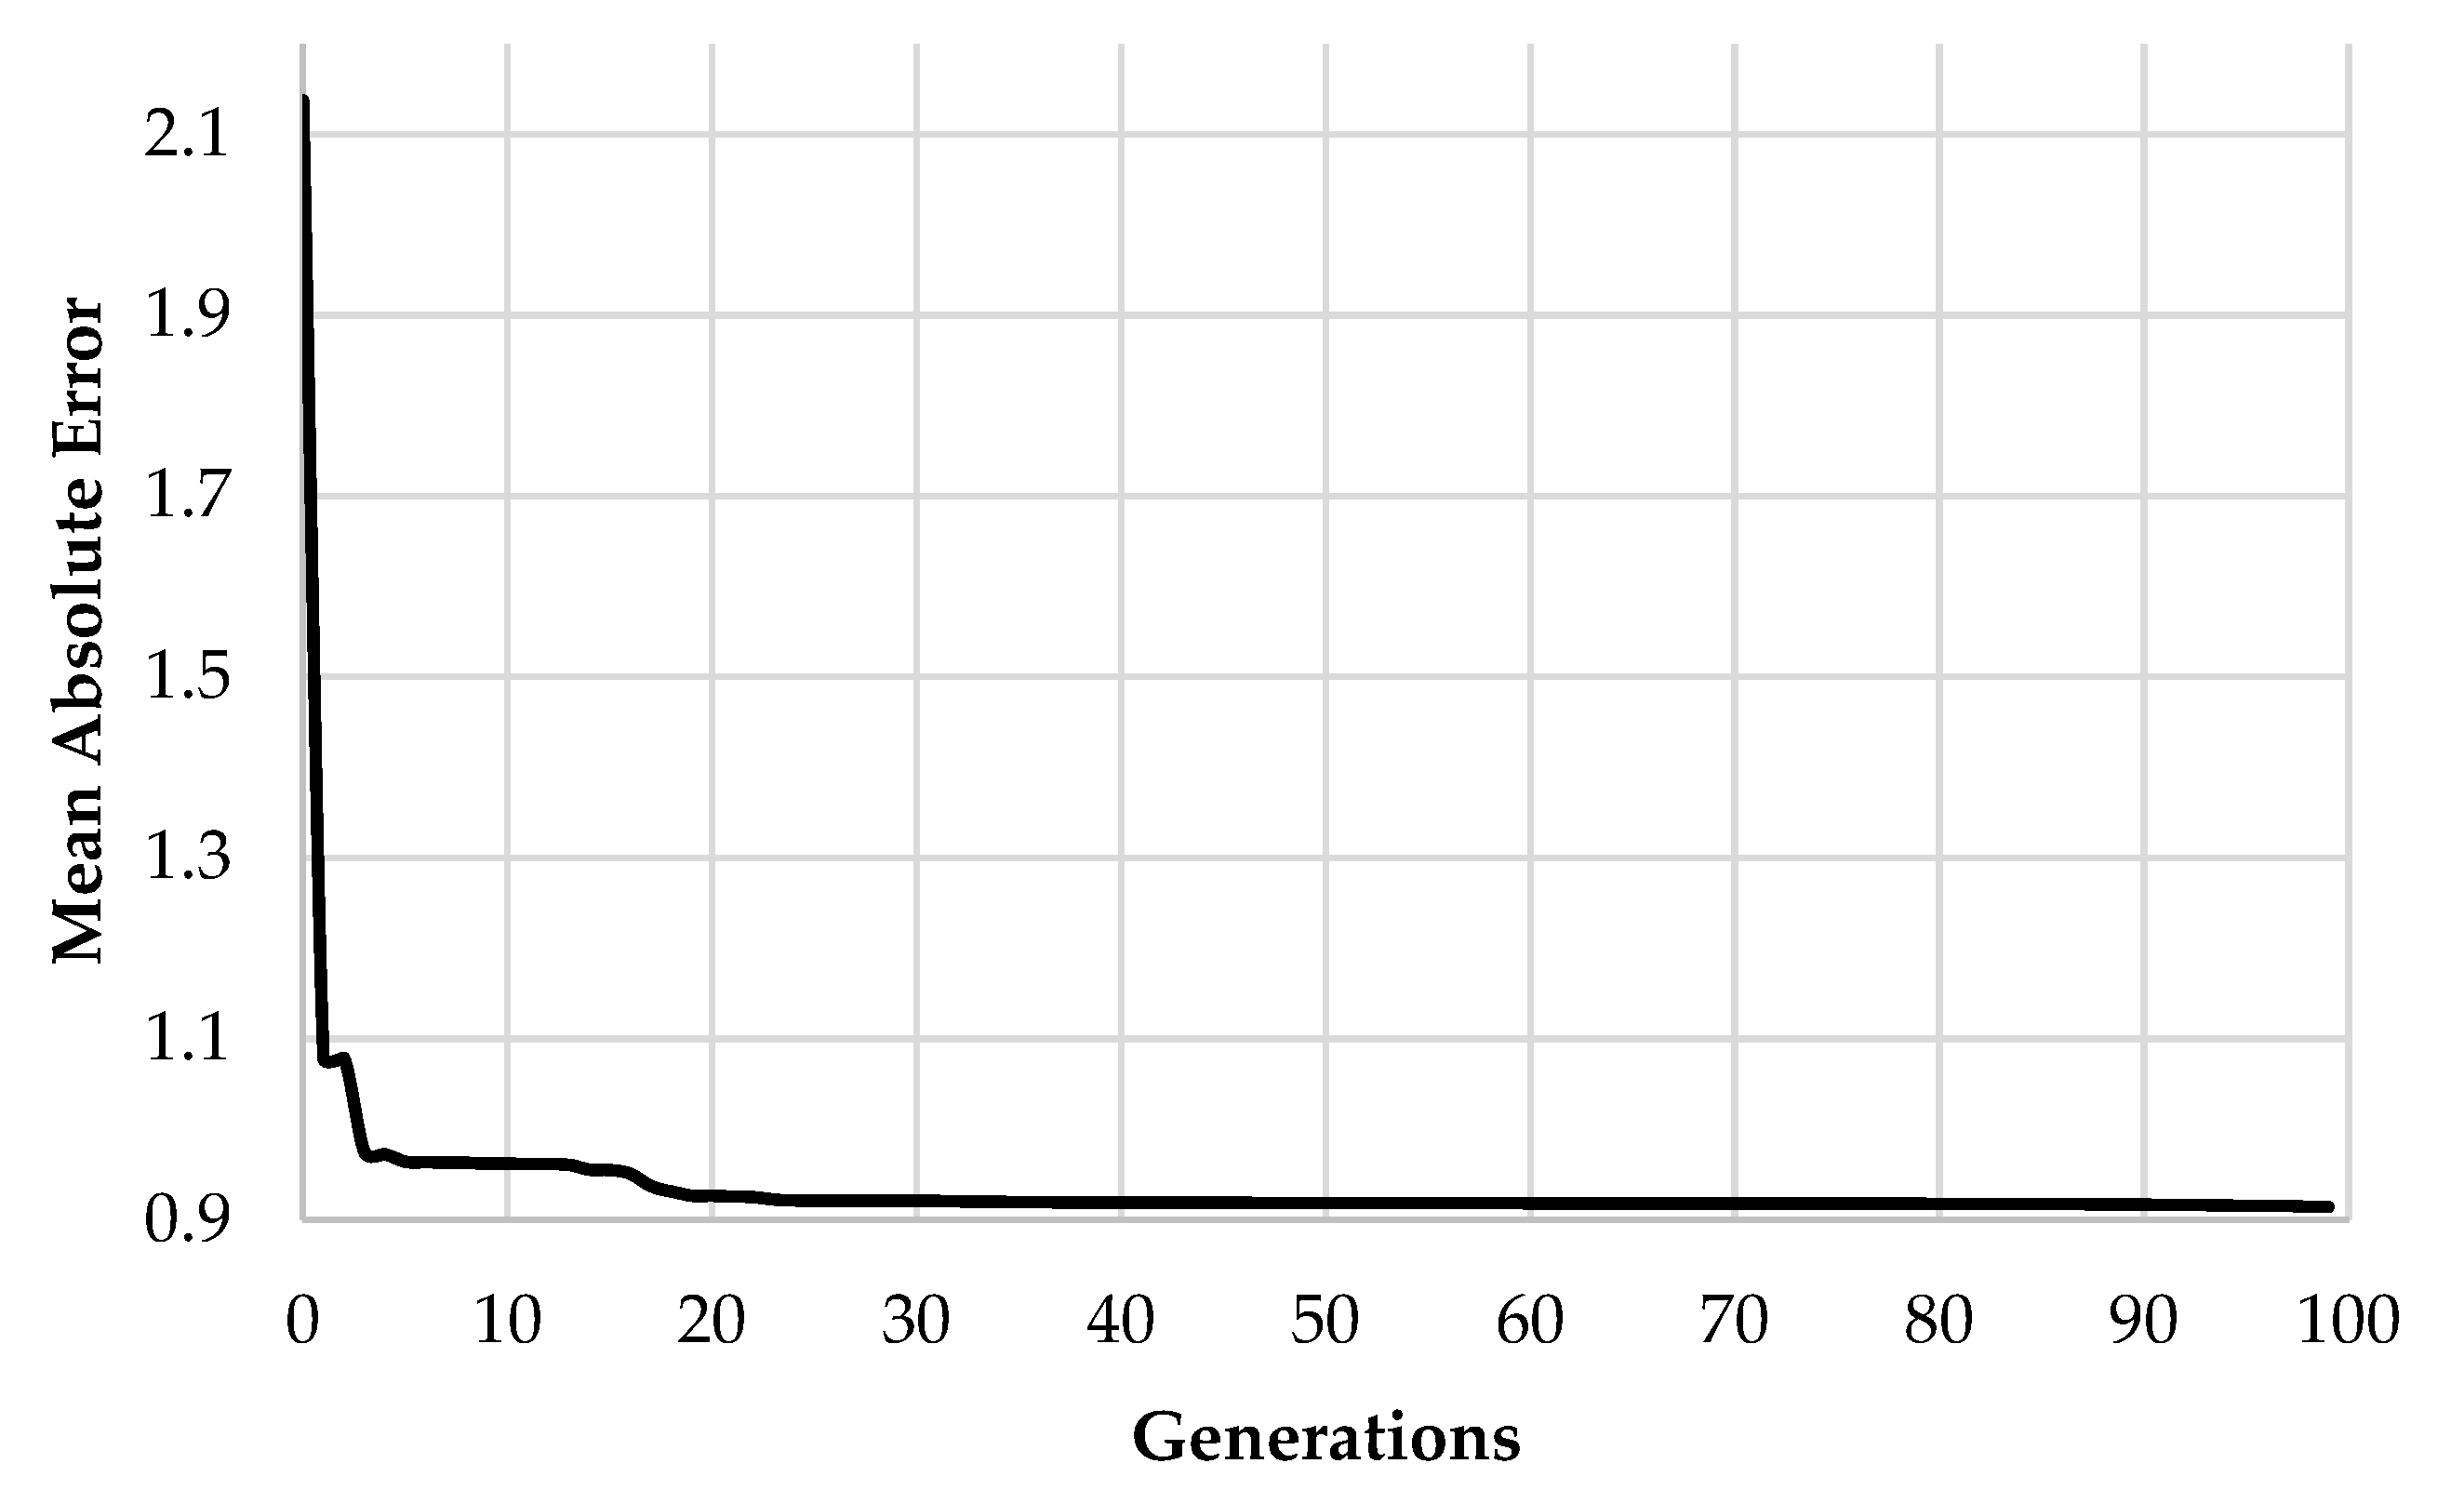
The following stage is where the optimization model comes in action, a genetic algorithm was employed in order to calibrate the deterioration rates used in the Markov decision model to form a near-optimal representation of the real situation within hospital building facilities. Being a metaheuristic methodology, the genetic algorithm was run five times in order to overcome its probable randomness, and the chosen run is the one having the lowest MAE. The parameters set for the genetic algorithm included an 0.1 mutation rate, 0.5 crossover rate, and the stopping condition is the actual convergence of the problem. The previous values were chosen as per experimentation conducted by [38] and [39], as these ratios represent the ranges of highly satisfactory model output results that provide a compromise between the runtime and prediction performance. The initial population size chosen was assumed to be 100, and generations were chosen to be 100 as well and the constraints were set within the dataset in order to govern the sum of the total percentages in each row in the Markov transition probability matrices to be equal to 100%, including an underlying set of non-negative real-numbered values bound between 0 and 100%. Figure 7 illustrates the convergence of the genetic algorithm optimization model with the objective of minimizing the MAE as per Equation (8).
As it can be noted from Figure 7, the minimum MAE derived from the genetic algorithm optimization model is equal to 0.909421. Upon observation of the preceding figure, it is noticeable that the developed model reaches a nearly stabilized state upon reaching the 20th generation, which proves and validates the capabilities of the developed model in terms of exploitation and exploration.
4.3. Overall Life Expectancy Results
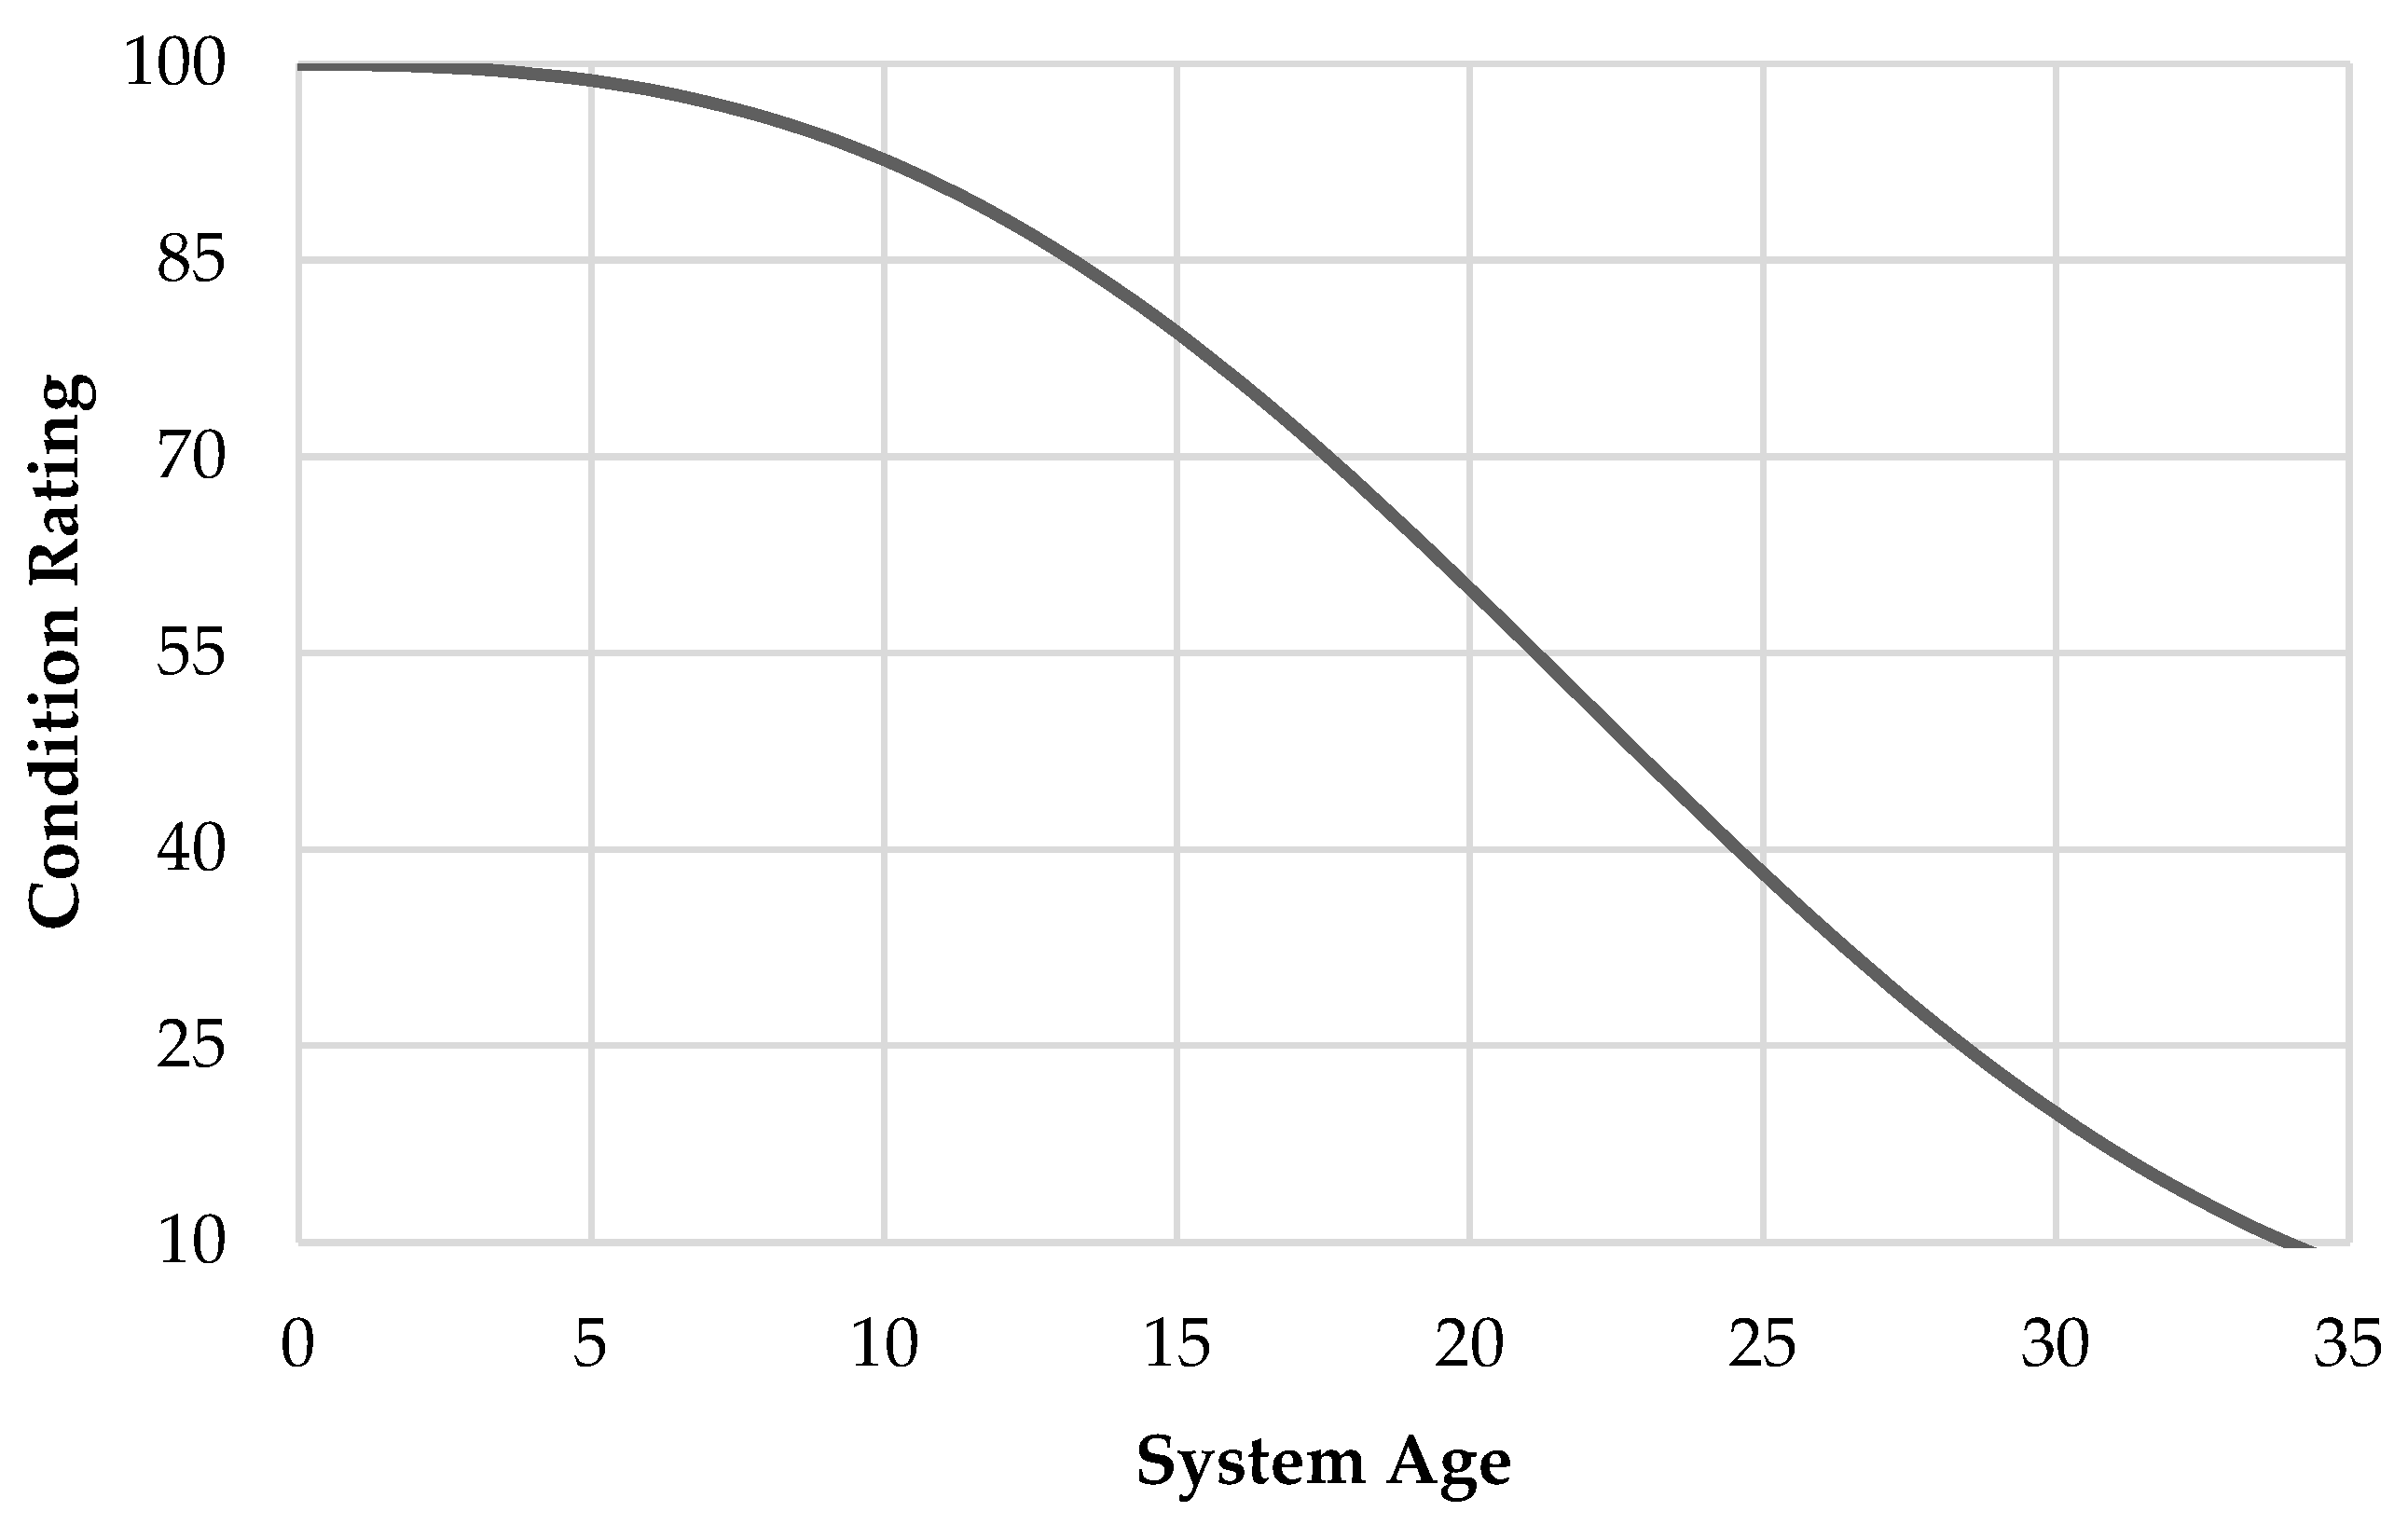
A Weibull distribution-based deterioration of the oxygen gas systems in a hospital building is demonstrated in Figure 8, showing the loss of the system’s reliability in terms of the condition rating of the system against the time spent from the system’s design life. As can be noted from Figure 8, the life of an oxygen gas system can almost reach 35 years of age since installation as per various manufacturer guidelines, however, this value cannot be considered an accurate estimate as it does not represent the actual useful life of the system tested and verified in previous studies such as [32].
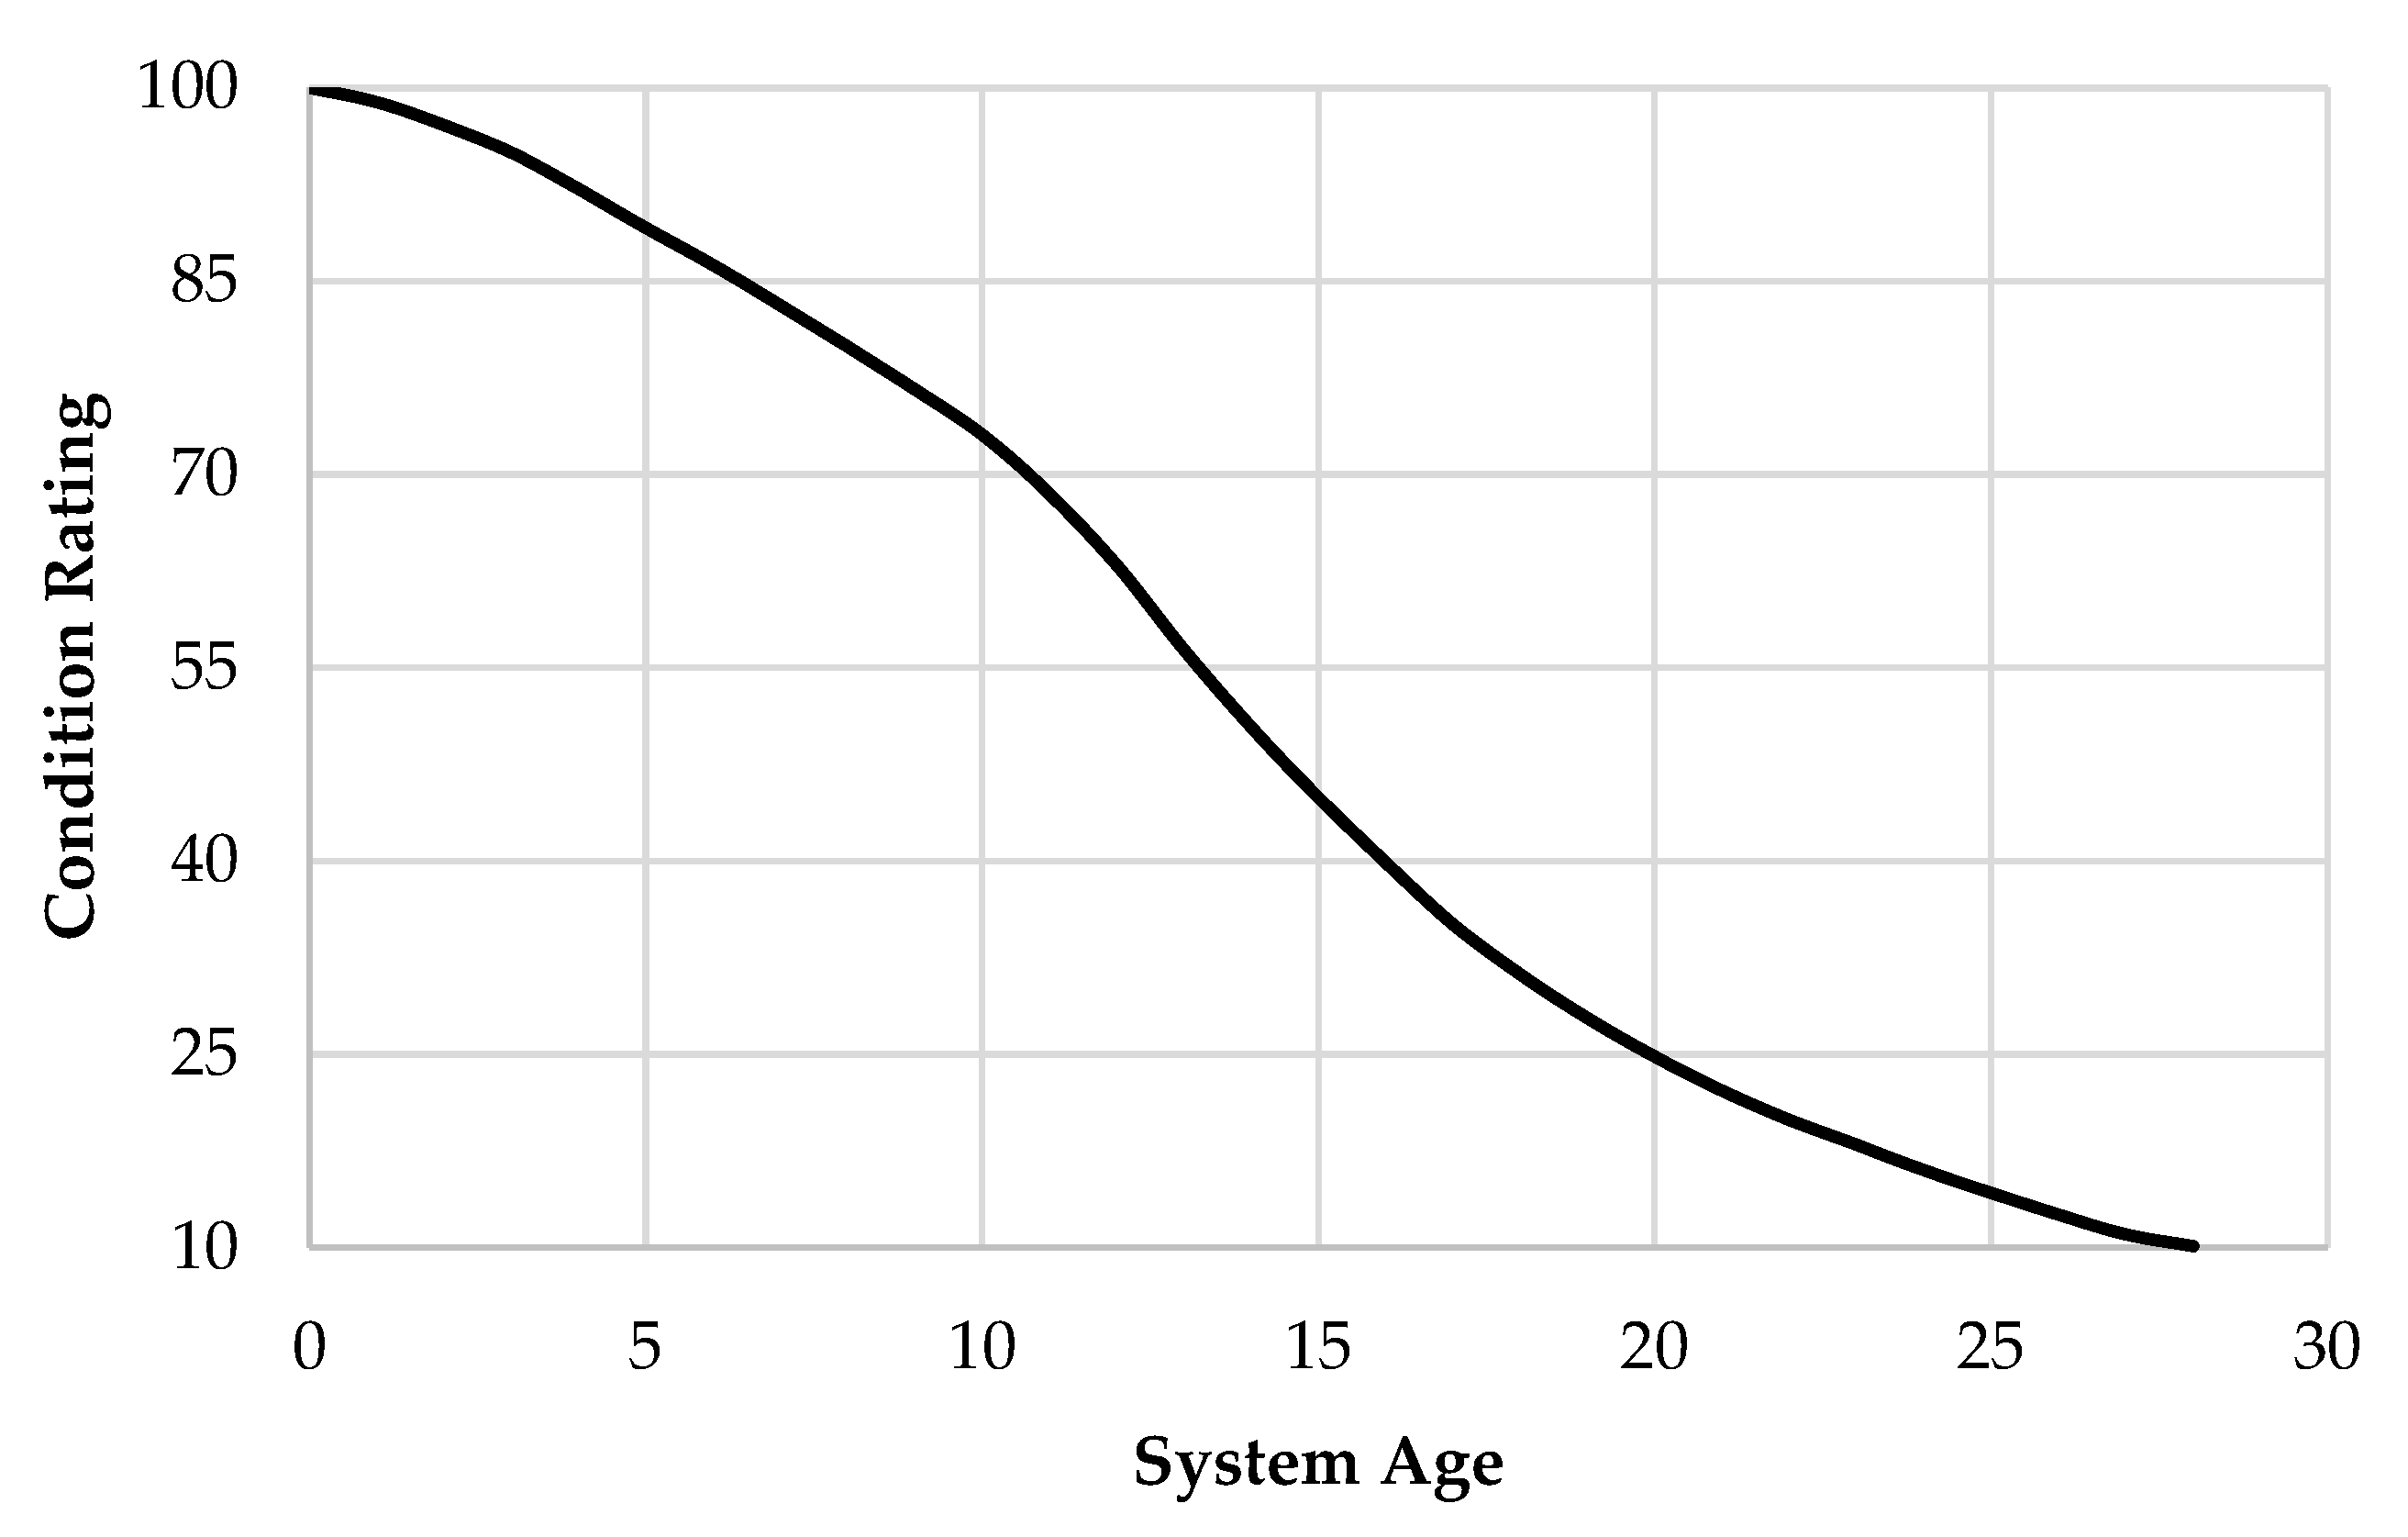
Contrarily, the graph depicted from applying the proposed GA-based fuzzy Markov model is shown in Figure 9. As demonstrated in the figure, the proposed model agrees with the assumption that the useful life of an oxygen gas system is almost 28 years. As portrayed in the Figure 8 and Figure 9, the Weibull-based model assumes a significantly slower deterioration rate in various zones within the system’s life cycle in comparison with the proposed model, which can in turn infer inappropriate or unrealistic decisions regarding maintenance, rehabilitation and replacement activities.
As demonstrated in Figure 9, the Markovian deterioration process is divided into five zones represented by the fuzzy age groups previously presented, that involve varying deterioration patterns representing transition trends from a certain condition rating to a lower one. The initial transition probabilities derived from the fuzzy inference system as well as the probabilities modified and calibrated by the GA-based Markov model for each of the five zones/age groups are shown in Figure 10. The transition probabilities from the final condition rating level have been omitted from the figure given the fact that a system with a “Critical” rating is assumed to remain in the same condition level till the end of the system’s life with no further possible deterioration. As illustrated in Figure 10, the term P66 represents the probability that components observed as having an “Excellent” condition rating stay in the same condition level for the following inspection, and P22 is the probability that components with a “Poor” condition rating remain at the same level till the following observation.
4.4. Model Validation Results
The model validation procedure is implemented by using Equations (10)–(12) applied to the validation set of hospital condition ratings and inspection records to measure the performance of the Weibull distribution-based deterioration against the proposed fuzzy GA-based Markov model and their respective capabilities to predict and model the actual deterioration attainable in a real healthcare facility setting. Table 2 provides a comparison between the results achieved by each of the two models in the three previously given tests. For the purpose of comparison, the Weibull-distribution curve was normalized to reflect a similar estimation value of system life as per the developed model which is 28 years.
As it can be concluded from Table 2, the developed model significantly surpassed the conventional Weibull distribution-based methodology in predicting the deterioration of oxygen gas systems as verified by their corresponding estimation performance with respect to the validation set of the actual condition ratings observed in hospital buildings, which proves the prediction competence of the developed model in forecasting the future degradation estimated for hospital building components. The developed methodology can thus be used by healthcare facility managers to efficiently predict the remaining useful lives of components within the facility and plan their replacement and repair activities accordingly in the most suitable time to ensure the continuity of the hospital operation overcoming possible unpredicted failure occurrences that can result from the inefficient deterioration predictions of forecasting methodologies.
5. Conclusions
As proved by recent global events, healthcare facilities are assets of extreme importance in a country and this in turn entails and obliges their smooth operation, decreased downtime and stoppages, as well as high reliability levels. Healthcare facilities in Canada are currently facing two major problems. First, the continuous pattern of deferring maintenance and renewal activities to ensure the continuation of facility operations is highly affecting the reliability and performance of hospital building systems and assets and is increasing the number of unpredictable failures. Moreover, the decreased amount of data available to study and analyze the failure patterns and condition degradation levels of hospital building systems is another major problem in hand that needs to be overcome.
Accordingly, this paper proposed a hybrid deterioration prediction model that estimates the future condition of hospital building systems based on an integration between fuzzy logic, Markov chains, and genetic algorithm (GA) optimization. Fuzzy logic is employed as part of the developed model to make use of expert knowledge in modeling and estimating the deterioration expected for healthcare assets, and the transition probabilities output from the fuzzy-based model are fed into a nonhomogeneous Markov model to conclude the suitable condition rating and its underlying degradation over the course of life of a healthcare system.
A sensitivity analysis was applied to the fuzzy-based methodology to check and ensure the robustness of the model against input alterations and the model was proved robust with a maximum variation of less than 8% with alterations in each input parameter separately. The probabilities were then calibrated using a GA in order to reflect the actual deterioration observable within healthcare facilities.
The proposed model was applied to oxygen gas systems in hospital buildings due to their relative criticality and priority in the hospital operation, and the model was validated by means of a comparison with the performance achieved by the Weibull distribution-based deterioration for a single validation dataset, and the proposed hybrid model significantly outperformed its counterpart with MAE, RMSE and MAPE values of 1.405, 1.853 and 5.358%, respectively. Consequently, the proposed model is expected to aid decision-makers in taking more informed, sound and efficient decisions regarding the maintenance, renewal, and replacements of hospital building assets.
However, the developed study can be expanded to include more parameters that might impose an effect on the deterioration patterns and condition rating of hospital building components such as the maintenance, risk or mission criticality levels. This can be a point to consider for future research endeavors. Additionally, the model formulated was only compared with a Weibull-distribution due to its popularity and relative applicability for hospital building assets, but this can form a new research question which is the comparative performance of the developed model along with other previously created models in the literature. Another aspect that can be further investigated is the optimization model initiation parameters. More experimentation can be conducted on the variability in the model output as per different initial parameter values. Finally, the applicability of the developed model on asset types other than hospital buildings is an area that is worth exploring.
Author Contributions
Conceptualization, R.A., T.Z. and F.N.; methodology, R.A.; validation, R.A., T.Z. and F.N.; formal analysis, R.A.; investigation, R.A.; writing—original draft preparation, R.A.; writing—review and editing, R.A., T.Z. and F.N.; supervision, T.Z. and F.N. All authors have read and agreed to the published version of the manuscript.
Funding
This research received no external funding.
Conflicts of Interest
The authors declare no conflict of interest.
References
- Shohet, I.; Lavy, S. Healthcare facilities management: State of the art review. Facilities 2004, 22, 210–220. [Google Scholar] [CrossRef] [Green Version]
- Talamo, C.; Paganin, G.; Rota, F. Industry 4.0 for failure information management within Proactive Maintenance. IOP Conf. Ser. Earth Environ. Sci. 2019, 296, 012055. [Google Scholar] [CrossRef]
- Abdel Wahed, M.; Sharawi, A.A.; Badawi, H.A. Modeling of medical equipment maintenance in health care facilities to support decision making. In Proceedings of the 2010 5th Cairo International Biomedical Engineering Conference, Cairo, Egypt, 16–18 December 2010; pp. 202–205. [Google Scholar] [CrossRef]
- Grussing, M.N.; Uzarski, D.R.; Murrano, L.R. Condition and Reliability Prediction Models Using the Weibull Probability Distribution. In Proceedings of the Ninth International Conference on Applications of Advanced Technology in Transportation (AATT), Chicago IL, USA, 13–16 August 2006; pp. 19–24. [Google Scholar] [CrossRef] [Green Version]
- Carvalho, M.; Nunes, E.; Telhada, J. Maintenance Decision Making. 2012. Available online: https://pdfs.semanticscholar.org/6690/9f7f3ee9c0a786c4862d261d918f357400ac.pdf (accessed on 28 August 2020).
- Knight, F.H. Risk, Uncertainty and Profit; Courier Corporation: North Chelmsford, MA, USA, 2012. [Google Scholar]
- Mohammadi, M.; Najafi, M.; Kermanshachi, S.; Kaushal, V.; Serajiantehrani, R. Factors Influencing the Condition of Sewer Pipes: State-of-the-Art Review. J. Pipeline Syst. Eng. Pract. 2020, 11, 0312002. [Google Scholar] [CrossRef]
- Sudhan, S.P.; Mathew, B.S.; Rose, S.; Isaac, K.P. Development of pavement deterioration prediction models for low volume roads using system dynamics. J. Stomatol. 2020, 146, 05020001. [Google Scholar] [CrossRef]
- Marmo, R.; Polverino, F.; Nicolella, M.; Tibaut, A. Building performance and maintenance information model based on IFC schema. Autom. Constr. 2020, 118, 103275. [Google Scholar] [CrossRef]
- Lavrenz, S.M.; Saeed, T.U.; Murillo-Hoyos, J.; Volovski, M.; Labi, S. Can interdependency considerations enhance forecasts of bridge infrastructure condition? Evidence using a multivariate regression approach. Struct. Infrastruct. Eng. 2020, 16, 1177–1185. [Google Scholar] [CrossRef]
- Ji, J.; Hong Lai, J.; Fu, G.; Zhang, C.; Kodikara, J. Probabilistic failure investigation of small diameter cast iron pipelines for water distribution. Eng. Fail. Anal. 2020, 108, 104239. [Google Scholar] [CrossRef]
- Zhu, M.; Zhu, H.; Guo, F.; Chen, X.; Ju, J.W. Tunnel condition assessment via cloud model-based random forests and self-training approach. In Computer-Aided Civil and Infrastructure Engineering; 2020; Available online: https://0-onlinelibrary-wiley-com.brum.beds.ac.uk/doi/epdf/10.1111/mice.12601 (accessed on 28 August 2020). [CrossRef]
- Allah Bukhsh, Z.; Saeed, A.; Stipanovic, I.; Doree, A.G. Predictive maintenance using tree-based classification techniques: A case of railway switches. Transp. Res. Part C Emerg. Technol. 2019, 101, 35–54. [Google Scholar] [CrossRef]
- Lavy, S.; Shohet, I. Integrated healthcare facilities maintenance management model: Case studies. Facilities 2009, 27, 107–119. [Google Scholar] [CrossRef]
- Ahmed, R.; Zayed, T. Criticality Assessment of Hospital Building Systems. In Proceedings of the The CSCE Annual Conference: Growing with Youth—Croître avec les jeunes, Laval (Greater Montreal), QC, Canada, 12–15 June 2019. [Google Scholar]
- Ali, A.; Hegazy, T. Multicriteria Assessment and Prioritization of Hospital Renewal Needs. J. Perform. Constr. Facil. 2014, 28, 528–538. [Google Scholar] [CrossRef]
- Shen, Y.; Goodall, J.L.; Chase, S.B. Condition State–Based Civil Infrastructure Deterioration Model on a Structure System Level. J. Infrastruct. Syst. 2019, 25, 04018042. [Google Scholar] [CrossRef] [Green Version]
- Bortolini, R.; Forcada, N. A probabilistic performance evaluation for buildings and constructed assets. Build. Res. Inf. 2019, 1–18. [Google Scholar] [CrossRef]
- Marteinsson, B. Durability and the factor method of ISO 15686-1. Build. Res. Inf. 2003, 31, 416–426. [Google Scholar] [CrossRef]
- Elhakeem, A.; Hegazy, T. Building asset management with deficiency tracking and integrated life cycle optimization. Struct. Infrastruct. Eng. 2012, 8, 729–738. [Google Scholar] [CrossRef]
- Lavy, S.; Shohet, I. On the effect of service life conditions on the maintenance costs of healthcare facilities. Constr Manag. Econ. 2007, 25, 1087–1098. [Google Scholar] [CrossRef]
- Salah, M.; Osman, H.; Hosny, O. Performance-Based Reliability-Centered Maintenance Planning for Hospital Facilities. J. Perform. Constr. Facil. 2018, 32, 04017113. [Google Scholar] [CrossRef]
- Farahani, A.; Wallbaum, H.; Dalenbäck, J.-O. Optimized maintenance and renovation scheduling in multifamily buildings—a systematic approach based on condition state and life cycle cost of building components. Constr. Manag. Econ. 2019, 37, 139–155. [Google Scholar] [CrossRef] [Green Version]
- Morcous, G. Performance Prediction of Bridge Deck Systems Using Markov Chains. J. Perform. Constr. Facil. 2006, 20, 146–155. [Google Scholar] [CrossRef]
- Edirisinghe, R.; Setunge, S.; Zhang, G. Markov Model—Based Building Deterioration Prediction and ISO Factor Analysis for Building Management. J. Manag. Eng. 2015, 31, 04015009. [Google Scholar] [CrossRef]
- Sánchez-Barroso, G.; Sanz-Calcedo, J.G. Application of Predictive Maintenance in Hospital Heating, Ventilation and Air Conditioning Facilities. Emerg. Sci. J. 2019, 3, 337–343. [Google Scholar] [CrossRef] [Green Version]
- Grussing, M.N.; Liu Liang, Y.; Uzarski, D.R.; El-Rayes, K.; El-Gohary, N. Discrete Markov Approach for Building Component Condition, Reliability, and Service-Life Prediction Modeling. J. Perform. Constr. Facil. 2016, 30, 04016015. [Google Scholar] [CrossRef]
- Mohseni, H.; Setunge, S.; Zhang, G.; Wakefield, R. Markov Process for Deterioration Modeling and Asset Management of Community Buildings. J. Constr Eng. Manag. 2017, 143, 04017003. [Google Scholar] [CrossRef]
- ISO. ISO-7396-1:2016 International Organization for Standardization. 2016. Available online: https://www.iso.org/cms/render/live/en/sites/isoorg/contents/data/standard/06/00/60061.html (accessed on 14 June 2020).
- Zadeh, L.A. Fuzzy sets. Inf. Control 1965, 8, 338–353. [Google Scholar] [CrossRef] [Green Version]
- Kleiner, Y.; Sadiq, R.; Rajani, B. Modeling Failure Risk in Buried Pipes Using Fuzzy Markov Deterioration Process. In Proceedings of the Pipeline Division Specialty Congress 2004, San Diego CA, USA, 1–4 August 2004; pp. 1–12. [Google Scholar] [CrossRef] [Green Version]
- Lufkin, P.; Abate, D.; Romani, L.; Dotz, R.; Towers, M.; Miller, J. The Whitestone Facility Maintenance and Repair Cost Reference 2013–2014; Whitestone Research Corporation: Santa Barbara, CA, USA, 2013. [Google Scholar]
- Babuska, R. Fuzzy Systems, Modeling and Identification. 2000. Available online: http://citeseerx.ist.psu.edu/viewdoc/download;jsessionid=6A91D177B47542D686CC50D884C3B88F?doi=10.1.1.29.9152&rep=rep1&type=pdf (accessed on 28 August 2020).
- Siddiqui, M.A.; Butt, S.I.; Baqai, A.A.; Lu, J.; Zhang, F. A Novel Idea for Optimizing Condition-Based Maintenance Using Genetic Algorithms and Continuous Event Simulation Techniques. Math. Probl. Eng. 2017, 2017, 1–10. [Google Scholar] [CrossRef] [Green Version]
- Holland, J.H. Adaptation in Natural and Artificial Systems; The MIT Press: Cambridge, MA, USA, 1975. [Google Scholar]
- Haladuick, S.; Dann, M.R. Genetic Algorithm for Inspection and Maintenance Planning of Deteriorating Structural Systems: Application to Pressure Vessels. Infrastructures 2018, 3, 32. [Google Scholar] [CrossRef] [Green Version]
- Alfon, P.; Soedarsono, J.W.; Priadi, D.; Sulistijono, S. Pipeline Material Reliability Analysis Regarding to Probability of Failure Using Corrosion Degradation Model. Adv. Mater. Res. 2012, 422, 705–715. [Google Scholar] [CrossRef]
- Hassanat, A.; Almohammadi, K.; Alkafaween, E.; Abunawas, E.; Hammouri, A.; Prasath, V.B.S. Choosing Mutation and Crossover Ratios for Genetic Algorithms—A Review with a New Dynamic Approach. Information 2019, 10, 390. [Google Scholar] [CrossRef] [Green Version]
- Gotshall, S.; Rylander, B. Optimal Population Size and the Genetic Algorithm. Population 2002, 100, 900. [Google Scholar]
Figure 1.
Parameters and rules of the fuzzy deterioration framework.


Figure 2.
Membership functions calculation procedure for different positions of “x”.

Figure 3.
Output alteration upon age parameter incrementation.

Figure 4.
Mean absolute error (MAE) results of different values of age incrementation as compared to the base dataset with 0% incrementation.
Figure 4.
Mean absolute error (MAE) results of different values of age incrementation as compared to the base dataset with 0% incrementation.

Figure 5.
Output alteration upon condition parameter incrementation.

Figure 6.
MAE results of different values of condition incrementation as compared to the base dataset with 0% incrementation.
Figure 6.
MAE results of different values of condition incrementation as compared to the base dataset with 0% incrementation.

Figure 7.
Convergence of the genetic algorithm optimization model.

Figure 8.
Weibull distribution-based deterioration.

Figure 9.
Fuzzy genetic algorithm (GA)-calibrated Markovian deterioration.

Figure 10.
Fuzzy-based (initial) and optimum GA-derived (modified) transition probabilities for each zone in system’s life.
Figure 10.
Fuzzy-based (initial) and optimum GA-derived (modified) transition probabilities for each zone in system’s life.


Table 1.
Initial state vector using percentages of systems inspected.
| Excellent | Good | Acceptable | Marginal | Poor | Critical | Total | |
|---|---|---|---|---|---|---|---|
| No. of Systems | 15 | 12 | 10 | 8 | 3 | 2 | 50 |
| % of Systems | 0.3 | 0.24 | 0.2 | 0.16 | 0.06 | 0.04 | 1 |
Table 2.
Comparison between the performance of the developed model against the Weibull-based model.
| Fuzzy GA-Based Markov Model | Weibull Distribution | |
|---|---|---|
| Mean Absolute Error | 1.405 | 9.852 |
| Root-Mean Squared Error | 1.853 | 11.429 |
| Mean Absolute Percentage Error | 5.358% | 40.496% |
© 2020 by the authors. Licensee MDPI, Basel, Switzerland. This article is an open access article distributed under the terms and conditions of the Creative Commons Attribution (CC BY) license (http://creativecommons.org/licenses/by/4.0/).
Share and Cite
MDPI and ACS Style
Ahmed, R.; Zayed, T.; Nasiri, F. A Hybrid Genetic Algorithm-Based Fuzzy Markovian Model for the Deterioration Modeling of Healthcare Facilities. Algorithms 2020, 13, 210. https://0-doi-org.brum.beds.ac.uk/10.3390/a13090210
AMA Style
Ahmed R, Zayed T, Nasiri F. A Hybrid Genetic Algorithm-Based Fuzzy Markovian Model for the Deterioration Modeling of Healthcare Facilities. Algorithms. 2020; 13(9):210. https://0-doi-org.brum.beds.ac.uk/10.3390/a13090210
Chicago/Turabian StyleAhmed, Reem, Tarek Zayed, and Fuzhan Nasiri. 2020. "A Hybrid Genetic Algorithm-Based Fuzzy Markovian Model for the Deterioration Modeling of Healthcare Facilities" Algorithms 13, no. 9: 210. https://0-doi-org.brum.beds.ac.uk/10.3390/a13090210
Note that from the first issue of 2016, this journal uses article numbers instead of page numbers. See further details here.