
An Integrated Neural Network and SEIR Model to Predict COVID-19
by
 , ,
, ,
Sharif Noor Zisad
1 ,
,
Mohammad Shahadat Hossain
1,
Mohammed Sazzad Hossain
2 and
Karl Andersson
3,* 1
Department of Computer Science and Engineering, University of Chittagong, Chittagong 4331, Bangladesh
2
Department of Computer Science and Engineering, University of Liberal Arts Bangladesh, Dhaka 1209, Bangladesh
3
Department of Computer Science, Electrical and Space Engineering, Luleå University of Technology, 93187 Skellefteå, Sweden
*
Author to whom correspondence should be addressed.
Algorithms 2021, 14(3), 94; https://0-doi-org.brum.beds.ac.uk/10.3390/a14030094
Submission received: 1 February 2021
/
Revised: 12 March 2021
/
Accepted: 17 March 2021
/
Published: 19 March 2021
Abstract
:A novel coronavirus (COVID-19), which has become a great concern for the world, was identified first in Wuhan city in China. The rapid spread throughout the world was accompanied by an alarming number of infected patients and increasing number of deaths gradually. If the number of infected cases can be predicted in advance, it would have a large contribution to controlling this pandemic in any area. Therefore, this study introduces an integrated model for predicting the number of confirmed cases from the perspective of Bangladesh. Moreover, the number of quarantined patients and the change in basic reproduction rate (the R-value) can also be evaluated using this model. This integrated model combines the SEIR (Susceptible, Exposed, Infected, Removed) epidemiological model and neural networks. The model was trained using available data from 250 days. The accuracy of the prediction of confirmed cases is almost between 90% and 99%. The performance of this integrated model was evaluated by showing the difference in accuracy between the integrated model and the general SEIR model. The result shows that the integrated model is more accurate than the general SEIR model while predicting the number of confirmed cases in Bangladesh.
Keywords:
COVID-19; coronavirus; SARS-CoV-2; 2019-nCoV; SEIR; neural network; basic reproduction number1. Introduction
The coronavirus of COVID-19 is a new strain that was discovered in 2019 and has not been previously identified in humans. Although Bangladesh identified their first COVID-19 case in mid-March, it confirmed infected cases in 63 districts (out of 64) by the end of April [1]. There were a total of 19 laboratories for coronavirus testing with a capacity of about 5000 samples per day [1]. Although the authorities tested nearly 2100 samples per day [2], reluctance from the testing authorities and the administrative complexity regarding the availability of test kits hindered the identification of actual infected cases. Since there was no scientific model to predict the number of patients in the perspective of this country, the administrator of Bangladesh was not actively restricting the movements of the common people from the very beginning of the pandemic [3]. Therefore, the situation worsened day by day.
The objective of this research is to develop a strong model for Bangladesh, enabling prediction of the total number of confirmed cases as well as the total number of quarantined persons for a specific day in an accurate way. Moreover, what impact does intervention have on the number of infected patients and what is the improvement in accuracy while integrating a neural network with the SEIR [4] (Susceptible, Exposed, Infected, Removed) epidemiological model are the main research questions for this research. A mobile application was developed, allowing for the generation of various COVID-19 scenarios for any administrative unit of Bangladesh. Eventually, such a mobile application will help decision-makers to develop an appropriate policy to control the impact of COVID-19 in areas of Bangladesh. The reason for this is that the developed mobile app will help decision-makers visualize the total confirmed cases as well as to simulate the impact of an intervention by taking into account custom data for confirmed cases of a specific area.
In the SEIR model, the total population of a region is divided into four compartments. The persons, who are in danger of being infected take place in the susceptible compartment. When a person from the susceptible portion comes into contact with an infected person, that person is moved to the exposed compartment. When the person is infected by the virus, he or she will take a position in the infected compartment. After being in the infected area, the person may get well or may leave their last breath. Hence, he or she will move to the removed compartment. In contrast, in the SIR (Susceptible, Infected, Removed) model, the exposed compartment is ignored. The person of a susceptible compartment who made contact with an infected person is directly moved to the infected compartment. Hence, it can be seen that the SEIR model consists of four compartments while the SIR model consists of three compartments.
A neural network [5] uses a backpropagation [6] algorithm, which is also known as a feedback process. The difference between the predicted output of the network and the actual output is used to update the weights of each unit of the network. The network of our integrated framework is trained to calculate the number of quarantined persons in a day. Moreover, the daily total confirmed cases as well as the basic reproduction rate (R) of any region of Bangladesh can also be calculated using this model.
The remainder of the paper is structured as follows. Section 2 presents the related works. Section 3 describes the methodology of this research. The framework of SEIR_NN-based apps development is described in Section 4, and the process of this experiment is given in Section 5. Finally, Section 6 and Section 7 present an analysis of the results and conclude the paper, with a brief discussion on the future scopes in improving upon the performance achieved.
2. Related Work
Kuniya [7] applied the SEIR model to predict the epidemic peak in Japan. They generated the peak value for multiple infection rates. Moreover, the effect of an intervention in peak value was also visualized in this research. However, the model cannot calculate results for specific parts of a country.
Dandekar et al. [8] added a neural network to the SIR model. They analyzed data from Wuhan (China), South Korea, the USA, and Italy. They calculated the quarantine strength and effective reproduction number for more than 500 patients. A comparison between original SIR and augmented SIR was performed for these four regions. However, the model cannot suggest an end date of the pandemic.
Rezapour et al. [9] provided a spread model of the coronavirus pandemic using SEIR. They applied the Caputo fractional derivative. An approximate solution for the model was found by applying the Euler method (Fractional). A numerical simulation was also provided based on real data for predicting the transmission of the novel coronavirus. However, the model cannot predict the number of quarantined persons in a day.
Anderez et al. [10] investigated the relationship between the vulnerable patients and the number of deaths. They used available data from the UK. Additionally, a modified SEIR model including vulnerable populations was proposed in this study. However, this model cannot analyze the impact of a lockdown in any area.
Huang et al. [11] forecasted the latest pandemic situation of COVID-19 inside and outside of China until 7 March 2020. They developed time-varying SIR models for this purpose. They considered the total population in each province of China as well as other countries as the initial population N for the model. However, the model is applicable only in China.
Owusu-Mensah et al. [12] introduced a fractional-type SEIR model. They introduced a new parameter named testing rates accompanying transmission rate and transition rate. The outcome of this experiment suggested that there is a strong benefit in tracing and moving tests. It reduces the spread of the virus since the number of infected individuals is reduced. However, the model cannot predict the number of quarantined persons in a day.
Mirzaee et al. [13] used an extended form of the SEIR model. The model was used to predict the disability-adjusted life years (DALYs) of Iran. The result shows that the total DALYs among women and men are 861 years/100,000 and 1082/100,000, respectively. This result may help regulate priorities in health and assign resources for future preparation. However, the model cannot suggest an end date to the pandemic.
Kheirallah et al. [14] simulated the track of the COVID-19 curve for Jordan. They assessed the impact of non-pharmaceutical interventions during this pandemic. A modified SEIR model was utilized for this study. They categorized the infected compartment into three subcompartments including pre-symptomatic, mild symptoms, and moderate to severe symptoms. They used the GLEAMviz client simulator to run this model. However, this model cannot analyze the impact of a lockdown in any area.
Kochańczyk et al. [15] estimated the range for the basic reproduction rate, R, of COVID-19. They applied the SEIR model based on doubling times. They considered the exponential phases of this disease in Italy, France, China, Switzerland, Spain, the UK, New York State, and Germany. The range was estimated as 4.7 to 11.4, which was higher than previous estimates. However, this model cannot analyze the impact of a lockdown in any area. Moreover, the model cannot calculate results for specific parts of a country.
Nguyen et al. [16] proposed a sequence-based approach with a deep neural network for identifying fertility-related proteins. They applied a 5-fold cross-validation dataset in the GRU architecture. Moreover, they implemented an ensemble neural network [17] to identify essential genes. They achieved 76.3% accuracy while identifying essential genes. However, these two models are applicable in classification problems.
Another study [18] forecasted the spreading tendency of the novel coronavirus and established an improved SEIR model. The removed compartment was extended using two new compartments: death and cured. The model parameters were estimated depending on the issued data of China. The accuracy of the infected, dead, and cured patients were respectively 99.9%, 99.8%, and 99.6%. However, the model is applicable only in China.
A summary of the previous research on this topic is shown in Table 1. Almost all of them tried to improve the SEIR or SIR model. One of them proposed an integrated solution of SIR and neural networks. However, none of them have applied the SEIR model with the neural network. In our work, we integrate a neural network with the SEIR model from the perspective of Bangladesh. Since the average incubation period of a coronavirus is 5 days, which was calculated by [19], the exposed compartment helps our integrated model obtain the best performance from the perspective of Bangladesh.
3. Methodology
3.1. SEIR Model
We used the well-known SEIR compartmental model because of the uncertainty due to incomplete identification of the infected population. Similarly, E, I, and R denote the population figures in the exposed, infected, and recovered or removed compartments, respectively. The architecture of the SEIR model is shown in Figure 1.
denotes the transmission rate, which is also known as the infection rate. The onset rate is the inverse of the incubation period, and denotes the removal rate, which is the inverse of the infection period.
The following differential equations are used to change the status of each compartment at time t (t > 0).
In the above equations, dS/dt denotes the number of infected patients changed in the susceptible compartment. Similarly, dE/dt, dI/dt, and dR/dt denote the change in the exposed, infected, and removed compartments, respectively. The number of infective persons who are diagnosed at time t can be identified using the following equation that was proposed in [7].
where ( ≤ 1) is the fraction of infective persons who can be identified by diagnosis and N is the population figure of the region.
R is considered an important parameter since it enables us to know the secondary cases produced by one infected person in an area [20]. Hence, the outbreak of an infectious disease can be determined by using this value. The R value of an infectious disease at greater than one means there could be a chance of outbreak or epidemic while a value at less than one determines that there is no risk of an outbreak [21]. In the case of COVID-19, if the R value is considered at 3, a person with this disease can infect three persons and then they can infect nine persons, then they can infect 81 persons, then they can infect 243 persons, and so on. The reason for this is that the infection rate grows exponentially.
Therefore, a single confirmed case in a locality is enough to infect all its population if strict measures are not followed. Eventually, such strict measures could help to reduce the R value, which depends upon many factors such as social distancing, the practice of personal hygiene, lockdown, testing, tracing, and isolation. In this way, this integrated model allows for the measurement of the R value as well as the calculation of confirmed cases and quarantined patients not for the whole country but for a district, which is managed by the local administration, upazila, which is a subunit of a district; for a union, which is a specific region of a upazila; or for a village.
Since the value of S(0) is close to 1, we may ignore S(0) while calculating the R value.
3.2. An Integrated SEIR and Neural Network Framework
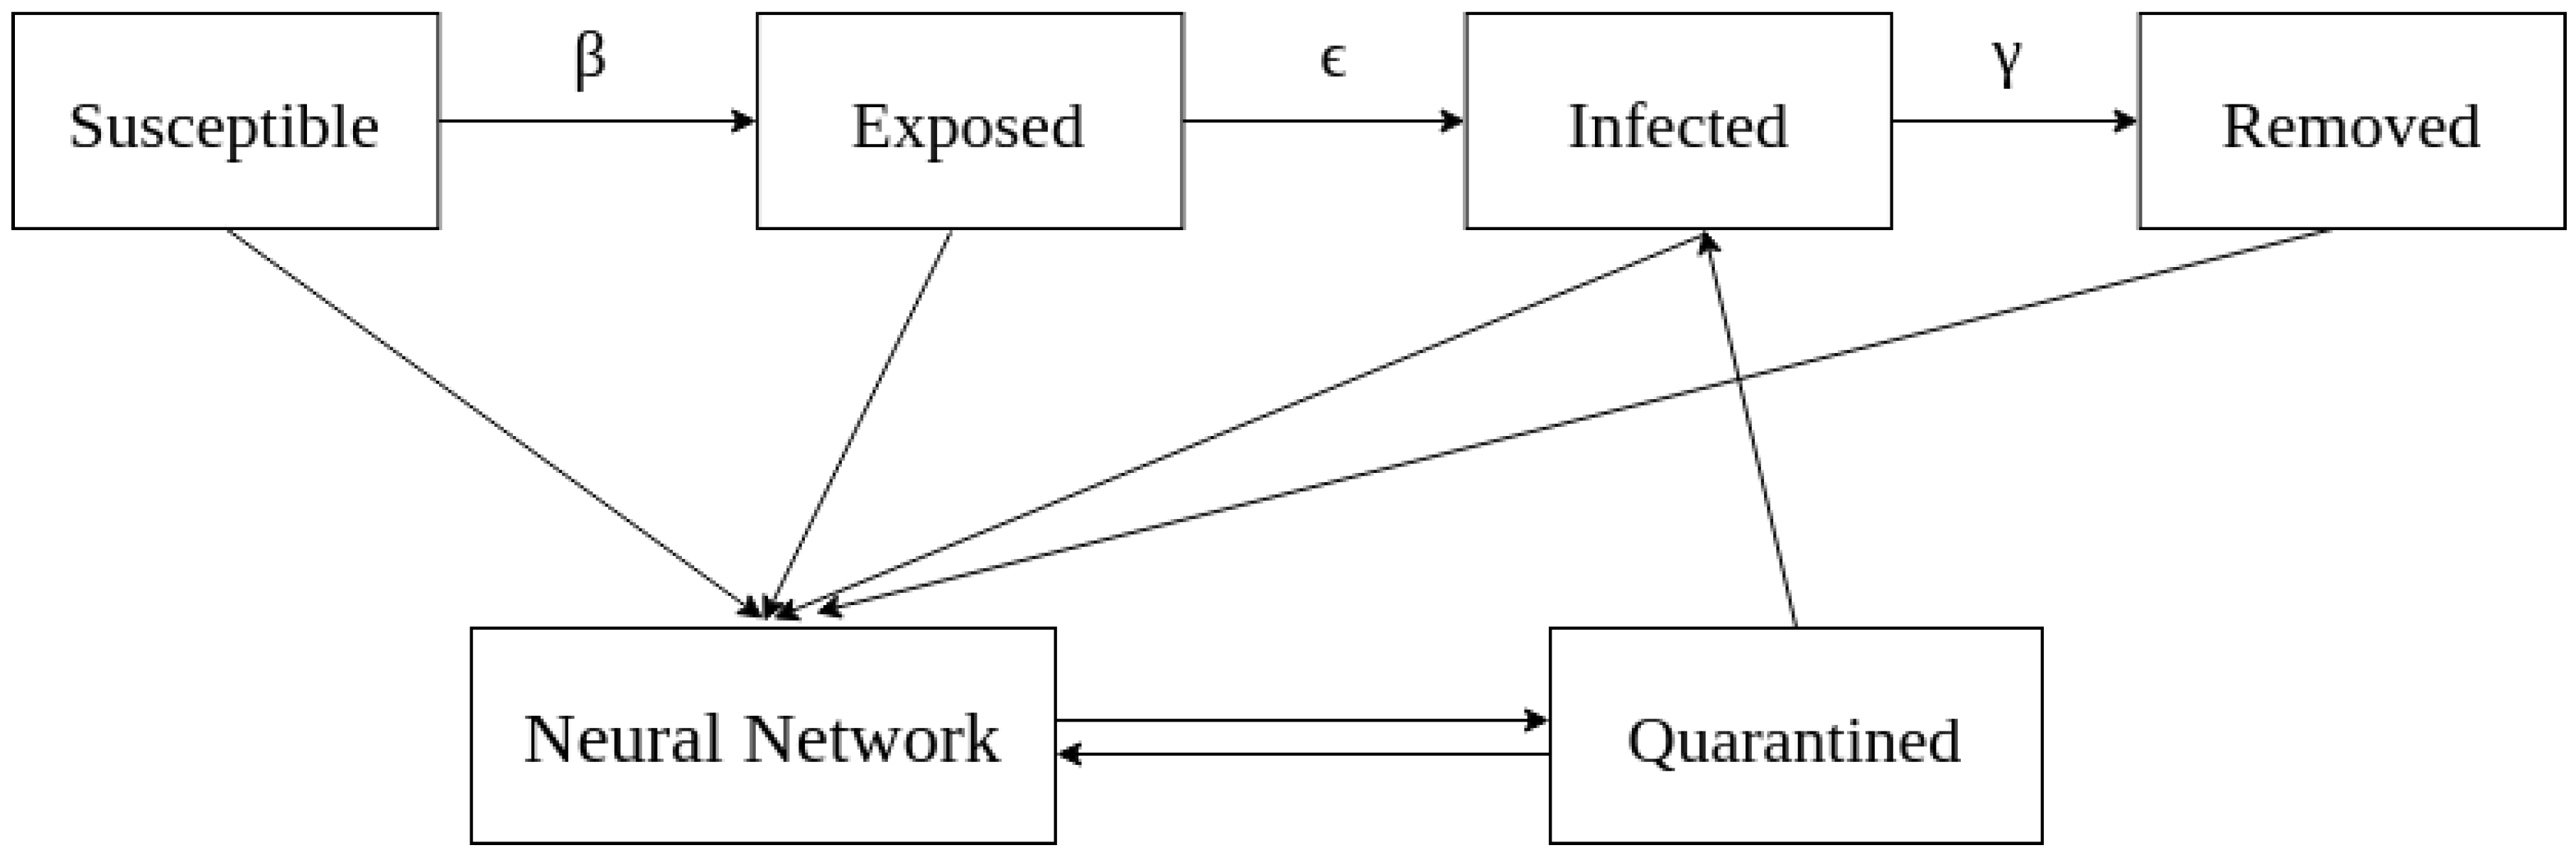
We included a neural network model to calculate the quarantined population at a specific time. A neural network is a combination of artificial neurons [22]. The gradient descent process [23] was used to resample the value of all parameters in the opposite direction. This process continues until the cost function is minimized. The flow chart of our integrated system is illustrated in Figure 2.
Here, the part of the population that is supposed to be infected with this disease can be placed in the susceptible compartment. Those who are in the incubation period and have not been diagnosed are placed in the exposed compartment. The infected compartment contains patients who are infected by COVID-19. The patients who have died or recovered from this disease are in the removed compartment.
To calculate the quarantined population figure at a specific time t, the population figure in S, E, I, R, and Q (quarantined) at time t − 1 is sent to the neural network. The network generates the quarantined population figure.
The following differential equations are used to change the status of each compartment at time t (t > 0).
where dQ/dt denotes the quarantined compartment and NN is the output of the neural network. The basic reproduction rate, R [8], for this diseases is calculated using Equation (12).
3.3. Neural Network Model
We applied the Recurrent Neural Network (RNN) model to predict the number of quarantined persons on a specific day. There are six LSTM layers and six dropout layers with a dropout value of 0.2 that disabled 20% neurons randomly. A dense layer with unit 1 is also included in this network. The input layer consists of five nodes since we have five input (S, E, I, R, and Q) from the SEIR model.
The model was trained using the available data from 250 days. The dataset was prepared by combining COVID-19 daily reports from the official COVID-19 information website of Bangladesh [24]. The dataset was split using a 70:20:10 split ratio, where 70% was used to train the model, 20% was used to validate the model, and the remaining 10% was used to test the model performance. Since RNN is a deep neural network [25], we performed a hyperparameter-tuning process to perceive the best parameters. Therefore, the model iwa trained using different batch sizes, hidden units in LSTM layers, activation functions, and optimizers, as shown in Table 2.
According to Table 2, the best performance was achieved while using the Stochastic Gradient Descent (SGD) optimizer and Relu [26] activation function with 40 hidden units in each LSTM layer and a batch size of 32. Since the Stochastic Gradient Descent (SGD) optimizer updates the model parameters frequently, it consumes less memory and time [27] and SGD with Relu activation function is used to optimize the network. Moreover, we used 5 fold cross-validation. Normalized Root Mean Square Error (NRMSE) [28] with 0.01 learning rate during training the model. The model was trained using 200 epochs. The training procedure was stopped if no significant improvement was noticed after every 5 epochs. The Mean Square Error (MSE) and Root Mean Square Error (RMSE) were used to validate the prediction results.
4. SEIR_NN-Based Apps Development Framework
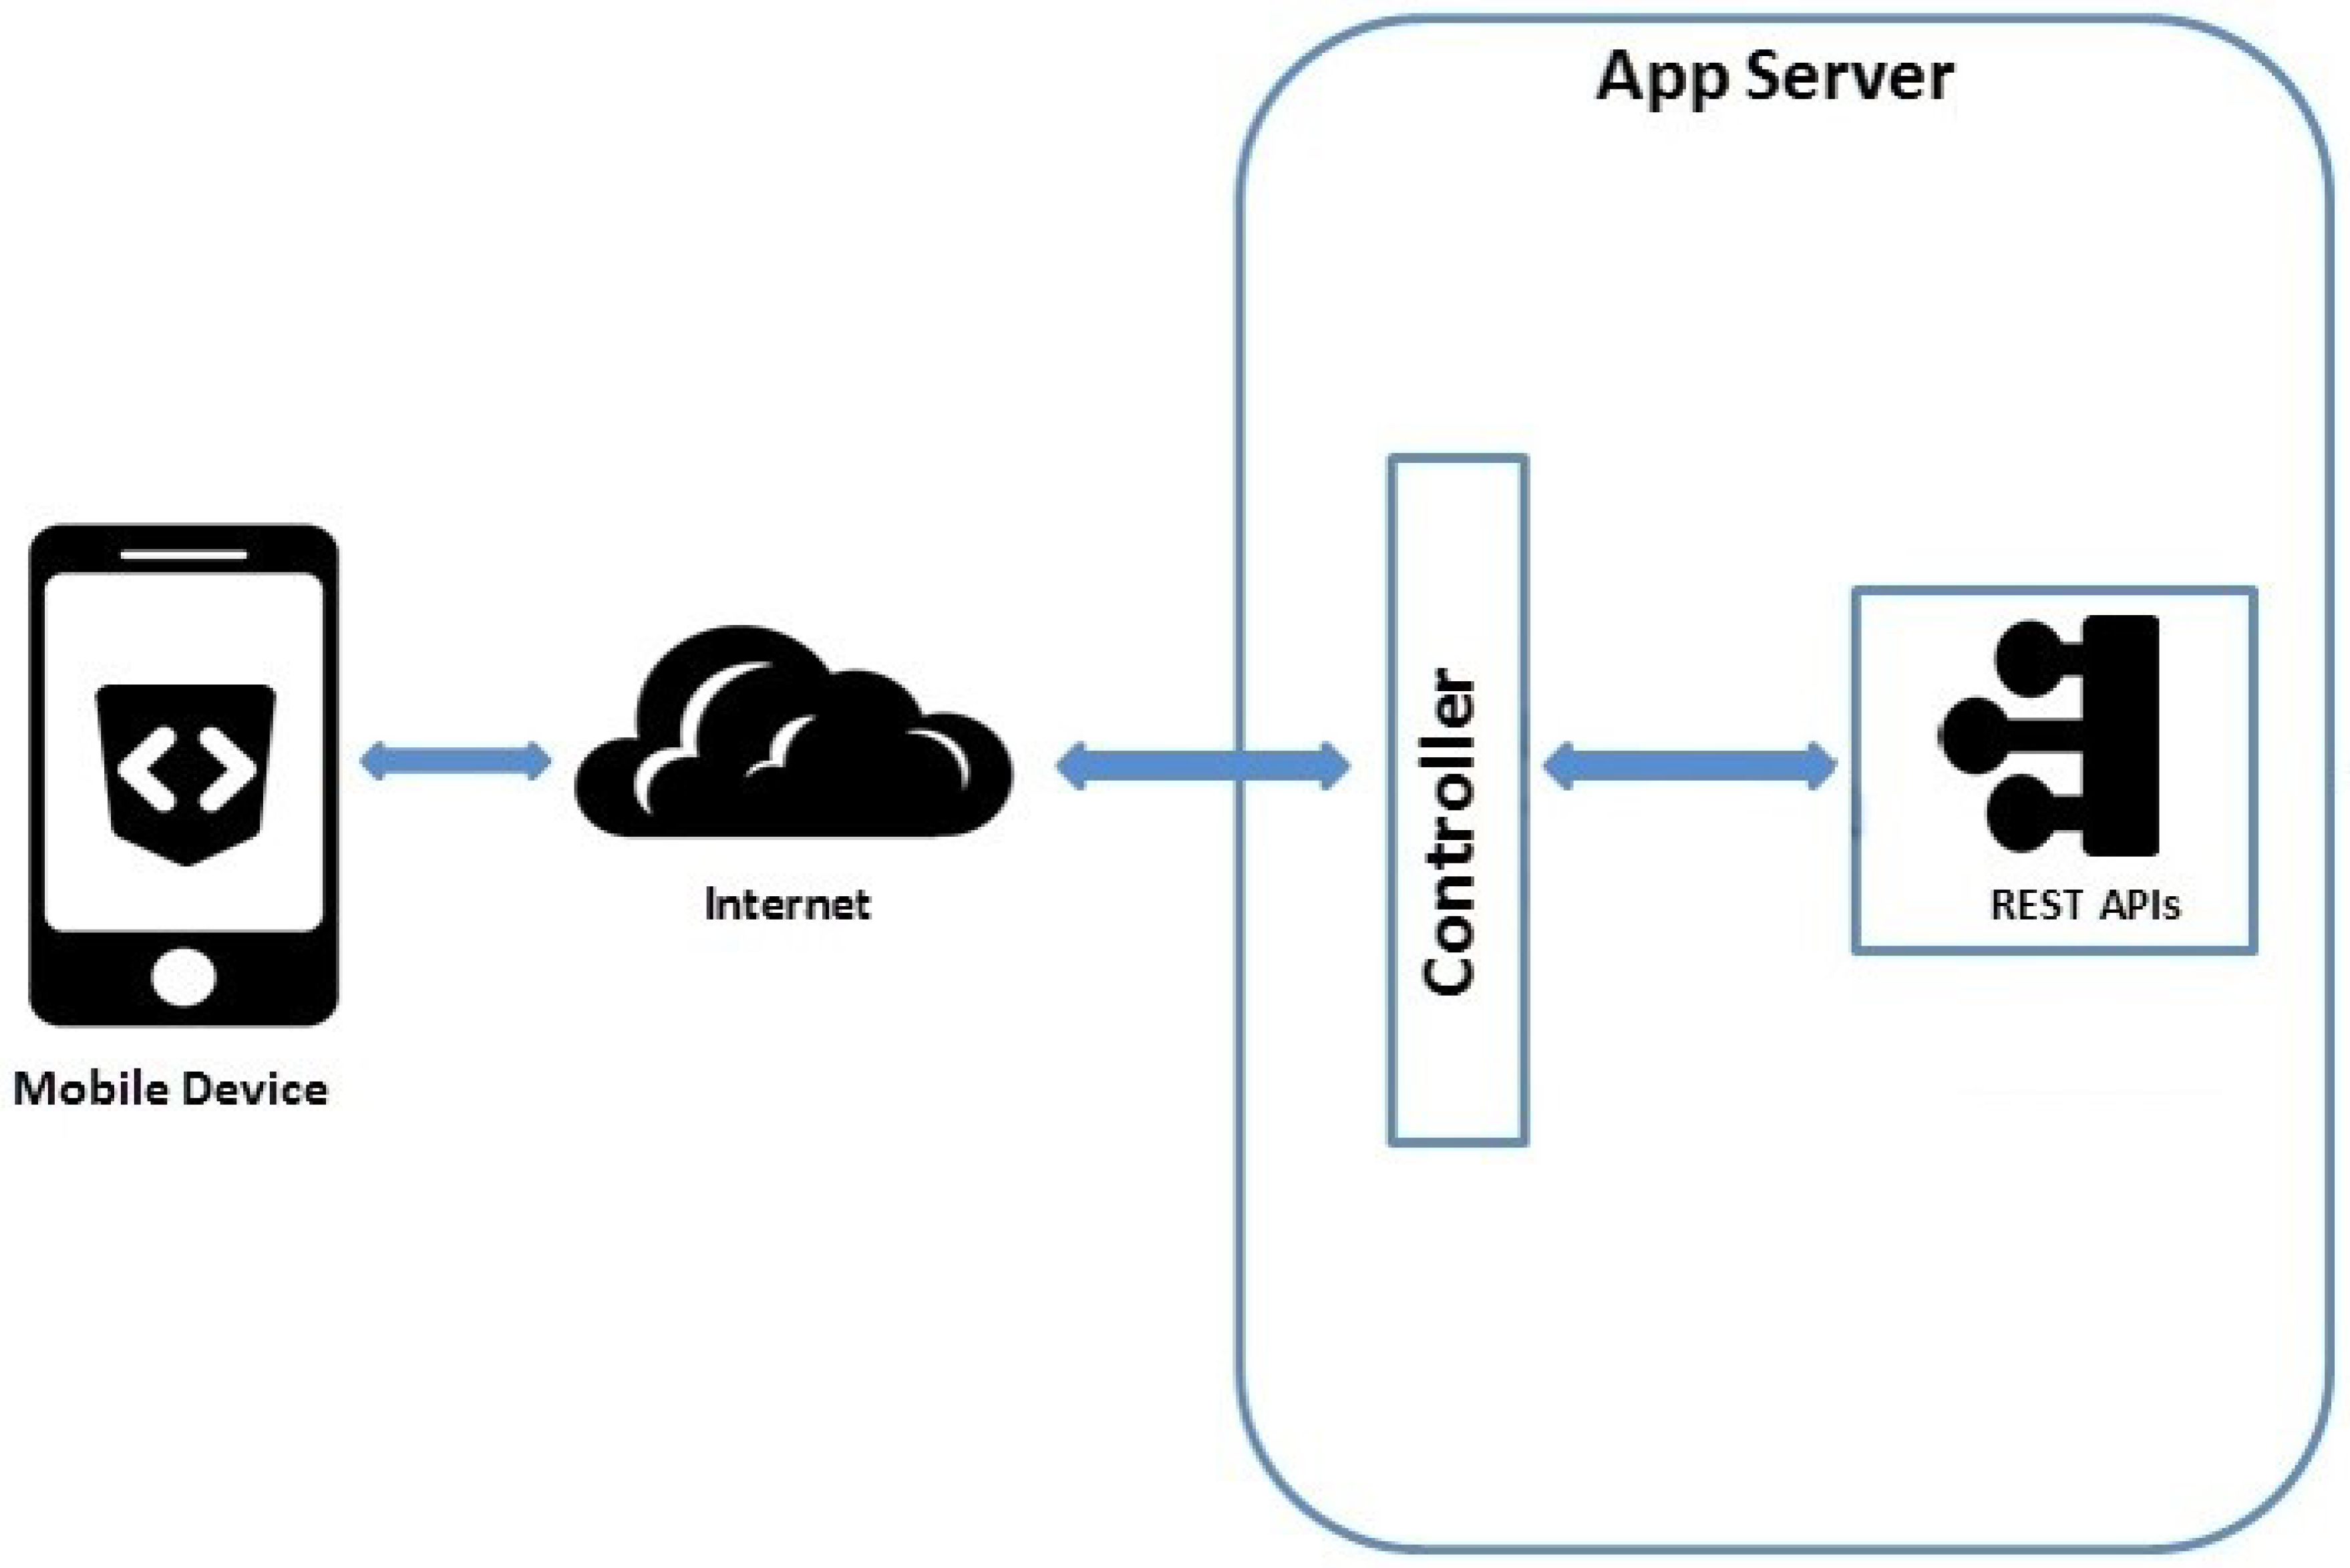
This section demonstrates the structure of the mobile application framework including a RESTful API [29]. The architecture of the mobile application is shown in Figure 3. The application connects to the server using RESTful APIs through an Internet connection. The controller handles all requests from the application. It sends the output for each request in JSON [30] format using the RESTful API. The application receives a response from the server. It parses the JSON data and displays it in the user interface. This application was developed using Android Studio and the Java programming language to visualize the prediction in a mobile phone. The server was developed using Django, a framework using the Python programming language. The server was deployed in Heroku, a cloud application platform.
4.1. Mobile Application
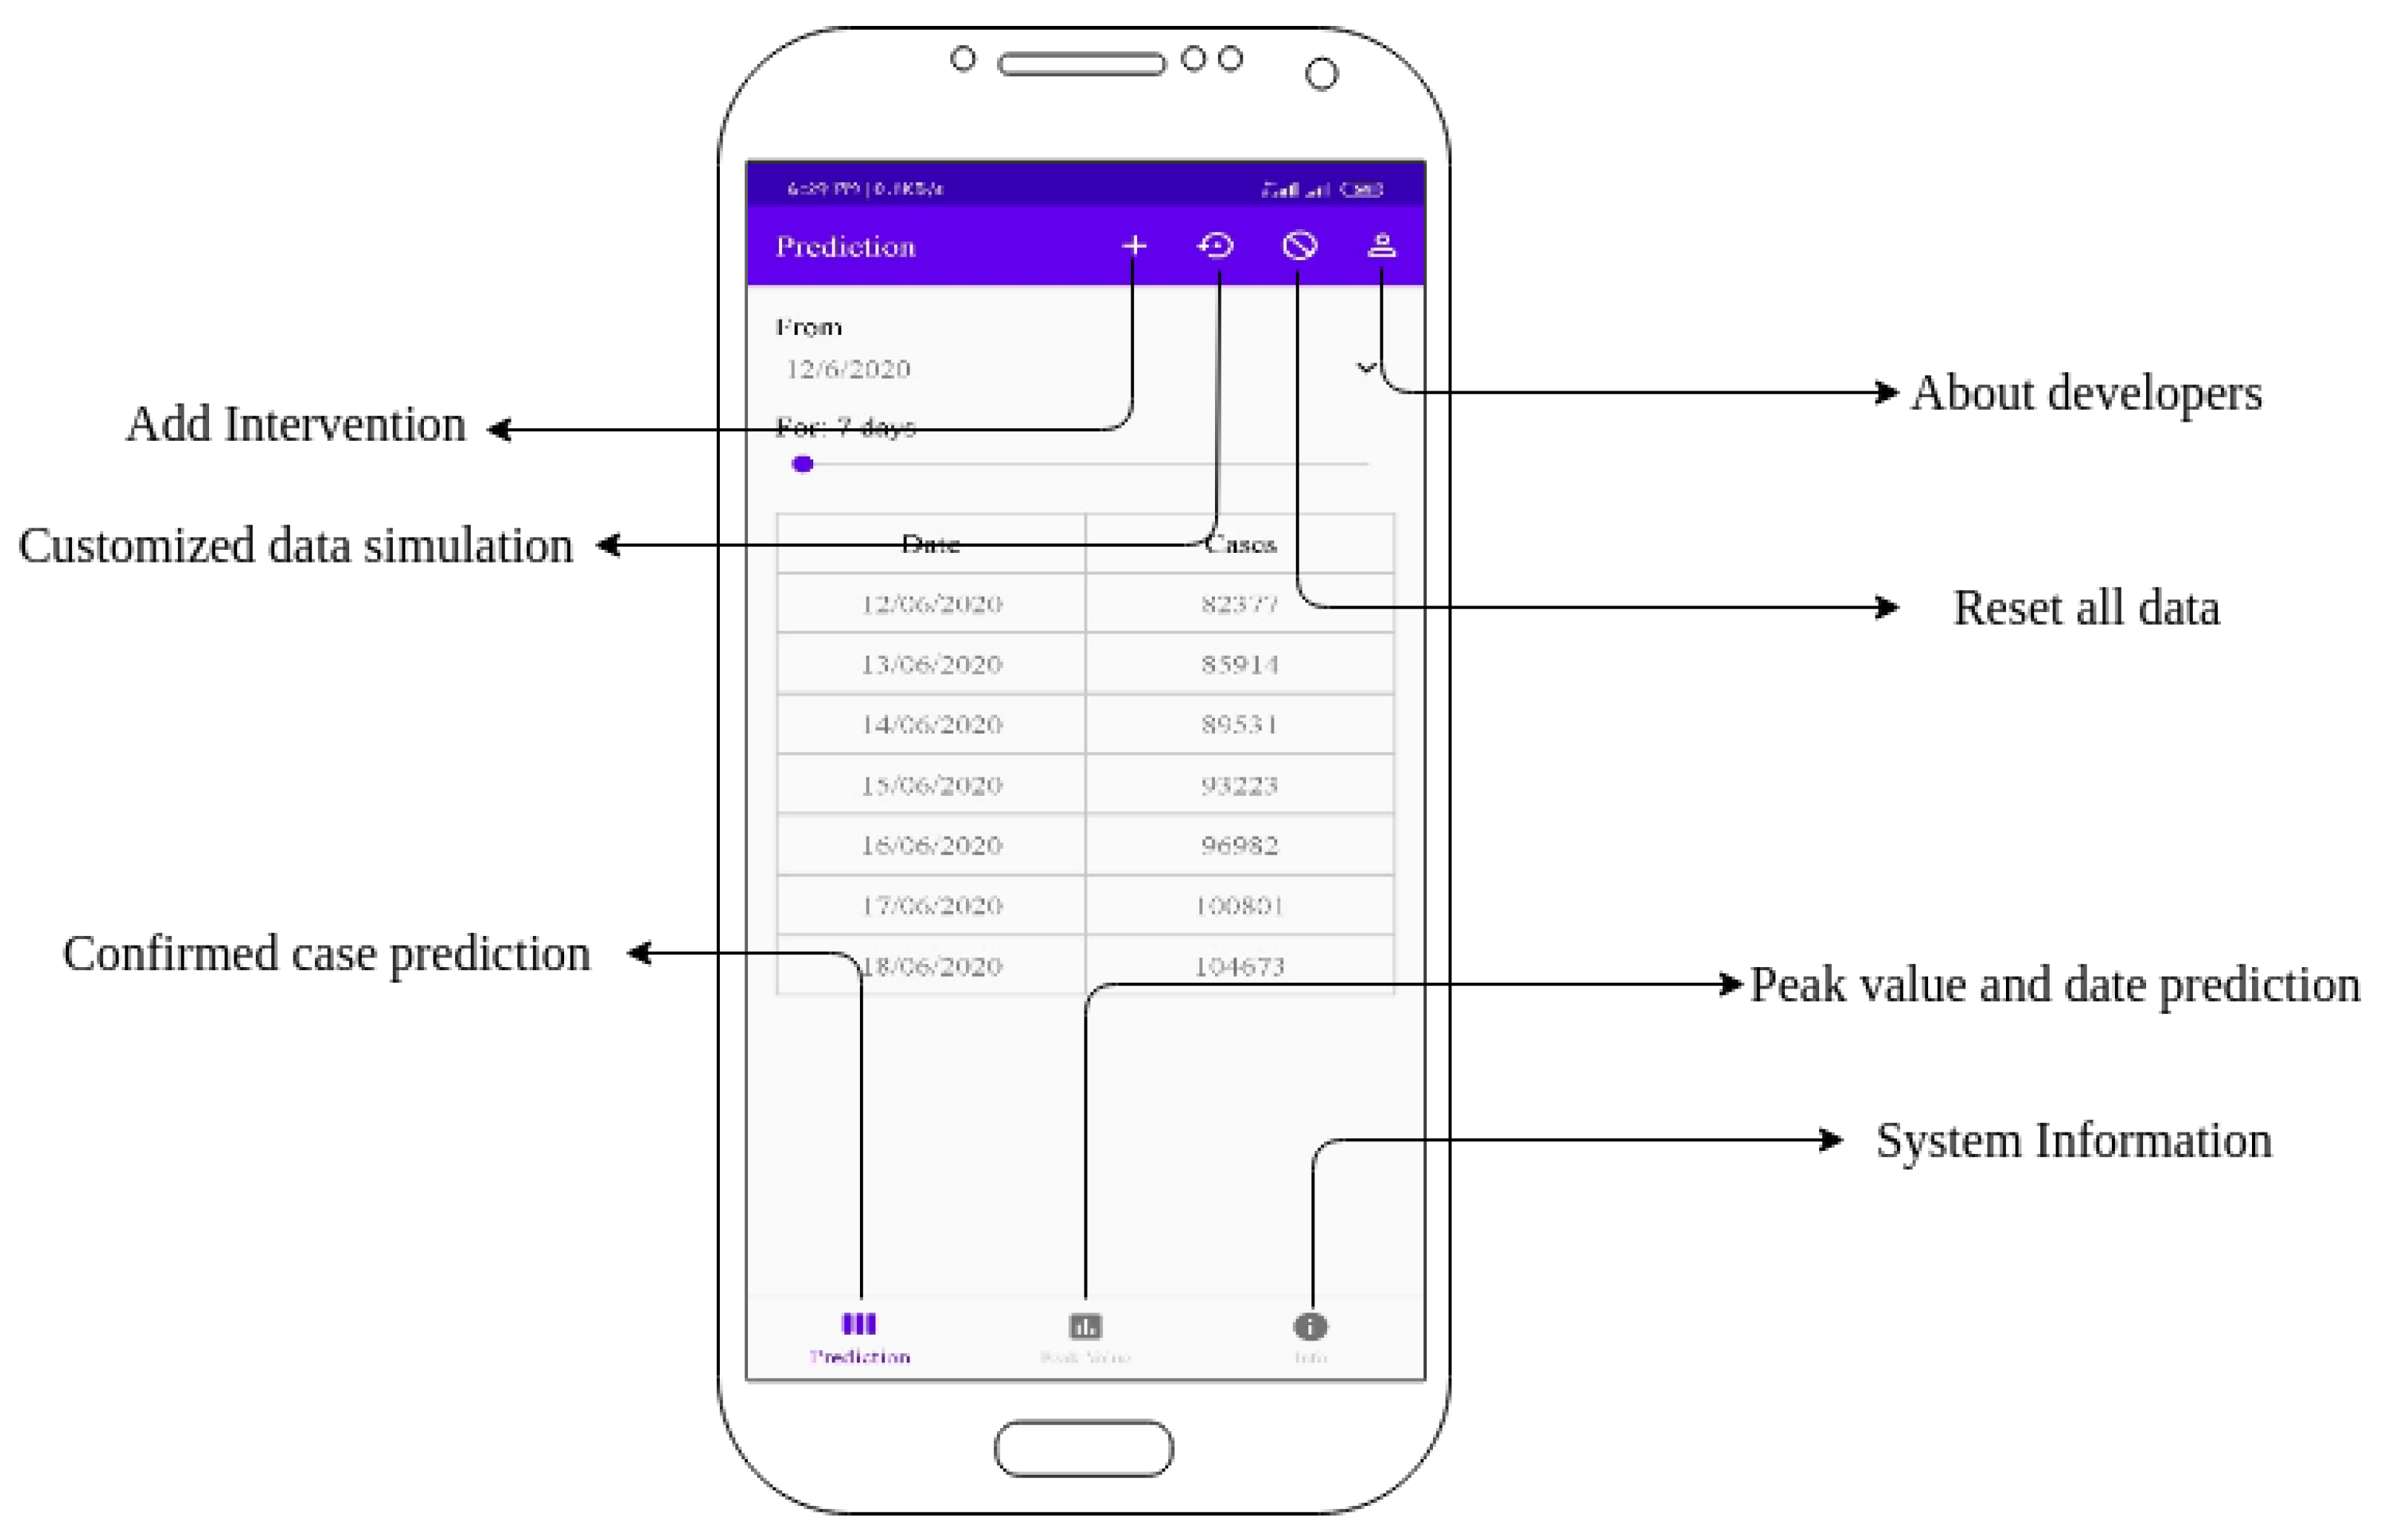
Figure 4 shows the home page of the mobile application. The user can find the predicted confirmed cases for specified days. Moreover, the user can add intervention, simulate with customized data, and reset to original data on the home page.
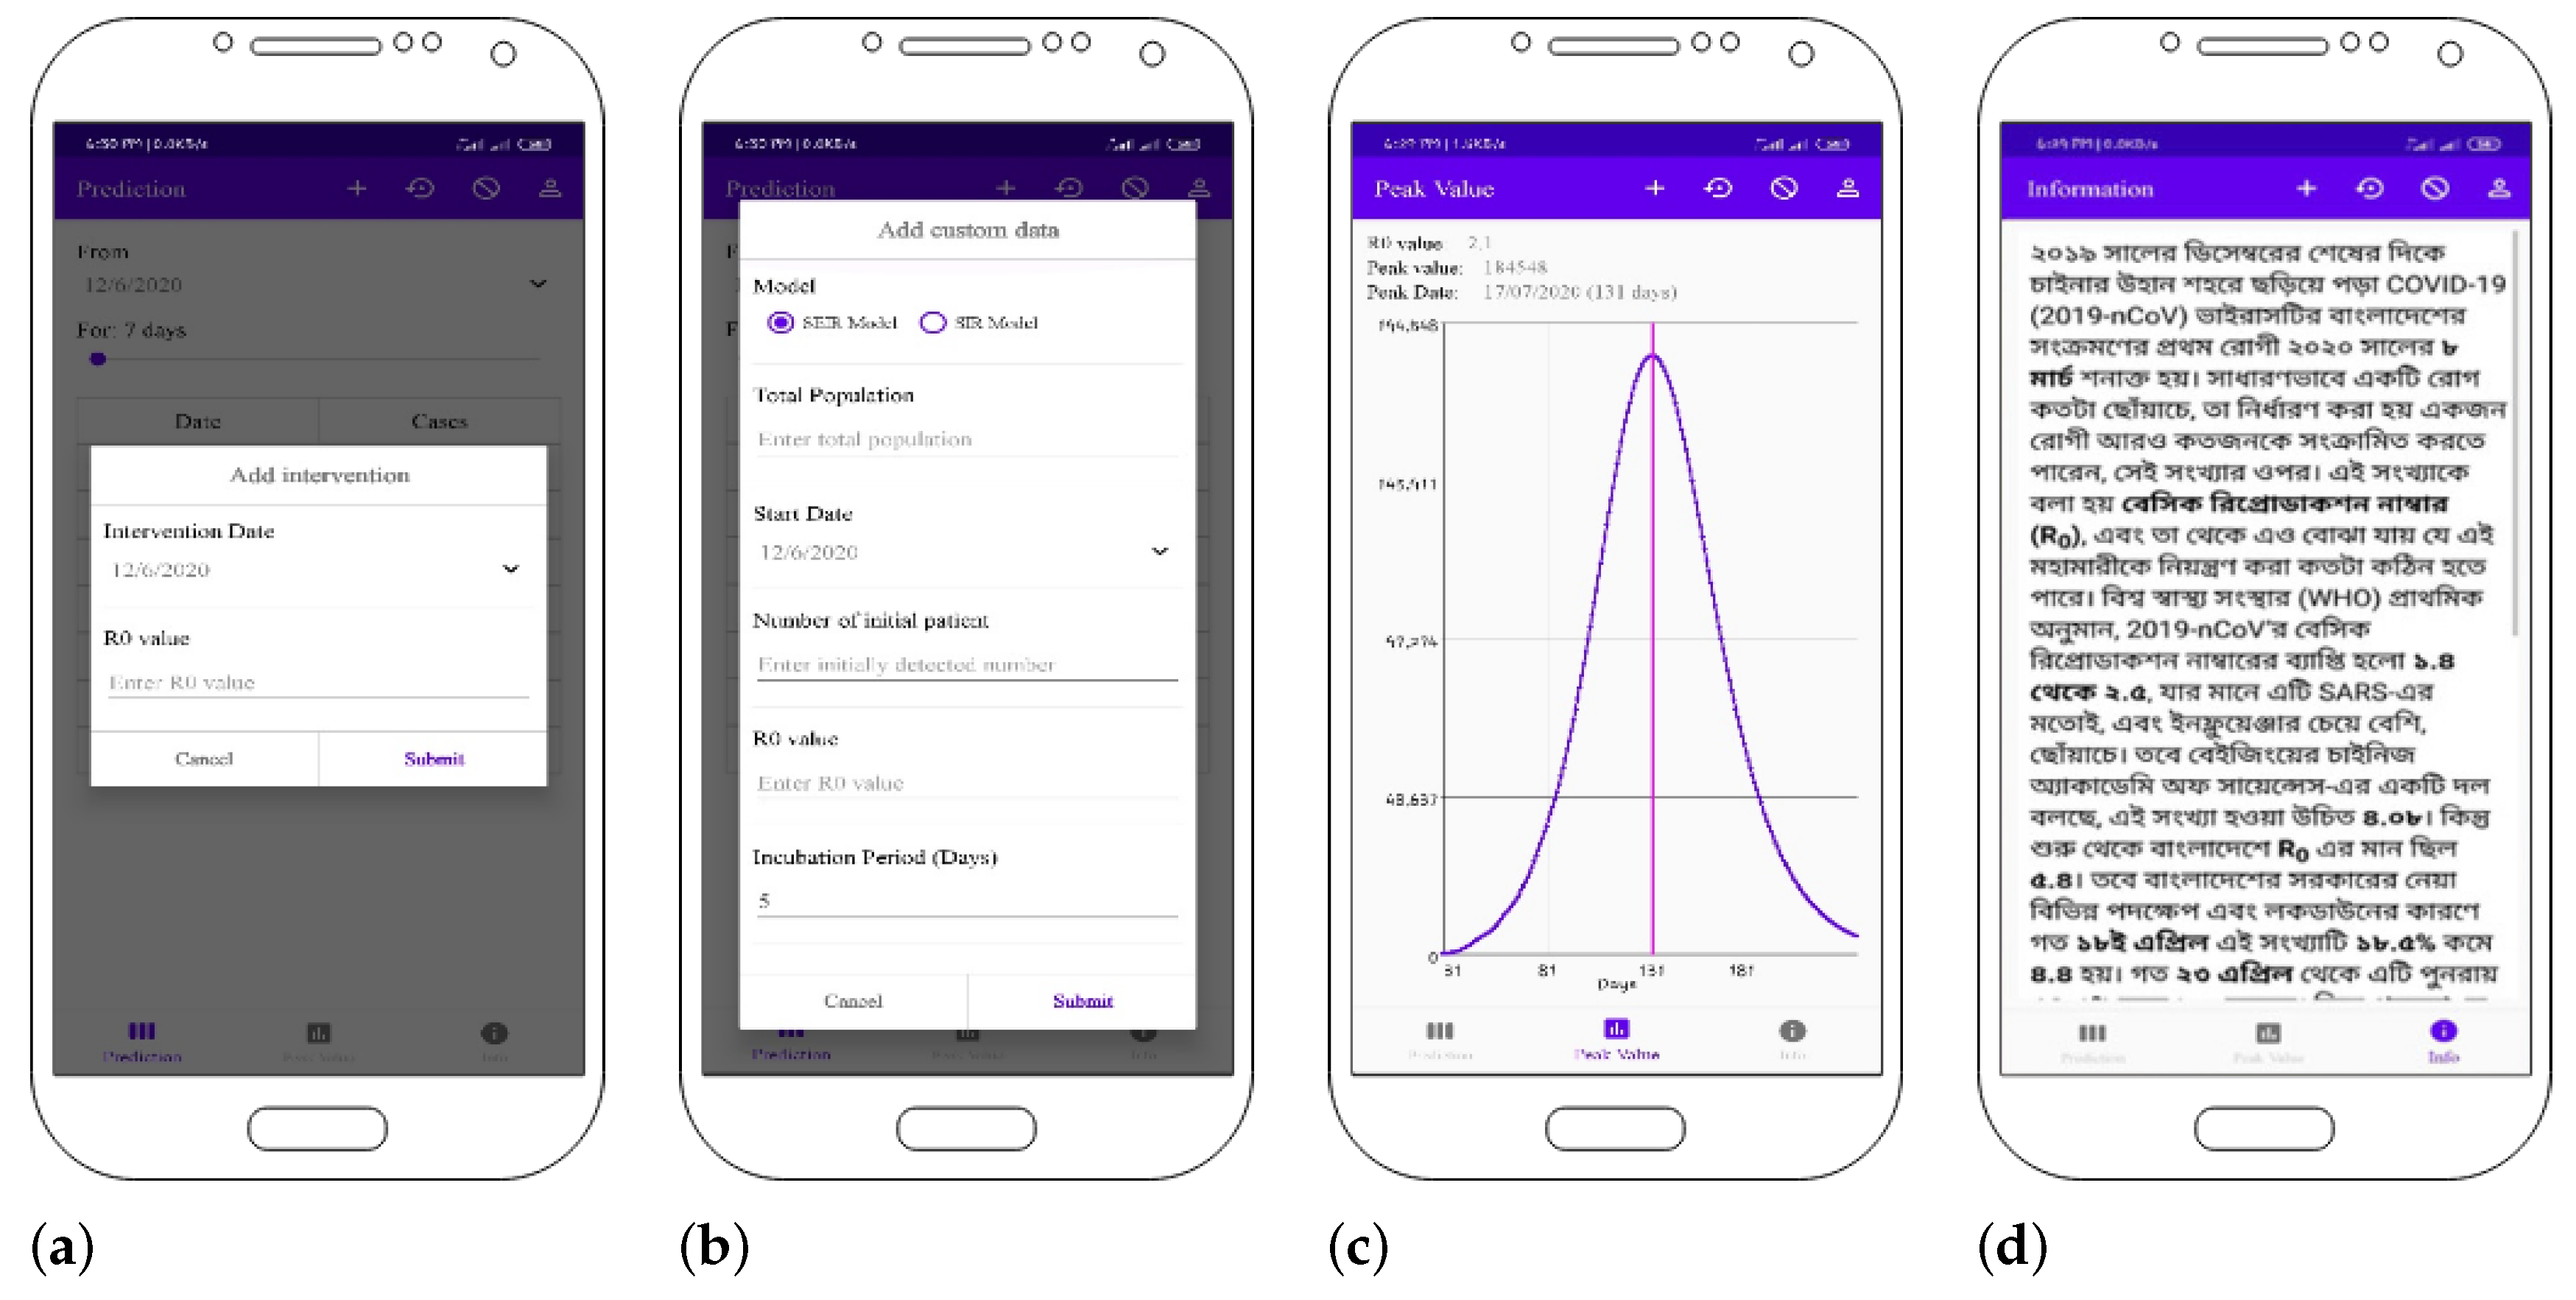
Figure 5 describes the functionality of this application.
The user can add an intervention by indicating a date and a R0 value, which is shown in Figure 5a. In Figure 5b, the user can simulate using custom data and can customize the app using data for their area. The user can simulate a confirmed case plot regarding customized data, which is shown in Figure 5c. In addition, the user can assume the peak value and date with the final R0 value from the plot. General information about the situation as well as the spread of the novel coronavirus, alert messages, and prevention steps is also notified to the user as shown in Figure 5d.
4.2. Controller
The controller of the server accepts requests from the application. It subsequently checks the parameters of the request. Then, it processes the parameters and sends the response through a RESTful API. The derivation process is performed using the Odeint [31] function of the Scipy library [32]. The final calculation process is shown in Algorithm 1. This function takes a list of dates and transmission rates (beta), which are used for intervention. Afterward, it processes the dates as well as the beta list to generate the number of infected patients.
| Algorithm 1 Calculation process of the SEIR differential equations |
|
4.3. RESTful API
The application communicates with the controller using a RESTful API. The controller sends the response to the API in JSON format. The output of this API contains the list of transmission rates over time. Peak value, peak date of confirmed cases, and the reproduction rate (R) of the current situation are also included in this response. However, the application parses the list of confirmed cases and visualizes to the user according to the current date.
5. Implementation
On 8 March 2020 (t = 0), Bangladesh confirmed its first three cases of COVID-19. That is,
where 0.01 ≤≤ 0.1 [7] and N = 1.614 × 10 (the population of Bangladesh is considered to be 161 million [33]).
We assumed each population to be proportional to the total population. Therefore,
The exposed, removed, and quarantined population figures are considered to be 0 at time t = 0. Hence,
Therefore,
We assumed the average incubation period (1/) to be 5 days [19] and the average infection period (1/) to be 10 days [7]. Therefore, = 0.2 and = 0.1 was considered for this experiment. By changing the input values (total population, number of initial confirmed cases, and date of the first case), we can calculate the daily confirmed cases and basic reproduction number R for any specific area of Bangladesh. The model was developed using the Python programming language in Spyder IDE. Numpy, SciPy, Datetime, and Matplotlib were required libraries to develop the program.
Numerical analysis was performed by using the Numpy library. The odeint function of the SciPy library was used to solve the differential equations and to calculate the values of S, E, I, R, and Q at time t. The graphs were generated using the Matplotlib library. The source code is available at [34].
6. Results
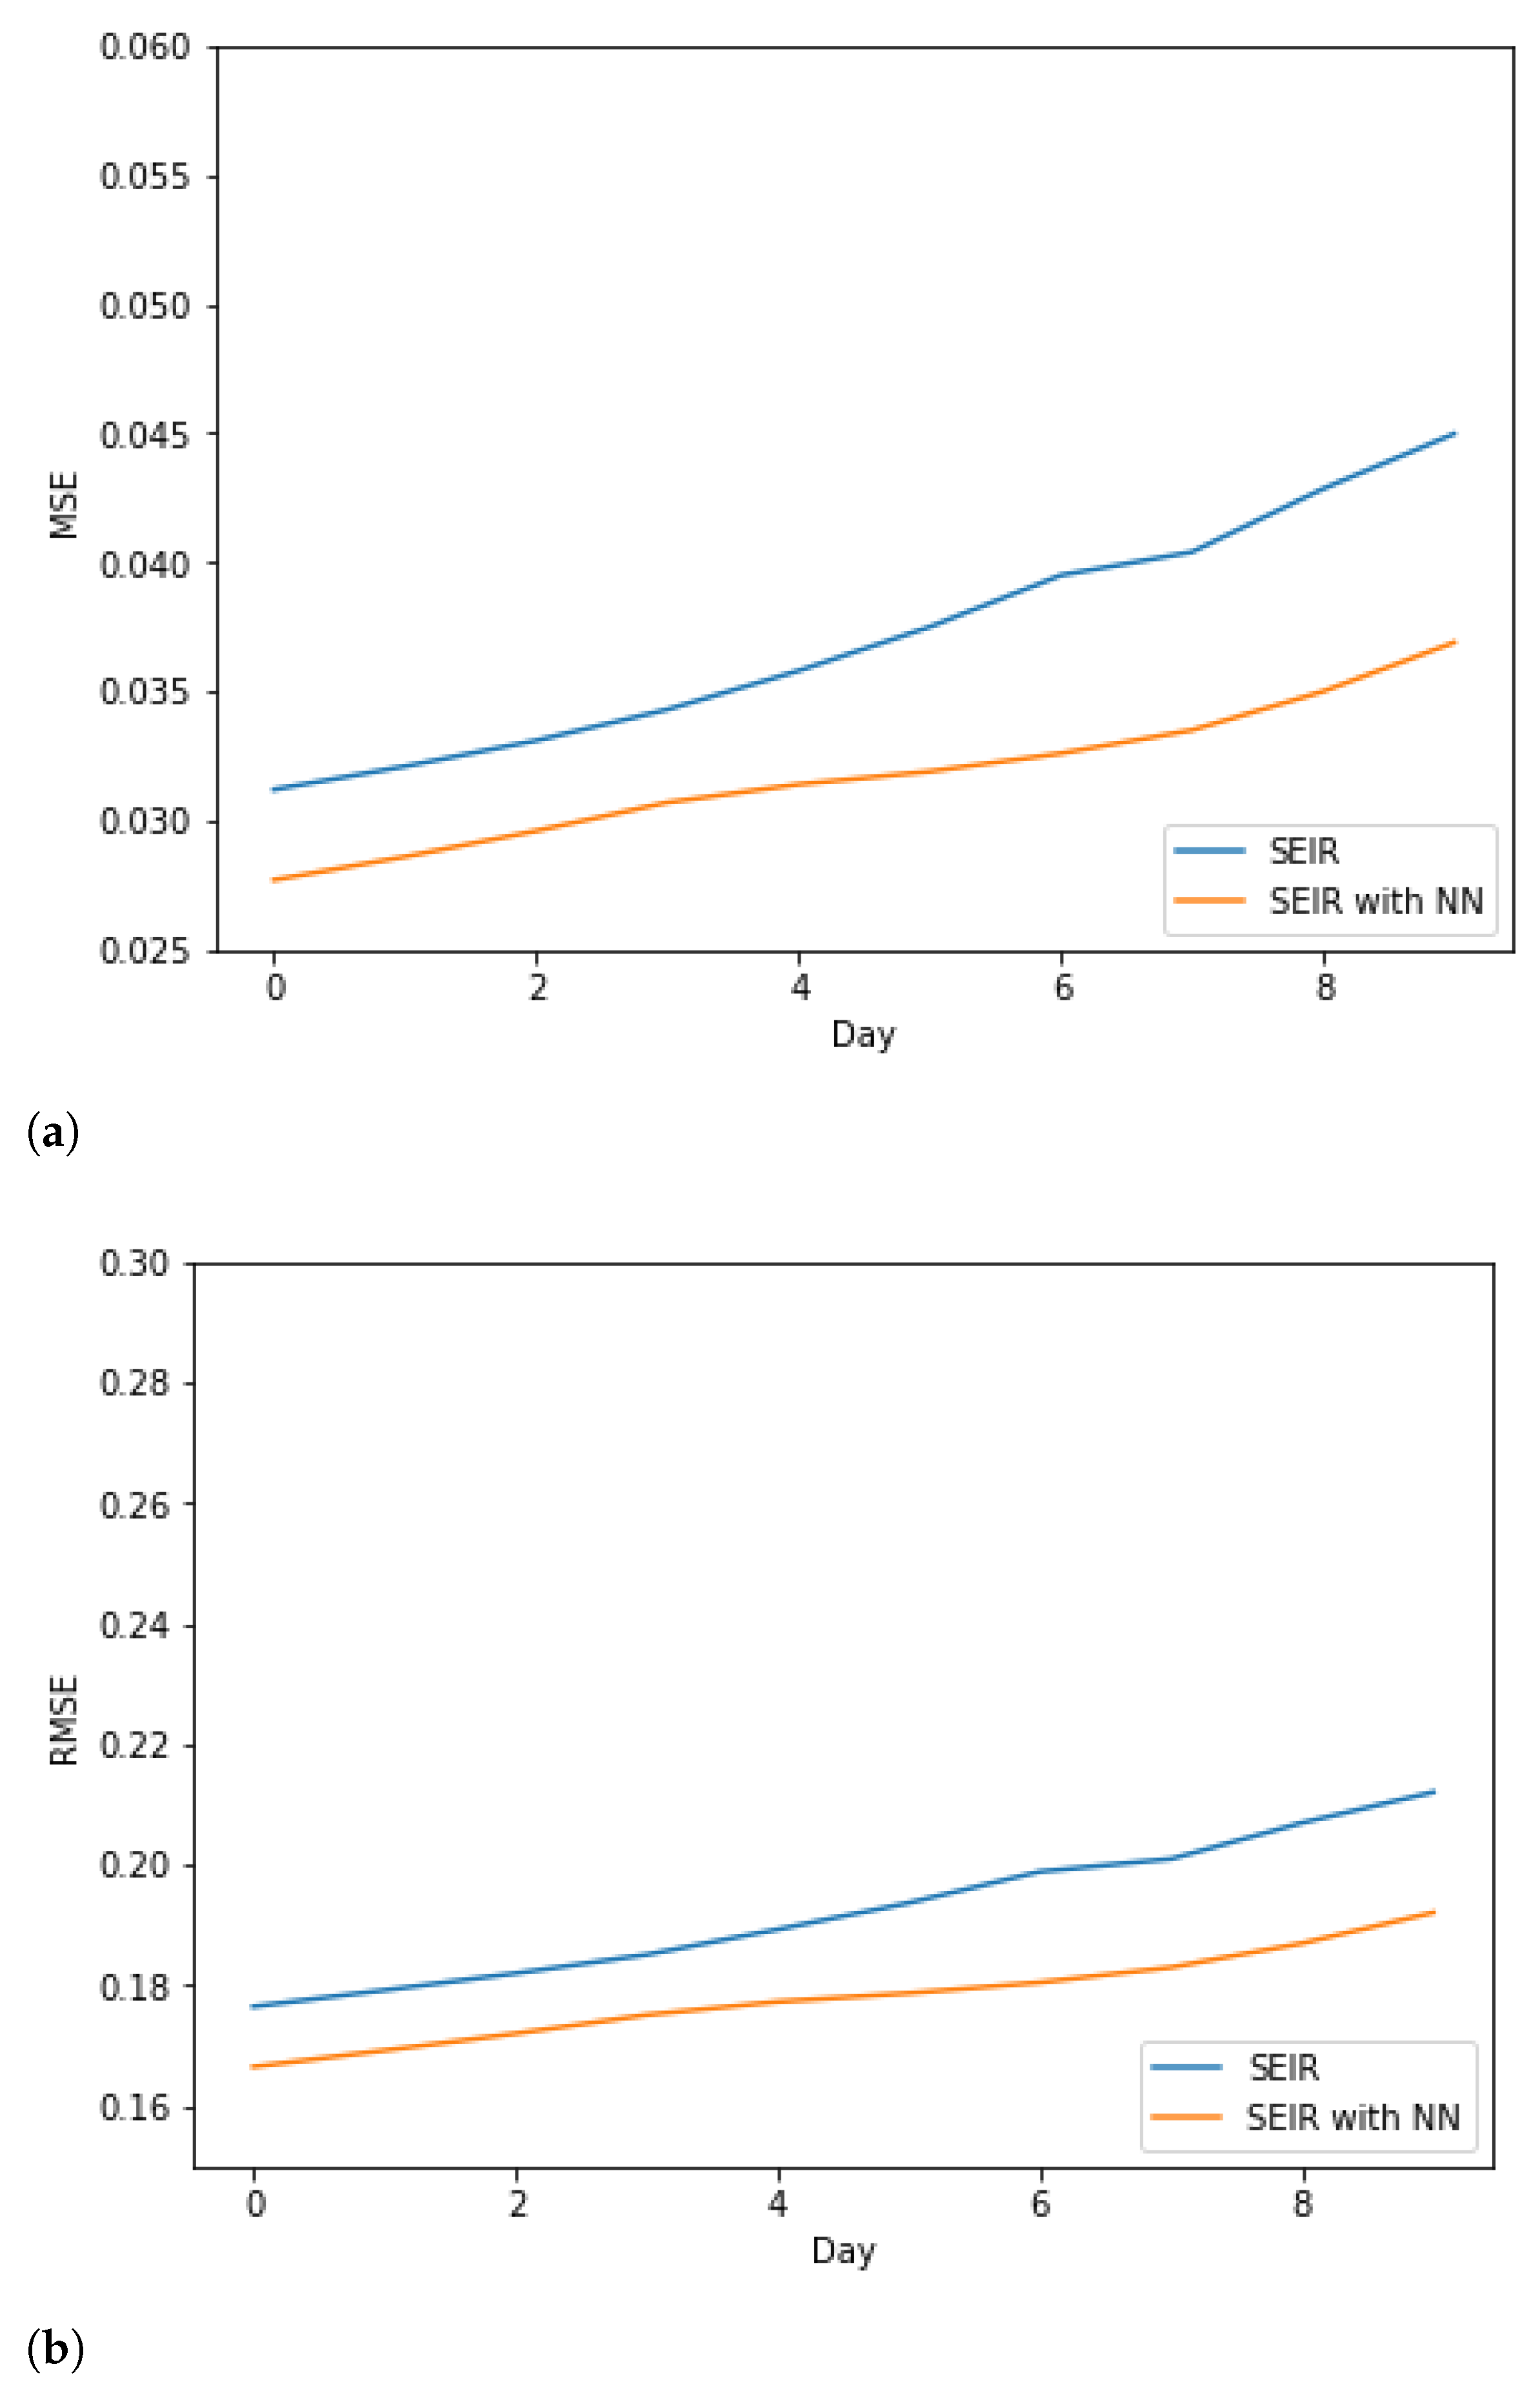
The comparison between the SEIR model and the model combining SEIR with NN includes the Mean Square Error (MSE) and Root Mean Square Error (RMSE) plots in Figure 6a,b. In Figure 6a, we can see that the Mean Square Error (MSE) of predicted confirmed cases is 0.0312 in the SEIR model and 0.0277 in the model combining SEIR with NN on the first day. After that, the error gradually increases over time. Although the error increases greatly on day 4 to day 7 in the SEIR model, the rate decreases in the model combining SEIR with NN. Again from Figure 6b, it can be observed that the Root Mean Square Error (RMSE) of predicted confirmed cases in the model combining SEIR with NN is always lower than that of the SEIR model. Therefore, the performance of our integrated model is better than the SEIR model.
The cross-validation result (mean accuracy) for the model combining SEIR with a neural network is shown in Table 3.
According to Table 3, the best-testing mean accuracy was 91.7%, which was achieved in the last fold. However, the training and validation mean accuracies were achieved in the third fold and they were 97.7% and 95.3%, respectively.
The dataset was trained using the SEIR, SIR, SEIR with NN, and SIR with NN models with the same parameters. The comparison between these models is shown in Table 4. From this table, it can be observed that the performance of our proposed model is better than previously implemented models from the perspective of Bangladesh.
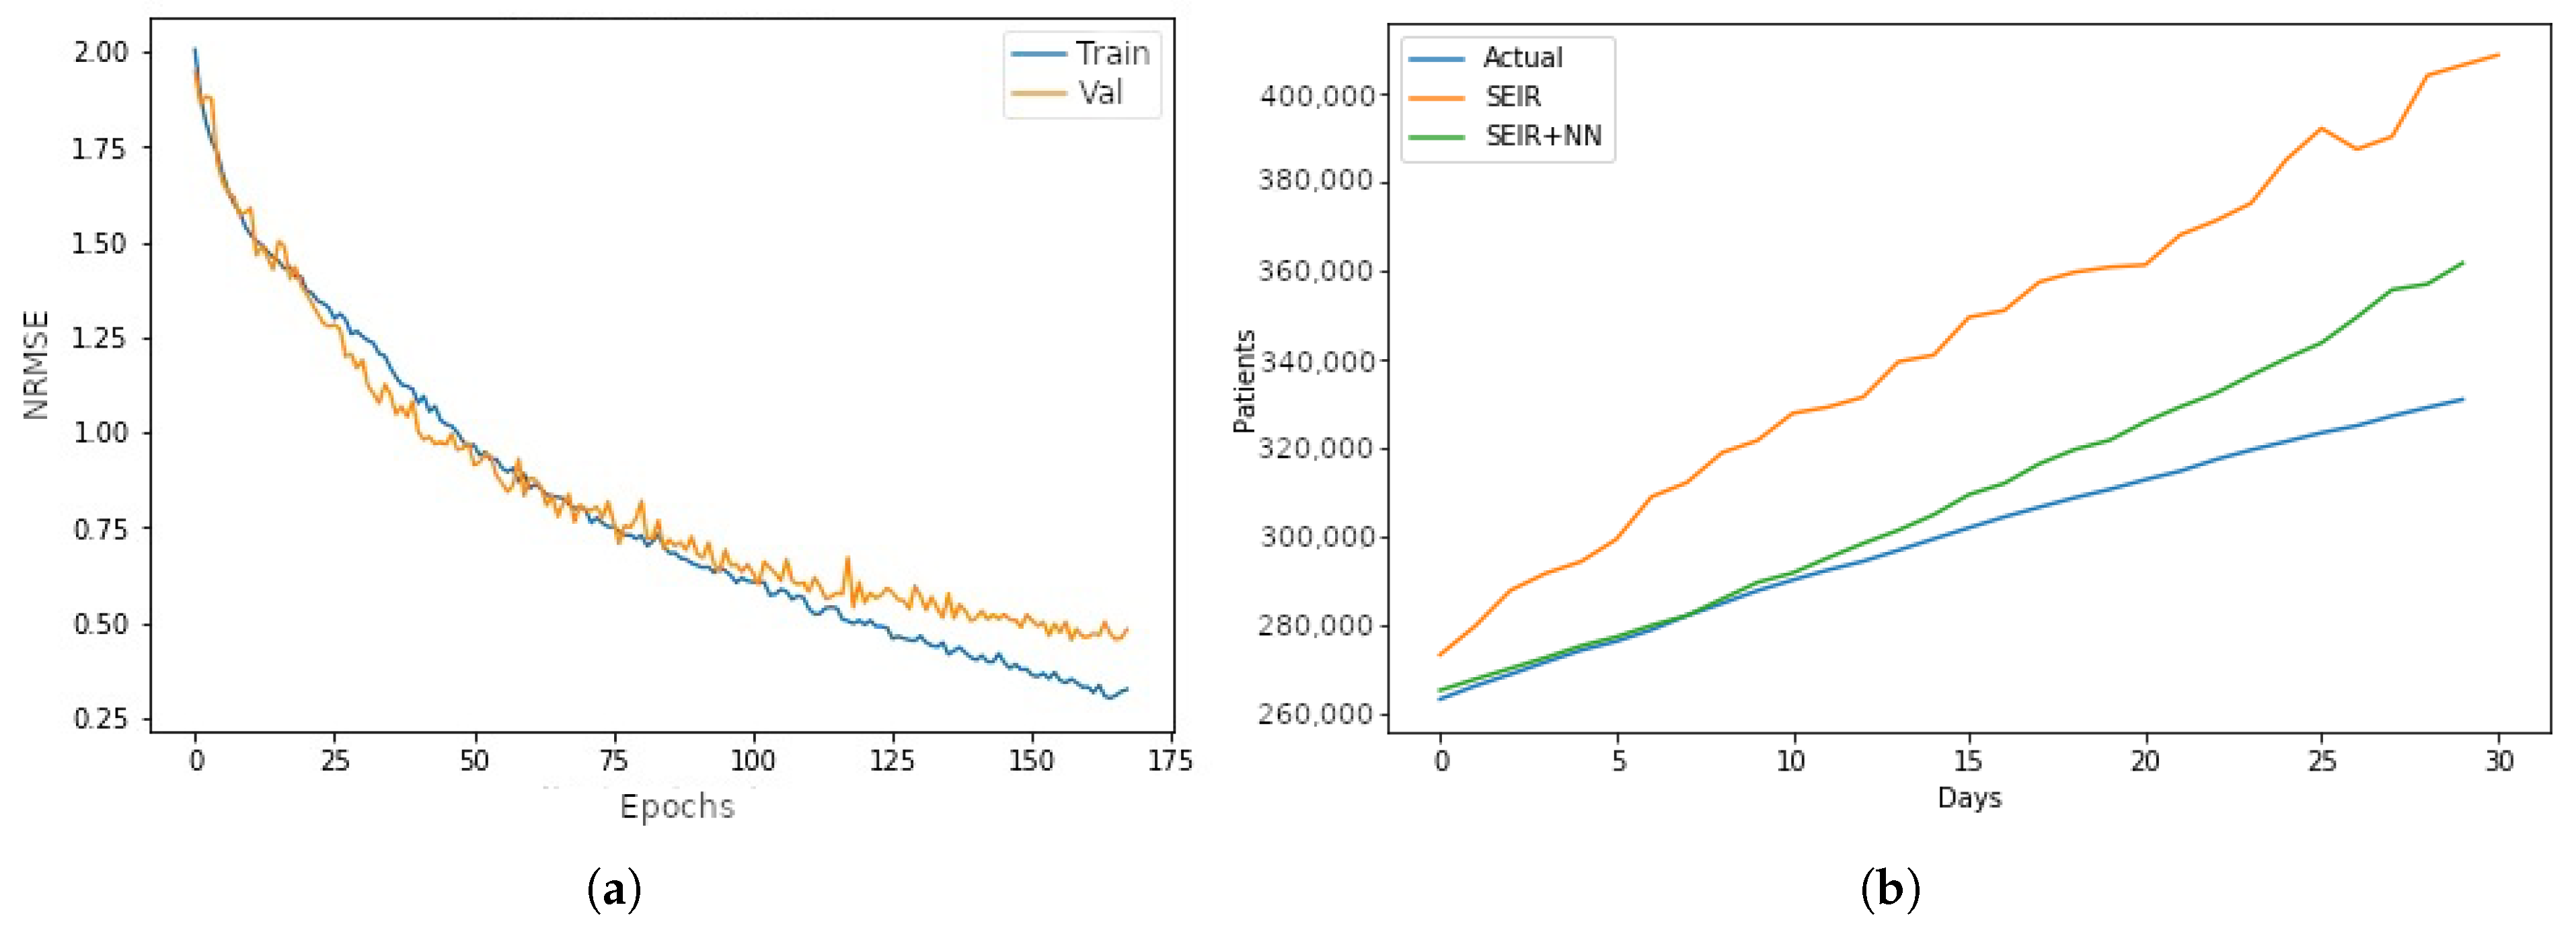
Figure 7a shows the change in Normalized Root Mean Square Error (NRMSE) over epochs. From Figure 7a, it can be observed that the validation error decreases from 1.99 to 0.68 while the training error decreases from 2.00 to 0.66 after the first 100 epochs. After 100 epochs, both the validation and training error decrease gradually. For example, the validation error becomes 0.51, while the training error becomes 0.35 in the last epoch, which is 173.
Figure 7b illustrates a comparison between the actual confirmed cases (which is shown using a blue line) and predicted confirmed cases by using the SEIR model, which is shown using a yellow line. Figure 7b presents a comparison between actual confirmed cases and predicted cases using the combined SEIR and NN model. The predicted confirmed cases using our combined SEIR and NN model are shown using a green line. From this figure, it can be concluded that the prediction of cases by using our combined SEIR and NN model is better than the SEIR model alone.
The neural network is trained using the dataset. It generated a pattern while predicting the number of quarantined patients. Since the number of quarantined patients was deducted from the number of confirmed cases, the prediction of the integrated model was better than that of the normal SEIR model. Thus, the neural network helps the integrated model achieve a higher accuracy than the SEIR model. While the actual confirmed cases depend on the action taken by law-makers, the neural network works on the parameters of trained neurons. Hence, there is some fluctuation in the accuracy of this integrated model.
7. Conclusions
The main goal of this research was to develop a model that can predict the confirmed cases in Bangladesh. Our integrated model can predict the confirmed cases with 90% to 99% accuracy. Moreover, an outlook on the total quarantined persons can also be achieved from this model. Hence, this model can be used in higher-level administrative units to lower-level administrative units of Bangladesh that are controlling this virus. Eventually, this will help decision-makers develop a strategy for each administrative unit in real-time. Thus, a real-time strategy to control this virus at various administrative units of Bangladesh can be developed. This model, however, has some fluctuation while predicting the number of patients for longer periods.
Belief Rule Base [35,36,37,38] is widely used to handle both qualitative and quantitative data and it can be used to measure the R0 value by taking into account all factors. Most of these factors cannot be measured with 100% certainty, and hence, it is an appropriate approach to develop an expert system to measure RQ values. Likewise, in this model, BRB can be developed starting from top-level administration to bottom-level administrative units of Bangladesh. Both the models can be interfaced with the present website developed by the Bangladesh government for coronavirus so that anybody can use them to calculate either R0 values or peak values at any location of the country. A GIS (Geographical Information System) interface can be incorporated with both models, allowing for a user-friendly user interface. In this way, SEIR with both a neural network and BRB models enable the inclusion of intelligence in the decision-making process.
Author Contributions
Conceptualization, S.N.Z., M.S.H. (Mohammad Shahadat Hossain), M.S.H. (Mohammed Sazzad Hossain) and K.A.; methodology, S.N.Z., M.S.H. (Mohammad Shahadat Hossain) and M.S.H. (Mohammed Sazzad Hossain); software, S.N.Z.; validation, M.S.H. (Mohammad Shahadat Hossain) and M.S.H. (Mohammed Sazzad Hossain); formal analysis, S.N.Z.; investigation, M.S.H. (Mohammad Shahadat Hossain), M.S.H. (Mohammed Sazzad Hossain) and K.A.; resources, S.N.Z. and M.S.H. (Mohammad Shahadat Hossain); data curation, S.N.Z. and M.S.H. (Mohammad Shahadat Hossain); writing—original draft preparation, S.N.Z. and M.S.H. (Mohammad Shahadat Hossain); writing—review and editing, M.S.H. (Mohammad Shahadat Hossain), M.S.H. (Mohammed Sazzad Hossain) and K.A.; visualization, S.N.Z.; supervision, M.S.H. (Mohammad Shahadat Hossain), M.S.H. (Mohammed Sazzad Hossain) and K.A. All authors have read and agreed to the published version of the manuscript
Funding
This research received no external funding.
Institutional Review Board Statement
Not applicable.
Informed Consent Statement
Not applicable.
Conflicts of Interest
The authors declare no conflict of interest.
References
- Dhar, B. Coronavirus: Rangamati Remains Only District to Report Zero Infection. 2020. Available online: https://www.dhakatribune.com/bangladesh/nation/2020/05/03/coronavirus-rangmati-marks-to-be-the-only-district-to-report-zero-infection (accessed on 1 February 2021).
- Sakib, S.N. Bangladesh: Low COVID-19 Testing Rate Raises Concerns. 2020. Available online: https://unb.com.bd/category/bangladesh/16-more-testing-labs-soon-health-minister/51376 (accessed on 1 February 2021).
- Mohiuddin, A.K. Covid-19 Situation in Bangladesh, Preprints 2020. Available online: https://0-doi-org.brum.beds.ac.uk/10.20944/preprints202005.0094.v1 (accessed on 18 March 2021).
- Li, M.Y.; Muldowney, J.S. Global stability for the SEIR model in epidemiology. Math. Biosci. 1995, 125, 155–164. [Google Scholar] [CrossRef]
- Zisad, S.N.; Hossain, M.S.; Andersson, K. Speech emotion recognition in neurological disorders using Convolutional Neural Network. In International Conference on Brain Informatics; Springer: Cham, Switzerland, 2020; pp. 287–296. [Google Scholar]
- Hecht-Nielsen, R. Theory of the backpropagation neural network. Neural Netw. Percept. 1992, 2, 65–93. [Google Scholar]
- Kuniya, T. Prediction of the epidemic peak of coronavirus disease in Japan, 2020. J. Clin. Med. 2020, 9, 789. [Google Scholar] [CrossRef] [PubMed] [Green Version]
- Dandekar, R.; Barbastathis, G. Neural Network aided quarantine control model estimation of global Covid-19 spread. arXiv 2020, arXiv:2004.02752. [Google Scholar]
- Rezapour, S.; Mohammadi, H.; Samei, M.E. SEIR epidemic model for COVID-19 transmission by Caputo derivative of fractional order. Adv. Differ. Equ. 2020, 2020, 1–19. [Google Scholar] [CrossRef]
- Anderez, D.O.; Kanjo, E.; Pogrebna, G.; Kaiwartya, O.; Johnson, S.D.; Hunt, J.A. A COVID-19-Based Modified Epidemiological Model and Technological Approaches to Help Vulnerable Individuals Emerge from the Lockdown in the UK. Sensors 2020, 20, 4967. [Google Scholar] [CrossRef] [PubMed]
- Huang, Y.; Yang, L.; Dai, H.; Tian, F.; Chen, K. Epidemic situation and forecasting of COVID-19 in and outside China. Bull. World Health Organ. 2020, 10. [Google Scholar] [CrossRef]
- Owusu-Mensah, I.; Akinyemi, L.; Oduro, B.; Iyiola, O.S. A fractional order approach to modeling and simulations of the novel COVID-19. Adv. Differ. Equ. 2020, 2020, 683. [Google Scholar] [CrossRef]
- Mirzaee, N.; Barouni, M.; Goudarzi, R.; Jahani, Y.; Haghdoost, A.; Gohari, M.A.; Nakhaeizadeh, M.; McFarland, W.; Sharifi, H. Prediction the burden of COVID-19 in Iran: Application of disability-adjusted life years (DALYs). Res. Sq. 2020. [Google Scholar] [CrossRef]
- Kheirallah, K.A.; Alsinglawi, B.; Alzoubi, A.; Saidan, M.N.; Mubin, O.; Alorjani, M.S.; Mzayek, F. The Effect of Strict State Measures on the Epidemiologic Curve of COVID-19 Infection in the Context of a Developing Country: A Simulation from Jordan. Int. J. Environ. Res. Public Health 2020, 17, 6530. [Google Scholar] [CrossRef]
- Kochańczyk, M.; Grabowski, F.; Lipniacki, T. Super-spreading events initiated the exponential growth phase of COVID-19 with R0 higher than initially estimated. R. Soc. Open Sci. 2020, 7, 200786. [Google Scholar] [CrossRef]
- Le, N.Q.K. Fertility-GRU: Identifying fertility-related proteins by incorporating deep-gated recurrent units and original position-specific scoring matrix profiles. J. Proteome Res. 2019, 18, 3503–3511. [Google Scholar] [CrossRef]
- Le, N.Q.K.; Do, D.T.; Hung, T.N.K.; Lam, L.H.T.; Huynh, T.T.; Nguyen, N.T.K. A computational framework based on ensemble deep neural networks for essential genes identification. Int. J. Mol. Sci. 2020, 21, 9070. [Google Scholar] [CrossRef] [PubMed]
- Sun, D.; Duan, L.; Xiong, J.; Wang, D. Modeling and forecasting the spread tendency of the COVID-19 in China. Adv. Differ. Equ. 2020, 2020, 1–16. [Google Scholar] [CrossRef] [PubMed]
- Linton, N.M.; Kobayashi, T.; Yang, Y.; Hayashi, K.; Akhmetzhanov, A.R.; Jung, S.M.; Yuan, B.; Kinoshita, R.; Nishiura, H. Incubation period and other epidemiological characteristics of 2019 novel coronavirus infections with right truncation: A statistical analysis of publicly available case data. J. Clin. Med. 2020, 9, 538. [Google Scholar] [CrossRef] [Green Version]
- Cuomo, N.Y.G.A. Coronavirus Press Briefing. 2020. Available online: https://www.facebook.com/NowThisPolitics/videos/613568519231254/ (accessed on 1 February 2021).
- Cuomo, N.Y.G.A. Coronavirus Press Briefing. 2020. Available online: https://www.facebook.com/GovernorAndrewCuomo/videos/1463036797212660/ (accessed on 1 February 2021).
- Jeong, D.S.; Kim, I.; Ziegler, M.; Kohlstedt, H. Towards artificial neurons and synapses: A materials point of view. RSC Adv. 2013, 3, 3169–3183. [Google Scholar] [CrossRef]
- Bottou, L. Stochastic gradient learning in neural networks. Proc. Neuro-Nımes 1991, 91, 12. [Google Scholar]
- Bangladesh. Coronavirus Disease 2019 (COVID-19) Information Bangladesh. 2020. Available online: http://www.corona.gov.bd/ (accessed on 1 February 2021).
- Pienaar, S.W.; Malekian, R. Human activity recognition using LSTM-RNN deep neural network architecture. In Proceedings of the 2019 IEEE 2nd Wireless Africa Conference (WAC), Pretoria, South Africa, 18–20 August 2019; pp. 1–5. [Google Scholar]
- Schmidt-Hieber, J. Nonparametric regression using deep neural networks with ReLU activation function. Ann. Stat. 2020, 48, 1875–1897. [Google Scholar] [CrossRef]
- Bottou, L. Stochastic gradient descent tricks. In Neural Networks: Tricks of the Trade; Springer: Berlin/Heidelberg, Germany, 2012; pp. 421–436. [Google Scholar]
- Stephen, K.D.; Kazemi, A. Improved normalization of time-lapse seismic data using normalized root mean square repeatability data to improve automatic production and seismic history matching in the Nelson field. Geophys. Prospect. 2014, 62, 1009–1027. [Google Scholar] [CrossRef]
- Miller, M.A.; Schwartz, T.; Pickett, B.E.; He, S.; Klem, E.B.; Scheuermann, R.H.; Passarotti, M.; Kaufman, S.; O’Leary, M.A. A RESTful API for access to phylogenetic tools via the CIPRES science gateway. Evol. Bioinform. 2015, 11, EBO–S21501. [Google Scholar] [CrossRef]
- Bourhis, P.; Reutter, J.L.; Suárez, F.; Vrgoč, D. JSON: Data model, query languages and schema specification. In Proceedings of the 36th ACM SIGMOD-SIGACT-SIGAI Symposium on Principles of Database Systems, Raleigh, NC, USA, 14–19 May 2017; pp. 123–135. [Google Scholar]
- Scipy.org. Scipy.integrate.odeint-SciPy v1.5.2 Reference Guide. 2008. Available online: https://docs.scipy.org/doc/scipy/reference/generated/scipy.integrate.odeint.html (accessed on 1 February 2021).
- Olivier, B.; Rohwer, J.M.; Hofmeyr, J. Modelling cellular processes with Python and Scipy. Mol. Biol. Rep. 2002, 29, 249–254. [Google Scholar] [CrossRef] [PubMed]
- Explorer, G.P.D. World Development Indicators. 2020. Available online: https://www.google.com/publicdata/explore?ds=d5bncppjof8f9_&met_y=sp_pop_totl&idim=country:BGD&hl=en&dl=en (accessed on 1 February 2021).
- Sharif Noor Zisad. Snzisad/Covid-19-seir-nn-bd. 2021. Available online: https://github.com/snzisad/covid-19-seir-nn-bd (accessed on 28 February 2021).
- Hossain, M.S.; Rahaman, S.; Mustafa, R.; Andersson, K. A belief rule-based expert system to assess suspicion of acute coronary syndrome (ACS) under uncertainty. Soft Comput. 2018, 22, 7571–7586. [Google Scholar] [CrossRef] [Green Version]
- Hossain, M.S.; Ahmed, F.; Fatema-Tuj-Johora; Andersson, K. A belief rule based expert system to assess tuberculosis under uncertainty. J. Med. Syst. 2017, 41, 43. [Google Scholar] [CrossRef] [PubMed] [Green Version]
- Hossain, M.S.; Rahaman, S.; Kor, A.L.; Andersson, K.; Pattinson, C. A belief rule based expert system for datacenter pue prediction under uncertainty. IEEE Trans. Sustain. Comput. 2017, 2, 140–153. [Google Scholar] [CrossRef] [Green Version]
- Hossain, M.S.; Zander, P.O.; Kamal, M.S.; Chowdhury, L. Belief-rule-based expert systems for evaluation of e-government: A case study. Expert Syst. 2015, 32, 563–577. [Google Scholar] [CrossRef]
Figure 1.
SEIR (Susceptible, Exposed, Infected, Removed) model.

Figure 2.
SEIR model with a neural network.

Figure 3.
Mobile application architecture.

Figure 4.
Home page of the mobile application.

Figure 5.
(a) Adding an intervention. (b) Simulating with custom data. (c) Peak value visualization. (d) General information.
Figure 5.
(a) Adding an intervention. (b) Simulating with custom data. (c) Peak value visualization. (d) General information.

Figure 6.
(a) Mean Squear Error (MSE) and (b) Root Mean Squeare Error (RMSE).

Figure 7.
(a) NRMSE vs. epochs. (b) Confirmed cases comparison plot.


Table 1.
Related Works.
| Ref. No. | Description | Model | Limitation |
|---|---|---|---|
| [7] | Generated the peak value for multiple infection rates. Visualized the effect of intervention. | SEIR | Cannot calculate results for specific parts of a country. |
| [8] | Calculated the quarantine strength and effective reproduction number for more than 500 patients. | SIR+NN | Cannot suggest an end date to the pandemic. |
| [9] | A numerical simulation based on real data for predicting the transmission of the novel coronavirus. | SEIR | Cannot predict the number of quarantined persons in a day. |
| [10] | Investigated the relationship between vulnerable patients and the number of deaths. | Modified SEIR | Cannot analyze the impact of a lockdown in any area. |
| [11] | Forecasted the latest pandemic situation of COVID-19 inside and outside of China until 7 March 2020. | Time varying SIR | Applicable only in China. |
| [12] | Introduced a new parameter named testing rates accompanying transmission rate and transition rate. The outcome of this experiment suggests that there is a strong benefit in tracing and moving tests. | Fractional type SEIR | Cannot predict the number of quarantined persons in a day. |
| [13] | Predicted the disability-adjusted life years (DALYs) of Iran. The result shows that the total DALYs among women and men are 861 years/100,000 and 1082/100,000, respectively. | Extended SEIR | Cannot suggest an end date to the pandemic. |
| [14] | Assessed the impact of non-pharmaceutical interventions during this pandemic | Modified SEIR | Cannot analyze the impact of a lockdown in any area. |
| [15] | Considered the exponential phases of this disease in Italy, France, China, Switzerland, Spain, the UK, New York State, and Germany. The range was estimated as 4.7 to 11.4, which was higher than previous estimates. | SEIR | Cannot calculate results for specific parts of a country. |
| [18] | The removed compartment was extended using two new compartments: death and cured. The model parameters was estimated depending on the issued data of China. | Improved SEIR | Applicable only in China. |
Table 2.
Neural network parameters.
| Batch Size | Units | Optimizer | Activation Function | Mean | Standard Deviation |
|---|---|---|---|---|---|
| 25 | 25 | SGD | Relu | 0.830 | 0.0420 |
| 25 | 25 | SGD | Sigmoid | 0.835 | 0.0212 |
| 25 | 25 | Adam | Relu | 0.775 | 0.0353 |
| 25 | 25 | Adam | Sigmoid | 0.795 | 0.0212 |
| 32 | 40 | SGD | Sigmoid | 0.890 | 0.0140 |
| 32 | 40 | SGD | Relu | 0.930 | 0.0670 |
| 32 | 40 | Adam | Relu | 0.865 | 0.0353 |
| 32 | 40 | Adam | Sigmoid | 0.930 | 0.0283 |
| 40 | 50 | SGD | Relu | 0.895 | 0.0353 |
| 40 | 50 | SGD | Sigmoid | 0.801 | 0.0283 |
| 40 | 50 | Adam | Relu | 0.790 | 0.0141 |
| 40 | 50 | Adam | Sigmoid | 0.820 | 0.0283 |
Table 3.
Cross validation result (mean) of the SEIR model with a neural network.
| Fold | Training Accuracy | Validation Accuracy | Testing Accuracy |
|---|---|---|---|
| Fold 1 | 0.974 | 0.931 | 0.915 |
| Fold 2 | 0.925 | 0.915 | 0.881 |
| Fold 3 | 0.977 | 0.953 | 0.911 |
| Fold 4 | 0.958 | 0.912 | 0.897 |
| Fold 5 | 0.947 | 0.935 | 0.917 |
| Average | 0.956 | 0.929 | 0.904 |
| Best | 0.977 | 0.953 | 0.917 |
Table 4.
Comparison between previous models.
| Model | Mean | Standard Deviation |
|---|---|---|
| SIR | 0.772 | 0.0352 |
| SEIR | 0.797 | 0.0215 |
| SIR with NN | 0.835 | 0.0212 |
| Proposed Model | 0.895 | 0.0353 |
Publisher’s Note: MDPI stays neutral with regard to jurisdictional claims in published maps and institutional affiliations. |
© 2021 by the authors. Licensee MDPI, Basel, Switzerland. This article is an open access article distributed under the terms and conditions of the Creative Commons Attribution (CC BY) license (http://creativecommons.org/licenses/by/4.0/).
Share and Cite
MDPI and ACS Style
Zisad, S.N.; Hossain, M.S.; Hossain, M.S.; Andersson, K. An Integrated Neural Network and SEIR Model to Predict COVID-19. Algorithms 2021, 14, 94. https://0-doi-org.brum.beds.ac.uk/10.3390/a14030094
AMA Style
Zisad SN, Hossain MS, Hossain MS, Andersson K. An Integrated Neural Network and SEIR Model to Predict COVID-19. Algorithms. 2021; 14(3):94. https://0-doi-org.brum.beds.ac.uk/10.3390/a14030094
Chicago/Turabian StyleZisad, Sharif Noor, Mohammad Shahadat Hossain, Mohammed Sazzad Hossain, and Karl Andersson. 2021. "An Integrated Neural Network and SEIR Model to Predict COVID-19" Algorithms 14, no. 3: 94. https://0-doi-org.brum.beds.ac.uk/10.3390/a14030094
Note that from the first issue of 2016, this journal uses article numbers instead of page numbers. See further details here.