
Valuation of Forest Ecosystem Services in Taiwan


1
Chief Secretary Office, Taiwan Forestry Research Institute, No. 53 Nanhai Rd., Taipei 10066, Taiwan
2
Department of Forestry and Resource Conservation, National Taiwan University, No. 1, Sec. 4, Roosevelt Rd., Taipei 10617, Taiwan
3
Forestry Economics Division, Taiwan Forestry Research Institute, No. 53 Nanhai Rd., Taipei 10066, Taiwan
*
Author to whom correspondence should be addressed.
Forests 2021, 12(12), 1694; https://0-doi-org.brum.beds.ac.uk/10.3390/f12121694
Submission received: 16 November 2021
/
Revised: 1 December 2021
/
Accepted: 2 December 2021
/
Published: 3 December 2021
(This article belongs to the Special Issue Forests as Nature-Based Solutions: Ecosystem Services, Multiple Benefits and Trade-Offs)
Abstract
:Forest is the largest ecosystem in the land area of Taiwan. In the past, most of the studies on the evaluation of forest ecosystem services were regional, and therefore lacked national assessment. This study uses a market value method and a benefit transfer method to assess the value of the forest ecosystem services in Taiwan, and expounds the link between ecosystem services and the effectiveness of forestry management and conservation. Preliminarily, it is estimated that the total value of forest ecosystem services in 2016 was approximately NT $749,278 million (equal to approximately 47.6 billion U.S. dollars, PPP-corrected), accounting for 4.28% of the GDP in 2016. The quotation of unit price data has a huge impact on the final assessment results of forest ecosystem service value, and therefore it is necessary use it appropriately.
1. Introduction
The concept of ecosystem services (ESs) has gained recognition and been put into use since the late 1970s [1], and ES classification methods have also been proposed gradually [2,3,4]. The “Millennium Ecosystem Assessment (MEA)” of 2005, which assessed the effects of ecosystem changes on human well-being, laid a scientific foundation for the actions required to strengthen ecosystems’ contributions to human well-being, without damaging their long-term productivity. The 2010 Economics of Ecosystems and Biodiversity (TEEB) analysis was based on the relevant research field of the past few decades, and proposed a method that can help decision makers recognize, demonstrate and—under appropriate circumstances—capture the value of ecosystems and biodiversity. The Common International Classification of Ecosystem Services (CICES) provides more formal and systematic definitions of various types of ecosystem services, presenting the pathways of ecosystem services from ecological structure and processes to human well-being, and helping people easily identify the content covered by different service categories. The classification method can be converted between MA, TEEB and other frameworks for the purpose of natural capital accounting. The United Nations has now developed the System of Environmental–Economic Accounting—ecosystem accounting [5]—which aims to link information about natural assets with economic and other human activities. Wealth Accounting and the Valuation of Ecosystem Services (WAVES) aims to promote sustainable development by ensuring that natural resources are mainstreamed in development planning and national economic accounts [6].
In order to increase certain specific ESs in an increasingly resource-constrained world, other ecosystem services have been degraded as result [2,7]. One of the main reasons for the decrease in ecosystem services is that their true value is not considered in economic decision-making [2]. Most decisions are based on market prices, but for many ecosystem services, there is no market, and decision makers have no clear signal on the value of the service [8]. A better understanding of the economic value generated by ESs can facilitate the adoption of efficient policies and measures to preserve and enhance them [9]. The traditional evaluation methods of ecological services and economic services include revealed and stated preferences [10]. In order to carry out research on ecosystem services, the benefit transfer method, which finds empirical economic valuation data under various backgrounds and spatial scales, and adjusts them according to the differences in ecological and economic backgrounds, is also a common evaluation method [11,12]. The natural capital associated with ecosystem services is inherently uncertain, and its decision-making involves many stakeholders in the economic evaluation of value, which makes imperfect information a key challenge for economic evaluation [13]. Current ecosystem services studies focus on developing quantifiable, replicable and credible methods that can explicitly consider biophysical, socio-cultural and monetary value fields, so that decision makers can incorporate them into the decision-making process, and link the biophysical mechanisms provided by ESs with the socio-economic impact of their use. [14,15,16].
The forest ecosystem not only provides basic living materials such as wood, fuel and recreational services for human beings, it also provides fundamental functions of life, such as biological gene banks, animal and plant habitats, climate regulation, air purification, and carbon sequestration, etc. [17,18]. Most of the existing research work focuses on provisioning, regulating and cultural services that have a relatively well-developed methodology. Other services, such as pollination, genetic resources and gene pool protection, regulation of pests and human disease, the aesthetic values of forests, waste treatment, environmental purification, and disease regulation, have received less attention in the scientific community, due to lack of data, challenges in estimating their value, and lack of well-designed methods, among other reasons [19]. China [20], Japan [21] and South Korea [22], adjacent to Taiwan, have successively completed national forest ecosystem service value assessments, all of which have achieved considerable results that have been applied to forestry policy communication and policy benefit evaluation. Forests are the largest ecosystem in the land area of Taiwan. In the past, most studies on the evaluation of the service value of forest ecosystems were regional, or focused on services such as conservation, soil and water conservation, and carbon sequestration [23,24,25], and lacked national forest service value. Although, awareness of the importance of ecosystem services to human beings is growing, and people are beginning to understand that ecosystem services need to be taken seriously. It is not easy to provide reliable and well accepted results when performing an economic assessment of ecosystem services. The main purpose of this study is to confirm the evaluation items and evaluation methods of forest ecosystem services in Taiwan, and to estimate their multi-oriented service value. Thus, we can provide decision-makers with opportunities to re-examine environmental resources and their values, so that ecosystem services can be more easily incorporated into public decision-making processes.
2. Materials and Methods
2.1. Research Area
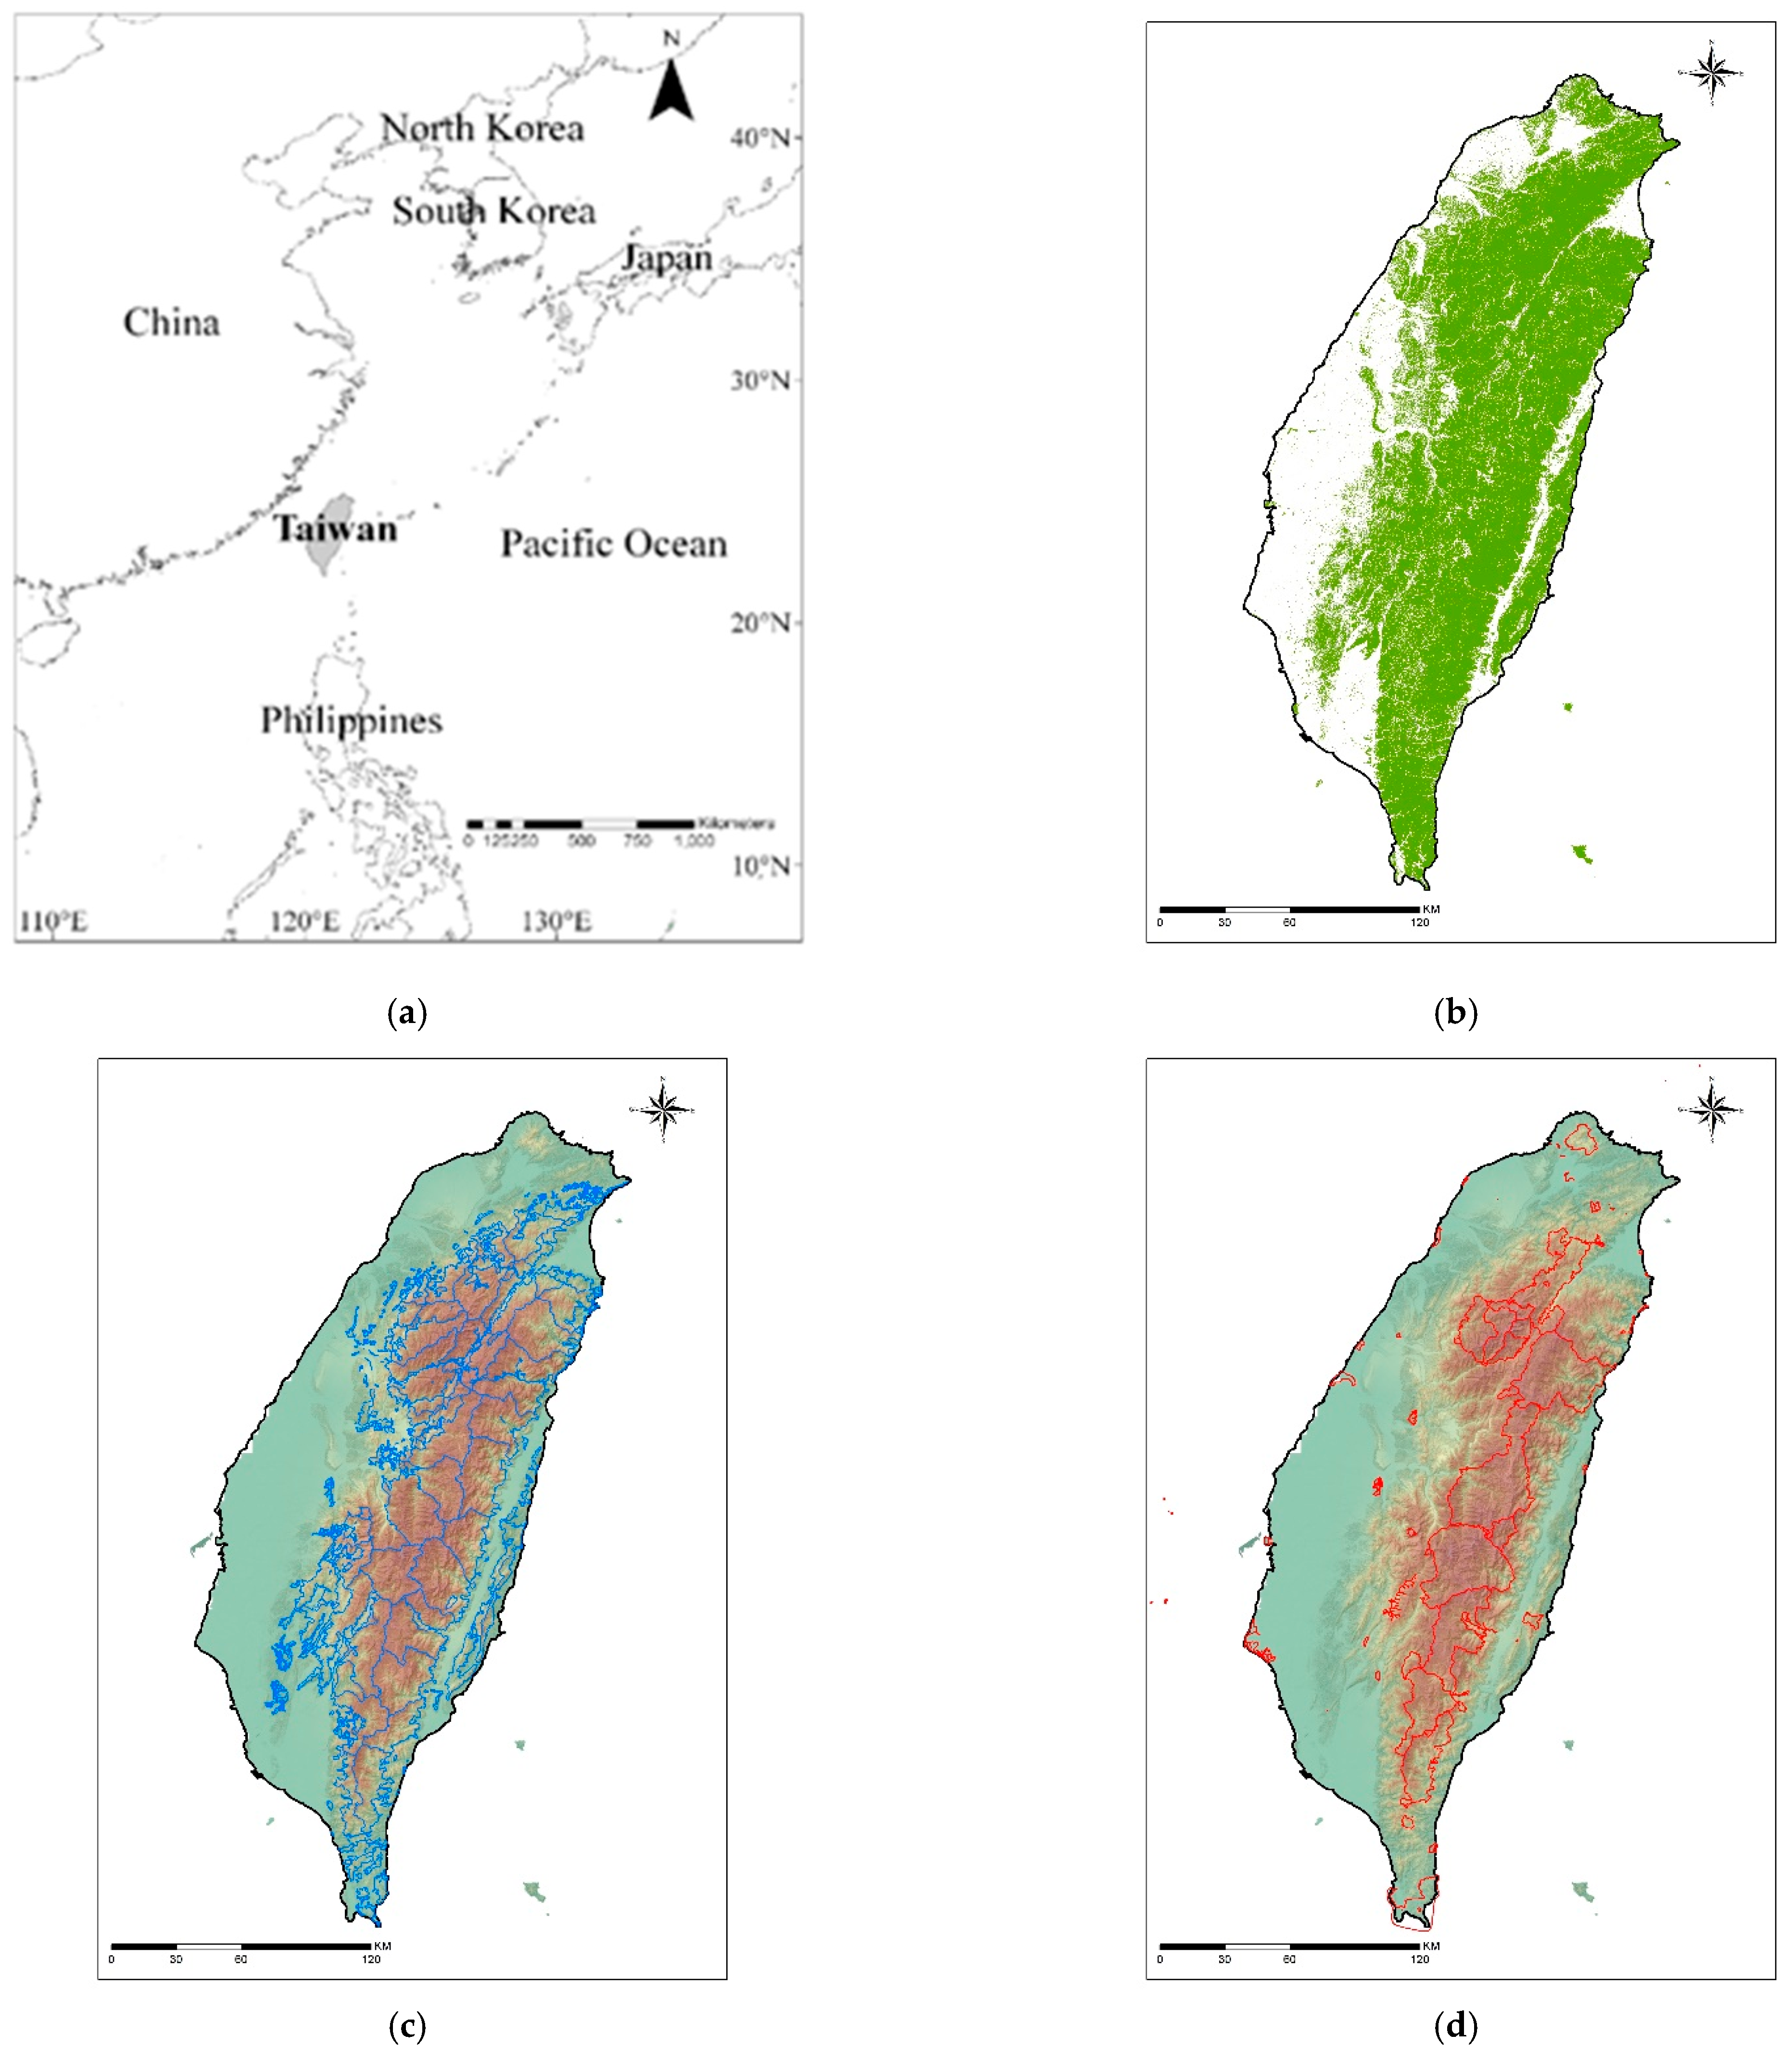
Taiwan is a long and narrow island stretching from north to south, with a total land area of 36,000 square kilometers, located in East Asia on the southwestern edge of the Pacific Ocean (Figure 1a). The average annual precipitation of the island is about 2221 mm on flatland, and about 3858 mm in mountainous areas, with an average annual temperature of about 20–25 °C. Taiwan has many high mountains, mainly distributed in the east of the island, with a vertical height difference of nearly 4000 m. The ecological environment is diverse, with rich biodiversity and a high proportion of endemic species and subspecies. There are more than 5000 species of vascular plants in the wilderness of Taiwan, about a quarter of which are endemic [26]. The total forest land of Taiwan is approximately 1,868,636 hectares, which includes 1,533,691 hectares of state-owned forest (81.07% natural forest and 18.93% planted forest), and 334,944.63 hectares of public and private forest (Figure 1b), which are mostly located in the shallow hills connected with the flatlands. The state-owned forest is divided into 36 national working circles (Figure 1c). In addition to forest land, the total forest land area also includes 1,695,469 hectares of woodland. The areas of Taiwan protected for the purpose of nature conservation consist of 6 categories, including national parks, national natural parks, nature reserves, natural reserves, wildlife reserves, and important wildlife habitats, totaling 95 protected areas. The total land area of these categories is 694,503 hectares (Figure 1d), accounting for approximately 19.19% of the land area of Taiwan [27].
2.2. Research Methods
In order to conduct a nationwide ecosystem service value assessment, this study selected China, Japan, South Korea, etc., as countries that have completed national forest ecosystem service value studies [20,21,22]. Then, we analyzed their evaluation items and methods as a reference for the choice of ecosystem service evaluation items and method in Taiwan. More than two countries listed water resources conservation, water quality purification, soil and sand loss prevention and control, carbon sequestration, air purification, biodiversity, forest recreation, etc. as assessment items. The evaluation methods were mainly based on market price-based approaches, cost-based approaches, and the benefit transfer method. This study refers to [20,21,22] to summarize common assessment items, and considered factors such as the data source and parameters of the assessment items, and the ease of obtaining information. In addition to water purification, the other six ecosystem services were used as assessment items in Taiwan.
The ecosystem service valuation considered factors such as the idiosyncratic roles of different services, the difficulties of obtaining information, the cost of survey and the accuracy of the evaluation. The evaluation methods varied: direct market valuation was conducted for general provisioning services; regulating services were mainly evaluated by avoiding cost, replacement cost or contingent valuation methods; cultural services were evaluated using travel cost methods (such as entertainment, tourism, or scientific value), hedonic methods (such as aesthetic value), or contingent valuation (such as existence value) [28]. In the absence of detailed ecological and economic data, the benefit transfer method is a common approach used to transfer the existing value through a similar ecosystem (research location), to estimate the service value of the ecosystem (designated location by policy) [29,30].
This study mainly used market valuation methods, cost-based methods and benefit transfer methods to assess the value of forest ecosystem services. In terms of quantifying the intensity of ecosystem service activities (measurement), current state or data available publicly were selected as research data. In terms of quantifying the intensity of ecosystem service activities, we selected current state or publicly available data as research data. Two expert meetings were also held, and scholars with expertise in soil and water conservation, carbon sequestration, air purification, forest recreation and biodiversity were consulted to discuss and confirm the data sources, parameters and other information of the forest ecosystem service assessment project. As for the evaluated unit price, experts in related fields were also invited to conduct two expert meetings to determine the unit price. About 4~6 experts participated in each meeting. The evaluation methods, indicators and unit prices of different forest ecosystem services are shown in the Table 1.
2.3. Ecosystem Services Valuation
2.3.1. Water Conservation
As rivers in Taiwan are short and rapid, reservoirs must be used to retain water resources, otherwise precipitation will flow into the sea in a short time. Forests can delay the loss of water resources, reduce the loss of unused water resources, and ensure a more efficient use of water resources. Water conservation means that forests can intercept, absorb and store precipitation, and convert surface water into surface runoff or groundwater. Water conservation generally uses the water-balance method, base-flow estimation method, and retreat-curve method to estimate the water conservation capacity of each watershed area. However, because the flow, evapotranspiration and other data at domestic watershed areas are incomplete, the water-balance method is used to estimate the amount of water conservation. The hydrological balance method regards the forest ecosystem as a closed-loop cycle, thereby directly considering the input and output of water in the soil, which is widely used in the calculation of many water resources. The discrepancy between precipitation and consumption, such as forest evapotranspiration, is the forest water conservation (water-retention capacity), which is then multiplied by the forest land area to get the total forest water conservation quantity, as seen in Equation (1):
where w is water conservation quantity (metric t), R is average annual precipitation (mm/year), θ is empirical formula of water conservation ratio (%), and A is working circle (m2) (there are 36 national forest working circles in Taiwan). Water conservation ratio in Taiwan during dry and wet periods is about 19–30% of rainfall, so an average of 25% is used as the conservation ratio.
w = Σ(R/1000) × θ × A
Regarding the unit price of water conservation valuation, the case study of water price assessment in Japan [31] uses reservoir maintenance costs (including construction and maintenance costs) as replacement costs. China [32] regards the cost of reservoir unit volume as the replacement cost, and the cost of different reservoirs varies greatly, about 4.25–30.20 NT dollars/m3. In Taiwan, [33] estimates the value of forest water conservation based on the tap water price of 6.6 NT$/m3. Moreover, [34,35] estimate the value of water conservation based on the shadow price of water used by the manufacturing industry in NT $21.56 and NT $15.36 respectively. This study originally intended to use water price as the unit price, but after discussion at the expert meeting, it was believed that the current water price could not reflect the cost of water use. Therefore, the shadow price of industrial water NT $40.81/m3 investigated by [36] was used as the unit price (Pw). The value of water conservation is calculated by Equation (2):
where Vw is water conservation value (NT), W is water conservation quantity (metric t), and Pw is price per metric t of water conservation (NT/m3).
Vw = W × Pw
2.3.2. Air Purification
Air purification refers to the ability of forest trees to trap pollutants on the surface of the leaves through the canopy when it is not raining, which is the function of adsorbing and purifying air pollutants [37,38]. In Taiwan, the net throughfall method is mainly used to estimate the amount of air pollution removed directly from the atmosphere by forest trees. The net throughfall method uses the difference between the input of ion components in the rain outside the forest and the throughfall of the forest canopy to estimate air pollutants intercepted by forest stand. Since the forest canopy can effectively intercept the dry deposition, which will be washed by rainwater to the ground surface, the difference in the contents of the elements between throughfall and the precipitation can be estimated [39]. Another study cited by this study investigates how forests in Taiwan contribute to the purification of air pollutants, monitoring the removal amount of particulate pollutants, SO2, and NOx, in flatland afforestation [40,41,42]. The monitoring period lasted more than 1 year, so the factors that could affect the removal amount such as season, fallen leaves and non-fallen leaves were able to be considered. Consequently, the study used the average removed amount by different tree species as the value of air pollutants adsorbed by the forest stand. The average annual removal of particulate pollutants, SO2, and NOx per hectare was 47.79, 7.17, and 6.52 kg respectively.
Using the cost for pollution prevention as a replacement cost is a benefit of the role of the forest as an air pollution filter. Thereby, the cost of using artificial technology to replace the cost generated by ecosystem services can be estimated. Due to the idiosyncratic variation in pollution sources, the pollution prevention methods and costs used varied accordingly [43]. The unit reduction cost of different pollutants was based on the latest available measures provided by the Environmental Protection Administration of the Executive Yuan [44], and was adjusted annually with the deflator of the pollution remediation industry [45]. The benefits of air pollutant removal of the forest in 2016 were estimated, using per unit leaf area particulate adhesion capacity × forest coverage area (with trees) × pollution prevention cost, as seen in Equation (3):
where VAir purification is the value of forest stand capacity to adsorb various pollutant. Qk1, Qk2 and Qk3 are the amount of particulate pollutants, sulfur dioxide and nitrogen oxides removed per unit area of the forest stand (kg/ha/year). A is forest coverage area (ha), and Pkf and Pkm are the cost per unit of prevention and control of particulate pollutants, sulfur dioxide, and nitrogen oxides (NT$/kg), when the pollution source is fixed or mobile, respectively. In the absence of information such as the relationship between pollution sources and forest land, this is a more reasonable way to estimate the range of air purification benefits based on the prevention and control costs of fixed and mobile pollution sources. In this study, the cost of fixed sources and mobile sources was averaged to calculate the air purification benefits, which was an expedient measure for the simple presentation of the evaluation results.
2.3.3. Biodiversity
Biodiversity refers to the function of the forest as a habitat conservation site to maintain and support species in range [3]. In view of the considerable differences in the assessments of biodiversity values in many countries, and of the lack of representative data on biodiversity conservation, the benefit transfer method is used to select representative indicators for evaluation. Presently, the development of biodiversity indicators is receiving more attention in the world. Biodiversity indicators can reflect whether an ecosystem is healthy and resilient, and monitor the status and trends of biodiversity [46]. For example, the “forest coverage area” is related to ecological, social, economic, and cultural impacts, and can be used as an indicator of land use and development pressure. Taiwan has established the “Taiwan Biodiversity Observation Network (TaiBON) [47]” with a stringent attitude, and has exchanged discussions with a diverse range of experts. Meanwhile, we have been referring to the developmental experience and framework of international biodiversity indicators to compile a set of biodiversity indicators suitable for Taiwan. Considering the comprehensiveness of current data collection and the frequency of updates, as well as existing research on relevant benefit evaluation, this study prioritizes the selection of “protected areas” as an indicator of biodiversity, which corresponds with the Sustainable Development Goals (SDGs) 15.4 of the United Nations and Aichi Target 11. The conservation price per unit area, referring to the conservation benefit of domestic nature reserves surveyed by [48], is about NT $79,075 per hectare, as seen in Equation (4).
where VB is biodiversity value (NT), IB is protected area (ha), and PB is the benefit of protected areas per unit area (NT).
VB = IB × PB
2.3.4. Soil Erosion Prevention
The prevention and control of soil erosion means that covering the land surface with forest vegetation, and humus or fallen leaves produced by trees can reduce the direct erosion of the soil by rainfall, thereby reducing the rills and gullies in the ground eroded by surface water flow. In addition, tree roots contribute to a well-granulated soil with more frictional resistance, increasing the permeability of the soil. The migration and sediment deposit of forest soil, due to natural factors such as rainfall or river flow paths, and topographical factors such as slope gradient, is called soil erosion. Taiwan is surrounded by the sea on all sides, and the terrain is towering and steep, with plenty of rainfall. After rainfall, most water flows to the sea; therefore, the accumulated soil erosion over the years is considerable. This study uses the modified universal soil erosion formula, Revised Universal Soil Loss Equation (RUSLE) [49], to conduct the evaluation. First, we calculated the amount of soil loss for both scenarios, wherein there was woodland and bare land. Second, we subtracted the two kinds of losses, to obtain the reduced soil loss due to the existence of forest land, and then multiplied the soil loss by the SDR (sediment delivery ratio) in each watershed, to obtain the actual soil production of each watershed area. This is the amount of soil erosion that the forest can reduce, as seen in Equation (5):
where Am = Rm × Km × L × S × C × CPF, Qs is average annual soil loss per hectare (metric t/ha-year), Am(F) is average annual soil loss per hectare from forest land (metric t/ha-year), Am(NF) is the average annual soil loss per hectare from bare woodland (metric t/ha-year), Rm is the erosion index of average annual rainfall (106 Joule-mm/ha-hour-year), Km is the soil erosion index (metric t-ha-hour-year/106 joule-mm-ha-year), L is slope length, S is slope gradient, C is coverage and management, CPF is the water and soil conservation factor, SDR is sediment delivery ratio (%), which refers to the ratio of the yield of mud and sand in the watershed area to the amount of soil erosion, and Aj are the 36 national working circles (ha).
The avoided cost method was used to calculate the price of soil erosion prevention and control. By considering the problems of sedimentation and sand transport in rivers, the costs of river and reservoir dredging are used instead to estimate the total amount of soil erosion with the general soil erosion formula. The amount of soil and sand left in the riverbed, and that flown into the reservoir, was calculated at 70% and 30%, respectively. Then, we collected the unit benefits of the rivers and reservoirs, and used it to estimate the value of soil and sand loss control, as seen by Equation (6):
where Vs is the value of soil erosion control (NT-year), Qs is average annual soil erosion per hectare (metric t/ha-year), and Ps is unit price for forest soil erosion prevention (NT/metric t).
Vs = Qs × Ps
2.3.5. Forest Carbon Sequestration
The guidelines for National Greenhouse Gas Inventories promulgated by the Intergovernmental Panel on Climate Change (IPCC) of the United Nations specifically regulates the methodologies of carbon emissions/sequestration. Taiwan also calculates the total carbon removal of forests according to the IPCC method (Equation (7)) [50], including the carbon removal of forest land and the maintenance of forest land, the carbon emission of forest land and the maintenance of forest land, and the carbon removal caused by conversion of other land to forest land:
here △CO2 is total carbon dioxide removal (Mt CO2e), △CO2 G is carbon removal from forest land maintained by forest land, △CO2 L is carbon emissions of forest land maintained by forest land, and △CO2 G(Increased woodland) is carbon removal from other land converted to forest land.
△CO2 = △CO2 G + △CO2 L + △CO2 G(Increased woodland)
The estimation of forest carbon sequestration value is calculated by multiplying the total carbon removal amount from the forest by the carbon price per t, as seen in Equation (8):
where Vc is forest carbon sequestration value (NT/Mt/year), △CO2 is the total carbon dioxide removal (Mt CO2e), and Pc is the carbon price per t (NT/Mt). According to the discussion at the expert meeting, the social cost of carbon is an estimate of the monetary value of the global damage caused by man-made carbon dioxide emissions. The price of the forest carbon emissions trading market alone cannot reflect the cost of the entire society; therefore, the shadow price of the European Bank (2014) [51] for carbon reduction financing is used to estimate the value of forest carbon sequestration.
Vc = △CO2 × Pc
2.3.6. Forest Recreation (Including Environmental Education)
The service provided by the forest ecosystem with places for leisure and entertainment for humans is called forest recreation. Meanwhile, forests can also offer space for environmental education services. This study uses the benefit transfer method to evaluate the value of forest recreation (environmental education) by using forest recreation (environmental education) person-time × forest recreation (environmental education) price, as seen in Equation (9):
where VR is the value (NT/year) of forest recreation (including environmental education), NR is annual forest recreation visits (person/year), PR is forest recreation price per person (NT/person), NE is person-time of forest environmental education per year (person/year), and PE is forest environmental education price per person (NT/person). The annual total number of tourists in each forest recreation area can be obtained from the statistical information of the Tourism Bureau. When determining the price of forest recreation, we referred to the survey data for domestic tourism from the Tourism Bureau of Taiwan [52], and considered an overnight stay or an extended stay. Hence, the cost for forest recreation per person is decided on the average cost per person per trip/the average number of days of stay. Regarding the number of participants in forest environmental education, the forestry statistical data of the Forestry Bureau are used as reference. The literature review shows that the Taiwanese willingness to pay (WTP) for environmental education and guided tours related to forests or ecological recreation is roughly in the range of 100–170 NT per person [53,54]. This study uses a minimum of 100 NT per person [52] on a conservative estimate for the forest environmental education pricing.
VR = ΣNR × PR + ΣNE × PE
3. Results
Based on the evaluation methods of the six ecosystem services mentioned above, the forest ecosystem services value of Taiwan in 2016 was calculated as follows.
3.1. Value of Forest Water Conservation
Geographic information system (GIS) was used to overlay the rainfall data of the 36 state-owned forestry working circles from the Central Weather Bureau and the rainfall measurement stations of the Water Resources Agency, to calculate the average annual rainfall and annual water conservation in each working circle. It was estimated that the total water conserved in the forest land of Taiwan in 2016 was 13,876.14 million metric t.
This study set 40.18 NT/m3 (medium-cost situation) as the price for water conservation. The value of water conservation in 2016 was calculated by multiplying the amount of water conservation and the unit price, which was NT $557,543 million.
3.2. Air Purification Value
This study refers to the study of the purification effect of forest trees in Taiwan on air pollutants: the average annual removal of particulate pollutants, SO2 and NOx per hectare is 47.79, 7.17, and 6.52 kg respectively [40,41,42].
Based on the latest unit reduction cost of each pollutant provided by the Environmental Protection Administration of the Executive Yuan, the pollution remediation industry deflator was used for adjustment annually, by utilizing the amount of adsorbed air pollution per unit area of forest × forest coverage area (with trees) × pollution prevention cost to estimate the benefits of forest removal of air pollutants in 2016. When using fixed source reduction costs as the unit price, the benefit was NT$1894 million. Alternatively, the benefit was NT$4684, using the mobile pollution sources as the unit price. Hence, the benefit of forest air purification was the average of the two, which was NT$3289 million (Figure 2).
3.3. Biodiversity Value
The conservation areas in Taiwan are mainly based on the land protected areas currently announced, including national parks, national natural parks, nature reserves, natural reserves, wildlife reserves, and important wildlife habitats. There are 95 protected areas in 6 categories. In 2016, the protected area was 6945 km2. According to [48], the conservation benefit of the domestic nature reserves was about NT $79,075 per hectare. This price was adjusted to the conservation benefit per unit of each year by applying the consumer price index, and then multiplied by the area of the protected area to obtain the biodiversity value (the conservation benefit of the protected area), which was NT $58,535 million.
3.4. Soil Erosion Prevention Value
The parameters in the analysis were calculated using grid data, among which the relevant L (slope length) and S (slope gradient) were converted using the 20 m-resolution topographic data of the whole station, published by the Ministry of the Interior. The R and K parameters were drawn into a gridded map with a resolution of 40 m, using data from the Water and Soil Conservation Handbook [55]. Finally, the C and P parameters were converted into 20 m grids, according to the land cover type. The results showed that the average amount of soil retained by the working circle in Taiwan was about 519 metric t/ha, and the total amount of soil erosion control was 719.73 million metric t.
The river silt reduction benefit was based on the direct benefit calculation of soil control by the reference manual for the overall survey and planning work of the watershed area [56], with an average about 112.5 NT/m3. The efficiency of the reservoir silt reduction was based on the unit price of mechanical dredging, which averaged about 350 NT/m3. The bulk density of soil per metric t was approximately 0.7 m3, and the value of soil erosion prevention was NT $92,575 million.
3.5. Forest Carbon Sequestration Value
The 2018 Greenhouse Gases Inventory Report of Taiwan showed that the total carbon removal from forest in 2016 was 21,418 × 103 Mt CO2e. The European Bank’s shadow price for carbon reduction financing in 2014 was 35 Euros/Mt CO2e. Reflecting this, the marginal cost of abatement will increase over time with the higher concentration of carbon dioxide in the atmosphere: the Bank of Europe sets the actual rate of increase in the shadow price every year as 2.0%. Therefore, it can be concluded that the value of forest carbon storage in 2016 was NT $27,879 million.
3.6. Value of Forest Recreation (Including Environmental Education)
The value of forest recreation includes forest recreation (A) and environmental education (B). Based on official statistics from the Tourism Bureau and the Forest Service Bureau, as well as the results of domestic research on willingness to pay for environmental education, the value of forest recreation (including environmental education) in 2016 was NT $9457 million (Table 2).
3.7. Results of Forest Ecosystem Service Valuation of Taiwan
This study assessed the value of six different kinds of forest ecosystem services in Taiwan. The total value in 2016 was approximately NT$ 749,278 million (equal to approximately 47.6 billion U.S. dollars, PPP-corrected), accounting for about 4.28% of the GDP of 2016. Forest water conservation value was about NT $557,543 million, accounting for 74.41% of the annual total forest ecosystem service value ratio, which was the highest, followed by the prevention and control of soil erosion value at NT $92,575 million, accounting for 12.36% of the annual total forest ecosystem service value. The biodiversity value was about NT $58,535 million, accounting for 7.81% of the annual total forest ecosystem service value. In 2016, the total forest area of the country was 1,868,636 hectares. If the total value of forest ecosystem services in the year was divided by the total forest area of Taiwan, the value of the forest ecosystem services per hectare was NT $400,976.
4. Discussion
4.1. Research Limitations
There are still some issues that require attention in the acquisition and application of data sources in this study. First, the value of forest ecosystem services was derived by multiplying the value of each ecosystem service by the unit price, but the acquisition of relevant data in Taiwan was not complete. For example, the range of different forest ecosystem services are slightly different; some of the benefits are in the national forest working circle, but some cover forests throughout Taiwan. In terms of the benefits of forest air purification, the analysis of this study found that the distance from the pollution source affects forest air purification [57]. However, because there are very few studies regarding air purification of forests in Taiwan, the results of the purification of air pollutants by flatland afforestation survey were applied to estimate forestlands island-wide, which was a stopgap measure due to lack of information. As for biodiversity value, due to the limited quantitative indicators of biodiversity benefits, in order to facilitate the Forestry Bureau to continuously update and evaluate their information, currently only one research result is cited. The estimation was carried out by the benefit transfer method, and the scope of estimation was limited to the conservation benefit of the natural conservation areas. With respect to water conservation, bogged down by currently incomplete data regarding rainfall and surface runoff, and the upstream of each watershed area, the use of relevant research to estimate the water conservation ratio in the watershed areas of the mountains of Taiwan still lacks accuracy. Forest recreation is currently based on the average daily travel expenses per person in the Tourism Bureau as the price unit, but this value does not distinguish between consumption in forest and non-forest areas. Further evaluation methods, discussion and correction should be carried out in the future.
In terms of unit price quotation, due to the lack of updated research data, the results of this study are outdated [44,48]. In addition, due to the lack of data on air pollution sources, the average value of the reduction costs of mobile pollution sources and fixed pollution sources was used to estimate the value of air pollution. To reasonably present the value of ecosystem services, the task of developing and updating data integrity requires our continuous effort to overcome challenges. Furthermore, the result of this study was on a larger scale, so its applicability is a concern. To draw upon it in a case or regional study, more complete and detailed information is required, as the supply and demand contribution of each case is different [10]. It is suggested that more regional research can be done on case studies.
4.2. Price Difference
Conducting forest ecosystem services evaluation requires a great deal of judgement and objectivity using unit price data; without this, there could be a significant impact on the final evaluation result of the forest ecosystem service value. For example, in the estimation of the value of water conservation, the shadow price of industrial water use is four times the current water price, and the difference between the two estimated values will be four times as much. In China [58] and Japan [21], the costs of constructing, maintaining and operating reservoirs for public water supply and depreciation are mainly used as replacement costs to estimate the preservation value of water bodies. South Korea [22] also considers the opportunity cost of land use for dam construction, such as the opportunity cost of planting rice and forests. Relatively speaking, the current price for calculating the value of water conservation in Taiwan is higher than these countries. The price of forest carbon storage, citing the shadow price of the European Bank of Carbon Finance, also differs about 14 times from the price in the international voluntary carbon trading market [59]. The shadow price reflects the marginal contributions of assets to well-being [60]. In the national accounts, the exchange value is easier to observe and estimate than the shadow price, while ensuring the integrity and consistency of the account [61]. Both should be selected carefully, according to the purpose.
4.3. Development for Biodiversity Assessment Methodology
Biodiversity and ecosystems are conceptually linked in three ways: (1) biodiversity is the support and foundation of ecosystems; (2) conflicts lie between biodiversity and ecosystems; (3) biodiversity means ecosystem services (or part of it) [62]. The corresponding service items vary in different ways, which also affects the evaluation of the biodiversity value. This study used only the natural reserve areas to estimate the value of biodiversity conservation, which simplified the relationship between biodiversity and ecosystem services.
Every country differs greatly in their biodiversity value assessment indicators. China uses the concept of conserving and maintaining the biodiversity of the forest ecosystem for hunting and gathering as its value calculation basis. The Shannon–Wiener index is used to classify the different biodiversity levels of the forest: the higher the biodiversity, the higher the value. The biodiversity value is calculated based on the wild animal market price and the forest product replacement cost to estimate the integrated price [63,64]. Japan estimates the bird population size in the forest based on the density of the forest that forms bird habitat. The area of each forest forms a biodiversity indicator, and then its value is calculated based on the price of artificial feeding bait, whereas South Korea’s biodiversity value is based on the sum of the value of wild bird conservation, and that of hunting activities [31,65].
The current “TAIBON” indicators [47] are complete and diverse, but many biodiversity indicators lack time continuity. Moreover, although some monitoring indicators have long-term monitoring data, they cannot be used, due to the lack of corresponding unit price. It is suggested that the methodology of biodiversity assessments should be developed in the future, to identify the corresponding indicators, and the scope of application and corresponding prices, so that the accuracy of the biodiversity value assessment can be increased.
4.4. Improve the Estimation of Soil Erosion
Regarding soil erosion prevention in the forest, this study, inhibited by time and funding, used RUSLE to calculate the difference in the amount of soil loss in the two scenarios of forest land and bare land, with each working circle of national forest as the scope. Then, we converted this into the amount of soil erosion in each working circle through SDR, assuming that there was forest land coverage in the working circle. However, a working circle can contain many watershed units, and the slope, surface coverage, and SDR of each watershed unit were bound to be different. Accordingly, to obtain a more accurate and detailed amount of soil, it is recommended to conduct a detailed investigation and calculation of the amount of soil erosion in individual cases for the main watershed units in different regions. In addition, the general formula calculated only the loss of surface soil, excluding the deep stratum and landslide. Normally, forest land has a small amount of runoff and soil erosion, but it is prone to collapse in extreme events, which can cause a large amount of soil erosion. The occurrence of landslides is atypical, and therefore this study did not include them in the estimation, but it can be further evaluated in the future.
4.5. Eosystem Disservices (EDS)
Ecosystem services are the benefits people obtain from ecosystems [2]. Research on the contribution of ecosystem services to human well-being has increased exponentially since MA. In contrast, some ecosystem disservices that undermine, or harm human well-being have been seriously overlooked [66]. The reason for this neglect of ecosystem disservices is that the frequency and intensity of their occurrence are variable (such as pest outbreaks) [67], and they lack clearly defined functions and types [68]. In Taiwan, substantial negative impacts, such as the landslide damage caused by the typhoon, the damage caused by the invasion of foreign species, and the protected Formosan macaques endangering crops, and other ecosystem disservices, are not included in the value estimation at present. To reflect the true ecosystem service value, EDS should also be reflected in the future, so that humans can better manage the ecosystem.
5. Conclusions
The forest is the largest ecosystem in the land area of Taiwan. In the past, most evaluation studies on the forest ecosystem services were regional, or focused on services such as conservation, soil conservation, and carbon sequestration, which lacked a representative evaluation of the value of forest ecosystem services of Taiwan. The evaluation of service values conducted by this study is on a nationwide forest ecosystem in Taiwan. The evaluation items included forest water conservation, air purification, biodiversity, soil erosion prevention, forest carbon storage, and forest recreation (including environmental education). It is preliminarily estimated that the total value of the forest ecosystem services in 2016 was approximately NT $749,278 million, accounting for roughly 4.28% of the GDP of the year.
The value of the forest ecosystem services in this study were derived by multiplying the size of each ecosystem service, defined in biophysical metrics, by its unit value. The evaluation results shed light on the link between ecosystem services and forestry management and conservation effectiveness. However, the gathered data on the amount of forest air pollution removal, the amount of soil erosion prevention and control, and on biodiversity indicators are not complete, and further research is still needed. Moreover, it is paramount to give proper scrutiny when drawing upon unit price data, for this has a huge impact on the final assessment results of forest ecosystem service values.
Author Contributions
Conceptualization, J.-C.L.; methodology, C.-R.C.; data curation, W.-H.C.; writing—original draft, M.-S.W. All authors have read and agreed to the published version of the manuscript.
Funding
This research was funded by Taiwan Forestry Research Institute, grant number 108AS-10.2.1-FI-G2”, Forestry Bureau, grant number tfbc-1070206, and the APC was funded by Taiwan Forestry Research Institute.
Institutional Review Board Statement
Not applicable.
Informed Consent Statement
Not applicable.
Data Availability Statement
The data presented in this study are available on request from the corresponding author.
Conflicts of Interest
The authors declare no conflict of interest.
References
- Gómez-Baggethun, E.; de Groot, R.; Lomas, P.L.; Montes, C. The History of Ecosystem Services in Economic Theory and Practice: From Early Notions to Markets and Payment Schemes. Ecol. Econ. 2010, 69, 1209–1218. [Google Scholar] [CrossRef]
- Reid, W.; Mooney, H.; Cropper, A.; Capistrano, D.; Carpenter, S.; Chopra, K. Millennium Ecosystem Assessment. Ecosystems and Human Well-Being: Synthesis; Island Press: Washington, DC, USA, 2005. [Google Scholar]
- Sukhdev, P.; Wittmer, H.; Schröter-Schlaack, C.; Neßhöver, C.; Bishop, J.; Ten Brink, P.; Gundimeda, H.; Kumar, P.; Simmons, B. Mainstreaming the Economics of Nature: A Synthesis of the Approach, Conclusions and Recommendations of TEEB; UNEP: Nairobi, Kenya, 2010. [Google Scholar]
- Haines-Young, R.; Potschin, M. CICES V4.3—Revised Report Prepared Following Consultation on CICES Version 4, August–December 2012; EEA Framework Contract No EEA/IEA/09/003; University of Nottingham: Nottingham, UK, 2013. [Google Scholar]
- United Nations. System of Environmental-Economic Accounting—Ecosystem Accounting (SEEA EA). 2021. Available online: https://seea.un.org/sites/seea.un.org/files/documents/EA/seea_ea_white_cover_final.pdf (accessed on 19 November 2021).
- WAVES Partnership. WAVES Annual Report 2015; World Bank Group: Washington, DC, USA, 2015. [Google Scholar]
- Tallis, H.; Kareiva, P.; Marvier, M.; Chang, A. An Ecosystem Services Framework to Support Both Practical Conservation and Economic Development. Proc. Natl. Acad. Sci. USA 2008, 105, 9457–9464. [Google Scholar] [CrossRef] [Green Version]
- Martín-López, B.; Gómez-Baggethun, E.; García-Llorente, M.; Montes, C. Trade-offs Across Value-domains in Ecosystem Services Assessment. Ecol. Indic. 2014, 37, 220–228. [Google Scholar] [CrossRef]
- Croci, E.; Lucchitta, B.; Penati, T. Valuing Ecosystem Services at the Urban Level: A Critical Review. Sustainability 2021, 13, 1129. [Google Scholar] [CrossRef]
- Pascual, U.; Muradian, R.; Brander, L.; Gómez-Baggethun, E.; Martín-López, B.; Verma, M.; Armsworth, P.; Christie, M.; Cornelissen, H.; Eppink, F. The Economics of Valuing Ecosystem Services and Biodiversity. TEEB-Ecological and Economic Foundation: Ecological and Economic Foundations; Kumar, P., Ed.; Earthscan: London, UK, 2010. [Google Scholar]
- De Groot, R.; Brander, L.; Van der Ploeg, S.; Costanza, R.; Bernard, F.; Braat, L.; Christie, M.; Crossman, N.; Ghermandi, A.; Hein, L.; et al. Global Estimates of the Value of Ecosystems and Their Services in Monetary Units. Ecosyst. Serv. 2012, 1, 50–61. [Google Scholar] [CrossRef]
- Kubiszewski, I.; Costanza, R.; Dorji, P.; Thoennes, P.; Tshering, K. An Initial Estimate of the Value of Ecosystem Services in Bhutan. Ecosyst. Serv. 2013, 3, e11–e21. [Google Scholar] [CrossRef]
- Costanza, R.; De Groot, R.; Braat, L.; Kubiszewski, I.; Fioramonti, L.; Sutton, P.; Farber, S.; Grasso, M. Twenty Years of Ecosystem Services: How Far Have We Come and How Far Do We Still Need To Go? Ecosyst. Serv. 2017, 28, 1–16. [Google Scholar] [CrossRef]
- De Groot, R.S.; Wilson, M.A.; Boumans, R.M.J. A Typology for the Classification, Description and Valuation of Ecosystem Functions, Goods and Services. Ecol. Econ. 2002, 41, 393–408. [Google Scholar] [CrossRef] [Green Version]
- Chan, K.M.A.; Satterfield, T.; Goldstein, J. Rethinking Ecosystem Services to Better Address and Navigate Cultural Values. Ecol. Econ. 2012, 74, 8–18. [Google Scholar] [CrossRef] [Green Version]
- Bagstad, K.J.; Semmens, D.J.; Waage, S.; Winthrop, R. A Comparative Assessment of Decision-support Tools for Ecosystem Services Quantification and Valuation. Ecosyst. Serv. 2013, 5, 27–39. [Google Scholar] [CrossRef]
- Costanza, R.; d’Arge, R.; Groot, R.; Farber, S.; Grasso, M.; Hannon, B.; van den Belt, M. The Value of the World’s Ecosystem Services and Natural Capital. Nature 1997, 387, 253–260. [Google Scholar] [CrossRef]
- Costanza, R.; de Groot, R.; Sutton, P.; van der Ploeg, S.; Anderson, S.J.; Kubiszewski, I.; Farber, S.; Turner, R.K. Changes in the Global Value of Ecosystem Services. Glob. Environ. Chang. 2014, 26, 152–158. [Google Scholar] [CrossRef]
- Mengist, W.; Soromessa, T. Assessment of Forest Ecosystem Service Research Trends and Methodological Approaches at Global Level: A Meta-analysis. Environ. Syst. Res. 2019, 8, 22. [Google Scholar] [CrossRef] [Green Version]
- Wang, B.; Ren, X.X.; Hu, W. China’s Forest Ecosystem Service Function and its Value Evaluation. For. Sci. 2011, 47, 145–153. [Google Scholar]
- Mitsubishi Research Institute, Inc. Research Report on Evaluation of Multifaceted Functions of Agriculture and Forests Related to Global Environment and Human Life; Mitsubishi Research Institute, Inc.: Tokyo, Japan, 2001. [Google Scholar]
- Kim, J.H.; Kim, R.H.; Youn, H.J.; Lee, S.W.; Choi, H.T.; Kim, J.J.; Park, C.R.; Kim, K.D. Valuation of Nonmarket Forest Resources. Korean J. For. Rec. 2012, 16, 9–18. [Google Scholar] [CrossRef]
- Lu, M.L.; Huang, J.Y.; Chung, Y.L. Assessing the Ecosystem Service Values in the Hengchun Peninsula, Taiwan. Q. J. Chin. For. 2012, 45, 491–501. [Google Scholar]
- Wu, C.S.; Liu, C.P.; Chen, Y.H.; Chen, L.C.; Lin, J.C.; Jeng, M.R.; Hsu, C.Y. Evaluating the Economic Benefits of Forest Ecosystem Management in the LiuKuei Experimental Forest. Taiwan J. For. Sci. 2006, 21, 191–203. [Google Scholar]
- Hsieh, C.H.; Liu, W.Y. Evaluating the Economic Value of Water Conservation by Taiwan National Forests. Taiwan J. Appl. Econ. 2018, 104, 185–228. [Google Scholar]
- Taiwan Botanic Red List Editorial Committee. The Red List of Vascular Plants of Taiwan, 2017; Endemic Species Research Institute, Council of Agriculture, Executive Yuan, R.O.C (Taiwan): Nantou, Taiwan, 2017.
- Accounting Office of Forestry Bureau, Council of Agriculture, Executive Yuan. Forestry Statistics, 2017; Forestry Bureau, Council of Agriculture, Executive Yuan, R.O.C (Taiwan): Taipei, Taiwan, 2017.
- Martín-López, B.; Gómez-Baggethun, E.; González, J.A.; Lomas, P.L.; Montes, C. The Assessment of Ecosystem Services Provided By Biodiversity: Re-Thinking Concepts and Research Needs. In Handbook of Nature Conservation: Global, Environmental and Economic Issues; Aronoff, J., Ed.; Nova Science Publisher: New York, NY, USA, 2009; pp. 261–282. ISBN 978-1-60692-993-3. [Google Scholar]
- Liu, S.; Costanza, R.; Troy, A.; D’Aagostino, J.D.; Mates, W. Valuing New Jersey’s Ecosystem Services and Natural Capital: A Spatially Explicit Benefit Transfer Approach. Environ. Manag. 2010, 45, 1271–1285. [Google Scholar] [CrossRef]
- Wilson, M.A.; Hoehn, J.P. Valuing Environmental Goods and Services Using Benefit Transfer: The State-of-the-art and Science. Ecol. Econ. 2006, 60, 335–342. [Google Scholar] [CrossRef]
- Ninan, K.N.; Inoue, M. Valuing Forest Ecosystem Services- Case Study of a Forest Reserve in Japan. In Valuing Ecosystem Services; Edward Elgar Publishing: Cheltenham, UK, 2013; Volume 5, pp. 78–87. [Google Scholar]
- National Forestry and Grass Administration. Forestry Industry Standard of the People’s Republic of China; National Forestry and Grass Administration: Beijing, China, 2008; Volume 11.
- Chen, H.H.; Li, J.Y. An Integrated Model of Soil and Water Conservation Functions in Forest Catchment Areas. Q. J. Chin. For. 1986, 19, 59–74. [Google Scholar]
- Zheng, C.L. Study on Water Use Functions and Water Use Pattern Prediction in Manufacturing Industry (1): Research Commissioned by Water Resources Agency; Chung-Hua Institution for Economic Research: Taipei, Taiwan, 1994; Volume 13. [Google Scholar]
- Wu, C.S.; Chen, Y.H.; Cheng, M.R.; Huang, J.L.; Lee, K.C. Evaluating the Economic Benefit of Water Resource Nourishment by Forests. Taiwan J. For. Sci. 2004, 19, 187–197. [Google Scholar]
- LotSoar Consultants Co., Ltd. The Study of Optimal Water Supply Portfolio for Central Region of Taiwan under the Impact of Climate Change; Water Resources Agency, Ministry of Economic Affairs: Taipei, Taiwan, 2018; ISBN 9789860578973.
- Nowak, D.J.; Crane, D.E.; Stevens, J.C. Air Pollution Removal by Urban Trees and Shrubs in the United States. Urban For. Urban Green. 2006, 4, 115–123. [Google Scholar] [CrossRef]
- Xing, Y.; Brimblecombe, P. Role of Vegetation in Deposition and Dispersion of Air Pollution in Urban Parks. Atmos. Environ. 2019, 201, 73–83. [Google Scholar] [CrossRef]
- Balestrini, R.; Tagliaferri, A. Atmospheric Deposition and Canopy Exchange Processes in Alpine Forest Ecosystems (Northern Italy). Atmos. Environ. 2001, 35, 6421–6433. [Google Scholar] [CrossRef]
- Chen, Q.P.; Liu, C.P. The purification function of air pollutants by flat afforestation- with Pingtung Linhousilin Forest Park as an example. For. Res. Newsl. 2014, 21, 6–10. Available online: https://www.airitilibrary.com/Publication/alDetailedMesh?DocID=16056922-201412-201501120037-201501120037-6-10 (accessed on 17 March 2021).
- Chen, Q.P. Air Pollutants Interception of Plains Afforestation in Central Taiwan. Ph.D. Thesis, Chung Hsing University, Taichung, Taiwan, 2015. [Google Scholar]
- Su, Z.H.; Chen, Q.P.; Liu, C.P. Evaluation on the Purification Function of Air Pollutants by Tree Species on Flat Land. In Proceedings of the 2016 Flat Land Afforestation Test and Monitoring Seminar, Taipei, Taiwan, 22 December 2016; pp. 17–22. [Google Scholar]
- Directorate General of Budget, Accounting and Statistics, Executive Yuan. Green National Income Account of 2019; Directorate General of Budget, Accounting and Statistics, Executive Yuan: Taipei, Taiwan, 2019.
- Ni, P.C.; Lee, C.Y.; Yeh, F.L. Study of Air Quality for Taiwan Area. Available online: http://tasder.org.tw/meeting/2004/part01/1-01.pdf (accessed on 26 September 2017).
- National Statistics. Domestic Production and Deflator Index of Various Industries over the Years. Taipei, Taiwan. Available online: https://www.stat.gov.tw/ct.asp?xItem=37407&CtNode=3564&mp=4 (accessed on 13 September 2017).
- Butchart, S.H.; Walpole, M.; Collen, B.; Van Strien, A.; Scharlemann, J.P.; Almond, R.E.; Baillie, J.E.; Bomhard, B.; Brown, C.; Bruno, J.; et al. Global Biodiversity: Indicators of Recent Declines. Science 2010, 328, 1164–1168. [Google Scholar] [CrossRef]
- Taiwan Biodiversity Observation Network (TaiBON). Available online: https://taibon.tw/en/node/20 (accessed on 25 September 2017).
- Chen, Z.Y.; Zhang, H.Y.; Guan, L.H.; Zheng, H.Y. Analysis of Economic Benefits of Nature Reserves. Agricultural Policy and Agricultural Conditions; Council of Agriculture, Executive Yuan: Taipei, Taiwan, 2012; Volume 240, pp. 77–80. Available online: https://www.coa.gov.tw/ws.php?id=2445783 (accessed on 12 December 2020).
- Renard, K.G.; Foster, G.R.; Weesies, G.A.; Porter, J.P. RUSLE: Revised Universal Soil Loss Equation. J. Soil Water Conserv. 1991, 46, 30–33. [Google Scholar]
- Environmental Protection Administration, Executive Yuan. The Republic of China (Taiwan) National Greenhouse Gas Inventory Report of 2018; Environmental Protection Administration, Executive Yuan: Taipei, Taiwan, 2018.
- European Bank for Reconstruction and Development. Methodology for the Assessment of Coal Fired Generation Projects. 2014. Available online: https://www.ebrd.com/documents/climate-finance/methodology-for-the-assessment-of-coal-fired-generation-projects.pdf (accessed on 2 February 2021).
- Tourism Bureau, Ministry of Transportation and Communication. Survey of Travel by R.O.C. Citizens. 2016. Available online: https://admin.taiwan.net.tw/FileUploadCategoryListC003340.aspx?CategoryID=7b8dffa9-3b9c-4b18-bf05-0ab402789d59 (accessed on 10 May 2017).
- Chang, H.H.; Chen, C.H. The Study of Visitor’s Willingness to Pay for Interpretative Service and Environmental Conservation: A Case of FuShan Nature Preserve Park. J. Tour. Travel Res. 2010, 5, 57–76. [Google Scholar]
- Tseng, C.H.; Lee, M.T. A Case Study of Tourist Willingness to Pay for Guidance Services: The Fushan Botanical Garden. J. Commer. Mod. 2008, 4, 29–49. [Google Scholar]
- Soil and Water Conservation Bureau of the Council of Agriculture, Executive Yuan. Water and Soil Conservation Handbook; Soil and Water Conservation Bureau of the Council of Agriculture, Executive Yuan: Nantou, Taiwan, 2005.
- Soil and Water Conservation Bureau of the Council of Agriculture, Executive Yuan. Reference Manual for Overall Investigation and Planning of Watershed Area; Soil and Water Conservation Bureau of the Council of Agriculture, Executive Yuan: Nantou, Taiwan, 2008.
- King, H.B.; Liu, C.P.; Hsia, Y.J.; Huang, J.L. Interactions of the Fushan Hardwood Forest Ecosystem and the Water Chemistry of Precipitation. Taiwan J. For. Sci. 2003, 18, 363–373. [Google Scholar]
- Zhang, B.; Li, W.; Xie, G.; Xiao, Y. Water Conservation of Forest Ecosystem in Beijing and Its Value. Ecol. Econ. 2010, 69, 1416–1426. [Google Scholar]
- State of the Voluntary Carbon Markets. 2017. Available online: https://www.cbd.int/financial/2017docs/carbonmarket2017.pdf (accessed on 10 May 2017).
- Dasgupta, P.S. The Welfare Economic Theory of Green National Accounts. Environ. Resour. Econ. 2009, 42, 3–38. [Google Scholar] [CrossRef]
- Obst, C.; Hein, L.; Edens, B. National Accounting and the Valuation of Ecosystem Assets and Their Services. Environ. Resour. Econ. 2016, 64, 1–23. [Google Scholar] [CrossRef]
- Mace, G.M.; Norris, K.; Fitter, A.H. Biodiversity and Ecosystem Services: A Multilayered Relationship. Trends Ecol. Evol. 2012, 27, 19–26. [Google Scholar] [CrossRef]
- Wang, B.; Zheng, Q.H.; Guo, H. Economic Value Assessment of Forest Species Diversity Conservation in China Based on the Shannon-Wiener index. For. Sci. Res. 2008, 21, 268–274. [Google Scholar]
- Zhang, Y. Research on the Value Assessment of Forest Biodiversity in China. For. Econ. 2001, 3, 37–42. [Google Scholar]
- Choi, H.A.; Lee, W.K.; Song, C.; Forsell, N.; Jeon, S.; Kim, J.S.; Kim, S.R. Selecting and Applying Quantification Models for Ecosystem Services to Forest Ecosystems in South Korea. J. For. Res. 2016, 27, 373–1384. [Google Scholar] [CrossRef]
- Ninan, K.N.; Inoue, M. Valuing Forest Ecosystem Services: What We Know and What We Don’t. In Valuing Ecosystem Services; Edward Elgar Publishing: Cheltenham, UK, 2013; Volume 93, pp. 137–149. [Google Scholar]
- Lyytimäki, J.; Sipilä, M. Hopping on One Leg: The Challenge of Ecosystem Disservices for Urban Green Management. Urban. For. Urban Green. 2009, 8, 309–315. [Google Scholar] [CrossRef]
- Shackleton, C.M.; Ruwanza, S.; Sanni, G.S.; Bennett, S.; De Lacy, P.; Modipa, R.; Mtati, N.; Sachikonye, M.; Thondhlana, G. Unpacking Pandora’s Box: Understanding and Categorising Ecosystem Disservices for Environmental Management and Human Well-being. Ecosystems 2016, 19, 587–600. [Google Scholar] [CrossRef]
Figure 1.
The geographical location and forest resources of Taiwan. (a) Geographical location of Taiwan. (b) Forest coverage of Taiwan. (c) The national forest working circles in Taiwan (area marked with blue lines). (d) Protected areas in Taiwan (area marked with red lines).
Figure 1.
The geographical location and forest resources of Taiwan. (a) Geographical location of Taiwan. (b) Forest coverage of Taiwan. (c) The national forest working circles in Taiwan (area marked with blue lines). (d) Protected areas in Taiwan (area marked with red lines).

Figure 2.
Unit reduction costs of different pollution sources and the benefits of forest air purification. Total suspended particles (TSP) (referring to particles suspended in the air) and suspended particles (PM10) (referring to particles with a size of less than 10 μm) belong to the category of granular pollutants, so the unit control cost of TSP (total suspended particles) is used as that of particulate pollutants. Currently, the data available for per unit control cost is limited to SOx, so the unit control cost of SO2 is replaced by that of SOx. Forest coverage area of woodland is 1,695,469 ha.


Table 1.
Ecosystem service valuation method, indicator and unit price used in this study.
| Ecosystem Service | Valuation Method | Indicator | Unit Price |
|---|---|---|---|
| Forest water conservation | Market price-based approaches | Water conservation quantity(m3) | Shadow price of industrial water |
| Air purification | Cost-based approaches | Removal of pollutants (kg) | Pollution control cost |
| Biodiversity | Benefit transfer method | Protected area (ha) | Benefits of protected areas |
| Soil loss prevention | Cost-based approaches | Soil loss (m3) | Costs of river dredging and reservoir dredging |
| Forest carbon sequestration | Market price-based approaches | Carbon storage (t) | Carbon price |
| Forest recreation/environmental education | Benefit transfer method | Forest recreation visits /Person-time of forest environmental education | Forest recreation price /Forest environmental education price |
Table 2.
Value of forest recreation (including environmental education).
| Item | People/Year | Price | Benefit (NT Million) |
|---|---|---|---|
| Forest recreation (A) | 6,133,885 | 1449 1 | 8888 |
| Environmental education (B) | 5,331,244 | 106.68 2 | 569 |
| Forest recreation (including environmental education) (A + B) | 9457 | ||
Publisher’s Note: MDPI stays neutral with regard to jurisdictional claims in published maps and institutional affiliations. |
© 2021 by the authors. Licensee MDPI, Basel, Switzerland. This article is an open access article distributed under the terms and conditions of the Creative Commons Attribution (CC BY) license (https://creativecommons.org/licenses/by/4.0/).
Share and Cite
MDPI and ACS Style
Lin, J.-C.; Chiou, C.-R.; Chan, W.-H.; Wu, M.-S. Valuation of Forest Ecosystem Services in Taiwan. Forests 2021, 12, 1694. https://0-doi-org.brum.beds.ac.uk/10.3390/f12121694
AMA Style
Lin J-C, Chiou C-R, Chan W-H, Wu M-S. Valuation of Forest Ecosystem Services in Taiwan. Forests. 2021; 12(12):1694. https://0-doi-org.brum.beds.ac.uk/10.3390/f12121694
Chicago/Turabian StyleLin, Jiunn-Cheng, Chyi-Rong Chiou, Wei-Hsun Chan, and Meng-Shan Wu. 2021. "Valuation of Forest Ecosystem Services in Taiwan" Forests 12, no. 12: 1694. https://0-doi-org.brum.beds.ac.uk/10.3390/f12121694
Note that from the first issue of 2016, this journal uses article numbers instead of page numbers. See further details here.