
Ultrasonic Signal Transmission Performance in Bolted Connections of Wood Structures under Different Preloads


College of Mechanical and Electronic Engineering, Nanjing Forestry University, Nanjing 210037, China
*
Author to whom correspondence should be addressed.
†
These authors contributed equally to this work.
Forests 2021, 12(6), 652; https://0-doi-org.brum.beds.ac.uk/10.3390/f12060652
Submission received: 16 April 2021
/
Revised: 17 May 2021
/
Accepted: 18 May 2021
/
Published: 21 May 2021
(This article belongs to the Special Issue Timber and Construction Structure)
Abstract
:In industrial applications, bolt connections are simple and economical, contributing to their popularity for use in wood packing boxes. However, they can easily fail when subjected to a continuous vibrational load under usual working conditions such as transportation and hoisting. Based on an ultrasonic technique, nondestructive evaluation can be used to quickly detect large-scale structures, but the complex propagation properties in wood limit its application. To solve this problem, a time-reversal method was adopted to predict the residual preload on bolted connections by focusing on the signals collected by wood structures, which helps to assess the structures’ reliability. In this study, the residual preload of bolted connections in wood structures was predicted using the deep-learning method, LSTM, one-dimensional Resnet and Densenet, and tree classification models. It was confirmed that the use of the time-reversal method for ultrasonic detection focused on the signals transmitted in bolted connections of wood structures and deep-learning methods are a feasible way to predict an ultrasonic transmission model.
1. Introduction
Wood is an organic, heterogeneous, and anisotropic material, the utility and applicability of which are determined by its mechanical properties, such as the modulus of rupture (MOR), modulus of elasticity (MOE), and tensile strength (TS) [1,2]. As a type of renewable material, wood is widely used in industrial production [3]. As a packaging material, wood plays an indispensable link between packaging and transportation. Bolted connections are commonly adopted in wood packaging. However, due to being impacted by continuous vibration during transportation, bolted connections within a packing box are easily lost, leading to an unreliable overall structure. The strength of wood structure bolt connections depends on both the properties of wood (defects, density, quality, etc.) and bolt (quality, size, etc.). The more intuitive performance is that the residual preload on the bolt will decrease or even disappear.
Thus, the reliability of the bolted connections in wood structures needs to be detected. Ultrasonic and near infrared spectroscopy are widely used as nondestructive testing methods in agricultural and forestry products [4]. In particular, ultrasonic detection can evaluate wood properties and detect defects [5,6,7,8]. During detection, the ultrasonic variation sent to a tested structure is defined as a connection-losing parameter. Piezoelectric (PZT) sensors are usually set to emit and receive ultrasonic signals. This method studies the ultrasonic signals on touching surfaces according to linear phenomena (e.g., wave reflection and scattering) and nonlinear phenomena (e.g., signal modulation and energy loss). Guided waves and Lamb waves are the most practical ways to conduct ultrasonic excitation [9,10]. Domingos [11] built a microcontrol system to nondestructively detect wood ultrasonically. Ornelas [12] verified the feasibility of ultrasonic detection on the MOE of different wood species.
The noise existing in a detection system and the vibration absorption brought up by the porosity of wood lead to signal dissipation during the process [13], resulting in a low detection accuracy. To solve this problem, a time-reversal method can be used to optimize the accuracy of signal collection. In this method, the collected signals are re-emitted to the original excitation after being reversed in a time domain to rebuild the input signal at the original excitation. The signal is focused during transmission [14].
In terms of the heterogeneity of wood, the ultrasonic transmission velocity in wood varies [15]. Additionally, the roughness and defects [16] of wood affect the contact surfaces of connections. Within the elastic limit of wood, the incremental preload in bolt connections enlarges contact surfaces and strengthens the reliability of the structure, while outside the elastic limit, the preload generates plastic transformation in wood [17,18,19] around the bolt, which reduces contact surfaces and might dissipate the signal strength. Hence, a linear correlation does not exist between the residual preload of bolts and the signal value transmitted in wood (Sotomayor Castellanos [20] found that there is no linear relationship between ultrasonic velocity and wood density). In order to predict the residual preload of a bolt in connections of wood structures, nonlinear models need to be adopted.
With the development of technology, as a type of classification algorithm, deep learning has been shown to have good performance. The recurrent neural network (RNN) [21], long short-term memory (LSTM) [22,23], and gated recurrent unit (GRU) [24] are commonly used for one-dimensional signals such as time sequence signal [25] classification. In terms of two-dimensional image identification, the deep convolutional network [26,27], residual network (Resnet) [28,29], Densenet [30,31] and their improved structures have been widely used in image classification tasks. Ouahabi [32] used the deep-learning method to perform real-time semantic segmentation of ultrasonic acoustic images. Senin [33] employed the SAX-VSM method to cluster temporal signals. Hatami [34] used the deep convolutional neural network to classify one-dimensional signals after converting them into two-dimensional signals.
In this study, a neural network model based on LSTM was designed by using long- and short-term memory networks, and the deep convolutional neural networks WideResnet and Densenet were extended to one-dimensional usage. The signals obtained with the time-reversal method and the signals collected directly were studied using the algorithm. Classification models, including XGBoost and LightGBM, were applied in this method to predict the reliability of bolted connections on wood structures. In addition, tests were carried out to verify the effectiveness of the deep convolutional network and time-reversal methods.
2. Materials and Methods
2.1. Experimental System Setup
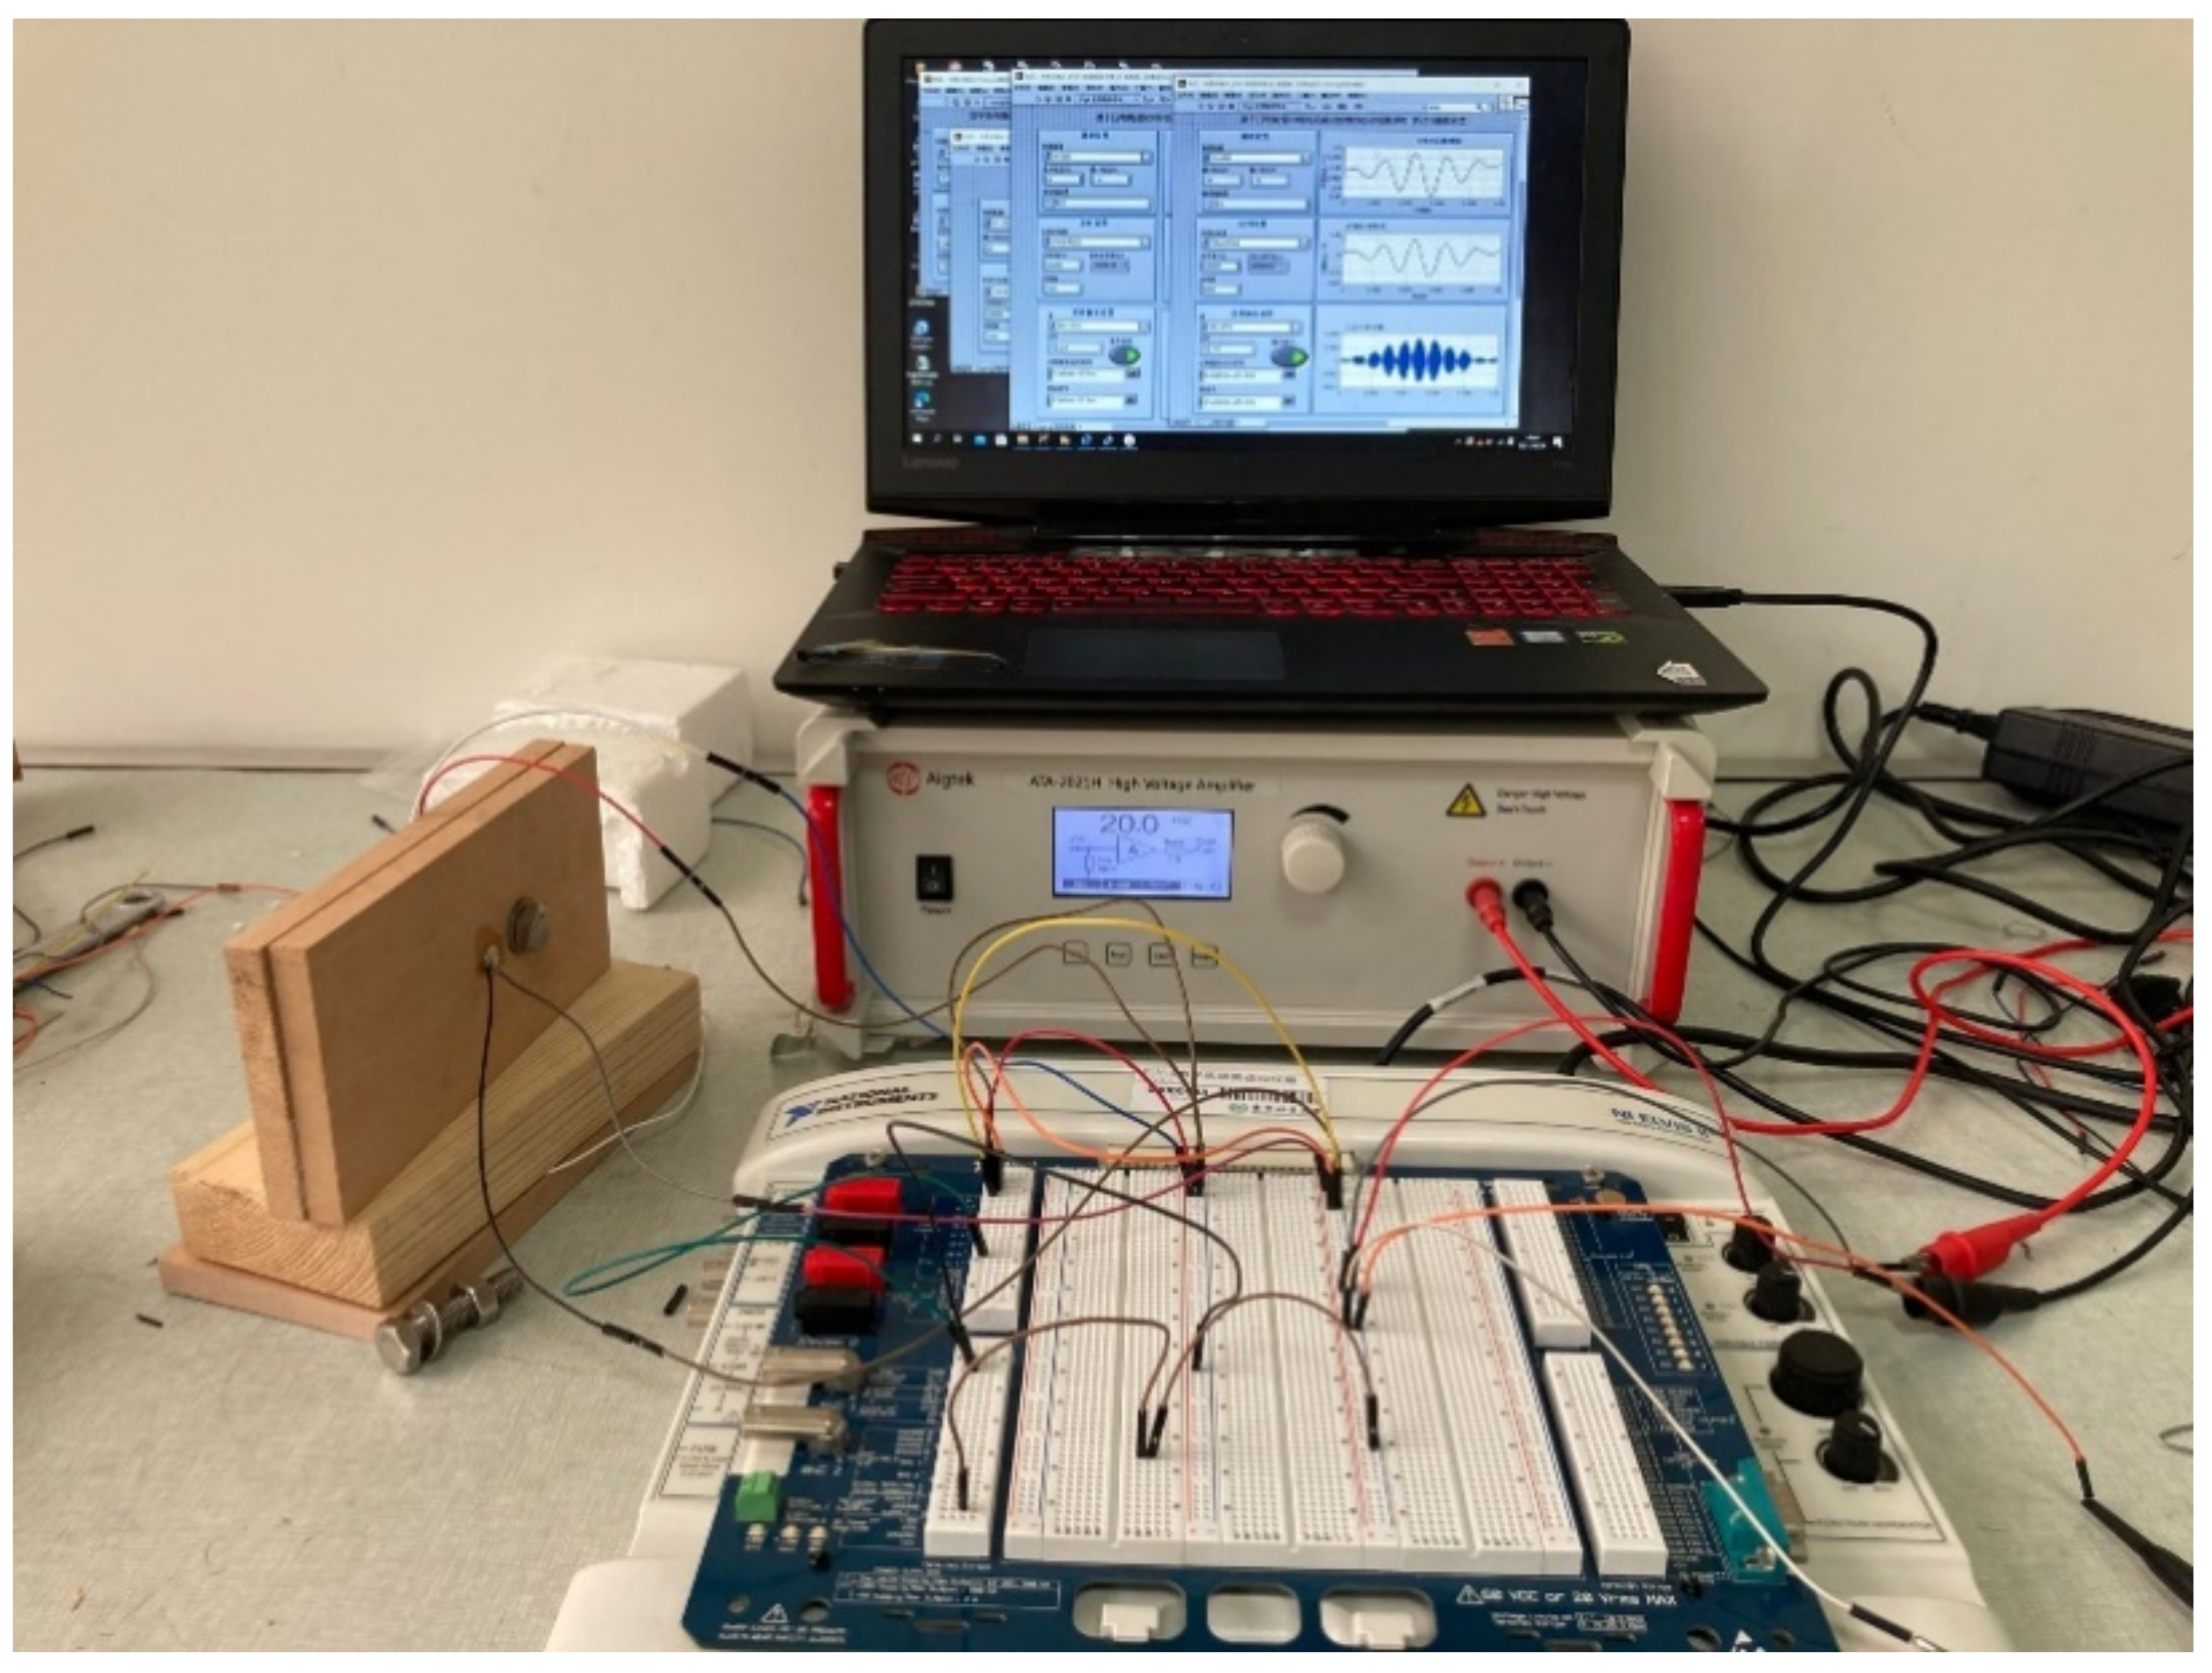
The experimental system (Figure 1) was made up of a power amplifier, a data acquisition card (NI USB-6366), and a computer. Each tested sample contained two pieces of faultless beech wood with dimensions of 200 mm in length, 100 mm in width, and 10 mm in height and was fastened by an M10 bolt with dimensions of 1.5 mm in screw pitch and 40 mm in length. The bolt met the ASTM A194/A194M standard. The density of the beech was 0.70 g/cm3, the moisture content was 10.2%. Two PZTs (piezoelectric ceramic transducers) were placed on the top face and bottom face of each wood piece. LabVIEW programming was used to control the data acquisition card to transmit the excitation signal and collect the signal through the PZTs.
2.2. Time-Reversal Method
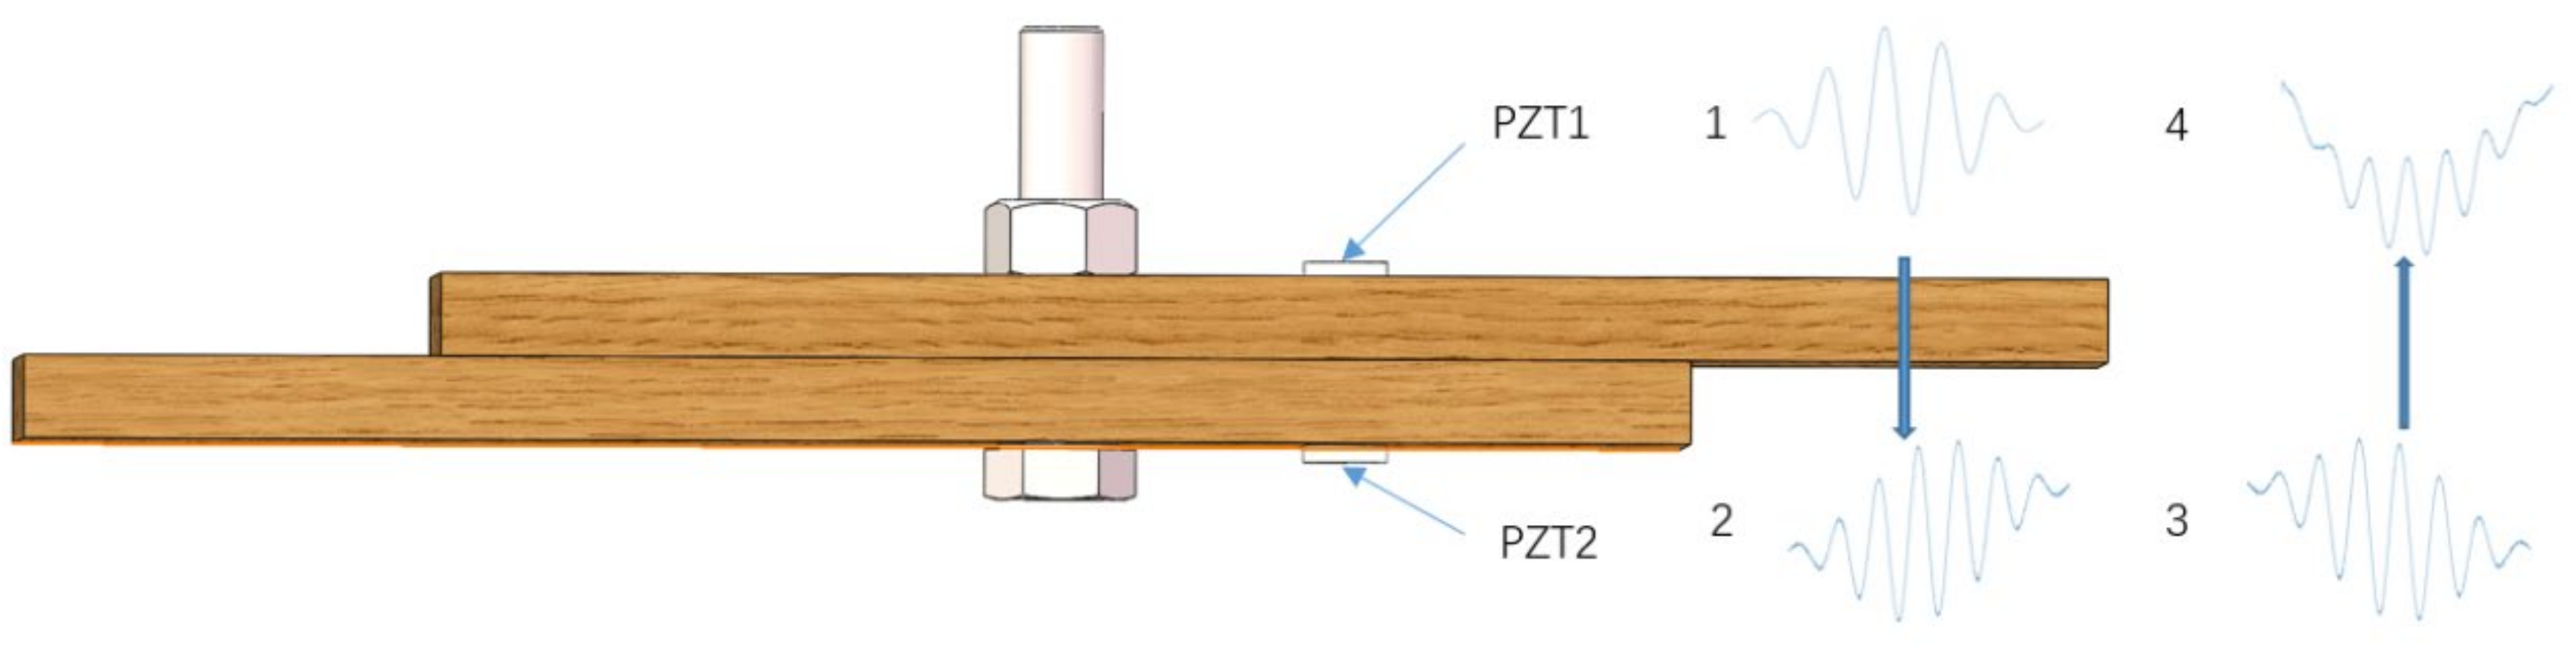
As shown in Figure 2, for the time-reversal method, PZT1 was set as a signal actuator to input excitation signals I(ω), and as a signal receiver, PZT2 obtained the response from the structure. This signal can be expressed as shown in Equation (1):
where and are electromechanical coupling factors of PZT1 and PZT2, and is the frequency response transfer function of the wood structure. The obtained signals were time reversed. Because the signals were conjugated in the time and frequency domains, the reversal signal can be described as shown in Equation (2):
After being time reversed, the guide-wave signal was re-excited by PZT2. Based on the principle of reciprocity of sound wave propagation, for the structure where the sensor and actuator were determined, reciprocity also exists between the sensor and actuator, but the frequency response transfer functions are the same. At this moment, received by PZT1 can be expressed by the following equation:
where is the product of and , is a complex conjugate product, so it is a real, even, and positive function. Only the amplitudes of reversal signals and excitation signals vary when the excitation frequency ω is kept constant. The looseness of bolted connections can be judged according to the difference between the reversal focusing signal and the excitation signal.
Figure 2.
Experimental sample and method sketch.

2.3. Symbolic Aggregate Approximation (SAX) Model
The SAX method transfers a time sequence of random length into a character string. Its core task is to express the character string as a piecewise aggregate approximation (PAA) to describe high-dimensional data columns in low dimensions. Then, the results expressed with PAA are signified as a discrete character string. Due to its high efficiency and easy computation, the SAX method performs well in the classification, clustering, and pattern discovery of time sequences.
The procedure involving the transfer of a time sequence covers the following steps: (1) an original time sequence is normalized and transferred to PAA data, meaning that subdata are separated according to the length of n into M (amount) subsequences of the same length; (2) the average number of sampling points in each subsequence is calculated, and all the averages constitute a set with a size of α; (3) the interval splitting points are found with a Gaussian distribution, and then, the averages expressed in PAA are mapped to relative letters to achieve data dimensionality reduction; and (4) the dimensionality reduced data are classified using the vector space model (VSM) algorithm.
2.4. Deep-Learning Model
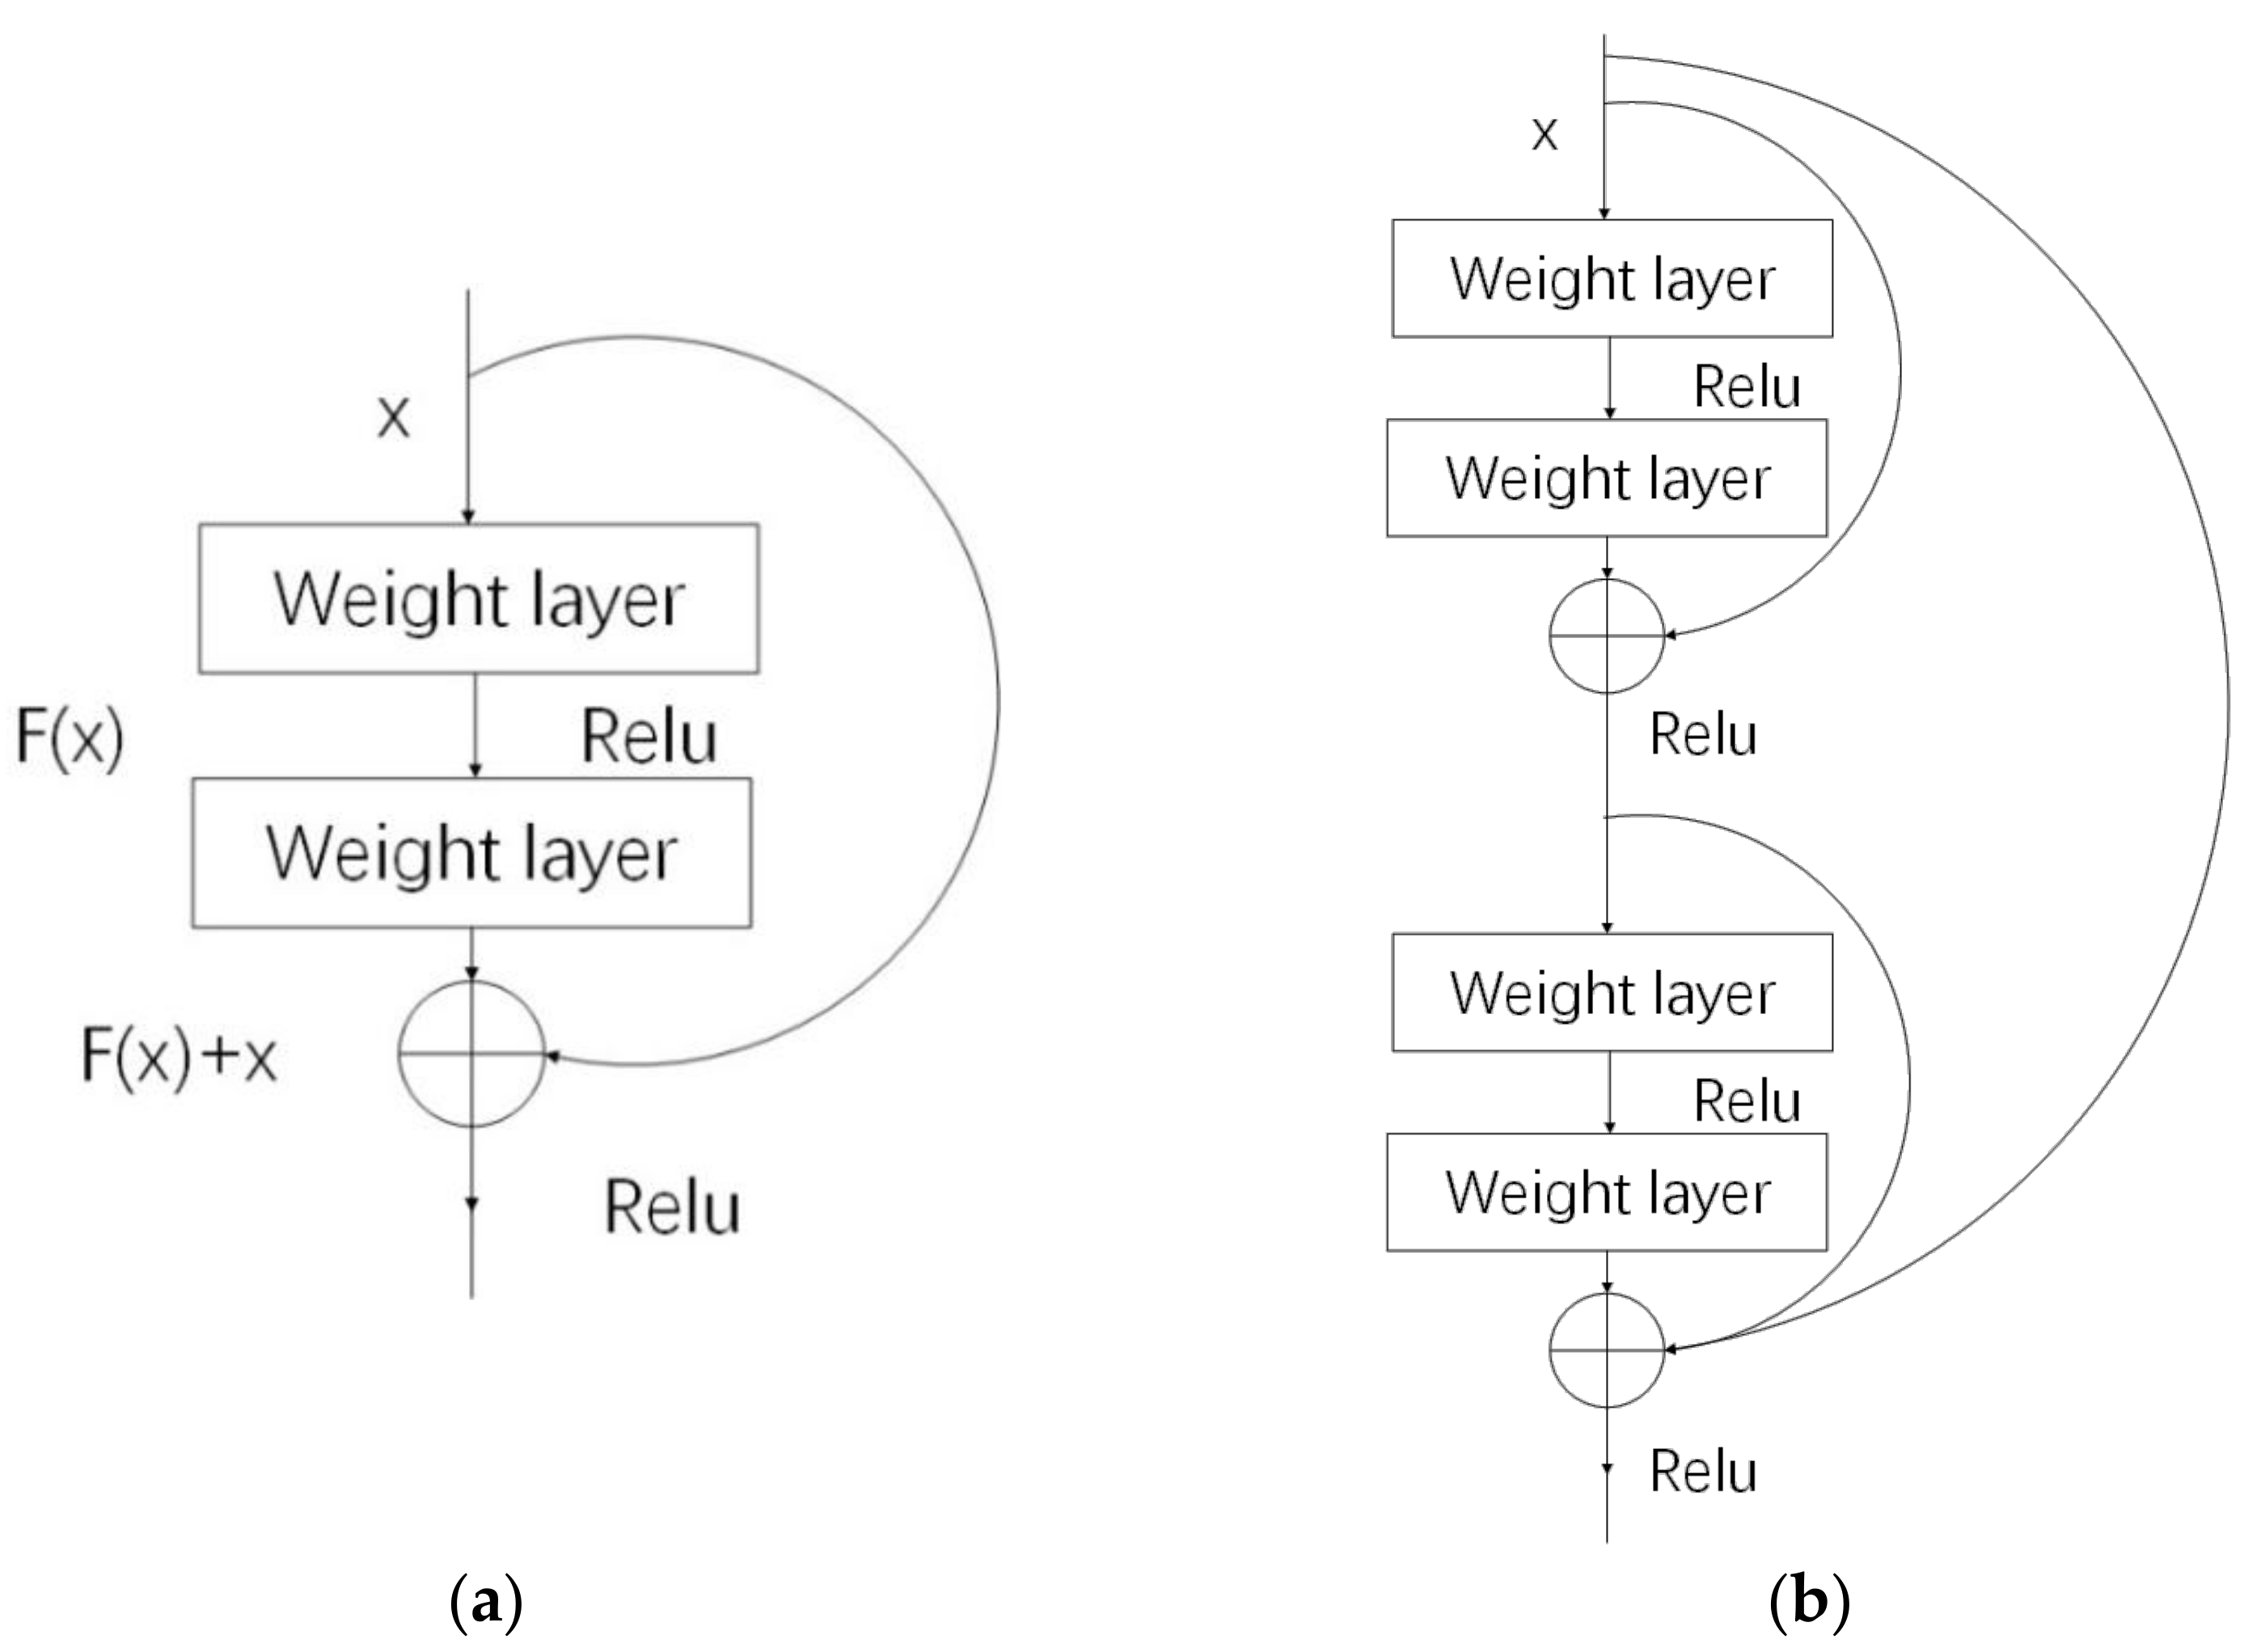
Deep-learning models use convolution to extract image features while reducing the complexity of data (Figure 3). Of these, ResNet and Densenet have been proven to be effective structures in the field of image processing. ResNet introduces the residual module to learn the expected and fitted residuals of the model and solve its degradation problem. Based on ResNet, the WideResNet model was introduced to increase the number of channels in the feature map in ResNet to optimize the effect of learning. DensNet introduced the dense block to ensure that the input on each layer came from the output of the last layer. This operation reduces the gradient explosion and strengthens the transmission of features. Moreover, the features are used more effectively, and parameters are decreased to some degree.
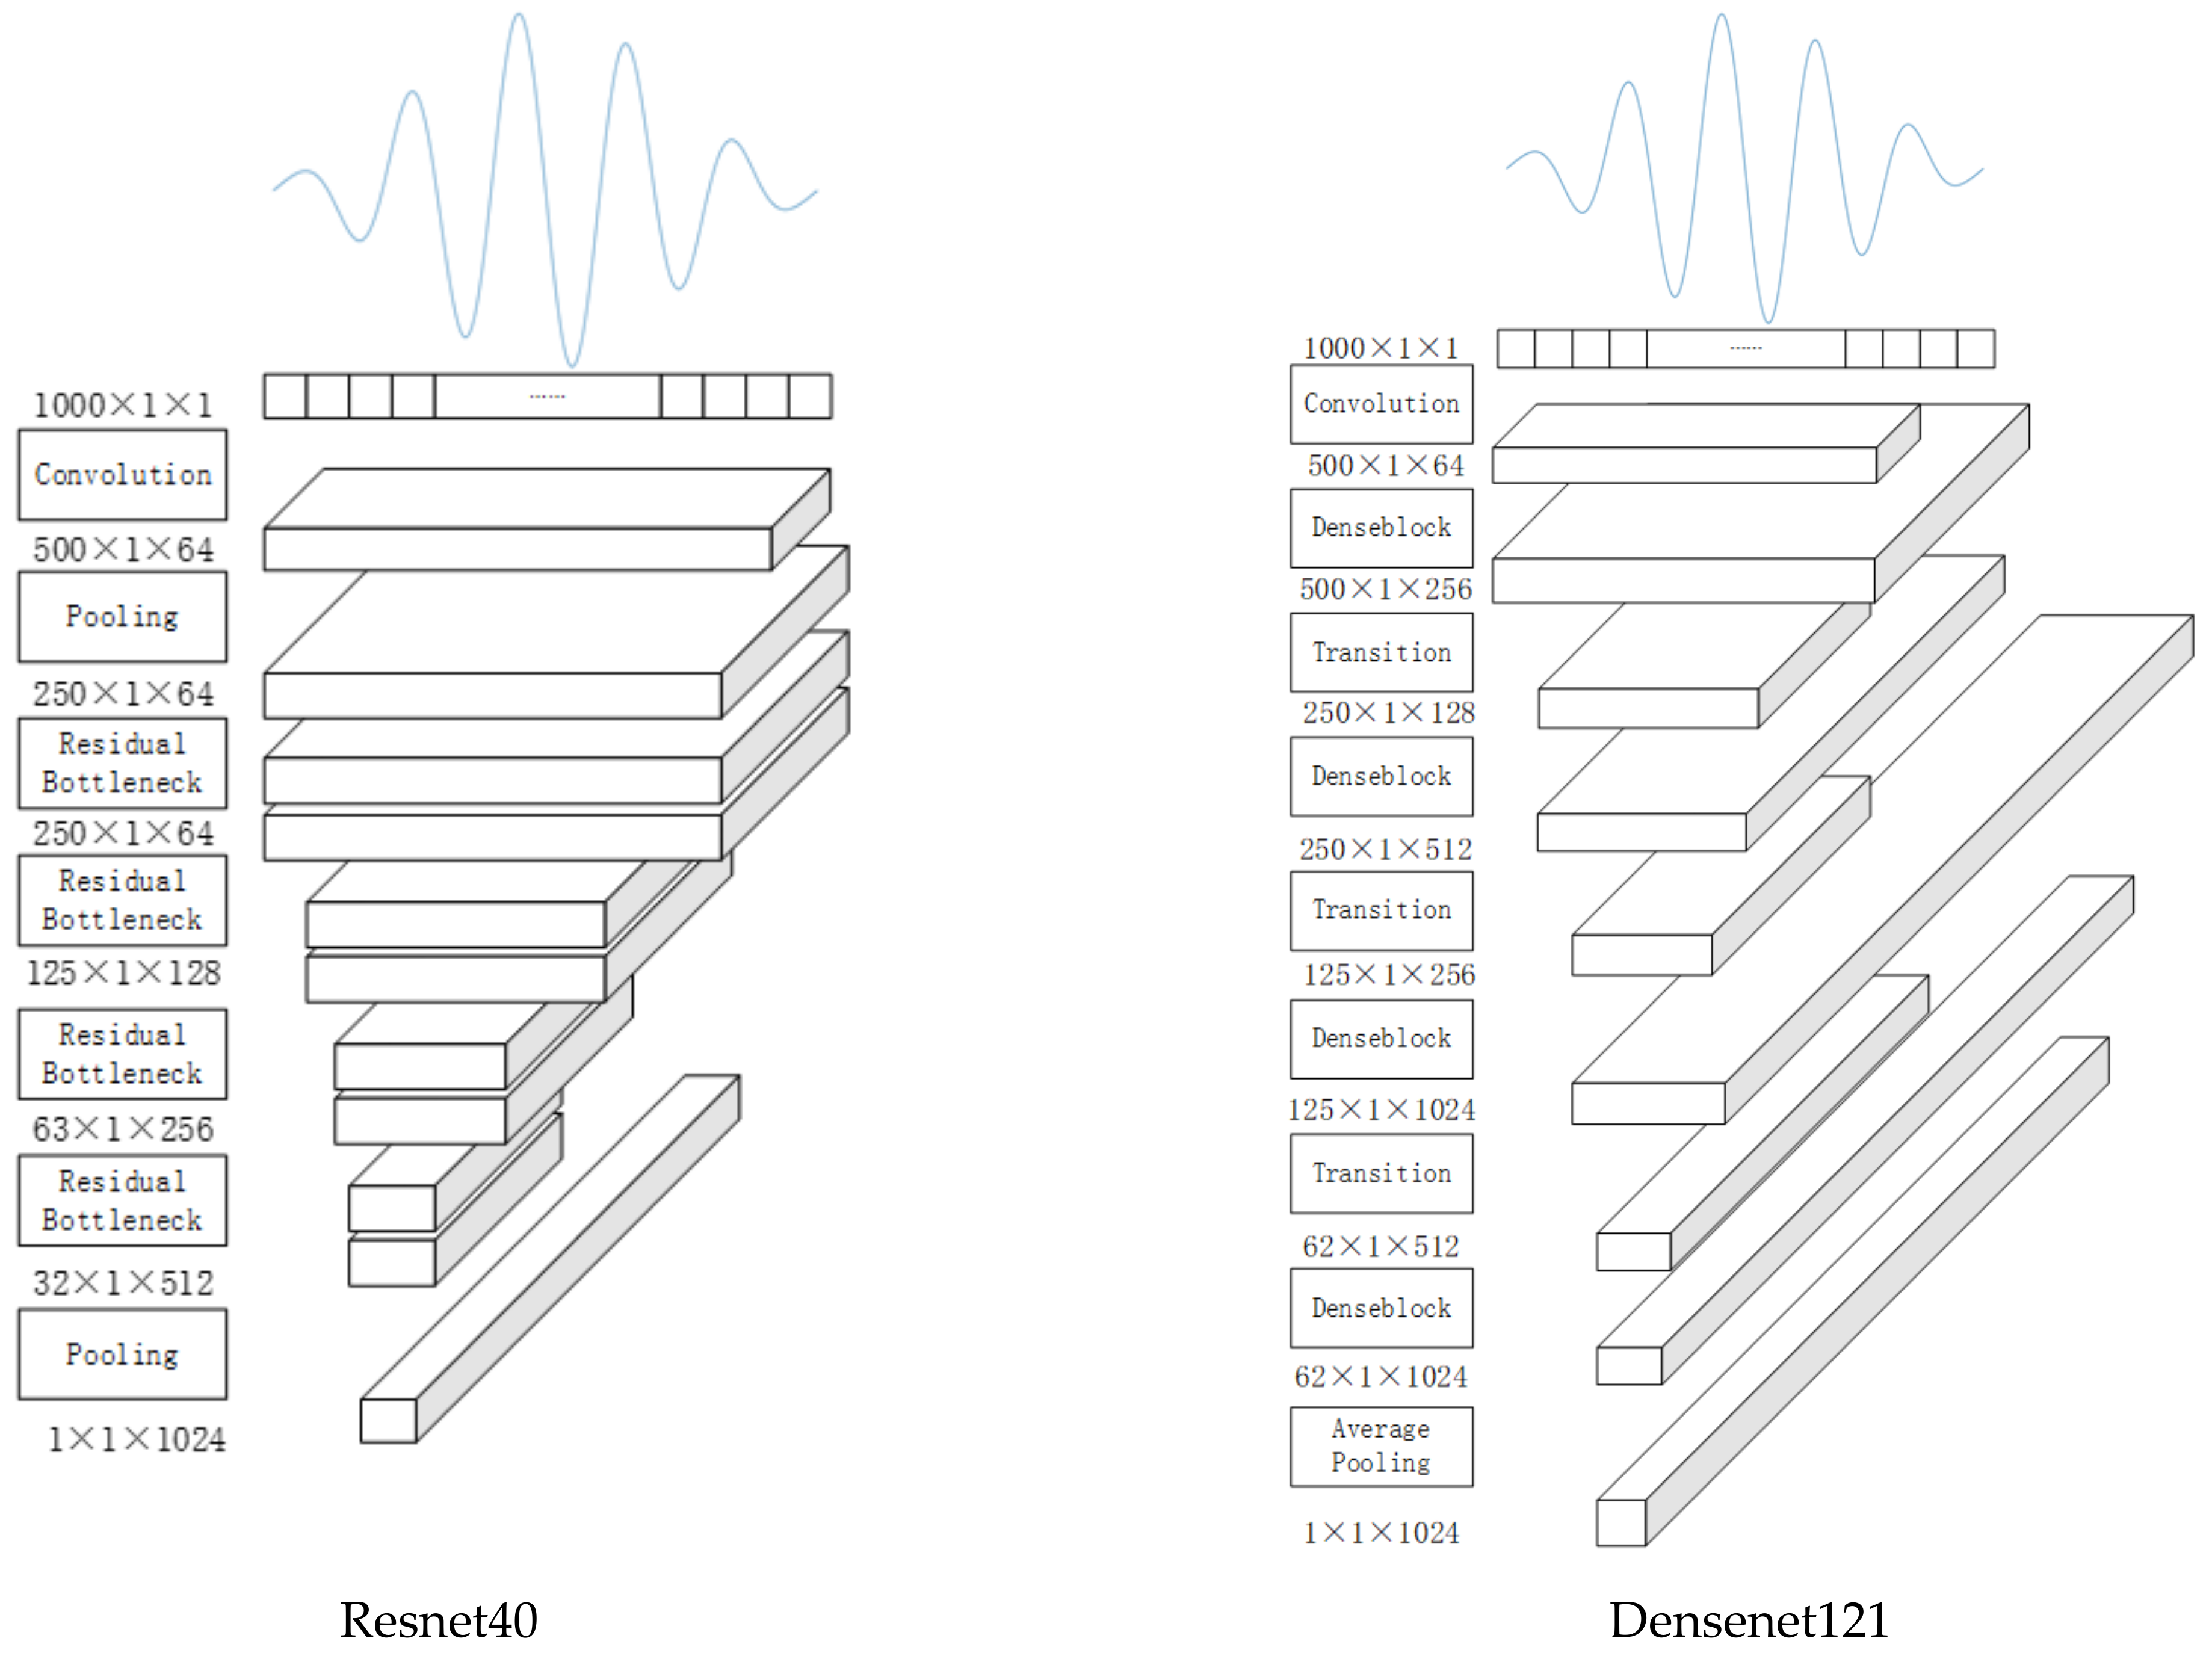
The deep-learning models, WideResnet40_2 [35] and Densenet121, were used to assess one-dimensional signals. To perform this processing, firstly, the original, traditional two-dimensional image input was changed to a one-dimensional signal input, then the convolution kernel was changed from a two-dimensional convolution kernel to a one-dimensional convolution kernel. The network structure is shown in Figure 4.
2.5. LSTM Model
At present, the RNN (recurrent neural network) is widely used in time-domain signal processing. The LSTM model is a special recurrent neural network, as compared to the RNN, which only has one delivery status, . The LSTM has two statuses, and . is the forget gate calculated with the input and the last delivery status , which determines the last status that needs to be forgotten (Equation (4)).
Then, is calculated to remember the gate to determine the information recorded on the cell status (Equation (5)).
After that, the cell status is renewed.
Finally, the output can be obtained based on the above processing (Equation (7)).
3. Results
Emission Signal Selection
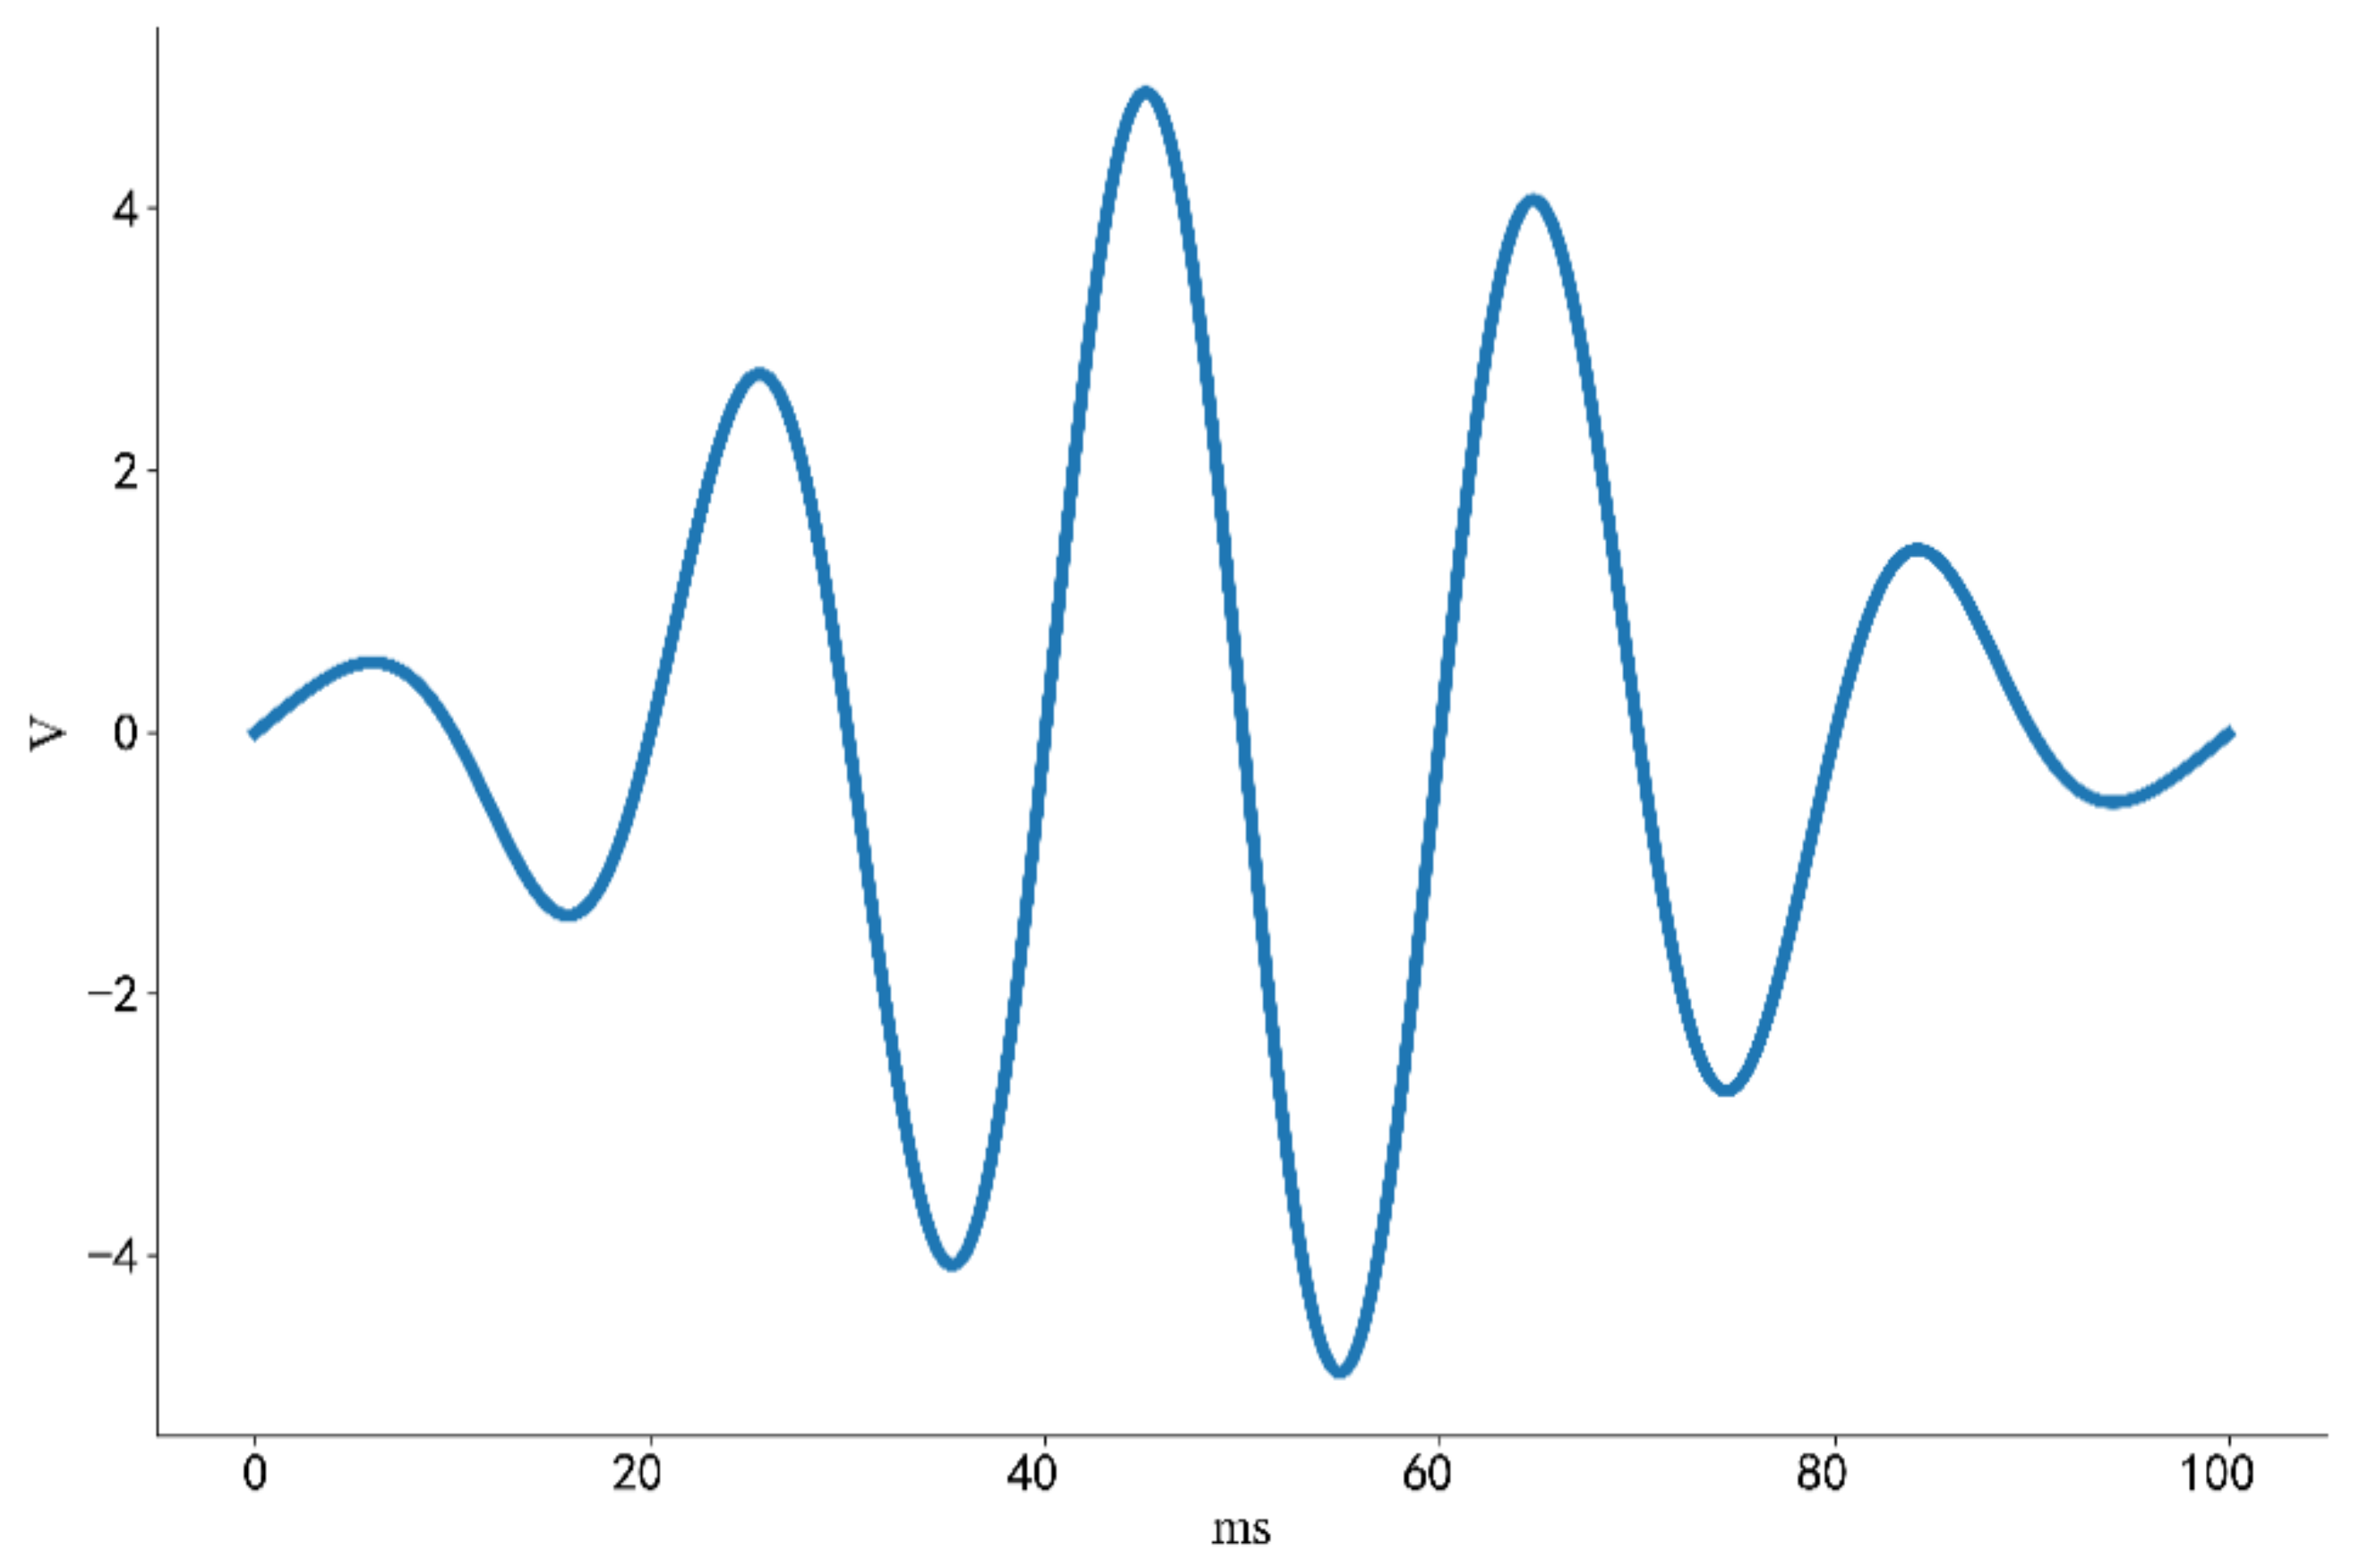
In order to reduce the dispersion degree of ultrasonic signals in the propagation process of wood connections, a single-frequency signal was chosen as the excitation signal. Thus, the five-period, single-frequency signal modulated by the Hanning window function was selected as the excitation signal, and this can be expressed as follows (Equation (8)):
when the emission signal amplitude value was 5 V, the time domain signal was as shown in Figure 5.
The sample was tested under different preloads. Each preload condition was tested around 60 times to ensure the reliability and sufficiency of the data. After removing invalid data, 457 directly collected signals data were obtained (Table 1).
Similarly, based on the directly collected data, 466 signals data were obtained with the time-reversal method after removing invalid data (Table 2).
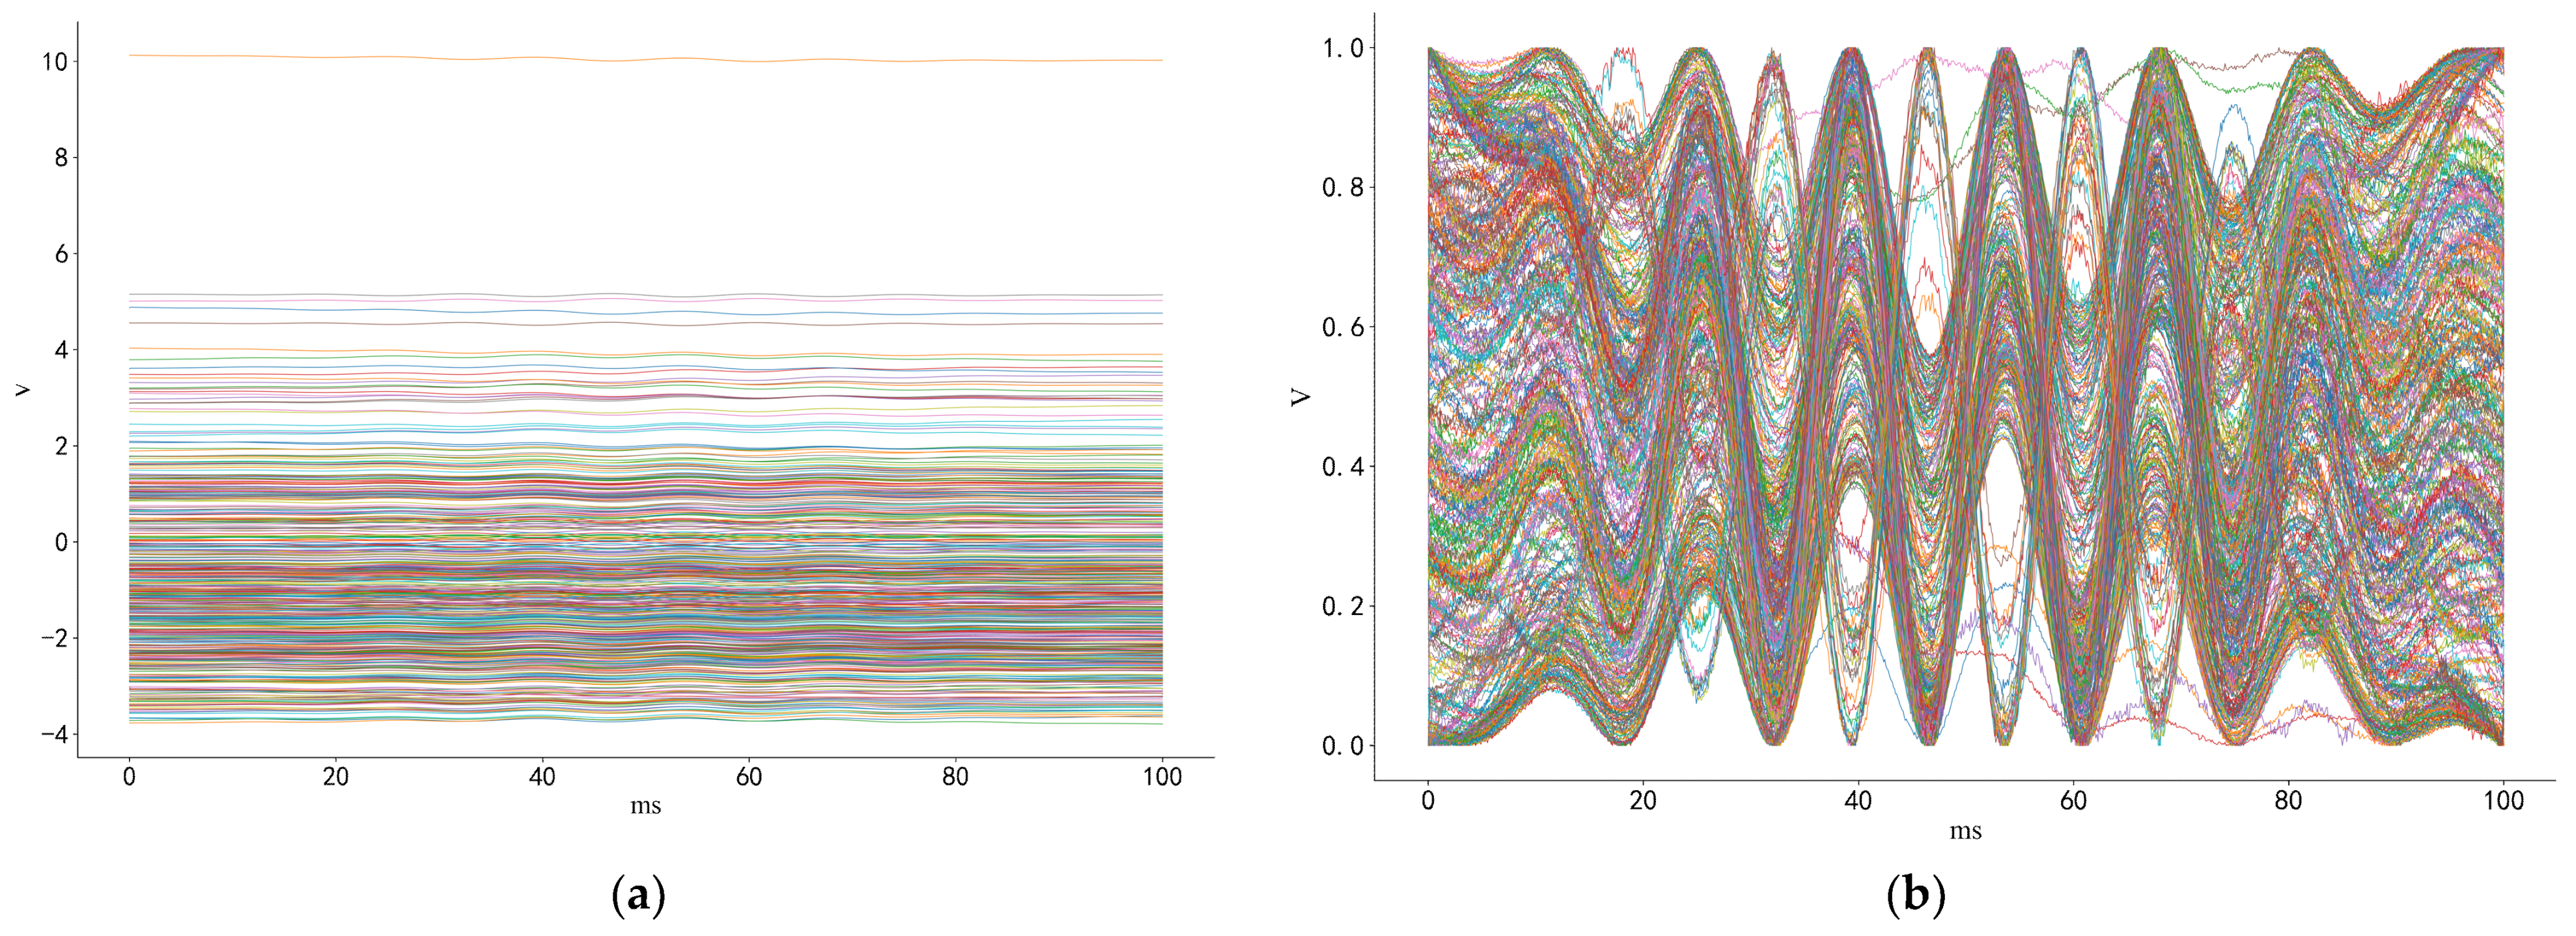
Since wood has the physical property of vibration absorption, and because the emission and collection signals of the data acquisition card only ranged from −10 to 10 V, the directly collected useful signals were smaller than the background noise (Figure 6a). Therefore, the collected signals were filtered to reduce the amount of irrelevant interference, as shown in Figure 6c. The filtered results for the randomly selected experimental signals under each different preload are shown in Figure 6d.
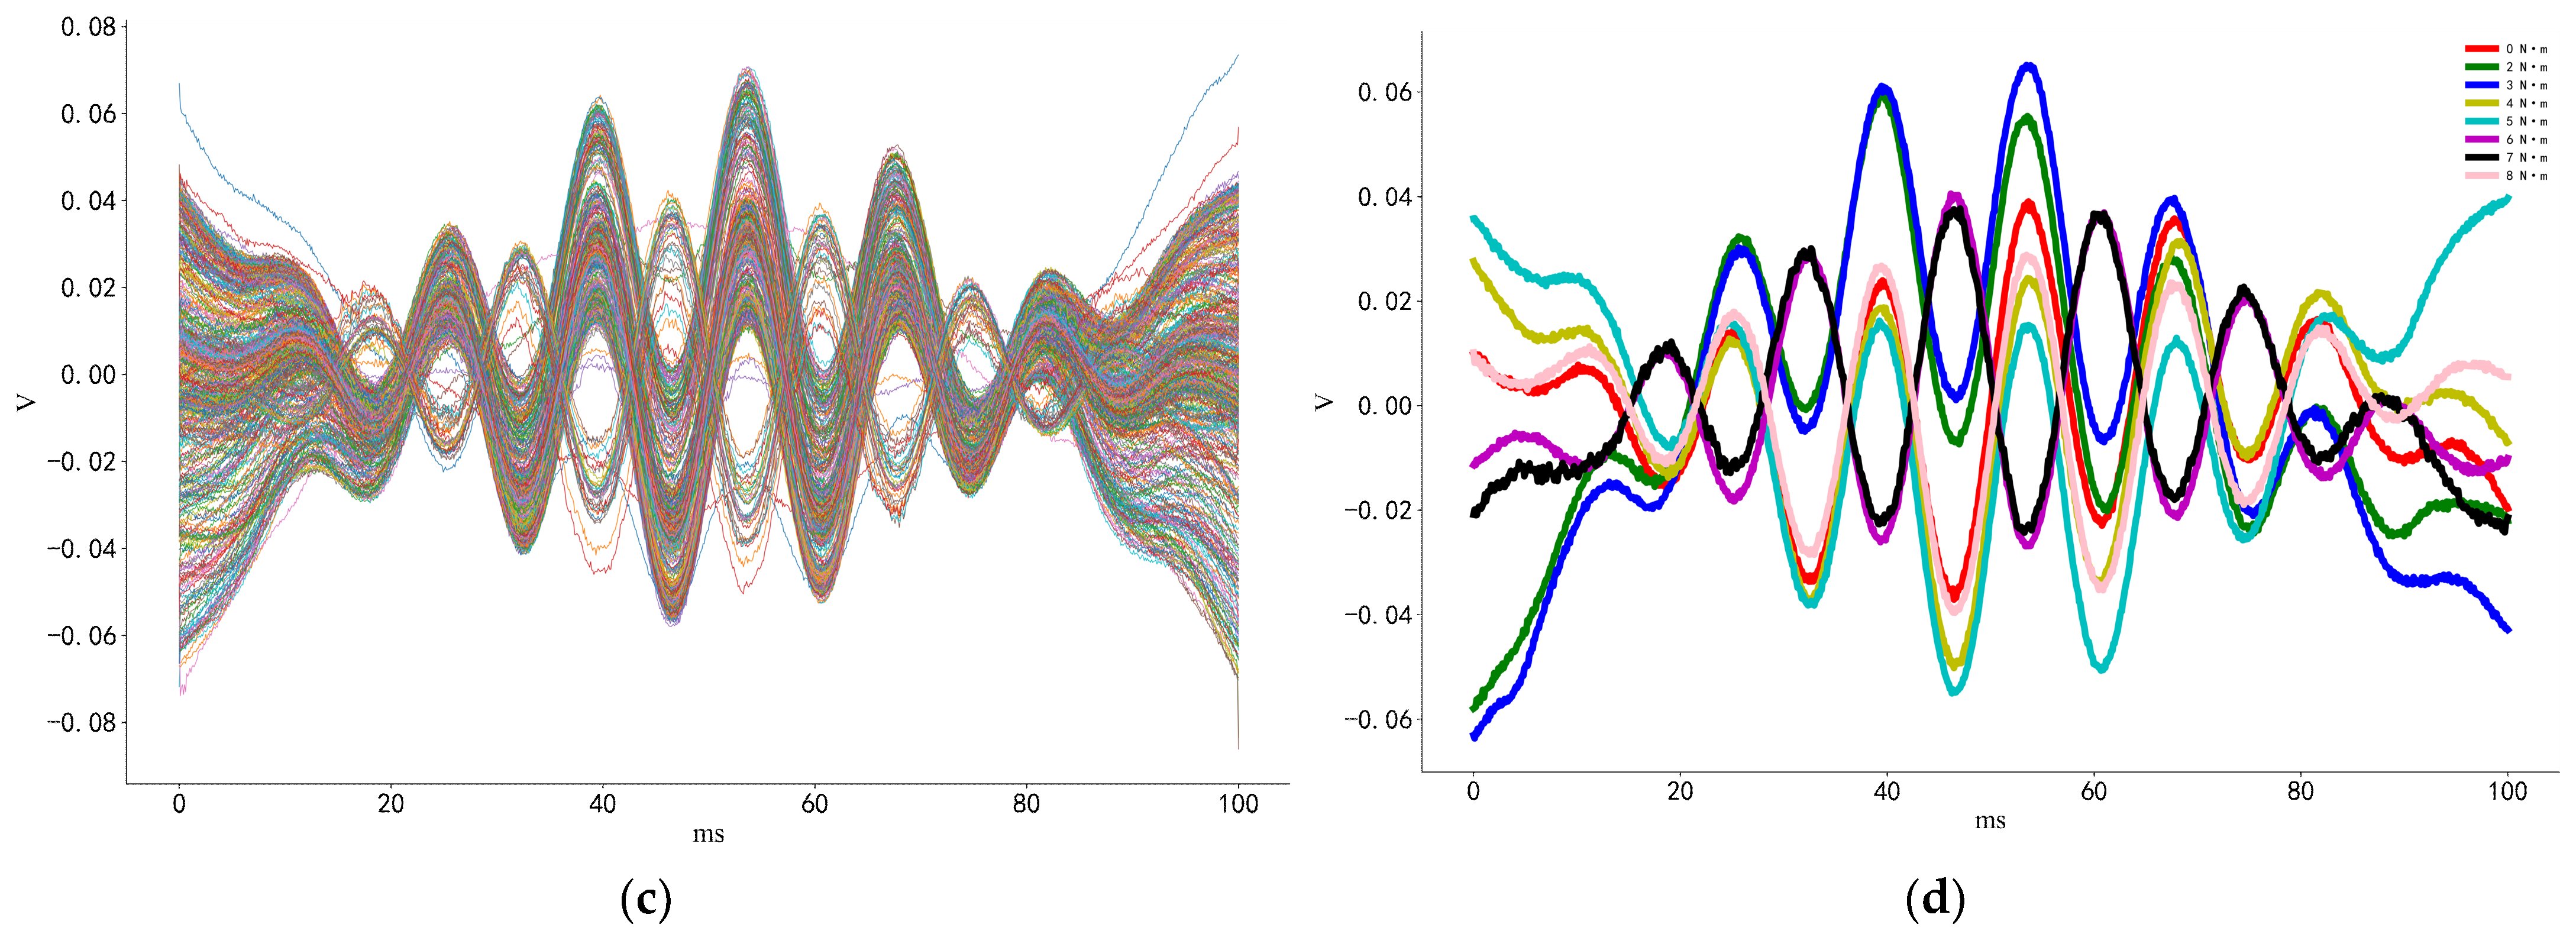
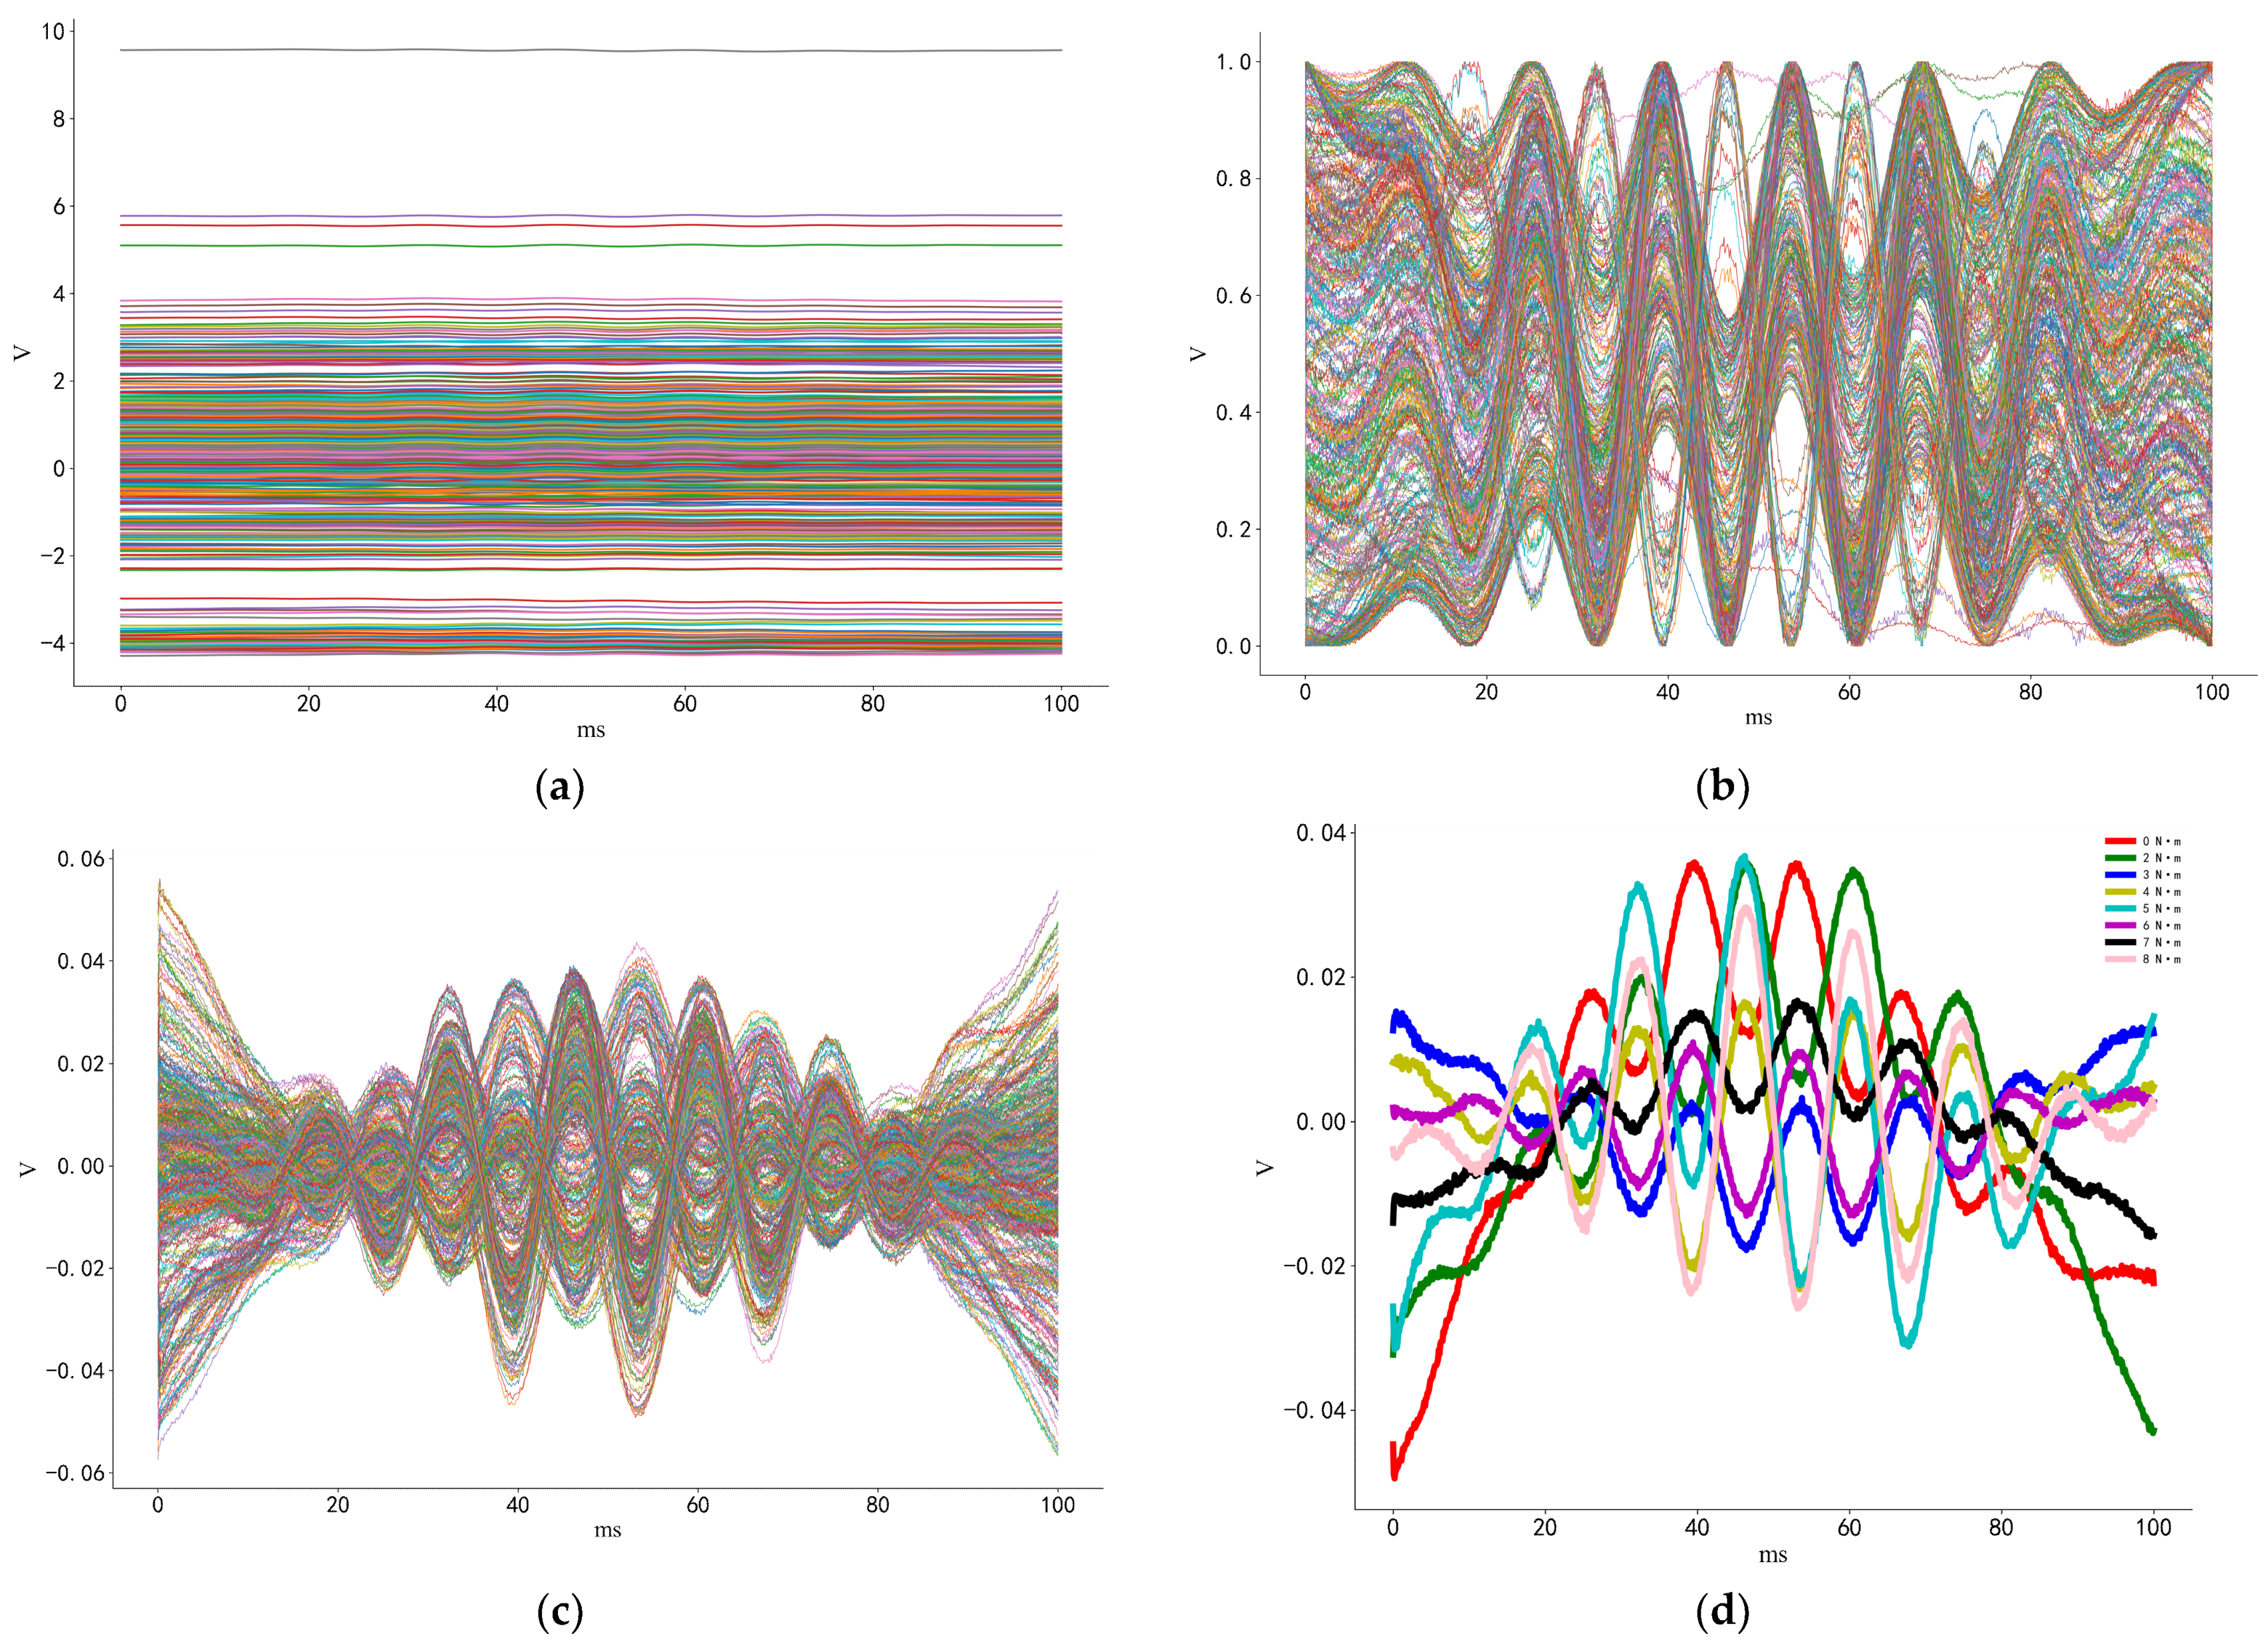
Meanwhile, the same processing methods were carried out on the time-reversal signals, the results of which are presented in Figure 7.
The directly measured signals and the time-reversal signals were divided into a training set and a test set at a ratio of 2:1. The classification label was the torque applied on the bolt. The data distribution is shown in Table 3.
Usually, in practical applications, only the reliability of a connection structure needs to be considered, so the use of binary classification in the algorithm is feasible. A torque of 5 N × m was set as the judging boundary for connection looseness. The collected signals were classified with the LSTM, WideResnet40_2, Densenet121, XGBoost, and LightGBM models. With a grid search, the hyper-parameters of XGBoost were set as follows: learning rate = 0.01, number of trees = 2000, depth = 9, and gamma = 0.1. The hyper-parameters of LightGBM were set as follows: learning rate = 0.01, maximum number of tree leaves = 600, and number of boosted trees = 121. The test results are presented in Table 4.
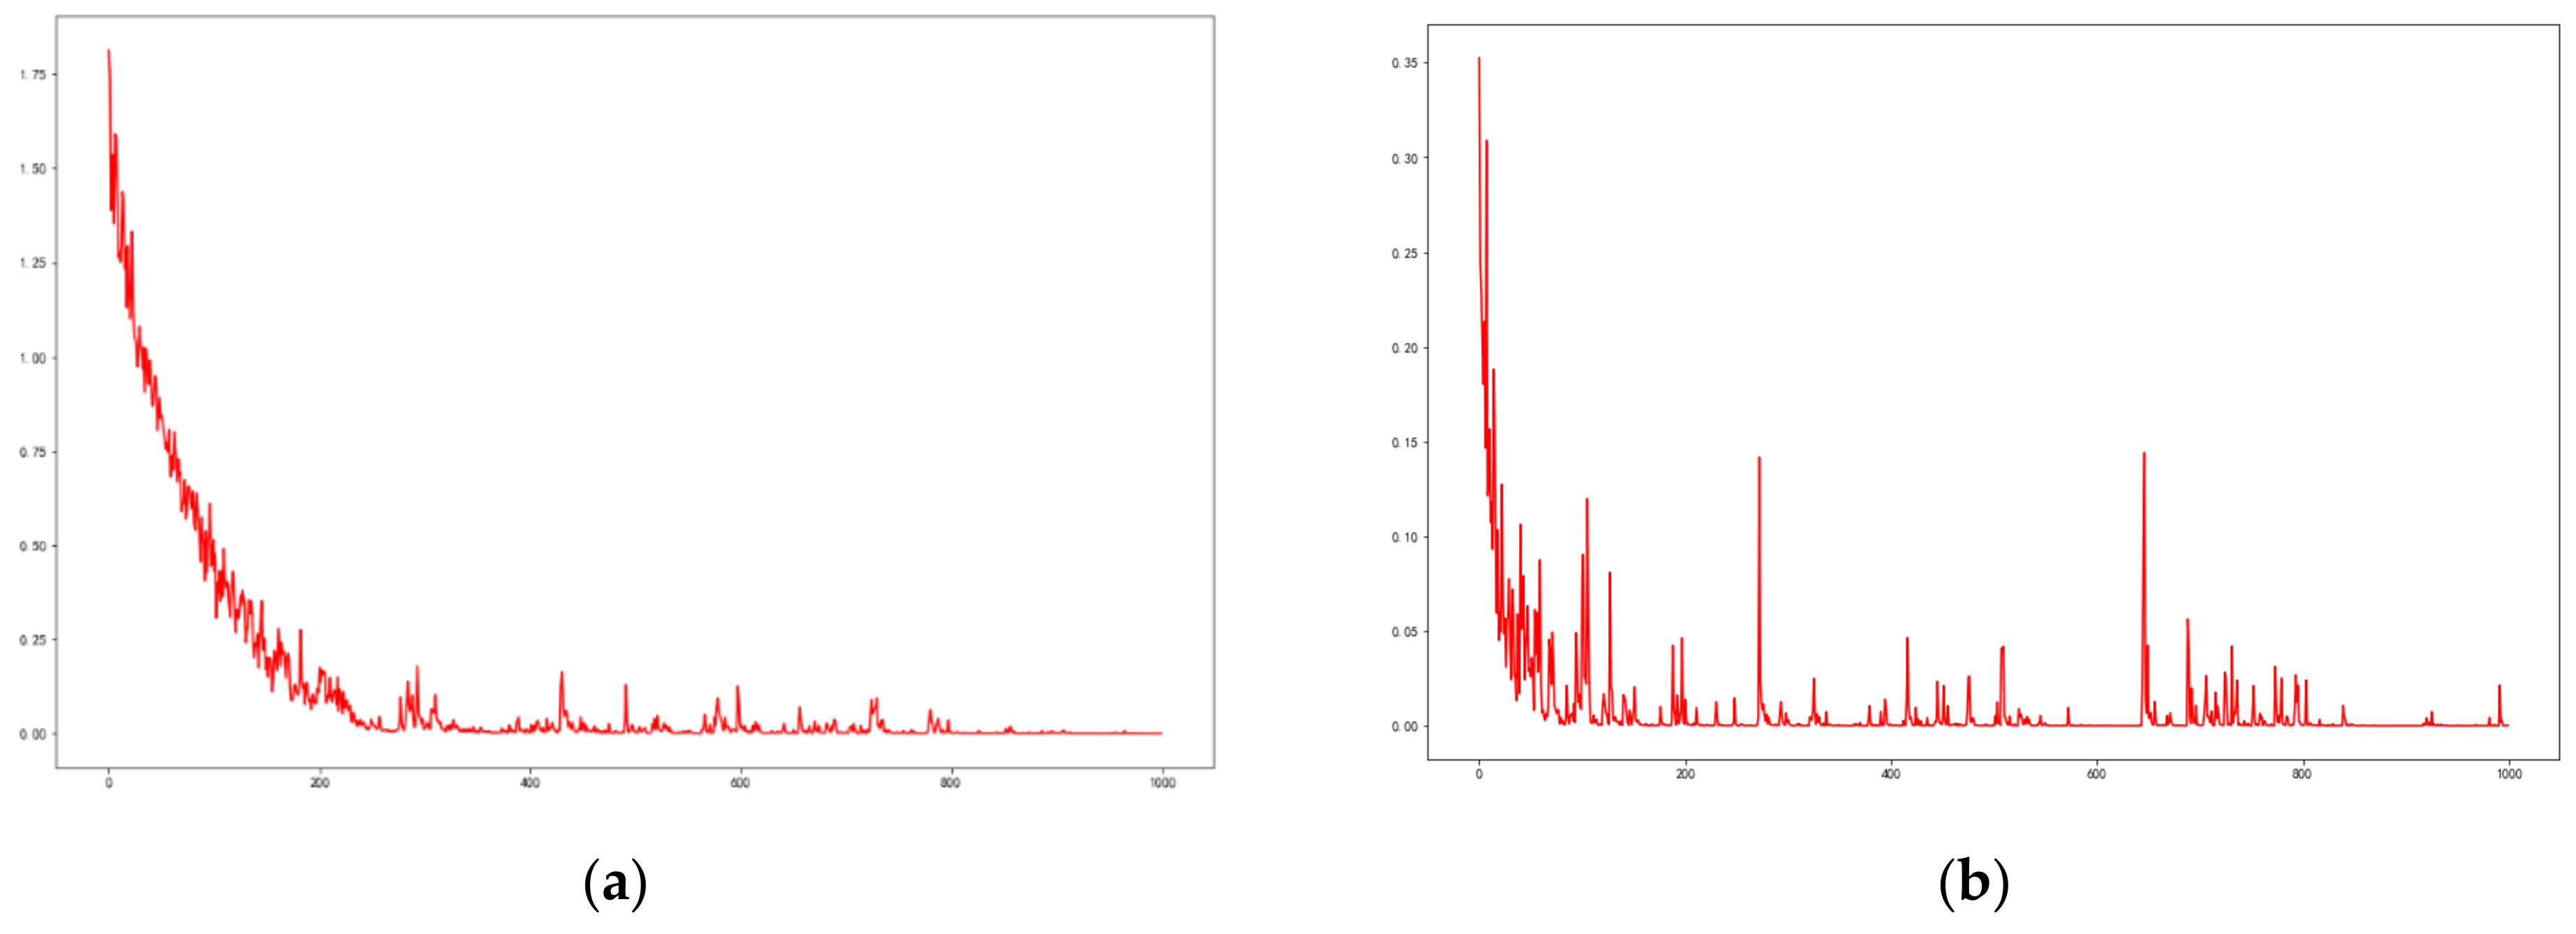
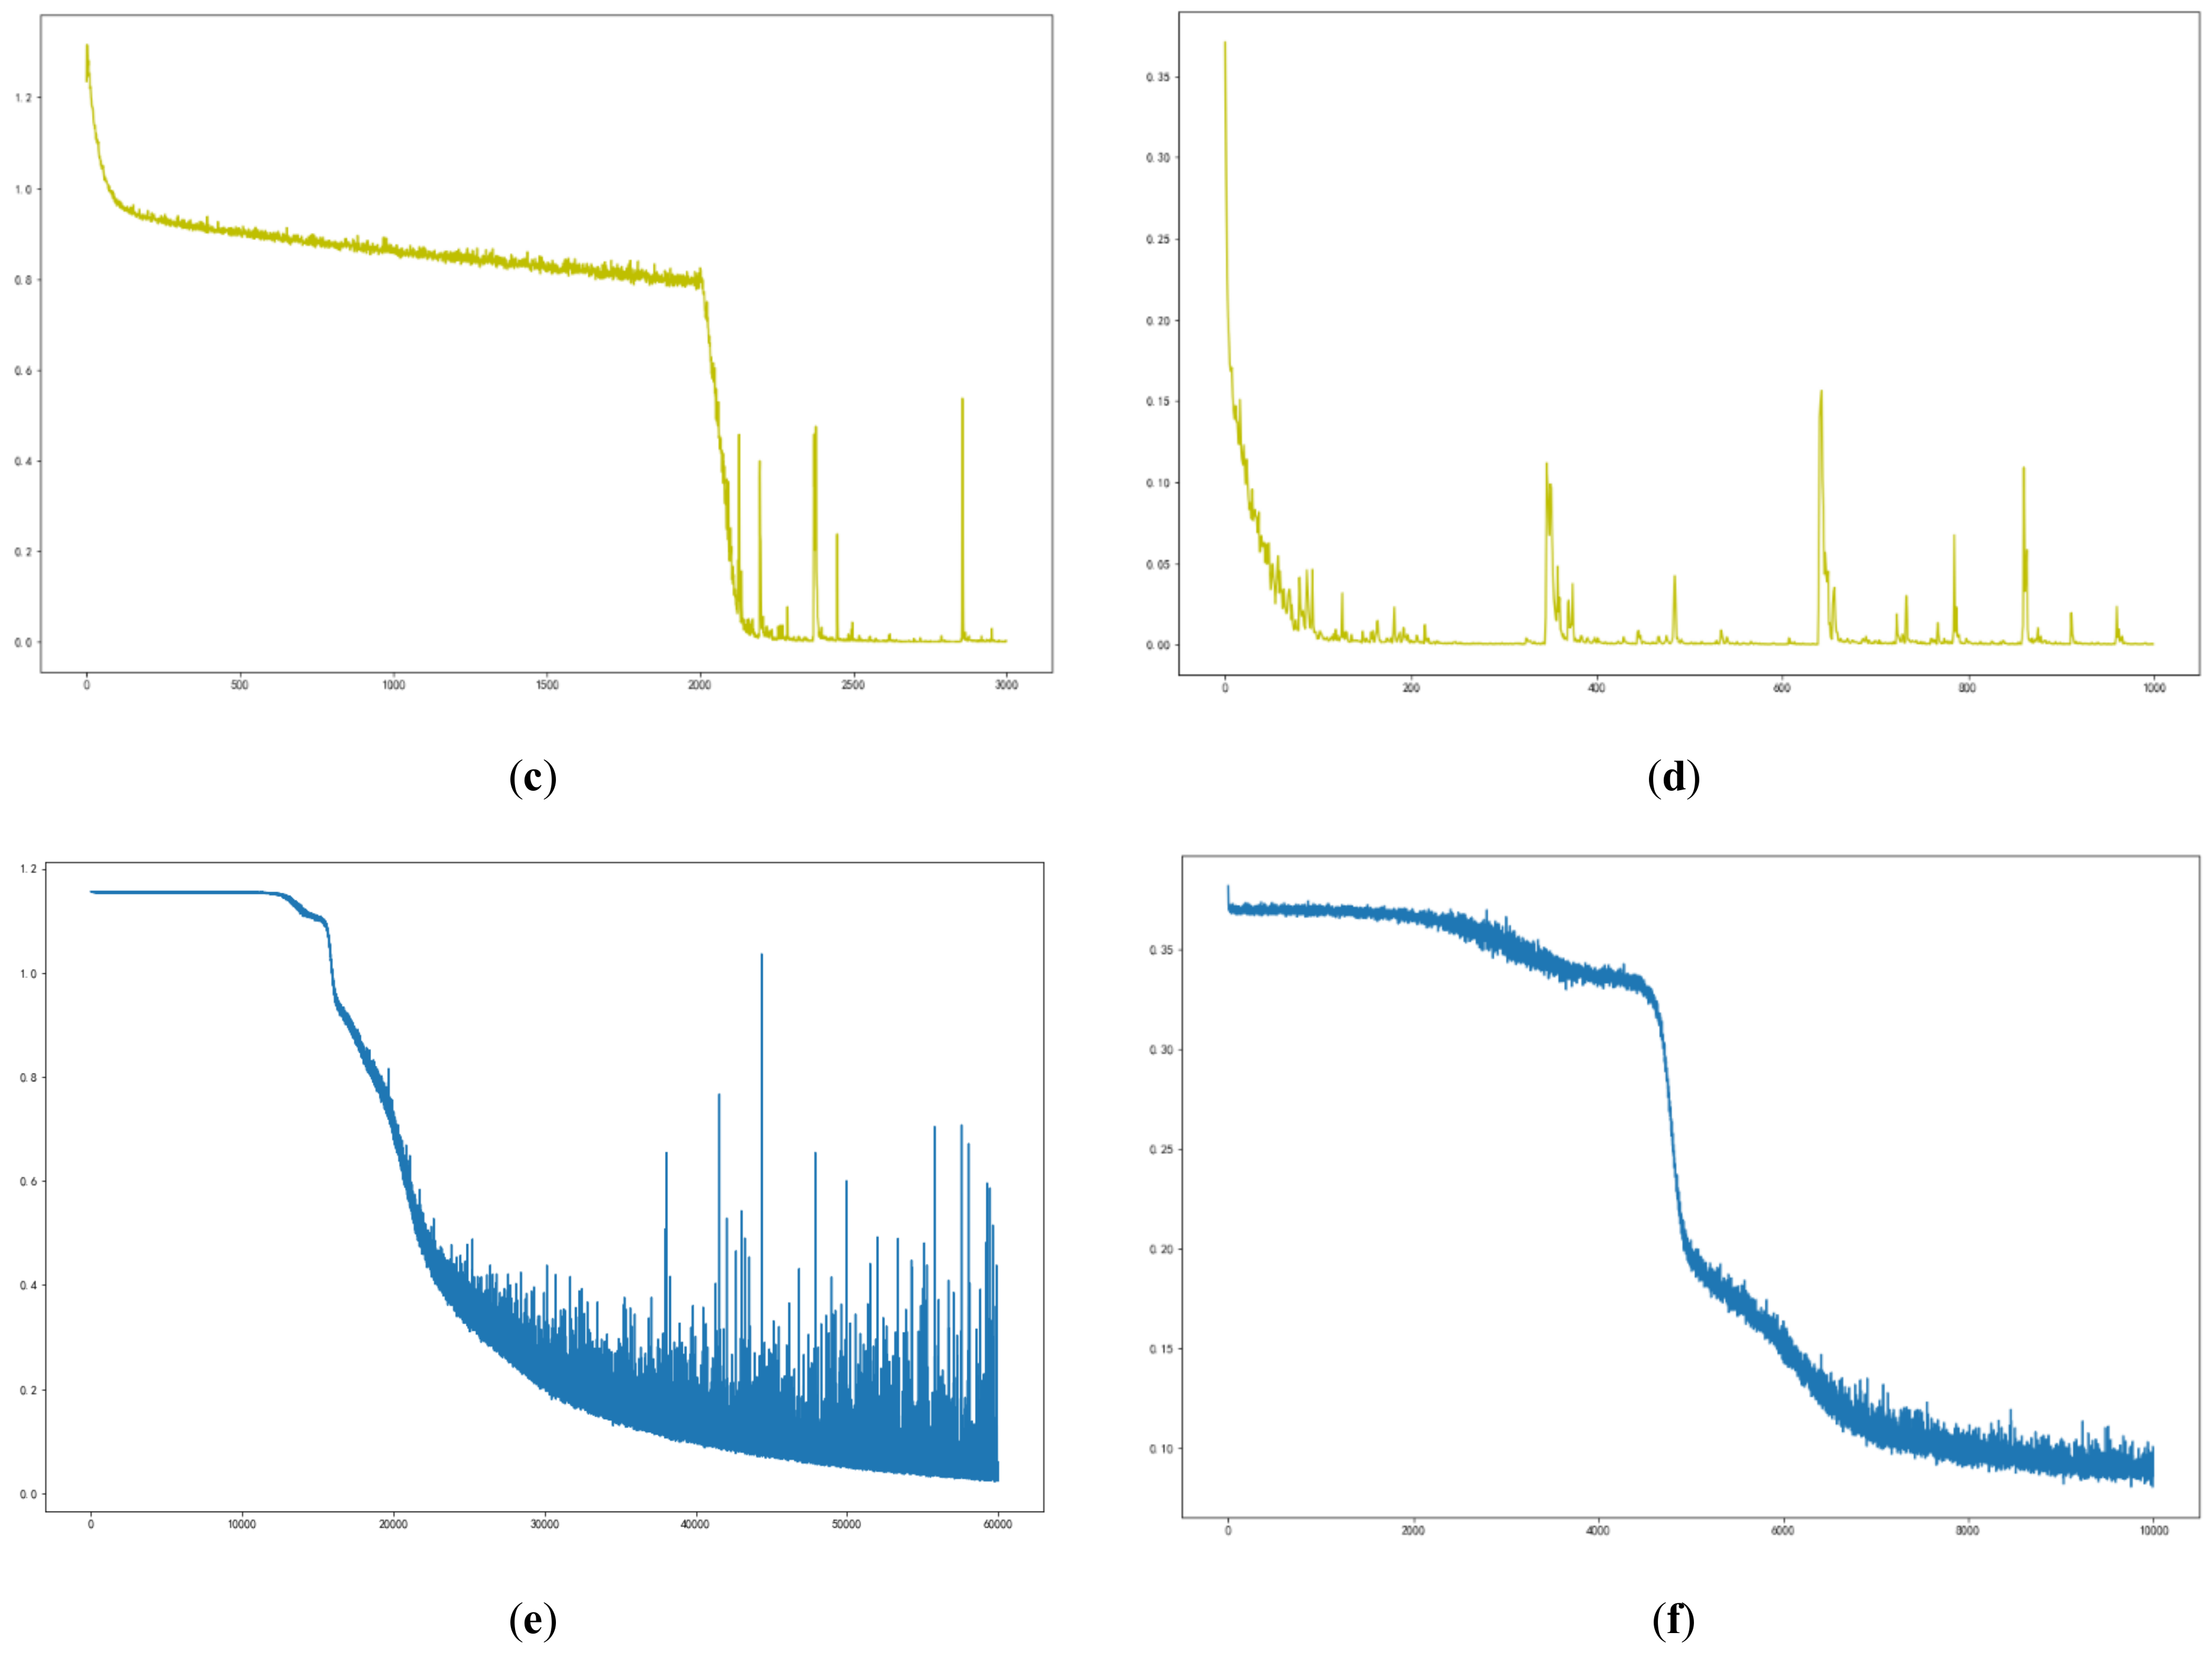
The objective function of the WideResnet40_2, Densenet121, and LSTM models was set to cross-entropy loss, and the optimizer was set as SWA based on SGD. The signals measured by time reversal were input into the neural network with a learning rate of 0.001. During the training process, the loss function value changed as the epoch of iterations increased, as shown in Figure 8.
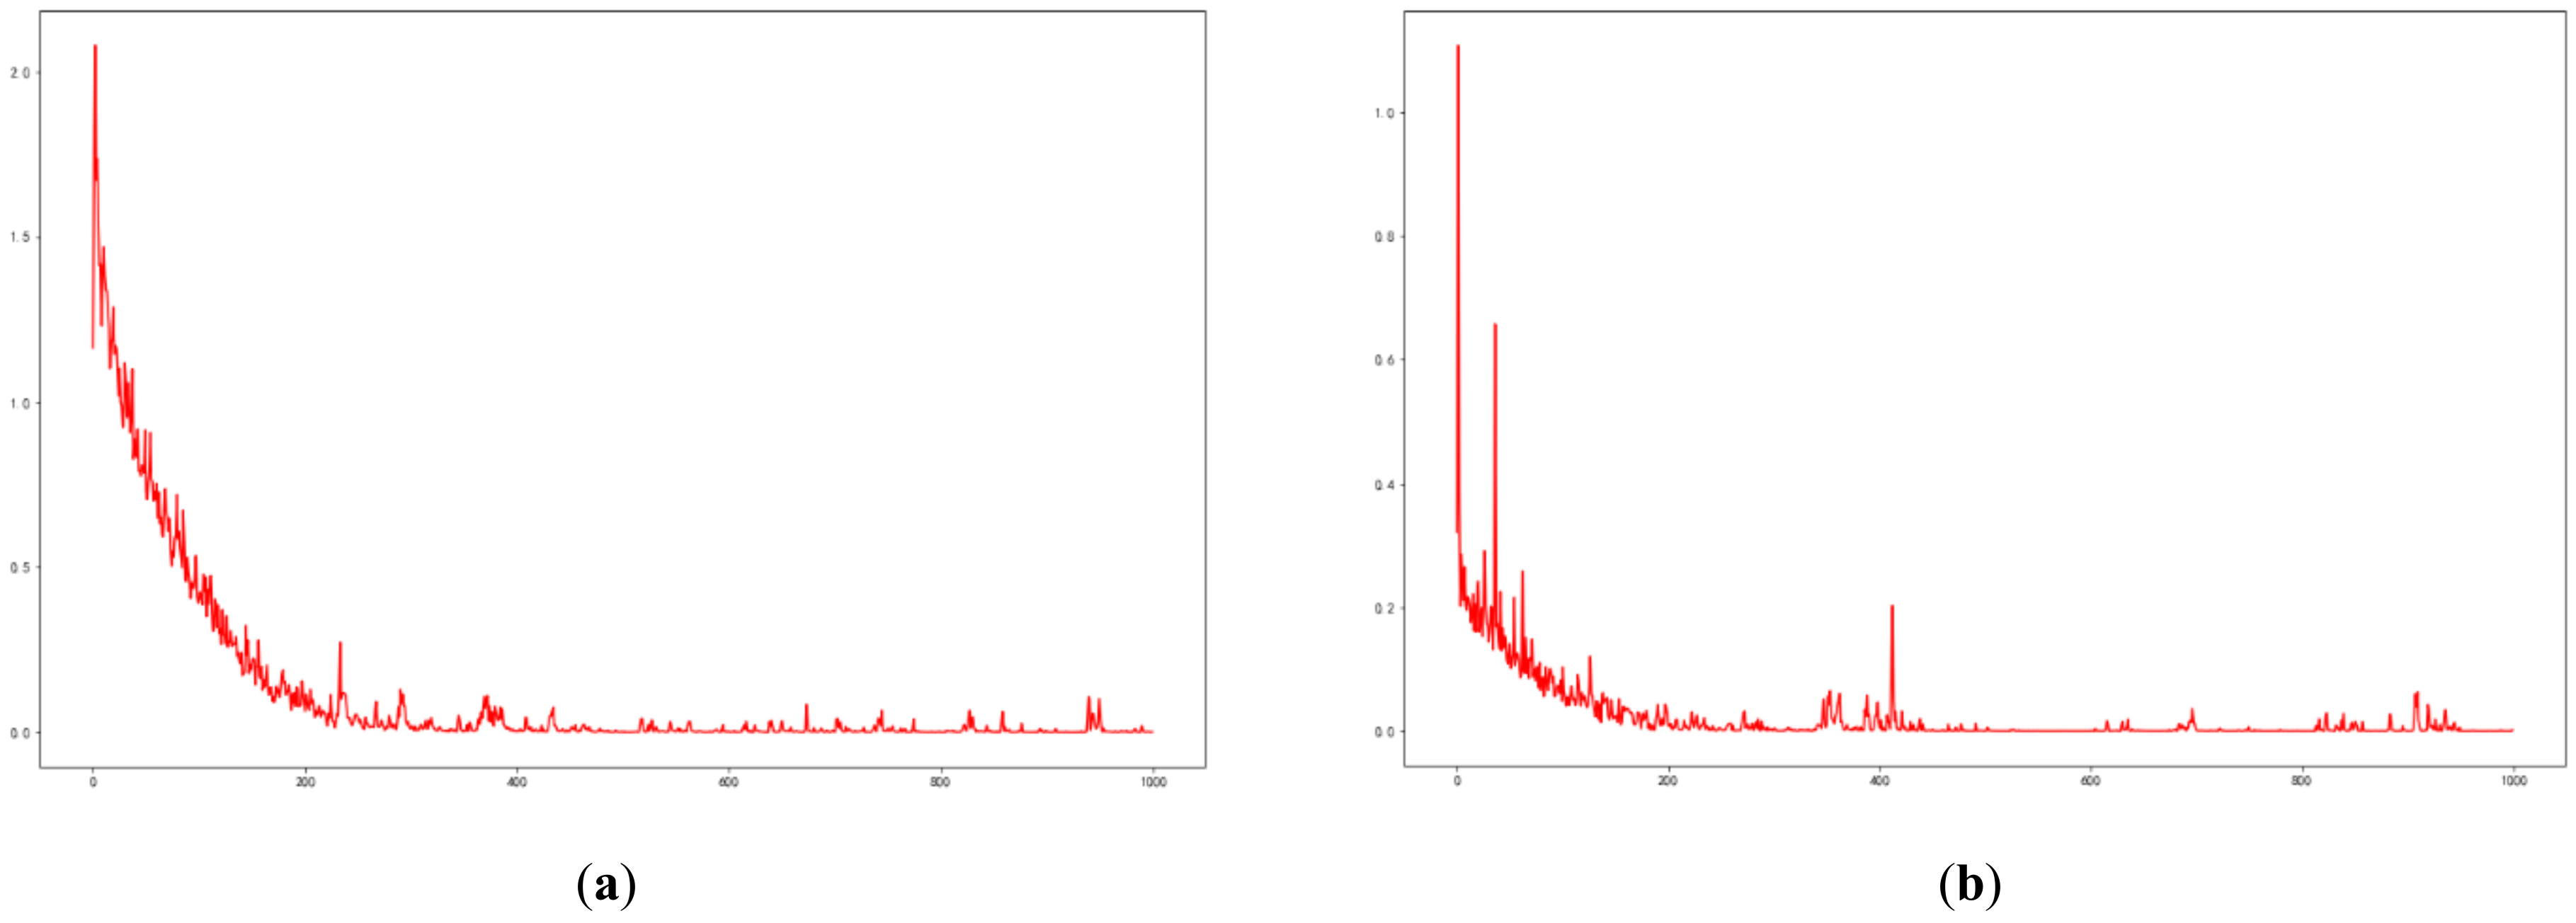
The signals measured directly were also input into the neural network with the same hyper-parameters. The loss function value changed as the number of iterations increased during the training process, as shown in Figure 9.
4. Discussion
In this study, the signal transmission in bolted connections of the wood structure was classified with the recurrent neural network LSTM, one-dimensional WideResnet40_2, one-dimensional Densenet121, XGBOOST tree classification model, LightGBM, and the SAX-VSM algorithm. Among these methods, the recurrent neural network LSTM performed the best. The signal classification accuracy under eight preload conditions was 83%, and the judging accuracy of connection looseness reached 97%. Additionally, the WideResnet40_2 and LightGBM models had good effects on classification, demonstrating that deep-learning models and tree-classification models perform well with one-dimensional data. WideResnet40_2 extracted 1024 eigenvalues from 1 × 1000 time sequence signals, and these eigenvalues were obtained through a series of residual blocks by nonlinear dimensionality reduction. Although the data volume obtained was greater than the data volume input directly, the extracted features did not have time correlations, and some of the eigenvalues would eventually have a weight of 0 in the full connection layer. The result of the SAX-VSM model was not ideal, possibly because the mean dimension reduction might have eliminated the useful information in the collected ultrasonic signals.
The prediction accuracy of the signals collected with the time-reversal method was generally higher than that of the signals collected directly. Therefore, it was obvious that the time-reversal method did play a signal strengthening effect and improved the signal resolution to a certain extent.
The deep-learning model usually led to computing cost problems. Significant amounts of resources and time are required to build deep-learning classification models with many parameters, which considerably slows down classification. By contrast, the tree classification model was relatively small, making the classification speed faster. However, the accuracy might have been lower than that of the deep-learning model.
Using the method proposed in this paper, the residual preload of the bolt can be detected by using the ultrasonic signal of PZT through the established network model, so as to realize the on-line monitoring of the reliability of the bolt connection of wood structures. In future work, this method will continue to be used to predict the reliability of bolted connection structures of different tree species plates under different working environments, and it can even be used to establish regression models to predict some mechanical properties of wood plates.
Author Contributions
Conceptualization, Y.Y. and Y.L.; methodology, J.C.; software, Z.Z.; validation, Z.Z., J.C., Z.W. and Y.Y.; formal analysis, Z.Z.; investigation, Z.Z.; resources, Y.Y.; data curation, Z.Z.; writing—original draft preparation, Z.Z.; writing—review and editing, Y.Y. and Y.L. visualization, Z.Z.; supervision, Y.L.; project administration, Y.L.; funding acquisition, Y.Y. All authors have read and agreed to the published version of the manuscript.
Funding
This research was funded by the 2015 Research Innovation Plan for Graduate Students of Ordinary Higher Education Institutions in Jiangsu Province (Project Title: the Detection and Evaluation of Wood Packaging Materials Applied on Large-scale and heavy Electromechanical Products): KYZZ15_0251 and the 2014 Innovation Foundation of the Excellent Doctorial Dissertations of Nanjing Forestry University (Project Title: The Non-destructive Evaluation of Wood-based Materials for Packaging the Mechanical and Electrical Products).
Institutional Review Board Statement
Not applicable.
Informed Consent Statement
Not applicable.
Data Availability Statement
The data is not publicly available because this study has not been finished.
Acknowledgments
In addition to the funds we received, we would also like to thank Xu Wang and Zhaochun Li for the experiment equipment and Xiaoli Wu for instruction.
Conflicts of Interest
The authors declare no conflict of interest.
References
- Amer, M.; Kabouchi, B.; Rahouti, M.; Famiri, A.; Fidah, A.; El Alami, S. Mechanical Properties of Clonal Eucalyptus Wood. Int. J. Thermophys. 2021, 42, 1–15. [Google Scholar] [CrossRef]
- Wu, G.F.; Sun, J.C.; Huang, C.J.; Ren, H.Q.; Zhao, R.J. Research progress on mechanical properties of tenon-mortise joints in traditional Chinese wood structures. J. For. Eng. 2020, 5, 29–37. [Google Scholar]
- Murphy, C.; Pantelides, C.P.; Blomgren, H.-E.; Rammer, D. Development of Timber Buckling Restrained Brace for Mass Timber-Braced Frames. J. Struct. Eng. 2021, 147, 04021050. [Google Scholar] [CrossRef]
- Huang, Y.P.; Yang, Y.T.; Sun, Y.; Zhou, H.Y.; Chen, K.J. Identification of Apple Varieties Using a Multichannel Hyperspectral Imaging System. Sensors 2020, 20, 11. [Google Scholar] [CrossRef] [PubMed]
- Bouhamed, N.; Souissi, S.; Marechal, P.; Ben Amar, M.; Lenoir, O.; Leger, R.; Bergeret, A. Ultrasound evaluation of the mechanical properties as an investigation tool for the wood-polymer composites including olive wood flour. Mech. Mater. 2020, 148, 11. [Google Scholar] [CrossRef]
- De Melo, R.R.; Barbosa, K.T.; Beltrame, R.; Acosta, A.P.; Pimenta, A.S.; Mascarenhas, A.R.P. Ultrasound to determine physical-mechanical properties of Eucalyptus camaldulensis wood. Wood Mater. Sci. Eng. 2020, 1–7. [Google Scholar] [CrossRef]
- Fathi, H.; Kazemirad, S.; Nasir, V. A nondestructive guided wave propagation method for the characterization of moisture-dependent viscoelastic properties of wood materials. Mater. Struct. 2020, 53, 1–14. [Google Scholar] [CrossRef]
- Wang, G.-G.; Zhang, X.; Gao, Z.-Z.; Wang, Y.-L.; Yu, C.; Wang, Z. Dynamic testing and analysis of Poisson’s ratio constants of timber. In Mechanics and Architectural Design, Proceedings of 2016 International Conference, Suzhou, China, 14–15 May 2016; pp. 9–18. Available online: https://www.worldscientific.com/doi/abs/10.1142/9789813149021_0002 (accessed on 21 May 2021).
- Fathi, H.; Kazemirad, S.; Nasir, V. Lamb wave propagation method for nondestructive characterization of the elastic properties of wood. Appl. Acoust. 2021, 171, 9. [Google Scholar] [CrossRef]
- Fathi, H.; Nasir, V.; Kazemirad, S. Prediction of the mechanical properties of wood using guided wave propagation and machine learning. Constr. Build. Mater. 2020, 262, 12. [Google Scholar] [CrossRef]
- Domingos, F.C.; Maia, J.M.; Maia, O.M.A.; Schneider, F.K. Microcontroller based Control System for Ultrasound NDT in Wood. Phys. Procedia 2015, 70, 428–432. [Google Scholar] [CrossRef] [Green Version]
- Ornelas Cavalcanti, N.M.; Goncalves, R.; Brazolin, S.; Bertoldo, C.; Ruy, M. Ultrasound Test for Root Wood Elastomechanical Characterization. Bioresources 2018, 13, 5818–5835. [Google Scholar]
- Jia, S.F.; Liu, J.Y.; Lin, X.X.; Sun, W.H.; Duo, X.; Cao, H.M.; Wang, W.B. Sound absorption performance of bionic perforated wood structure fiberboard. J. For. Eng. 2021, 6, 38–43. [Google Scholar]
- Huo, L.S.; Wang, F.R.; Li, H.N.; Song, G.B. A fractal contact theory based model for bolted connection looseness monitoring using piezoceramic transducers. Smart Mater. Struct. 2017, 26, 9. [Google Scholar] [CrossRef]
- Palma, S.S.A.; Goncalves, R.; Trinca, A.J.; Costa, C.P.; Reis, M.N.; Martins, G.A. Interference from Knots, Wave Propagation Direction, and Effect of Juvenile and Reaction Wood on Velocities in Ultrasound Tomography. Bioresources 2018, 13, 2834–2845. [Google Scholar] [CrossRef]
- Barmpoutis, P.; Barboutis, I.; Lefakis, P. Detection of various characteristics on wooden surfaces, using scanner and image processing techniques. In Proceedings of the 27th International Conference on Wood Modification and Tehnology, Zagreb, Croatia, 13–14 October 2016; pp. 7–13. [Google Scholar]
- Liu, Y.Y.; Wang, Y.X.; Zhang, Y.M.; Chen, M.H.; Nie, X.Z. Force-displacement relations of bolted timber joints with slotted-in steel plates parallel to the grain. J. Wood Sci. 2020, 66, 13. [Google Scholar] [CrossRef]
- Kovryga, A.; Sarnaghi, A.K.; van de Kuilen, J.W.G. Strength grading of hardwoods using transversal ultrasound. Eur. J. Wood Wood Prod. 2020, 78, 951–960. [Google Scholar] [CrossRef]
- Moshtaghin, A.F.; Franke, S.; Keller, T.; Vassilopoulos, A.P. Experimental investigation of mesoscale variability of clear spruce mechanical properties in the radial direction. Constr. Build. Mater. 2021, 270, 14. [Google Scholar]
- Sotomayor Castellanos, J.R.; Villasenor Aguilar, J.M. Material properties and acoustic performance indexes of twenty-two Mexican woods. Measurement by ultrasound. Madera Bosques 2018, 24, e2431132. [Google Scholar]
- Kim, K.H.; Jung, S.H. Automatic Composition using Time Series Embedding of RNN Auto-Encoder. J. Korea Multimed. Soc. 2018, 21, 849–857. [Google Scholar]
- Yu, Y.; Si, X.S.; Hu, C.H.; Zhang, J.X. A Review of Recurrent Neural Networks: LSTM Cells and Network Architectures. Neural. Comput. 2019, 31, 1235–1270. [Google Scholar] [CrossRef]
- Yu, W.; Li, X.; Gonzalez, J. In Fast Training of Deep LSTM Networks, Cham, 2019; Springer: Berlin/Heidelberg, Germany, 2019; pp. 3–10. [Google Scholar]
- Dey, R.; Salem, F.M. Gate-Variants of Gated Recurrent Unit (GRU) Neural Networks. In Proceedings of the 2017 IEEE 60th International Midwest Symposium on Circuits and Systems, Boston, MA, USA, 6–9 August 2017; IEEE: New York, NY, USA, 2017; pp. 1597–1600. [Google Scholar]
- Huang, L.; Li, Z.; Xie, F.; Feng, K. Novel Time Series Modeling Methods for Gyro Random Noise Used in Internet of Things. IEEE Access 2018, 6, 47911–47921. [Google Scholar] [CrossRef]
- Ye, C.W.; Yu, Z.W.; Kang, R.; Yousaf, K.; Qi, C.; Chen, K.J.; Huang, Y.P. An experimental study of stunned state detection for broiler chickens using an improved convolution neural network algorithm. Comput. Electron. Agric. 2020, 170, 9. [Google Scholar] [CrossRef]
- Ni, C.; Wang, D.Y.; Tao, Y. Variable weighted convolutional neural network for the nitrogen content quantization of Masson pine seedling leaves with near-infrared spectroscopy. Spectroc. Acta Part A Molec. Biomolec. Spectr. 2019, 209, 32–39. [Google Scholar] [CrossRef] [PubMed]
- Lin, L.; Yuan, H.; Guo, L.; Kuang, Y.; Zhang, K. Optimization Method of Residual Networks of Residual Networks for Image Classification. In International Conference on Intelligent Computing; Huang, D.S., Gromiha, M.M., Han, K., Hussain, A., Eds.; Springer: Berlin/Heidelberg, Germany, 2018; Volume 10956, pp. 212–222. [Google Scholar]
- Zhong, X.; Gong, O.B.; Huang, W.X.; Li, L.; Xia, H.X. Squeeze-and-Excitation Wide Residual Networks in Image Classification. In Proceedings of the 2019 IEEE International Conference on Image Processing, Taipei, Taiwan, 22–25 September 2019; IEEE: New York, NY, USA, 2019; pp. 395–399. [Google Scholar]
- Zhang, K.; Guo, Y.R.; Wang, X.S.; Yuan, J.S.; Ding, Q.L. Multiple Feature Reweight DenseNet for Image Classification. IEEE Access 2019, 7, 9872–9880. [Google Scholar] [CrossRef]
- Chen, B.L.; Zhao, T.S.; Liu, J.H.; Lin, L.Q. Multipath feature recalibration DenseNet for image classification. Int. J. Mach. Learn. Cybern. 2021, 12, 651–660. [Google Scholar] [CrossRef]
- Ouahabi, A.; Taleb-Ahmed, A. Deep learning for real-time semantic segmentation: Application in ultrasound imaging. Pattern Recognit. Lett. 2021, 144, 27–34. [Google Scholar] [CrossRef]
- Senin, P.; Malinchik, S. SAX-VSM: Interpretable Time Series Classification Using SAX and Vector Space Model. In Proceedings of the 2013 IEEE 13th International Conference on Data Mining, Dallas, TX, USA, 7–10 December 2013; Xiong, H., Karypis, G., Thuraisingham, B., Cook, D., Wu, X., Eds.; pp. 1175–1180. [Google Scholar]
- Hatami, N.; Gavet, Y.; Debayle, J. Classification of Time-Series Images Using Deep Convolutional Neural Networks. In Proceedings of the Tenth International Conference on Machine Vision, Vienna, Austria, 13–15 November 2017; Verikas, A., Radeva, P., Nikolaev, D., Zhou, J., Eds.; Spie-Int Soc Optical Engineering: Bellingham, WA, USA, 2018; Volume 10696. [Google Scholar]
- Su, W.; Wang, Z.F. Widening residual refine edge reserved neural network for semantic segmentation. Multimed. Tools Appl. 2019, 78, 18229–18247. [Google Scholar] [CrossRef]
Figure 1.
Experimental system.

Figure 3.
Structure of deep convolutional networks: (a) Resnet cell structure and (b) Densenet cell structure.
Figure 3.
Structure of deep convolutional networks: (a) Resnet cell structure and (b) Densenet cell structure.

Figure 4.
Structures of Resnet40 and Densenet121.

Figure 5.
Emission signal.

Figure 6.
Results of different types of processing on directly collected signals: (a) directly collected signals, (b) normalized signals, (c) filtered signals, and (d) filtered signals obtained from randomly selected experimental signals under each preload.
Figure 6.
Results of different types of processing on directly collected signals: (a) directly collected signals, (b) normalized signals, (c) filtered signals, and (d) filtered signals obtained from randomly selected experimental signals under each preload.


Figure 7.
Results of different processing methods on time-reversal signals: (a) directly collected signals, (b) normalized signals, (c) filtered signals, and (d) filtered signals obtained from randomly selected experimental signals under each preload.
Figure 7.
Results of different processing methods on time-reversal signals: (a) directly collected signals, (b) normalized signals, (c) filtered signals, and (d) filtered signals obtained from randomly selected experimental signals under each preload.

Figure 8.
Loss of time-reversal signal classification during neural network training: (a) WideResnet40_2 octonary classification, (b) WideResnet40_2 binary classification, (c) Densenet121 octonary classification, (d) Densenet121 binary classification, (e) LSTM octonary classification, and (f) LSTM binary classification.


Figure 9.
Loss of directly collected signal classification during neural network training: (a) WideResnet40_2 octonary classification, (b) WideResnet40_2 binary classification, (c) Densenet121 octonary classification, (d) Densenet121 binary classification, (e) LSTM octonary classification, and (f) LSTM binary classification.


Table 1.
Directly collected data distribution.
| Preload (N × m) | Experimental Amount |
|---|---|
| 0 | 56 |
| 2 | 58 |
| 3 | 53 |
| 4 | 53 |
| 5 | 57 |
| 6 | 63 |
| 7 | 58 |
| 8 | 59 |
Table 2.
Data distribution with the time-reversal method.
| Preload (N × m) | Experimental Amount |
|---|---|
| 0 | 58 |
| 2 | 58 |
| 3 | 57 |
| 4 | 55 |
| 5 | 57 |
| 6 | 63 |
| 7 | 58 |
| 8 | 60 |
Table 3.
Data set distribution.
| Training Set | Test Set | |
|---|---|---|
| Directly collected signals | 306 | 151 |
| Time-reversal signals | 312 | 154 |
Table 4.
Test results obtained using multiple models.
| Classification Models | Binary Classification | Octonary Classification | ||
|---|---|---|---|---|
| Original Signals | Time-Reversal Signals | Original Signals | Time-Reversal Signals | |
| LSTM | 92.0% | 97.0% | 78.0% | 83.0% |
| WideResnet40_2 | 93.0% | 95.0% | 58.3% | 80.0% |
| Densenet121 | 92.0% | 97.0% | 53.0% | 75.0% |
| XGBoost | 92.7% | 93.5% | 54.9% | 77.3% |
| lightGBM | 92.7% | 96.1% | 58.9% | 81.2% |
| SAX-VSM | 92.7% | 88.3% | 50.0% | 71.4% |
Publisher’s Note: MDPI stays neutral with regard to jurisdictional claims in published maps and institutional affiliations. |
© 2021 by the authors. Licensee MDPI, Basel, Switzerland. This article is an open access article distributed under the terms and conditions of the Creative Commons Attribution (CC BY) license (https://creativecommons.org/licenses/by/4.0/).
Share and Cite
MDPI and ACS Style
Zhuang, Z.; Yu, Y.; Liu, Y.; Chen, J.; Wang, Z. Ultrasonic Signal Transmission Performance in Bolted Connections of Wood Structures under Different Preloads. Forests 2021, 12, 652. https://0-doi-org.brum.beds.ac.uk/10.3390/f12060652
AMA Style
Zhuang Z, Yu Y, Liu Y, Chen J, Wang Z. Ultrasonic Signal Transmission Performance in Bolted Connections of Wood Structures under Different Preloads. Forests. 2021; 12(6):652. https://0-doi-org.brum.beds.ac.uk/10.3390/f12060652
Chicago/Turabian StyleZhuang, Zilong, Yabin Yu, Ying Liu, Jiawei Chen, and Zhengguang Wang. 2021. "Ultrasonic Signal Transmission Performance in Bolted Connections of Wood Structures under Different Preloads" Forests 12, no. 6: 652. https://0-doi-org.brum.beds.ac.uk/10.3390/f12060652
Note that from the first issue of 2016, this journal uses article numbers instead of page numbers. See further details here.