
Soil, Topography and Forest Structure Shape the Abundance, Richness and Composition of Fern Species in the Fragmented Tropical Landscape of Xishuangbanna, Yunnan, China

Abstract
:1. Introduction
- (1)
- Is fern abundance, richness and composition explained better by forest fragment size, topography, forest structure, or soil properties?
- (2)
- Is the composition of the fern communities in smaller forest fragments a subset of the communities found in larger fragments?
2. Methods
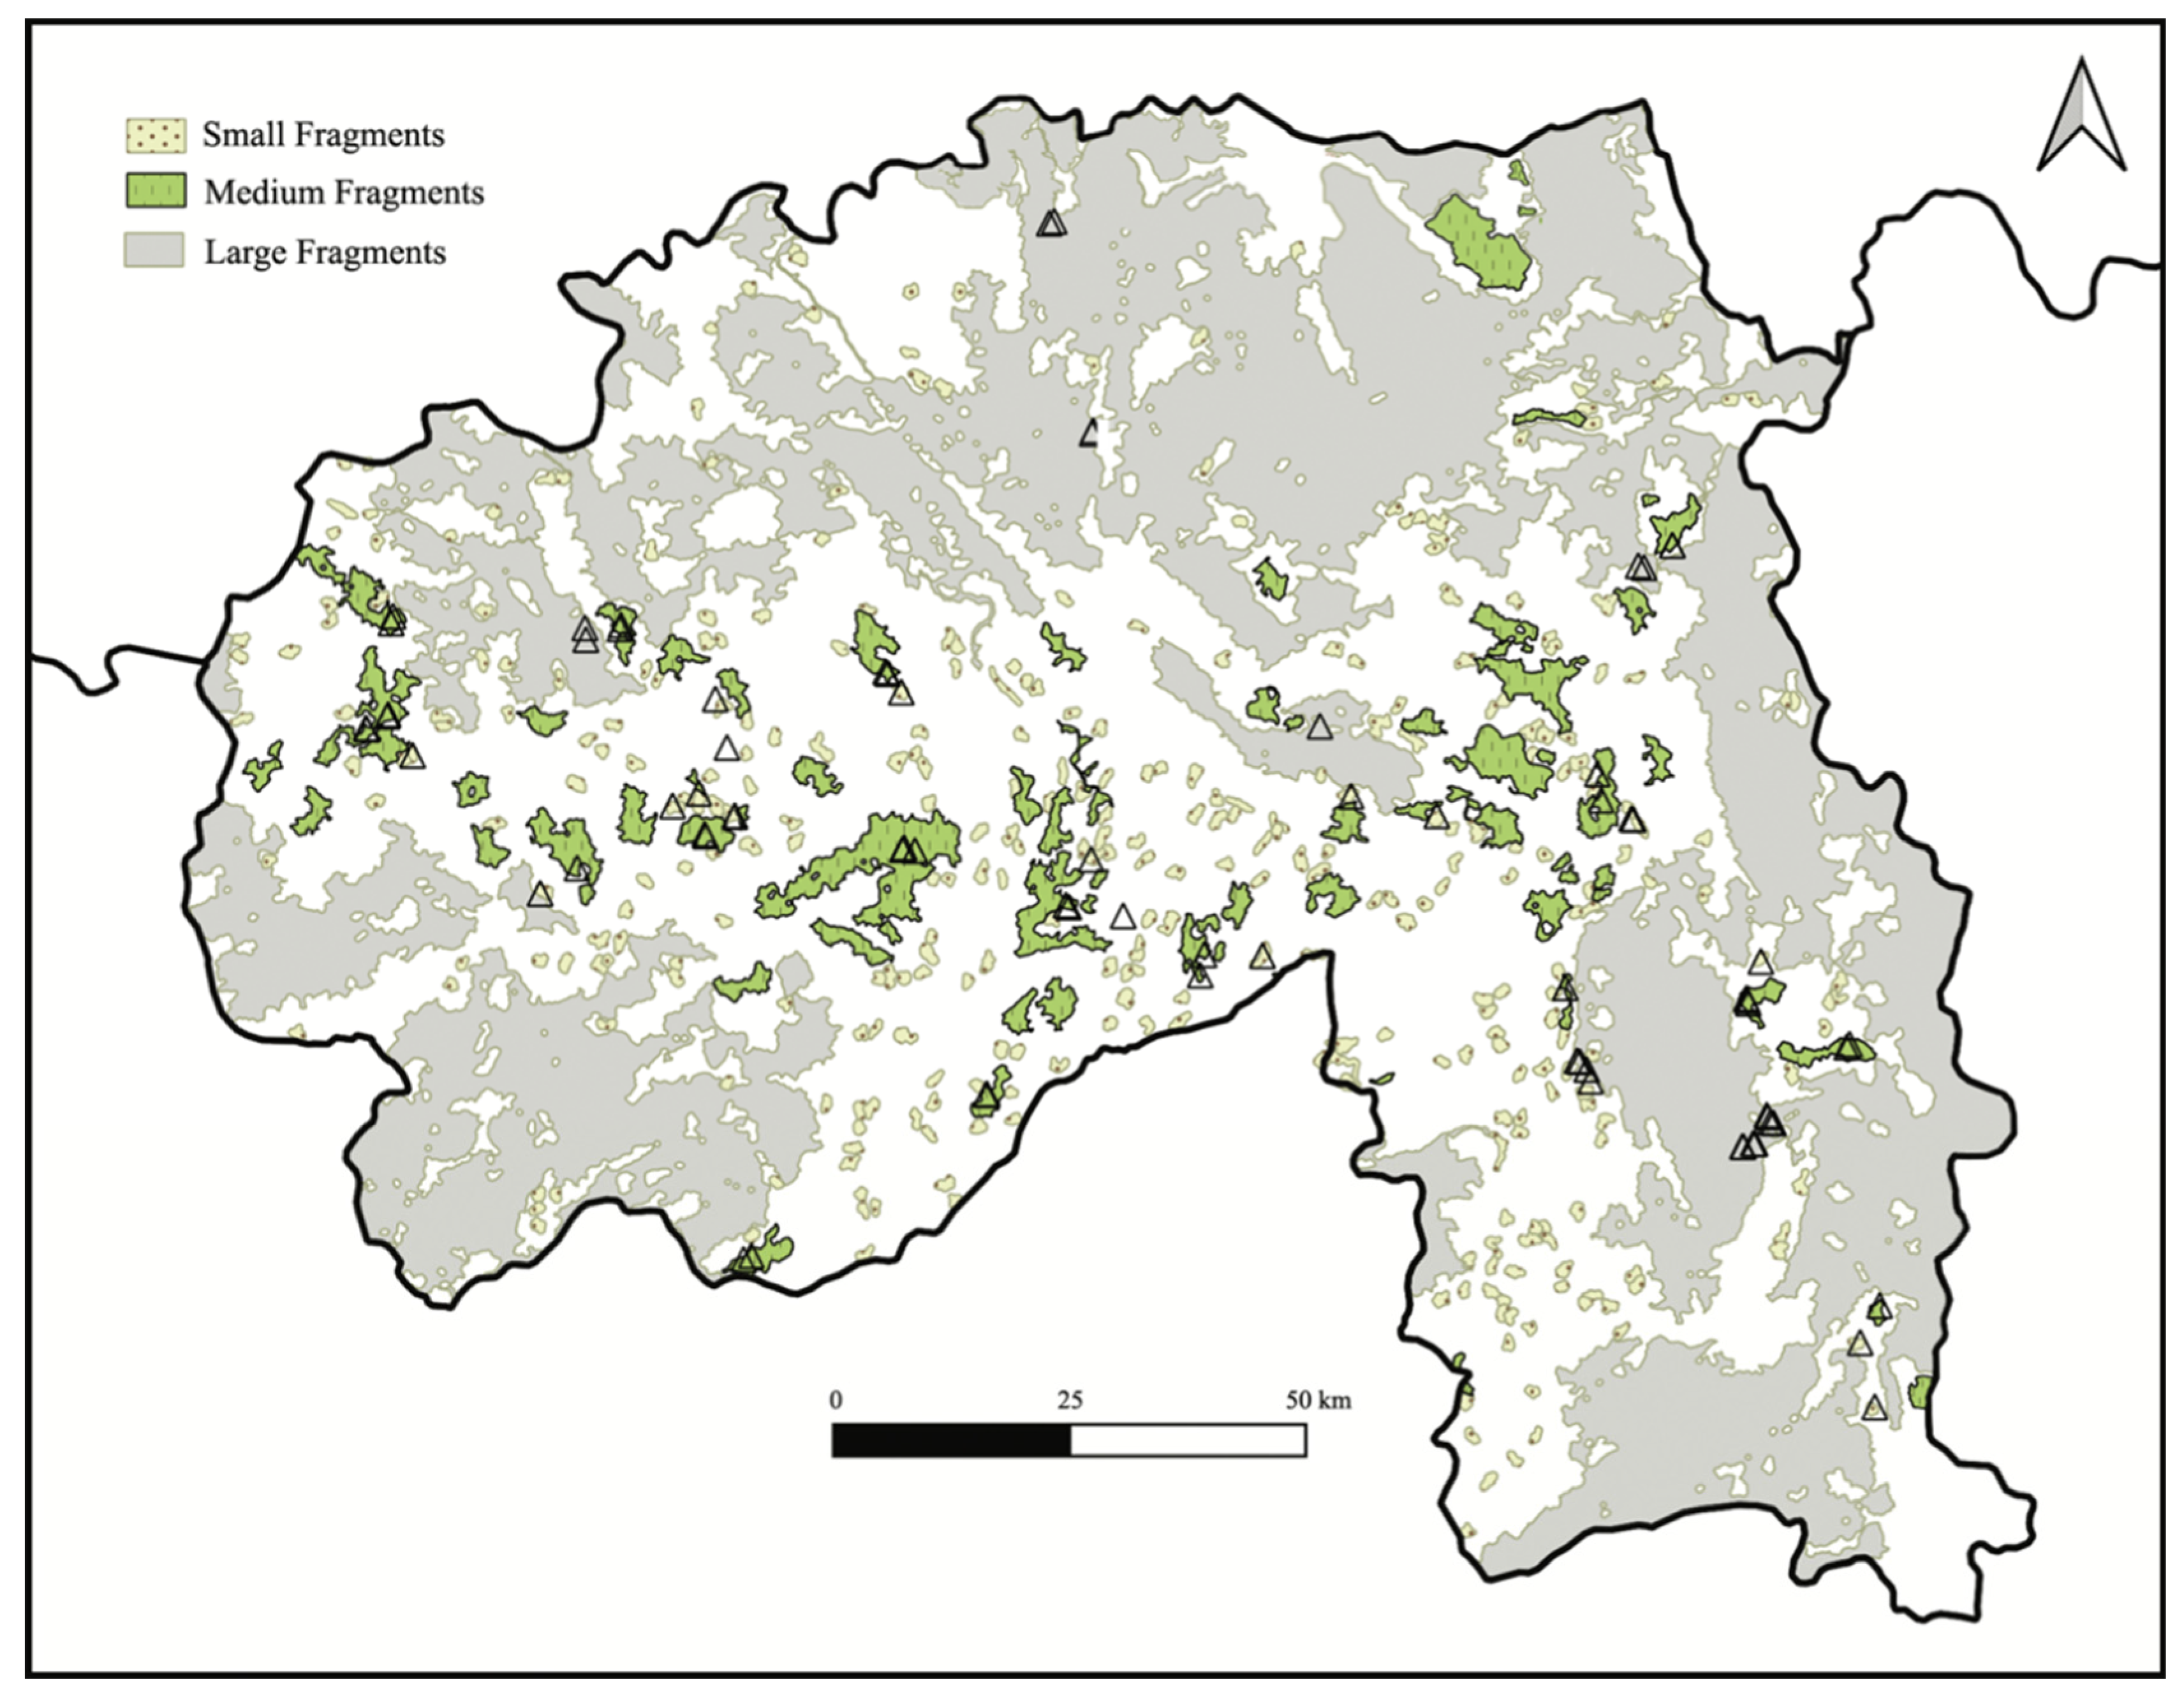
2.1. Study Area
2.2. Forest Map and Field Data Collection
2.3. Fragment Size, Topography, and Forest Structure
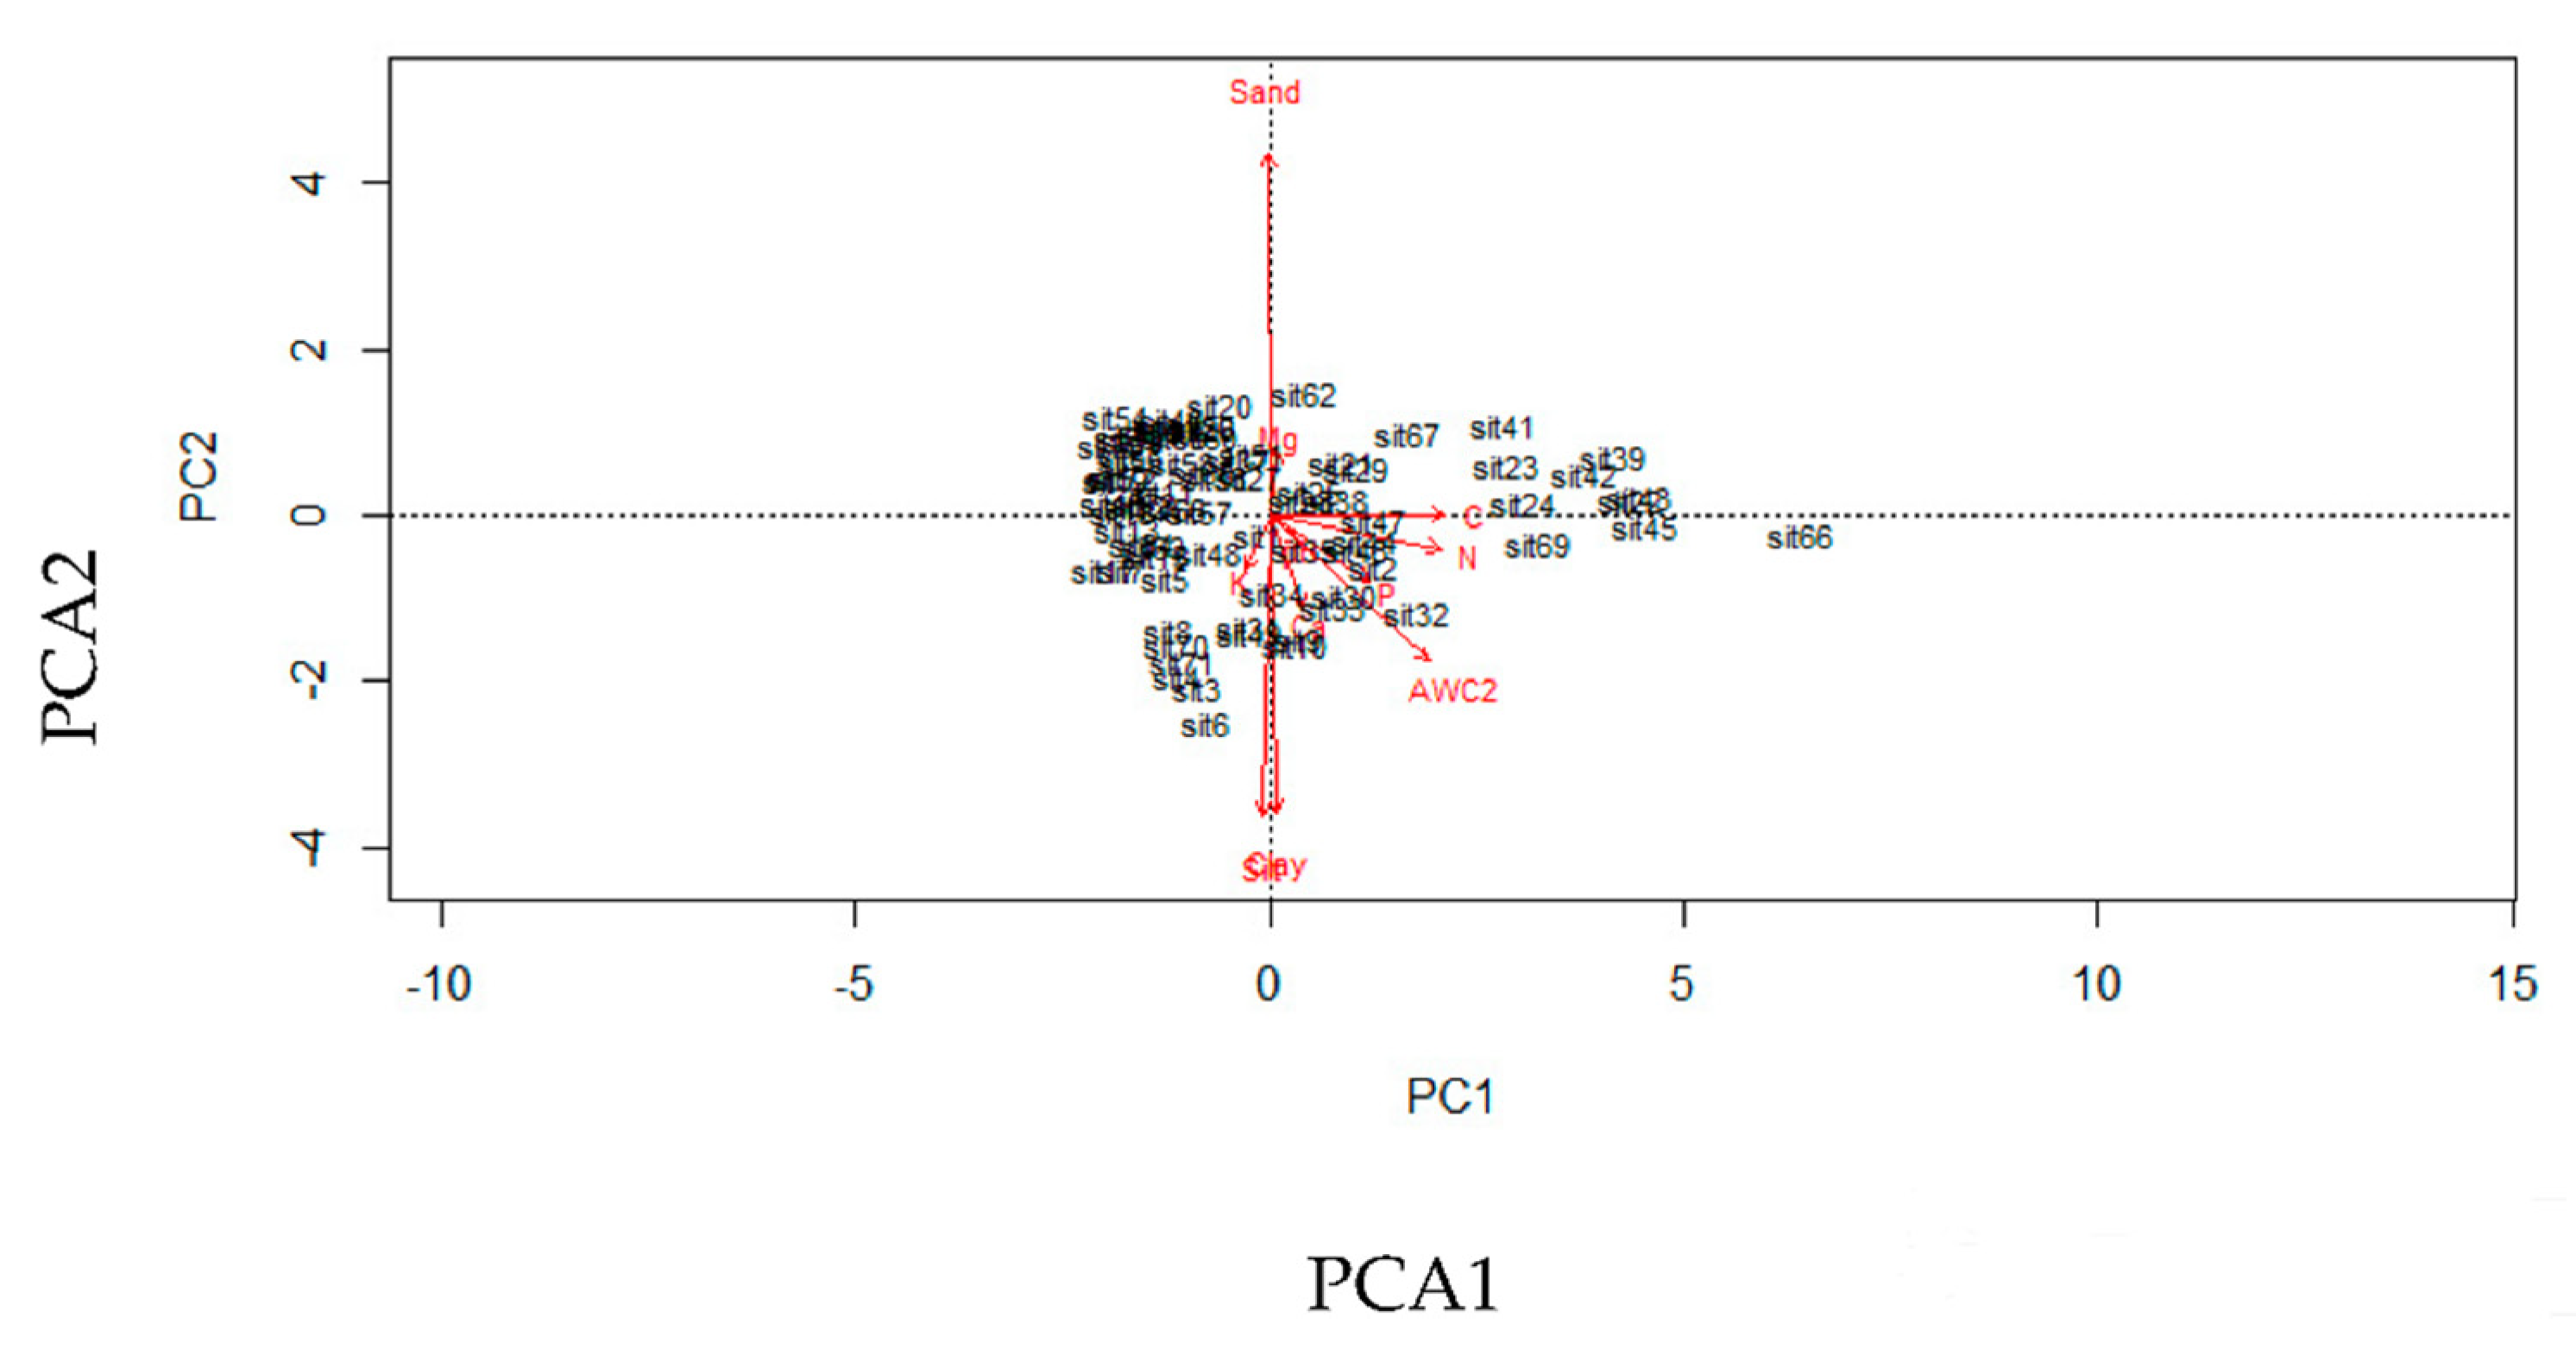
2.4. Soil Properties
2.5. Data Analysis
2.6. Determining Nestedness
3. Results
3.1. Fern Species among the Transects
3.2. Fern Abundance Richness and Composition
3.3. Species Nestedness
4. Discussion
4.1. Fern Species Abundance
4.2. Ferns Species Richness
4.3. Fern Species Composition
4.4. Soil, Topography, and Conservation
4.5. Determining Nestedness
5. Conclusions
Author Contributions
Funding
Institutional Review Board Statement
Informed Consent Statement
Data Availability Statement
Acknowledgments
Conflicts of Interest
Appendix A

| Large Fragments | Elevation m a.s.l. | Area (Km²) | Slope (Degrees) | Aspect (Degrees) | Canopy Cover | Basal Area (m²) | DBH > 10 cm | SoilPCA1 | SoilPCA2 | AWC | |
|---|---|---|---|---|---|---|---|---|---|---|---|
| 35 sites in 10 fragments | Min | 710 | 14 | 14 | 25 | 53 | 0.46 | 7 | −9.12 | −3.011 | 1.21 |
| Mean ± SE | 1234 ± 59 | 640 ± 139 | 27 ± 1 | 199 ± 15 | 74 ± 1 | 1.35 ± 0.10 | 22 ± 1 | −0.16 ± 0.28 | −0.11 ± 0.23 | 1.99 ± 0.10 | |
| Max | 2121 | 1824 | 39 | 357 | 100 | 2.74 | 41 | 1.04 | 5.96 | 3.70 | |
| Medium Fragments | Elevation m a.s.l. | Area (Km²) | Slope (degrees) | Aspect (degrees) | Canopy Cover | Basal Area (m²) | DBH > 10 cm | SoilPCA1 | SoilPCA2 | AWC | |
| 22 sites in 14 fragments | Min | 611 | 1.1 | 0 | 22 | 53 | 0.45 | 17 | −0.50 | −1.45 | 1.33 |
| Mean ± SE | 1225 ± 75 | 7.1 ± 0.7 | 26 ± 1.6 | 183 ± 19 | 76 ± 2 | 1.07 ± 0.10 | 24 ± 1 | 0.21 ± 0.05 | 0.02 ± 0.15 | 1.97 ± 0.09 | |
| Max | 1881 | 9.8 | 41 | 297 | 93 | 2.38 | 40 | 0.60 | 1.17 | 2.88 | |
| Small Fragments | Elevation m a.s.l. | Area (Km²) | Slope (degrees) | Aspect (degrees) | Canopy Cover | Basal Area (m²) | DBH > 10cm | SoilPCA1 | SoilPCA2 | AWC | |
| 18 sites in 18 fragments | Interval | 603 | 0.45 | 0 | 20 | 53 | 0.39 | 14 | −0.55 | −1.04 | 1.41 |
| Mean ± SE | 1149 ± 79 | 0.68 ± 0.03 | 24 ± 2 | 190 ± 24 | 70 ± 3 | 1.11 ± 0.11 | 24 ± 1 | 0.06 ± 0.07 | 0.23 ± 0.28 | 1.97 ± 0.11 | |
| Max | 1804 | 0.96 | 36 | 340 | 93 | 2.11 | 37 | 0.58 | 4.16 | 3.04 | |
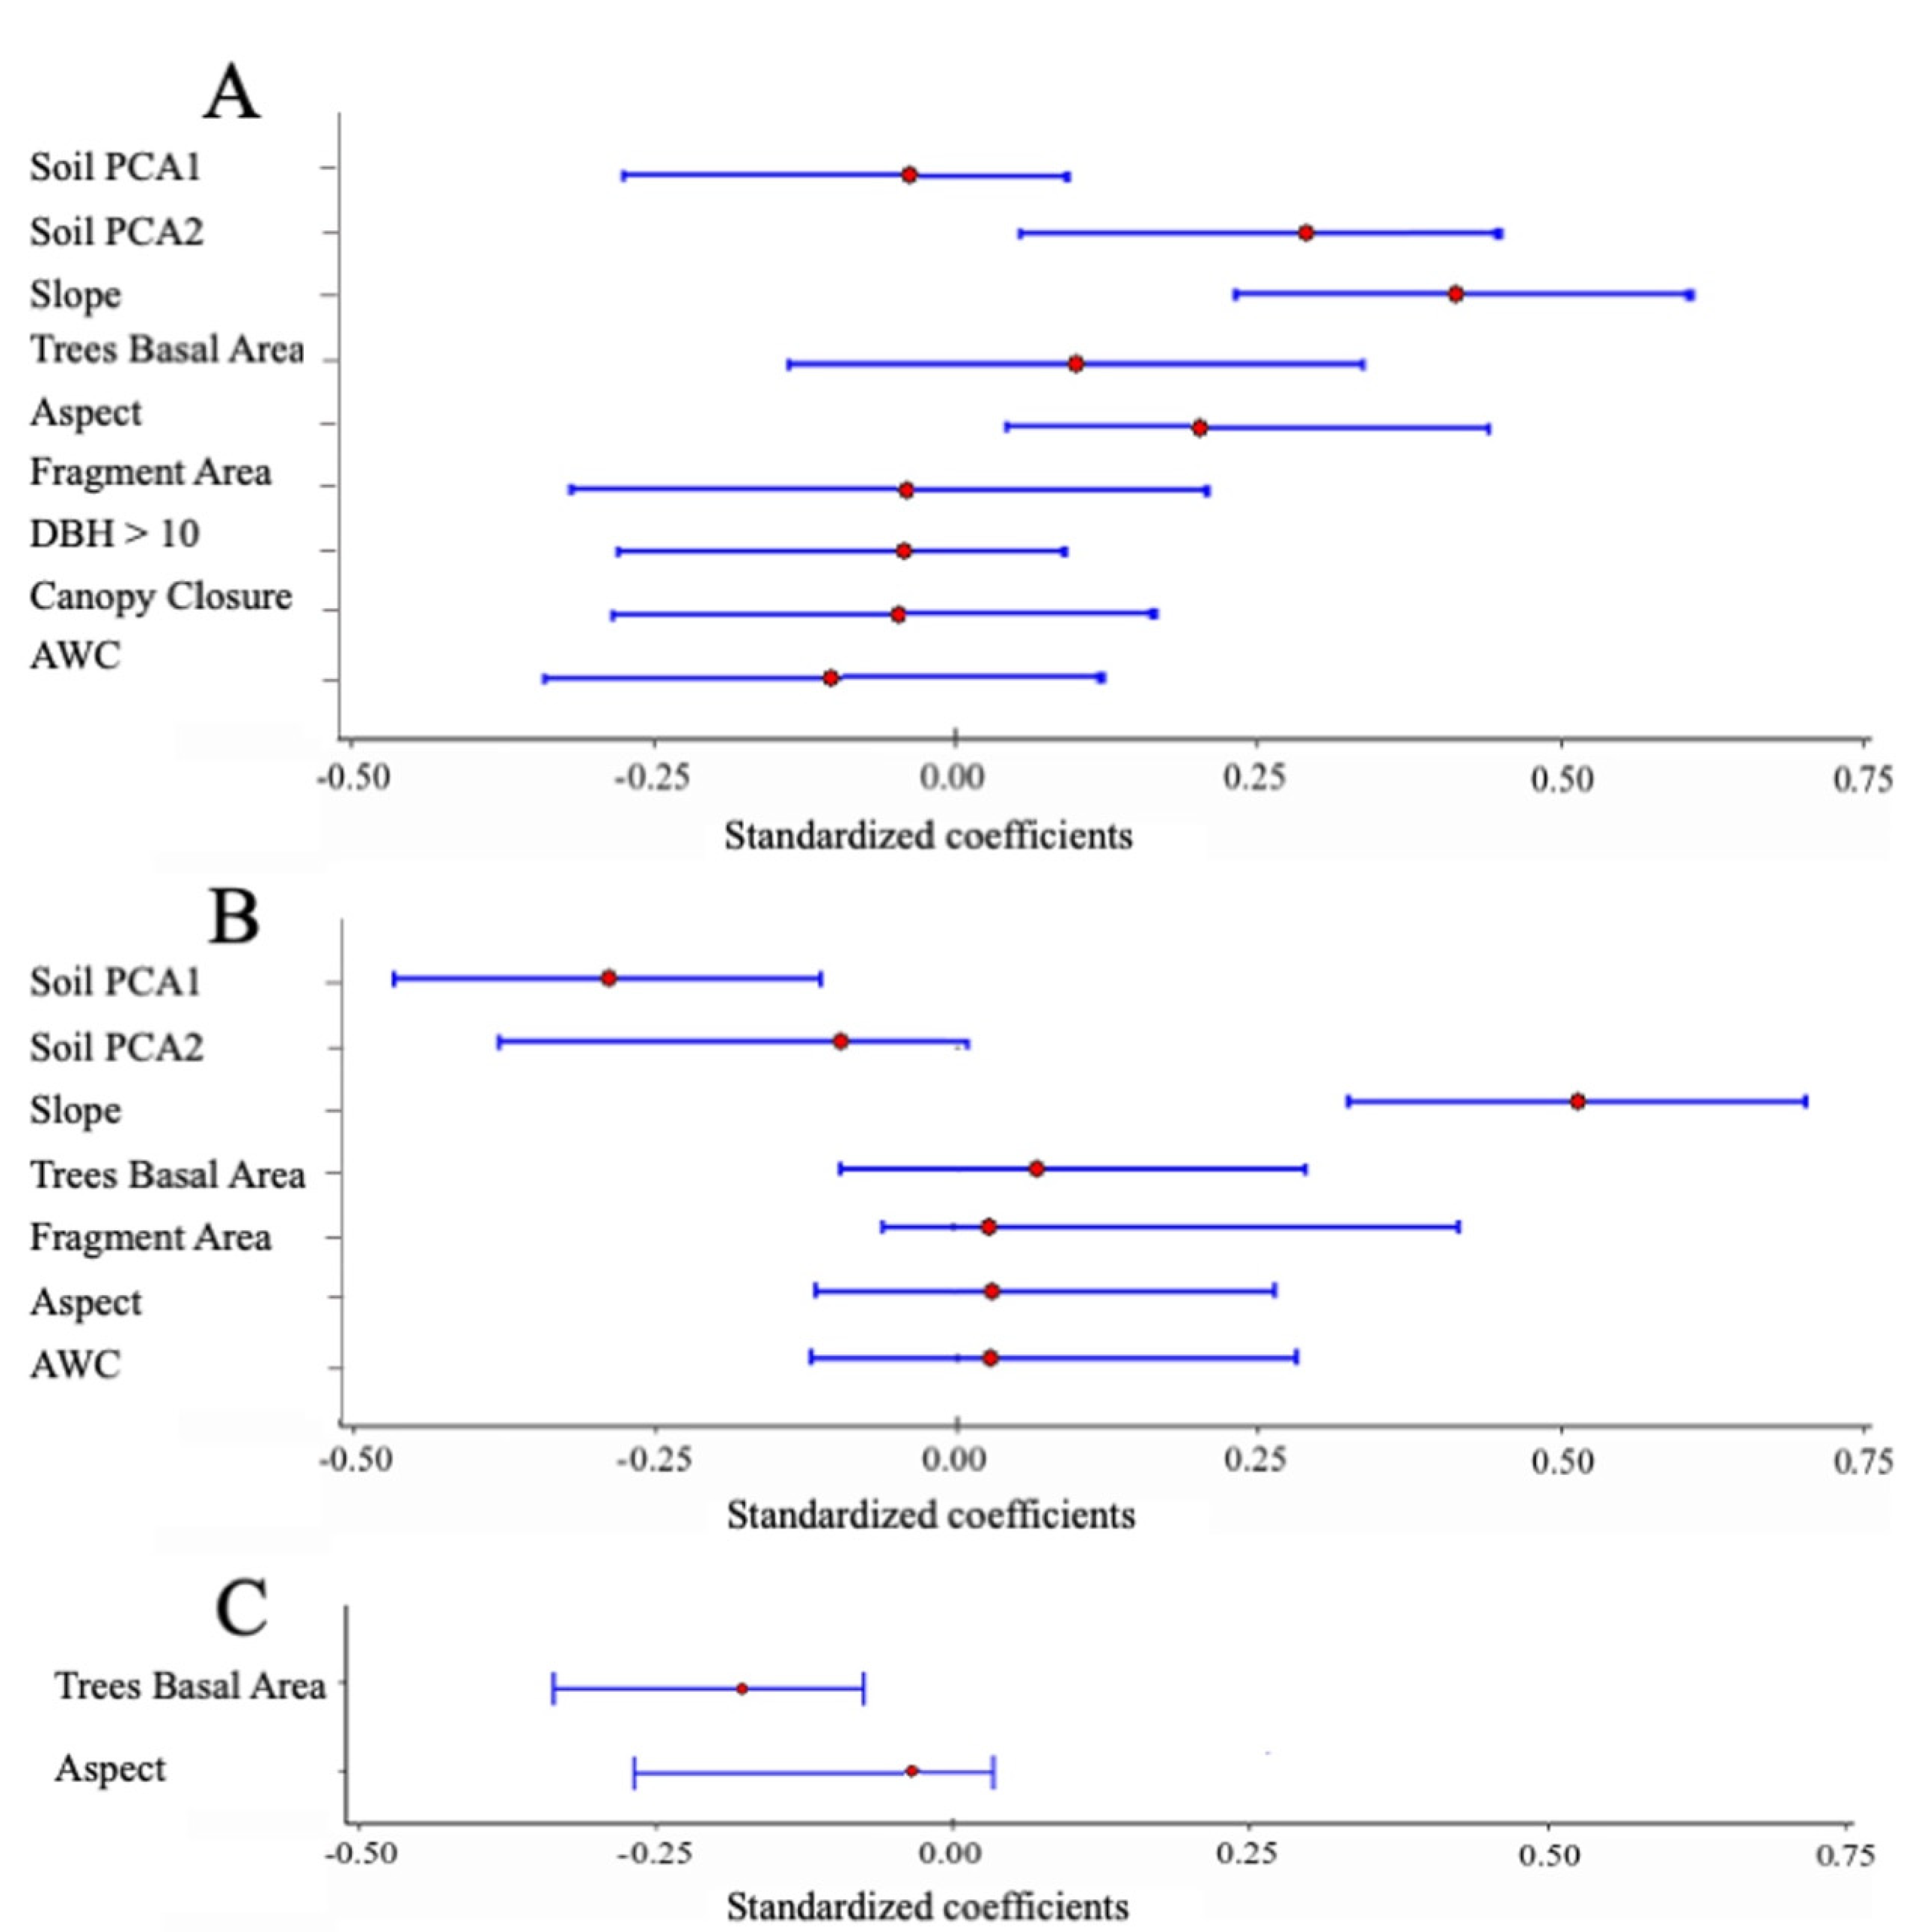
| Factor | Unstandardized Coefficient | Standardized Coefficient | Confidence Interval 2.5% | Confidence Interval 97.5% | Relative Importance | |
|---|---|---|---|---|---|---|
| Fern abundance | ||||||
| R2 marginal = 0.391; R2 conditional = 0.646; ΔAICc 3.66 | ||||||
| Fragment size | Fragment size | −0.297 | −0.033 | −0.312 | 0.164 | 0.45 |
| Topography | Slope | 1.214 | 0.366 | 0.181 | 0.5522 | 1.00 |
| Aspect | 14.168 | 0.244 | 0.066 | 0.421 | 1.00 | |
| Forest structure | DBH > 10 | −0.110 | −0.028 | −0.275 | 0.073 | 0.280 |
| Canopy closure | −0.283 | −0.033 | −0.277 | 0.121 | 0.420 | |
| Basal Area | 5.223 | 0.098 | −0.088 | 0.296 | 0.950 | |
| Soil properties | Soil PCA1 | −0.761 | −0.037 | −0.225 | 0.105 | 0.610 |
| Soil PCA2 | 5.577 | 0.269 | 0.073 | 0.465 | 1.00 | |
| AWC | −7.992 | −0.176 | −0.367 | 0.015 | 1.00 | |
| Fern species richness | ||||||
| R2 marginal = 0.416; R2 conditional = 0.612, ΔAICc 3.97 | ||||||
| Fragment size | Fragment size | 0.040 | 0.034 | −0.061 | 0.497 | 0.180 |
| Topography | Slope | 0.223 | 0.512 | 0.141 | 0.306 | 1.00 |
| Aspect | 0.225 | 0.030 | −0.877 | 2.021 | 0.390 | |
| Forest structure | Basal area | 0.292 | 0.042 | −0.677 | 2.031 | 0.43 |
| Soil properties | Soil PCA1 | −0.754 | −0.276 | −1.234 | −0.274 | 1.00 |
| Soil PCA2 | −0.266 | −0.098 | −1.034 | 0.021 | 0.530 | |
| AWC | 0.159 | 0.027 | −0.729 | 1.655 | 0.340 | |
| Fern species composition | ||||||
| R2 marginal = 0.111; R2 conditional = 0.935; ΔAICc 3.99 | ||||||
| Forest structure | Basal area | −0.166 | −0.191 | −0.275 | −0.073 | 0.84 |
| Topography | Aspect | −0.011 | −0.011 | −0.217 | 0.024 | 0.120 |
| GPS.Elev | Aspect | Slope | Canopy closure | DBH.10 | AWC | SoilPC1 | SoilPCA2 | LogBasArea | |
|---|---|---|---|---|---|---|---|---|---|
| GPS.Elev | 1 | ||||||||
| Aspect | 0.184 | 1 | |||||||
| Slope | 0.098 | 0.200 | 1 | ||||||
| Canopy closure | −0.363 | −0.039 | 0.075 | 1 | |||||
| DBH.10 | 0.086 | 0.119 | 0.032 | 0.011 | 1 | ||||
| AWC | 0.358 | 0.051 | −0.126 | −0.164 | −0.102 | 1 | |||
| SoilPCA1 | 0.349 | 0.237 | −0.042 | −0.208 | 0.024 | 0.196 | 1 | ||
| SoilPCA2 | −0.511 | −0.156 | −0.038 | 0.309 | 0.005 | −0.113 | 0.000 | 1 | |
| LogBasArea | −0.206 | −0.083 | 0.055 | 0.256 | 0.083 | −0.200 | −0.106 | −0.089 | 1 |
Appendix B. Development of the Forest Map

References
- Fahrig, L. Habitat Fragmentation: A Long and Tangled Tale. Glob. Ecol. Biogeogr. 2018, 28, 33–41. [Google Scholar] [CrossRef]
- Struebig, M.J.; Kingston, T.; Zubaid, A.; Mohd-Adnan, A.; Rossiter, S.J. Conservation Value of Forest Fragments to Palaeotropical Bats. Biol. Conserv. 2008, 141, 2112–2126. [Google Scholar] [CrossRef]
- Jones, M.M.; Ruokolainen, K.; Martinez, N.C.L.; Tuomisto, H. Differences in Topographic and Soil Habitat Specialization between Trees and Two Understorey Plant Groups in a Costa Rican Lowland Rain Forest. J. Trop. Ecol. 2016, 32, 482–497. [Google Scholar] [CrossRef]
- Condit, R.; Engelbrecht, B.M.J.; Pino, D.; Pérez, R.; Turner, B.L. Species Distributions in Response to Individual Soil Nutrients and Seasonal Drought across a Community of Tropical Trees. Proc. Natl. Acad. Sci. USA 2013, 110, 5064–5068. [Google Scholar] [CrossRef]
- Liu, J.; Yunhong, T.; Slik, J.W.F. Topography Related Habitat Associations of Tree Species Traits, Composition and Diversity in a Chinese Tropical Forest. For. Ecol. Manag. 2014, 330, 75–81. [Google Scholar] [CrossRef]
- Kou, W.; Dong, J.; Xiao, X.; Hernandez, A.J.; Qin, Y.; Zhang, G.; Chen, B.; Lu, N.; Doughty, R. Expansion Dynamics of Deciduous Rubber Plantations in Xishuangbanna, China during 2000–2010. GIsci. Remote Sens. 2018, 55, 905–925. [Google Scholar] [CrossRef]
- Liu, J.; Slik, J. Forest Fragment Spatial Distribution Matters for Tropical Tree Conservation. Biol. Conserv. 2014, 171, 99–106. [Google Scholar] [CrossRef]
- Jones, M.M.; Olivas Rojas, P.; Tuomisto, H.; Clark, D.B. Environmental and Neighbourhood Effects on Tree Fern Distributions in a Neotropical Lowland Rain Forest. J. Veg. Sci. 2007, 18, 13–24. [Google Scholar] [CrossRef]
- Jones, M.M.; Cicuzza, D.; van Straaten, O.; Veldkamp, E.; Kessler, M. Determinants of Fern and Angiosperm Herb Community Structure in Lower Montane Rainforest in Indonesia. J. Veg. Sci. 2014, 25, 1216–1224. [Google Scholar] [CrossRef]
- Kessler, M.; Kluge, J.; Hemp, A.; Ohlemüller, R. A Global Comparative Analysis of Elevational Species Richness Patterns of Ferns. Glob. Ecol. Biogeogr. 2011, 20, 868–880. [Google Scholar] [CrossRef]
- Ewers, R.M.; Banks-Leite, C. Fragmentation Impairs the Microclimate Buffering Effect of Tropical Forests. PLoS ONE 2013, 8, e58093. [Google Scholar] [CrossRef] [PubMed]
- Santo-Silva, E.E.; Almeida, W.R.; Tabarelli, M.; Peres, C.A. Habitat Fragmentation and the Future Structure of Tree Assemblages in a Fragmented Atlantic Forest Landscape. Plant Ecol. 2016, 217, 1129–1140. [Google Scholar] [CrossRef]
- Tan, Z.-H.; Zhang, Y.-P.; Song, Q.-H.; Liu, W.-J.; Deng, X.-B.; Tang, J.-W.; Deng, Y.; Zhou, W.-J.; Yang, L.-Y.; Yu, G.-R.; et al. Rubber Plantations Act as Water Pumps in Tropical China. Geophys. Res. Lett. 2011, 38, 1–3. [Google Scholar] [CrossRef]
- Briant, G.; Gond, V.; Laurance, S.G.W. Habitat Fragmentation and the Desiccation of Forest Canopies: A Case Study from Eastern Amazonia. Biol. Conserv. 2010, 143, 2763–2769. [Google Scholar] [CrossRef]
- Moulatlet, G.; Zuquim, G.; Tuomisto, H. The Role of Soils for Pteridophyte Distribution in Tropicalmerican Forests. Fern Gaz 2019, 21, 1–21. [Google Scholar]
- Metali, F.; Abu Salim, K.; Tennakoon, K.; Burslem, D.F.R.P. Controls on Foliar Nutrient and Aluminium Concentrations in a Tropical Tree Flora: Phylogeny, Soil Chemistry and Interactions among Elements. N. Phytol. 2015, 205, 280–292. [Google Scholar] [CrossRef]
- Phoutthavong, K.; Nakamura, A.; Cheng, X.; Cao, M. Differences in Pteridophyte Diversity between Limestone Forests and Non-Limestone Forests in the Monsoonal Tropics of Southwestern China. Plant Ecol. 2019, 220, 917–934. [Google Scholar] [CrossRef]
- Tuomisto, H.; Van doninck, J.; Ruokolainen, K.; Moulatlet, G.M.; Figueiredo, F.O.G.; Sirén, A.; Cárdenas, G.; Lehtonen, S.; Zuquim, G. Discovering Floristic and Geoecological Gradients across Amazonia. J. Biogeogr. 2019, 46, 1734–1748. [Google Scholar] [CrossRef]
- Patterson, B.D.; Atmar, W. Nested Subsets and.the Structure of Insular Mammalian Faunas and Archipelagos. Biol. J. Linn. Soc. 1986, 28, 65–82. [Google Scholar] [CrossRef]
- Hu, G.; Feeley, K.J.; Wu, J.; Xu, G.; Yu, M. Determinants of Plant Species Richness and Patterns of Nestedness in Fragmented Landscapes: Evidence from Land-Bridge Islands. Landsc. Ecol. 2011, 26, 1405–1417. [Google Scholar] [CrossRef]
- Wang, Y.; Bao, Y.; Yu, M.; Xu, G.; Ding, P. Nestedness for Different Reasons: The Distributions of Birds, Lizards and Small Mammals on Islands of an Inundated Lake. Divers. Distrib. 2010, 16, 862–873. [Google Scholar] [CrossRef]
- Fleishman, E.; Betrus, C.J.; Blair, R.B.; Mac Nally, R.; Murphy, D.D. Nestedness Analysis and Conservation Planning: The Importance of Place, Environment, and Life History across Taxonomic Groups. Oecologia 2002, 133, 78–89. [Google Scholar] [CrossRef] [PubMed]
- Collins, C.D.; Banks-Leite, C.; Brudvig, L.A.; Foster, B.L.; Cook, W.M.; Damschen, E.I.; Andrade, A.; Austin, M.; Camargo, J.L.; Driscoll, D.A.; et al. Fragmentation Affects Plant Community Composition over Time. Ecography 2017, 40, 119–130. [Google Scholar] [CrossRef]
- Hughes, A.C. Understanding the Drivers of Southeast Asian Biodiversity Loss. Ecosphere 2017, 8, e01624. [Google Scholar] [CrossRef]
- Chen, H.; Yi, Z.; Schmidt-vogt, D.; Ahrends, A. Pushing the Limits: The Pattern and Dynamics of Rubber Monoculture Expansion. PLoS ONE 2016, 11, e0150062. [Google Scholar] [CrossRef] [PubMed]
- Jin, Y.; Fan, H. Land Use/Land Cover Change and Its Impacts on Protected Areas in Mengla County, Xishuangbanna, Southwest China. Environ. Monit. Assess 2018, 190, 509. [Google Scholar] [CrossRef]
- Shu, H.; Sun, W.; Xu, G.; Zhan, R.; Chang, S. The Situation and Challenges of Pineapple Industry in China. Agric. Sci. 2019, 10, 683–688. [Google Scholar] [CrossRef]
- Dayananda, S.K.; Mammides, C.; Lee, M.B.; Liu, J.J.; Pasion, B.O.; Sreekar, R.; Yasuda, M.; Quan, R.C.; Slik, J.W.F.; Tomlinson, K.W.; et al. Topography and Soil Type Are Critical to Understanding How Bird and Herpetofaunal Communities Persist in Forest Fragments of Tropical China. Biol. Conserv. 2017, 215, 107–115. [Google Scholar] [CrossRef]
- Pasion, B.O.; Roeder, M.; Liu, J.; Yasuda, M.; Corlett, R.T.; Slik, J.W.F.; Tomlinson, K.W. Trees Represent Community Composition of Other Plant Life-Forms, but Not Their Diversity, Abundance or Responses to Fragmentation. Sci. Rep. 2018, 8, 11374. [Google Scholar] [CrossRef]
- Kreft, H.; Jetz, W. Global Patterns and Determinants of Vascular Plant Diversity. Proc. Natl. Acad. Sci. USA 2007, 104, 5925–5930. [Google Scholar] [CrossRef]
- PPGI. A Community-Derived Classification for Extant Lycophytes and Ferns. J. Syst. Evol. 2016, 54, 563–603. [Google Scholar] [CrossRef]
- Silva, V.L.; Mehltreter, K.; Schmitt, J.L. Ferns as Potential Ecological Indicators of Edge Effects in Two Types of Mexican Forests. Ecol. Indic. 2018, 93, 669–676. [Google Scholar] [CrossRef]
- Cao, M.; Zou, X.; Warren, M.; Zhu, H. Tropical Forests of Xishuangbanna, China. Biotropica 2006, 38, 306–309. [Google Scholar] [CrossRef]
- Hua, Z. Forest Vegetation of Xishuangbanna, South China. For. Stud. China. 2006, 8, 1–58. [Google Scholar] [CrossRef]
- Cicuzza, D.; Kessler, M.; Clough, Y.; Pitopang, R.; Leitner, D.; Tjitrosoedirdjo, S.S. Conservation Value of Cacao Agroforestry Systems for Terrestrial Herbaceous Species in Central Sulawesi, Indonesia. Biotropica 2011, 43, 755–762. [Google Scholar] [CrossRef]
- Hansen, M.C.; Wang, L.; Song, X.-P.; Tyukavina, A.; Turubanova, S.; Potapov, P.V.; Stehman, S.V. The Fate of Tropical Forest Fragments. Sci. Adv. 2020, 6, eaax8574. [Google Scholar] [CrossRef]
- Whitfeld, T.J.S.; Lasky, J.R.; Damas, K.; Sosanika, G.; Molem, K.; Montgomery, R.A. Species Richness, Forest Structure, and Functional Diversity During Succession in the New Guinea Lowlands. Biotropica 2014, 46, 538–548. [Google Scholar] [CrossRef]
- Koupai, J.A.; Eslamian, S.S.; Kazemi, J.A. Enhancing the Available Water Content in Unsaturated Soil Zone Using Hydrogel, to Improve Plant Growth Indices. Ecohydrol. Hydrobiol. 2008, 8, 67–75. [Google Scholar] [CrossRef]
- Oliveira-Filho, A.T.; Dexter, K.G.; Pennington, R.T.; Simon, M.F.; Bueno, M.L.; Neves, D.M. On the Floristic Identity of Amazonian Vegetation Types. Biotropica 2021, 53, 767–777. [Google Scholar] [CrossRef]
- Soria-Auza, R.W.; Kessler, M. The Influence of Sampling Intensity on the Perception of the Spatial Distribution of Tropical Diversity and Endemism: A Case Study of Ferns from Bolivia. Divers. Distrib. 2008, 14, 123–130. [Google Scholar] [CrossRef]
- Bates, D.; Mächler, M.; Bolker, B.M.; Walker, S.C. Fitting Linear Mixed-Effects Models Using Lme4. J. Stat. Softw. 2015, 67, 1–51. [Google Scholar] [CrossRef]
- Rodríguez-gironés, M.A.; Santamaría, L. A New Algorithm to Calculate the Nestedness Temperature of Presence-Absence Matrices. J. Biogeogr. 2006, 33, 924–935. [Google Scholar] [CrossRef]
- Grueber, C.E.; Nakagawa, S.; Laws, R.J.; Jamieson, I.G. Multimodel Inference in Ecology and Evolution: Challenges and Solutions. J. Evol. Biol. 2011, 24, 699–711. [Google Scholar] [CrossRef] [PubMed]
- Nakagawa, S.; Schielzeth, H. A General and Simple Method for Obtaining R2 from Generalized Linear Mixed-Effects Models. Methods Ecol. Evol. 2013, 4, 133–142. [Google Scholar] [CrossRef]
- Benedick, S.; Hill, J.K.; Mustaffa, N.; Chey, V.K.; Maryati, M.; Searle, J.B.; Schilthuizen, M.; Hamer, K.C. Impacts of Rain Forest Fragmentation on Butterflies in Northern Borneo: Species Richness, Turnover and the Value of Small Fragments. J. Appl. Ecol. 2006, 43, 967–977. [Google Scholar] [CrossRef]
- Lindo, Z.; Winchester, N.N.; Didham, R.K.; Lindo, Z.; Winchester, N.N. Nested Patterns of Community Assembly in the Colonisation of Artificial Canopy Habitats by Oribatid Mites. Oikos 2008, 117, 1856–1864. [Google Scholar] [CrossRef]
- Colwell, R.K.; Chao, A.; Gotelli, N.J.; Lin, S.Y.; Mao, C.X.; Chazdon, R.L.; Longino, J.T. Models and Estimators Linking Individual-Based and Sample-Based Rarefaction, Extrapolation and Comparison of Assemblages. J. Plant Ecol. 2012, 5, 3–21. [Google Scholar] [CrossRef]
- Oksanen, J. Multivariate Analysis of Ecological Communities in R: Vegan Tutorial; University of Oulu: Oulu, Finland, 2013. [Google Scholar]
- Cicuzza, D. Rare Pteridophytes Are Disproportionately Frequent in the Tropical Forest of Xishuangbanna, Yunnan, China. Acta Oecologica 2021, 110, 103717. [Google Scholar] [CrossRef]
- Jucker, T.; Bongalov, B.; Burslem, D.F.R.P.; Nilus, R.; Dalponte, M.; Lewis, S.L.; Phillips, O.L.; Qie, L.; Coomes, D.A. Topography Shapes the Structure, Composition and Function of Tropical Forest Landscapes. Ecol. Lett. 2018, 21, 989–1000. [Google Scholar] [CrossRef]
- Kessler, M.; Hofmann, S.; Krömer, T.; Cicuzza, D.; Kluge, J. The Impact of Sterile Populations on the Perception of Elevational Richness Patterns in Ferns. Ecography 2011, 34, 123–131. [Google Scholar] [CrossRef]
- Joly, C.A.; Metzger, J.P.; Tabarelli, M. Experiences from the Brazilian Atlantic Forest: Ecological Findings and Conservation Initiatives. New Phytologist 2014, 204, 459–473. [Google Scholar] [CrossRef] [PubMed] [Green Version]
- Pardini, R. Effects of Forest Fragmentation on Small Mammals in an Atlantic Forest Landscape. Biodivers. Conserv. 2004, 13, 2567–2586. [Google Scholar] [CrossRef]
- Hardely, A.S.; Frey, S.J.K.; Robinson, D.W.; Kress, J.W.; Betts, M.G. Tropical Forest Fragmentation Limits Pollination of a Keystone Understory Herb. Ecology 2014, 95, 2202–2212. [Google Scholar]
- Lôbo, D.; Leão, T.; Melo, F.P.L.; Santos, A.M.M.; Tabarelli, M. Forest Fragmentation Drives Atlantic Forest of Northeastern Brazil to Biotic Homogenization. Divers. Distrib. 2011, 17, 287–296. [Google Scholar] [CrossRef]
- Zuquim, G.; Costa, F.R.C.; Tuomisto, H.; Moulatlet, G.M.; Figueiredo, F.O.G. The Importance of Soils in Predicting the Future of Plant Habitat Suitability in a Tropical Forest. Plant Soil 2020, 450, 151–170. [Google Scholar] [CrossRef]
- Figueiredo, F.O.G.; Zuquim, G.; Tuomisto, H.; Moulatlet, G.M.; Balslev, H.; Costa, F.R.C. Beyond Climate Control on Species Range: The Importance of Soil Data to Predict Distribution of Amazonian Plant Species. J. Biogeogr. 2018, 45, 190–200. [Google Scholar] [CrossRef]
- Moeslund, J.E.; Arge, L.; Bøcher, P.K.; Dalgaard, T.; Svenning, J.C. Topography as a Driver of Local Terrestrial Vascular Plant Diversity Patterns. Nord. J. Bot. 2013, 31, 129–144. [Google Scholar] [CrossRef]
- Tang, J.; Lü, X.; Yin, J.; Qi, J. Diversity, Composition and Physical Structure of Tropical Forest over Limestone in Xishuangbanna, South-West China. J. Trop. For. Sci. 2011, 23, 425–433. [Google Scholar]
- Lü, X.; Yin, J.; Tang, J. Diversity and Composition of Understory Vegetation in the Tropical Seasonal Rain Forest of Xishuangbanna, SW China. Rev. Biol. Trop. 2011, 59, 455–463. [Google Scholar] [CrossRef]
- Ruokolainen, K.; Tuomisto, H.; Mac, M.J.; Higgins, M.A.; Yli-halla, M.; Al, E.T. Are Floristic and Edaphic Patterns in Amazonian Rain Forests Congruent for Trees, Pteridophytes and Melastomataceae? J. Trop. Ecol. 2007, 23, 13–25. [Google Scholar] [CrossRef]
- Zuquim, G.; Tuomisto, H.; Jones, M.M.; Prado, J.; Figueiredo, F.O.G.; Moulatlet, G.M.; Costa, F.R.C.; Quesada, C.A.; Emilio, T. Predicting Environmental Gradients with Fern Species Composition in Brazilian Amazonia. J. Veg. Sci. 2014, 25, 1195–1207. [Google Scholar] [CrossRef]
- Cai, L.; Zhang, G.; Xiang, J.; Dao, Z.; Sun, W. Rescuing Christensenia Aesculifolia (Marattiaceae), a Plant Species with an Extremely Small Population in China. Oryx 2019, 53, 436–438. [Google Scholar] [CrossRef]
- Liu, H.; Schneider, H.; Yu, Y.; Fuijwara, T.; Khine, P.K. Towards the Conservation of the Mesozoic Relict Fern Christensenia: A Fern Species with Extremely Small Populations in China. J. Plant Res. 2019, 132, 601–616. [Google Scholar] [CrossRef]
- Lopatin, J.; Dolos, K.; Hernández, H.J.; Galleguillos, M.; Fassnacht, F.E. Comparing Generalized Linear Models and Random Forest to Model Vascular Plant Species Richness Using LiDAR Data in a Natural Forest in Central Chile. Remote Sens. Environ. 2016, 173, 200–210. [Google Scholar] [CrossRef]
- Guerra, C.A.; Rosa, I.M.D.; Valentini, E.; Wolf, F.; Filipponi, F.; Karger, D.N.; Nguyen Xuan, A.; Mathieu, J.; Lavelle, P.; Eisenhauer, N. Global Vulnerability of Soil Ecosystems to Erosion. Landsc. Ecol. 2020, 35, 823–842. [Google Scholar] [CrossRef] [PubMed]
- Vijith, H.; Dodge-Wan, D. Spatio-Temporal Changes in Rate of Soil Loss and Erosion Vulnerability of Selected Region in the Tropical Forests of Borneo during Last Three Decades. Earth Sci. Inform. 2017, 11, 171–181. [Google Scholar] [CrossRef]
- Paustian, K.; Lehmann, J.; Ogle, S.; Reay, D.; Robertson, G.P.; Smith, P. Climate-Smart Soils. Nature 2016, 532, 49–57. [Google Scholar] [CrossRef]
- Wall, D.H.; Nielsen, U.N.; Six, J. Soil Biodiversity and Human Health. Nature 2015, 528, 69–76. [Google Scholar] [CrossRef]
- Mancino, G.; Nolè, A.; Ripullone, F.; Ferrara, A. Landsat TM Imagery and NDVI Differencing to Detect Vegetation Change: Assessing Natural Forest Expansion in Basilicata, Southern Italy. IForest 2014, 7, 75–84. [Google Scholar] [CrossRef]
- Li, Z.; Fox, J.M. Mapping Rubber Tree Growth in Mainland Southeast Asia Using Time-Series MODIS 250 m NDVI and Statistical Data. Appl. Geogr. 2012, 32, 420–432. [Google Scholar] [CrossRef]
- Dong, J.; Xiao, X.; Sheldon, S.; Biradar, C.; Duong, N.D.; Hazarika, M. A Comparison of Forest Cover Maps in Mainland Southeast Asia from Multiple Sources: PALSAR, MERIS, MODIS and FRA. Remote Sens. Environ. 2012, 127, 60–73. [Google Scholar] [CrossRef]
- Dong, J.; Xiao, X.; Sheldon, S.; Biradar, C.; Xie, G. Mapping Tropical Forests and Rubber Plantations in Complex Landscapes by Integrating PALSAR and MODIS Imagery. ISPRS J. Photogramm. Remote Sens. 2012, 74, 20–33. [Google Scholar] [CrossRef]


Publisher’s Note: MDPI stays neutral with regard to jurisdictional claims in published maps and institutional affiliations. |
© 2022 by the authors. Licensee MDPI, Basel, Switzerland. This article is an open access article distributed under the terms and conditions of the Creative Commons Attribution (CC BY) license (https://creativecommons.org/licenses/by/4.0/).
Share and Cite
Cicuzza, D.; Mammides, C. Soil, Topography and Forest Structure Shape the Abundance, Richness and Composition of Fern Species in the Fragmented Tropical Landscape of Xishuangbanna, Yunnan, China. Forests 2022, 13, 1453. https://0-doi-org.brum.beds.ac.uk/10.3390/f13091453
Cicuzza D, Mammides C. Soil, Topography and Forest Structure Shape the Abundance, Richness and Composition of Fern Species in the Fragmented Tropical Landscape of Xishuangbanna, Yunnan, China. Forests. 2022; 13(9):1453. https://0-doi-org.brum.beds.ac.uk/10.3390/f13091453
Chicago/Turabian StyleCicuzza, Daniele, and Christos Mammides. 2022. "Soil, Topography and Forest Structure Shape the Abundance, Richness and Composition of Fern Species in the Fragmented Tropical Landscape of Xishuangbanna, Yunnan, China" Forests 13, no. 9: 1453. https://0-doi-org.brum.beds.ac.uk/10.3390/f13091453