Next Article in Journal
Spatiotemporal Distribution and Genetic Characterization of Measles Strains Circulating in Greece during the 2017–2018 Outbreak
Next Article in Special Issue
Expression Pattern of the SARS-CoV-2 Entry Genes ACE2 and TMPRSS2 in the Respiratory Tract
Previous Article in Journal
Merkel Cell Polyomavirus Large T Antigen is Dispensable in G2 and M-Phase to Promote Proliferation of Merkel Cell Carcinoma Cells
Previous Article in Special Issue
Tracking SARS-CoV-2 in Sewage: Evidence of Changes in Virus Variant Predominance during COVID-19 Pandemic
 
 
viruses-logo
Article Menu

Article Menu

Article

Amplicon-Based Detection and Sequencing of SARS-CoV-2 in Nasopharyngeal Swabs from Patients With COVID-19 and Identification of Deletions in the Viral Genome That Encode Proteins Involved in Interferon Antagonism

by
Shona C. Moore
1,†,
Rebekah Penrice-Randal
1,†,
Muhannad Alruwaili
1,†,
Nadine Randle
1,†,
Stuart Armstrong
1,†,
Catherine Hartley
1,†,
Sam Haldenby
1,
Xiaofeng Dong
1,
Abdulrahman Alrezaihi
1,
Mai Almsaud
1,
Eleanor Bentley
1,
Jordan Clark
1,
Isabel García-Dorival
1,
Paul Gilmore
1,
Ximeng Han
1,
Benjamin Jones
1,
Lisa Luu
1,
Parul Sharma
1,
Ghada Shawli
1,
Yani Sun
1,2,
Qin Zhao
1,2,
Steven T. Pullan
3,
Daniel P. Carter
3,
Kevin Bewley
3,
Jake Dunning
3,4,
En-min Zhou
2,
Tom Solomon
1,4,5,
Michael Beadsworth
6,
James Cruise
6,
Derrick W. Crook
7,
David A. Matthews
8,
Andrew D. Davidson
8,
Zana Mahmood
1,9,
Waleed Aljabr
1,10,
Julian Druce
11,
Richard Vipond
3,4,
Lisa Ng
1,4,5,12,
Laurent Renia
12,
Peter J. M. Openshaw
13,
J. Kenneth Baillie
14,
Miles W. Carroll
3,4,7,
James Stewart
1,5,
Alistair Darby
1,5,
Malcolm Semple
1,4,5,
Lance Turtle
1,4,5,* and
Julian A. Hiscox
1,4,5,12,*
add Show full author list remove Hide full author list
1
Institute of Infection, Veterinary and Ecological Sciences, University of Liverpool, Liverpool L3 5RF, UK
2
College of Veterinary Medicine, Northwest A&F University, Yangling 712100, China
3
National Infection Service, Public Health England, Salisbury SP4 0JG, UK
4
Health Protection Research Unit in Emerging and Zoonotic Infections, Liverpool L69 7BE, UK
5
Liverpool Health Partners, Liverpool L3 5TF, UK
6
Tropical & Infectious Disease Unit, Liverpool University Hospitals NHS Foundation Trust (a member of Liverpool Health Partners), Liverpool L7 8XP, UK
7
Nuffield Department of Medicine, University of Oxford, Oxford OX3 7BN, UK
8
School of Cellular and Molecular Medicine, University of Bristol, Bristol BS8 1TD, UK
9
Laboratory Department, Directorate of Veterinary in Sulaimany, Rizgari 402, Sulaimani, Kurdistan Region 46001, Iraq
10
Research Center, King Fahad Medical City, Riyadh 11525, Saudi Arabia
11
The Peter Doherty Institute for Infection and Immunity, Melbourne 3000, Australia
12
Infectious Diseases Horizontal Technology Centre (ID HTC), A*STAR, Singapore 138648, Singapore
13
Faculty of Medicine, Imperial College London, London SW7 2AZ, UK
14
Roslin Institute, University of Edinburgh, Edinburgh EH25 9RG, UK
*
Authors to whom correspondence should be addressed.
These authors Contributed equally to this work.
Submission received: 8 September 2020 / Revised: 8 October 2020 / Accepted: 9 October 2020 / Published: 14 October 2020
(This article belongs to the Collection Coronaviruses)

Abstract

:
Severe acute respiratory syndrome coronavirus 2 (SARS-CoV-2) is the causative agent of coronavirus disease 2019 (COVID-19). Sequencing the viral genome as the outbreak progresses is important, particularly in the identification of emerging isolates with different pathogenic potential and to identify whether nucleotide changes in the genome will impair clinical diagnostic tools such as real-time PCR assays. Although single nucleotide polymorphisms and point mutations occur during the replication of coronaviruses, one of the biggest drivers in genetic change is recombination. This can manifest itself in insertions and/or deletions in the viral genome. Therefore, sequencing strategies that underpin molecular epidemiology and inform virus biology in patients should take these factors into account. A long amplicon/read length-based RT-PCR sequencing approach focused on the Oxford Nanopore MinION/GridION platforms was developed to identify and sequence the SARS-CoV-2 genome in samples from patients with or suspected of COVID-19. The protocol, termed Rapid Sequencing Long Amplicons (RSLAs) used random primers to generate cDNA from RNA purified from a sample from a patient, followed by single or multiplex PCRs to generate longer amplicons of the viral genome. The base protocol was used to identify SARS-CoV-2 in a variety of clinical samples and proved sensitive in identifying viral RNA in samples from patients that had been declared negative using other nucleic acid-based assays (false negative). Sequencing the amplicons revealed that a number of patients had a proportion of viral genomes with deletions.

1. Introduction

Severe acute respiratory syndrome coronavirus 2 (SARS-CoV-2) emerged in China in 2019 and has sequence similarity to SARS-CoV and certain bat coronaviruses [1]. After an incubation period that averages 5 days but may be between two days and two weeks [2], patients with the disease, termed coronavirus disease 2019 (COVID-19), typically present with fever, myalgia, cough, sore throat, and difficulty breathing. A range of other symptoms are also possible, in particular gastrointestinal symptoms. Approximately 80% of infections are mild, but of those that require hospitalisation, mortality is around 30% [3,4]. SARS-CoV-2 is highly transmissible with a reproductive number (R0) of around 3 if unmanaged.
SARS-CoV-2 has a positive-sense RNA genome of approximately 30 kb, and viral RNA synthesis occurs in the cytoplasm of an infected cell. During RNA synthesis, several processes occur including replication of the genome and transcription of a nested set of subgenomic messenger RNAs, which encode for the suite of viral proteins, as well as the genome for ORF1AB. During viral RNA synthesis, errors can occur including point mutation of single nucleic acids and recombination [5]. Recombination events manifest themselves in insertions and/or deletions in the viral genome and can result in major changes in viral tropism. One of the unusual features of the SARS-CoV-2 genome sequence, compared to the most closely related coronaviruses, such as SARS-CoV, is the insertion of a furin cleavage site in the spike glycoprotein (S protein) sequence [6]. The origin of the furin cleavage site is unknown but may be either viral or cellular in origin. The presence of the furin cleavage site reduces the dependence on cellular proteases to process the S protein into two functional subunits, S1 and S2. Thus, recombination can result in the insertion of a non-coronavirus sequence. The furin cleavage site is potentially unstable [7].
SARS-CoV-2 has caused a worldwide pandemic and has severe economic and health implications for all affected countries. Given that mechanisms of both point mutation and recombination operate in coronaviruses, monitoring for these changes in the SARS-CoV-2 genome is essential not only for potential contact tracing but also for confidence in vaccine efficacy, which are generally based around the S protein. Experience from developing vaccines against the coronavirus infectious bronchitis virus (IBV), which arguably have been the most successful vaccines developed against coronaviruses so far, has suggested that differences of as little as 5% between the S1 sequences can result in poor cross-protection against different variants of IBV [8]. Differences in S1 of 2% to 3% (10 to 15 amino acids) can change serotype, suggesting that a small number of epitopes are immunodominant with respect to neutralizing antibody [8].
Anecdotal data from diagnostic laboratories (at least based in the UK) early in the outbreak suggested that nucleic acid-based diagnostics to SARS-CoV-2 and complications around the sampling processes can lead to unreliable results and false negatives. The advantage of both laboratory [9] and field-based sequencing [10] approaches in characterising viral infection was illustrated in the 2013–2016 West African Ebola virus outbreak, and allowed the origin of clusters of infection to be rapidly identified [11]. Therefore, the accurate identification and sequencing of SARS-CoV-2 in samples from patients provide multiple information from reducing false negatives, contact tracing, to assessing the suitability of diagnostic assays (especially nucleic acid-based) and investigating whether vaccines are likely to be or remain efficacious in the background of nucleotide substitution and recombination during virus replication. The International Severe Acute Respiratory and emerging Infection Consortium (ISARIC) 4C UK study provided a large and detailed collection of sequentially collected virological samples from well-characterised hospitalised patients; here we assess the utility of the Rapid Sequencing Long Amplicon (RSLA) protocol in monitoring viral RNA from early participants.

2. Materials and Methods

2.1. Ethics and Clinical Information

Patients (n = 24) were recruited under the International Severe Acute Respiratory and Emerging Infection Consortium (ISARIC) Clinical Characterisation Protocol (CCP) (https://isaric.net/ccp) by giving informed consent. ISARIC CCP was reviewed and approved by the national research ethics service, Oxford (13/SC/0149). Samples from clinical specimens were processed at CL3 in the Outbreak Response Laboratory at the University of Liverpool, Liverpool, UK.

2.2. RNA Extraction and Preparation

Nasopharyngeal swabs were collected into viral transport medium from patients with COVID-19. RNA was isolated using either a QIAamp Viral RNA Mini Kit (Qiagen, Mancheste, UK) by spin-column procedure or Trizol LS (Invitrogen, UK), according to the manufacturer’s instructions. Total RNA was purified from SARS-CoV-2 infected Vero cells following AVL inactivation using the Qiagen RNA Mini Kit. Infection of Vero cells was conducted at Public Health England, Porton Down at CL3. RNA samples were treated with Turbo DNase (Invitrogen).

2.3. Primer Design

Alignments generated from the NCBI reference sequence for SARS-CoV-2 NCBI (NC_045512.2) and published sequences on GISAID were used to identify conserved regions for primer design. Primers (Table 1) were chosen that sequentially amplified roughly 1000 bp with an ~200 bp overlapping region.

2.4. RT and PCR

SuperScript IV (Invitrogen) was used to generate single-strand cDNA using random primer mix (NEB, Hitchin, UK). The primer sets were used to generate 30 amplicons from the cDNA. Subsequently, primers were pooled to generate six sets each containing five primer pairs. Reactions were performed using 2 × Q5-High Fidelity master mix (NEB) with 0.5 μM of each primer for the individual reactions and 0.1 μM of each primer for the pooled primers. The reaction conditions were as follows: denaturation at 98 °C for 30 sec followed by 35 to 40 cycles of 10 sec denaturation at 98 °C, 30 sec annealing at 66 °C and then 50 sec of extension at 72 °C. A final extension step was done for 2 min at 72 °C.

2.5. Library Preparation for MinION Sequencing

Following amplification, PCR products were purified at a 1:1 ratio with AMPure XP beads (Beckman Coulter, High Wycombe, UK). The library was prepared as per the sequencing by ligation protocol with native barcodes for multiplexing (Oxford Nanopore, Oxford, UK).

2.6. Informatics Analysis

For assembly of the SARS-CoV-2 genomes, Minimap2 (v. 2.17-r941) was used to align fastq sequences to the coronavirus 2 isolate Wuhan-Hu-1 reference genome (NC_045512.2) using the -ax map-ont parameters. Samtools (v.1.10) was used to sort and index alignment files, and Picard (v.2.23.4) was used to mark duplicates. A custom script written in perl (v.5.26.2) was used to determine viral genome coverage, the viral consensus sequence and the presence of indels. Viral genome coverage was visualised in RStudio (v. 4.0.2). For the identification of deletions within the SARS-CoV-2 genome, ONT RSLA library reads were aligned to the coronavirus 2 isolate Wuhan-Hu-1 reference genome using Minimap2, as part of the Nextflow ARTIC analysis pipeline (https://github.com/connor-lab/ncov2019-artic-nf). Raw aligned BAM files were used as input to SVIM, to detect putative deletions. Resulting candidate deletions were filtered to accept any with at least 5 supporting reads and intersected with reference gene annotations to determine which genes intersected with the deletions.

3. Results

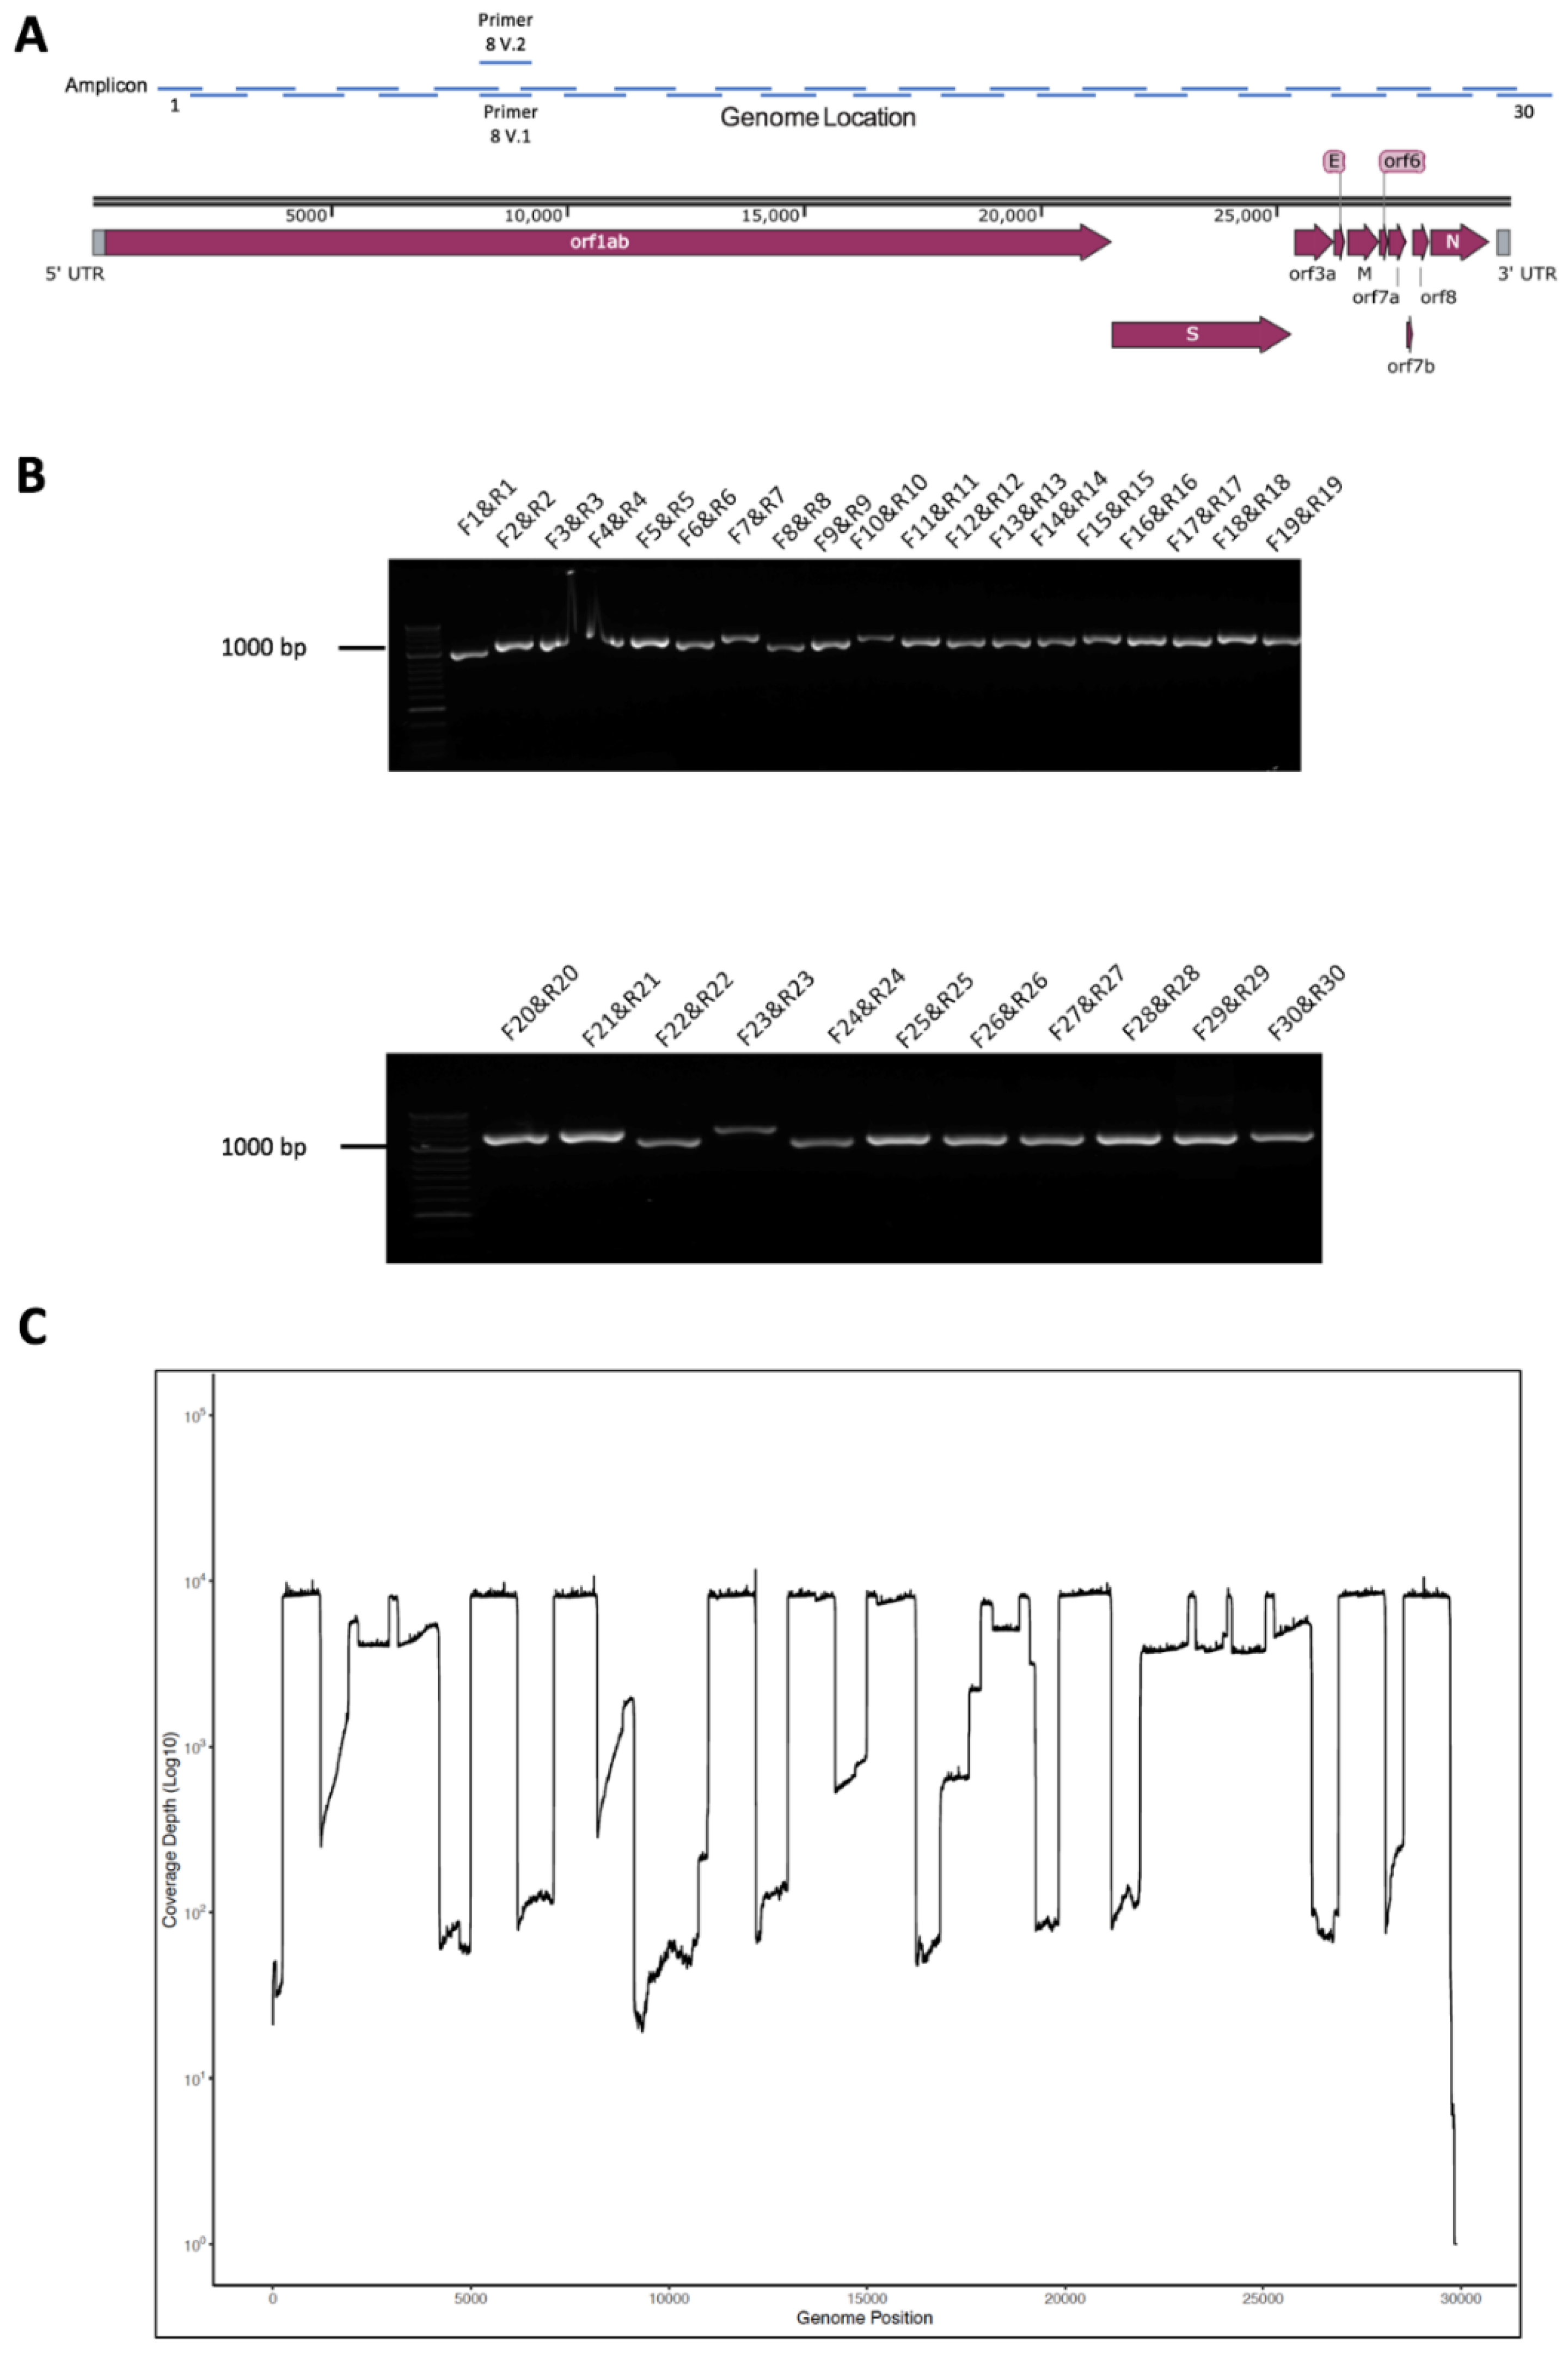
3.1. Primer and Amplicon Design

To sequence SARS-CoV-2 with a view to identify both nucleotide polymorphisms and recombination events on the viral genome, a longer read length amplicon-based system was developed. A series of primers were designed (Table 1), allowing overlapping sections of the SARS-CoV-2 genome to be amplified sequentially in 1000 base-paired fragments, with an approximately 200 base pair overlap to facilitate sequence assembly from the amplicon data (Figure 1A). The primers were selected on the basis of conserved regions in the SARS-CoV-2 genome based upon an initial deposition of 17 genomes available on GISAID.

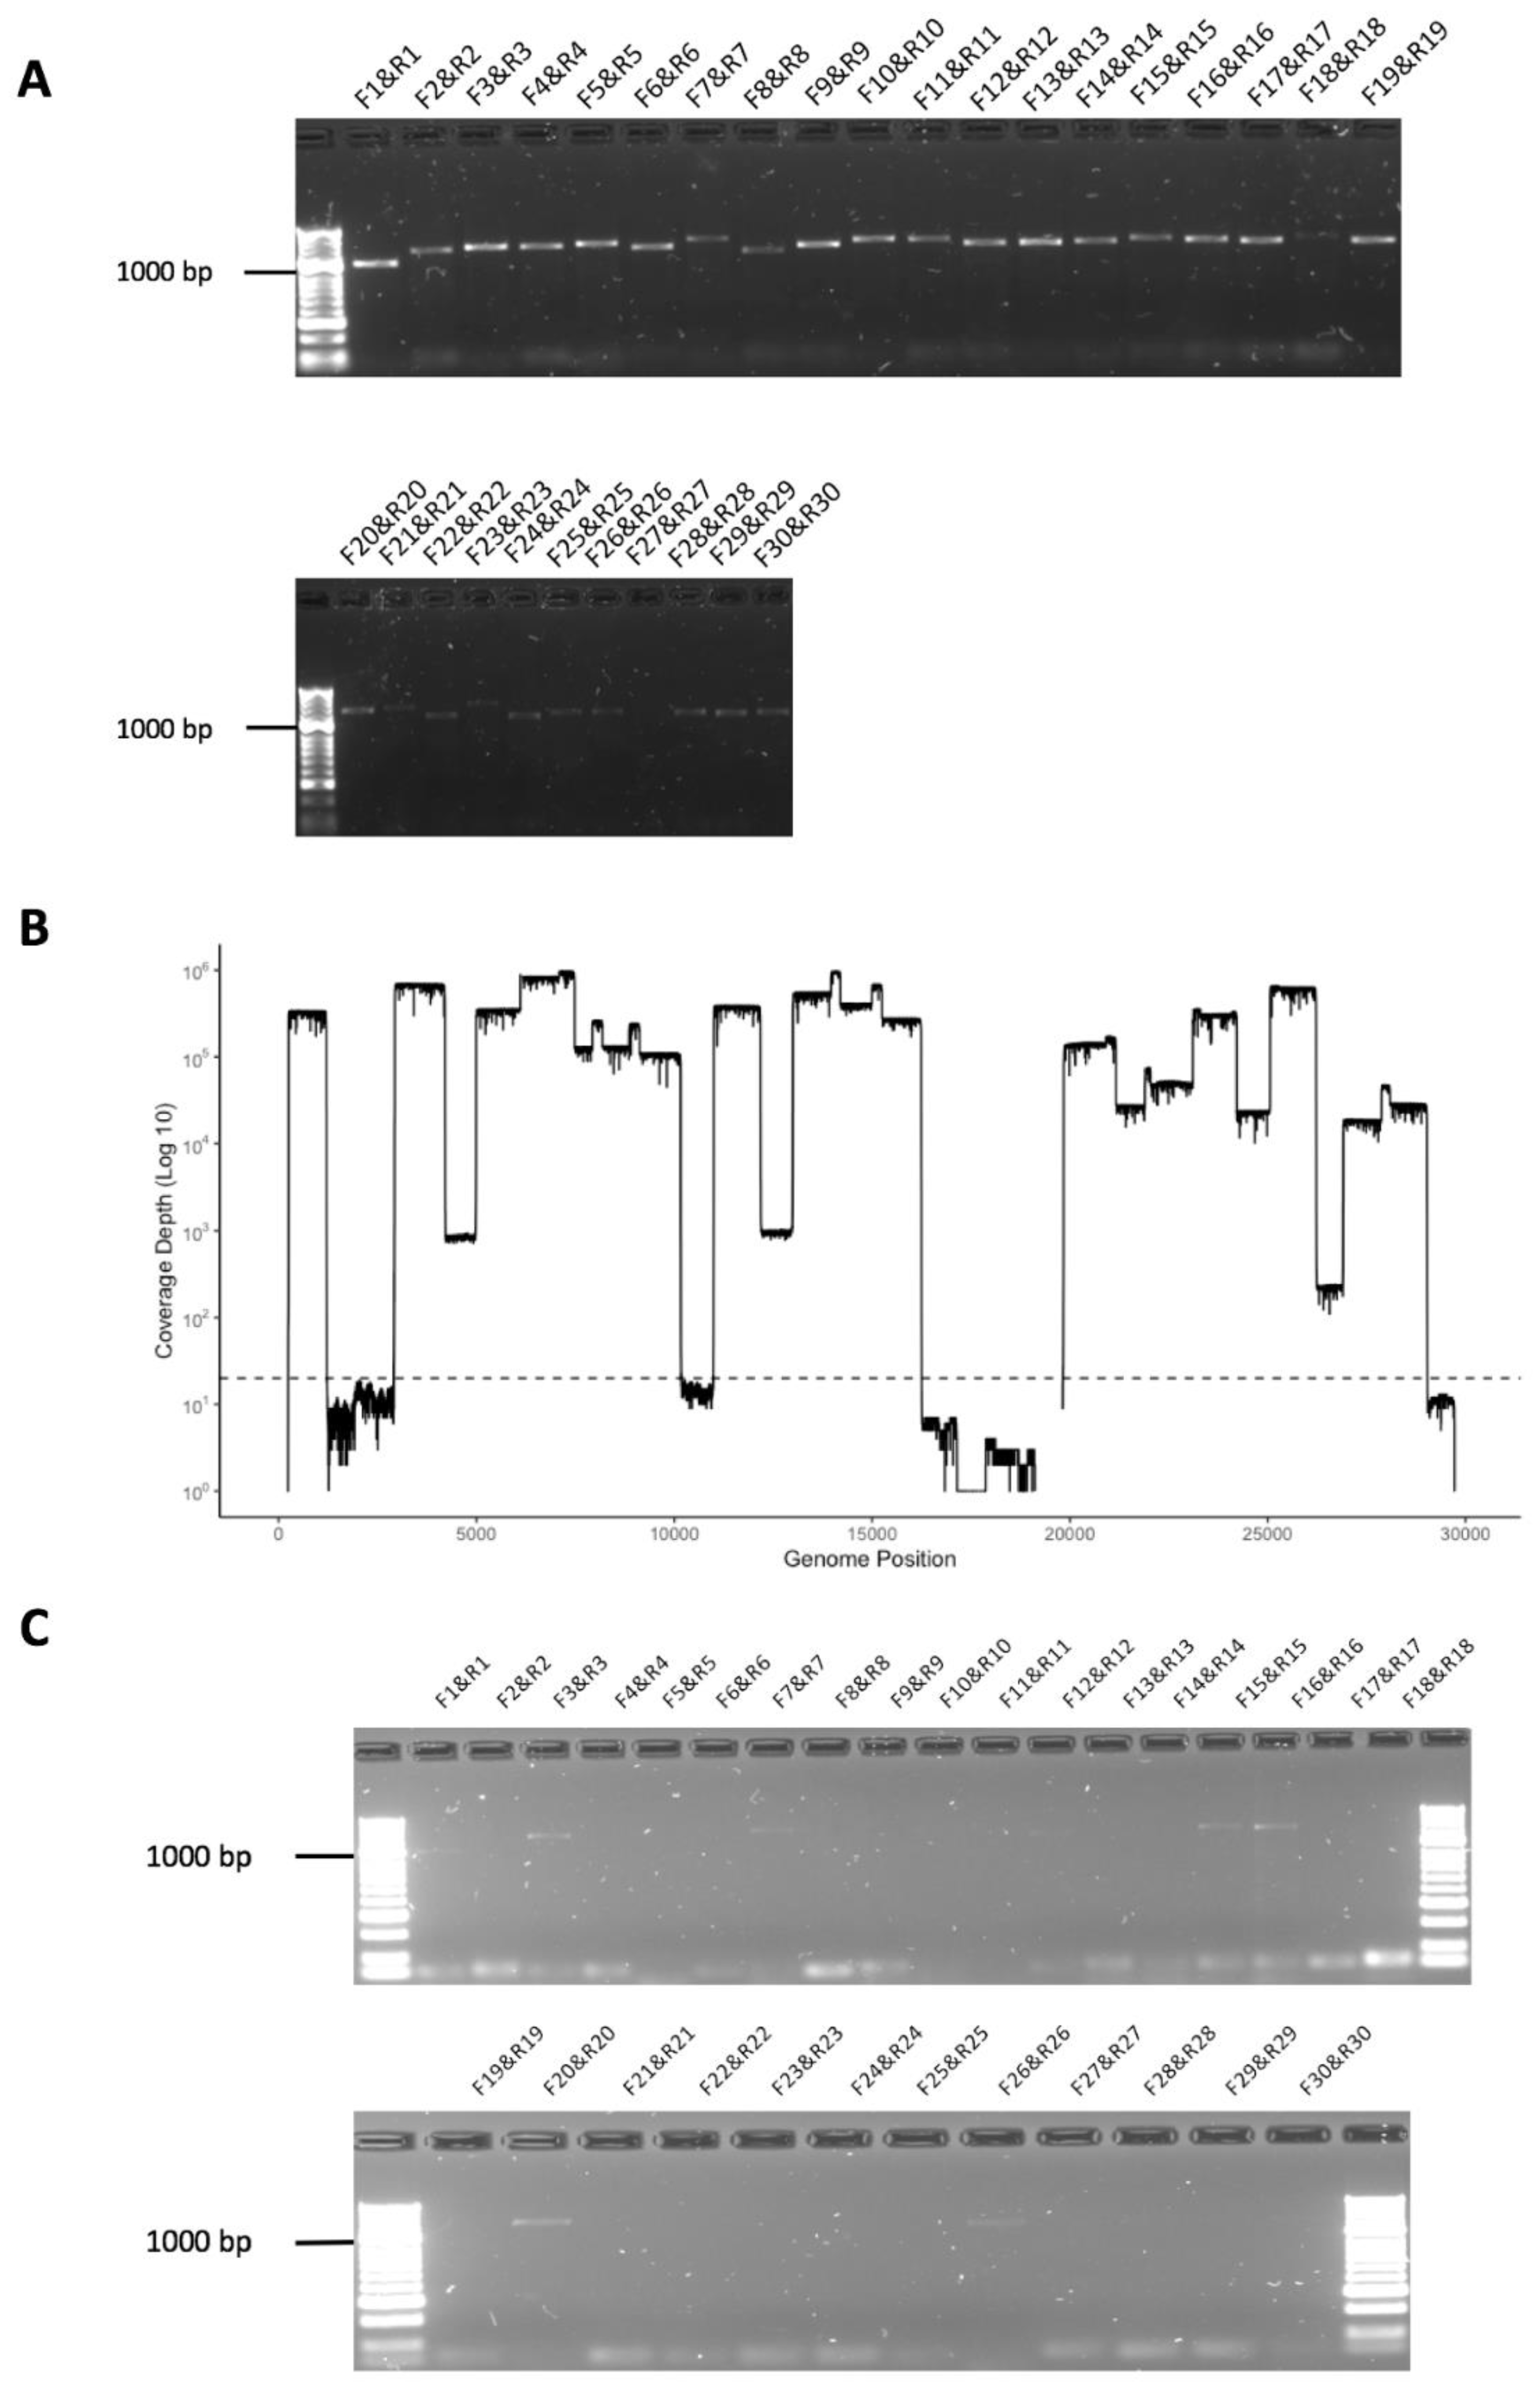
3.2. Validation of Amplicon Generation and Oxford Nanopore Sequencing Using RNA from Cells Infected with SARS-CoV-2

Purified RNA from SARS-CoV-2 (MT007544.1 GenBank)-infected Vero cells was used to confirm that the primers could generate amplicons. This RNA was used as a template for cDNA synthesis followed by PCR using the conserved primers. This generated 30 separate amplicons covering the SARS-CoV-2 genome, and the synthesis and expected size of these amplicons were confirmed using agarose gel electrophoresis (Figure 1B). These amplicons were sequenced on an Oxford Nanopore (UK) flow cell using MinION and reads were mapped to the SARS-CoV-2 genome confirming that the amplicons represented viral sequence (Figure 1C). This approach was termed Rapid Sequencing Long Amplicons (RSLAs).

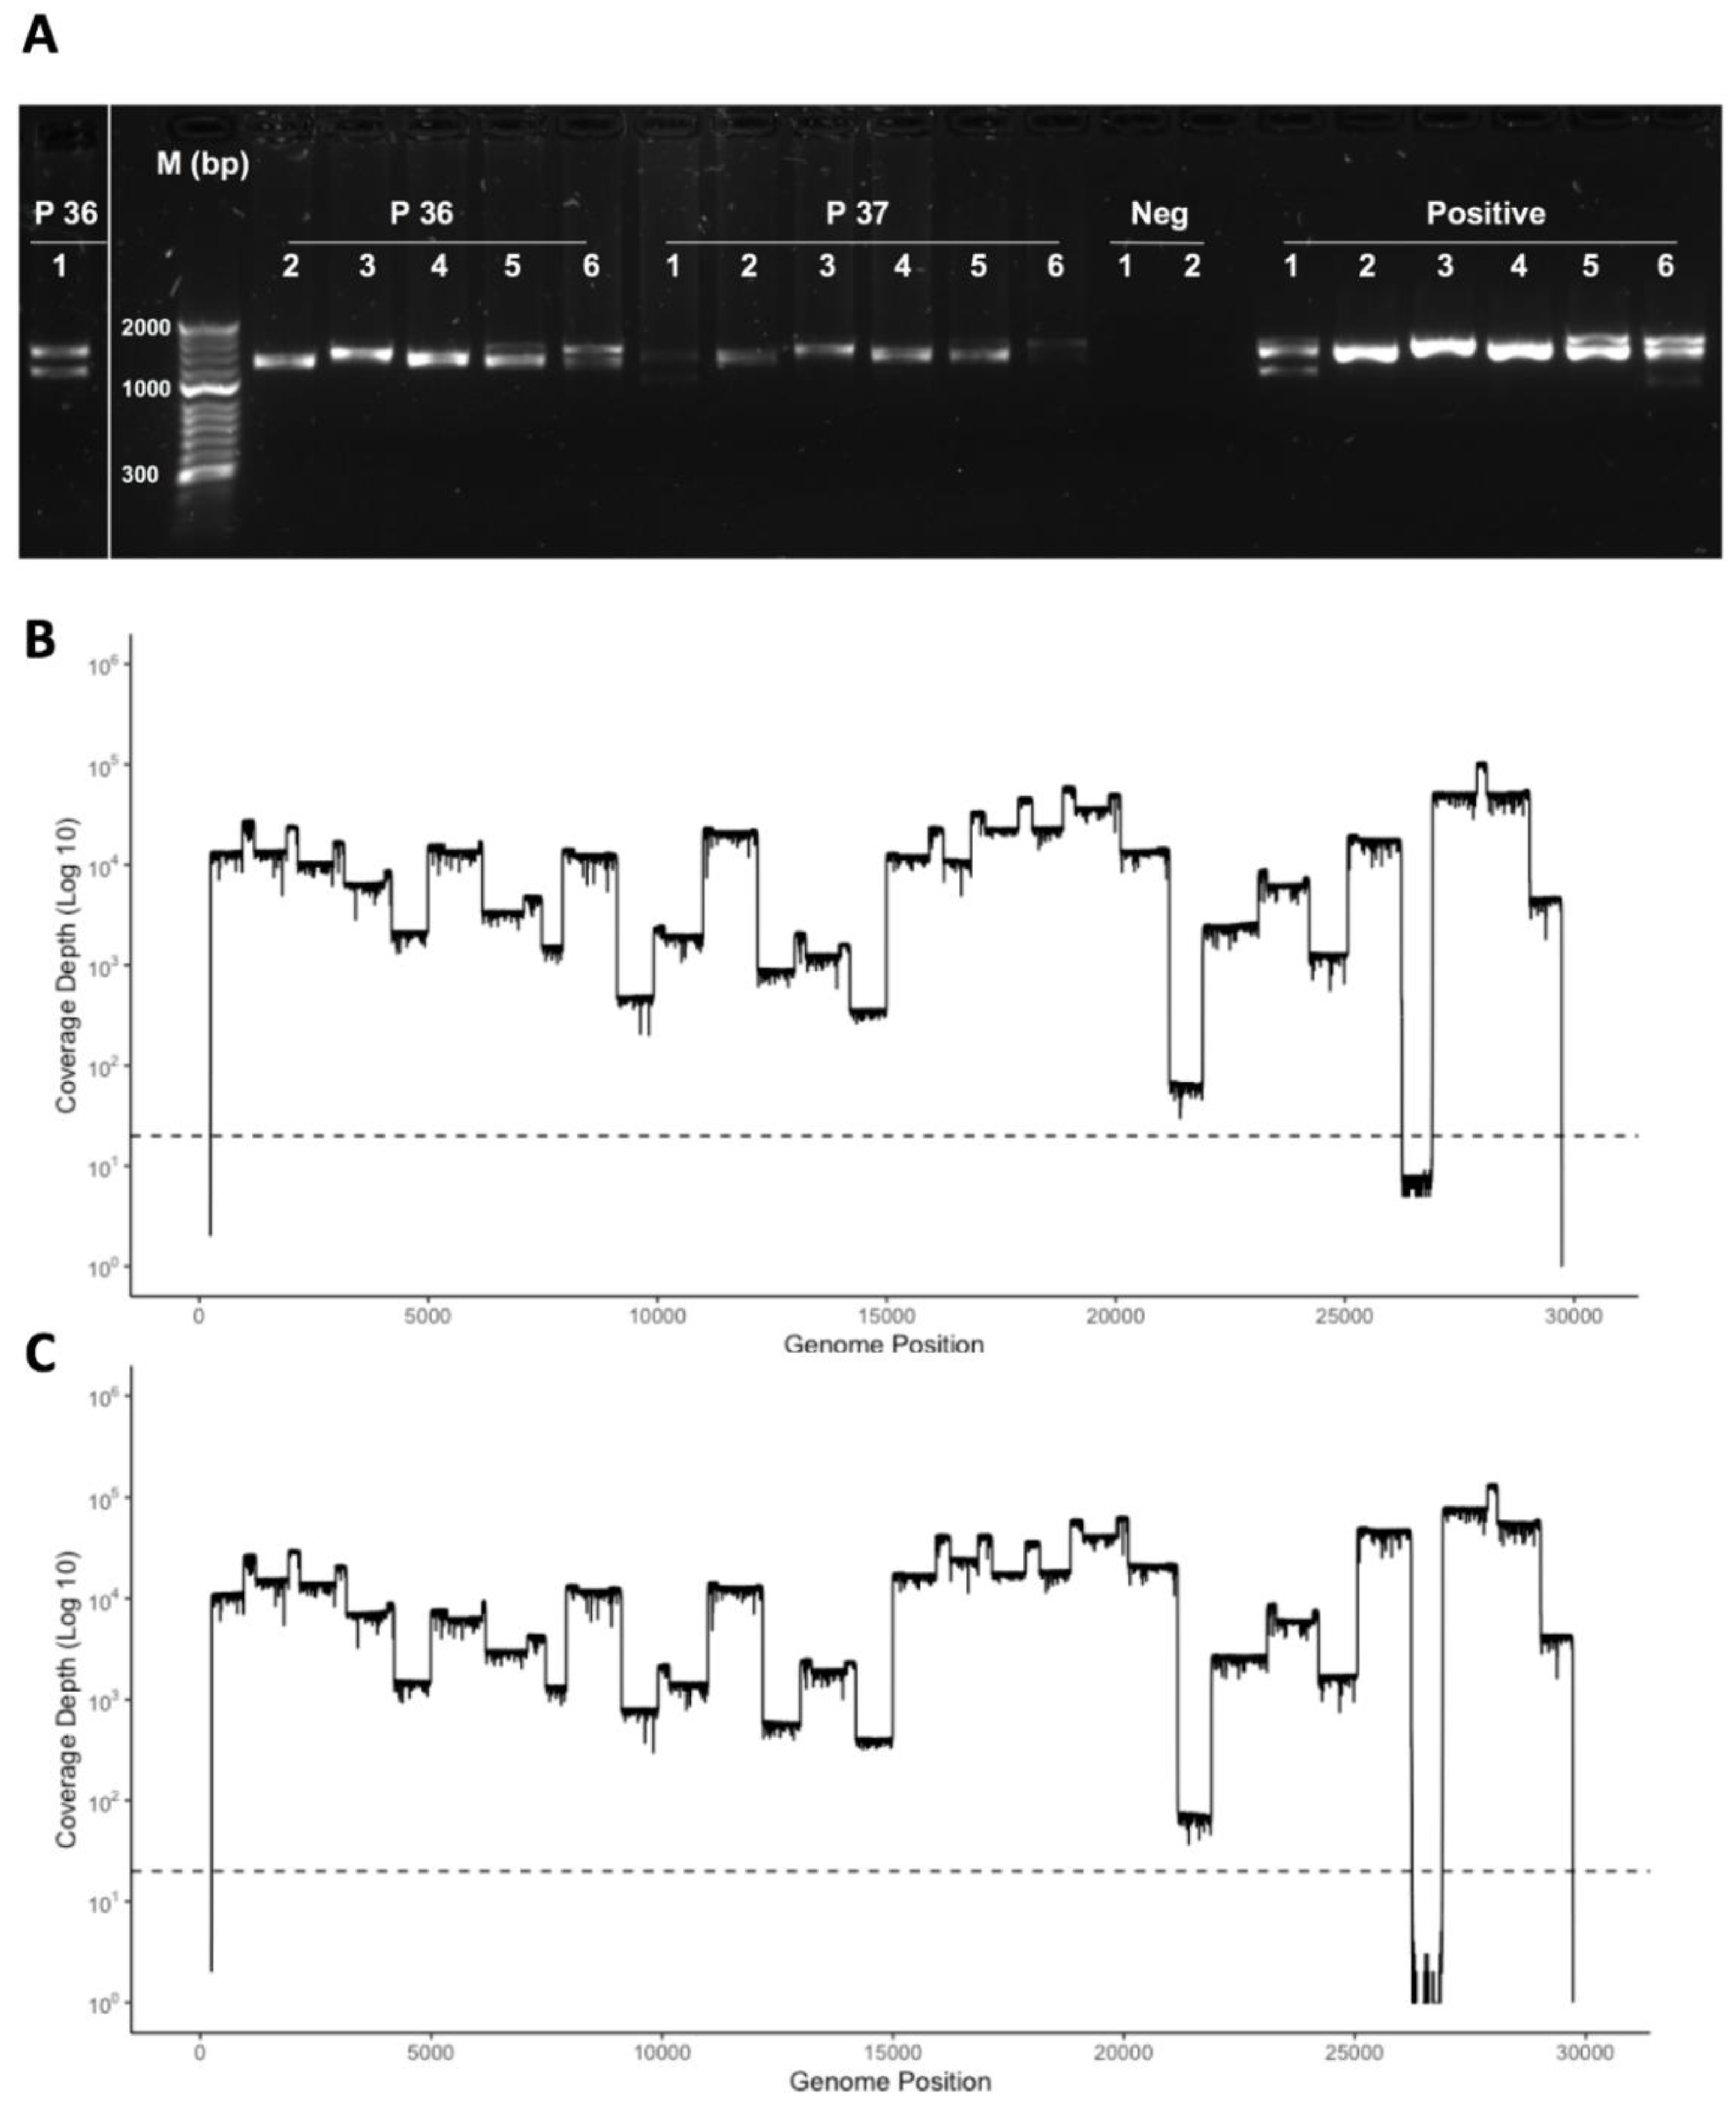
3.3. Initial Evaluation of the Amplicon Approach to Detect SARS-CoV-2 on RNA Purified from Nasopharyngeal Swabs Collected from Patients with COVID-19 Correctly Identified a Positive but also a False Negative Sample

The ability of the amplicon-based approach to detect SARS-CoV-2 was initially evaluated on nasopharyngeal swabs collected from patients with COVID-19. The first patient (REMRQ0001) was admitted to the Royal Liverpool University Hospital on 23 February 2020. The patient was a member of staff from the Diamond Princes cruise ship that had an outbreak of SARS-CoV-2 leading to passengers developing COVID-19 [12,13]. The patient was asymptomatic but was screened for SARS-CoV-2 on 20 February 2020, left the ship on 21 February and was repatriated from Japan on 22 February 2020. During the flight, a positive result for SARS-CoV-2 using a nucleic acid-based system was received. A repeat nasopharyngeal swab was taken on admission and again tested positive with a viral load of Ct = 31.3. Two repeat swabs were collected on 24 February, one was positive (Ct = 32.7) and the second was negative. On 25 February, a fourth diagnostic swab was again negative, but a separately collected swab yielded PCR products from RNA isolated to evaluate the amplicon system. Here, 30 separate amplicons were synthesized and then visualised by agarose gel electrophoresis (Figure 2A). The data indicated that all amplicons (F1&R1 to F30&R30) could be identified and spanned the SARS-CoV-2 genome. These amplicons were sequenced on an Oxford Nanopore flow cell using MinION and sequence reads were mapped to the SARS-CoV-2 genome (Figure 2B), confirming that the amplicons represented viral sequence.
A final nasopharyngeal swab was taken from patient REMRQ0001 on 27 February. This latter swab was not used for a diagnostic assay but was used to evaluate the sensitivity of the amplicon-based system using RNA isolated from the sample. In this case, several amplicon products were identified, though fewer than on the previous sample (note that the brightness on the gel image was adjusted post-exposure to show these products more clearly) (Figure 2C). The products most clearly visible included amplicons from the polymerase (orf1ab) region (F1&R1, F3&R3, F7&R7, F12&R12, F15&R15, F16&R16, F20&R20) and the membrane (M) region (F26&R26). Other amplicon products were less visible including F28&R28, spanning the orf8/nucleoprotein gene sequence. Therefore, the data suggested that the viral genome or viral sequence was present in a patient that had been evaluated as negative.
The second patient (REMRQ0002) had onset of symptoms of COVID-19 on 22 February 2020 and was admitted to the Royal Liverpool University Hospital on 27 February 2020 after a diagnostic nasopharyngeal swab taken on 25 February tested positive for SARS-CoV-2. A repeat swab taken on the day of admission against tested positive for SARS-CoV-2. A further swab was taken for research the same day, and RNA isolated from this swab was used to evaluate the amplicon system. The amplicons were visualised by agarose gel electrophoresis (Figure 3A,B; same gel as shown in 3A but with the brightness enhanced post-image capture). These amplicons were sequenced on an Oxford Nanopore flow cell using MinION and sequence reads were mapped to the SARS-CoV-2 genome (Figure 3C), confirming that the amplicons represented viral sequence. There were some regions of the genome that had lower sequence read depth.

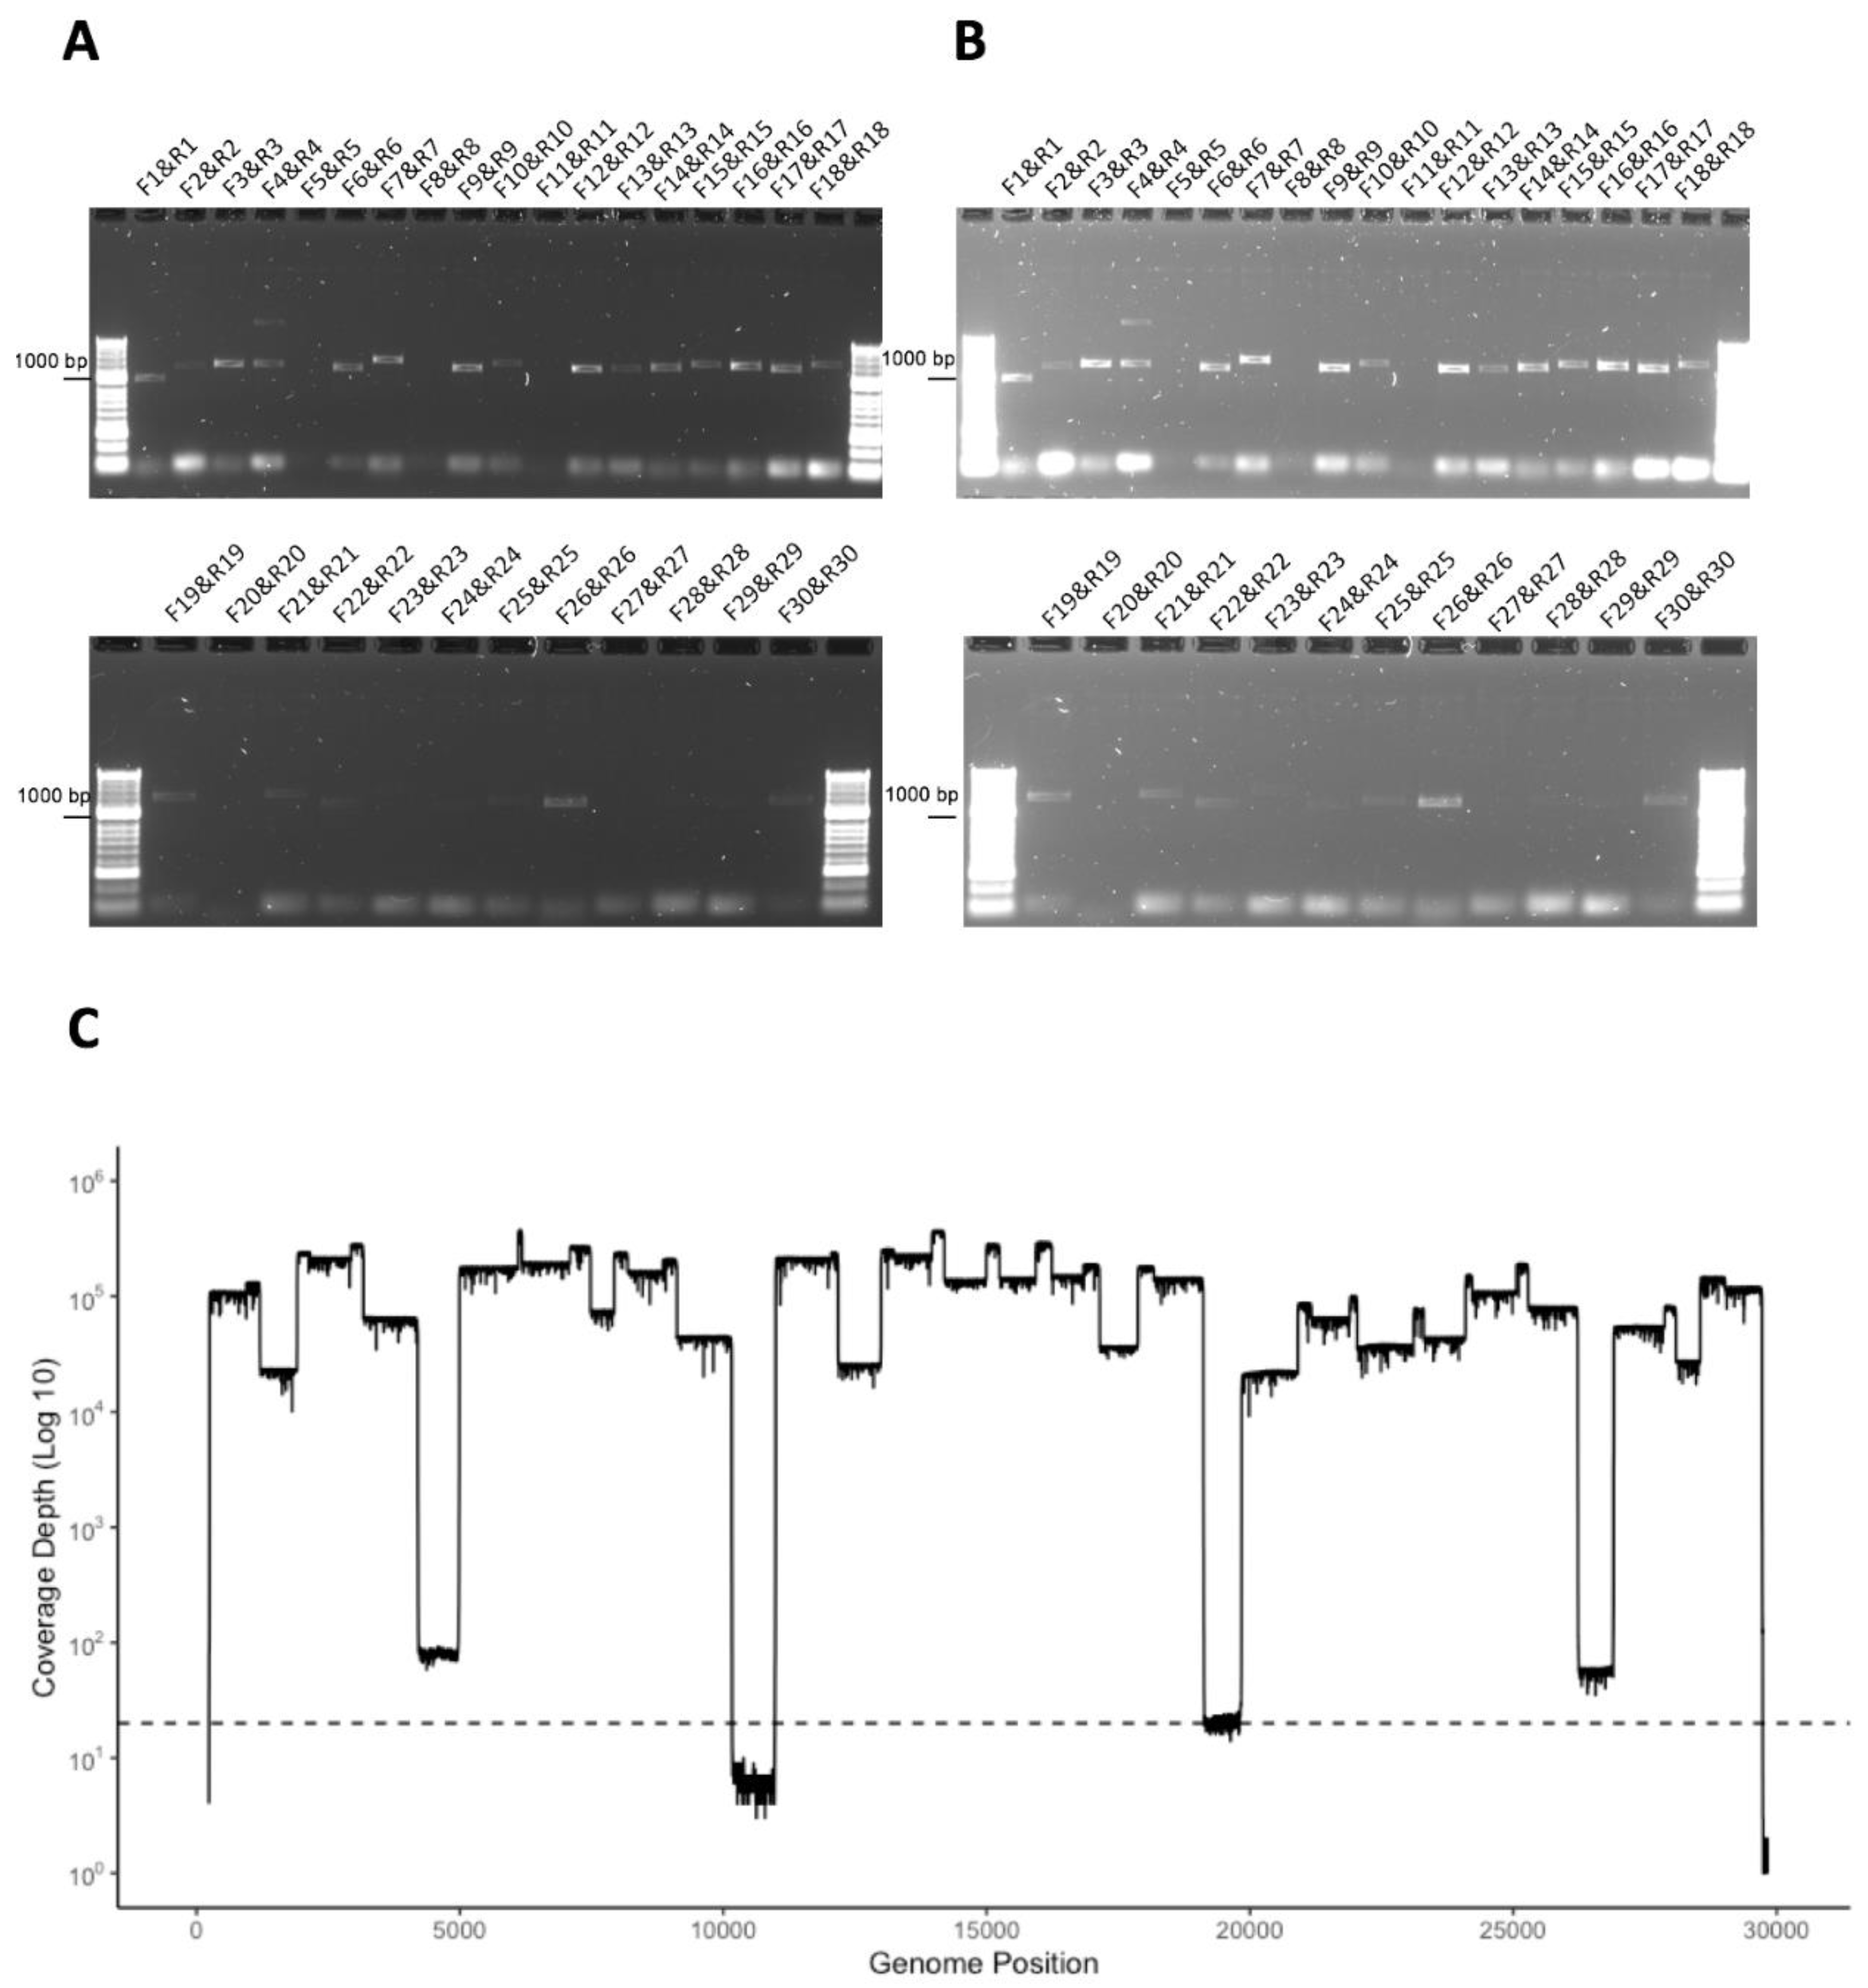
3.4. Development of a Multiplex Method to Generate Amplicons

In order to increase capacity and reduce complexity (the need to conduct individual PCRs for each amplicon primer set), primer sets were pooled into six groups (Table 1). These were arranged so that adjacent regions were not in the same pool and that there was coverage across the genome in each pool. This way, if a reaction failed, there would still be genome coverage in each amplicon group. The ability of this multiplex method to identify SARS-CoV-2 RNA in clinical material was evaluated by isolating RNA from nasopharyngeal swabs taken from patients. Total RNA from SARS-CoV-2 infected cells was also used as a positive control, and negative controls were also included. The six groups of primer sets were used to generate a mixture of amplicons in each pool for each patient and the positive control. These amplicons were visualised by agarose gel electrophoresis (exemplar data shown in Figure 4).

3.5. Identification of Deletions in SARS-CoV-2 from Patients with COVID-19

Recombination is a major mechanism of genetic change in coronaviruses, and this will manifest in insertions and deletions being present in the SARS-CoV-2 genome [7]. For coronaviruses in general, this process is well characterised in cell culture and has been demonstrated in vivo for both animal coronaviruses [5] and also in humans for Middle East respiratory syndrome coronavirus (MERS-CoV) [14,15]. To assess whether and where these were occurring during SARS-CoV-2 replication in patients, RNA was extracted from nasopharyngeal swabs taken from 24 patients and amplicons generated using the RSLA multiplex approach and sequenced on Oxford Nanopore flow cells using either MinION and/or GridION. Sequence reads were mapped to the SARS-CoV-2 genome and putative deletions identified (Table 2). Interestingly, several patients had deletions, at the minor variant level, in the SARS-CoV-2 genome scored with high confidence, mainly in orf3a and orf7a, which are associated with interferon antagonism and would result in potential defective genomes being present.

4. Discussion

This work demonstrates that both amplicon-based detection and subsequent sequencing are feasible for identifying the SARS-CoV-2 genome or nucleic acid in samples from patients with COVID-19. The rationale is based on amplifying and sequencing longer fragments than comparative techniques, and our approach was named Rapid Sequencing Long Amplicons (RSLAs) to reflect this and its origins based on identifying MERS-CoV from viral subgenomic messenger RNAs present in clinical samples in Saudi Arabia. The amplicon system was evaluated first on RNA purified from cells infected with SARS-CoV-2 as a positive control and then on RNA purified from nasopharyngeal swabs from patients with COVID-19. We would note that this system best lends itself to identifying and sequencing SARS-CoV-2 from RNA that is of good quality. In general, the Ct value of these diagnostic leftover samples was not known. Different platforms are used in different settings and diagnostic laboratories in the UK, and there is no common uniformity. Interestingly, the RSLA system could identify nucleic acid corresponding to parts of the SARS-CoV-2 genome in a sample from a patient that had tested SARS-CoV-2 negative by an alternative diagnostic nucleic acid-based test performed on a separate sample. Provided that the primer binding sites remain conserved in the pathogen being tested, RT-qPCR is generally more sensitive for diagnostic purposes. In this case, diagnostic reagents for RT-qPCR can be reassessed based upon using sequencing as sentinel for these events. We would note that, based upon our comparison, multiple sites should be targeted within the genome to increase diagnostic sensitivity. Not all regions of the viral genome had equal sequence coverage, and this may be reflective of differential RNA stability in a clinical sample and the gradient of subgenomic messenger RNAs. Nevertheless, there was sufficient coverage to build consensus genomes.
The non-multiplexed RSLA approach has been compared to other viral genome sequencing protocols such as ARTIC and viral bait capture, using the Illumina MiSeq platform, further demonstrating the feasibility and flexibility of this method. Although RSLA generates less depth in comparison to other methods, the breadth of coverage tends to be more even [16]. RNA quality and viral load (Ct values) can influence sequence read depth and obtaining full genome coverage regardless of method. Previous studies on sequencing viral genomes and investigating depth of coverage and accuracy of base calling have shown that MinION sequencing is comparable to short-read sequencing platforms such as Illumina [17,18]. Long-read sequencing data has advantages in detecting insertions and deletions and allows linkage of potentially different sequence variations. These can be missed depending on the type of bioinformatic analysis in short-read data. Much needed information can be gained from sequencing of viral genomes in terms of viral adaptation [9], thus informing molecular epidemiological studies during outbreaks [18]. Current diagnostics may not remain fit for purpose due to recombination in coronaviruses (e.g., [5,19]). Interestingly, analysis of deletions that occurred in the SARS-CoV-2 genome in infected patients from this study identified several that mapped to genes encoding proteins involved in interferon and host antagonism. Deletions with high confidence scores were particularly situated in Orf3a but particularly in Orf7a. These genes are conserved with SARS-CoV [20]. ORF3A in SARS-CoV has been shown to activate the NLRP3 inflammasome [21], induce NF-κB activation and chemokine production [22] and may act as a viroporin. Data from SARS-CoV suggested that ORF7A acts as an RNA silencing suppressor (RSS) and therefore is a suppressor of siRNA activity in mammalian cells [23]. The presence of deletion variants of the genome may also act as defective interfering genomes within patients. Such deletion variants may account for the transient emergence of isolates of SARS-CoV-2 that are associated with the milder disease in patients [24].
While most analysis of genome variation in viruses with RNA genomes is focused on nucleotide substitution, it is recombination in coronaviruses that is one of the big drivers of adaptation and change. A novel genotype of human coronavirus OC43 has been shown to emerge through recombination [25]. Indeed, recombination in coronaviruses can occur between highly divergent coronaviruses of the same strain [26] and even between coronaviruses that infect different species [27], as has been proposed for the origin of these severe coronaviruses in humans. Therefore, we would caution that any surveillance and sequencing pipeline is able to identify recombination and monitor for recombination between SARS-CoV-2 and other coronaviruses—particularly human ones.

Author Contributions

Conceptualization: M.W.C., M.G.S., J.K.B., P.J.M.O., J.D., L.T. and J.A.H. Methodology: S.C.M., R.P.-R., L.T., M.A. (Muhannad Alruwaili), X.D., D.W.C., N.R., S.H., Z.M., D.A.M., R.V., W.A., S.T.P. and A.D.D. Software: R.P.-R., X.D., S.H. and D.A.M. Validation: S.C.M., R.P.-R., S.A. and M.A. (Muhannad Alruwaili) Formal analysis and investigation: K.B., S.C.M., R.P.-R., M.A. (Mai Almsaud), X.D., S.T.P., A.D., D.B., D.W.C., D.P.C., J.K.B., Q.Z., Y.S., C.H., N.R., S.A., C.H., J.D., A.A., M.A. (Muhannad Alruwaili), E.B., J.C. (Jordan Clark), I.G.-D., P.G., X.H., B.J., L.L., P.S., G.S., J.D. and J.A.H. Resources: S.T.P., D.P.C., J.K.B., J.S., J.D., M.B., J.C. (James Cruise), L.T., L.N., L.R., D.A.M., A.D.D. and J.D. Data Curation: R.P.-R., S.H., and X.D. Writing—Original Draft: S.C.M., R.P.-R., M.A. (Muhannad Alruwaili), L.T. and J.A.H. Writing—Review & Editing: All authors. Visualization: R.P.-R., X.D. and M.A. (Muhannad Alruwaili) Supervision: J.A.H., L.T., A.D., L.F.P.N., M.W.C., J.P.S., E.-m.Z. and W.A. Funding acquisition: J.A.H., M.W.C., W.A., T.S., L.T., J.K.B., P.J.M.O. and M.S. All authors have read and agreed to the published version of the manuscript.

Funding

This work was supported by the United States Food and Drug Administration grant number HHSF223201510104C ‘Ebola Virus Disease: correlates of protection, determinants of outcome and clinical management’ amended to incorporate urgent COVID-19 studies. Awarded to J.A.H., A.D., D.A.M. and M.W.C. Recruitment, sample acquisition, transport, laboratory and management costs were supported by the Medical Research Council “Protocol for Severe Emerging Infection” grant number MC_PC_19025 awarded to J.K.B., M.G.S., and P.J.M.O. This work was supported by Research Center, King Fahad Medical City, Saudi Arabia grant number 019-003 ‘Elucidating the viral biology of MERS-CoV and the host response using high resolution sequencing’. Awarded to W.A. This work was supported by the Medical Research Council Discovery Medicine North Doctoral Training Partnership and directly funded the studentship of R.P.-R.This work was supported by the National Institute for Health Research Health Protection Research Unit (NIHR HPRU) in Emerging and Zoonotic Infections at University of Liverpool in partnership with Public Health England (PHE), in collaboration with Liverpool School of Tropical Medicine. The views expressed are those of the author(s) and not necessarily those of the NHS, the NIHR, the Department of Health or Public Health England. Awarded to T.S. This work is also supported by the Centre of Excellence in Infectious Diseases Research (CEIDR) and the Alder Hey Charity awarded to J.A.H. and L.T. We also acknowledge support of Liverpool Health Partners and the Liverpool-Malawi-Covid-19 Consortium. L.T. is a Wellcome Trust clinical career development fellow, supported by grant number 205228/Z/16/Z.

Acknowledgments

We would like to acknowledge the research teams at the hospital sites who gave their time and effort for this study. We would particularly like to thank the patients who consented to having several additional samples collected over the course of this research. We would like to thank the laboratory staff for their continuous work during the COVID-19 pandemic and the University of Liverpool for maintaining these facilities.

Conflicts of Interest

The authors declare no conflict of interest. The funders had no role in the design of the study; in the collection, analyses, or interpretation of data; in the writing of the manuscript, or in the decision to publish the results.

References

  1. Andersen, K.G.; Rambaut, A.; Lipkin, W.I.; Holmes, E.C.; Garry, R.F. The proximal origin of SARS-CoV-2. Nat. Med. 2020, 26, 450–452. [Google Scholar] [CrossRef] [PubMed] [Green Version]
  2. Chen, N.; Zhou, M.; Dong, X.; Qu, J.; Gong, F.; Han, Y.; Qiu, Y.; Wang, J.; Liu, Y.; Wei, Y.; et al. Epidemiological and clinical characteristics of 99 cases of 2019 novel coronavirus pneumonia in SARS-CoV-2, China: A descriptive study. Lancet 2020, 395, 507–513. [Google Scholar] [CrossRef] [Green Version]
  3. Docherty, A.B.; Harrison, E.M.; Green, C.A.; Hardwick, H.E.; Pius, R.; Norman, L.; Holden, K.A.; Read, J.M.; Dondelinger, F.; Carson, G.; et al. Features of 20 133 UK patients in hospital with covid-19 using the ISARIC WHO Clinical Characterisation Protocol: Prospective observational cohort study. BMJ 2020, 369, m1985. [Google Scholar] [CrossRef] [PubMed]
  4. Knight, S.R.; Ho, A.; Pius, R.; Buchan, I.; Carson, G.; Drake, T.M.; Dunning, J.; Fairfield, C.J.; Gamble, C.; Green, C.A.; et al. Risk stratification of patients admitted to hospital with covid-19 using the ISARIC WHO Clinical Characterisation Protocol: Development and validation of the 4C Mortality Score. BMJ 2020, 370, m3339. [Google Scholar] [CrossRef]
  5. Kottier, S.A.; Cavanagh, D.; Britton, P. Experimental evidence of recombination in coronavirus infectious bronchitis virus. Virology 1995, 213, 569–580. [Google Scholar] [CrossRef]
  6. Coutard, B.; Valle, C.; de Lamballerie, X.; Canard, B.; Seidah, N.G.; Decroly, E. The spike glycoprotein of the new coronavirus 2019-nCoV contains a furin-like cleavage site absent in CoV of the same clade. Antivir. Res. 2020, 176, 104742. [Google Scholar] [CrossRef]
  7. Davidson, A.D.; Williamson, M.K.; Lewis, S.; Shoemark, D.; Carroll, M.W.; Heesom, K.J.; Zambon, M.; Ellis, J.; Lewis, P.A.; Hiscox, J.A.; et al. Characterisation of the transcriptome and proteome of SARS-CoV-2 reveals a cell passage induced in-frame deletion of the furin-like cleavage site from the spike glycoprotein. Genome Med. 2020, 12, 68. [Google Scholar] [CrossRef]
  8. Cavanagh, D. Severe acute respiratory syndrome vaccine development: Experiences of vaccination against avian infectious bronchitis coronavirus. Avian Pathol. 2003, 32, 567–582. [Google Scholar] [CrossRef] [Green Version]
  9. Carroll, M.W.; Matthews, D.A.; Hiscox, J.A.; Elmore, M.J.; Pollakis, G.; Rambaut, A.; Hewson, R.; Garcia-Dorival, I.; Bore, J.A.; Koundouno, R.; et al. Temporal and spatial analysis of the 2014–2015 Ebola virus outbreak in West Africa. Nature 2015, 524, 97–101. [Google Scholar] [CrossRef] [Green Version]
  10. Quick, J.; Loman, N.J.; Duraffour, S.; Simpson, J.T.; Severi, E.; Cowley, L.; Bore, J.A.; Koundouno, R.; Dudas, G.; Mikhail, A.; et al. Real-time, portable genome sequencing for Ebola surveillance. Nature 2016, 530, 228–232. [Google Scholar] [CrossRef]
  11. Pini, A.; Zomahoun, D.; Duraffour, S.; Derrough, T.; Charles, M.; Quick, J.; Loman, N.; Cowley, L.; Leno, M.; Ouedraogo, N.; et al. Field investigation with real-time virus genetic characterisation support of a cluster of Ebola virus disease cases in Dubreka, Guinea, April to June 2015. Eurosurveillance 2018, 23, 17-00140. [Google Scholar] [CrossRef]
  12. Kato, H.; Shimizu, H.; Shibue, Y.; Hosoda, T.; Iwabuchi, K.; Nagamine, K.; Saito, H.; Sawada, R.; Oishi, T.; Tsukiji, J.; et al. Clinical course of 2019 novel coronavirus disease (COVID-19) in individuals present during the outbreak on the Diamond Princess cruise ship. J. Infect. Chemother. 2020, 26, 865–869. [Google Scholar] [CrossRef]
  13. Russell, T.W.; Hellewell, J.; Jarvis, C.I.; van Zandvoort, K.; Abbott, S.; Ratnayake, R.; CMMID COVID-19 working group; Flasche, S.; Eggo, R.M.; Edmunds, W.J.; et al. Estimating the infection and case fatality ratio for coronavirus disease (COVID-19) using age-adjusted data from the outbreak on the Diamond Princess cruise ship, February 2020. Eurosurveillance 2020, 25, 2000256. [Google Scholar] [CrossRef] [Green Version]
  14. Sabir, J.S.; Lam, T.T.; Ahmed, M.M.; Li, L.; Shen, Y.; Abo-Aba, S.E.; Qureshi, M.I.; Abu-Zeid, M.; Zhang, Y.; Khiyami, M.A.; et al. Co-circulation of three camel coronavirus species and recombination of MERS-CoVs in Saudi Arabia. Science 2016, 351, 81–84. [Google Scholar] [CrossRef] [Green Version]
  15. Kim, J.I.; Kim, Y.J.; Lemey, P.; Lee, I.; Park, S.; Bae, J.Y.; Kim, D.; Kim, H.; Jang, S.I.; Yang, J.S.; et al. The recent ancestry of Middle East respiratory syndrome coronavirus in Korea has been shaped by recombination. Sci. Rep. 2016, 6, 18825. [Google Scholar] [CrossRef]
  16. Nasir, J.A.; Kozak, R.A.; Aftanas, P.; Raphenya, A.R.; Smith, K.M.; Maguire, F.; Maan, H.; Alruwaili, M.; Banerjee, A.; Mbareche, H.; et al. A Comparison of Whole Genome Sequencing of SARS-CoV-2 Using Amplicon-Based Sequencing, Random Hexamers, and Bait Capture. Viruses 2020, 12, 895. [Google Scholar] [CrossRef]
  17. Kafetzopoulou, L.E.; Efthymiadis, K.; Lewandowski, K.; Crook, A.; Carter, D.; Osborne, J.; Aarons, E.; Hewson, R.; Hiscox, J.A.; Carroll, M.W.; et al. Assessment of metagenomic Nanopore and Illumina sequencing for recovering whole genome sequences of chikungunya and dengue viruses directly from clinical samples. Eurosurveillance 2018, 23, 1800228. [Google Scholar] [CrossRef] [Green Version]
  18. Dudas, G.; Carvalho, L.M.; Bedford, T.; Tatem, A.J.; Baele, G.; Faria, N.R.; Park, D.J.; Ladner, J.T.; Arias, A.; Asogun, D.; et al. Virus genomes reveal factors that spread and sustained the Ebola epidemic. Nature 2017, 544, 309–315. [Google Scholar] [CrossRef] [Green Version]
  19. So, R.T.Y.; Chu, D.K.W.; Miguel, E.; Perera, R.; Oladipo, J.O.; Fassi-Fihri, O.; Aylet, G.; Ko, R.L.W.; Zhou, Z.; Cheng, M.S.; et al. Diversity of Dromedary Camel Coronavirus HKU23 in African Camels Revealed Multiple Recombination Events among Closely Related Betacoronaviruses of the Subgenus Embecovirus. J. Virol. 2019, 93. [Google Scholar] [CrossRef] [Green Version]
  20. Wu, A.; Peng, Y.; Huang, B.; Ding, X.; Wang, X.; Niu, P.; Meng, J.; Zhu, Z.; Zhang, Z.; Wang, J.; et al. Genome Composition and Divergence of the Novel Coronavirus (2019-nCoV) Originating in China. Cell Host Microbe 2020, 27, 325–328. [Google Scholar] [CrossRef] [Green Version]
  21. Siu, K.L.; Yuen, K.S.; Castano-Rodriguez, C.; Ye, Z.W.; Yeung, M.L.; Fung, S.Y.; Yuan, S.; Chan, C.P.; Yuen, K.Y.; Enjuanes, L.; et al. Severe acute respiratory syndrome coronavirus ORF3a protein activates the NLRP3 inflammasome by promoting TRAF3-dependent ubiquitination of ASC. FASEB J. 2019, 33, 8865–8877. [Google Scholar] [CrossRef] [PubMed]
  22. Kanzawa, N.; Nishigaki, K.; Hayashi, T.; Ishii, Y.; Furukawa, S.; Niiro, A.; Yasui, F.; Kohara, M.; Morita, K.; Matsushima, K.; et al. Augmentation of chemokine production by severe acute respiratory syndrome coronavirus 3a/X1 and 7a/X4 proteins through NF-kappaB activation. FEBS Lett. 2006, 580, 6807–6812. [Google Scholar] [CrossRef] [PubMed] [Green Version]
  23. Karjee, S.; Minhas, A.; Sood, V.; Ponia, S.S.; Banerjea, A.C.; Chow, V.T.; Mukherjee, S.K.; Lal, S.K. The 7a accessory protein of severe acute respiratory syndrome coronavirus acts as an RNA silencing suppressor. J. Virol. 2010, 84, 10395–10401. [Google Scholar] [CrossRef] [PubMed] [Green Version]
  24. Young, B.E.; Fong, S.W.; Chan, Y.H.; Mak, T.M.; Ang, L.W.; Anderson, D.E.; Lee, C.Y.; Amrun, S.N.; Lee, B.; Goh, Y.S.; et al. Effects of a major deletion in the SARS-CoV-2 genome on the severity of infection and the inflammatory response: An observational cohort study. Lancet 2020, 396, 603–611. [Google Scholar] [CrossRef]
  25. Zhang, Y.; Li, J.; Xiao, Y.; Zhang, J.; Wang, Y.; Chen, L.; Paranhos-Baccala, G.; Ren, L.; Wang, J. Genotype shift in human coronavirus OC43 and emergence of a novel genotype by natural recombination. J. Infect. 2015, 70, 641–650. [Google Scholar] [CrossRef] [Green Version]
  26. Hewson, K.A.; Noormohammadi, A.H.; Devlin, J.M.; Browning, G.F.; Schultz, B.K.; Ignjatovic, J. Evaluation of a novel strain of infectious bronchitis virus emerged as a result of spike gene recombination between two highly diverged parent strains. Avian Pathol. 2014, 43, 249–257. [Google Scholar] [CrossRef] [Green Version]
  27. Terada, Y.; Matsui, N.; Noguchi, K.; Kuwata, R.; Shimoda, H.; Soma, T.; Mochizuki, M.; Maeda, K. Emergence of pathogenic coronaviruses in cats by homologous recombination between feline and canine coronaviruses. PLoS ONE 2014, 9, e106534. [Google Scholar] [CrossRef] [Green Version]
Publisher’s Note: MDPI stays neutral with regard to jurisdictional claims in published maps and institutional affiliations.
Figure 1. (A) Schematic diagram of the severe acute respiratory syndrome coronavirus 2 (SARS-CoV-2) genome showing the position of major open reading frames and the position of the amplicons along the genome. (B) Agarose gel electrophoresis analysis of the amplicon products resulting from RT-PCR using the designated forward and reverse primers to amplify the SARS-CoV-2 genome from RNA purified from Vero cells infected with the virus. (C) The amplicon products were purified and sequenced on a single flow cell using an Oxford Nanopore MinION. Shown are the number of reads that map (y-axis) to each amplicon across the SARS-CoV-2 genome from 5′ to 3′ (x-axis).
Viruses 12 01164 g001
Figure 2. (A) Agarose gel electrophoresis analysis of amplicons generated by RT-PCR from RNA isolated from a nasopharyngeal swab taken from patient REMRQ0001, who had coronavirus disease 2019 (COVID-19), and diagnosed positive for SARS-CoV-2 by a laboratory-based test. Primer pairs are indicated above each amplicon. (B) The amplicon products were purified and sequenced on a single flow cell using an Oxford Nanopore MinION. Shown are the number of reads that map (y-axis) to each amplicon across the SARS-CoV-2 genome from 5′ to 3′ (x-axis). (C) Agarose gel electrophoresis analysis of amplicons generated by RT-PCR from RNA isolated from a nasopharyngeal swab taken from patient REMRQ0001, who had COVID-19, and subsequently found negative for SARS-CoV-2 by a laboratory-based test. Note that the brightness of the image has been adjusted post-image capture to more clearly show amplicon products.
Viruses 12 01164 g002
Figure 3. (A,B) Agarose gel electrophoresis analysis of amplicons generated by RT-PCR from RNA isolated from a nasopharyngeal swab taken from patient REMRQ0002, who had COVID-19, and diagnosed positive for SARS-CoV-2 by a laboratory-based test. Primer pairs are indicated above each amplicon. Note that the image in (B) is the same image as (A) but the brightness has been enhanced post-image capture in order to more clearly show amplicon products. (C) The amplicon products were purified and sequenced on a single flow cell using an Oxford Nanopore MinION. Shown are the number of reads that map (y-axis) to each amplicon across the SARS-CoV-2 genome from 5′ to 3′ (x-axis).
Viruses 12 01164 g003
Figure 4. (A) Agarose gel electrophoresis analysis of amplicons generated by multiplex RT-PCR from RNA isolated from a nasopharyngeal swab taken from patients who had COVID-19 and diagnosed positive for SARS-CoV-2 by a laboratory-based test. Primer pairs are indicated above each amplicon and exemplar data from two patients (numbers 36 and 37) are shown. Note that amplicons from multiplex pool 1, for patient 36, is shown to the left as these were run on a separate gel. Also shown are negative controls and a positive control using RNA isolated from SARS-CoV-2 infected cells. (B,C) The amplicon products were purified, barcoded and sequenced on a single flow cell using an Oxford Nanopore MinION. Shown are the number of reads that map (y-axis) to each amplicon across the SARS-CoV-2 genome from 5′ to 3′ (x-axis).
Viruses 12 01164 g004
Table 1. Primer pairs by sequence order.
Primer NameSequence 5′–3′LocationSize (bp)Multiplex Pool
StartEnd
SARS-CoV-2_1_FGTGTGACCGAAAGGTAAGATGG2482699561
SARS-CoV-2_1_RTTGCATTCATTTGGTGACGC12031184
SARS-CoV-2_2_FGGTGTATACTGCTGCCGTGA94496312132
SARS-CoV-2_2_RGCCAATCAAGGACGGGTTTG21562137
SARS-CoV-2_3_FCCGCACTCTTGAAACTGCTC1912193112543
SARS-CoV-2_3_RGCAGAAGTGGCACCAAATTC31653146
SARS-CoV-2_4_FACACCACTGGGCATTGATTTAG2936295712644
SARS-CoV-2_4_RTTTCAGTAGTGCCACCAGCC41994180
SARS-CoV-2_5_FCTTCATCCAGATTCTGCCAC4052407112965
SARS-CoV-2_5_RAGCAGGTGGATTAAACTTCAACTC53475324
SARS-CoV-2_6_FCAACATTAACCTCCACACGC4990500911896
SARS-CoV-2_6_RATCAATAGCCACCACATCACC61786158
SARS-CoV-2_7_FAGAAACCTGCTTCAAGAGAGC6108612813731
SARS-CoV-2_7_RATTACAACCGTCTACAACATGCAC74807457
SARS-CoV-2_8_FGTCACTATTGCAACCTACTGTAC7091711310932
SARS-CoV-2_8_RCTTGCCGAGCTGCTGAAATA81838164
SARS-CoV-2_9_FAATCAGCGTCTGTTTACTACAGTC7929795211923
SARS-CoV-2_9_RGTGTCAGGGCGTAAACTTTC91209101
SARS-CoV-2_10_FTTGTCGTGCCTGGTTTGC8856887313034
SARS-CoV-2_10_RACGTCATCAAGCCAAAGACC1015810139
SARS-CoV-2_11_FAGTGGAGCAATGGATACAAC9917993612395
SARS-CoV-2_11_RAGCTACAGTGGCAAGAGAAG1120911190
SARS-CoV-2_12_FAGGGTACACACCACTGGTTG109951101411856
SARS-CoV-2_12_RCACCATTAGCAACAGCCTGC1217912160
SARS-CoV-2_13_FGTGAAGAAATGCTGGACAACAG120571207811801
SARS-CoV-2_13_RGCACCACCAAAGGATTCTTG1323613217
SARS-CoV-2_14_FTAGTTTAGCTGCCACAGTACG129971301712002
SARS-CoV-2_14_RAGTTAAAGCCCTGGTCAAGG1419614177
SARS-CoV-2_15_FATACGCCAACTTAGGTGAACG139621398212843
SARS-CoV-2_15_RAACATGTTGTGCCAACCACC1524515226
SARS-CoV-2_16_FTGAGTTATGAGGATCAAGATGCAC149961501912434
SARS-CoV-2_16_RGCCTGTAAGACTGTATGCGG1623816219
SARS-CoV-2_17_FCCCAGATCCATCAAGAATCCTAG159331595512145
SARS-CoV-2_17_RTGCGAGCAGAAGGGTAGTAG1714617127
SARS-CoV-2_18_FAAGGTGACTATGGTGATGCTG168411686113366
SARS-CoV-2_18_RGGTATGCCAGGTATGTCAACAC1817618155
SARS-CoV-2_19_FACTCAAACCACTGAAACAGCTC178751789612391
SARS-CoV-2_19_RGTCACTACAAGGCTGTGCATC1911319093
SARS-CoV-2_20_FAGCTAGTTGTGATGCAATCATGAC188461886912352
SARS-CoV-2_20_RCTTGTTTGGGACCTACAGATGG2009820077
SARS-CoV-2_21_FTTTGGGTGTGGACATTGCTG198421986113233
SARS-CoV-2_21_RATAGCCACGGAACCTCCAAG2116421145
SARS-CoV-2_22_FTAAGACAGTGGTTGCCTACG209122093111254
SARS-CoV-2_22_RTCTGAACTCACTTTCCATCCAAC2203622014
SARS-CoV-2_23_FTTCGAAGACCCAGTCCCTAC218952191414055
SARS-CoV-2_23_RTGGATCACGGACAGCATCAG2329923280
SARS-CoV-2_24_FTTGAACTTCTACATGCACCAGC231062312711116
SARS-CoV-2_24_RCCAGAAGTGATTGTACCCGC2421624197
SARS-CoV-2_25_FTTGCTGCTAGAGACCTCATTTG240932411411901
SARS-CoV-2_25_RGCAACTGGTCATACAGCAAAG2528225262
SARS-CoV-2_26_FGGTGACATCTCTGGCATTAATGC250612508311632
SARS-CoV-2_26_RTGCTTACAAAGGCACGCTAG2622326204
SARS-CoV-2_27_FACCAGCTGTACTCAACTCAATTG260272604911373
SARS-CoV-2_27_RCTGCTACTGGAATGGTCTGTG2716327143
SARS-CoV-2_28_FTGACCAGACCGCTTCTAGAAAG269082692911804
SARS-CoV-2_28_RGCCTCATCCACGCACAATTC2808728068
SARS-CoV-2_29_FTGTCACGCCTAAACGAACATG278762789611475
SARS-CoV-2_29_RGATTTCTTAGTGACAGTTTGGCC2902229000
SARS-CoV-2_30_FCGAATTCGTGGTGGTGACG285502856811736
SARS-CoV-2_30_R GGTGGCTCTTTCAAGTCCTC2972229703
Table 2. Analysis of deletions in the SARS-CoV-2 genome in patients with COVID-19. The columns from left to right are as follows: sample barcode, deletion start position (bp), deletion end position (bp), number of reads supporting this deletion, quality score (similar to number of reads supporting, but also takes into account read mapping quality scores with a score greater than 10 having higher confidence), standard deviation (SD) of deletion span (bp) from supporting reads, SD of deletion position (bp) from supporting reads. If the deletion interrupts a gene, these are the coordinates of the gene, the gene name, and the bp overlap with the deletion. In cases where the deletion overlaps >1 gene, the information of the second gene is provided.
Deletion InformationAffected Gene Information
Patient NumberStart (bp)End (bp)Supporting ReadsQuality ScoreSD SpanSD PosGene StartGene EndGene NameOverlap (bp)Gene2 StartGene2 EndGene2 NameOverlap2 (bp)
2219325193809104.4258.4226621555Orf1ab55
2220294204298100026621555Orf1ab135
22254172579610120.790.862539326220Orf3a379
22275782762416192.492.452739427759Orf7a46
222875628884782.273.42827429533N128
2321432198554.3673.6926621555Orf1ab55
2323752421885.5482.8526621555Orf1ab46
2325892642663.241.7826621555Orf1ab53
2326542741558.7351.8826621555Orf1ab87
23285929049102.4288.4826621555Orf1ab45
252027420383786.27.526621555Orf1ab109
25202792034010123.832.5726621555Orf1ab61
25275942764010112.3731.772739427759Orf7a46
26273862769991990.861.662739427759Orf7a3052720227387ORF61
2620274203389111.51.0226621555Orf1ab64
27270202707311130.60.32652327191M53
27275222776124291.092.042739427759Orf7a237
27276892776323273.5829.92739427759Orf7a70
2820252088557.1680.9426621555Orf1ab63
282550825568668.3161.452539326220Orf3a60
282788427934667.1927.432789428259Orf840
2927546276507814.6164.82739427759Orf7a104
2928454287316726.8958.792827429533N277
30253982577612141.5669.872539326220Orf3a378
30275552762531381.945.712739427759Orf7a70
308676872311121.7938.6126621555Orf1ab47
31284442877562771.291.312827429533N331
32254802555197991.622.042539326220Orf3a71
36202742033911131.430.8726621555Orf1ab65
3725429256411113177.892539326220Orf3a212
37254322580810125.2444.622539326220Orf3a376
372844428776890.710.652827429533N332
4327426275595519.7750.252739427759Orf7a133
432769027732662.2549.852739427759Orf7a42
43280112806213145.3677.822789428259Orf851
43281962823855296.732789428259Orf842
43284812853655364.732827429533N55
2860128718554.8243.762827429533N117

