Article

Investigation of P1/HC-Pro-Mediated ABA/Calcium Signaling Responses via Gene Silencing through High- and Low-Throughput RNA-seq Approaches

1
Institute of Biotechnology, National Taiwan University, Taipei 106, Taiwan
2
Seed Improvement and Propagation Station, Council of Agriculture, Taichung 427, Taiwan
3
Institute of Plant Biology, National Taiwan University, Taipei 106, Taiwan
4
Department of Engineering Science and Ocean Engineering, National Taiwan University, Taipei 106, Taiwan
5
Agricultural Biotechnology Research Center, Academia Sinica, Taipei 115, Taiwan
6
Center of Biotechnology, National Taiwan University, Taipei 106, Taiwan
*
Authors to whom correspondence should be addressed.
Submission received: 4 August 2021 / Revised: 16 November 2021 / Accepted: 19 November 2021 / Published: 23 November 2021
(This article belongs to the Special Issue State-of-the-Art Plant-Virus Interactions in Asia)

Abstract

:
The P1/HC-Pro viral suppressor of potyvirus suppresses posttranscriptional gene silencing (PTGS). The fusion protein of P1/HC-Pro can be cleaved into P1 and HC-Pro through the P1 self-cleavage activity, and P1 is necessary and sufficient to enhance PTGS suppression of HC-Pro. To address the modulation of gene regulatory relationships induced by turnip mosaic virus (TuMV) P1/HC-Pro (P1/HC-ProTu), a comparative transcriptome analysis of three types of transgenic plants (P1Tu, HC-ProTu, and P1/HC-ProTu) were conducted using both high-throughput (HTP) and low-throughput (LTP) RNA-Seq strategies. The results showed that P1/HC-ProTu disturbed the endogenous abscisic acid (ABA) accumulation and genes in the signaling pathway. Additionally, the integrated responses of stress-related genes, in particular to drought stress, cold stress, senescence, and stomatal dynamics, altered the expressions by the ABA/calcium signaling. Crosstalk among the ABA, jasmonic acid, and salicylic acid pathways might simultaneously modulate the stress responses triggered by P1/HC-ProTu. Furthermore, the LTP network analysis revealed crucial genes in common with those identified by the HTP network in this study, demonstrating the effectiveness of the miniaturization of the HTP profile. Overall, our findings indicate that P1/HC-ProTu-mediated suppression in RNA silencing altered the ABA/calcium signaling and a wide range of stress responses.

1. Introduction

P1/HC-Pro is the first identified viral suppressor of potyvirus and can trigger the suppression of RNA silencing in the microRNA (miRNA) and short-interfering RNA (siRNA) regulatory pathways [1,2,3]. Our previous studies indicate that the FRNK motif of HC-Pro plays an essential role in the suppression of the miRNA pathway but still suppresses 40% of the siRNA pathway [2]. Moreover, Hu et al. (2020) demonstrated that various potyviral species of P1/HC-Pro, i.e., turnip mosaic virus (TuMV), zucchini yellow mosaic virus (ZYMV), and tobacco etch virus (TEV), have the same function in RNA silencing suppression [1]. However, the P1/HC-Pro of TuMV (P1/HC-ProTu) triggers ARGONAUTE1 (AGO1) degradation, whereas those of ZYMV (P1/HC-ProZy) and TEV (P1/HC-ProTe) do not cause AGO1 degradation, which suggests that viral P1/HC-Pros exhibit functional diversity. Moreover, Sanobar et al. (2021) demonstrated that HC-ProTu inhibits HEN1 activity in miRNA 3′-end 2′-O-methylation in vitro and in vivo through the binding activity of HC-ProTu FRNK motif with HEN1 [4].
To understand P1/HC-Pro-mediated RNA silencing suppression further, a transcriptomic analysis based on transgenic Arabidopsis expressing the P1/HC-ProTu gene (P1/HC-ProTu plant) was previously performed via high-throughput (HTP) RNA sequencing (RNA-Seq) [1]. The transcriptomic profiles were subsequently analyzed through a comparative network using the ContigViews system. The network highlighted several critical gene silencing components, including AGO1, AGO2, and AGO3, as well as several miRNA targets, calcium signaling components, hormone signaling components, and defense response-related genes [1]. Hu et al. (2020) demonstrated that ethylene signaling genes in the P1/HC-ProTu plants are significantly highlighted in the gene-to-gene network and that endogenous ethylene is also highly accumulated in the P1/HC-ProTu plants [1]. Moreover, Pasin et al. (2020) showed that the P1 (P1Pp) of plum pox virus (PPV) triggers endogenous abscisic acid (ABA) accumulation in PPV-infected plants [5].
HTP RNA-Seq provides deep bioinformation; however, the abundant information obtained by RNA-Seq increases the analysis threshold for data mining and the difficulties in excluding the false-positive results generated with the low abundance gene profile. HTP RNA-Seq also has a higher cost for the deep sequencing. For example, the cost and sample determination for HTP RNA-Seq might limit the experimental design of a preliminary transcriptome study. Here, we propose the use of low-throughput (LTP) RNA-Seq in a preliminary study. The LTP RNA-Seq profiles were generated from P1/HC-ProTu-related transgenic plants and compared with the related P1/HC-ProTu-related profiles obtained previously via HTP RNA-Seq by Hu et al. [1].
In this study, we conducted the P1/HC-ProTu-related transcriptomic profiling using different logic analysis approaches to investigate the suppression mechanism further. We also performed LTP RNA-Seq of these P1/HC-ProTu-related materials and compared the networks obtained from the LTP datasets and previously published HTP profiles. The results indicate that LTP RNA-Seq has the potential to decrease the sequencing budgets and exclude genes with low expressions, which might yield a false-positive, and therefore, this approach could help researchers rapidly identify important pathways for further study.

2. Materials and Methods

2.1. Plant Materials and Transgenic Plants

Arabidopsis thaliana ecotype Col-0, three P1/HC-ProTu-related transgenic plants (P1Tu, HC-ProTu, and P1/HC-ProTu), and ago1-27 mutant were used in this study [1,6]. The Arabidopsis seeds were surface-sterilized, chilled at 4 °C for 2 days, and then sown on Murashige and Skoog (MS) medium with/without suitable antibiotics. All the plants were grown at 24 °C in a growth room with 16 h of light/8 h of dark.

2.2. cDNA Library Construction and RNA Sequencing

Ten-day-old and 14-day-old seedlings of the wild-type Col-0, P1Tu, HC-ProTu, and P1/HC-ProTu plants were used for the collecting samples for HTP and LTP whole-transcriptome deep sequencing, respectively. Three biological replicates of all the wild-type Col-0, P1Tu, HC-ProTu, and P1/HC-ProTu samples were included in this study, and each biological replicate consisted of 25–30 seedlings. Total RNA was extracted from the seedlings using a silica-gel membrane system (Viogene, New Taipei City, Taiwan). The mRNAs for LTP sequencing were isolated using the poly(A) mRNA magnetic isolation module (New England Biolabs, San Diego, CA, USA). All RNA sequencing libraries were constructed by using the cDNA library kit (Invitrogen Thermo Fisher Scientific, Waltham, MA, USA) according to the manufacturer’s instructions. Twelve cDNA libraries were constructed with three biological replicates of each sample. For HTP sequencing, the sequencing was accomplished by paired-end (2 × 125) strand-specific HiSeq sequencing (Illumina, San Diego, CA, USA), whereas for LTP, the sequencing was accomplished through paired-end (2 × 75) strand-specific MiSeq sequencing (Illumina) by next-generation sequencing (NGS) at the High Throughput Genomics Core of Academia Sinica. The clean reads were trimmed to filter out the adapters and the low-quality reads by using CLC Genomic Workbench (Qiagen, Hilden, Germany). The sequences of the coding regions in the whole Arabidopsis transcriptome were then mapped, and the reads were counted by using Bowtie 2 version 2.2.5 [7] and eXpress version 1.1.5 [8]. The raw RNA-Seq data of the HTP and LTP profiles are available at the National Center for Biotechnology Information Short Reads Archive (NCBI SRA) accession number SRR16916514-SRR16916533 and SRR16916443-SRR16916454 at the following URL: https://0-www-ncbi-nlm-nih-gov.brum.beds.ac.uk/Traces/study/?acc=PRJNA779609 and https://0-www-ncbi-nlm-nih-gov.brum.beds.ac.uk/Traces/study/?acc=PRJNA779601 respectively (accessed on 11 November 2021).

2.3. Differential Gene Expression Analysis and Functional Annotation

The transcriptome was analyzed using the ContigViews system (www.contigviews.bioagri.ntu.edu.tw, accessed on 11 November 2021) of the NGS core of National Taiwan University. The transcript abundances were based on read counts normalized to FPKM (fragments per kilobase per million). For the HTP expressional network analysis, the differentially expressed genes (DEGs) between the comparative Col-0 and P1/HC-ProTu-related datasets were identified based on an 80% passing rate, and genes with twofold log10 FPKM values less than 1.14 were filtered out. Due to the difference in the sequencing coverages achieved with HTP and LTP, different parameters were used in the ContigViews analysis. The LTP datasets were analyzed using appropriately adjusted parameter settings for the correlation thresholds during the construction of the expressional correlational networks. At least 10 samples from the Col-0, P1Tu, HC-ProTu, and P1/HC-ProTu profiles were selected to calculate the Pearson correlation based on a 0.975 threshold for a positive correlation and a 0.925 threshold for a negative correlation. For the LTP expressional network analysis, DEGs were identified using an 80% passing rate and a fold-change of 2, and the LTP networks were then constructed using thresholds of 0.95 and 0.90 for positive and negative correlations, respectively.

2.4. Quantification of Endogenous ABA and ABA Sensitivity Assay

Ten-day-old Arabidopsis seedlings (20–25 seedlings, approximately 60 mg for each extraction) were freshly collected and ground into fine powder with a tissue grinder pestle in a tube with liquid nitrogen. Fifty microliters of working solution (methanol) containing 0.5 ng of d6-ABA were added as a standard to each tube. After the addition of 500 µL of extraction solvent (2-propanol/H2O/concentrated HCl, 2:1:0.002), the tube was shaken at 100 r.p.m. and 4 °C for 30 min. Subsequently, 1 mL of dichloromethane was added to each tube, and the tube was shaken for another 30 min and centrifuged at 13,000× g and 4 °C for 5 min. Nine hundred microliters of the lower phase were transferred to a new tube, and the solvent was concentrated using a rotary evaporator (EYELA CVE-3110). An ultra-performance LC/ESI-qMS/MS analysis was conducted by the Metabolomic Core Facility at the Agricultural Biotechnology Research Center, Academia Sinica, Taiwan. A HALO C18 (Advanced Materials Technology, Inc., Wilmington, DE, USA) column (inner diameter, 2.1 mm; column length, 75 mm; particle size, 2.7 μm) was used, and gradient elution was performed with water and 0.05% glacial acetic acid (solvent A) and acetonitrile with 0.05% glacial acetic acid (solvent B) at a constant flow rate of 0.6 mL min−1. The following gradient profile was applied: t (min), % A): (0, 99), (2.20, 0), (2.40, 0), (2.60, 99), (3, 99). The MS and MS/MS experiments were performed with an API 3000 triple quadrupole mass spectrometer (PE Sciex, Concord, Ont., Canada) with the following parameters: temperature of 400 °C, nebulizer gas (N2) 10 (arbitrary units), curtain gas (N2) 12 (arbitrary units), collision gas (N2) 4 (arbitrary units), and the capillary voltage of −3.5 kV. The mass spectrometer was operated in multiple reaction mode (MRM). To germinate seeds for the ABA sensitivity assay, Arabidopsis seeds were sterilized and spread on the MS medium with or without 0.11 µM ABA, and the growth conditions were observed at 7 days after germination.

2.5. Real-Time Quantitative PCR

qRT-PCR was performed to validate the expression patterns of selected DEGs in the HTP network. Total RNA was extracted from each biological replicate of the Col-0, P1/HC-ProTu, and P1/HC-ProZ plants (each replicate consisted of 25–30 seedlings) using a plant total RNA extraction miniprep system (Viogene-Biotek Corporation, New Taipei City, Taiwan). The obtained RNA was treated with a TURBO DNA-free Kit (Ambion Thermo Fisher Scientific, Waltham, MA, USA) and then subjected to phenol/chloroform extraction and alcohol precipitation to remove contaminating genomic DNA. First-strand cDNA was synthesized using MMLV reverse transcriptase (Invitrogen, Carlsbad, CA, USA). Gene-specific primers for the DEGs were designed using Primer3Plus [9]. The primer sets of OZF1_qPCR_F1 (5′-CGGATTCGTAAACCGGAGTGTCTG-3′) and OZF1_qPCR_R1 (5′-GAGGAATCTCCCTCGAATCATCGATTATG-3′) for OZF1, MYB44_qPCR_F1 (5′-GGAGTTGGGAGAATCGAGTAGACAAAGTG-3′) and MYB44_qPCR_R1 (5′-CGTCACTACGTCCCCAGCTCTC-3′) for MYB44, MYB96_qPCR_F1 (5′-GCTCTACAACACTCTTTTCCCCTTTTGG-3′) and MYB96_qPCR_R1 (5′-GCATAACCATATGAGCCACAAAGTGAAAC-3′) for MYB96, ABF4_qPCR_F1 (5′-TGGTGCAAATGAGGCCATGATTGG-3′) and ABF4_qPCR_R1 (5′-GGCAAAACAAATCATGCAGTGTACCTG-3′) for ABF4, IQM4_qPCR_F1 (5′-GCCTTGTCAACTTAACTCACCAAGAAGTG-3′) and IQM4_qPCR_R1 (5′-CCTTGGGCATTTCACCTAAACCAGAAG-3′) for IQM4, CaLB_qPCR_F1 (5′-TCCTTGGTTTTGTGTGTTCATCATCCTC-3′) and CaLB_qPCR_R1 (5′-GCGATGATTATACGCCGATAAGTTCCG-3′) for CaLB, CPK28_qPCR_F1 (5′-CGCAGCAAAACAAAGAGAGAAAGTGG-3′) and CPK28_qPCR_R1 (5′-ATTCAGGGAATGCCACGTGTCCTC-3′) for CPK28 and P_Actin2 (5′-CCTCAATCTCATCTTCTTCCGCTC-3′) and M_Actin2 (5′-AGCATCATCTCCTGCAAATCCAGC-3′) for ACT2 were used for expressional detection. The qRT-PCR assays were performed using the Light Cycler 480 System (Roche) with the KAPA SYBR FAST qPCR Master Mix (2×) Kit (Sigma-Aldrich, St. Louis, MO, USA). Three biological replicates and three technical replicates were included in the assays. The expression levels of ACT2 were used as the internal control, and normalized mRNA expression levels were calculated using the formula 2−ΔCt.

2.6. Expression-Based Heatmaps and Principal Component Analysis (PCA)

The identified DEGs were functionally annotated based on their sequence similarities with known protein annotations in the public TAIR database (www.arabidopsis.org, accessed on 11 November 2021). Heatmaps of DEG expressions were generated with the ClustVis web tool [10]. PCA was performed using the PCA method of the decomposition module in the scikit-learn package of Python. The principal component (PC) scores were plotted with the Matplotlib package. The PCA analysis was performed using the FPKM values for all the transcripts obtained from individual replicates. Thus, the PCA-based comparison of gene expression was performed using 24 libraries of the 4 Col-o, P1Tu, HC-ProTu, and P1/HC-ProTu samples from the HTP and LTP datasets.

3. Results

3.1. P1/HC-ProTu Suppressor Triggers Plant Defense Responses

The comparative analyses of the HTP RNA-Seq profiles of Col-0 vs. P1/HC-ProTu, Col-0 vs P1Tu, and Col-0 vs. HC-ProTu sets revealed 1601, 559, and 777 DEGs, respectively (Table 1). These DEGs were then used for a network analysis using the ContigViews system, which revealed 662, 106, and 162 genes in the networks, respectively (Table 1). A Venn diagram showed that 29 of the network genes were found in all three comparative sets (Figure 1A). The P1/HC-ProTu-only section contained a markedly higher number of network genes (553), whereas the P1Tu-only and HC-ProTu-only sections contained only 18 and 24 genes, respectively (Figure 1A).
To elucidate the functions of the unique genes in the P1/HC-ProTu-only, P1Tu-only, and HC-ProTu-only sections further, we performed gene annotation and functional classification. Unique genes with functions related to stress-responses, cell growth, and plant development were predominantly enriched in the P1/HC-ProTu-only section in addition to unknown or unclassified functional genes (Figure 1B). Similar gene functional classification results were found for the P1Tu-only and HC-ProTu-only sections, although only 18 and 24 genes were identified in these two sections, respectively (Figure 1A). A high abundance of network genes in the P1/HC-ProTu-only section were classified as being involved in ABA phytohormone and calcium signaling pathways (Figure 1A).

3.2. P1/HC-ProTu Alters ABA-Induced Immune Responses

ABA plays pivotal roles in seed germination and stress tolerance [11]. Several studies demonstrate that abiotic stresses increase ABA and Ca2+ concentrations in the cytosol and induce signaling to modulate common target proteins (Figure 2A) [12]. We found 41 genes belonging to the ABA signaling pathway that could be further classified into the ABA homeostasis, ABA signaling regulation, and ABA response categories (Figure 2A and Table 2). Among these genes, PMI1/MEE31 (AT3G02570) and SULTR3;1 (AT3G51895) that belong to the ABA positive biosynthesis regulator were respectively repressed and induced in the P1/HC-ProTu plants (Figure 2A(panel i),B). The expression of both CYP707A3 (AT5G45340), involved in ABA catabolism, and DTX50 (AT5G52050), involved in ABA transport, was induced in the P1/HC-ProTu plants (Figure 2A(panel ii and iii),B). As for the ABA signaling regulation, RCAR/PYLs, PP2C, and SRNK2, the core components of ABA signaling transduction, were not differentially expressed in our study, even though several negative regulators (e.g., ATL27/ATARRE (AT5G66070), PUB22 (AT3G52450), RDUF1 (AT3G46620), RDUF2 (AT5G59550), and HB12 (AT3G61890)), which inhibit RCAR/PYL and PP2C expressions either transcriptionally or posttranscriptionally, had an induced expression pattern in the P1/HC-ProTu plants (Figure 2A(panel iv and v),B).
ABA response genes accounted for the highest proportion of the genes involved in the ABA signaling pathway found in the P1/HC-ProTu-only section and could be divided into the biotic stress response, development, drought stress response, cold stress response, and senescence subcategories (Figure 2A(panel vi and vii) and Table 2). Almost all of these ABA response genes were expressed at a higher level in the P1/HC-ProTu plants than in Col-0, P1Tu, and HC-ProTu plants (Figure 2B). Induced expressions of these ABA response genes might change plant resistance to drought stress, cold stress, and leaf senescence in response to P1/HC-ProTu. These results revealed that the regulation of the ABA signaling pathway was disrupted, and its responses might be severely interfered with overexpressing P1/HC-ProTu.

3.3. Quantification of Endogenous ABA and ABA Sensitivity Assay

To examine ABA accumulation in the P1/HC-ProTu plants, the 10-day-old seedlings were extracted and measured by MS/MS analysis. A significantly lower ABA amount was detected in the P1/HC-ProTu seedlings than in the Col-0 (Figure 3A). To test the effects of ABA on the P1/HC-ProTu seedlings further, an ABA sensitivity assay was carried out to observe the phenotypical changes with seed germination. P1/HC-ProTu plays a major role in PTGS suppression by triggering AGO1 degradation [1]. Therefore, ago1-27 mutant was also used for the ABA sensitivity assay. Without ABA treatment, the seeds of Col-0 were germinated and developed into true-leaf seedlings at phase IV, while seeds of the P1/HC-ProTu plants and ago1-27 mutant were more late-germinated or delayed-growth at phase I, II, and III (Figure 3B), suggesting that the germination rate and post-germination growth were greatly delayed in the P1/HC-ProTu plants and ago1-27 mutant. With exogenous ABA treatment, the delayed-germination phenotype became more severe in the P1/HC-ProTu plants and ago1-27 mutant than in the Col-0 (Figure 3B). Specifically, more than half of the P1/HC-ProTu seeds remained at phases I and II, which indicated that the P1/HC-ProTu plants exhibited a higher sensitivity to ABA during seed germination.

3.4. P1/HC-ProTu Triggers Immune Responses in a Calcium-Dependent Manner

We found that the genes in the P1/HC-ProTu-only section encode various Ca2+ transporters, including Ca2+ channels [CMCU (AT5G66650), CNGC2 (AT5G15410), and CNGC14 (AT2G24610)], Ca2+ co-transporter [CCX2 (AT5G17850)], and Ca2+ pump [ACA1 (AT1G27770)] (Figure 4A(panel i) and Table 3). We also identified several Ca2+ sensors, including Ca2+/calmodulin (CaM), CaM-like (CaML) (Figure 4A(panel ii)), calcium binding proteins (Figure 4A(panel iii)), calmodulin-binding proteins (Figure 4A(panel iv)), and CDPKs/CIPKs (Figure 4A(panel v) and Table 3). The members of the various families of Ca2+ sensors identified in the P1/HC-ProTu-only section were expected to contribute to the conversion of Ca2+ signals into either cellular stress responses or developmental processes (Figure 4A(panel vi and vii)). For instance, the expressions of genes encoded calmodulin-binding proteins, including CAMBP25 (AT2G41010) and IQM4 (AT2G26190), whose gene expressions are induced by drought and salt/osmotic stress. CPK32 (AT3G57530) and CPK28 (AT5G66210) encode calcium-dependent protein kinases that regulate plant growth in addition to resetting pathogen-associated molecular pattern (PAMP)-induced defense signaling. The majority of genes involved in the Ca2+ signaling pathway were expressed at higher levels in the P1/HC-ProTu plants than in the Col-0, P1Tu, and HC-ProTu plants (Figure 4B) except for CNGC2 (AT5G15410), which suggests that the induction of the calcium signaling pathway depends on ectopic-expressing P1/HC-ProTu. In summary, the results indicate that P1/HC-ProTu might trigger various stress responses and developmental processes through the calcium signaling pathway.

3.5. Validation of DEGs in the ABA and Ca2+ Pathways

The expression patterns of several candidate genes in the ABA and Ca2+ signaling pathways were validated by qPCR. In addition to the Col-0 and P1/HC-ProTu plants, P1/HC-ProZy plants were also included in gene expressional validation. Compared with the ovate leaves of the Col-0 plants, the serrated-leaf phenotype was observed in the P1/HC-ProTu and P1/HC-ProZy seedlings, which implies common PTGS suppression effects induced by the heterogeneous P1/HC-Pros. (Figure 5). Four ABA response genes (ABF4, MYB44, MYB96, and OZF1) exhibited similar expression patterns with higher transcripts in the P1/HC-ProTu plants, consistent with the HTP RNA-Seq profiles. Moreover, the expression levels of the selected genes were also highly induced in the P1/HC-ProZy plants (Figure 6A–D). Additionally, CaLB, IQM4, and CPK28 involved in the Ca2+ signaling pathway showed similar qRT-PCR results to those of the ABA response genes (Figure 6E–G). The qRT-PCR results indicate that the overall expressions of genes in the ABA and Ca2+ signaling pathways were consistent in the P1/HC-ProTu and P1/HC-ProZy plants.

3.6. P1/HC-ProTu Triggers Drought Response and Stomatal Closure

Our data mining of the P1/HC-ProTu-only section revealed 66 drought stress-related genes, e.g., MYB96 (AT5G62470), MYB44 (AT5G67300), NF-YA5 (AT1G54160), ANAC029 (AT1G69490), and TZF1 (AT2G25900), that were highly enriched in terms annotated to drought stress responses (Table 4). Among them, 21 and 4 genes were found to be involved in either the ABA or Ca2+ signaling pathway, respectively (Table 4). Notably, four regulatory modules composed of 15 drought response genes that function in controlling stomatal guard cell dynamics were identified (Figure 7A and Table 4). Genes in these regulatory modules could induce ABA/Ca2+-mediated stomatal closure, salicylic acid (SA)- or jasmonic acid (JA)-mediated stomatal opening, starch degradation-mediated rapid stomatal reopening, and guard cell division to influence stomatal development (Figure 7A). The mechanisms through which these genes are controlled and the involvement of phytohormones and environmental stimuli that are involved in the regulation of stomatal dynamics are explained below.
In the ABA/Ca2+-mediated stomatal closure modulation (Figure 7A(panel i)), genes such as WRKY46 (AT2G46400) and RZPF34/CHYR1 (AT5G22920) function in the response to ABA and to water deficit stress (Figure 5A). However, several genes, such as JAZ2, MYC2, and ANAC019 (AT1G74950, AT1G32640, and AT1G52890), modulate stomatal reopening after microbe-associated molecular pattern (MAMP)-mediated stomatal closure and activate the JA pathway upon bacterial infection (Figure 7A(panel ii)). Similarly, stomatal reopening is modulated by either the SA-mediated pathogen infection signaling pathway (Figure 7A(panel ii)) or light-induced starch degradation by the glucan hydrolase β-AMYLASE1, which is encoded by BAM1 (AT3G23920), to promote rapid stomatal opening (Figure 7A(panel iii)). All the DEGs in the three modulations showed greater induced expression levels in the P1/HC-ProTu plants than in the Col-0, P1Tu, and HC-ProTu plants (Figure 7B).
Moreover, the stress responses induced by P1/HC-ProTu could affect the regulatory mechanisms of stomatal development and lead to stable long-term adaptations to stress (Figure 7A(panel iv)). Induced expression of the negative regulator EPF2 (AT1G34245) and the positive regulator TMM (AT1G80080) might affect the asymmetric divisions of guard mother cells (Figure 7B). An accumulation of AGL16 (AT3G57230) with silent mutations (AGL16m) in the miR824 recognition site reportedly promotes the development of higher-order stomatal complexes by increasing the number of additional divisions in meristemoid cells [13]. With the exceptions of EPE2 and TMM, all of these genes were expressed at higher levels in the P1/HC-ProTu plants than in the Col-0, P1Tu, and HC-ProTu plants (Figure 7B). Overall, the results indicate that the integration of ABA, calcium, and other hormone signals could simultaneously trigger dynamic closure and opening mechanisms during drought stress or biotic stress in the P1/HC-ProTu plants.

3.7. P1/HC-ProTu Stimulates Cold Response and Leaf Senescence

Twenty cold response genes were identified in the P1/HC-ProTu-only section obtained from of the HTP profiles (Table 5). All of these genes showed higher expression levels in the P1/HC-ProTu plants that were different from those found in the Col-0, P1Tu, and HC-ProTu plants (Figure 8A). Because a transient increase in cytosolic Ca2+ levels is detected within seconds of cold shock [14], several annotated cold-related genes in our dataset, including CBF2 (AT4G25470), CEJ1/DEAR1 (AT3G50260), ZAT10 (AT1G27730), and ZAT12 (AT5G59820), were found to be involved in the cold stress-induced Ca2+ signature (Table 5). Moreover, seven of the cold-response genes were involved in the drought stress response (Table 5), which indicates that the gain of P1/HC-ProTu function may suggest overlaps between the gene regulatory mechanisms underlying enhancement to cold and drought tolerance. However, there were still many cold-response genes that were independent of the ABA/Ca2+ signaling pathways, suggesting that P1/HC-ProTu could stimulate a cold response via other regulating mechanisms.
Although leaf senescence is a general developmental program, it can be induced by abiotic and biotic stresses through the transcriptional control of senescence-related transcription factors [15]. Twenty-five genes annotated as being involved in leaf senescence, cell death, and chlorophyll degradation were identified in the P1/HC-ProTu-only section (Table 6). Among these genes, the WRKY22 (AT4G01250) and ERF014 (AT1G44830) transcription factor-encoding genes function in mediating dark-induced senescence [16,17]. Chlorophyll degradation is one of the most visually apparent phenomena that occurs during leaf senescence [18,19]. The leaf degreening process appears to be promoted by genes involved in the ABA signaling pathway [ABF4 (AT4G24390)] as well as in the JA [ANAC019 (AT1G52890)] and GA [ANAC029 (AT1G69490)] signaling pathways. Developmentally controlled programmed cell death occurs at the terminal stage of leaf senescence [18] The identified NUDT7 (AT4G12720) and CAD1 (AT1G29690) genes might play distinct roles in plant immunity related to the regulation of programmed cell death [20,21]. With the exceptions of APD7 (AT5G02760) and AT2G44670, all of these genes were expressed at higher levels in the P1/HC-ProTu plants than in the Col-0, P1Tu and HC-ProTu plants (Figure 8B). Taken together, our results suggest that cold tolerance, chloroplast degradation, and leaf senescence are likely to serve as key responses in the P1/HC-ProTu plants.

3.8. Comparison of the HTP and LTP Profiles

We then compared the data mining efficiency of the LTP profile (~2 M reads) with that of the HTP profile (~ 20 M reads). A total of 21.94 to 24.66 M clean reads were generated from all the samples for the HTP profiles, and these exhibited an average mapping rate of 79.2% to the coding DNA sequence (CDS) (Table 7). Approximately one-tenth of the total sequencing depth was used to construct the LTP profiles; thus, the LTP profiles contained 1.89 to 2.96 M clean reads obtained from 1.97 to 3.10 M raw reads (Table 7). The average mapping rate of the LTP profiles was 78.5%, which was close to that found for the HTP profiles (Table 7). The equivalent mapping rates obtained for the HTP and LTP libraries indicate that the mapping ability of the RNA-Seq reads does not depend on the RNA-Seq depth.
We then performed a PCA of the HTP and LTP profile data (Figure 9A). The top two PCs explained 75.7% of all differences among the three varieties, and PC1 accounted for 63.0%, which suggested that PC1 can distinguish between the HTP and LTP profiles (Figure 9A). We also noted that biological replicates of the HTP profiles were more consistent than those of the LTP profiles (Figure 9A). Furthermore, the PCA clustering of the HTP data corresponded to the morphological phenotypes: the Col-0 and P1Tu plants had identical normal developmental phenotypes, whereas the HC-ProTu and P1/HC-ProTu plants had a serrated leaf phenotype. In contrast, PC2 explained only 12.7% of the overall differences but was most likely to distinguish the P1/HC-ProTu samples from the other samples (Figure 9A). In addition, based on PC2, the clustering of the P1/HC-ProTu samples distinctly differed from that of the other samples, and this finding was obtained for both the HTP and LTP profiles.
We compared the Col-0 vs. P1/HC-ProTu plant samples, and the results revealed 75 common genes, which were shown in the intersection area of the networks obtained with the HTP and that obtained with the LTP profiles (Figure 9B and Table 8). These genes were characterized as being involved in ABA/Ca2+ signaling pathways, drought or cold stress responses, senescence, and gene silencing and RNA regulation (Table 8). We also found that the 75 common genes were located at identical positions in the HTP and LTP networks for comparison (Figure 9C,D). Moreover, the HTP and LTP profile-based networks of the 75 common genes revealed 132 and 159 gene-gene correlations for the HTP and LTP profiles, respectively (Figure 9C,D). However, we observed that connections associated with the positive and negative correlations were not 100% identical between the HTP and LTP profiles (Figure 9C,D). Twenty-six correlations (19.7%), including 25 positive connections and one negative connection, among the 30 common genes in the HTP network remained conserved in the LTP network. Furthermore, the heatmaps of the 75 common genes in the HTP and LTP profiles exhibited similar expression patterns, and the expressions of these genes were upregulated in the P1/HC-ProTu plants (Figure 10).

3.9. Functional Classification of the DEGs Identified from the LTP Profile

A total of 188, 234, and 193 network genes were identified in the Col-0 vs. P1/HC-ProTu, Col-0 vs. P1Tu, and Col-0 vs. HC-ProTu LTP comparison sets, respectively, whereas the corresponding HTP comparison sets contained 553, 18, and 24 network genes, respectively (Table 1). The LTP dataset revealed equivalent gene numbers among the three comparison sets, whereas the HTP dataset showed a higher abundance of network genes in the Col-0 vs. P1/HC-ProTu comparison. A Venn diagram was generated to determine the unique and shared genes among the Col-0 vs. P1/HC-ProTu, Col-0 vs. P1Tu, and Col-0 vs. HC-ProTu comparison sets. Sixty-nine shared network genes were identified from the three comparison sets of the LTP profiles (Figure 11A). Adequate gene numbers were also obtained in the P1/HC-ProTu-only (96 genes), P1Tu-only (121 genes), and HC-ProTu-only (79 genes) sections (Figure 11A). Moreover, functional characterization revealed that genes involved in stress responses, plant development processes, and the calcium signaling pathway were abundant in the P1/HC-ProTu-only section obtained with the LTP profiles, which are similar to the results obtained from the functional characterization of genes in the P1/HC-ProTu-only section based on the HTP profiles (Figure 1B and Figure 11B). Notably, the P1Tu-only and HC-ProTu-only sections obtained from the HTP and LTP profiles were not significantly identical (Figure 1B and Figure 11B).

4. Discussion

4.1. P1/HC-ProTu Alters ABA and the Other Hormones Accumulations

Multiple plant hormones are reported to respond to P1/HC-Pros [1,5]. Endogenous ethylene is maintained at a higher level in the P1/HC-ProTu plants, and the comparative network of Col-0 vs. P1/HC-ProTu also highlighted critical genes in various hormone signalings (e.g., JA, ethylene, and ABA) [1]. Hu et al. (2020) also proposed that the serrated leaf phenotype of the P1/HC-ProTu plants might relate to the endogenous auxin accumulation [1]. These studies implied a comprehensive alternation among different hormone pathways that occurred in response to P1/HC-Pros. Consequently, the coordinated modulations or crosstalk of hormone responses could possibly be interfered by P1/HC-Pros and cause changes in growth and immunity responses.
In this study, the ABA signaling pathway was fundamentally changed in the P1/HC-ProTu plants. For example, P1/HC-ProTu triggered the ABA negative regulator up-regulation and interfered with ABA positive regulator expressions for the ABA homeostasis and signaling regulation, resulting in low abundant endogenous ABA in the P1/HC-ProTu plants. Surprisingly, the ABA response genes were mostly induced in the P1/HC-ProTu plants (Figure 2), implying that the PTGS suppression might alter these gene expressions. Indeed, the endogenous AGO1 was degraded in the P1/HC-ProTu plants [1], which also showed ABA-sensitivity in seed germination as ago1-27 mutants, suggesting that AGO1 deficiency might disrupt ABA sensing and ABA responses. However, not P1/HC-Pros of all viral species have the same effect in ABA pathway regulation. Pasin et al. (2020) show that P1Pp increases the amounts of ABA [5], which is conflicted with the ABA profile of P1/HC-ProTu. Our explanation is the sequence divergence of P1Pp and P1Tu, which showed only 19.35% amino acid identity, resulting in the difference in endogenous ABA accumulation.

4.2. P1/HC-ProTu Might Alter ABA and Calcium Signaling Crosstalk during Stomatal Closure and Drought Stress

Abiotic stress and biotic stress can initiate ABA signaling pathways that lead to many molecular and cellular responses [22,23]. Among the ABA-induced stress response genes, those controlling stomatal closure and opening are important during drought conditions [24], and stomatal immunity plays an important role in the restriction of pathogen entry [24]. Thus, stomatal movement serves as a platform for crosstalk between biotic and abiotic stress responses involving ABA action. Studies reporting Ca2+ oscillations elicited by stimulating ABA and the temporal dynamics of Ca2+ in ABA signaling provide strong evidence showing that Ca2+ is a crucial element in the ABA signaling network [25]. The integration of ABA and calcium signalings could govern PP2C-type phosphatase regulators in the responses to abiotic stresses via the modulation of common targets [12]. Our comparative transcriptome profiles demonstrated that upregulated Ca2+-related genes in the P1/HC-ProTu plants were associated with ABA signaling (Figure 2 and Figure 3; and Table 4 and Table 5). The integration of both ABA and Ca2+ signaling processes might occur and simultaneously induce stress responses to P1/HC-ProTu during exposure to drought/cold stress responses and particularly stomatal dynamics. Interestingly, an antagonistic regulatory mechanism controls stomatal movement via crosstalk among ABA, JA, and SA when pathogen effectors, i.e., P1/HC-ProTu, ingress into host tissues to induce a rapid defense response (Figure 5A). In addition, the P1/HC-ProTu plants exhibited upregulated genes associated with SA and brassinosteroid (BR) signaling, including NPR3 (AT5G45110), which is involved in the negative regulation of defense responses against bacteria [26], and BAR1 (AT5G18360) and BKI1 (AT5G42750), which have Ca2+-dependent functions [27]. These results provided possible links among ABA, other phytohormones, and the secondary messenger calcium in stimulus-response reactions of the P1/HC-ProTu plants.

4.3. The LTP NGS Strategy Enables the Collection of a Miniature of the HTP Sequencing Data

RNA silencing in plants prevents virus accumulation [28,29], and accordingly, viruses have evolved various strategies to counteract this defense. Viral silencing of suppressor proteins blocks the production of siRNAs or the ability of siRNAs to reach their targets [30,31]. Previous studies proposed models for interfering with viral suppressors in endogenous silencing that contribute to viral symptom development [32,33]; however, the link between plant physiology and the underlying molecular mechanisms remains unclear. NGS technology enables an understanding of the roles of viral suppressors in stress responses and gene silencing mechanisms. Recently, a HTP transcriptome was applied in studies of the mechanism of virus-infected plant cells, and this approach enables a more accurate determination of plant-virus interactions [34,35]. Using a combination of microarray and RNA-Seq data, researchers can identify the molecular mechanisms and physiological alterations that might contribute to viral symptom development during acute infection [36]. Pasin et al. (2020) demonstrated that ABA can control RNA biology, including RNA stability, turnover, maturation, and translation, in viral suppressor transgenic plants [5].
Compared with the HTP NGS, LTP NGS represents a more economical approach for transcriptome studies due to the pooling of additional sample libraries. In this study, the DEGs identified using the LTP profiles could reflect the essence of the HTP profiles because we performed sequencing at only one-tenth of the sequencing depth used in the HTP analysis. The important genes correlated with drought stress, cold stress, senescence, and the RNA silencing pathway were accurately identified with the LTP dataset. Seventy-five network genes were identified with both the HTP and the LTP profiles, and these network genes included gene encoding PTGS components (i.e., AGO1 and AGO2) and miRNA targets (i.e., SPL3, SPL13A; CSD1, CSD2, CCS, and TOE2). These results imply that the LTP strategy has a certain level of accuracy with respect to transcriptome analysis. However, the Pearson correlation coefficients were not 100% identical between the HTP and LTP profiles. A low number of genes might be excluded in the LTP analysis, which would lead to differences in matrix genes and thus differences in the Pearson correlation coefficients between the HTP and LTP profiles. Therefore, we recommend that the LTP approach can be used in preliminary or primary studies to identify critical genes and to identify a backbone network before a more in-depth HTP approach is considered.

5. Conclusions

By using comparative networks from the HTP RNA-Seq profiles, it revealed that P1/HC-ProTu can trigger multiple phytohormone-mediated stress responses, especially the regulatory signaling pathways controlled by ABA/Ca2+. Upon stimulation by P1/HC-ProTu, expression changes of genes involved in various cellular processes, such as drought and cold stress responses, stomatal dynamics, senescence, cell death, and chlorophyll degradation, were linked to viral suppressor induced responses. The P1/HC-ProTu-mediated ABA disturbances via PTGS suppression might alter these gene expressions. Using a LTP NGS approach, we can simulate the HTP network for studying the P1/HC-ProTu-mediated PTGS suppression.

Author Contributions

Conceptualization, S.-S.L.; methodology, Y.-L.H., Y.-H.C., W.-L.W., and Z.-J.P.; investigation, Y.-H.C., H.-P.W., Q.-W.S., T.H.P., C.-K.H., and Z.-J.P.; data curation, S.-S.L. and Z.-J.P.; writing—original draft preparation, S.-S.L. and Z.-J.P.; writing—review and editing, S.-S.L. and Z.-J.P.; supervision, S.-S.L.; visualization, Z.-J.P. All authors have read and agreed to the published version of the manuscript.

Funding

This research was funded by the Ministry of Science and Technology (MOST) of Taiwan (MOST 108-2311-B-018-MY3), Joint Center for Instruments and Researches, College of Bioresources and Agriculture, NTU (110KKZT69A), and CH Biotech Company (110HT654004).

Institutional Review Board Statement

Not applicable.

Informed Consent Statement

Not applicable.

Data Availability Statement

The data presented in this study are available on request from the corresponding author.

Acknowledgments

We acknowledge the deep sequencing technology from the High Throughput Sequencing Core of Academia Sinica. We also thank the service of LC/MS analysis by the Metabolomic Core Facility, in the Agricultural Biotechnology Research Center, Academia Sinica, Taiwan.

Conflicts of Interest

The authors declare no conflict of interest.

References

  1. Hu, S.F.; Wei, W.L.; Hong, S.F.; Fang, R.Y.; Wu, H.Y.; Lin, P.C.; Sanobar, N.; Wang, H.P.; Sulistio, M.; Wu, C.T.; et al. Investigation of the effects of P1 on HC-pro-mediated gene silencing suppression through genetics and omics approaches. Bot. Stud. 2020, 61, 22. [Google Scholar] [CrossRef]
  2. Kung, Y.J.; Lin, P.C.; Yeh, S.D.; Hong, S.F.; Chua, N.H.; Liu, L.Y.; Lin, C.P.; Huang, Y.H.; Wu, H.W.; Chen, C.C.; et al. Genetic analyses of the FRNK motif function of Turnip mosaic virus uncover multiple and potentially interactive pathways of cross-protection. Mol. Plant Microbe Interact. 2014, 27, 944–955. [Google Scholar] [CrossRef] [PubMed] [Green Version]
  3. Wu, H.W.; Lin, S.S.; Chen, K.C.; Yeh, S.D.; Chua, N.H. Discriminating mutations of HC-Pro of zucchini yellow mosaic virus with differential effects on small RNA pathways involved in viral pathogenicity and symptom development. Mol. Plant Microbe Interact. 2010, 23, 17–28. [Google Scholar] [CrossRef] [Green Version]
  4. Sanobar, N.; Lin, P.C.; Pan, Z.J.; Fang, R.Y.; Tjita, V.; Chen, F.F.; Wang, H.C.; Tsai, H.L.; Wu, S.H.; Shen, T.L.; et al. Investigating the Viral Suppressor HC-Pro Inhibiting Small RNA Methylation through Functional Comparison of HEN1 in Angiosperm and Bryophyte. Viruses 2021, 13, 1837. [Google Scholar] [CrossRef]
  5. Pasin, F.; Shan, H.; García, B.; Müller, M.; San León, D.; Ludman, M.; Fresno, D.H.; Fátyol, K.; Munné-Bosch, S.; Rodrigo, G.; et al. Abscisic Acid Connects Phytohormone Signaling with RNA Metabolic Pathways and Promotes an Antiviral Response that Is Evaded by a Self-Controlled RNA Virus. Plant Commun. 2020, 1, 100099. [Google Scholar] [CrossRef] [PubMed]
  6. Li, W.; Cui, X.; Meng, Z.; Huang, X.; Xie, Q.; Wu, H.; Jin, H.; Zhang, D.; Liang, W. Transcriptional regulation of Arabidopsis MIR168a and argonaute1 homeostasis in abscisic acid and abiotic stress responses. Plant Physiol. 2012, 158, 1279–1292. [Google Scholar] [CrossRef] [PubMed] [Green Version]
  7. Langmead, B.; Salzberg, S.L. Fast gapped-read alignment with Bowtie 2. Nat. Methods 2012, 9, 357–359. [Google Scholar] [CrossRef] [Green Version]
  8. Roberts, A.; Pachter, L. Streaming fragment assignment for real-time analysis of sequencing experiments. Nat. Methods 2013, 10, 71–73. [Google Scholar] [CrossRef] [Green Version]
  9. Untergasser, A.; Cutcutache, I.; Koressaar, T.; Ye, J.; Faircloth, B.C.; Remm, M.; Rozen, S.G. Primer3—New capabilities and interfaces. Nucleic Acids Res. 2012, 40, e115. [Google Scholar] [CrossRef] [PubMed] [Green Version]
  10. Metsalu, T.; Vilo, J. ClustVis: A web tool for visualizing clustering of multivariate data using Principal Component Analysis and heatmap. Nucleic Acids Res. 2015, 43, W566–W570. [Google Scholar] [CrossRef]
  11. Nakashima, K.; Yamaguchi-Shinozaki, K. ABA signaling in stress-response and seed development. Plant Cell Rep. 2013, 32, 959–970. [Google Scholar] [CrossRef]
  12. Edel, K.H.; Kudla, J. Integration of calcium and ABA signaling. Curr. Opin. Plant Biol. 2016, 33, 83–91. [Google Scholar] [CrossRef]
  13. Kutter, C.; Schob, H.; Stadler, M.; Meins, F., Jr.; Si-Ammour, A. MicroRNA-mediated regulation of stomatal development in Arabidopsis. Plant Cell 2007, 19, 2417–2429. [Google Scholar] [CrossRef] [PubMed] [Green Version]
  14. Knight, M.R.; Campbell, A.K.; Smith, S.M.; Trewavas, A.J. Transgenic plant aequorin reports the effects of touch and cold-shock and elicitors on cytoplasmic calcium. Nature 1991, 352, 524–526. [Google Scholar] [CrossRef]
  15. Zhang, Y.; Wang, H.L.; Li, Z.; Guo, H. Genetic Network between Leaf Senescence and Plant Immunity: Crucial Regulatory Nodes and New Insights. Plants 2020, 9, 495. [Google Scholar] [CrossRef] [Green Version]
  16. Chung, K.; Nakano, T.; Fujiwara, S.; Mitsuda, N.; Otsuki, N.; Tsujimoto-Inui, Y.; Naito, Y.; Ohme-Takagi, M.; Suzuki, K. The ERF transcription factor EPI1 is a negative regulator of dark-induced and jasmonate-stimulated senescence in Arabidopsis. Plant Biotechnol. 2016, 33, 235–243. [Google Scholar] [CrossRef] [Green Version]
  17. Zhou, X.; Jiang, Y.; Yu, D. WRKY22 transcription factor mediates dark-induced leaf senescence in Arabidopsis. Mol. Cells 2011, 31, 303–313. [Google Scholar] [CrossRef] [PubMed] [Green Version]
  18. Daneva, A.; Gao, Z.; Van Durme, M.; Nowack, M.K. Functions and Regulation of Programmed Cell Death in Plant Development. Annu. Rev. Cell Dev. Biol. 2016, 32, 441–468. [Google Scholar] [CrossRef] [PubMed]
  19. Khanna-Chopra, R. Leaf senescence and abiotic stresses share reactive oxygen species-mediated chloroplast degradation. Protoplasma 2012, 249, 469–481. [Google Scholar] [CrossRef] [PubMed]
  20. Asada, Y.; Yamamoto, M.; Tsutsui, T.; Yamaguchi, J. The Arabidopsis NSL2 negatively controls systemic acquired resistance via hypersensitive response. Plant Biotechnol. 2011, 28, 9–15. [Google Scholar] [CrossRef] [Green Version]
  21. Straus, M.R.; Rietz, S.; Ver Loren van Themaat, E.; Bartsch, M.; Parker, J.E. Salicylic acid antagonism of EDS1-driven cell death is important for immune and oxidative stress responses in Arabidopsis. Plant J. 2010, 62, 628–640. [Google Scholar] [CrossRef] [PubMed]
  22. Chinnusamy, V.; Gong, Z.; Zhu, J.K. Abscisic acid-mediated epigenetic processes in plant development and stress responses. J. Integr. Plant Biol. 2008, 50, 1187–1195. [Google Scholar] [CrossRef]
  23. Ton, J.; Flors, V.; Mauch-Mani, B. The multifaceted role of ABA in disease resistance. Trends Plant Sci. 2009, 14, 310–317. [Google Scholar] [CrossRef]
  24. Lim, C.W.; Baek, W.; Jung, J.; Kim, J.H.; Lee, S.C. Function of ABA in Stomatal Defense against Biotic and Drought Stresses. Int. J. Mol. Sci. 2015, 16, 15251–15270. [Google Scholar] [CrossRef] [Green Version]
  25. Allen, G.J.; Chu, S.P.; Harrington, C.L.; Schumacher, K.; Hoffmann, T.; Tang, Y.Y.; Grill, E.; Schroeder, J.I. A defined range of guard cell calcium oscillation parameters encodes stomatal movements. Nature 2001, 411, 1053–1057. [Google Scholar] [CrossRef] [PubMed]
  26. Fu, Z.Q.; Yan, S.; Saleh, A.; Wang, W.; Ruble, J.; Oka, N.; Mohan, R.; Spoel, S.H.; Tada, Y.; Zheng, N.; et al. NPR3 and NPR4 are receptors for the immune signal salicylic acid in plants. Nature 2012, 486, 228–232. [Google Scholar] [CrossRef] [Green Version]
  27. Wang, D.; Yang, C.; Wang, H.; Wu, Z.; Jiang, J.; Liu, J.; He, Z.; Chang, F.; Ma, H.; Wang, X. BKI1 Regulates Plant Architecture through Coordinated Inhibition of the Brassinosteroid and ERECTA Signaling Pathways in Arabidopsis. Mol. Plant 2017, 10, 297–308. [Google Scholar] [CrossRef] [Green Version]
  28. Baulcombe, D. RNA silencing in plants. Nature 2004, 431, 356–363. [Google Scholar] [CrossRef] [PubMed]
  29. Martínez de Alba, A.E.; Elvira-Matelot, E.; Vaucheret, H. Gene silencing in plants: A diversity of pathways. Biochim. Biophys. Acta 2013, 1829, 1300–1308. [Google Scholar] [CrossRef] [PubMed]
  30. Anandalakshmi, R.; Pruss, G.J.; Ge, X.; Marathe, R.; Mallory, A.C.; Smith, T.H.; Vance, V.B. A viral suppressor of gene silencing in plants. Proc. Natl. Acad. Sci. USA 1998, 95, 13079–13084. [Google Scholar] [CrossRef] [PubMed] [Green Version]
  31. Kasschau, K.D.; Carrington, J.C. A counterdefensive strategy of plant viruses: Suppression of posttranscriptional gene silencing. Cell 1998, 95, 461–470. [Google Scholar] [CrossRef] [Green Version]
  32. Kontra, L.; Csorba, T.; Tavazza, M.; Lucioli, A.; Tavazza, R.; Moxon, S.; Tisza, V.; Medzihradszky, A.; Turina, M.; Burgyán, J. Distinct Effects of p19 RNA Silencing Suppressor on Small RNA Mediated Pathways in Plants. PLoS Pathog. 2016, 12, e1005935. [Google Scholar] [CrossRef] [PubMed] [Green Version]
  33. Mallory, A.C.; Reinhart, B.J.; Bartel, D.; Vance, V.B.; Bowman, L.H. A viral suppressor of RNA silencing differentially regulates the accumulation of short interfering RNAs and micro-RNAs in tobacco. Proc. Natl. Acad. Sci. USA 2002, 99, 15228–15233. [Google Scholar] [CrossRef] [PubMed] [Green Version]
  34. Baráth, D.; Jaksa-Czotter, N.; Molnár, J.; Varga, T.; Balássy, J.; Szabó, L.K.; Kirilla, Z.; Tusnády, G.E.; Preininger, É.; Várallyay, É. Small RNA NGS Revealed the Presence of Cherry Virus A and Little Cherry Virus 1 on Apricots in Hungary. Viruses 2018, 10, 318. [Google Scholar] [CrossRef] [Green Version]
  35. Hadidi, A.; Flores, R.; Candresse, T.; Barba, M. Next-Generation Sequencing and Genome Editing in Plant Virology. Front. Microbiol. 2016, 7, 1325. [Google Scholar] [CrossRef] [PubMed]
  36. Pesti, R.; Kontra, L.; Paul, K.; Vass, I.; Csorba, T.; Havelda, Z.; Várallyay, É. Differential gene expression and physiological changes during acute or persistent plant virus interactions may contribute to viral symptom differences. PLoS ONE 2019, 14, e0216618. [Google Scholar] [CrossRef]
Figure 1. Network genes among the three comparison datasets obtained from the HTP RNA-seq profiling: Col-0 vs. P1/HC-ProTu, Col-0 vs. P1Tu, and Col-0 vs. HC-ProTu comparative sets. (A) Venn diagram showing the distributions of shared and unique network genes. (B) Functional classification of unique genes in the P1Tu-only, HC-ProTu-only, and P1/HC-ProTu-only sections.
Viruses 13 02349 g001
Figure 2. The P1/HC-ProTu altered ABA-mediated immune responses. (A) P1/HC-ProTu-only genes in the P1/HC-ProTu-only section of the HTP datasets that were functionally annotated to categories and subcategories of genes involved in (i) ABA biosynthesis, (ii) catabolism, (iii) transport, (iv) signaling regulation, (v) posttranscriptional regulation, (vi) calcium signaling, and (vii) ABA responses. (B) Heatmap showing the expression patterns of the genes in the P1/HC-ProTu-only section that are involved in the ABA signaling pathway. ‘+’ and ‘−’ represent genes that positively or negatively regulate the ABA signaling pathway. The symbols in the right panel indicate the functions of genes in various biotic and abiotic stress responses and developmental processes.
Viruses 13 02349 g002
Figure 3. Endogenous ABA detection and ABA sensitivity assay. (A) Determination of the endogenous ABA amounts. The mean values ± SD were obtained from three biological repeats. Comparisons between two groups were performed using a Student’s t test. *** p < 0.001. (B) ABA sensitivity assay. The germination phenotypes were classified into four phases: I, rupture of the seed coat; II, radicle protrusion; III, fully-opened cotyledons; and IV, true leaf development.
Viruses 13 02349 g003
Figure 4. Calcium signaling pathway in response to P1/HC-ProTu. (A) Calcium signaling pathway in the P1/HC-ProTu-only section of the HTP profiles in the Col-0 vs. P1/HC-ProTu, Col-0 vs. P1Tu, and Col-0 vs. HC-ProTu comparison sets obtained from the HTP profiles. (B) Heatmap showing the expression patterns of the P1/HC-ProTu-only genes involved in the calcium signaling pathway.
Viruses 13 02349 g004
Figure 5. 
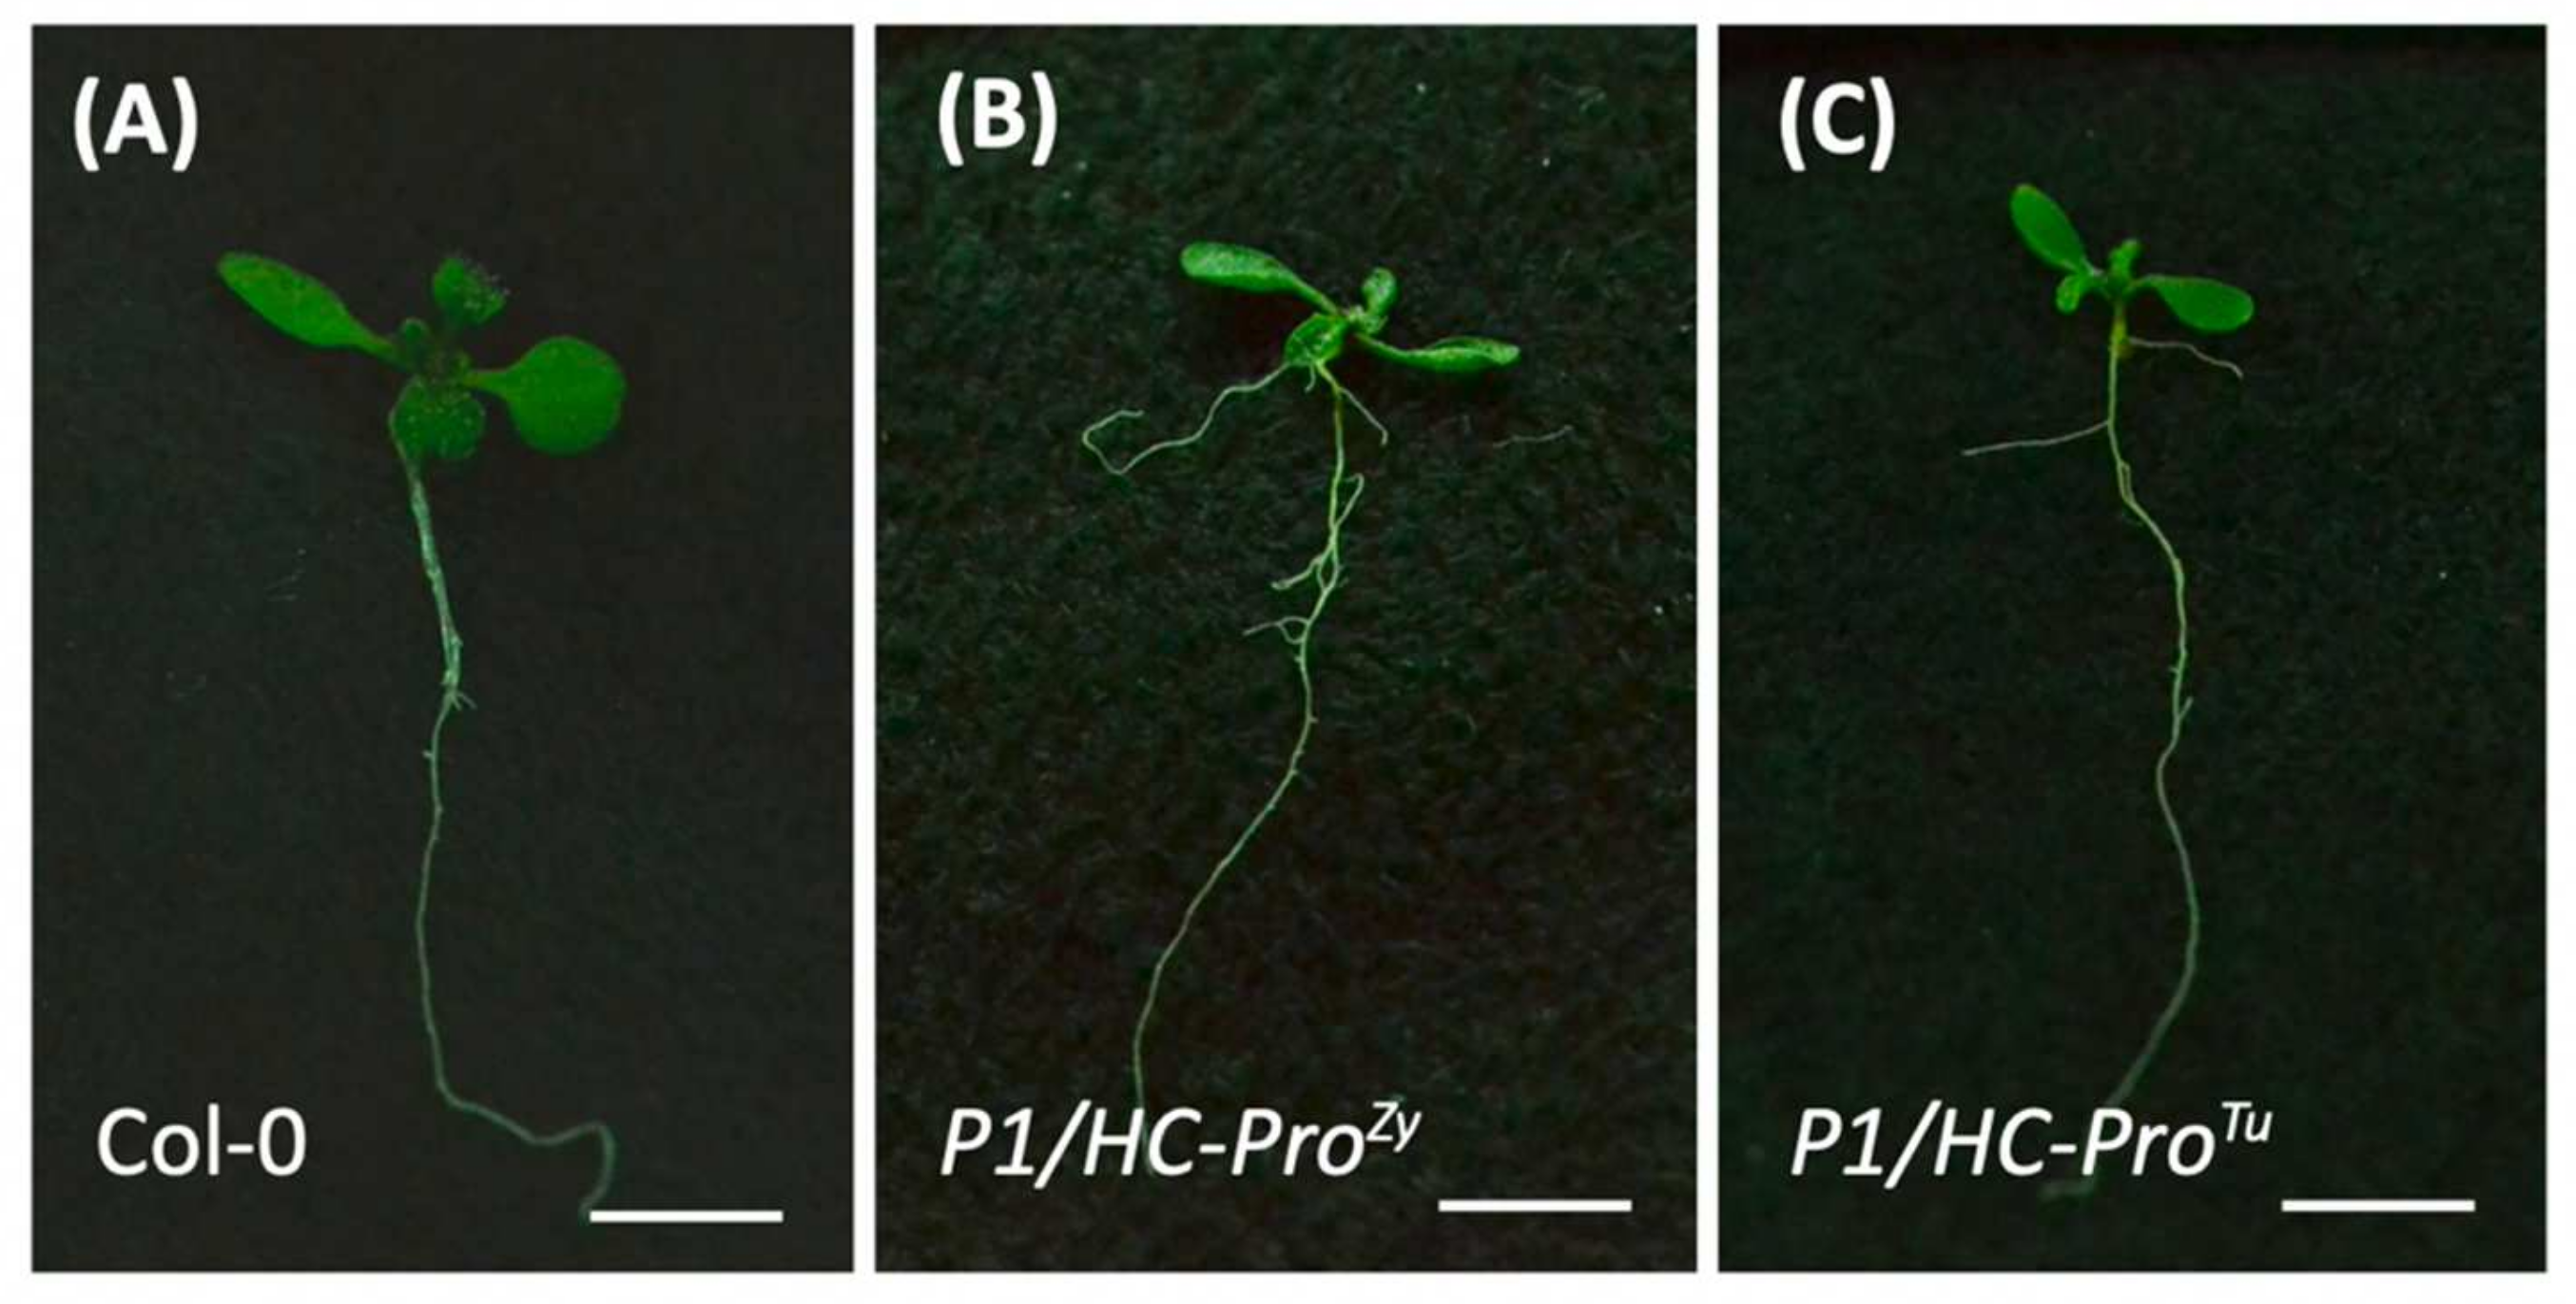
Phenotypes of the P1/HC-ProTu and P1/HC-ProZy plants. Ten-day-old seedlings of (A) Col-0, (B) P1/HC-ProZy, and (C) P1/HC-ProTu transgenic plants. Scale bars = 0.5 cm.
Viruses 13 02349 g005
Figure 6. 
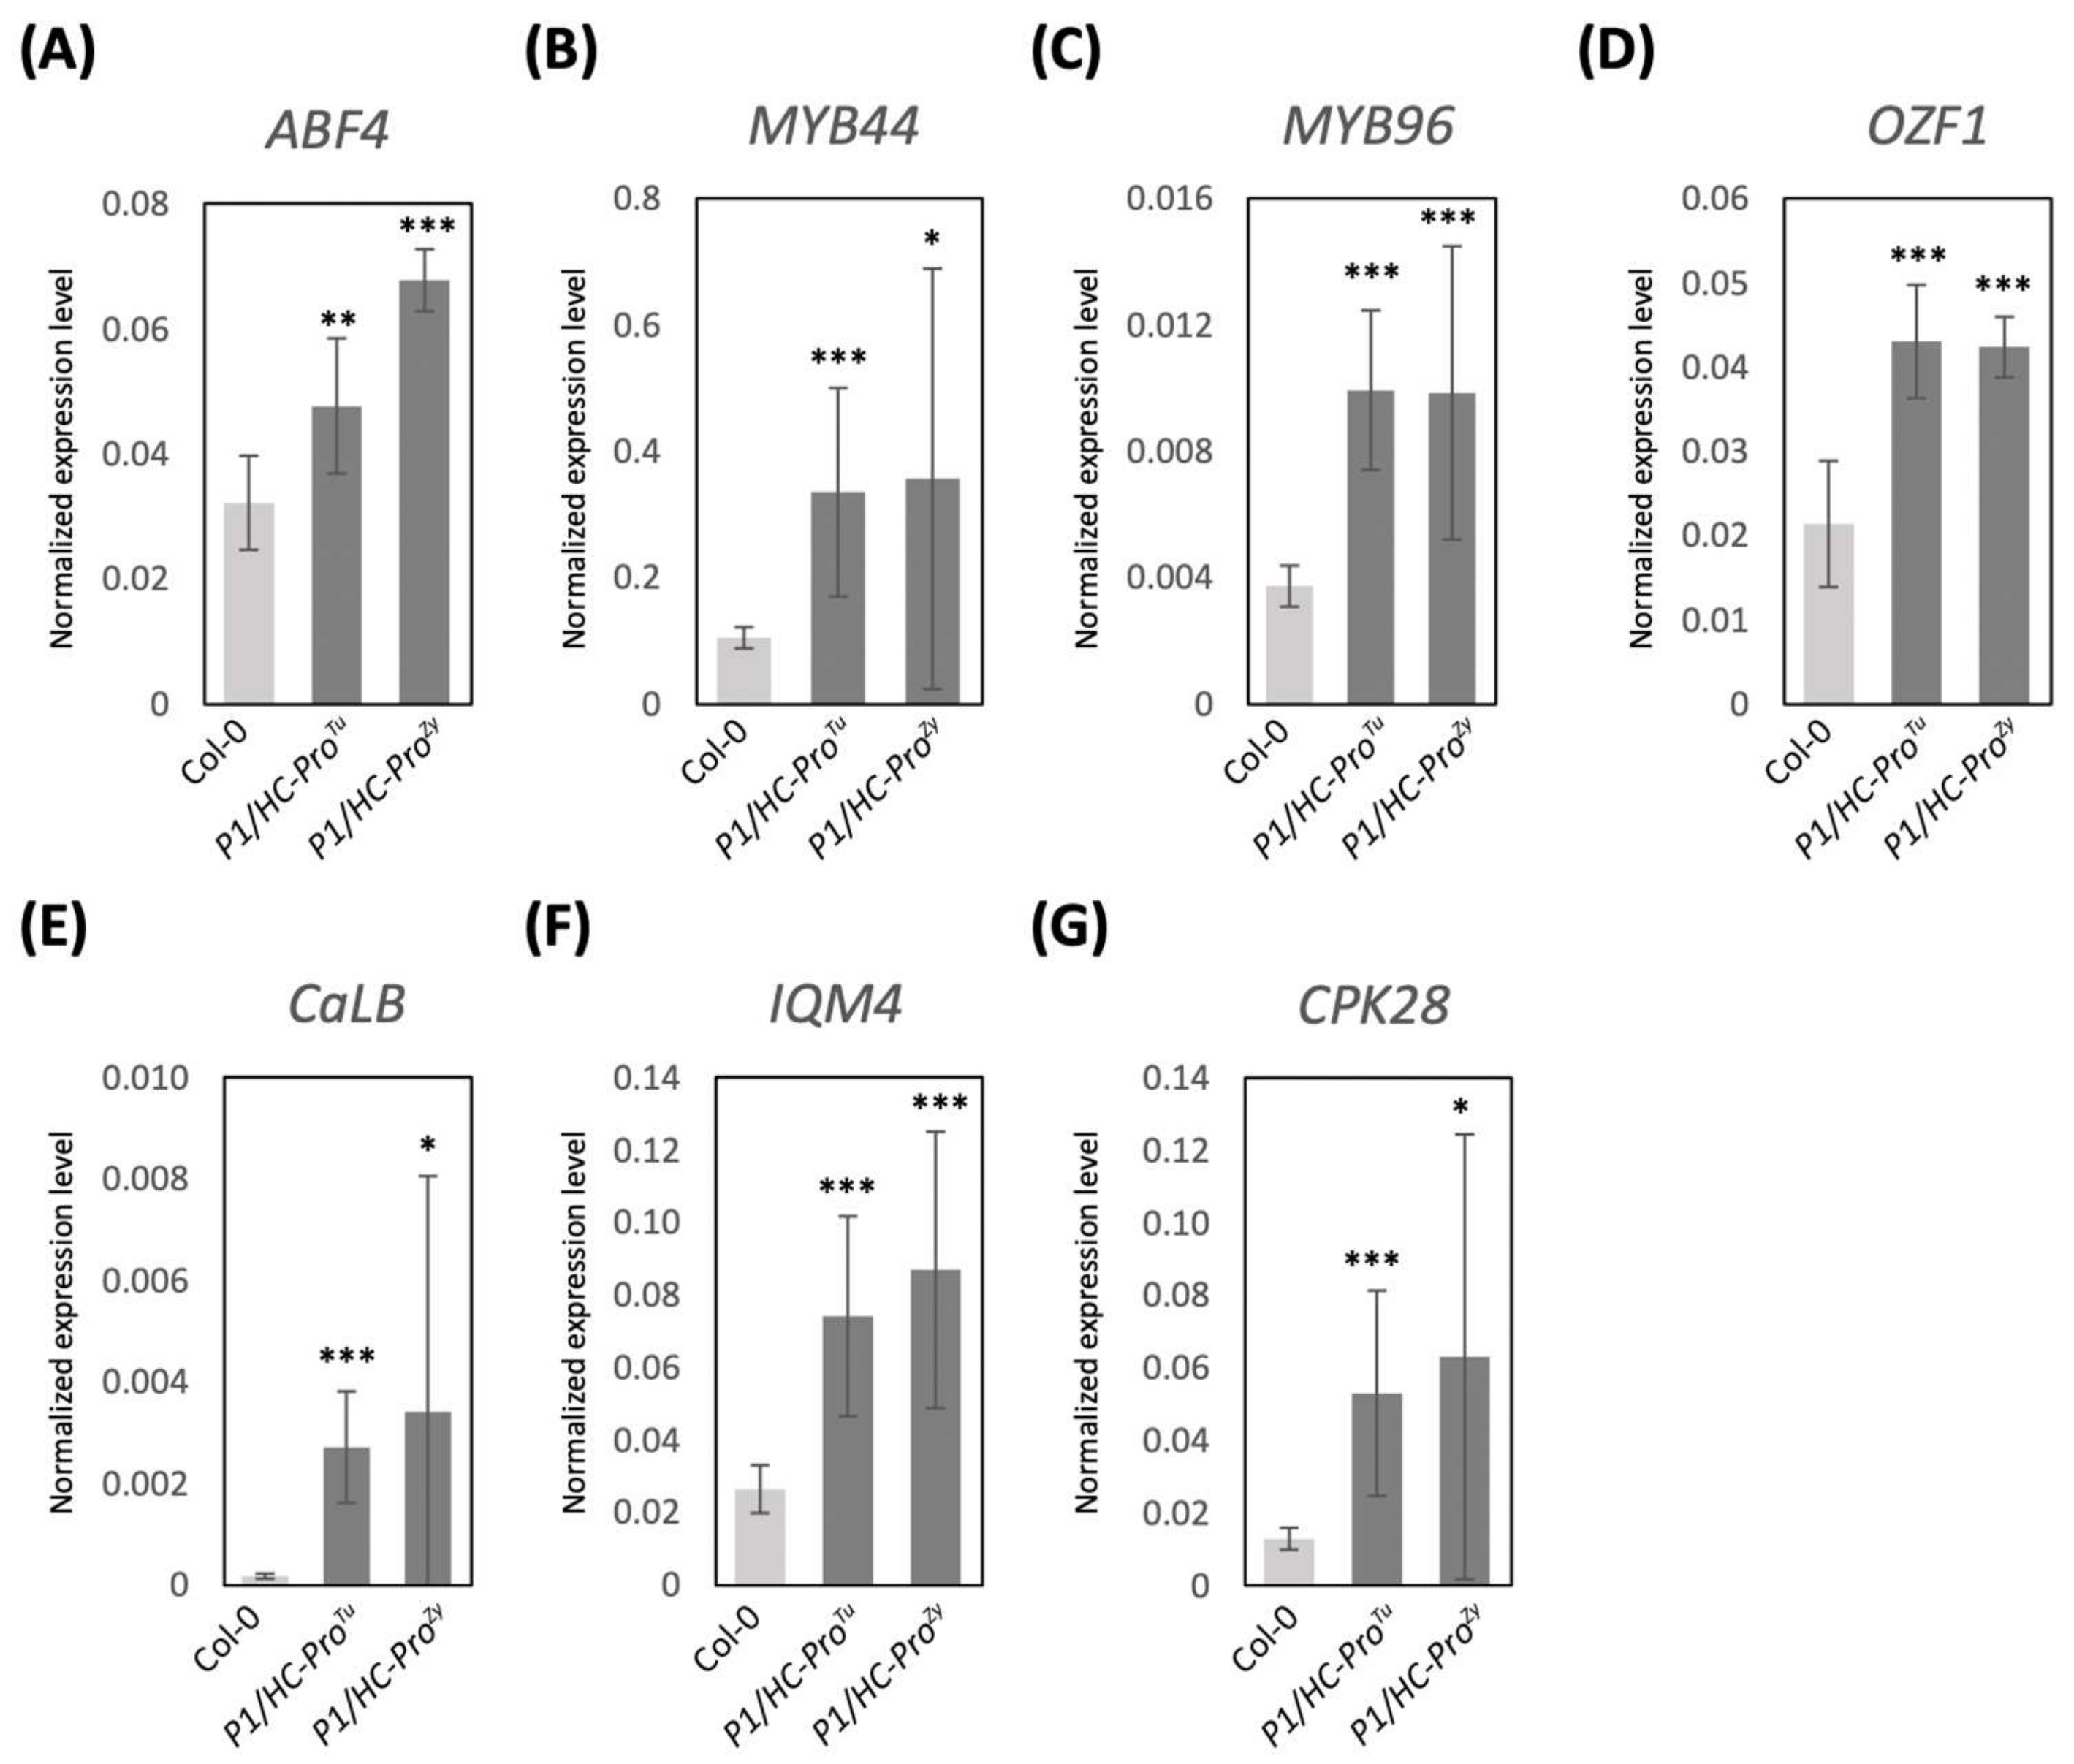
The qRT-PCR-based validation of the gene expressions in the P1/HC-Pro-related plants obtained from the HTP profiles. (AD) DEGs in the ABA signaling pathway. (EG) DEGs in the Ca2+ signaling pathway. The mean values ± SD were from three biological repeats. Comparisons between two groups were performed with Student’s t test. * p < 0.05, ** p < 0.01, *** p < 0.001.
Viruses 13 02349 g006
Figure 7. 
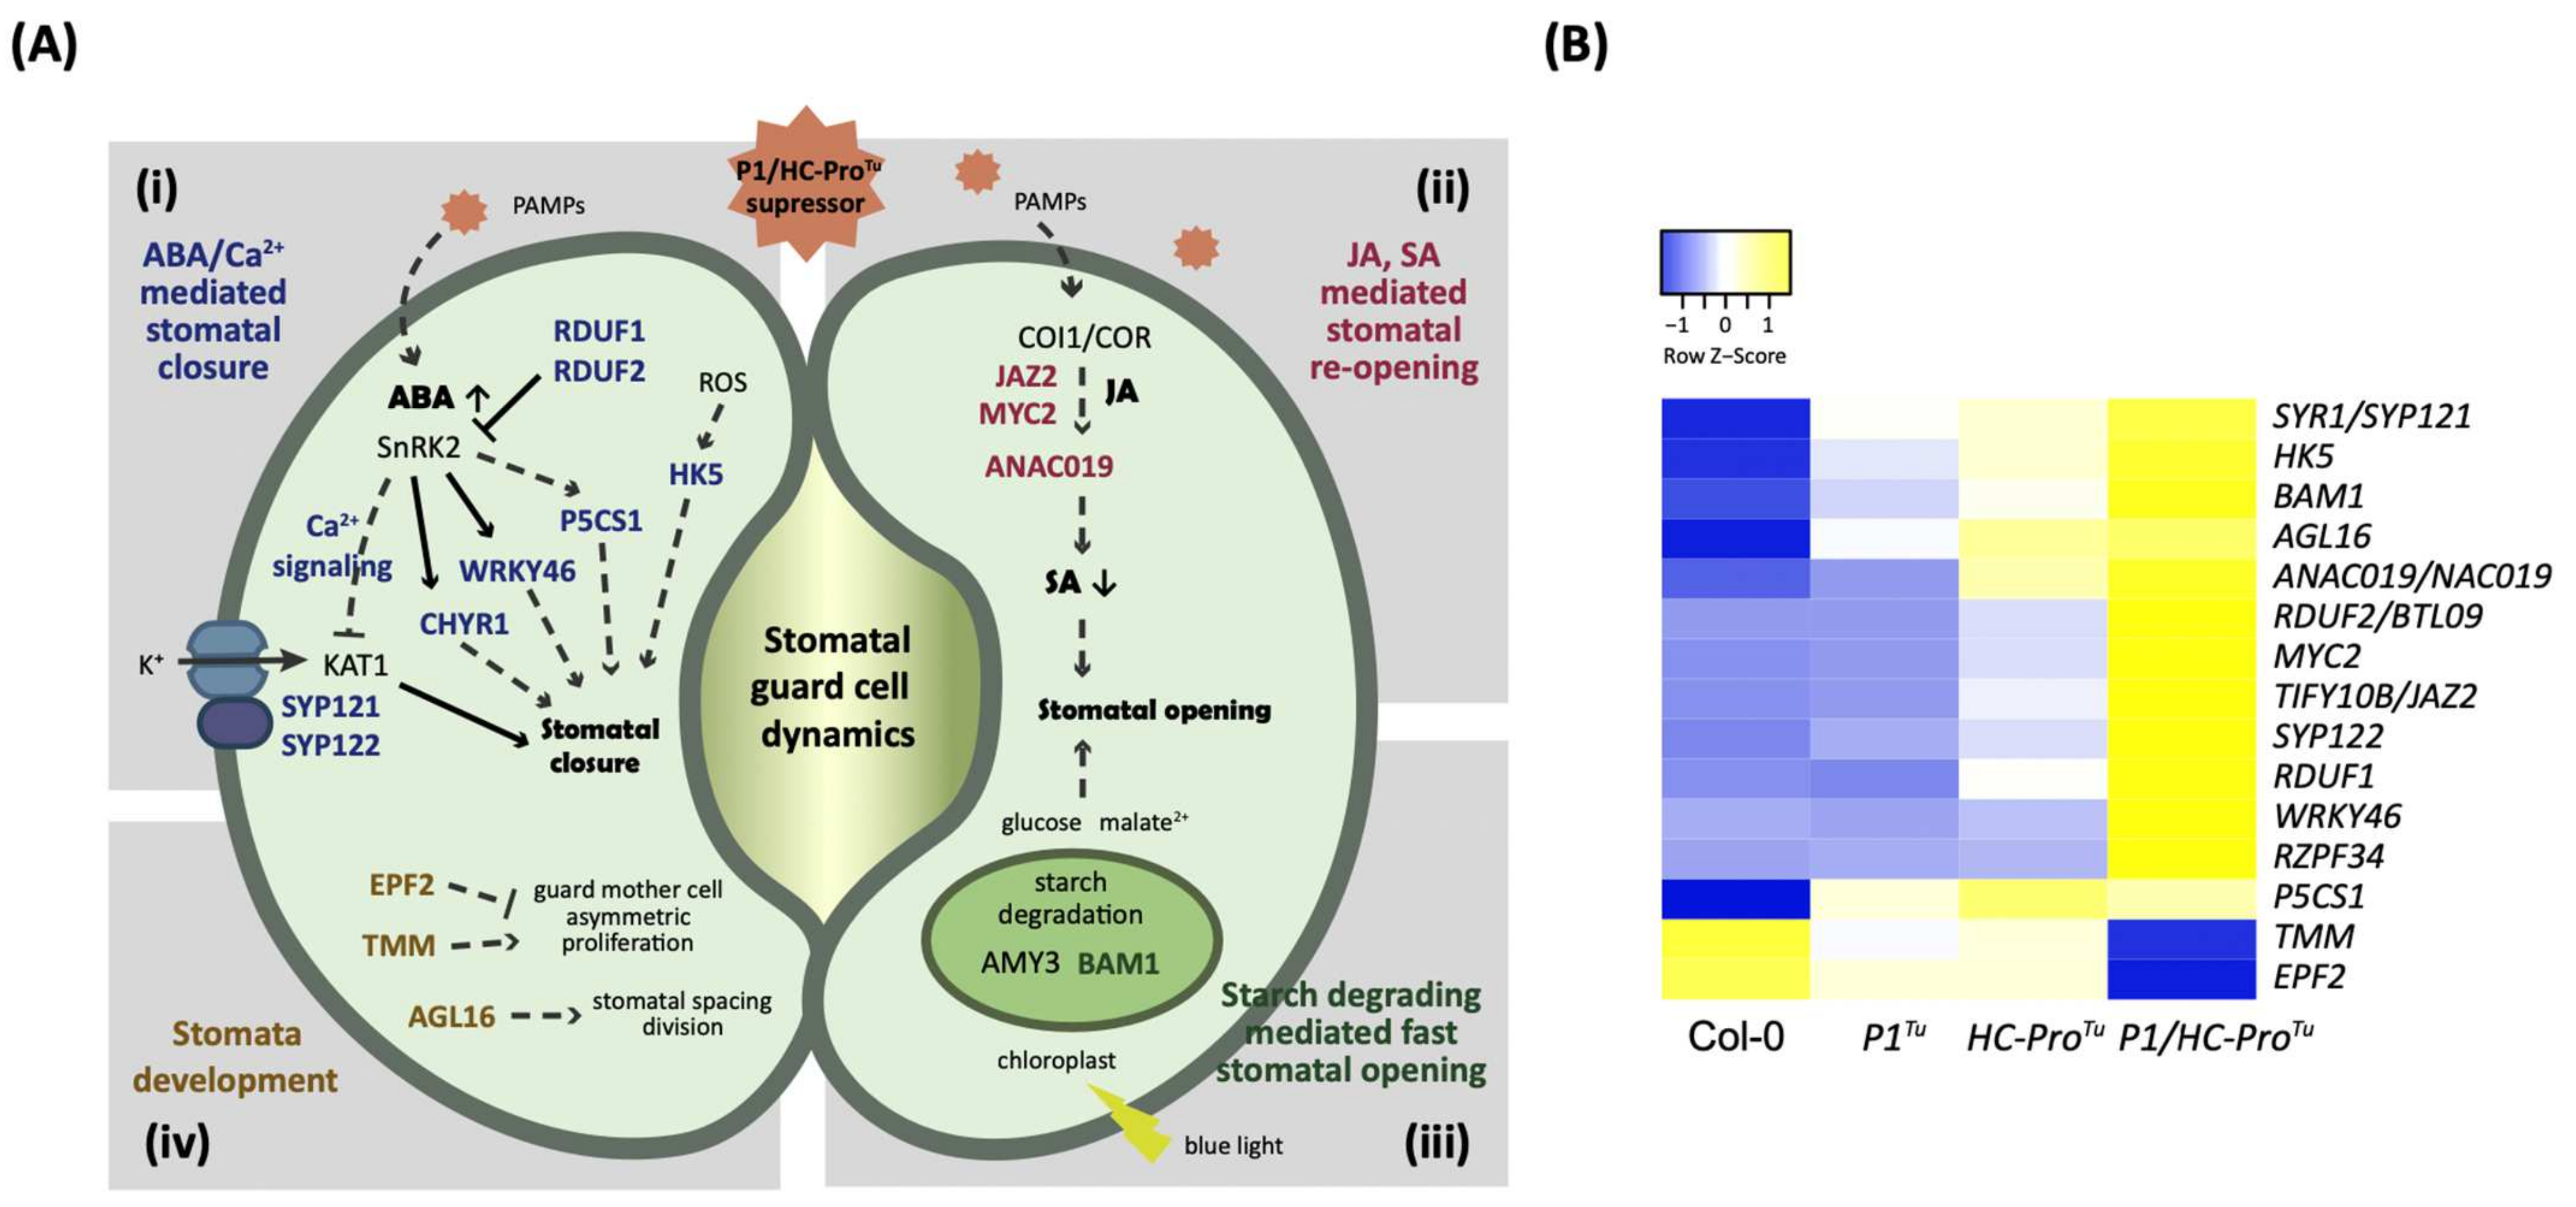
Regulatory mechanism controlling stomatal dynamics in response to P1/HC-ProTu. (A) Genes involved in the regulation of stomatal guard cell dynamics and development found in the P1/HC-ProTu-only section. The genes involved in stomatal closure, stomatal opening, starch degradation, and stomatal development are labeled in blue, red, green, and brown, respectively. (B) Heatmap showing the expression patterns of the P1/HC-ProTu-only genes involved in the stomatal closure, opening, and development.
Viruses 13 02349 g007
Figure 8. Heatmaps showing the expression patterns of (A) cold response- and (B) senescence-related genes in the P1/HC-ProTu-only section of the HTP datasets.
Viruses 13 02349 g008
Figure 9. Comparison of gene expression and networks obtained with the HTP and LTP profiles. (A) PCA plot of gene expression profiles from the HTP and LTP datasets of Col-0, P1Tu, HC-ProTu, and P1/HC-ProTu samples. The top two principal components (X-axis, PC1; Y-axis, PC2) are shown. Each data point represents one biological sample. (B) Venn diagram showing the shared and unique genes in the Col-0 vs. P1/HC-ProTu comparison samples between the HTP and LTP datasets. Network-based comparison of the 75 shared genes in the Col-0 vs. P1/HC-ProTu datasets between (C) the HTP and (D) the LTP datasets. The red and green lines represent positive and negative correlations, respectively. The dark red and green lines indicate conserved connections between the HTP and LTP networks, respectively.
Viruses 13 02349 g009
Figure 10. Heatmaps showing the expression patterns of the 75 overlapped genes in the Col-0 vs. P1/HC-ProTu comparison identified from both the HTP and LTP profiles.
Viruses 13 02349 g010
Figure 11. Network genes among the three comparison sets obtained from the LTP profiles: Col-0 vs. P1/HC-ProTu, Col-0 vs. P1Tu, and Col-0 vs. HC-ProTu comparison sets. (A) Venn diagram showing the distributions of shared and unique network genes. (B) Functional classification of unique genes in the P1Tu-only, HC-ProTu-only, and P1/HC-ProTu-only sections.
Viruses 13 02349 g011
Table 1. Identification of the HTP and LTP network genes in the Col-0 vs. P1/HC-ProTu, Col-0 vs. P1Tu, and Col-0 vs. HC-ProTu comparative datasets in the ContigViews system.
HTPLTP
Col-0 vs. P1/HC-ProTuCol-0 vs. P1TuCol-0 vs. HC-ProTuCol-0 vs. P1/HC-ProTuCol-0 vs. P1TuCol-0 vs. HC-ProTu
Passing rate808080808080
Fold change222222
(+) correlation97.597.597.5959595
(−) correlation92.592.592.5909090
Sample sets10/1210/1210/1210/1210/1210/12
Filtered DEGs1601559777700621587
Network genes662106162188243193
Table 2. List of genes involved in the ABA signaling pathway that were identified in the P1/HC-ProTu-only section of the HTP profiles.
CategoriesSubcategoriesAGI Locus CodeGene NameAnnotations
HomeostasisBiosynthesisAT3G02570PMI1/MEE31Mannose-6-phosphate isomerase, type I
AT3G51895SULTR3;1sulfate transporter 3;1
CatabolismAT5G45340CYP707A3Cytochrome P450, family 707, subfamily A, polypeptide 3
TransportAT5G52050DTX50MATE efflux family protein
RegulationPosttranscriptional regulationAT5G66070ATL27/ATARRERING/U-box superfamily protein
AT3G52450PUB22Plant U-box 22
AT2G35930PUB23Plant U-box 23
AT3G46620RDUF1Zinc finger (C3HC4-type RING finger) family protein
AT5G59550RDUF2/BTL09Zinc finger (C3HC4-type RING finger) family protein
Transcriptional regulationAT3G61890HB12Homeobox 12
ABA-responsesBioticAT1G69480EXSEXS (ERD1/XPR1/SYG1) family protein
AT1G32640MYC2Basic helix-loop-helix (bHLH) DNA-binding family protein
AT2G32030NA aAcyl-CoA N-acyltransferases (NAT) superfamily protein
AT2G19810OZF1/TZF2CCCH-type zinc finger family protein
ColdAT4G25470CBF2C-repeat/DRE binding factor 2
ColdAT5G61600ERF104Ethylene response factor 104
ColdAT5G51190ERF105Integrase-type DNA-binding superfamily protein
Cold, DevelopmentAT1G74670GASA6Gibberellin-regulated family protein
DevelopmentAT1G56170NF-YC2/HAP5BNuclear factor Y, subunit C2
DevelopmentAT5G23220NIC3Nicotinamidase 3
DevelopmentAT5G42050NRPDCD (Development and Cell Death) domain protein, NRP has a positive role in ABA-mediated seed germination.
Development, DroughtAT1G13260RAV1Related to ABI3/VP1 1
Development, DroughtAT5G39760HB23Homeobox protein 23
DroughtAT2G46510AIB/BHLH017ABA-inducible BHLH-type transcription factor
DroughtAT2G25900ATCTH/TZF1Zinc finger C-x8-C-x5-C-x3-H type family protein
DroughtAT1G74930ERF018/ORA47Integrase-type DNA-binding superfamily protein
DroughtAT5G62470MYB96MYB domain protein 96
DroughtAT5G67300MYBR1/MYB44MYB domain protein r1
DroughtAT3G56880NA aVQ motif-containing protein
DroughtAT1G54160NF-YA5Nuclear factor Y, subunit A5
DroughtAT2G39800P5CS1Delta1-pyrroline-5-carboxylate synthase 1
DroughtAT3G11820SYR1/SYP121Syntaxin of plants 121
DroughtAT2G46400WRKY46WRKY DNA-binding protein 46
Drought, ColdAT5G65300SUPAUnknown protein
Drought, ColdAT1G72240SUPA-likeUnknown protein
Drought, SenescenceAT1G08920ESL1ERD (early response to dehydration) six-like 1
Drought, Senescence, Chlorophyll degradationAT1G69490ANAC029/NAPNAC-like, activated by AP3/PI
Multiple stressAT3G48360BT2BTB and TAZ domain protein 2
SenescenceAT1G53170ERF8Ethylene response factor 8
Senescence, Chlorophyll degradationAT4G24390AFB4RNI-like superfamily protein
UncertainAT3G54200NHL39Late embryogenesis abundant (LEA) hydroxyproline-rich glycoprotein family
a NA indicates that the gene name is not available.
Table 3. List of genes in the calcium signaling pathway found in the P1/HC-ProTu-only section of the HTP profiles.
CategoriesSubcategoriesAGI Locus CodeGene NameAnnotations
TransporterUniporterAT1G27770ACA1Autoinhibited Ca2+-ATPase 1
AT2G24610CNGC14Cyclic nucleotide-gated channel 14
AT5G15410CNGC2/DND1Cyclic nucleotide-regulated ion channel family protein
AT5G17850CCX2Sodium/calcium exchanger family protein
AT5G66650CMCUProtein of unknown function (DUF607)
SensorCaMs/CaMLsAT1G66400CML23Calmodulin like 23
AT1G76650CML38Calmodulin-like 38
AT2G43290CML5/MSS3Calcium-binding EF-hand family protein
AT3G22930CML11Calmodulin-like 11
AT5G37770CML24/TCH2EF hand calcium-binding protein family
AT5G39670CML46Calcium-binding EF-hand family protein
Other calcium-binding proteinsAT3G01830NA aCalcium-binding EF-hand family protein
AT3G16510CaLBCalcium-dependent lipid-binding (CaLB domain) family protein
AT3G25600NA aCalcium-binding EF-hand family protein
AT4G34150CaLBCalcium-dependent lipid-binding (CaLB domain) family protein
Calmodulin-binding proteinsAT2G26190IQM4Calmodulin-binding family protein
AT2G41010CAMBP25Calmodulin (CAM)-binding protein of 25 kDa
AT3G13600NA aCalmodulin-binding family protein
AT3G16490IQD26IQ-domain 26
AT5G26920CBP60GCam-binding protein 60-like G
AT5G35670IQD33IQ-domain 33
AT5G57010NA aCalmodulin-binding family protein
AT5G62570CBP60ACalmodulin binding protein-like
CDPKs/CIPKAT2G30360CIPK11/PKS5SOS3-interacting protein 4
AT3G57530CPK32Calcium-dependent protein kinase 32
AT5G66210CPK28Calcium-dependent protein kinase 28
a NA indicates that the gene name is not available.
Table 4. List of genes related to drought responses found in the P1/HC-ProTu-only section of the HTP profiles.
AGIGene NameAnnotationsCategories bABA/Ca c
AT2G39800P5CS1Delta1-pyrroline-5-carboxylate synthase 1drought/stomataABA
AT3G46620RDUF1Zinc finger (C3HC4-type RING finger) family proteindrought/stomataABA
AT5G59550RDUF2/BTL09Zinc finger (C3HC4-type RING finger) family proteindrought/stomataABA
AT3G11820SYR1/SYP121Syntaxin of plants 121drought/stomataABA
AT2G46400WRKY46WRKY DNA-binding protein 46drought/stomataABA
AT1G32640MYC2Basic helix-loop-helix (bHLH) DNA-binding family proteindrought/stomataABA
AT3G57230AGL16AGAMOUS-like 16drought/stomata
AT3G23920BAM1Beta-amylase 1drought/stomata
AT1G34245EPF2Putative membrane lipoproteindrought/stomata
AT5G10720HK5Histidine kinase 5drought/stomata
AT5G22920RZPF34/CHYR1CHY-type/CTCHY-type/RING-type Zinc finger proteindrought/stomata
AT3G52400SYP122Syntaxin of plants 122drought/stomata
AT1G74950TIFY10B/JAZ2TIFY domain/Divergent CCT motif family proteindrought/stomata
AT1G80080TMMLeucine-rich repeat (LRR) family proteindrought/stomata
AT1G52890ANAC019/NAC019NAC domain containing protein 19drought/stomata
AT1G69490ANAC029/NAPNAC-like, activated by AP3/PIdroughtABA
AT2G25900ATCTH/TZF1Zinc finger C-x8-C-x5-C-x3-H type family proteindroughtABA
AT5G45340CYP707A3Cytochrome P450, family 707, subfamily A, polypeptide 3droughtABA
AT5G52050DTX50MATE efflux family proteindroughtABA
AT1G74930ERF018/ORA47Integrase-type DNA-binding superfamily proteindroughtABA
AT1G08920ESL1ERD (early response to dehydration) six-like 1droughtABA
AT5G39760HB23Homeobox protein 23droughtABA
AT5G62470MYB96MYB domain protein 96droughtABA
AT5G67300MYBR1/MYB44MYB domain protein r1droughtABA
AT1G54160NF-YA5Nuclear factor Y, subunit A5droughtABA
AT5G42050NRPDCD (Development and Cell Death) domain proteindroughtABA
AT3G52450PUB22Plant U-box 22droughtABA
AT2G35930PUB23Plant U-box 23droughtABA
AT1G13260RAV1Related to ABI3/VP1 1droughtABA
AT5G65300SUPAUnknown proteindroughtABA
AT2G41010CAMBP25Calmodulin (CAM)-binding protein of 25 kDadroughtCa
AT2G26190IQM4Calmodulin-binding family proteindroughtCa
AT5G17850CCX2Sodium/calcium exchanger family proteindroughtCa
AT5G66650CMCUProtein of unknown function (DUF607)droughtCa
AT2G33860ARF3/ETTTranscriptional factor B3 family protein/auxin-responsive factor AUX/IAA-relateddrought
AT4G02200AtDi19-5Drought-responsive family proteindrought
AT3G08760ATSIKProtein kinase superfamily proteindrought
AT5G49450BZIP1Basic leucine-zipper 1drought
AT4G36880CP1/RDL1Cysteine proteinase1drought
AT5G04340CZF2/ZAT6Zinc finger of Arabidopsis thaliana 6drought
AT5G04760DIV2Duplicated homeodomain-like superfamily proteindrought
AT1G73330DR4Drought-repressed 4drought
AT5G05410DREB2ADRE-binding protein 2Adrought
AT2G45180DRN1Bifunctional inhibitor/lipid-transfer protein/seed storage 2S albumin superfamily proteindrought
AT4G17490ERF6Ethylene responsive element binding factor 6drought
AT2G47180GOLS1Galactinol synthase 1drought
AT4G18880HSF A4AHeat shock transcription factor A4Adrought
AT5G12030HSP17.6AHeat shock protein 17.6Adrought
AT4G02410LPK1/LECRK-IV.3Concanavalin A-like lectin protein kinase family proteindrought
AT3G49580LSU1Response to low sulfur 1drought
AT1G73500MKK9MAP kinase kinase 9drought
AT3G45640MPK3Mitogen-activated protein kinase 3drought
AT5G61290NA aFlavin-binding monooxygenase family proteindrought
AT3G27150NA aGalactose oxidase/kelch repeat superfamily proteindrought
AT5G26260NA aTRAF-like family proteindrought
AT4G33070PDC1Thiamine pyrophosphate dependent pyruvate decarboxylase family proteindrought
AT3G62260PP2C49Protein phosphatase 2C family proteindrought
AT5G64905PROPEP3Elicitor peptide 3 precursordrought
AT3G18710PUB29plant U-box 29drought
AT3G49810PUB30ARM repeat superfamily proteindrought
AT1G68840RAV2/TEM2Related to ABI3/VP1 2drought
AT3G08720S6K2Serine/threonine protein kinase 2drought
AT5G62520SRO5Similar to RCD one 5drought
AT3G55980SZF1/TZF11Salt-inducible zinc finger 1drought
AT2G40140SZF2Zinc finger (CCCH-type) family proteindrought
AT1G27730ZAT10Salt tolerance zinc fingerdrought
a NA indicates that the gene name is not available. b Classification of the genes into the functional categories of drought responses (drought, salt, osmotic, salinity, dehydration, water loss, submergence, and water loading) and/or stomatal dynamics. c Involvement of the genes in the ABA and Ca2+ signaling pathways.
Table 5. List of genes related to the cold response found in the P1/HC-ProTu-only section of the HTP profiles.
AGIGene NameAnnotationsCategories aABA/Ca b
AT5G61600ERF104Ethylene response factor 104coldABA
AT5G51190ERF105Integrase-type DNA-binding superfamily proteincoldABA
AT1G13260RAV1Related to ABI3/VP1 1cold/droughtABA
AT4G25470CBF2C-repeat/DRE binding factor 2coldABA/Ca
AT3G50260CEJ1/DEAR1Cooperatively regulated by ethylene and jasmonate 1coldCa
AT5G59820ZAT12C2H2-type zinc finger family proteincoldCa
AT1G27730ZAT10Salt tolerance zinc fingercold/droughtCa
AT5G05410DREB2ADRE-binding protein 2Acold/drought
AT4G17490ERF6Ethylene responsive element binding factor 6cold/drought
AT2G47180GOLS1Galactinol synthase 1cold/drought
AT3G45640MPK3Mitogen-activated protein kinase 3cold/drought
AT3G08720S6K2Serine/threonine protein kinase 2cold/drought
AT1G20823ATL80RING/U-box superfamily proteincold
AT1G18740B1LProtein of unknown function (DUF793)cold
AT5G20230BCBBlue-copper-binding proteincold
AT3G13310DJC66Chaperone DnaJ-domain superfamily proteincold
AT3G49530NAC062/NTL6NAC domain containing protein 62cold
AT1G09070SRC2Soybean gene regulated by cold-2cold
AT1G72940TN11Toll-Interleukin-Resistance (TIR) domain-containing proteincold
AT5G57560XTH22/TCH4Xyloglucan endotransglucosylase/hydrolase family proteincold
a Classification of the genes into the functional categories of cold responses (cold, low temperature, freeze, and chilling) and/or drought. b Involvement of the genes in the ABA and/or calcium signaling pathways.
Table 6. List of genes related to senescence, cell death, and chlorophyll degradation found in the P1/HC-ProTu-only section of the HTP datasets.
AGIGene NameAnnotationsCategories b
AT5G42050NRPDCD (Development and Cell Death) domain proteincell death
AT3G25250AGC2-1/OXI1AGC (cAMP-dependent, cGMP-dependent and protein kinase C) kinase family proteincell death
AT5G18270ANAC087Arabidopsis NAC domain containing protein 87cell death
AT1G29690CAD1/NSL2MAC/Perforin domain-containing proteincell death
AT5G58430EXO70B1Exocyst subunit exo70 family protein B1cell death
AT1G59910FORMIN7Actin-binding FH2 (formin homology 2) family proteincell death
AT1G70830MLP28MLP-like protein 28cell death
AT4G12720NUDT7MutT/nudix family proteincell death
AT1G08920ESL1ERD (early response to dehydration) six-like 1senescence
AT2G46400WRKY46WRKY DNA-binding protein 46senescence
AT5G02760APD7Protein phosphatase 2C family proteinsenescence
AT5G08790ATAF2/ANAC081NAC (No Apical Meristem) domain transcriptional regulator superfamily proteinsenescence
AT1G44830ERF014/EPI1Integrase-type DNA-binding superfamily proteinsenescence
AT1G51660MKK4Mitogen-activated protein kinase kinase 4senescence
AT1G67470NA aProtein kinase superfamily proteinsenescence
AT2G28400NA aProtein of unknown function, DUF584senescence
AT4G21930NA aProtein of unknown function, DUF584senescence
AT2G44670NA aProtein of unknown function, DUF581senescence
AT4G04630NA aProtein of unknown function, DUF584senescence
AT1G55740SIP1Seed imbibition 1senescence
AT4G01250WRKY22WRKY family transcription factorsenescence
AT3G21520DMP1DUF679 domain membrane protein 1senescence/cell death
AT1G52890ANAC019/NAC019NAC domain containing protein 19senescence/chloroplast degradation
AT1G69490ANAC029/NAPNAC-like, activated by AP3/PIsenescence/chloroplast degradation
AT4G24390AFB4RNI-like superfamily proteinsenescence/chloroplast degradation
a NA indicates that the gene name is not available. b Classification of the gene into the functional categories of senescence responses (leaf senescence, chloroplast degradation, and cell death).
Table 7. Statistics of the RNA-seq data and read mapping rates of the Col-0, P1Tu, HC-ProTu, and P1/HC-ProTulibraries obtained with the HTP and LTP profiles.
Samples aRead Length
(bp)
Raw ReadsClear ReadsMapped Rates
(% of Total)
HTPCol-0-112523,692,67823,692,67882.09
Col-0-212523,536,69023,536,69081.41
Col-0-312524,361,66024,361,66084.04
P1Tu-112524,270,63424,270,63479.83
P1Tu-212523,727,16023,727,16079.97
P1Tu-312524,663,28024,663,28079.54
HC-ProTu-112523,502,83223,502,83277.45
HC-ProTu-212523,074,68823,074,68880.87
HC-ProTu-312523,817,24623,817,24679.23
P1/HC-ProTu-112523,104,48023,104,48075.27
P1/HC-ProTu-212523,766,69223,766,69273.56
P1/HC-ProTu-312521,935,51221,935,51277.24
LTPCol-0-1752,732,6722,611,63678.17
Col-0-2753,027,1922,895,78278.97
Col-0-3752,974,3242,844,91679.84
P1Tu-1753,072,7482,899,82280.16
P1Tu-2753,100,2262,956,54079.33
P1Tu-3752,309,8982,151,49280.63
HC-ProTu-1752,300,7762,196,49077.28
HC-ProTu-2752,814,4922,664,14278.34
HC-ProTu-3751,967,5201,888,40877.94
P1/HC-ProTu-1752,738,0242,609,92476.81
P1/HC-ProTu-2753,012,3222,866,21277.07
P1/HC-ProTu-3752,973,6522,817,06677.53
a 1, 2, and 3 represent three independent biological replicates.
Table 8. List of 75 overlapping genes in the P1/HC-ProTu-only section identified from both the HTP and LTP profiles.
AGIGene NameAnnotationFunctional Classification bABA/Ca cStresses d
AT1G48410AGO1Stabilizer of iron transporter SufD/Polynucleotidyl transferase
AT1G31280AGO2Argonaute family protein
AT4G12720NUDT7MutT/nudix family proteincell death
AT3G49530NAC062/NTL6NAC domain containing protein 62 cold
AT5G57560XTH22/TCH4Xyloglucan endotransglucosylase/hydrolase family protein cold
AT5G67300MYBR1/MYB44MYB domain protein r1ABAdrought
AT3G08760ATSIKProtein kinase superfamily protein drought
AT1G73330DR4Drought-repressed 4 drought
AT4G18880HSF A4AHeat shock transcription factor A4A drought
AT3G49810PUB30ARM repeat superfamily protein drought
AT3G08720S6K2Serine/threonine protein kinase 2 drought, cold
AT1G51660MKK4mitogen-activated protein kinase kinase 4 senescence
AT4G01250WRKY22WRKY family transcription factor senescence
AT3G48360BT2BTB and TAZ domain protein 2ABA
AT1G33560ADR1Disease resistance protein (CC-NBS-LRR class) family
AT1G08830CSD1Copper/zinc superoxide dismutase 1
AT2G28190CSD2Copper/zinc superoxide dismutase 2
AT5G41750DM1Disease resistance protein (TIR-NBS-LRR class) family
AT5G41080GDPD2PLC-like phosphodiesterases superfamily protein
AT1G25550HHO3/NIGT1.1MYB-like transcription factor family protein
AT3G10020HUP26Unknown protein; response to oxidative stress, anaerobic respiration
AT1G17420LOX3Lipoxygenase 3
AT1G72520LOX4PLAT/LH2 domain-containing lipoxygenase family protein
AT2G01180LPP1Phosphatidic acid phosphatase 1
AT1G01560MPK11MAP kinase 11
AT4G37260MYB73MYB domain protein 73
AT1G66090TIR-NBS-LRRDisease resistance protein (TIR-NBS class)
AT5G04720PHX21/ADR1-L2ADR1-like 2
AT4G17230SCL13SCARECROW-like 13
AT1G19020SDA1/HUP35Unknown protein
AT2G23810TET8Tetraspanin8
AT2G33770UBC24/PHO2Phosphate 2
AT1G56250VBF/PP2-B14Phloem protein 2-B14
AT1G12520CCSCopper chaperone for SOD1
AT1G70830MLP28MLP-like protein 28 cell death
AT5G02760APD7Protein phosphatase 2C family protein senescence
AT1G74670GASA6Gibberellin-regulated family proteinABA
AT5G27420ATL31/CNI1Carbon/nitrogen insensitive 1
AT2G22840GRF1Growth-regulating factor 1
AT3G05690NF-YA2/HAP2BNuclear factor Y, subunit A2
AT3G14020NF-YA6Nuclear factor Y, subunit A6
AT5G50570SPL13ASquamosa promoter-binding protein-like (SBP domain) transcription factor family protein
AT2G33810SPL3Squamosa promoter binding protein-like 3
AT5G60120TOE2Target of early activation tagged (EAT) 2
AT1G69530EXPA1Expansin A1
AT2G26190IQM4Calmodulin-binding family proteinCadrought
AT4G34150CaLBCalcium-dependent lipid-binding (CaLB domain) family proteinCa
AT3G16510CaLBCalcium-dependent lipid-binding (CaLB domain) family proteinCa
AT5G26920CBP60GCam-binding protein 60-like GCa
AT5G37770CML24/TCH2EF hand calcium-binding protein familyCa
AT5G66210CPK28Calcium-dependent protein kinase 28Ca
AT3G57530CPK32Calcium-dependent protein kinase 32Ca
AT1G27770ACA1Autoinhibited Ca2+-ATPase 1Ca
AT5G45340CYP707A3Cytochrome P450, family 707, subfamily A, polypeptide 3ABAdrought
AT5G08790ATAF2/ANAC081NAC (No Apical Meristem) domain Transcriptional regulator superfamily protein senescence
AT5G66070ATL27/ATARRERING/U-box superfamily proteinABA
AT3G25780AOC3Allene oxide cyclase 3
AT1G28370ERF11ERF domain protein 11
AT4G36040J11Chaperone DnaJ-domain superfamily protein
AT4G23180CRK10/RLK4Cysteine-rich RLK (RECEPTOR-like protein kinase) 10
AT3G26200CYP71B22Cytochrome P450, family 71, subfamily B, polypeptide 22
AT1G80610NAaUnknown protein
AT1G63750TIR-NBS-LRRDisease resistance protein (TIR-NBS-LRR class) family
AT4G32480NA aProtein of unknown function (DUF506)
AT3G15450NA aAluminium induced protein with YGL and LRDR motifs
AT4G23870NA aUnknown protein
AT5G46780NA aVQ motif-containing protein
AT2G39650NA aProtein of unknown function (DUF506)
AT1G77270NA aUnknown protein
AT2G29300NA aNAD(P)-binding Rossmann-fold superfamily protein
AT3G07350NAaProtein of unknown function (DUF506)
AT1G52820NA a2-oxoglutarate (2OG) and Fe(II)-dependent oxygenase superfamily protein
AT3G44400NA aDisease resistance protein (TIR-NBS-LRR class) family
AT5G44572PROSCOOP6Unknown protein
AT1G16110WAKL6Wall associated kinase-like 6
a NA indicates that the gene name is not available. b Functional classification of genes based on the color shown in the corresponding network. c Involvement of genes in the ABA and Ca2+ signaling pathways. d Classification of genes into the functional categories of drought responses (drought, salt, osmotic, salinity, dehydration, water loss, submergence, and water loading), cold responses (cold, low temperature, freeze, and chilling) and senescence responses (leaf senescence, chloroplast degradation, and cell death).
Publisher’s Note: MDPI stays neutral with regard to jurisdictional claims in published maps and institutional affiliations.

