
Adeno-Associated Vector-Delivered CRISPR/SaCas9 System Reduces Feline Leukemia Virus Production In Vitro


Abstract
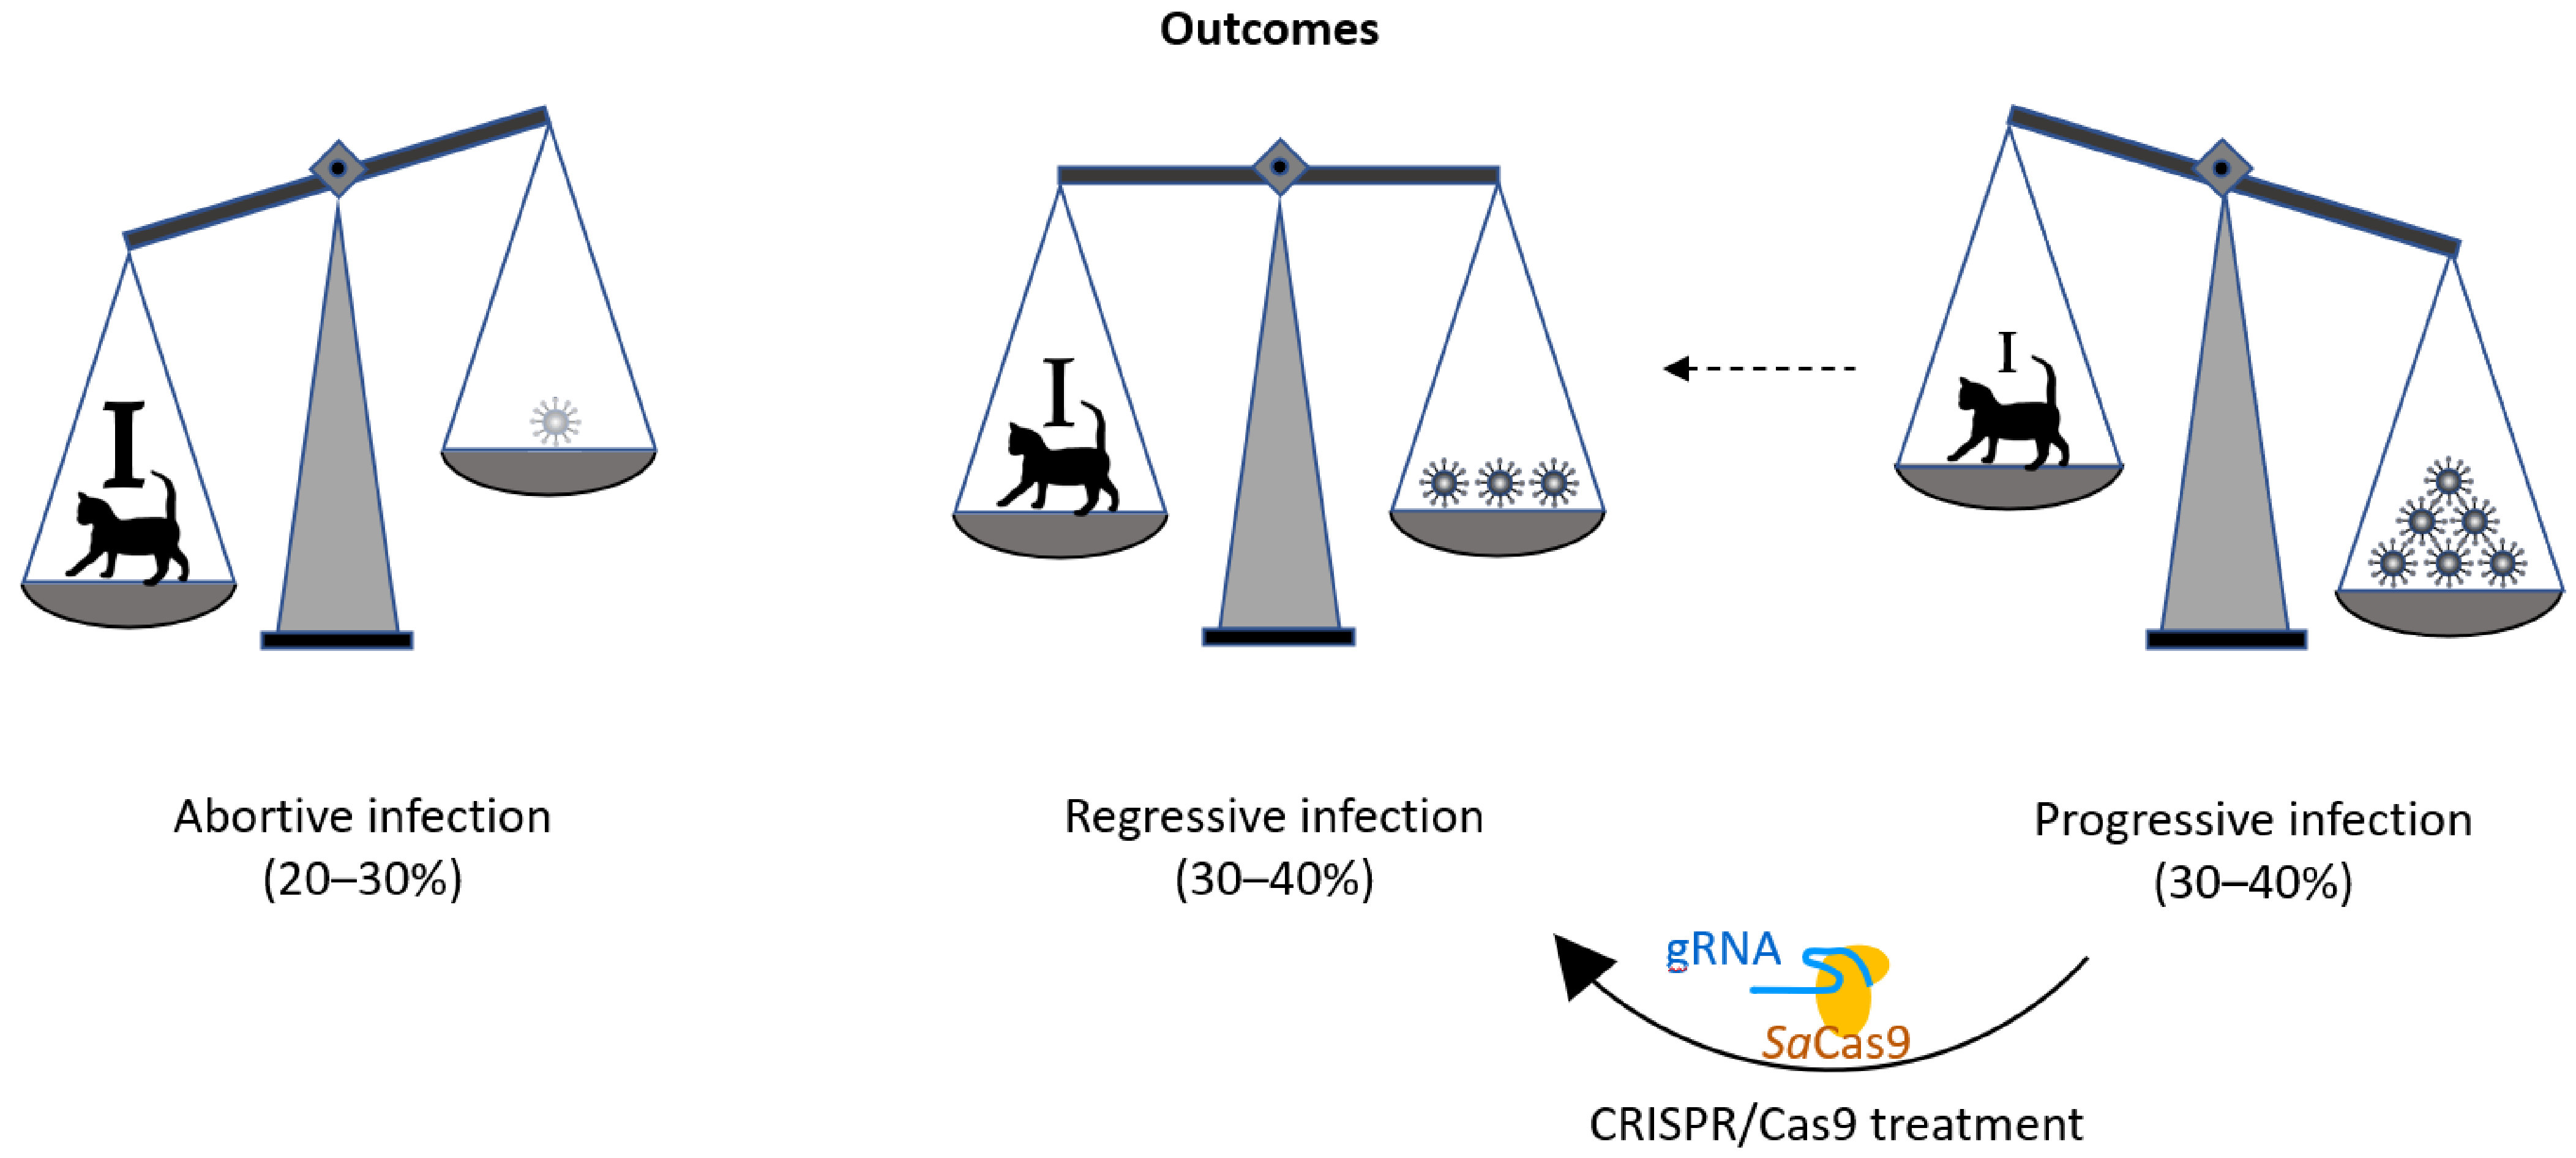
:1. Introduction
2. Materials and Methods
2.1. Cell Culture
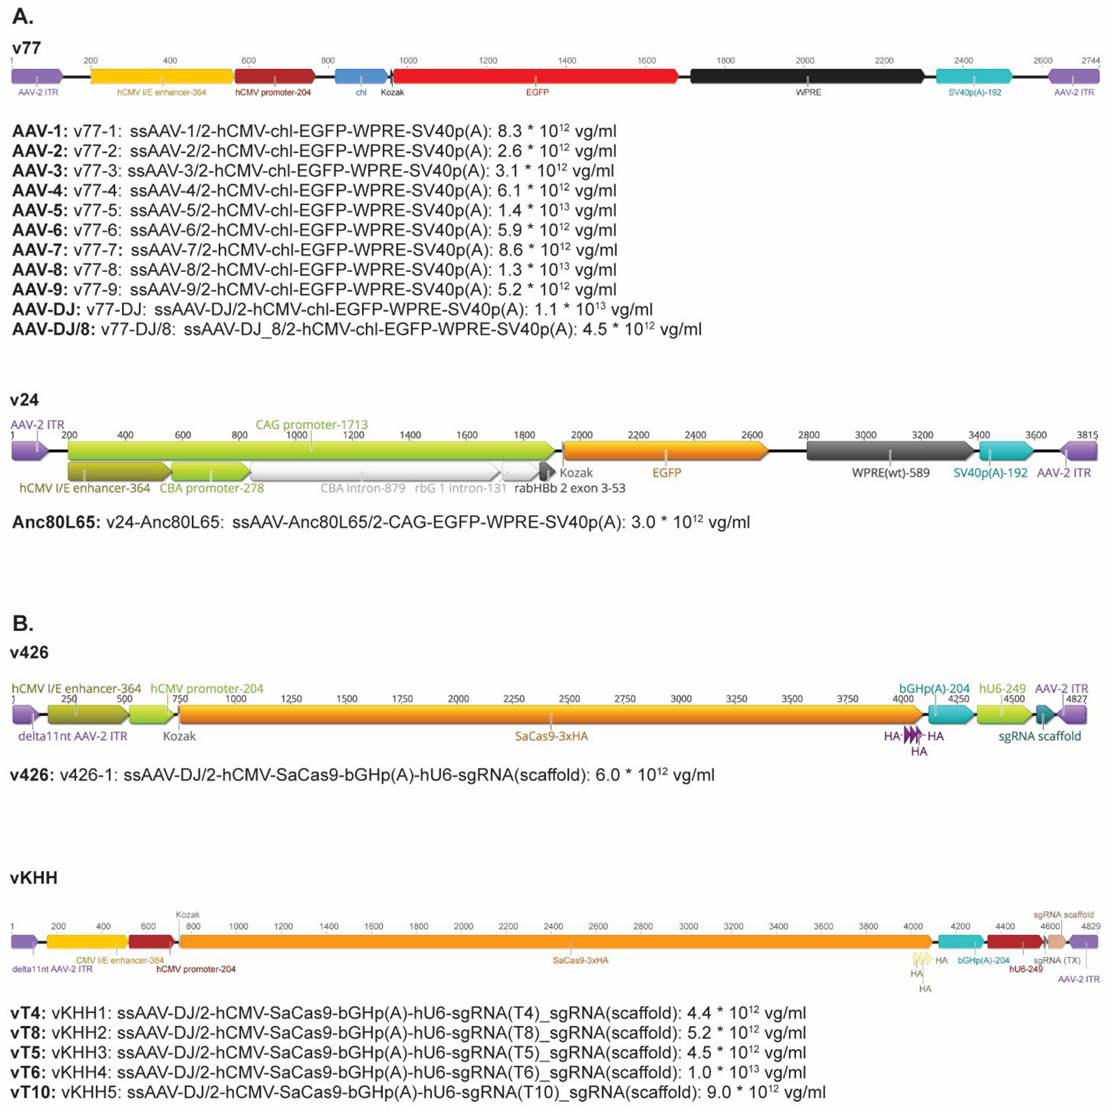
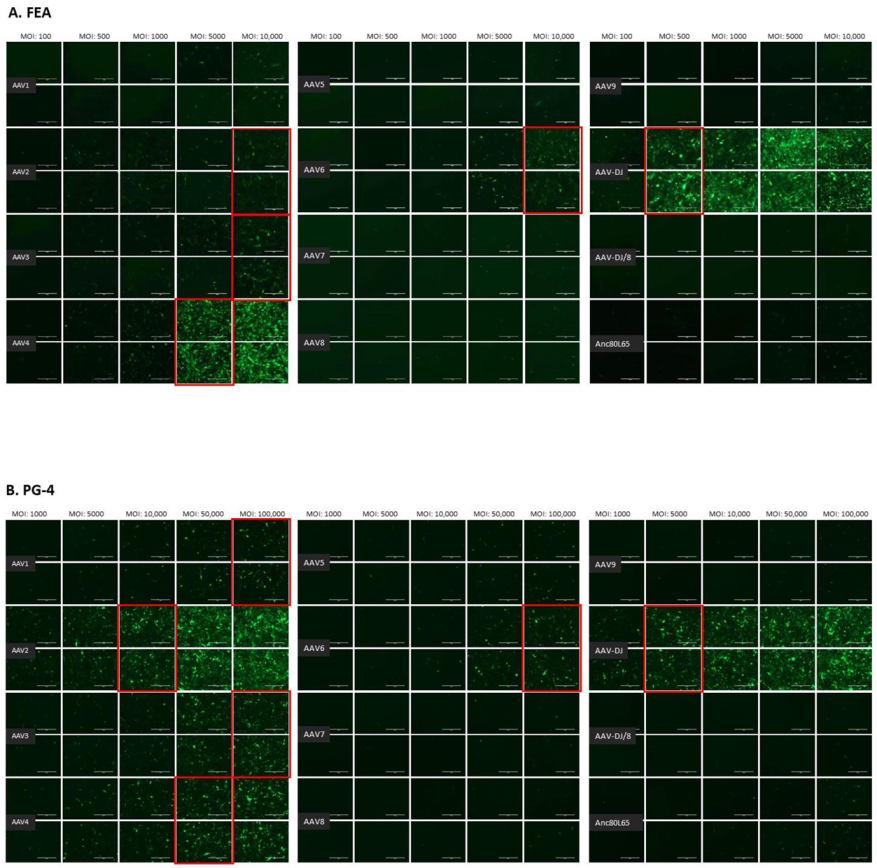
2.2. AAV Vectors and Their Infectivity In Vitro
2.3. Infection of Cells with FeLV-A/Glasgow-1 and FeLV Antigen Quantification
2.4. Gene Editing Technology and Target Selection
2.5. Transfection
2.6. Nucleic Acid Extractions and TaqMan Fluorogenic Real-Time PCR Assay
2.7. CRISPR Efficiency Analysis by T7 Endonuclease 1 (T7E1) Mismatch Detection Assay and Tracking of Indels by Decomposition (TIDE)
2.8. Production, Purification and Quantification of Single-Stranded (ss) AAV Vectors
2.9. Transduction of AAV- SaCas9 Vectors
2.10. Statistics
3. Results
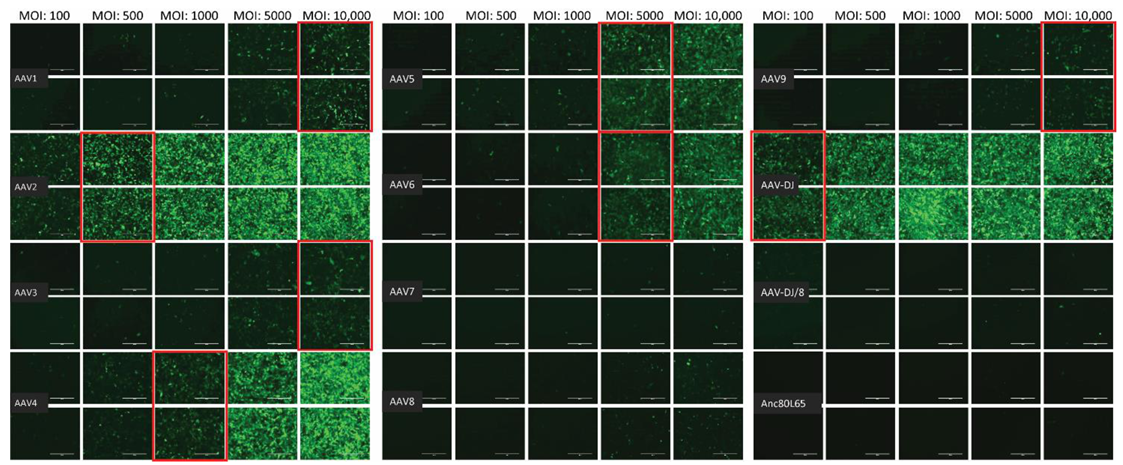
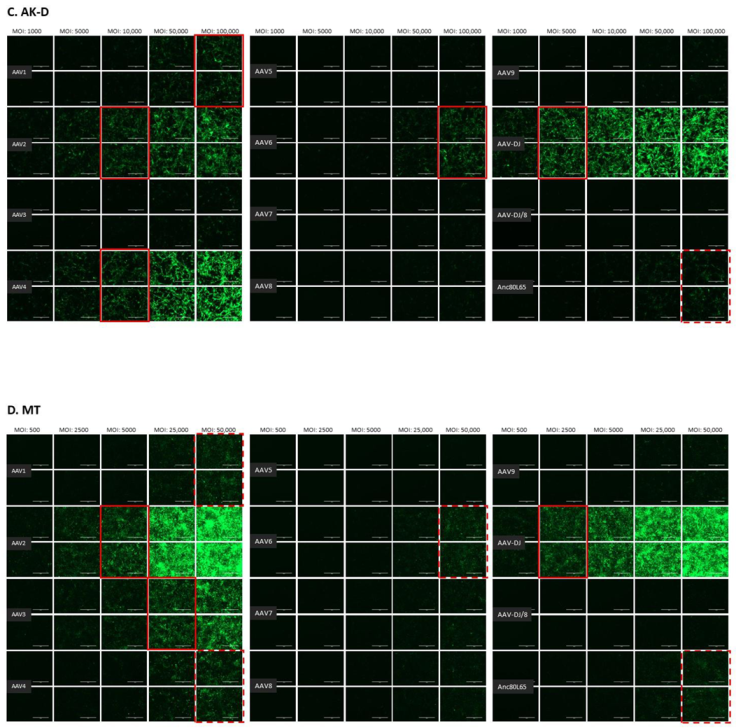
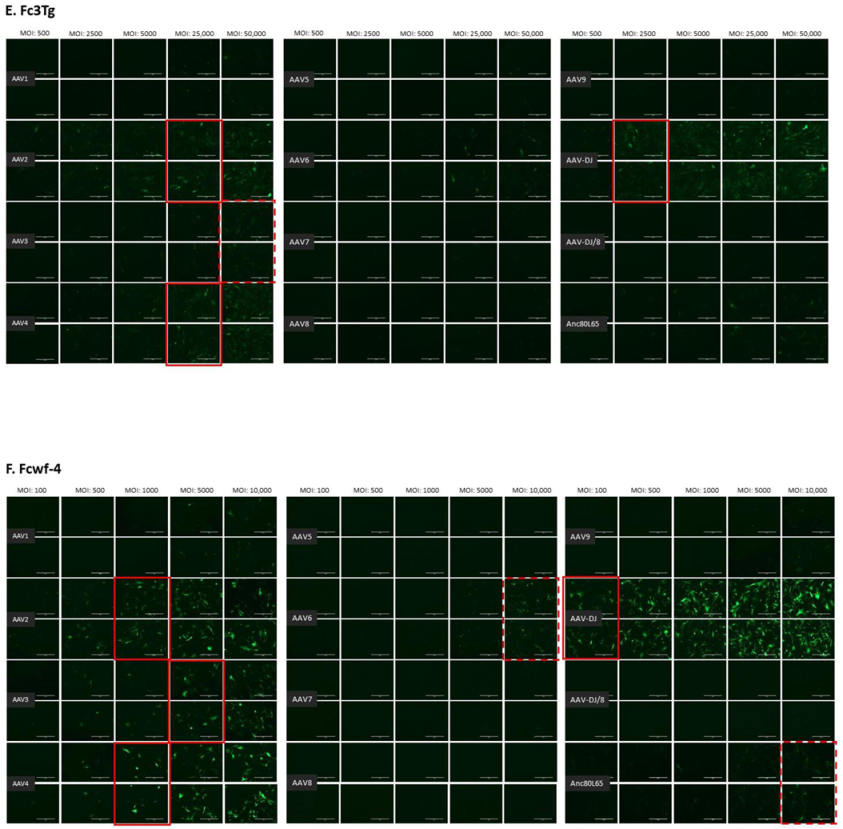
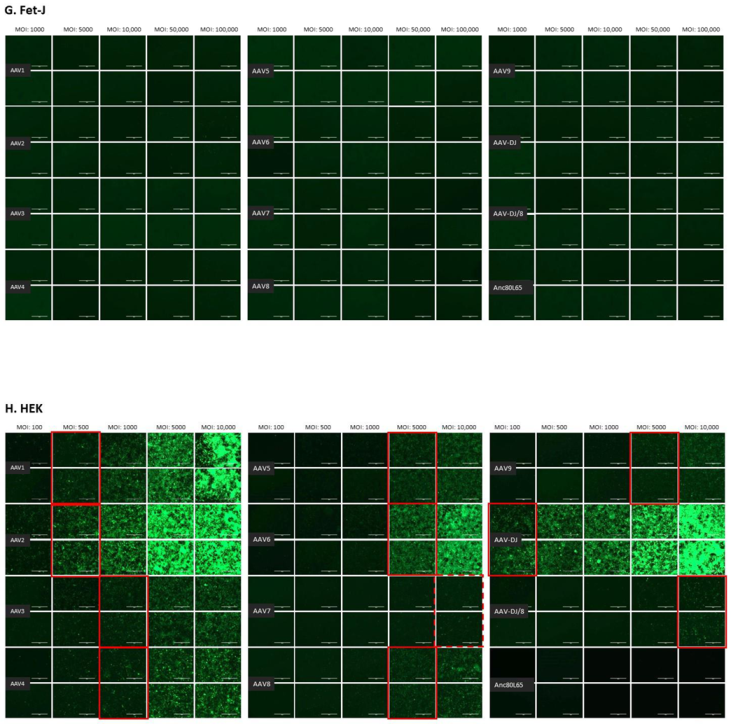
3.1. Cell Tropism of AAV Serotypes
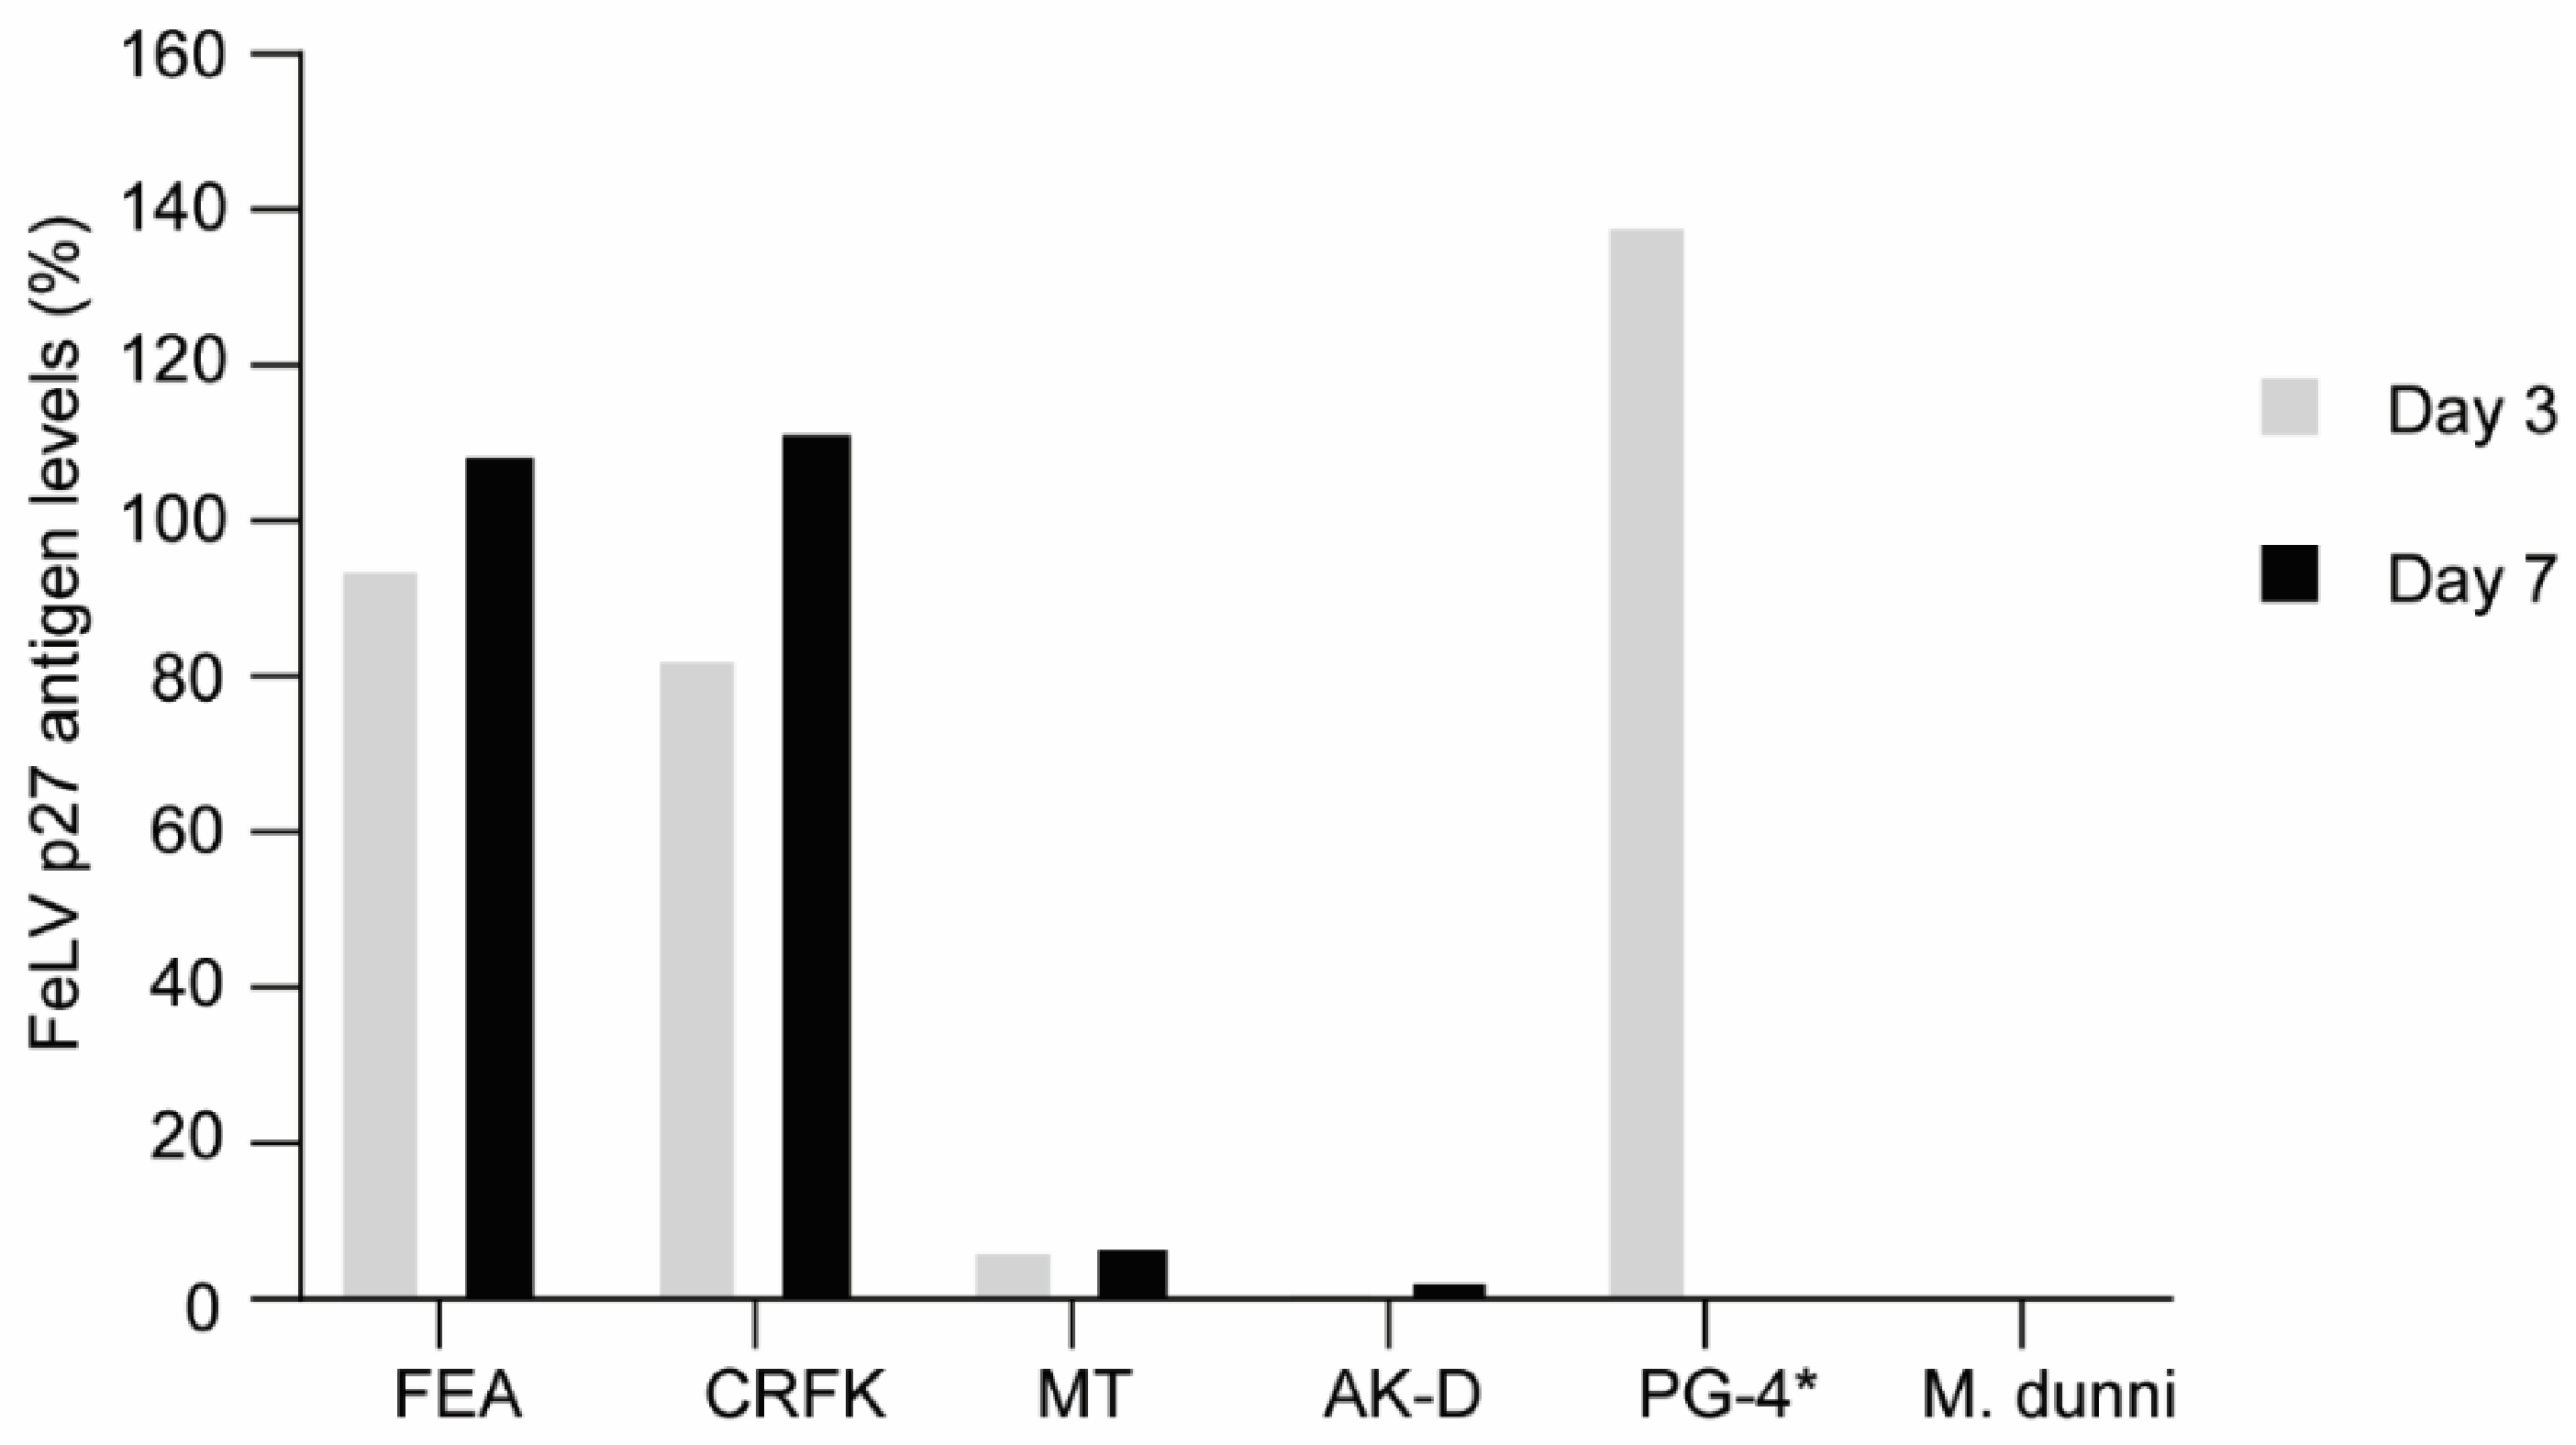
3.2. FeLV-A/Glasgow-1 Infection of Feline Cell Lines
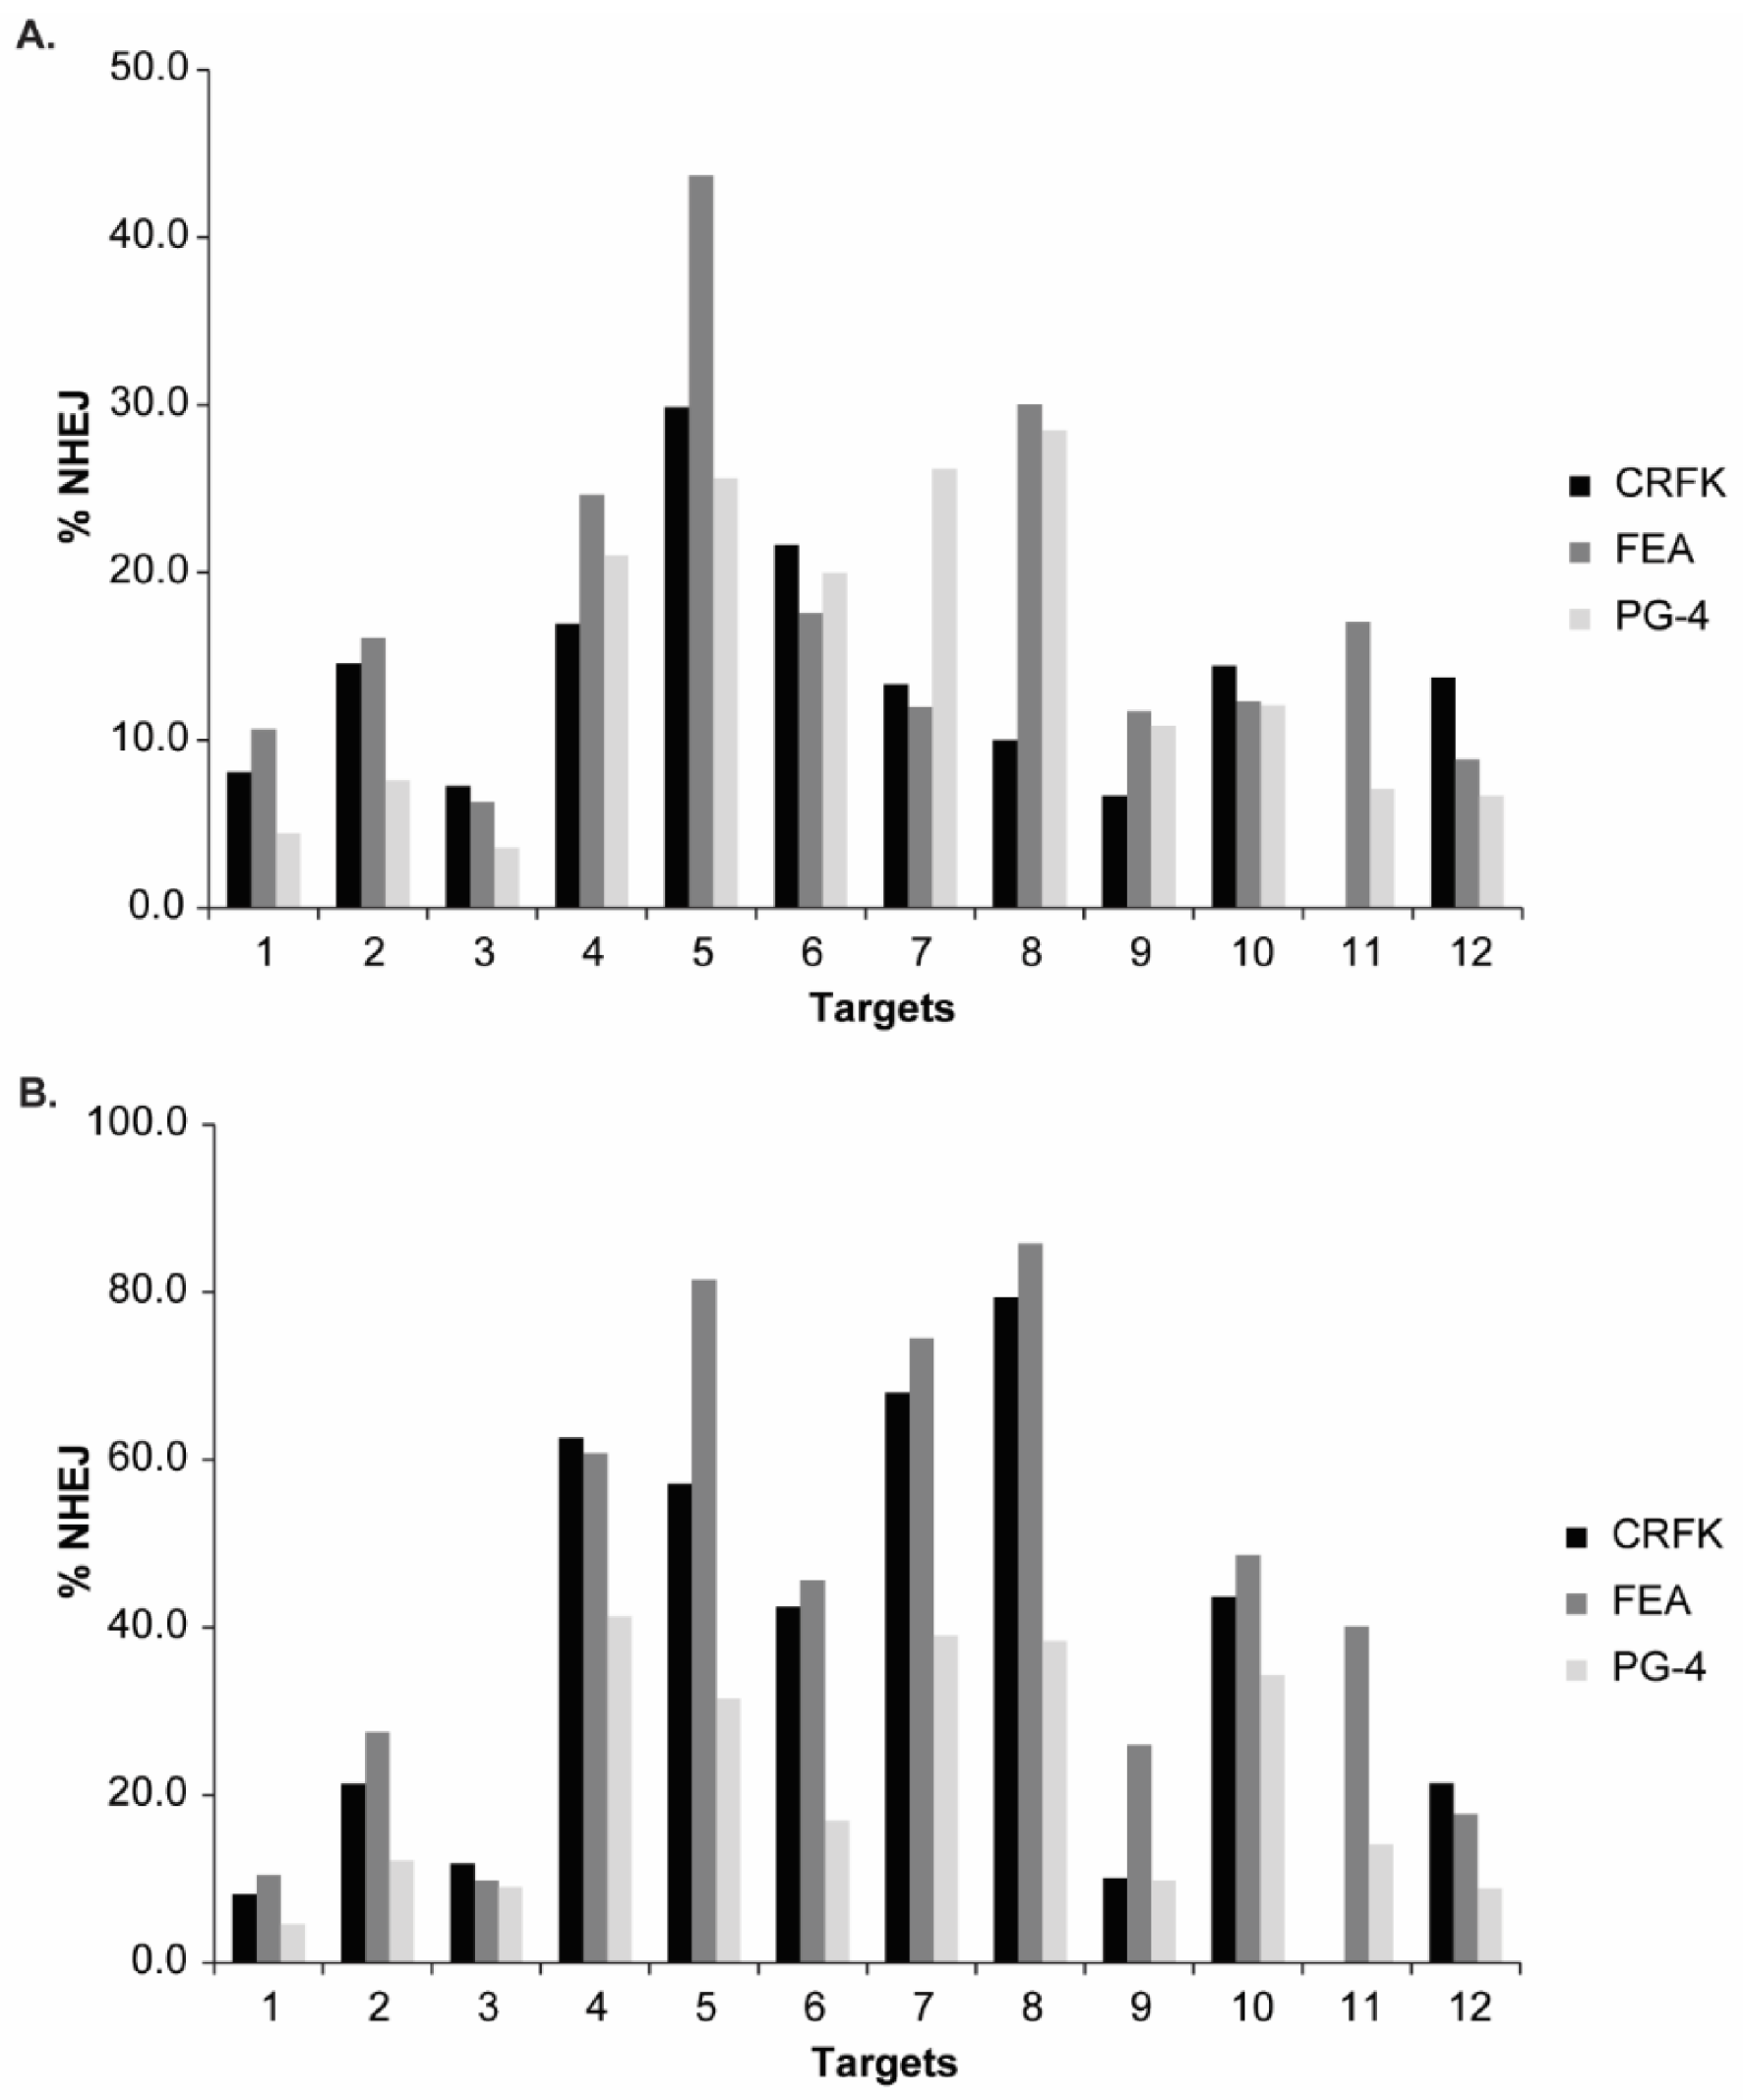
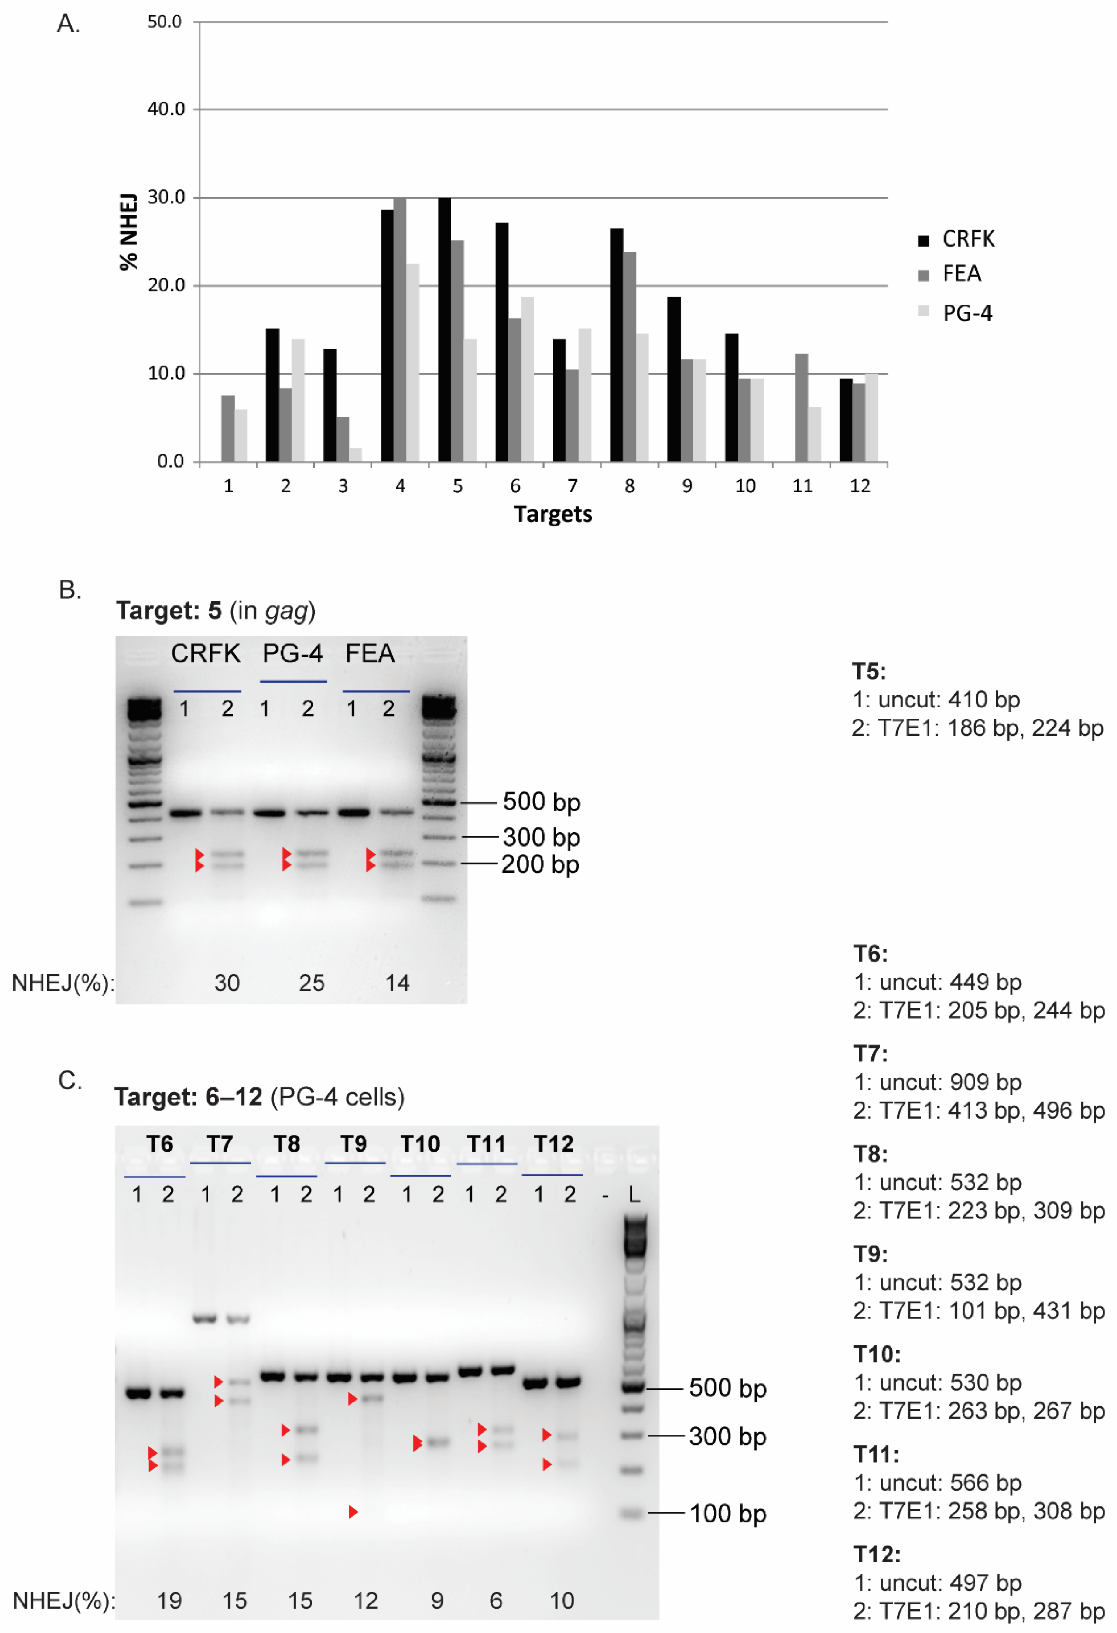
3.3. Validation of CRISPR/SaCas9 Targets by Transfection
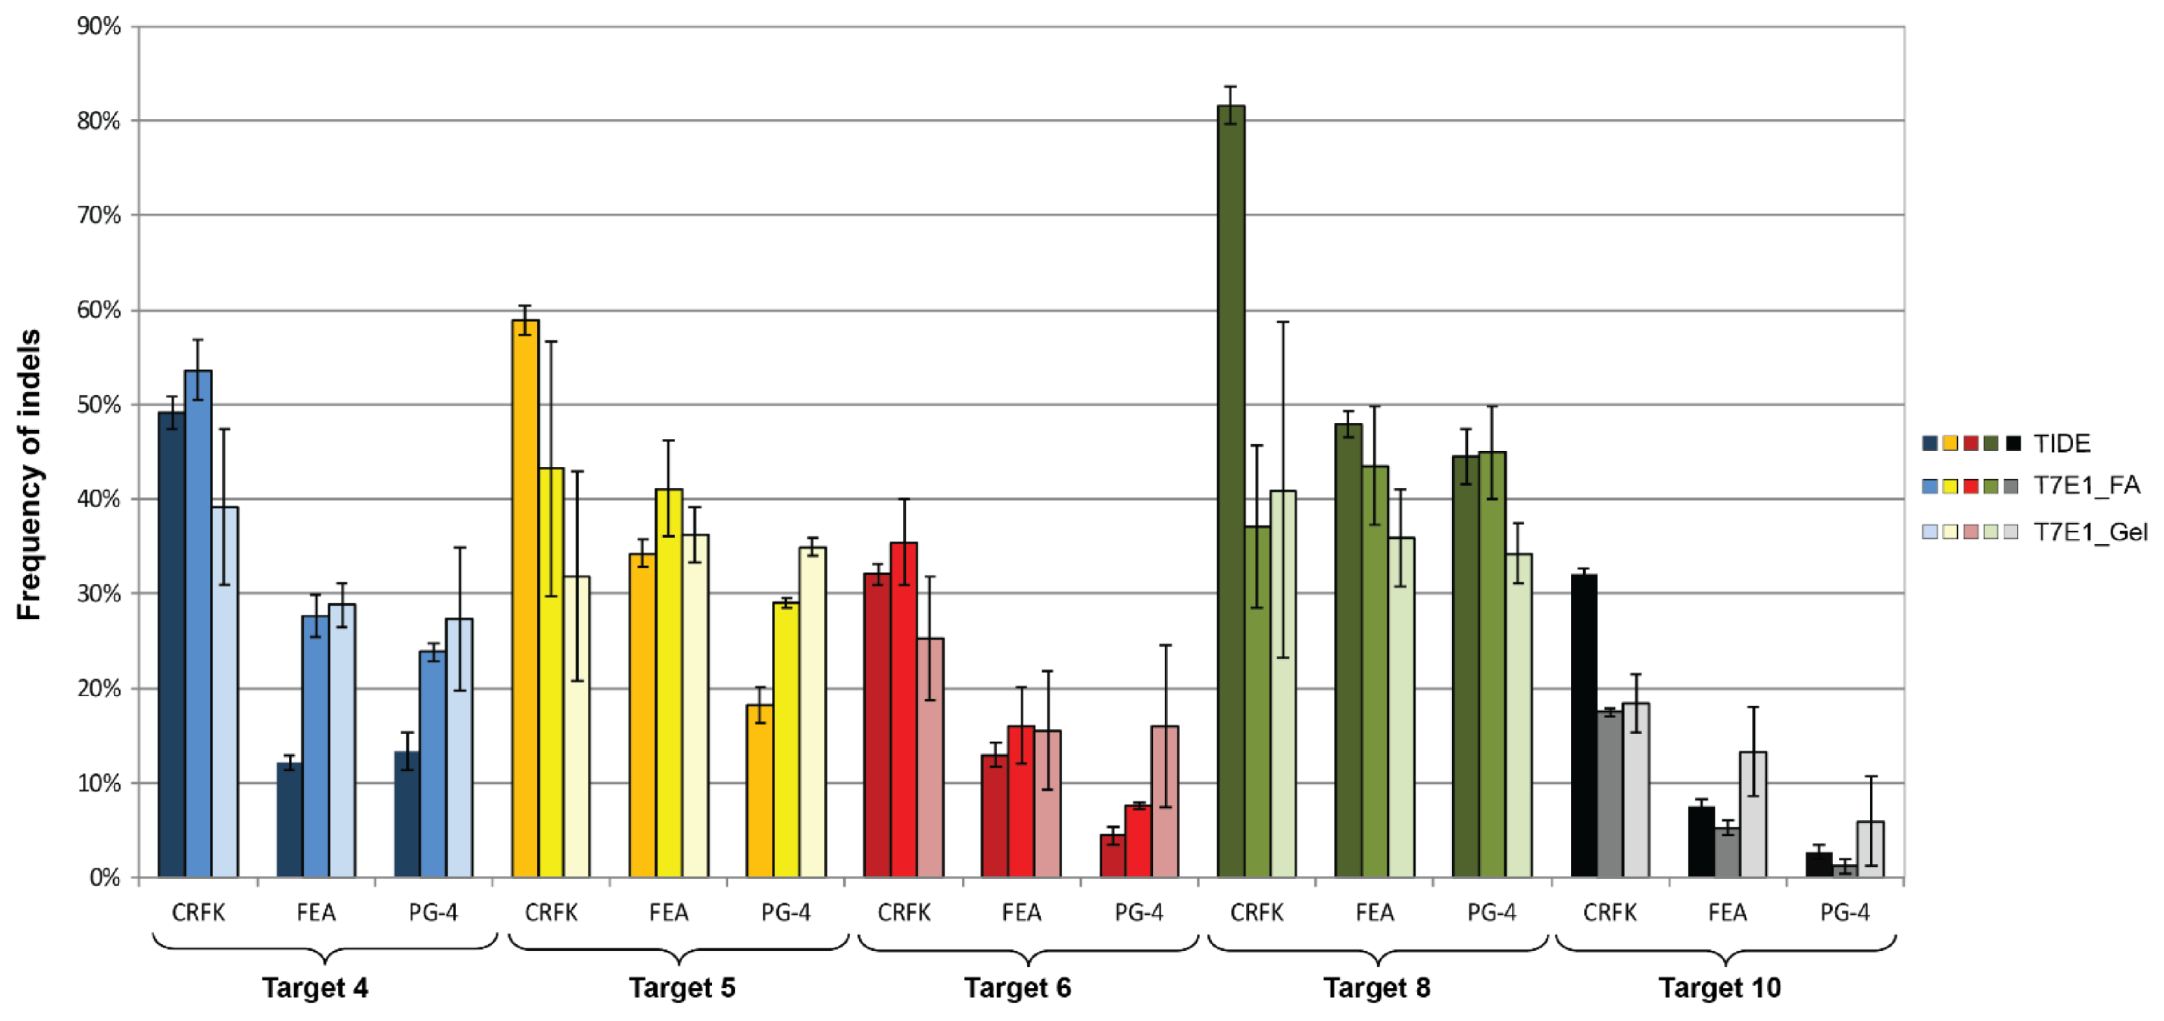
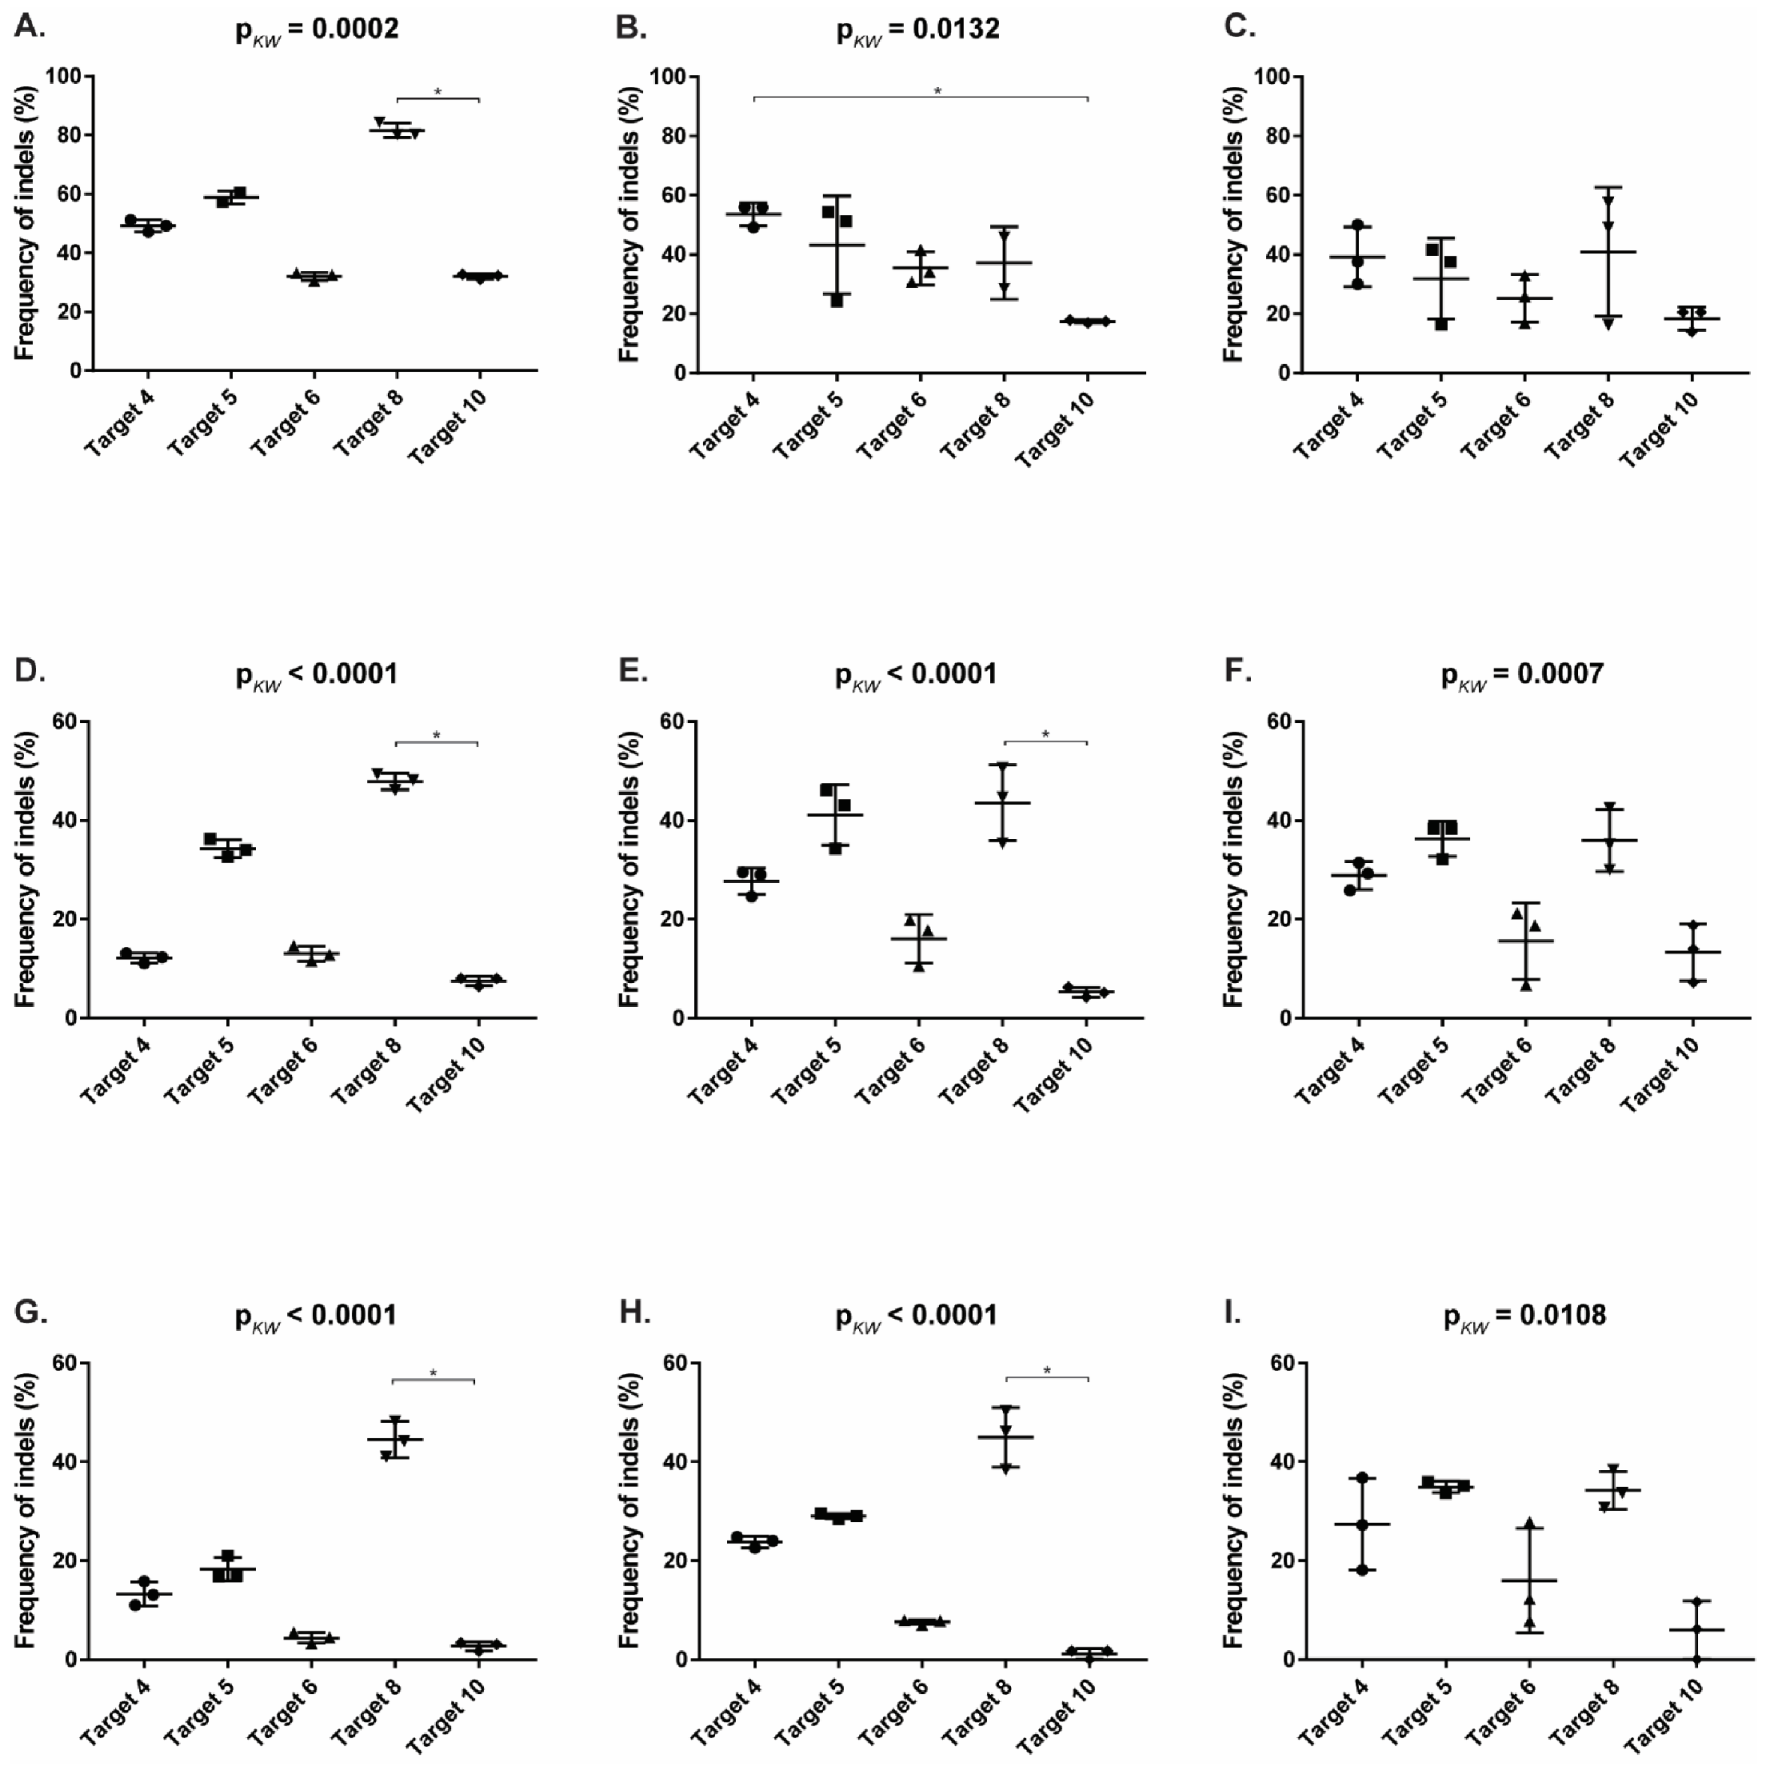
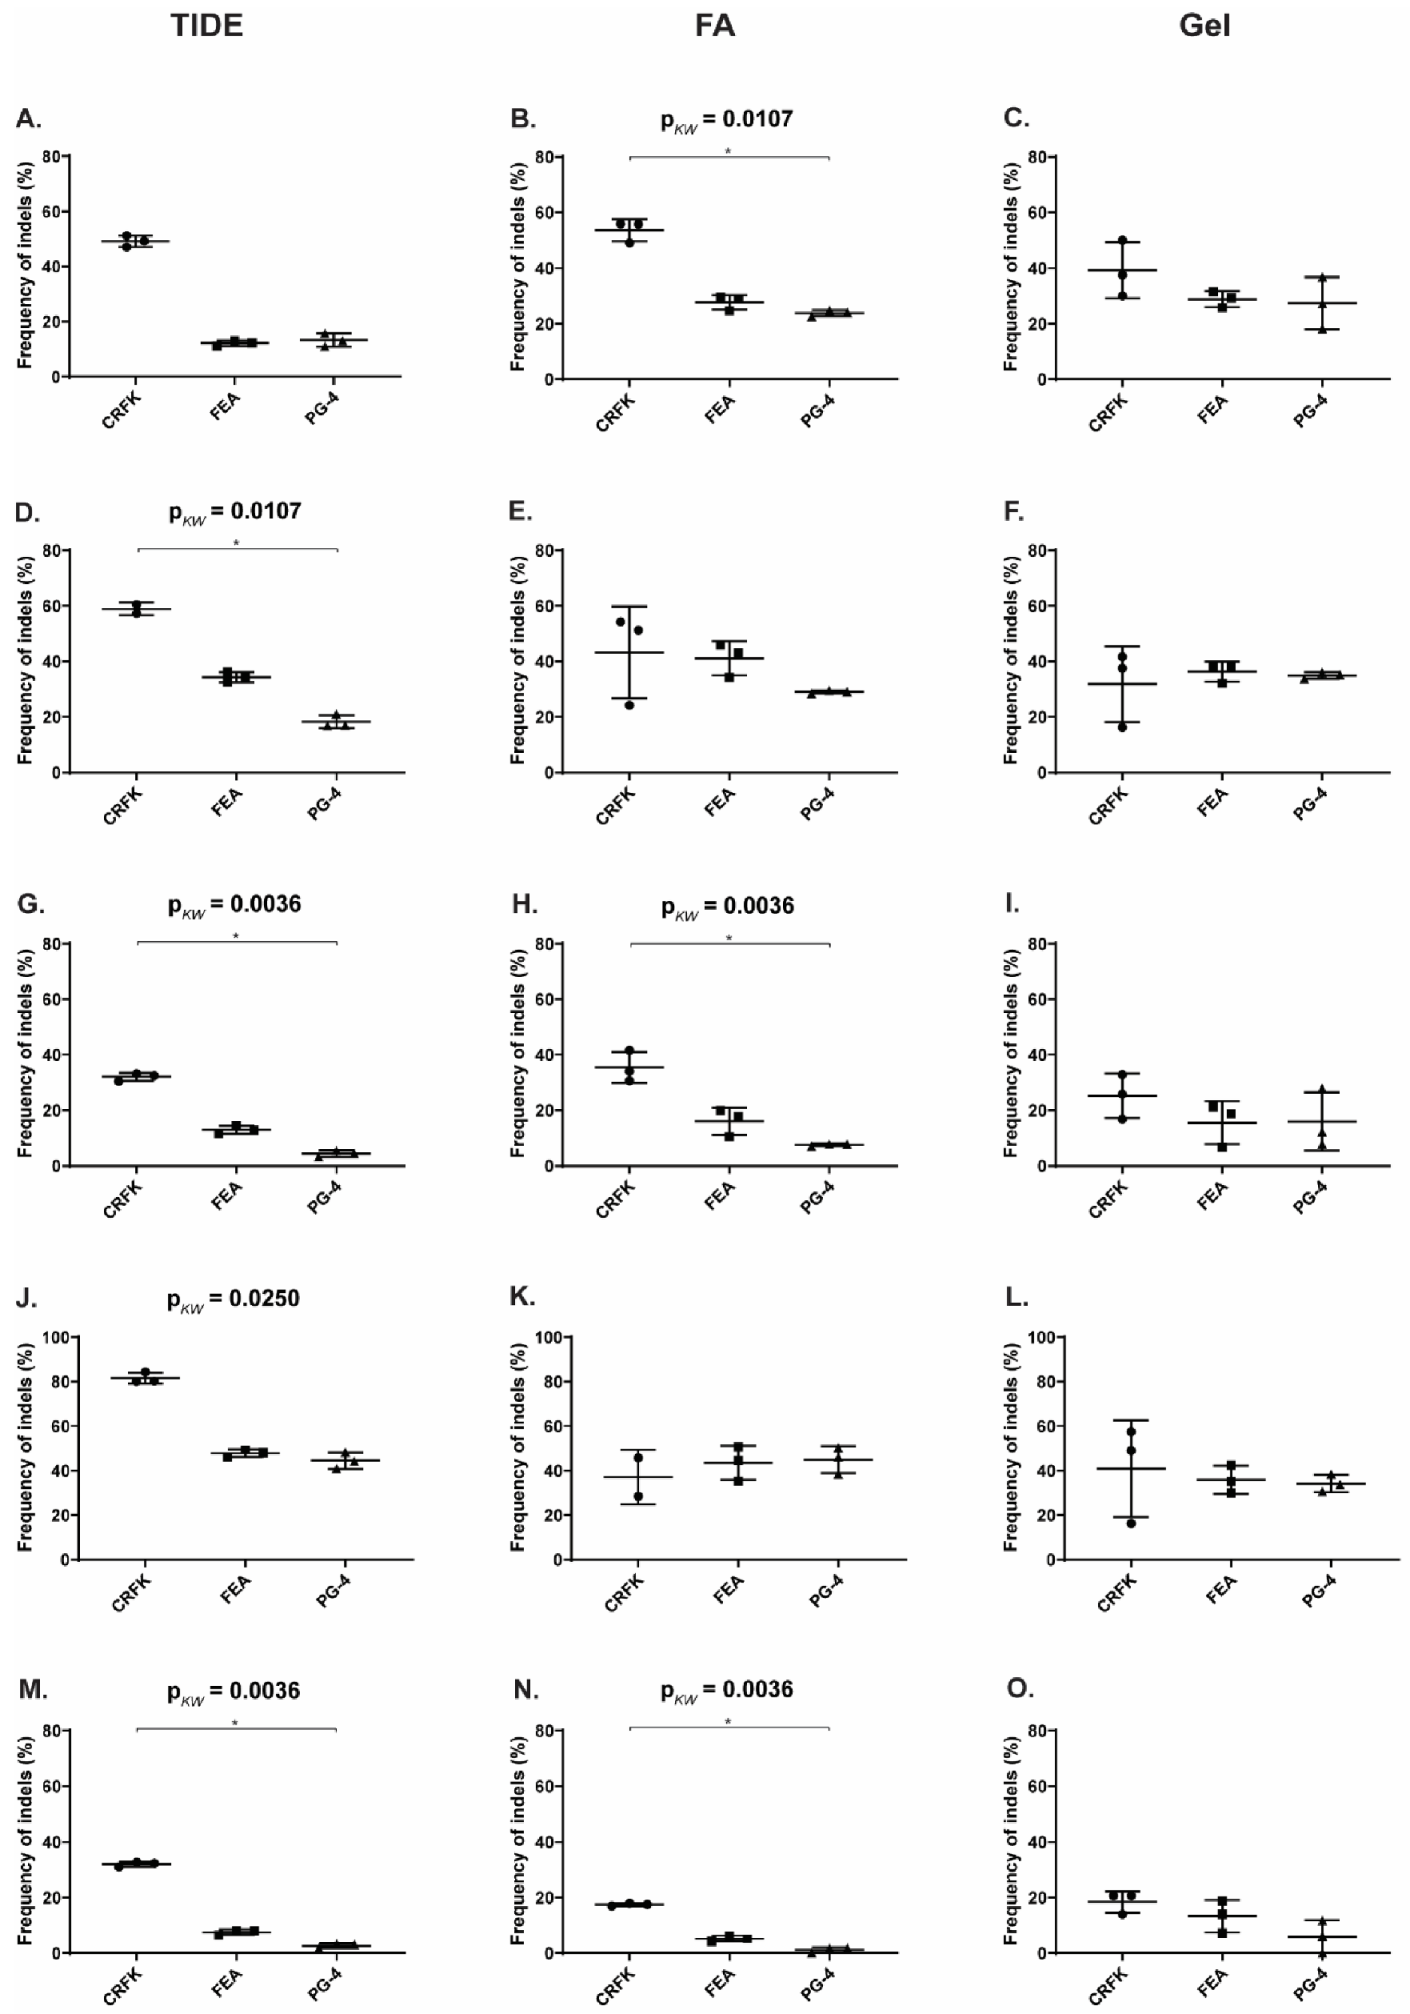
3.4. CRISPR/SaCas9 Activity on the Different FeLV Targets Using AAV-DJ as Gene Therapy Vector
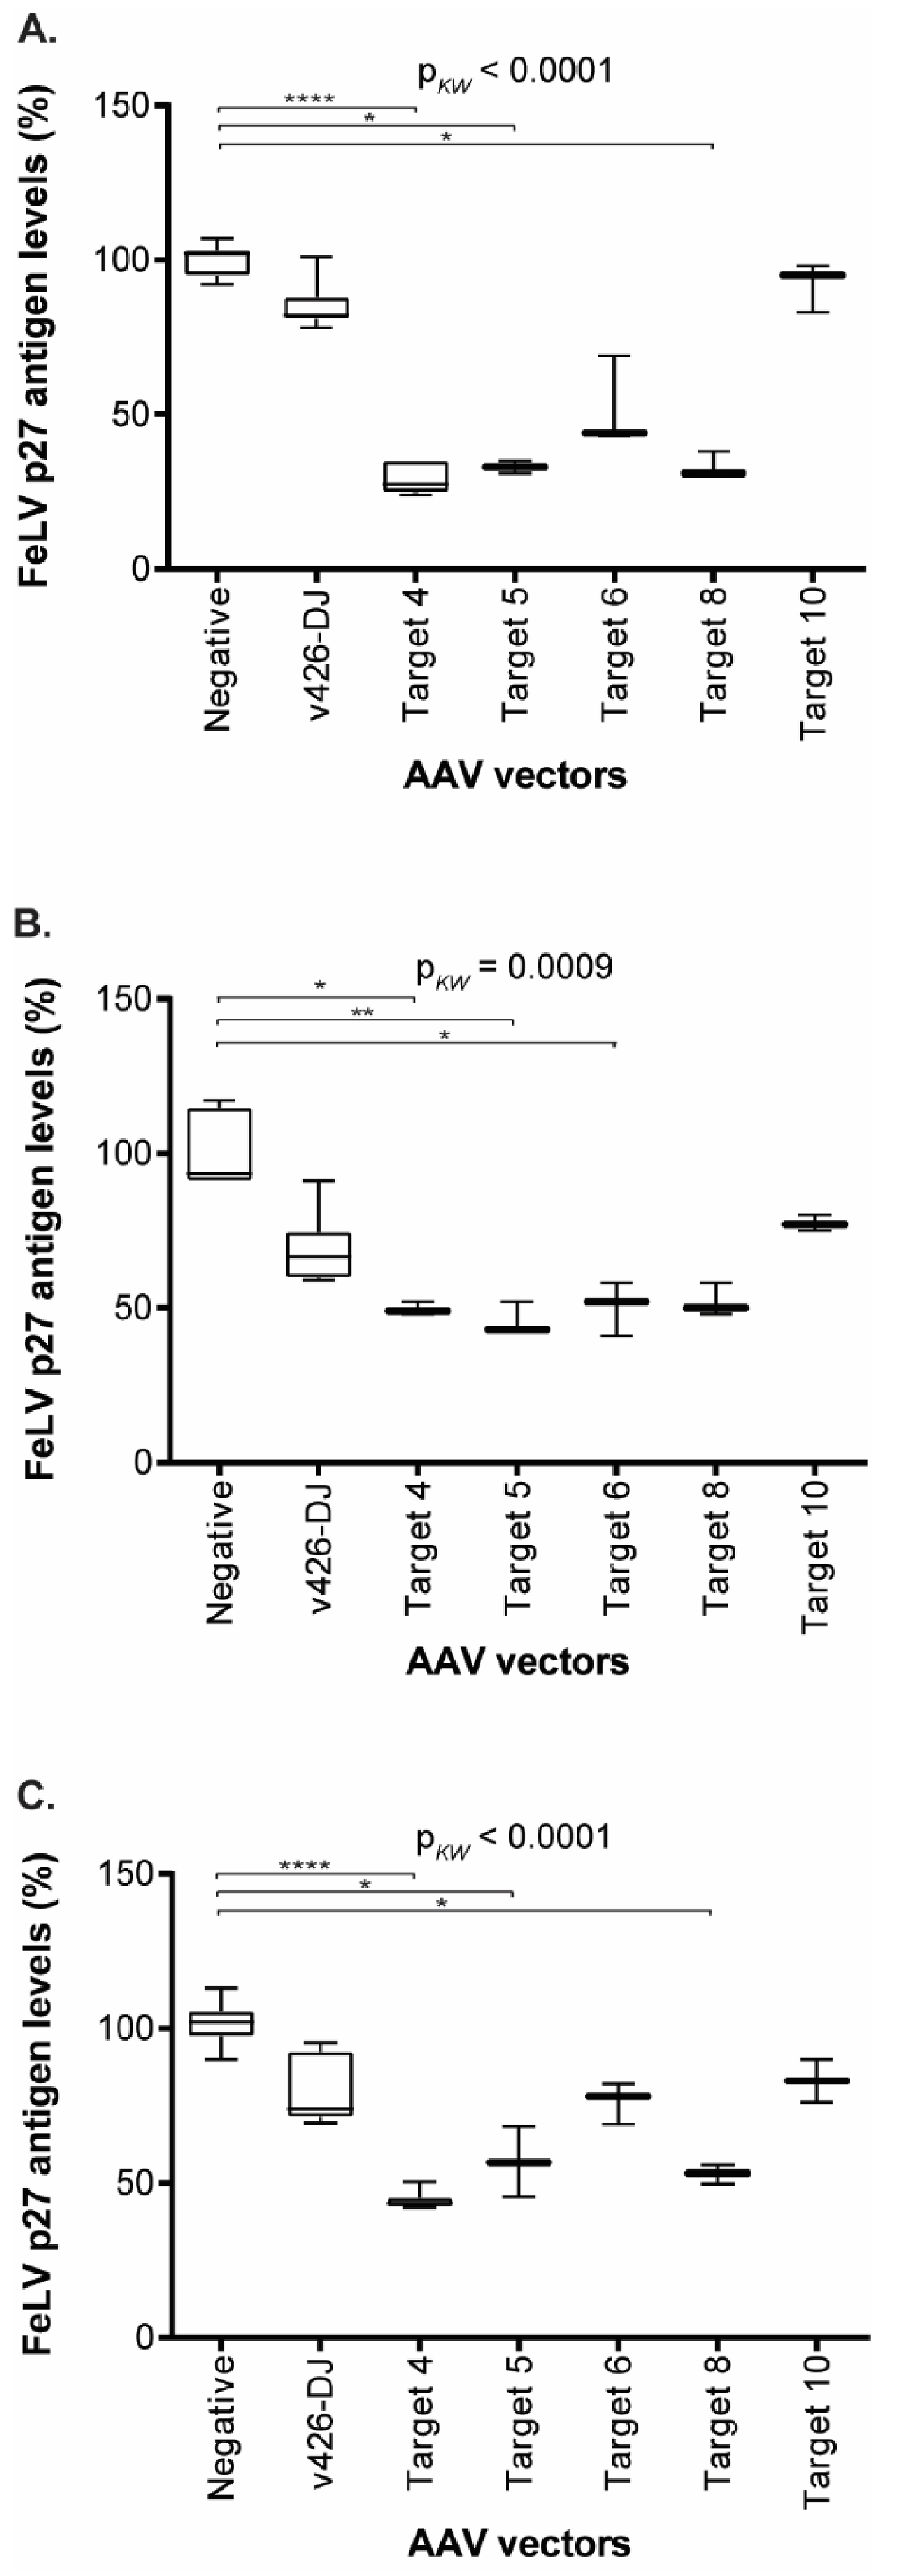
3.5. Reduction of FeLV Antigen in Different Cell Lines by AAV Transduction
4. Discussion
5. Conclusions
Supplementary Materials
Author Contributions
Funding
Institutional Review Board Statement
Informed Consent Statement
Data Availability Statement
Acknowledgments
Conflicts of Interest
Appendix A


References
- UNAIDS. Global HIV & AIDS Statistics–2020 Fact Sheet. 2021. Available online: https://www.unaids.org/en/resources/fact-sheet (accessed on 2 June 2021).
- Ananworanich, J.; Dubé, K.; Chomont, N. How does the timing of antiretroviral therapy initiation in acute infection affect HIV reservoirs? Curr. Opin. HIV AIDS 2015, 10, 18–28. [Google Scholar] [CrossRef]
- Studer, N.; Lutz, H.; Saegerman, C.; Gönczi, E.; Meli, M.L.; Boo, G.; Hartmann, K.; Hosie, M.J.; Moestl, K.; Tasker, S.; et al. Pan-European Study on the Prevalence of the Feline Leukaemia Virus Infection—Reported by the European Advisory Board on Cat Diseases (ABCD Europe). Viruses 2019, 11, 993. [Google Scholar] [CrossRef] [Green Version]
- Willett, B.J.; Hosie, M.J. Feline leukaemia virus: Half a century since its discovery. Vet. J. 2013, 195, 16–23. [Google Scholar] [CrossRef] [PubMed] [Green Version]
- Jarrett, W.; Mackey, L.; Jarrett, O.; Laird, H.; Hood, C. Antibody response and virus survival in cats vaccinated against feline leukaemia. Nat. Cell Biol. 1974, 248, 230–232. [Google Scholar] [CrossRef] [PubMed]
- Essex, M.; Hardy, W.D.; Cotter, S.M.; Jakowski, R.M. Immune Response of Healthy and Leukemic Cats to the Feline Oncornavirus-associated Cell Membrane Antigen. Unifying Concepts Leuk. 2015, 40, 483–488. [Google Scholar] [CrossRef]
- Hofmann-Lehmann, R.; Huder, J.B.; Gruber, S.; Boretti, F.; Sigrist, B.; Lutz, H. Feline leukaemia provirus load during the course of experimental infection and in naturally infected cats. J. Gen. Virol. 2001, 82, 1589–1596. [Google Scholar] [CrossRef]
- Jarrett, O.; Russell, P.H.; Stewart, M.F. Protection of kittens from feline leukaemia virus infection by maternally-derived antibody. Vet. Rec. 1977, 101, 304–305. [Google Scholar] [CrossRef]
- Flynn, J.N.; Hanlon, L.; Jarrett, O. Feline leukaemia virus: Protective immunity is mediated by virus-specific cytotoxic T lymphocytes. Immunology 2000, 101, 120–125. [Google Scholar] [CrossRef]
- Hoover, E.A.; Mullins, J.I. Feline leukemia virus infection and diseases. J. Am. Vet. Med. Assoc. 1991, 199, 1287–1297. [Google Scholar]
- Flynn, J.N.; Dunham, S.P.; Watson, V.; Jarrett, O. Longitudinal Analysis of Feline Leukemia Virus-Specific Cytotoxic T Lymphocytes: Correlation with Recovery from Infection. J. Virol. 2002, 76, 2306–2315. [Google Scholar] [CrossRef] [Green Version]
- McClelland, A.J.; Hardy, W.D.; Zuckerman, E.E. Prognosis of healthy feline leukemia virus infected cats. In Development in Cancer Research; Hardy, W.D., Essex, M., McClelland, A.J., Eds.; Elsevier Science: New York, NY, USA, 1980; Volume 4, pp. 121–126. [Google Scholar]
- Helfer-Hungerbuehler, A.K.; Widmer, S.; Kessler, Y.; Riond, B.; Boretti, F.S.; Grest, P.; Lutz, H.; Hofmann-Lehmann, R. Long-term follow up of feline leukemia virus infection and characterization of viral RNA loads using molecular methods in tissues of cats with different infection outcomes. Virus Res. 2014, 197, 137–150. [Google Scholar] [CrossRef] [PubMed]
- Hofmann-Lehmann, R.; Holznagel, E.; Aubert, A.; Ossent, P.; Reinacher, M.; Lutz, H. Recombinant FeLV vaccine: Long-term protection and effect on course and outcome of FIV infection. Vet. Immunol. Immunopathol. 1995, 46, 127–137. [Google Scholar] [CrossRef]
- Kuranda, K.; Jean-Alphonse, P.; Leborgne, C.; Hardet, R.; Collaud, F.; Marmier, S.; Verdera, H.C.; Ronzitti, G.; Veron, P.; Mingozzi, F. Exposure to wild-type AAV drives distinct capsid immunity profiles in humans. J. Clin. Investig. 2018, 128, 5267–5279. [Google Scholar] [CrossRef] [PubMed]
- Flotte, T.; Carter, B.; Conrad, C.; Guggino, W.; Reynolds, T.; Rosenstein, B.; Taylor, G.; Walden, S.; Wetzel, R. A Phase I Study of an Adeno-Associated Virus-CFTR Gene Vector in Adult CF Patients with Mild Lung Disease. Johns Hopkins Children’s Center, Baltimore, Maryland. Hum. Gene Ther. 1996, 7, 1145–1159. [Google Scholar] [CrossRef]
- Manno, C.S.; Pierce, G.F.; Arruda, V.R.; Glader, B.; Ragni, M.; Rasko, J.J.; Ozelo, M.C.; Hoots, K.; Blatt, P.; Konkle, B.; et al. Successful transduction of liver in hemophilia by AAV-Factor IX and limitations imposed by the host immune response. Nat. Med. 2006, 12, 342–347. [Google Scholar] [CrossRef]
- Jiang, H.; Couto, L.B.; Patarroyo-White, S.; Liu, T.; Nagy, D.; Vargas, J.A.; Zhou, S.; Scallan, C.D.; Sommer, J.; Vijay, S.; et al. Effects of transient immunosuppression on adenoassociated, virus-mediated, liver-directed gene transfer in rhesus macaques and implications for human gene therapy. Blood 2006, 108, 3321–3328. [Google Scholar] [CrossRef] [Green Version]
- Scallan, C.D.; Jiang, H.; Liu, T.; Patarroyo-White, S.; Sommer, J.M.; Zhou, S.; Couto, L.B.; Pierce, G.F. Human immunoglobulin inhibits liver transduction by AAV vectors at low AAV2 neutralizing titers in SCID mice. Blood 2006, 107, 1810–1817. [Google Scholar] [CrossRef] [PubMed] [Green Version]
- Li, P.; Boenzli, E.; Hofmann-Lehmann, R.; Helfer-Hungerbuehler, A.K. Pre-existing antibodies to candidate gene therapy vectors (adeno-associated vector serotypes) in domestic cats. PLoS ONE 2019, 14, e0212811. [Google Scholar] [CrossRef]
- Adachi, K.; Dissen, G.A.; Lomniczi, A.; Xie, Q.; Ojeda, S.R.; Nakai, H. Adeno-associated virus-binding antibodies detected in cats living in the Northeastern United States lack neutralizing activity. Sci. Rep. 2020, 10, 1–13. [Google Scholar] [CrossRef]
- Dissen, G.A.; Adachi, K.; Lomniczi, A.; Chatkupt, T.; Davidson, B.L.; Nakai, H.; Ojeda, S.R. Engineering a gene silencing viral construct that targets the cat hypothalamus to induce permanent sterility: An update. Reprod. Domest. Anim. 2016, 52, 354–358. [Google Scholar] [CrossRef] [Green Version]
- Bradbury, A.M.; Cochran, N.; McCurdy, V.J.; Johnson, A.K.; Brunson, B.L.; Gray-Edwards, H.; Leroy, S.G.; Hwang, M.; Randle, A.N.; Jackson, L.S.; et al. Therapeutic Response in Feline Sandhoff Disease Despite Immunity to Intracranial Gene Therapy. Mol. Ther. 2013, 21, 1306–1315. [Google Scholar] [CrossRef] [PubMed] [Green Version]
- Bradbury, A.M.; Peterson, T.A.; Gross, A.L.; Wells, S.Z.; McCurdy, V.J.; Wolfe, K.G.; Dennis, J.C.; Brunson, B.L.; Gray-Edwards, H.; Randle, A.N.; et al. AAV-mediated gene delivery attenuates neuroinflammation in feline Sandhoff disease. Neuroscience 2017, 340, 117–125. [Google Scholar] [CrossRef] [PubMed] [Green Version]
- Yoon, S.Y.; Bagel, J.H.; O’Donnell, P.A.; Vite, C.H.; Wolfe, J.H. Clinical Improvement of Alpha-mannosidosis Cat Following a Single Cisterna Magna Infusion of AAV1. Mol. Ther. 2016, 24, 26–33. [Google Scholar] [CrossRef] [Green Version]
- McCurdy, V.J.; Rockwell, H.E.; Arthur, J.R.; Bradbury, A.M.; Johnson, A.K.; Randle, A.N.; Brunson, B.L.; Hwang, M.; GrayEdwards, H.L.; Morrison, N.E.; et al. Widespread correction of central nervous system disease after intracranial gene therapy in a feline model of Sandhoff disease. Gene Ther. 2015, 22, 181–189. [Google Scholar] [CrossRef] [Green Version]
- Rockwell, H.E.; McCurdy, V.J.; Eaton, S.C.; Wilson, D.U.; Johnson, A.K.; Randle, A.N.; Bradbury, A.M.; Gray-Edwards, H.L.; Baker, H.J.; Hudson, J.A.; et al. AAV-Mediated Gene Delivery in a Feline Model of Sandhoff Disease Corrects Lysosomal Storage in the Central Nervous System. ASN Neuro 2015, 7, 1759091415569908. [Google Scholar] [CrossRef]
- Choudhury, S.R.; Fitzpatrick, Z.; Harris, A.F.; Maitland, S.A.; Ferreira, J.S.; Zhang, Y.; Ma, S.; Sharma, R.B.; Gray-Edwards, H.L.; Johnson, J.A.; et al. In Vivo Selection Yields AAV-B1 Capsid for Central Nervous System and Muscle Gene Therapy. Mol. Ther. 2016, 24, 1247–1257. [Google Scholar] [CrossRef] [Green Version]
- Choudhury, S.R.; Harris, A.F.; Cabral, D.; Keeler, A.M.; Sapp, E.; Ferreira, J.S.; Gray-Edwards, H.L.; Johnson, J.A.; Johnson, A.K.; Su, Q.; et al. Widespread Central Nervous System Gene Transfer and Silencing After Systemic Delivery of Novel AAV-AS Vector. Mol. Ther. 2016, 24, 726–735. [Google Scholar] [CrossRef] [Green Version]
- Jinek, M.; Chylinski, K.; Fonfara, I.; Hauer, M.; Doudna, J.A.; Charpentier, E. A Programmable dual-RNA-guided DNA endonuclease in adaptive bacterial immunity. Science 2012, 337, 816–821. [Google Scholar] [CrossRef]
- Gasiunas, G.; Barrangou, R.; Horvath, P.; Siksnys, V. Cas9-crRNA ribonucleoprotein complex mediates specific DNA cleavage for adaptive immunity in bacteria. Proc. Natl. Acad. Sci. USA 2012, 109, E2579–E2586. [Google Scholar] [CrossRef] [Green Version]
- Garneau, J.E.; Dupuis, M.-È.; Villion, M.; Romero, D.A.; Barrangou, R.; Boyaval, P.; Fremaux, C.; Horvath, P.; Magadán, A.H.; Moineau, S. The CRISPR/Cas bacterial immune system cleaves bacteriophage and plasmid DNA. Nature 2010, 468, 67–71. [Google Scholar] [CrossRef]
- Deveau, H.; Garneau, J.E.; Moineau, S. CRISPR/Cas System and Its Role in Phage-Bacteria Interactions. Annu. Rev. Microbiol. 2010, 64, 475–493. [Google Scholar] [CrossRef]
- Horvath, P.; Barrangou, R. CRISPR/Cas, the Immune System of Bacteria and Archaea. Science 2010, 327, 167–170. [Google Scholar] [CrossRef] [PubMed] [Green Version]
- Makarova, K.S.; Haft, D.H.; Barrangou, R.; Brouns, S.J.J.; Charpentier, E.; Horvath, P.; Moineau, S.; Mojica, F.J.M.; Wolf, Y.I.; Yakunin, A.F.; et al. Evolution and classification of the CRISPR–Cas systems. Nat. Rev. Microbiol. Genet. 2011, 9, 467–477. [Google Scholar] [CrossRef] [PubMed] [Green Version]
- Ran, F.A.; Cong, L.; Yan, W.X.; Scott, D.A.; Gootenberg, J.; Kriz, A.J.; Zetsche, B.; Shalem, O.; Wu, X.; Makarova, K.S.; et al. In vivo genome editing using Staphylococcus aureus Cas9. Nat. Cell Biol. 2015, 520, 186–191. [Google Scholar] [CrossRef]
- Anders, C.; Niewoehner, O.; Duerst, A.; Jinek, M. Structural basis of PAM-dependent target DNA recognition by the Cas9 endonuclease. Nat. Cell Biol. 2014, 513, 569–573. [Google Scholar] [CrossRef]
- Doench, J.G.; Fusi, N.; Sullender, M.; Hegde, M.; Vaimberg, E.W.; Donovan, K.F.; Smith, I.; Tothova, Z.; Wilen, C.; Orchard, R.; et al. Optimized sgRNA design to maximize activity and minimize off-target effects of CRISPR-Cas9. Nat. Biotechnol. 2016, 34, 184–191. [Google Scholar] [CrossRef] [PubMed] [Green Version]
- Isaac, R.S.; Jiang, F.; Doudna, J.A.; Lim, W.A.; Narlikar, G.J.; Ab Almeida, R. Nucleosome breathing and remodeling constrain CRISPR-Cas9 function. eLife 2016, 5, e13450. [Google Scholar] [CrossRef] [PubMed]
- Horlbeck, M.A.; Witkowsky, L.B.; Guglielmi, B.; Replogle, J.; Gilbert, L.; Villalta, J.E.; Torigoe, S.; Tjian, R.; Weissman, J.S. Nucleosomes impede Cas9 access to DNA in vivo and in vitro. eLife 2016, 5, e12677. [Google Scholar] [CrossRef]
- Jarrett, O.; Laird, H.M.; Hay, D. Determinants of the Host Range of Feline Leukaemia Viruses. J. Gen. Virol. 1973, 20, 169–175. [Google Scholar] [CrossRef]
- Robert-Tissot, C.; Rüegger, V.L.; Cattori, V.; Meli, M.L.; Riond, B.; Gomes-Keller, M.A.; Vögtlin, A.; Wittig, B.; Juhls, C.; Hofmann-Lehmann, R.; et al. The innate antiviral immune system of the cat: Molecular tools for the measurement of its state of activation. Vet. Immunol. Immunopathol. 2011, 143, 269–281. [Google Scholar] [CrossRef]
- Zinn, E.; Pacouret, S.; Khaychuk, V.; Turunen, H.T.; Carvalho, L.; Andres-Mateos, E.; Shah, S.; Shelke, R.; Maurer, A.; Plovie, E.; et al. In Silico Reconstruction of the Viral Evolutionary Lineage Yields a Potent Gene Therapy Vector. Cell Rep. 2015, 12, 1056–1068. [Google Scholar] [CrossRef] [PubMed] [Green Version]
- Schneider, C.A.; Rasband, W.S.; Eliceiri, K.W. NIH Image to ImageJ: 25 years of image analysis. Nat. Methods 2012, 9, 671–675. [Google Scholar] [CrossRef] [PubMed]
- Lutz, H.; Pedersen, N.; Durbin, R.; Theilen, G. Monoclonal antibodies to three epitopic regions of feline leukemia virus p27 and their use in enzyme-linked immunosorbent assay of p27. J. Immunol. Methods 1983, 56, 209–220. [Google Scholar] [CrossRef]
- Hofmann-Lehmann, R.; Tandon, R.; Boretti, F.; Meli, M.; Willi, B.; Cattori, V.; Gomeskeller, M.; Ossent, P.; Golder, M.; Flynn, J. Reassessment of feline leukaemia virus (FeLV) vaccines with novel sensitive molecular assays. Vaccine 2006, 24, 1087–1094. [Google Scholar] [CrossRef]
- Ye, L.; Wang, J.; Tan, Y.; Beyer, A.I.; Xie, F.; Muench, M.O.; Kan, Y.W. Genome editing using CRISPR-Cas9 to create the HPFH genotype in HSPCs: An approach for treating sickle cell disease and β-thalassemia. Proc. Natl. Acad. Sci. USA 2016, 113, 10661–10665. [Google Scholar] [CrossRef] [Green Version]
- Tandon, R.; Cattori, V.; Gomes-Keller, M.A.; Meli, M.L.; Golder, M.C.; Lutz, H.; Hofmann-Lehmann, R. Quantitation of feline leukaemia virus viral and proviral loads by TaqMan® real-time polymerase chain reaction. J. Virol. Methods 2005, 130, 124–132. [Google Scholar] [CrossRef]
- Helfer-Hungerbuehler, A.K.; Widmer, S.; Hofmann-Lehmann, R. GAPDH Pseudogenes and the Quantification of Feline Genomic DNA Equivalents. Mol. Biol. Int. 2013, 2013, 1–7. [Google Scholar] [CrossRef]
- Mashal, R.D.; Koontz, J.; Sklar, J. Detection of mutations by cleavage of DNA heteroduplexes with bacteriophage resolvases. Nat. Genet. 1995, 9, 177–183. [Google Scholar] [CrossRef]
- Sentmanat, M.F.; Peters, S.T.; Florian, C.P.; Connelly, J.P.; Pruett-Miller, S.M. A Survey of Validation Strategies for CRISPR-Cas9 Editing. Sci. Rep. 2018, 8, 1–8. [Google Scholar] [CrossRef] [Green Version]
- Brinkman, E.K.; Chen, T.; Amendola, M.; Van Steensel, B. Easy quantitative assessment of genome editing by sequence trace decomposition. Nucleic Acids Res. 2014, 42, e168. [Google Scholar] [CrossRef]
- Paterna, J.-C.; Feldon, J.; Büeler, H. Transduction Profiles of Recombinant Adeno-Associated Virus Vectors Derived from Serotypes 2 and 5 in the Nigrostriatal System of Rats. J. Virol. 2004, 78, 6808–6817. [Google Scholar] [CrossRef] [PubMed] [Green Version]
- Zolotukhin, S.; Byrne, B.J.; Mason, E.; Zolotukhin, I.; Potter, M.; Chesnut, K.; Summerford, C.; Samulski, R.J.; Muzyczka, N. Recombinant adeno-associated virus purification using novel methods improves infectious titer and yield. Gene Ther. 1999, 6, 973–985. [Google Scholar] [CrossRef] [PubMed] [Green Version]
- Graham, F.L.; Russell, W.C.; Smiley, J.; Nairn, R. Characteristics of a Human Cell Line Transformed by DNA from Human Adenovirus Type 5. J. Gen. Virol. 1977, 36, 59–72. [Google Scholar] [CrossRef]
- DuBridge, R.B.; Tang, P.; Hsia, H.C.; Leong, P.M.; Miller, J.H.; Calos, M.P. Analysis of mutation in human cells by using an Epstein-Barr virus shuttle system. Mol. Cell. Biol. 1987, 7, 379–387. [Google Scholar] [CrossRef] [PubMed]
- Paterna, J.-C.; Moccetti, T.; Mura, A.; Feldon, J.; Büeler, H. Influence of promoter and WHV post-transcriptional regulatory element on AAV-mediated transgene expression in the rat brain. Gene Ther. 2000, 7, 1304–1311. [Google Scholar] [CrossRef] [Green Version]
- Donahue, P.R.; Hoover, E.A.; Beltz, G.A.; Riedel, N.; Hirsch, V.M.; Overbaugh, J.; Mullins, J.I. Strong sequence conservation among horizontally transmissible, minimally pathogenic feline leukemia viruses. J. Virol. 1988, 62, 722–731. [Google Scholar] [CrossRef] [Green Version]
- Mendoza, R.; Anderson, M.M.; Overbaugh, J. A Putative Thiamine Transport Protein Is a Receptor for Feline Leukemia Virus Subgroup A. J. Virol. 2006, 80, 3378–3385. [Google Scholar] [CrossRef] [Green Version]
- Katrin Helfer-Hungerbuehler, A.; Cattori, V.; Bachler, B.; Hartnack, S.; Riond, B.; Ossent, P.; Lutz, H.; Hofmann-Lehmann, R. Quantification and molecular characterization of the feline leukemia virus A receptor. Infect. Genet. Evol. 2011, 11, 1940–1950. [Google Scholar] [CrossRef]
- Grimm, D.; Lee, J.S.; Wang, L.; Desai, T.; Akache, B.; Storm, T.A.; Kay, M.A. In Vitro and In Vivo Gene Therapy Vector Evolution via Multispecies Interbreeding and Retargeting of Adeno-Associated Viruses. J. Virol. 2008, 82, 5887–5911. [Google Scholar] [CrossRef] [Green Version]
- Benveniste, R.E.; Todaro, G.J. Segregation of RD-114 AND FeL-V-related sequences in crosses between domestic cat and leopard cat. Nature 1975, 257, 506–508. [Google Scholar] [CrossRef]
- Chiu, E.S.; VandeWoude, S. Presence of Endogenous Viral Elements Negatively Correlates with Feline Leukemia Virus Susceptibility in Puma and Domestic Cat Cells. J. Virol. 2020, 94, 94. [Google Scholar] [CrossRef] [PubMed]
- Stoye, J.P. Endogenous retroviruses: Still active after all these years? Curr. Biol. 2001, 11, R914–R916. [Google Scholar] [CrossRef] [Green Version]
- Soe, L.H.; Shimizu, R.W.; Landolph, J.R.; Roy-Burman, P. Molecular analysis of several classes of endogenous feline leukemia virus elements. J. Virol. 1985, 56, 701–710. [Google Scholar] [CrossRef] [PubMed] [Green Version]
- Soe, L.H.; Devi, B.G.; Mullins, J.I.; Roy-Burman, P. Molecular cloning and characterization of endogenous feline leukemia virus sequences from a cat genomic library. J. Virol. 1983, 46, 829–840. [Google Scholar] [CrossRef] [Green Version]
- Tandon, R.; Cattori, V.; Pepin, A.C.; Riond, B.; Meli, M.L.; McDonald, M.; Doherr, M.; Lutz, H.; Hofmann-Lehmann, R. Association between endogenous feline leukemia virus loads and exogenous feline leukemia virus infection in domestic cats. Virus Res. 2008, 135, 136–143. [Google Scholar] [CrossRef]
- Boesch, A.; Cattori, V.; Riond, B.; Willi, B.; Meli, M.L.; Rentsch, K.M.; Hosie, M.J.; Hofmann-Lehmann, R.; Lutz, H. Evaluation of the effect of short-term treatment with the integrase inhibitor raltegravir (Isentress™) on the course of progressive feline leukemia virus infection. Vet. Microbiol. 2015, 175, 167–178. [Google Scholar] [CrossRef] [PubMed]
- Friedland, A.E.; Baral, R.; Singhal, P.; Loveluck, K.; Shen, S.; Sanchez, M.; Marco, E.; Gotta, G.M.; Maeder, M.L.; Kennedy, E.M.; et al. Characterization of Staphylococcus aureus Cas9: A smaller Cas9 for all-in-one adeno-associated virus delivery and paired nickase applications. Genome Biol. 2015, 16, 1–10. [Google Scholar] [CrossRef] [PubMed] [Green Version]
- Chen, J.; Dagdas, Y.S.; Kleinstiver, B.; Welch, M.M.; Sousa, A.A.; Harrington, L.B.; Sternberg, S.H.; Joung, J.K.; Yildiz, A.; Doudna, J.A. Enhanced proofreading governs CRISPR–Cas9 targeting accuracy. Nat. Cell Biol. 2017, 550, 407–410. [Google Scholar] [CrossRef] [PubMed] [Green Version]
- Hu, Z.; Wang, Y.; Liu, Q.; Qiu, Y.; Zhong, Z.; Li, K.; Li, W.; Deng, Z.; Sun, Y. Improving the Precision of Base Editing by Bubble Hairpin Single Guide RNA. mBio 2021, 12, e00342-21. [Google Scholar] [CrossRef] [PubMed]
- Chakrabarti, A.M.; Henser-Brownhill, T.; Monserrat, J.; Poetsch, A.R.; Luscombe, N.M.; Scaffidi, P. Target-Specific Precision of CRISPR-Mediated Genome Editing. Mol. Cell 2019, 73, 699–713. [Google Scholar] [CrossRef] [Green Version]
- Yin, C.; Zhang, T.; Qu, X.; Zhang, Y.; Putatunda, R.; Xiao, X.; Li, F.; Xiao, W.; Zhao, H.; Dai, S.; et al. In Vivo Excision of HIV-1 Provirus by saCas9 and Multiplex Single-Guide RNAs in Animal Models. Mol. Ther. 2017, 25, 1168–1186. [Google Scholar] [CrossRef] [Green Version]
- Quail, M.A.; Smith, M.E.; Coupland, P.; Otto, T.D.; Harris, S.R.; Connor, T.R.; Bertoni, A.; Swerdlow, H.P.; Gu, Y. A tale of three next generation sequencing platforms: Comparison of Ion torrent, pacific biosciences and illumina MiSeq sequencers. BMC Genom. 2012, 13, 341. [Google Scholar] [CrossRef] [Green Version]
- Yang, Z.; Steentoft, C.; Hauge, C.; Hansen, L.; Thomsen, A.L.; Niola, F.; Vester-Christensen, M.B.; Frödin, M.; Clausen, H.; Wandall, H.H.; et al. Fast and sensitive detection of indels induced by precise gene targeting. Nucleic Acids Res. 2015, 43, e59. [Google Scholar] [CrossRef] [PubMed] [Green Version]
- Vouillot, L.; Thelie, A.; Pollet, N. Comparison of T7E1 and Surveyor Mismatch Cleavage Assays to Detect Mutations Triggered by Engineered Nucleases. G3 Genes Genomes Genet. 2015, 5, 407–415. [Google Scholar] [CrossRef] [Green Version]
- Murphy, B.G.; Wolf, T.; Vogel, H.; Castillo, D.; Woolard, K. An RNA-Directed Gene Editing Strategy for Attenuating the Infectious Potential of Feline Immunodeficiency Virus-Infected Cells: A Proof of Concept. Viruses 2020, 12, 511. [Google Scholar] [CrossRef]
- McDonnel, S.J.; Sparger, E.E.; Murphy, B.G. Feline immunodeficiency virus latency. Retrovirology 2013, 10, 1–69. [Google Scholar] [CrossRef] [Green Version]
- Hofmann-Lehmann, R.; Hartmann, K. Feline leukaemia virus infection: A practical approach to diagnosis. J. Feline Med. Surg. 2020, 22, 831–846. [Google Scholar] [CrossRef] [PubMed]
- Manjunath, N.; Yi, G.; Dang, Y.; Shankar, P. Newer Gene Editing Technologies toward HIV Gene Therapy. Viruses 2013, 5, 2748–2766. [Google Scholar] [CrossRef] [PubMed] [Green Version]
- Stone, D.; Kiem, H.-P.; Jerome, K.R. Targeted gene disruption to cure HIV. Curr. Opin. HIV AIDS 2013, 8, 217–223. [Google Scholar] [CrossRef] [PubMed]
- Wang, W.; Ye, C.; Liu, J.; Zhang, D.; Kimata, J.; Zhou, P. CCR5 Gene Disruption via Lentiviral Vectors Expressing Cas9 and Single Guided RNA Renders Cells Resistant to HIV-1 Infection. PLoS ONE 2014, 9, e115987. [Google Scholar] [CrossRef] [Green Version]
- Hu, W.; Kaminski, R.; Yang, F.; Zhang, Y.; Cosentino, L.; Li, F.; Luo, B.; Alvarez-Carbonell, D.; Garcia-Mesa, Y.; Karn, J.; et al. RNA-directed gene editing specifically eradicates latent and prevents new HIV-1 infection. Proc. Natl. Acad. Sci. USA 2014, 111, 11461–11466. [Google Scholar] [CrossRef] [PubMed] [Green Version]
- Yin, C.; Zhang, T.; Li, F.; Yang, F.; Putatunda, R.; Young, W.-B.; Khalili, K.; Hu, W.; Zhang, Y. Functional screening of guide RNAs targeting the regulatory and structural HIV-1 viral genome for a cure of AIDS. AIDS 2016, 30, 1163–1173. [Google Scholar] [CrossRef] [PubMed] [Green Version]
- Kaminski, R.; Bella, R.; Yin, C.; Otte, J.; Ferrante, P.; Gendelman, H.E.; Li, H.; Booze, R.; Gordon, J.; Hu, W.; et al. Excision of HIV-1 DNA by gene editing: A proof-of-concept in vivo study. Gene Ther. 2016, 23, 690–695. [Google Scholar] [CrossRef] [PubMed]
- Robert-Tissot, C.; Meli, M.L.; Riond, B.; Hofmann-Lehmann, R.; Lutz, H. Induction of a systemic antiviral state in vivo in the domestic cat with a class A CpG oligonucleotide. Vet. Immunol. Immunopathol. 2012, 150, 1–9. [Google Scholar] [CrossRef]


| Target | Direction 1 | Sequence | Amplification Primers | Annealing | PCR Size | T7E1 Cut |
|---|---|---|---|---|---|---|
| Target 1 | as | TTATATCTCATGGGAACATAC | 907_F: CCCCTACCCCAAAATTTAGCC | 64 °C | 456 bp | 386 bp |
| GTATGTTCCCATGAGATATAA | 1710_R: GTCTTCCTCGGCGATGAGAC | 70 bp | ||||
| Target 2 | s | GAGGCCAAGAACAGTTAAACC | 907_F: CCCCTACCCCAAAATTTAGCC | 64 °C | 456 bp | 296 bp |
| GGTTTAACTGTTCTTGGCCTC | 1710_R: GTCTTCCTCGGCGATGAGAC | 160 bp | ||||
| Target 3 | s | TCTCCAGGCTCCCCAGTTGAC | 907_F: CCCCTACCCCAAAATTTAGCC | 64 °C | 456 bp | 229 bp |
| GTCAACTGGGGAGCCTGGAGA | 1710_R: GTCTTCCTCGGCGATGAGAC | 227 bp | ||||
| Target 4 | as | TGCGGCGAAAGAGGTTGAGGG | 1229_F: GAAACCGTCATGGGCCAAAC | 65 °C | 714 bp | 373 bp |
| CCCTCAACCTCTTTCGCCGCA | 1366_R: AGTTAGGGCCACTGGATCTT | 341 bp | ||||
| Target 5 | s | CCTGACAGGCGAAGAAAGGCA | 1365_F: CAACAACCGACCCCAGTATT | 65 °C | 410 bp | 224 bp |
| TGCCTTTCTTCGCCTGTCAGG | 1691_R: CAACCTGCTTTACCTGTGCC | 186 bp | ||||
| Target 6 | as | TAGTAATGTAAGGAACTTGGT | 1229_F: GAAACCGTCATGGGCCAAAC | 65 °C | 449 bp | 244 bp |
| ACCAAGTTCCTTACATTACTA | 1230_R: GAGGAAGGATCAGGCGGTAAC | 205 bp | ||||
| Target 7 | s | TTATACCGGGTACGTAACACG | 1248_F: CCGGAACACATTGGGAAG | 61 °C | 909 bp | 496 bp |
| CGTGTTACGTACCCGGTATAA | 1251_R: CCCACCAGAAACGCTAAG | 413 bp | ||||
| Target 8 | as | GTACCAAGGGTGAGACGGCGG | 1236_F: GGTATGGGAATGGCTCATTGTC | 61 °C | 532 bp | 223 bp |
| CCGCCGTCTCACCCTTGGTAC | 1240_R: GGTACCTTACCCTGAAATCG | 309 bp | ||||
| Target 9 | s | TATGCCCCATGAAGCGTACCA | 1236_F: GGTATGGGAATGGCTCATTGTC | 61 °C | 532 bp | 431 bp |
| TGGTACGCTTCATGGGGCATA | 1240_R: GGTACCTTACCCTGAAATCG | 101 bp | ||||
| Target 10 | s | ATTTAGTCCCCAGAAAAAGGG | 1543_F: CCAACAGGGATGGTTTGAAG | 61 °C | 530 bp | 267 bp |
| CCCTTTTTCTGGGGACTAAAT | 1544_R: CGGAAGGTCGAACTCTGGTC | 263 bp | ||||
| Target 11 | as | GGGACACCGTGAATAAAGCGA | 1662_F: CAAAGGGAACACATTGTGGA | 61 °C | 566 bp | 308 bp |
| TCGCTTTATTCACGGTGTCCC | 1668_R: ATAGGGTGGTCGAGAAACCA | 258 bp | ||||
| Target 12 | s | GGCTCTGTGCCGCATTGAAAG | 1666_F: AGCTGTCAGGTTCCGAAGAG | 62 °C | 497 bp | 287 bp |
| CTTTCAATGCGGCACAGAGCC | 1669_R: GGCCGAAGAGGAGAATTAGG | 210 bp |
| HEK | CRFK | FEA | PG-4 | AK-D | MT | Fc3Tg | Fcwf-4 | FetJ | fPBMC | |
|---|---|---|---|---|---|---|---|---|---|---|
| AAV1 | 500 | 10,000 | >10,000 | 100,000 | 100,000 | ≥50,000 | >50,000 | >10,000 | >100,000 | >100,000 |
| AAV2 | 500 | 500 | 10,000 | 10,000 | 10,000 | 5000 | 25,000 | 1000 | >100,000 | >100,000 |
| AAV3 | 1000 | 10,000 | 10,000 | 100,000 | >100,000 | 25,000 | ≥50,000 | 5000 | >100,000 | >100,000 |
| AAV4 | 1000 | 1000 | 5000 | 50,000 | 10,000 | ≥50,000 | 25,000 | 1000 | >100,000 | >100,000 |
| AAV5 | 5000 | 5000 | >10,000 | >100,000 | >100,000 | >50,000 | >50,000 | >10,000 | >100,000 | >100,000 |
| AAV6 | 5000 | 5000 | 10,000 | 100,000 | 100,000 | ≥50,000 | > 50,000 | ≥10,000 | >100,000 | >100,000 |
| AAV7 | ≥10,000 | >10,000 | >10,000 | >100,000 | >100,000 | >50,000 | >50,000 | >10,000 | >100,000 | >100,000 |
| AAV8 | 5000 | >10,000 | >10,000 | >100,000 | >100,000 | >50,000 | >50,000 | >10,000 | >100,000 | >100,000 |
| AAV9 | 5000 | 10,000 | >10,000 | >100,000 | >100,000 | >50,000 | >50,000 | >10,000 | >100,000 | >100,000 |
| AAV-DJ | 100 | 100 | 500 | 5000 | 5000 | 2500 | 2500 | 100 | >100,000 | >100,000 |
| AAV-DJ/8 | 10,000 | >10,000 | >10,000 | >100,000 | >100,000 | >50,000 | >50,000 | >10,000 | >100,000 | >100,000 |
| Anc80L65 | 50,000 | ≥50,000 | 100,000 | >100,000 | ≥100,000 | ≥50,000 | >50,000 | ≥10,000 | >100,000 | >100,000 |
| Target | CRFK | FEA | PG-4 | ||||||
|---|---|---|---|---|---|---|---|---|---|
| TIDE | FA 1 | Gel | TIDE | FA | Gel | TIDE | FA | Gel | |
| T1 | 8.2 | 8.1 | 0.0 | 10.5 | 10.7 | 7.5 | 4.6 | 4.5 | 5.9 |
| T2 | 21.3 | 14.6 | 15.1 | 27.5 | 16.1 | 8.3 | 12.2 | 7.6 | 14.0 |
| T3 | 11.8 | 7.3 | 12.8 | 9.8 | 6.3 | 5.1 | 9.1 | 3.6 | 1.5 |
| T4 | 62.6 | 16.9 | 28.6 | 60.8 | 24.6 | 30.0 | 41.3 | 21.0 | 22.5 |
| T5 | 57.2 | 29.9 | 30.0 | 81.5 | 43.7 | 25.2 | 31.5 | 25.6 | 14.0 |
| T6 | 42.5 | 21.6 | 27.2 | 45.6 | 17.6 | 16.3 | 16.9 | 20.0 | 18.8 |
| T7 | 68.0 | 13.3 | 14.0 | 74.5 | 12.0 | 10.6 | 39.0 | 26.2 | 15.1 |
| T8 | 79.4 | 10.0 | 26.5 | 85.8 | 30.0 | 23.8 | 38.4 | 28.5 | 14.6 |
| T9 | 10.1 | 6.7 | 18.8 | 26.0 | 11.7 | 11.7 | 9.8 | 10.8 | 11.7 |
| T10 | 43.7 | 14.4 | 14.6 | 48.6 | 12.3 | 9.4 | 34.3 | 12.1 | 9.4 |
| T11 | N.A. | N.A. | N.A. | 40.1 | 17.1 | 12.3 | 14.1 | 7.1 | 6.2 |
| T12 | 21.4 | 13.7 | 9.4 | 17.7 | 8.8 | 8.9 | 8.9 | 6.7 | 10.0 |
| Target | CRFK | FEA | PG-4 | ||||||
|---|---|---|---|---|---|---|---|---|---|
| TIDE | FA 1 | Gel | TIDE | FA | Gel | TIDE | FA | Gel | |
| T4 (vT4) | 49.17 | 53.63 | 39.18 | 12.17 | 27.71 | 28.86 | 13.30 | 23.83 | 27.37 |
| T5 (vT5) | 58.90 | 43.25 | 31.86 | 34.27 | 41.14 | 36.30 | 18.30 | 29.03 | 34.94 |
| T6 (vT6) | 32.07 | 35.48 | 25.23 | 13.00 | 16.07 | 15.58 | 4.43 | 7.62 | 15.98 |
| T8 (vT8) | 81.60 | 37.15 | 40.97 | 47.87 | 43.54 | 35.92 | 44.50 | 44.96 | 34.25 |
| T10 (vT10) | 32.00 | 17.48 | 18.41 | 7.50 | 5.26 | 13.33 | 2.73 | 1.18 | 5.96 |
Publisher’s Note: MDPI stays neutral with regard to jurisdictional claims in published maps and institutional affiliations. |
© 2021 by the authors. Licensee MDPI, Basel, Switzerland. This article is an open access article distributed under the terms and conditions of the Creative Commons Attribution (CC BY) license (https://creativecommons.org/licenses/by/4.0/).
Share and Cite
Helfer-Hungerbuehler, A.K.; Shah, J.; Meili, T.; Boenzli, E.; Li, P.; Hofmann-Lehmann, R. Adeno-Associated Vector-Delivered CRISPR/SaCas9 System Reduces Feline Leukemia Virus Production In Vitro. Viruses 2021, 13, 1636. https://0-doi-org.brum.beds.ac.uk/10.3390/v13081636
Helfer-Hungerbuehler AK, Shah J, Meili T, Boenzli E, Li P, Hofmann-Lehmann R. Adeno-Associated Vector-Delivered CRISPR/SaCas9 System Reduces Feline Leukemia Virus Production In Vitro. Viruses. 2021; 13(8):1636. https://0-doi-org.brum.beds.ac.uk/10.3390/v13081636
Chicago/Turabian StyleHelfer-Hungerbuehler, A. Katrin, Jimit Shah, Theres Meili, Eva Boenzli, Pengfei Li, and Regina Hofmann-Lehmann. 2021. "Adeno-Associated Vector-Delivered CRISPR/SaCas9 System Reduces Feline Leukemia Virus Production In Vitro" Viruses 13, no. 8: 1636. https://0-doi-org.brum.beds.ac.uk/10.3390/v13081636