
HIV RGB: Automated Single-Cell Analysis of HIV-1 Rev-Dependent RNA Nuclear Export and Translation Using Image Processing in KNIME

 and
and 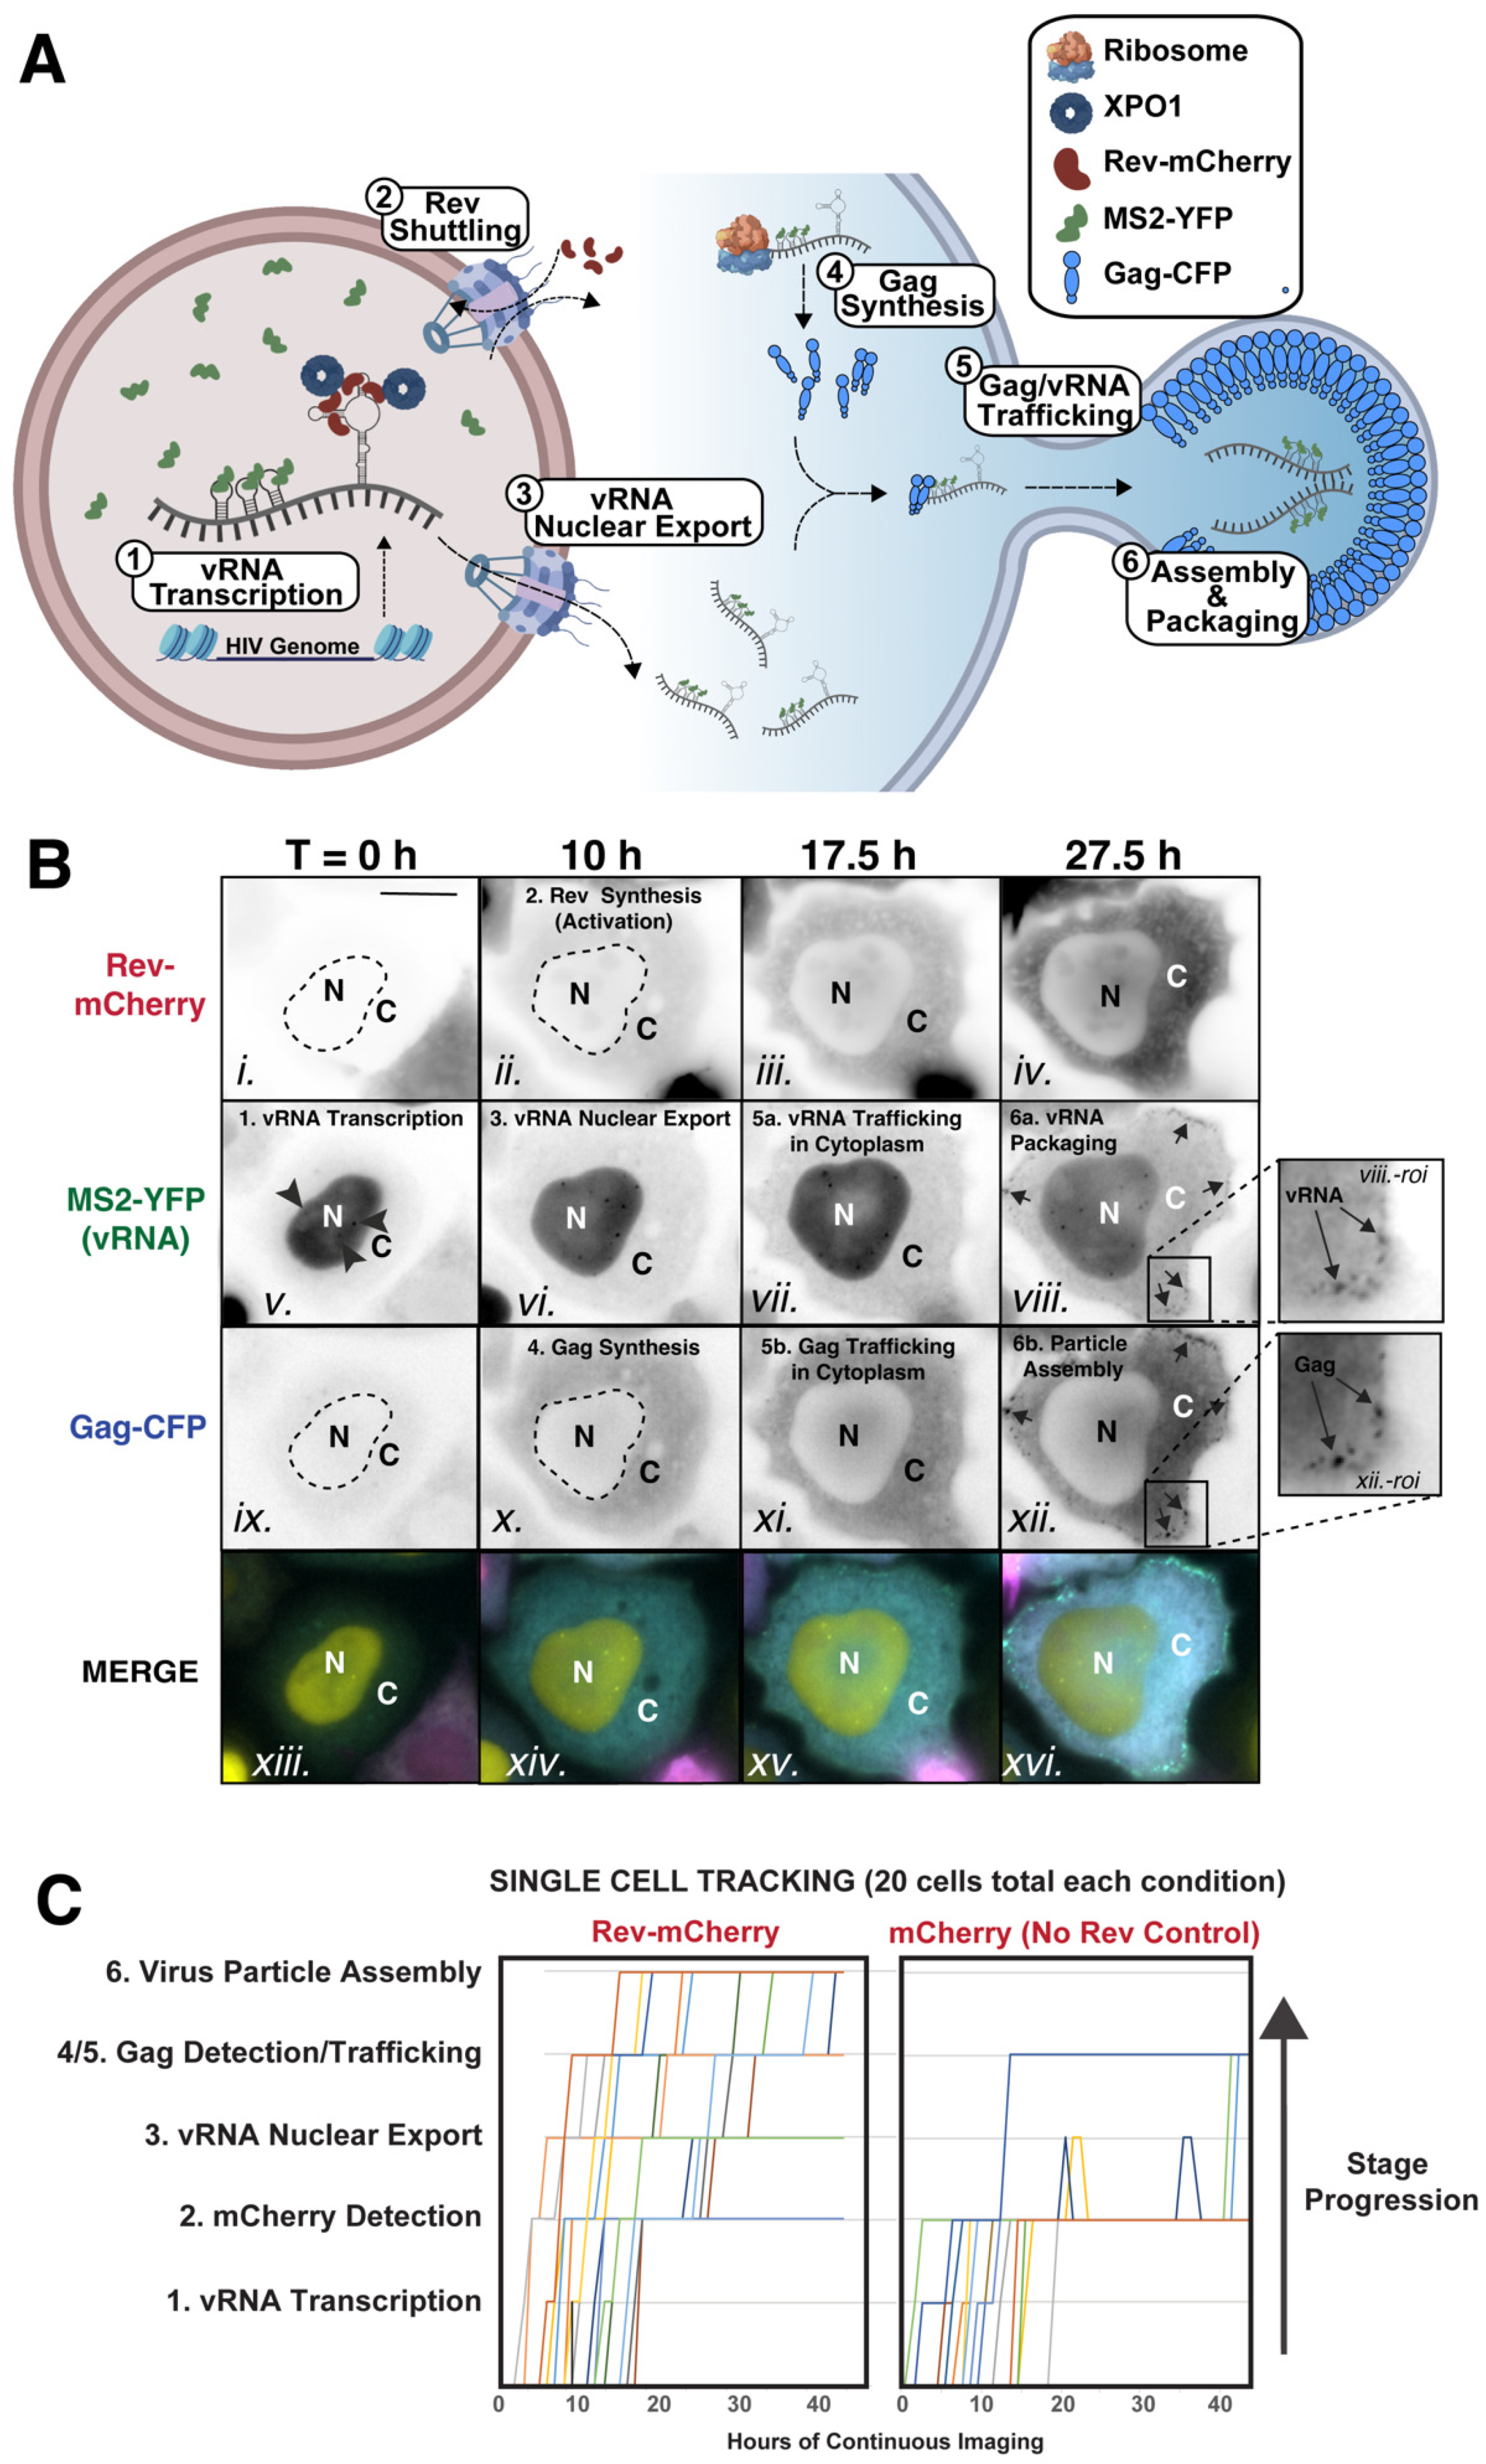
Abstract
:1. Introduction
2. Materials and Methods
2.1. Cell Manipulation and Live Cell Imaging
2.2. Image Processing and Computing Resources
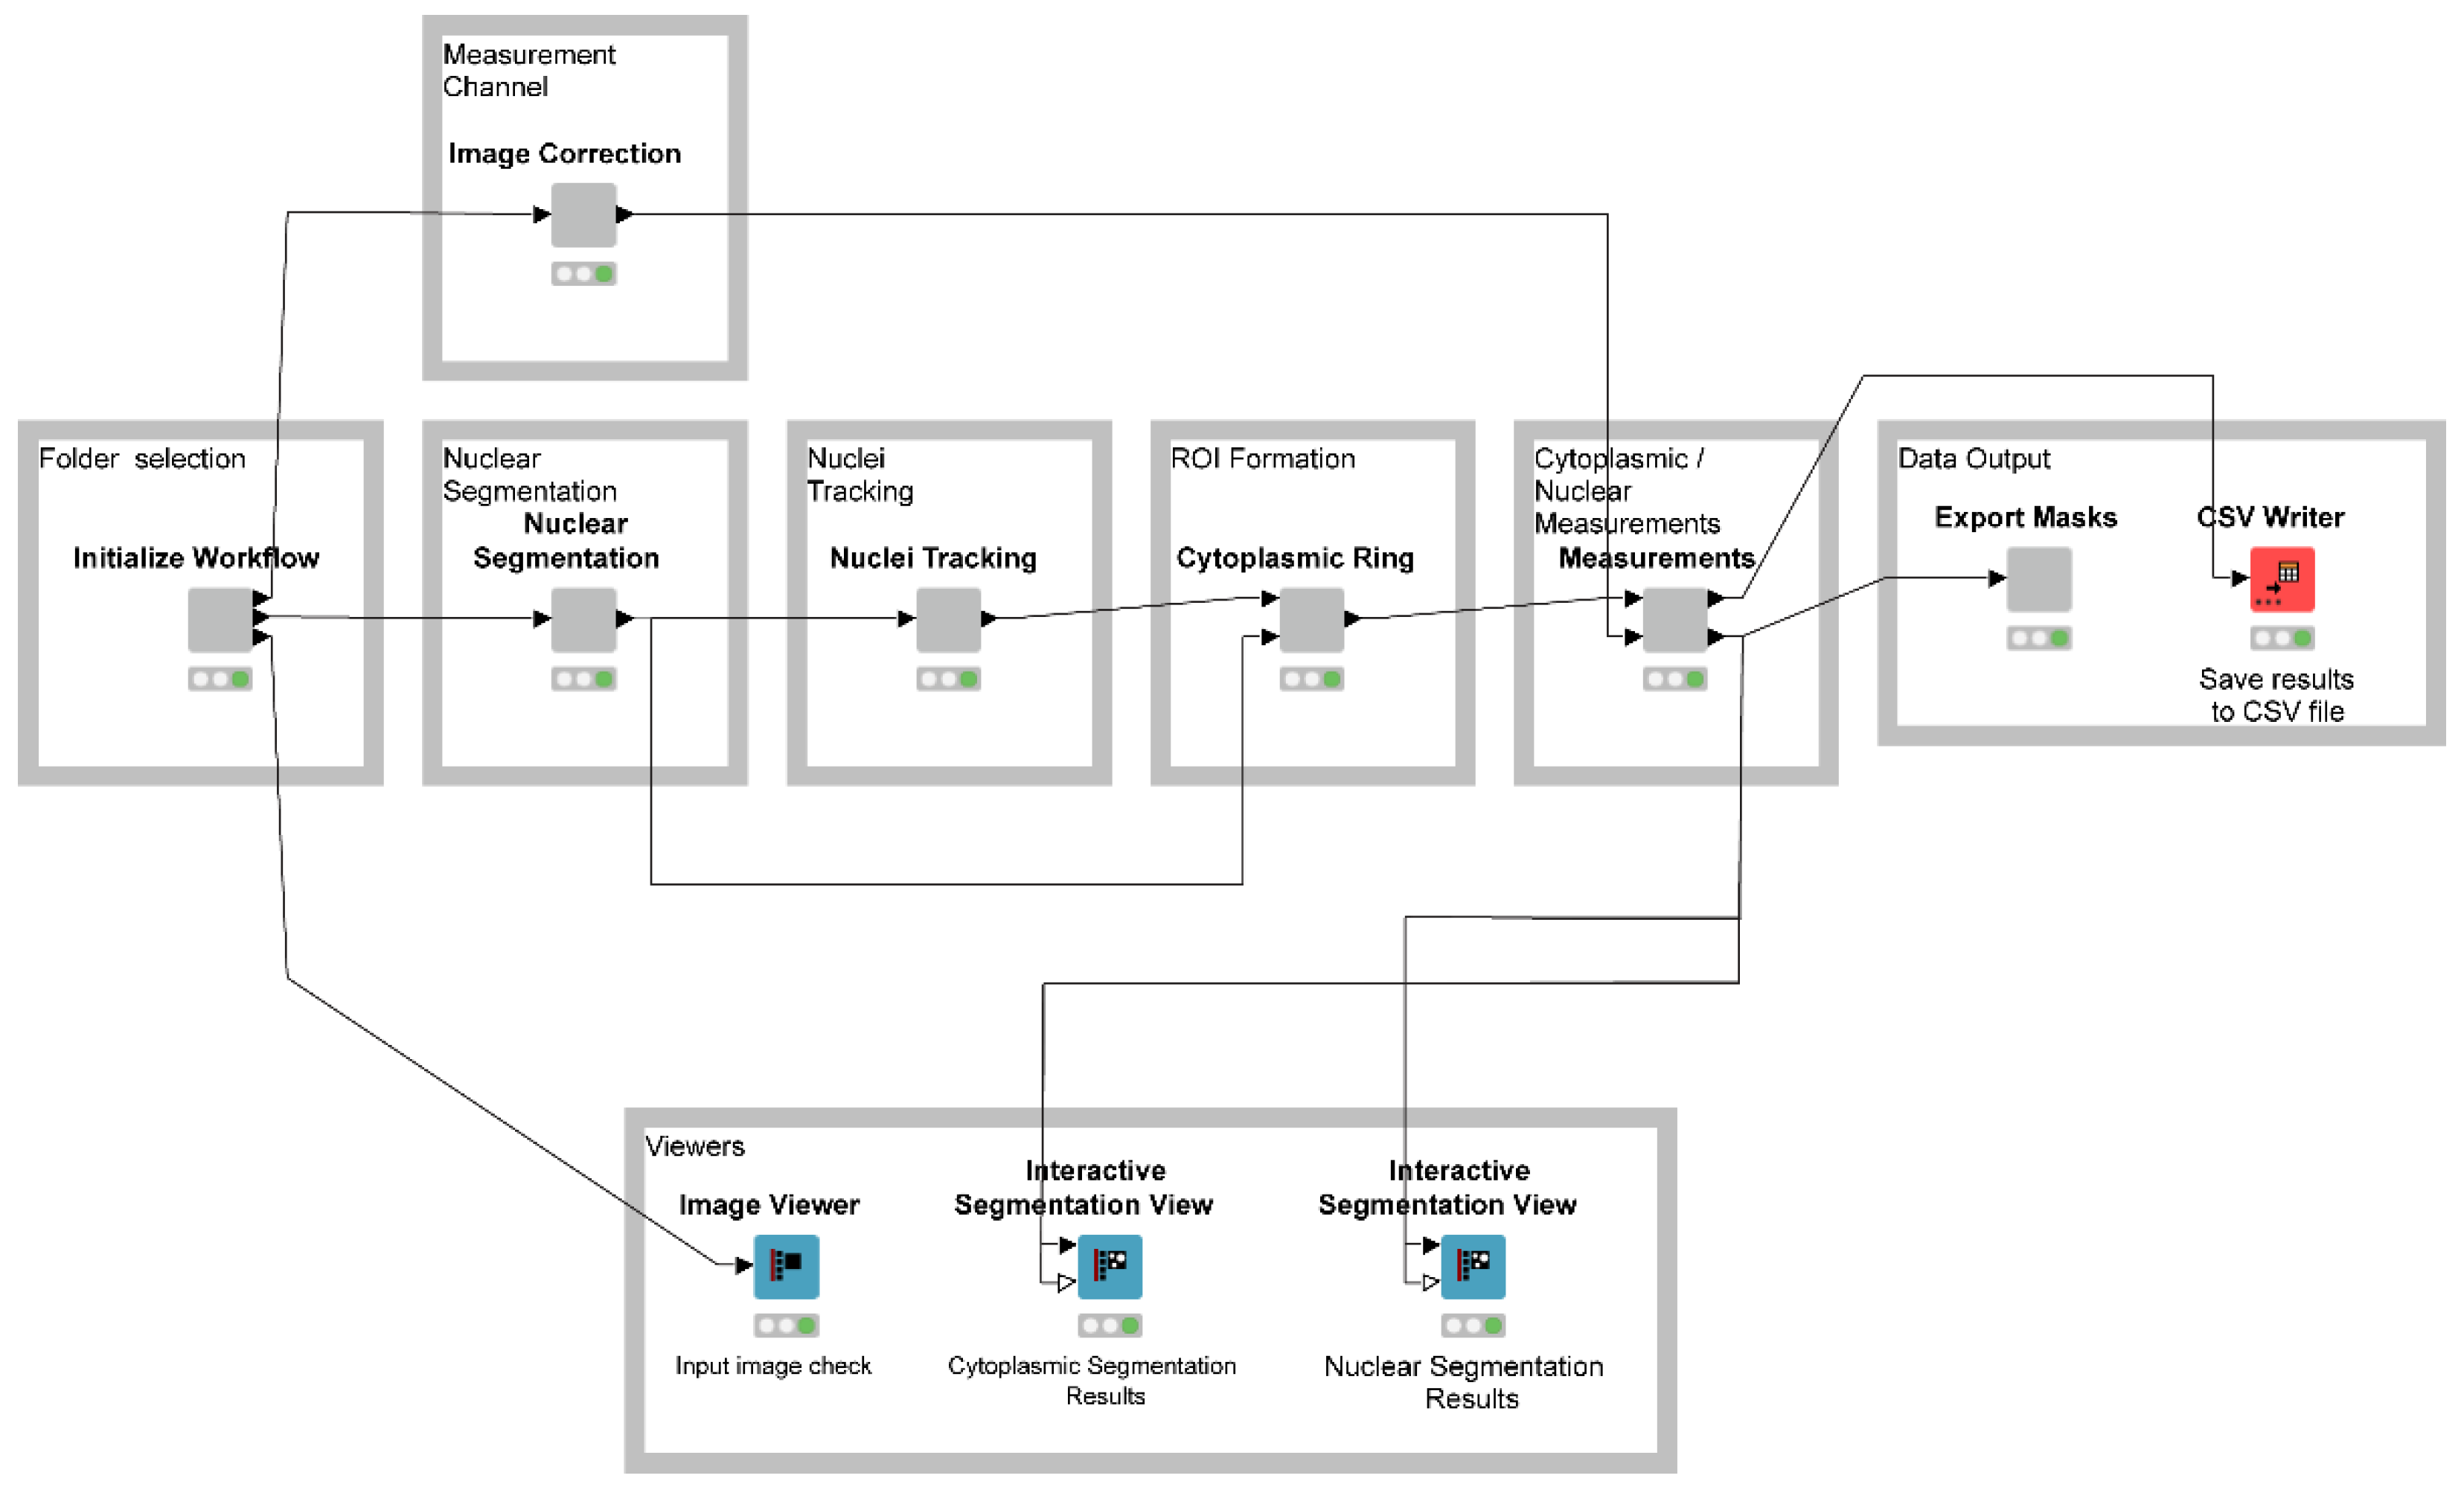
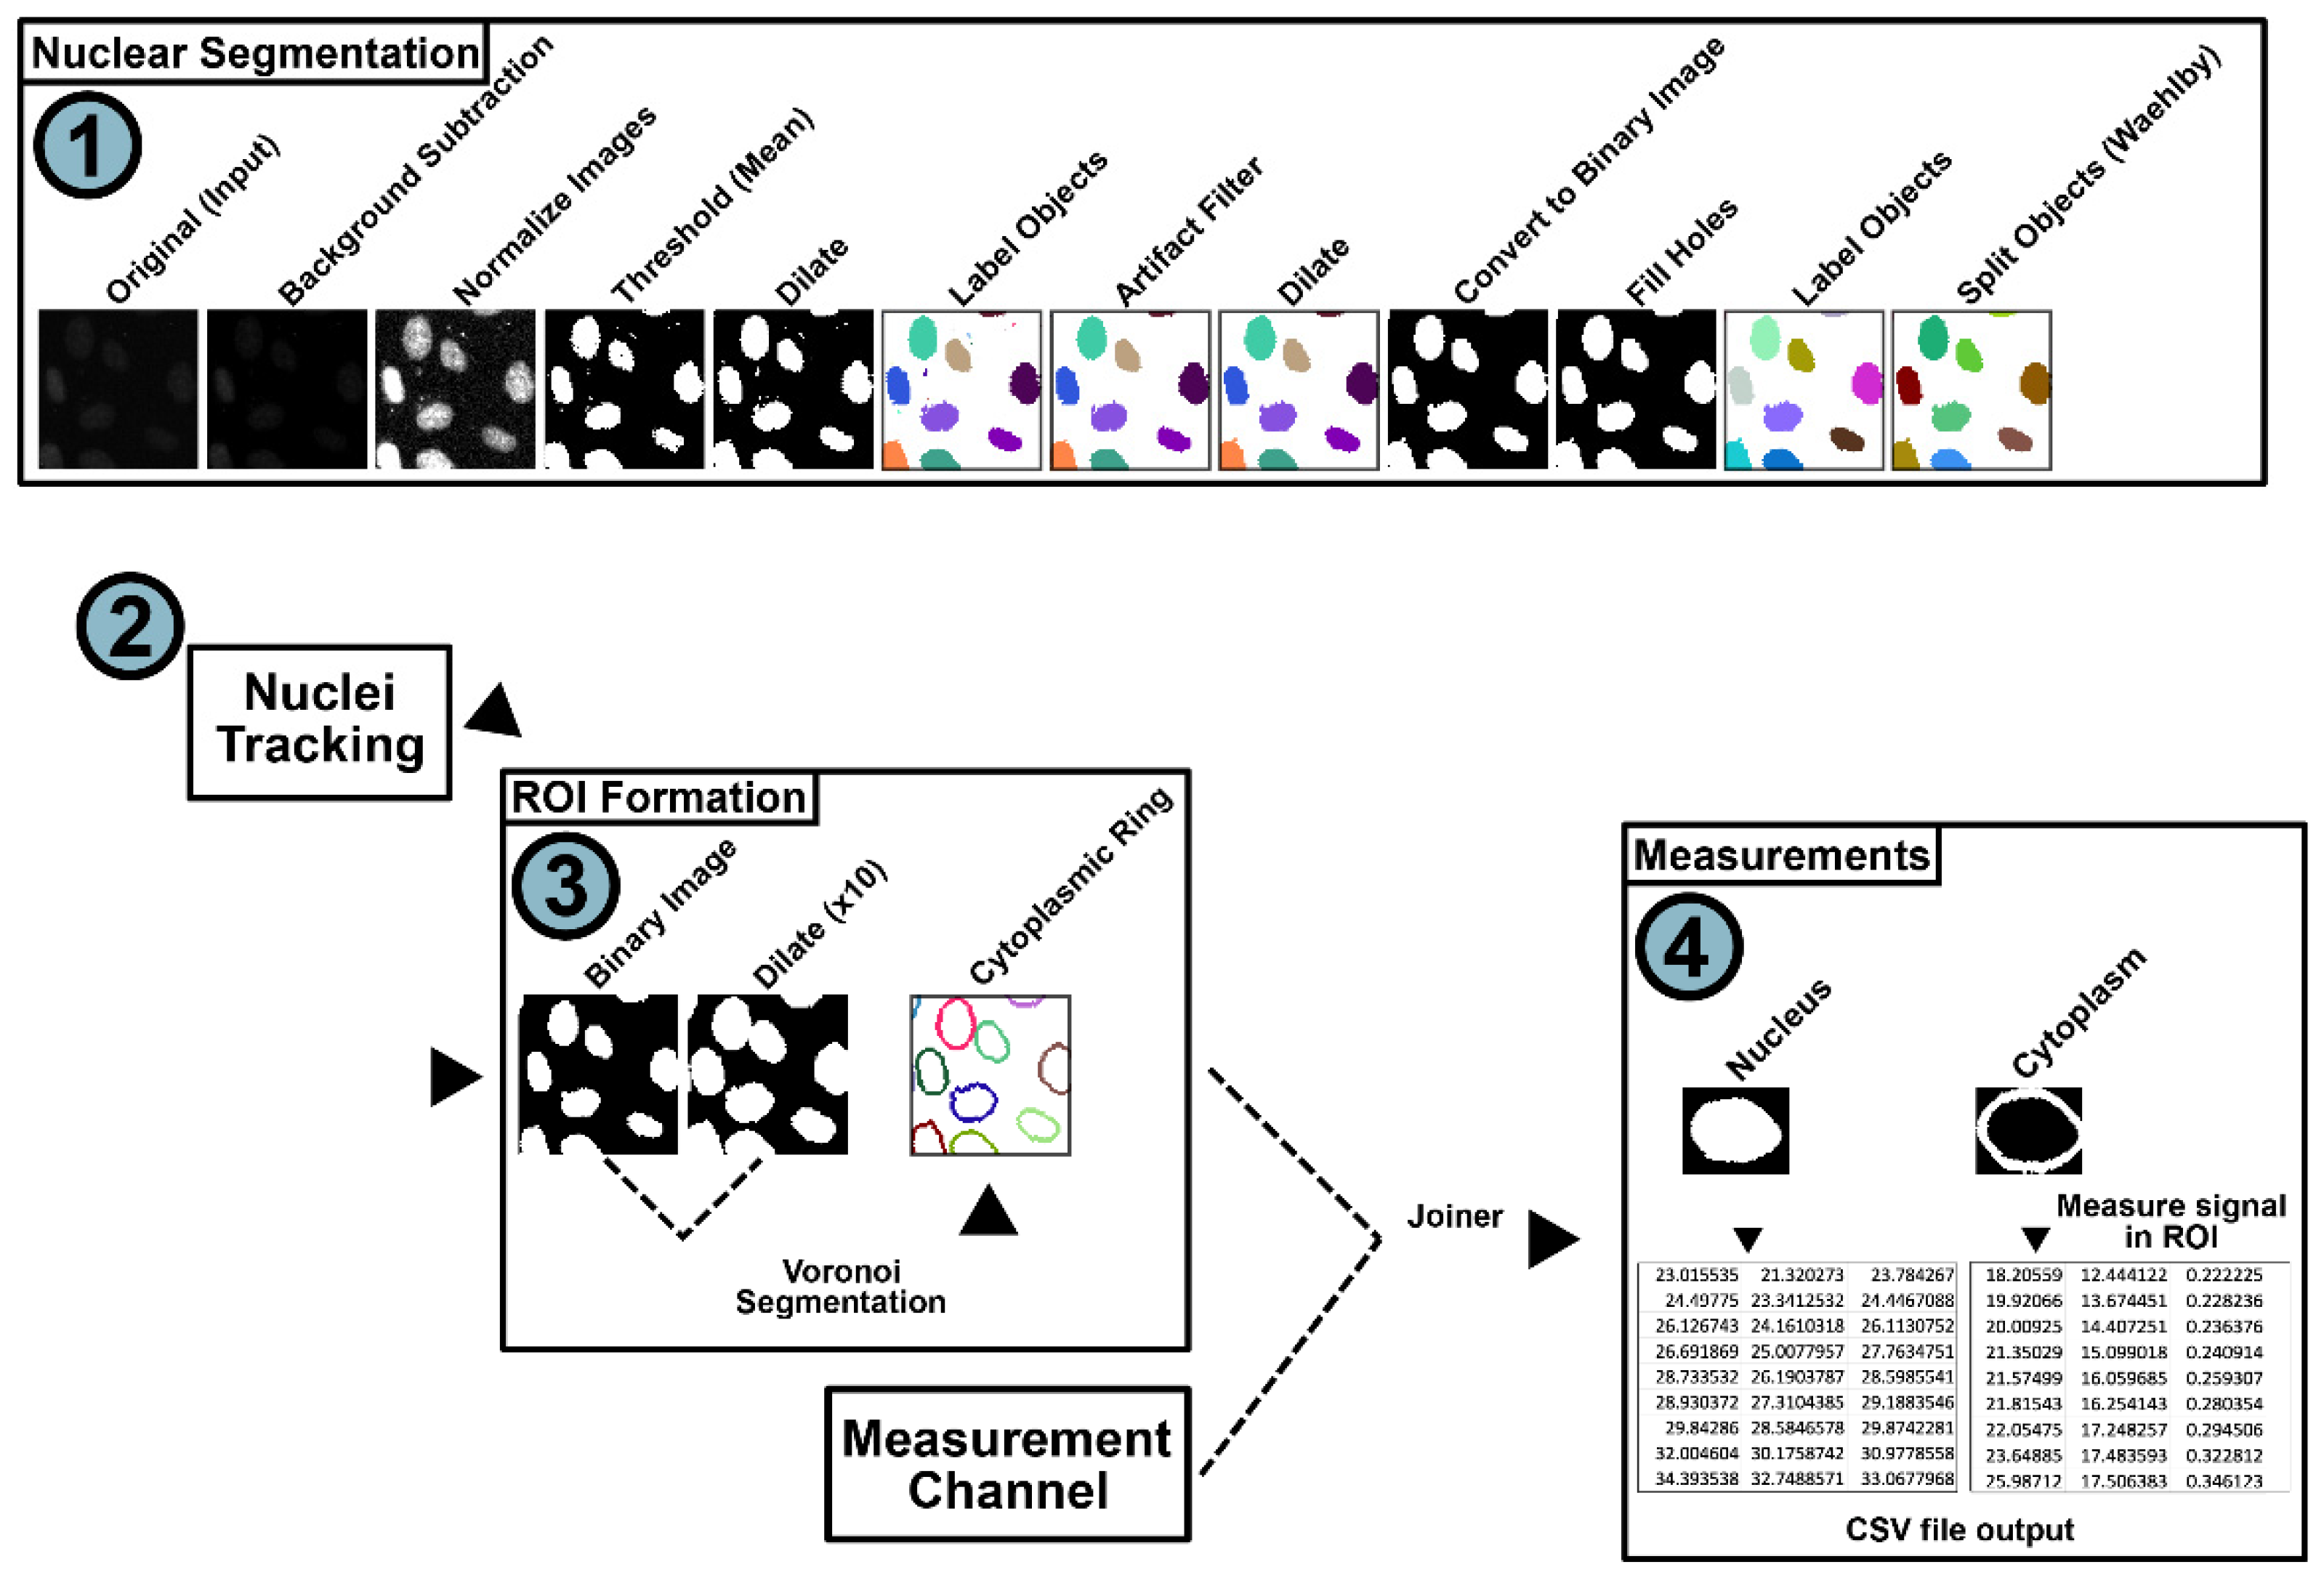
2.3. Nuclear Segmentation and Subcellular Tracking Using NR-SAT
3. Results
3.1. HIV-RGB: A System for Multicolor Visualization of HIV-1’s RNA Post-Transcriptional Regulatory Stages
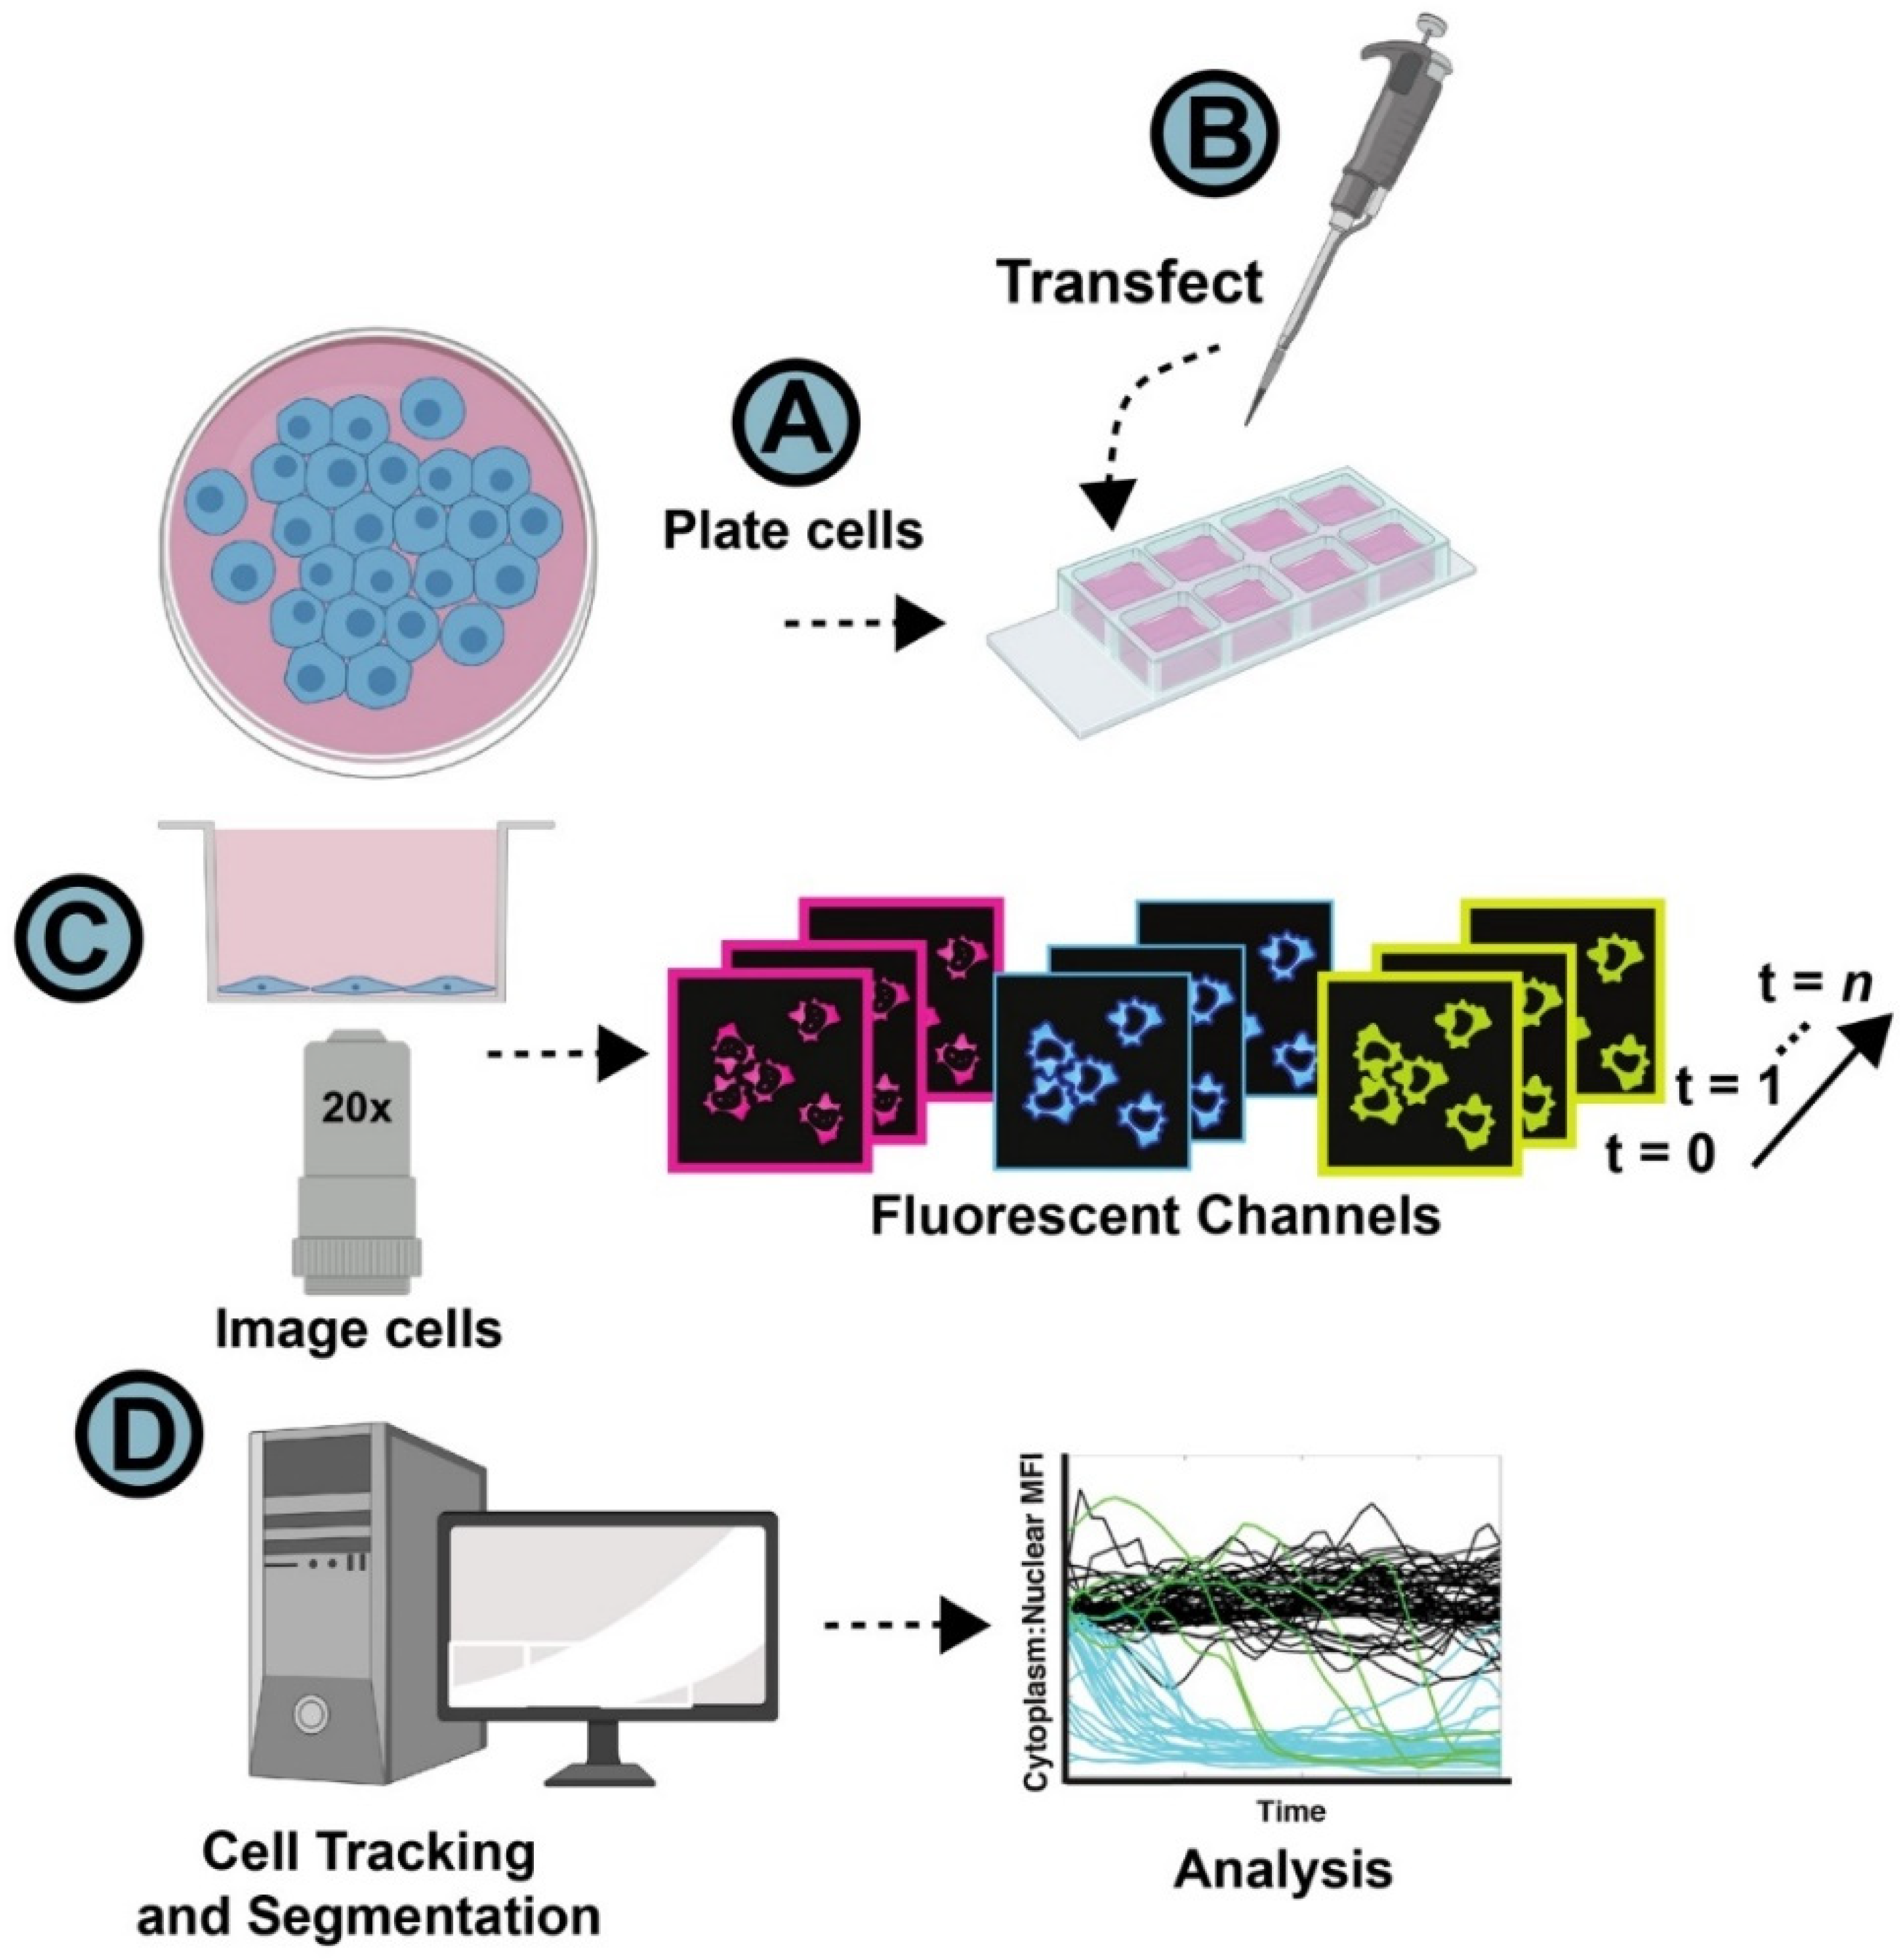
3.2. Automated Analysis of HIV-1 RNA Regulation Using NR-SAT and KNIME: An Overview
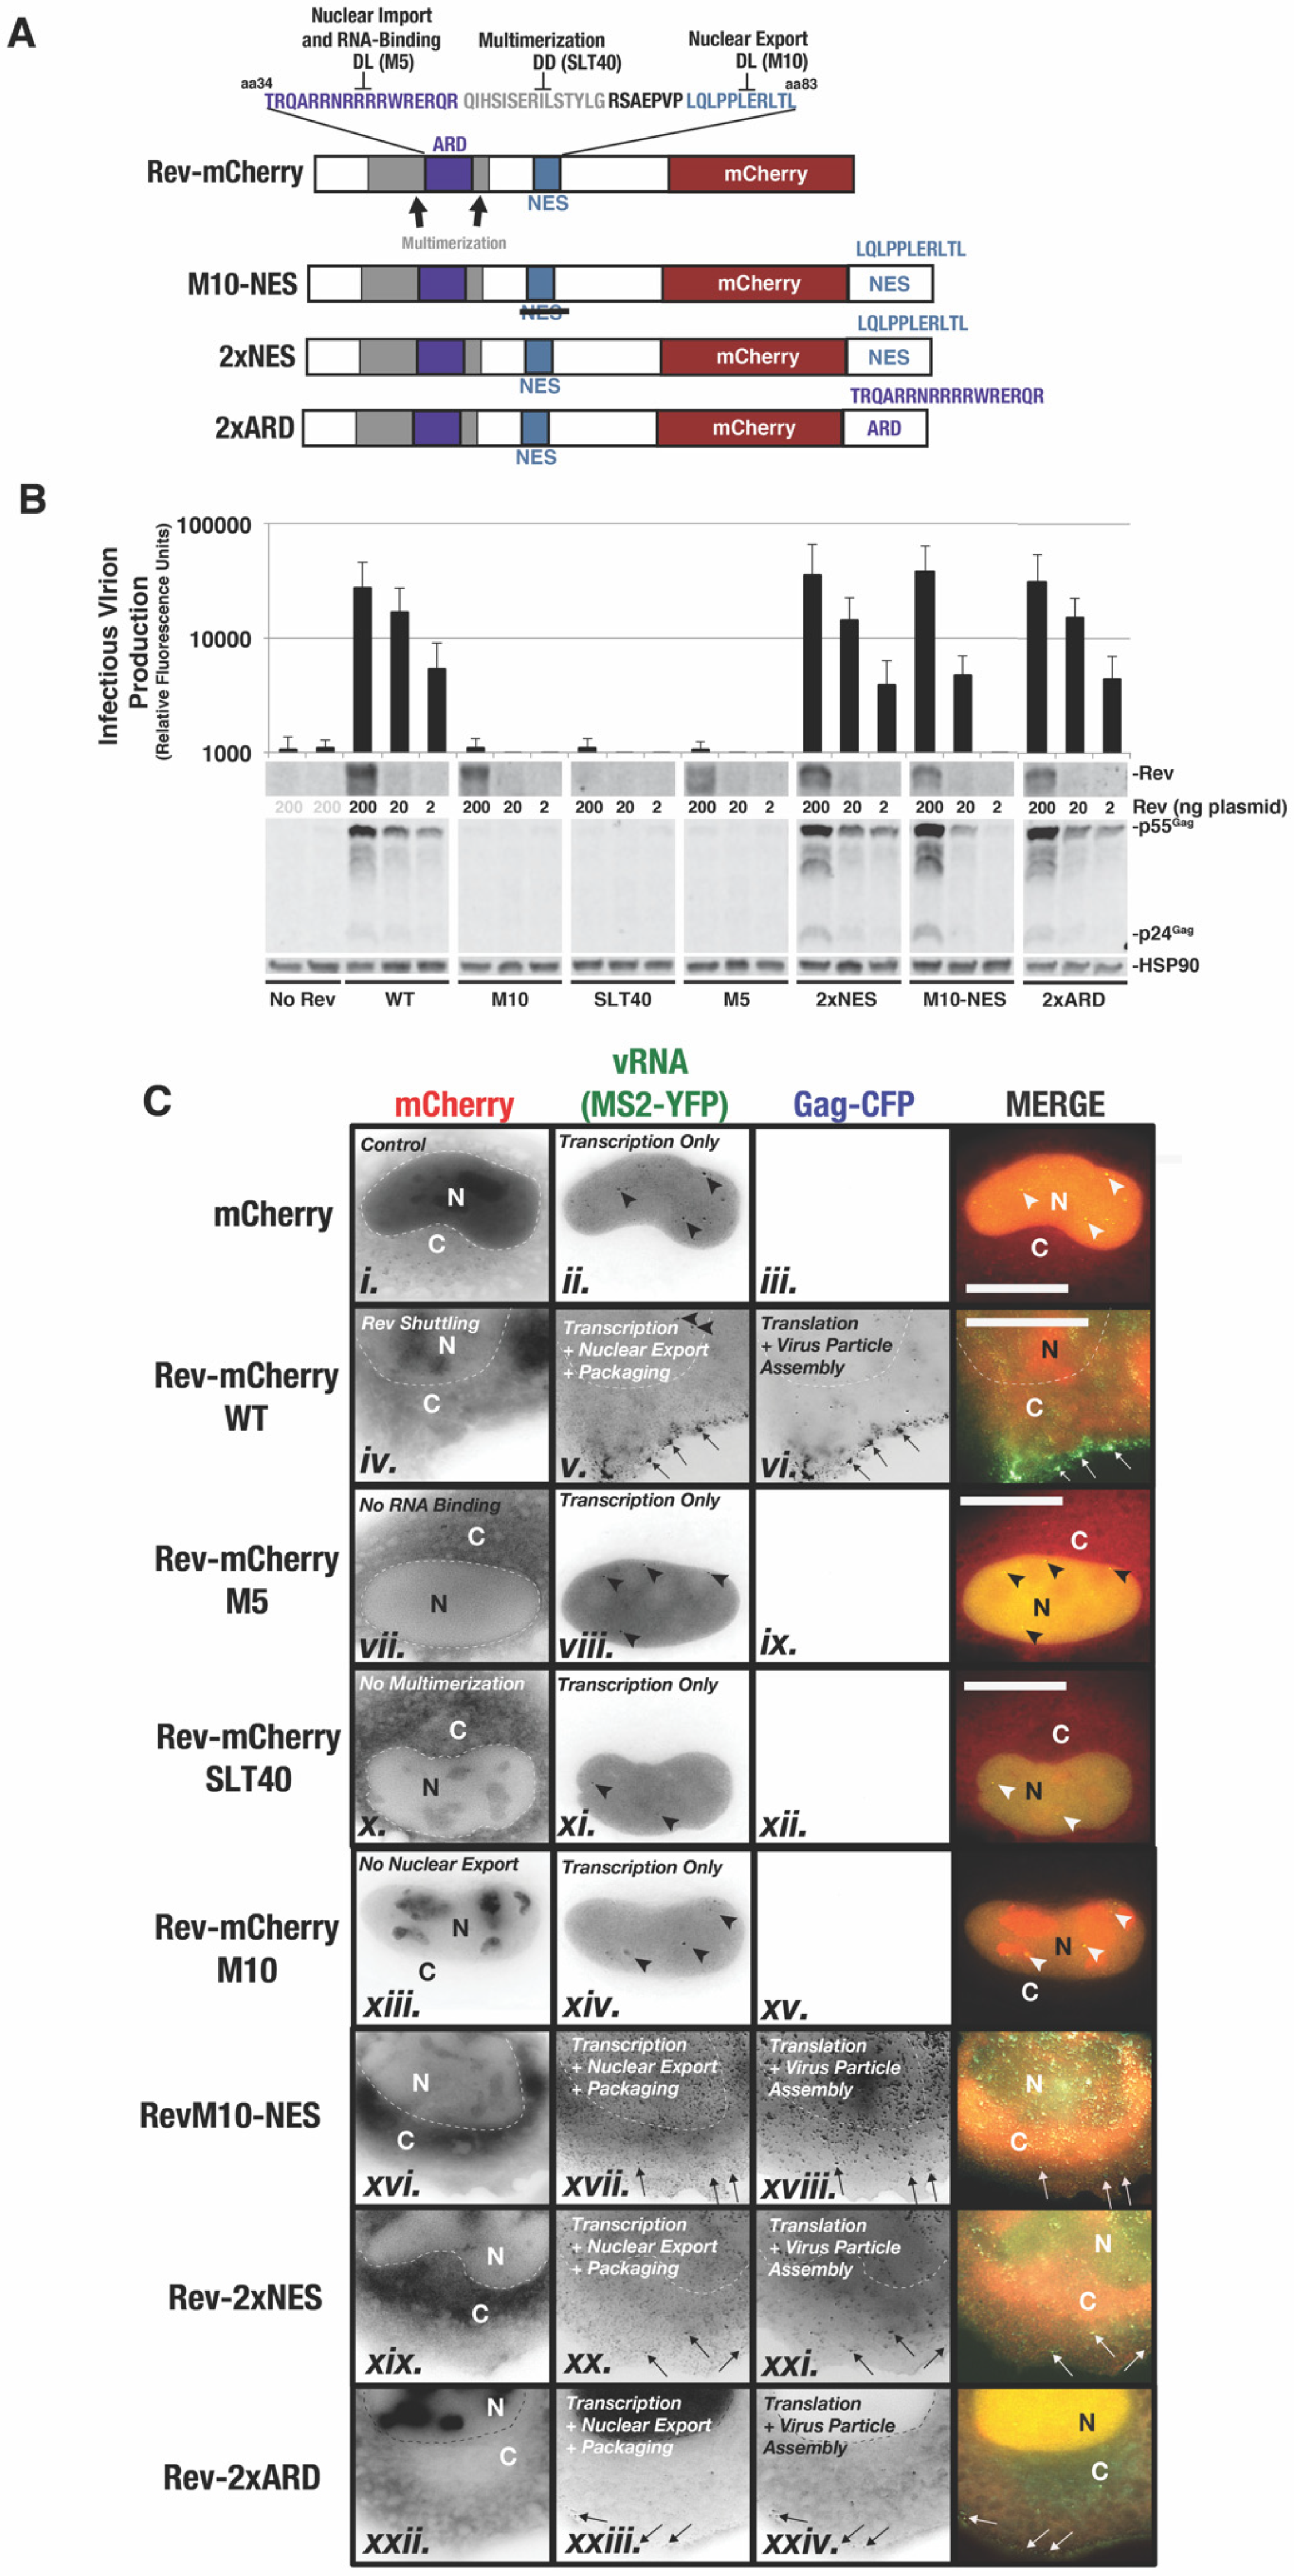
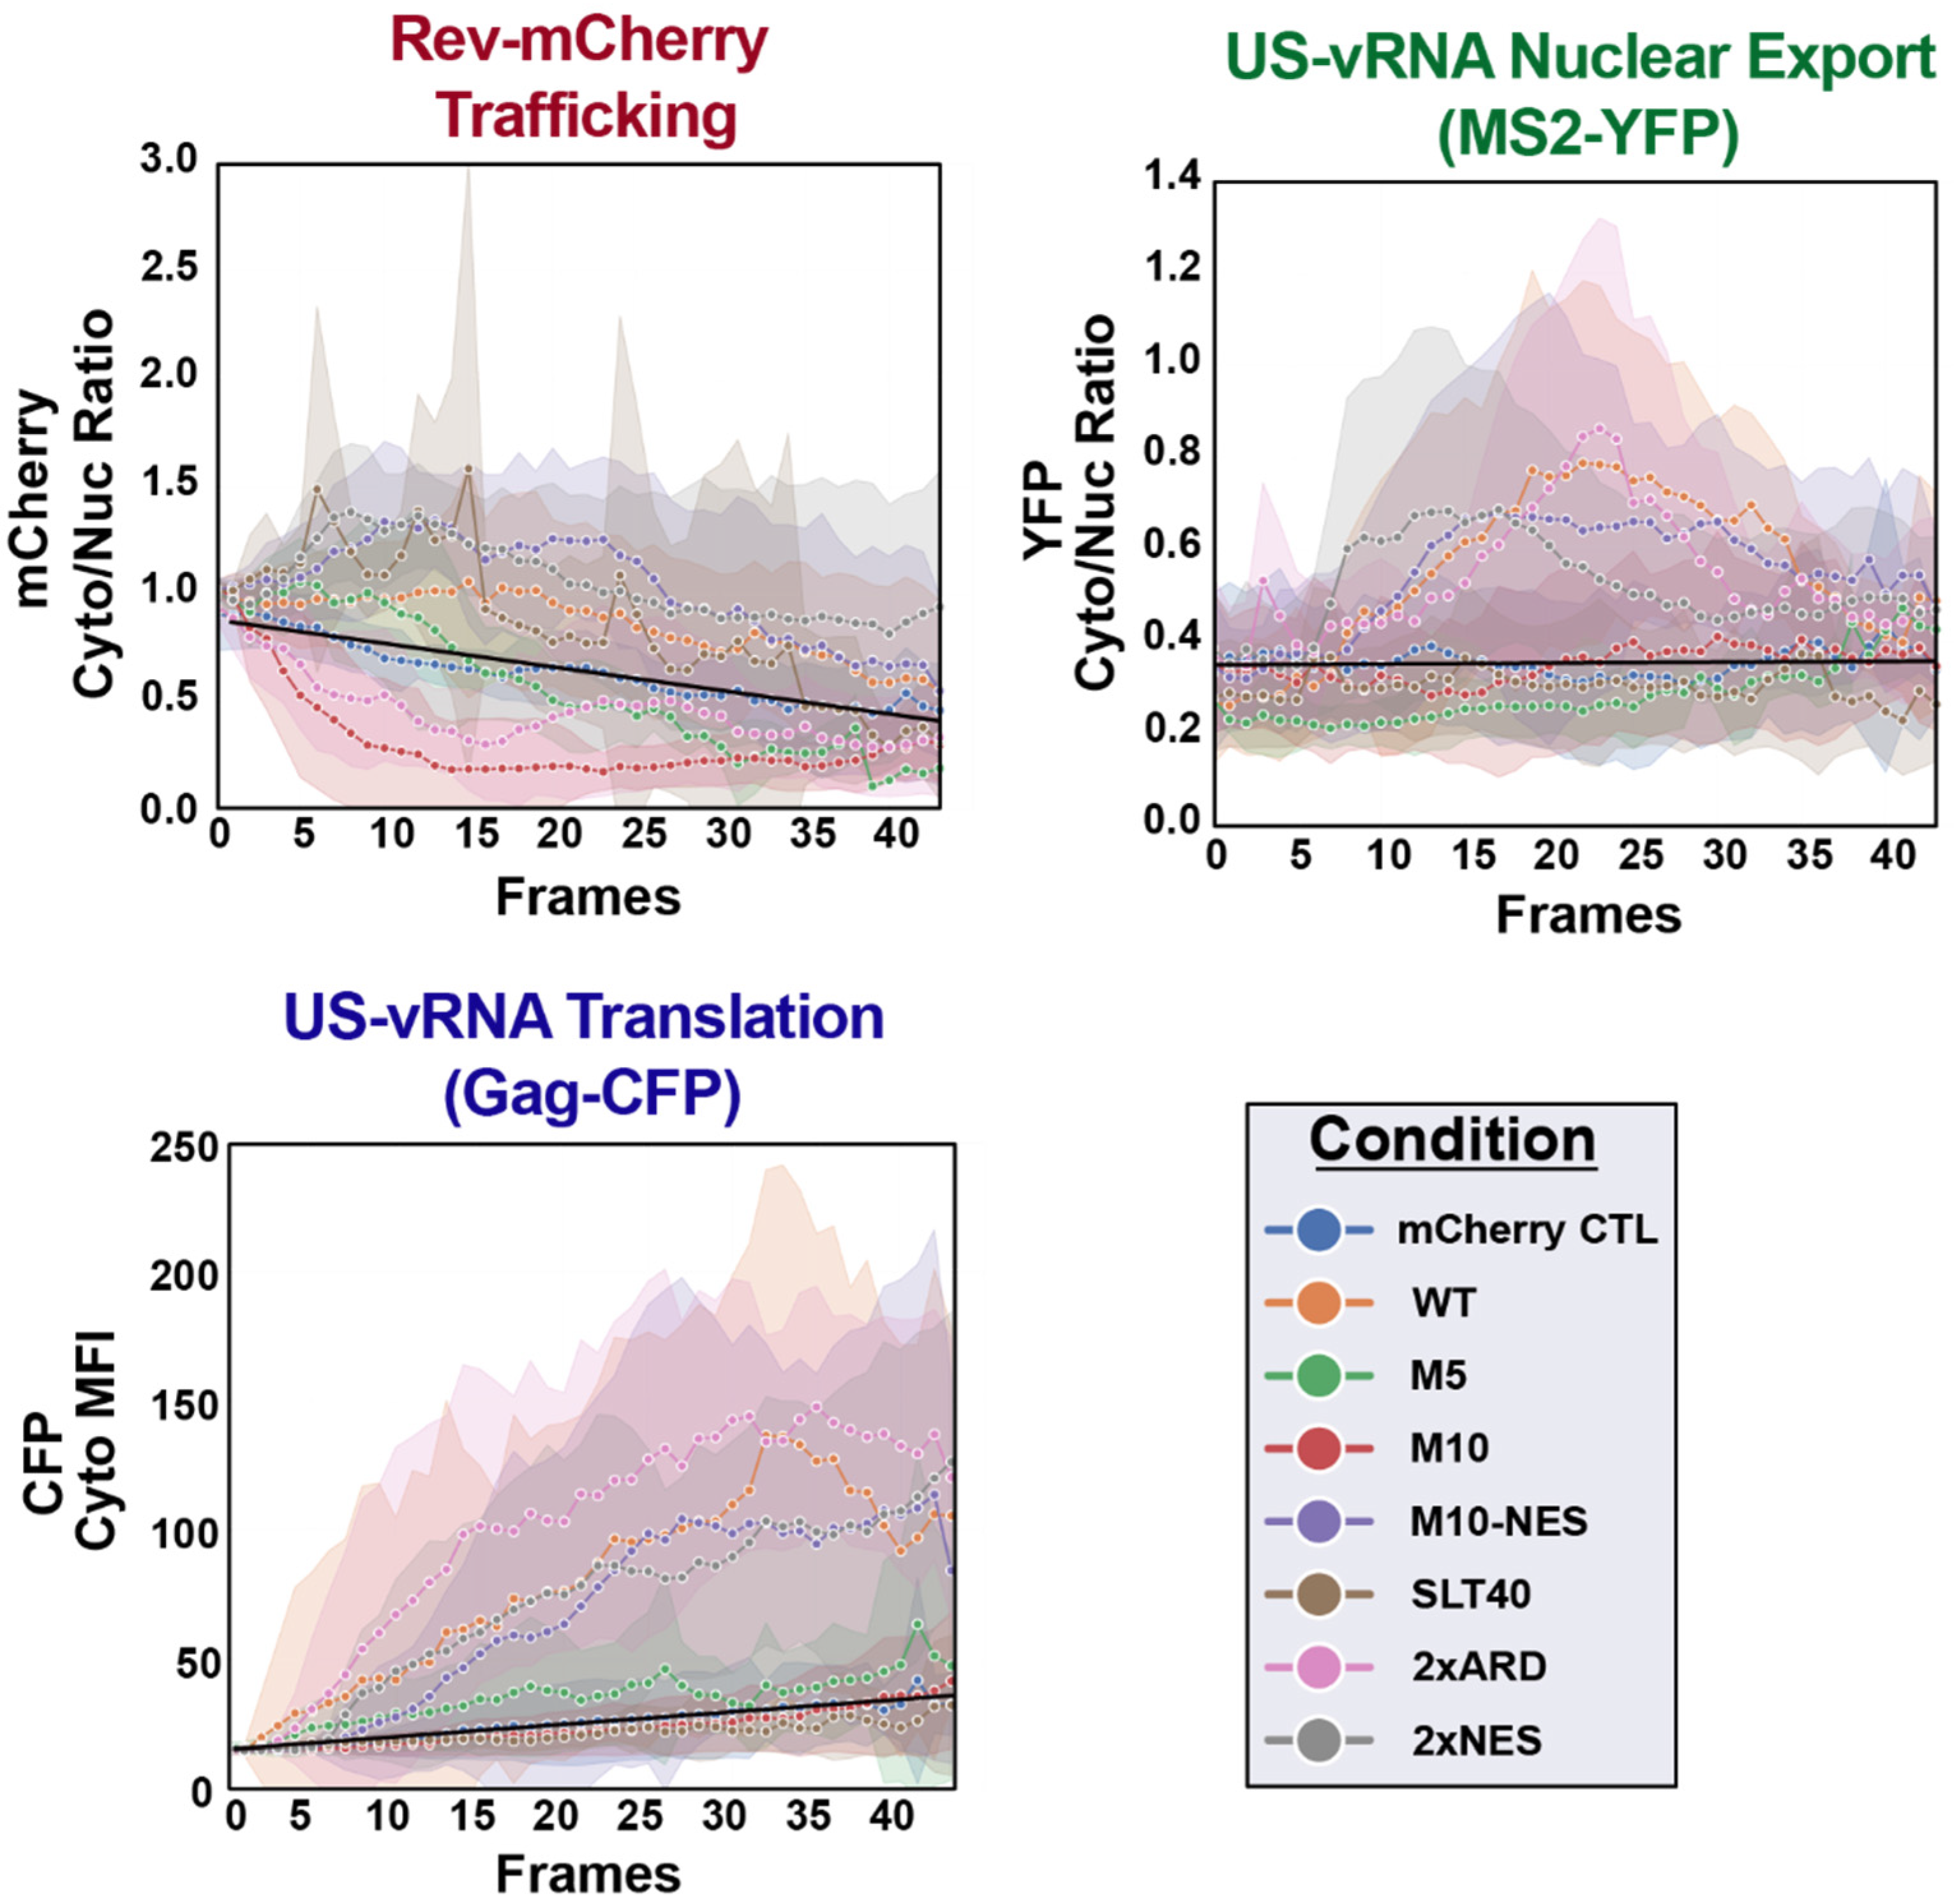
3.3. Case Study: Altered Steady-State Rev Subcellular Distribution Has Only Minor Impact on HIV-1 US RNA Transport and Translation
4. Discussion
Supplementary Materials
Author Contributions
Funding
Institutional Review Board Statement
Informed Consent Statement
Data Availability Statement
Acknowledgments
Conflicts of Interest
References
- Global HIV & AIDS Statistics—Fact Sheet. Available online: https://www.unaids.org/en/resources/fact-sheet (accessed on 18 February 2022).
- Vogt, V.M. Retroviral Virions and Genomes. In Retroviruses; Coffin, J.M., Hughes, S.H., Varmus, H.E., Eds.; Cold Spring Harbor Laboratory Press: Cold Spring Harbor, NY, USA, 1997; ISBN 978-0-87969-571-2. [Google Scholar]
- Jones, K.A.; Peterlin, B.M. Control of RNA Initiation and Elongation at the HIV-1 Promoter. Annu. Rev. Biochem. 1994, 63, 717–743. [Google Scholar] [CrossRef] [PubMed]
- Ott, M.; Geyer, M.; Zhou, Q. The Control of HIV Transcription: Keeping RNA Polymerase II on Track. Cell Host Microbe 2011, 10, 426–435. [Google Scholar] [CrossRef] [Green Version]
- Van Lint, C.; Bouchat, S.; Marcello, A. HIV-1 Transcription and Latency: An Update. Retrovirology 2013, 10, 67. [Google Scholar] [CrossRef] [Green Version]
- Karn, J.; Stoltzfus, C.M. Transcriptional and Posttranscriptional Regulation of HIV-1 Gene Expression. Cold Spring Harb. Perspect Med. 2012, 2, a006916. [Google Scholar] [CrossRef] [PubMed]
- Pollard, V.W.; Malim, M.H. The Hiv-1 Rev Protein. Annu. Rev. Microbiol. 1998, 52, 491–532. [Google Scholar] [CrossRef] [PubMed]
- Cullen, B.R. Nuclear MRNA Export: Insights from Virology. Trends Biochem. Sci. 2003, 28, 419–424. [Google Scholar] [CrossRef]
- Hope, T.J. The Ins and Outs of HIV Rev. Arch. Biochem. Biophys. 1999, 365, 186–191. [Google Scholar] [CrossRef]
- Fernandes, J.D.; Booth, D.S.; Frankel, A.D. A Structurally Plastic Ribonucleoprotein Complex Mediates Post-Transcriptional Gene Regulation in HIV-1. Wiley Interdiscip Rev RNA 2016, 7, 470–486. [Google Scholar] [CrossRef] [Green Version]
- Freed, E.O. HIV-1 Assembly, Release and Maturation. Nat. Rev. Microbiol. 2015, 13, 484–496. [Google Scholar] [CrossRef]
- Sundquist, W.I.; Kräusslich, H.-G. HIV-1 Assembly, Budding, and Maturation. Cold Spring Harb. Perspect Med. 2012, 2, a006924. [Google Scholar] [CrossRef]
- Kuzembayeva, M.; Dilley, K.; Sardo, L.; Hu, W.-S. Life of Psi: How Full-Length HIV-1 RNAs Become Packaged Genomes in the Viral Particles. Virology 2014, 454–455, 362–370. [Google Scholar] [CrossRef] [PubMed] [Green Version]
- Bolinger, C.; Boris-Lawrie, K. Mechanisms Employed by Retroviruses to Exploit Host Factors for Translational Control of a Complicated Proteome. Retrovirology 2009, 6, 8. [Google Scholar] [CrossRef] [PubMed] [Green Version]
- Bieniasz, P.; Telesnitsky, A. Multiple, Switchable Protein:RNA Interactions Regulate Human Immunodeficiency Virus Type 1 Assembly. Annu. Rev. Virol 2018, 5, 165–183. [Google Scholar] [CrossRef] [PubMed]
- Miyauchi, K.; Kim, Y.; Latinovic, O.; Morozov, V.; Melikyan, G.B. HIV Enters Cells via Endocytosis and Dynamin-Dependent Fusion with Endosomes. Cell 2009, 137, 433–444. [Google Scholar] [CrossRef] [Green Version]
- Lehmann, M.J.; Sherer, N.M.; Marks, C.B.; Pypaert, M.; Mothes, W. Actin- and Myosin-Driven Movement of Viruses along Filopodia Precedes Their Entry into Cells. J. Cell Biol. 2005, 170, 317–325. [Google Scholar] [CrossRef] [Green Version]
- Francis, A.C.; Marin, M.; Shi, J.; Aiken, C.; Melikyan, G.B. Time-Resolved Imaging of Single HIV-1 Uncoating In Vitro and in Living Cells. PLoS Pathog. 2016, 12, e1005709. [Google Scholar] [CrossRef] [Green Version]
- Burdick, R.C.; Li, C.; Munshi, M.; Rawson, J.M.O.; Nagashima, K.; Hu, W.-S.; Pathak, V.K. HIV-1 Uncoats in the Nucleus near Sites of Integration. Proc. Natl. Acad. Sci. USA 2020, 117, 5486–5493. [Google Scholar] [CrossRef]
- Mamede, J.I.; Cianci, G.C.; Anderson, M.R.; Hope, T.J. Early Cytoplasmic Uncoating Is Associated with Infectivity of HIV-1. Proc. Natl. Acad. Sci. USA 2017, 114, E7169–E7178. [Google Scholar] [CrossRef] [Green Version]
- Campbell, E.M.; Perez, O.; Anderson, J.L.; Hope, T.J. Visualization of a Proteasome-Independent Intermediate during Restriction of HIV-1 by Rhesus TRIM5alpha. J. Cell Biol. 2008, 180, 549–561. [Google Scholar] [CrossRef] [Green Version]
- Ma, Y.; He, Z.; Tan, T.; Li, W.; Zhang, Z.; Song, S.; Zhang, X.; Hu, Q.; Zhou, P.; Wu, Y.; et al. Real-Time Imaging of Single HIV-1 Disassembly with Multicolor Viral Particles. ACS Nano 2016, 10, 6273–6282. [Google Scholar] [CrossRef]
- Boireau, S.; Maiuri, P.; Basyuk, E.; de la Mata, M.; Knezevich, A.; Pradet-Balade, B.; Bäcker, V.; Kornblihtt, A.; Marcello, A.; Bertrand, E. The Transcriptional Cycle of HIV-1 in Real-Time and Live Cells. J. Cell Biol. 2007, 179, 291–304. [Google Scholar] [CrossRef] [PubMed] [Green Version]
- Tantale, K.; Mueller, F.; Kozulic-Pirher, A.; Lesne, A.; Victor, J.-M.; Robert, M.-C.; Capozi, S.; Chouaib, R.; Bäcker, V.; Mateos-Langerak, J.; et al. A Single-Molecule View of Transcription Reveals Convoys of RNA Polymerases and Multi-Scale Bursting. Nat. Commun. 2016, 7, 12248. [Google Scholar] [CrossRef] [PubMed] [Green Version]
- Pocock, G.M.; Becker, J.T.; Swanson, C.M.; Ahlquist, P.; Sherer, N.M. HIV-1 and M-PMV RNA Nuclear Export Elements Program Viral Genomes for Distinct Cytoplasmic Trafficking Behaviors. PLOS Pathog. 2016, 12, e1005565. [Google Scholar] [CrossRef] [PubMed] [Green Version]
- Behrens, R.T.; Aligeti, M.; Pocock, G.M.; Higgins, C.A.; Sherer, N.M. Nuclear Export Signal Masking Regulates HIV-1 Rev Trafficking and Viral RNA Nuclear Export. J. Virol. 2017, 91, e02107-16. [Google Scholar] [CrossRef] [PubMed] [Green Version]
- Lyon, K.; Aguilera, L.U.; Morisaki, T.; Munsky, B.; Stasevich, T.J. Live-Cell Single RNA Imaging Reveals Bursts of Translational Frameshifting. Mol. Cell 2019, 75, 172–183. [Google Scholar] [CrossRef]
- Chen, J.; Liu, Y.; Wu, B.; Nikolaitchik, O.A.; Mohan, P.R.; Chen, J.; Pathak, V.K.; Hu, W.-S. Visualizing the Translation and Packaging of HIV-1 Full-Length RNA. Proc. Natl. Acad. Sci. USA 2020, 117, 6145–6155. [Google Scholar] [CrossRef]
- Chen, A.; Panjaworayan, T.; Thienprasert, N.; Brown, C.M. Prospects for Inhibiting the Post-Transcriptional Regulation of Gene Expression in Hepatitis B Virus. World J. Gastroenterol. 2014, 20, 7993–8004. [Google Scholar] [CrossRef]
- Hendrix, J.; Baumgärtel, V.; Schrimpf, W.; Ivanchenko, S.; Digman, M.A.; Gratton, E.; Kräusslich, H.-G.; Müller, B.; Lamb, D.C. Live-Cell Observation of Cytosolic HIV-1 Assembly Onset Reveals RNA-Interacting Gag Oligomers. J. Cell Biol. 2015, 210, 629–646. [Google Scholar] [CrossRef]
- Fogarty, K.H.; Berk, S.; Grigsby, I.F.; Chen, Y.; Mansky, L.M.; Mueller, J.D. Interrelationship between Cytoplasmic Retroviral Gag Concentration and Gag-Membrane Association. J. Mol. Biol. 2014, 426, 1611–1624. [Google Scholar] [CrossRef] [Green Version]
- Milev, M.P.; Brown, C.M.; Mouland, A.J. Live Cell Visualization of the Interactions between HIV-1 Gag and the Cellular RNA-Binding Protein Staufen1. Retrovirology 2010, 7, 41. [Google Scholar] [CrossRef] [Green Version]
- Kemler, I.; Meehan, A.; Poeschla, E.M. Live-Cell Coimaging of the Genomic RNAs and Gag Proteins of Two Lentiviruses. J. Virol. 2010, 84, 6352–6366. [Google Scholar] [CrossRef] [PubMed] [Green Version]
- Jouvenet, N.; Simon, S.M.; Bieniasz, P.D. Imaging the Interaction of HIV-1 Genomes and Gag during Assembly of Individual Viral Particles. Proc. Natl. Acad. Sci. USA 2009, 106, 19114–19119. [Google Scholar] [CrossRef] [PubMed] [Green Version]
- Chen, J.; Rahman, S.A.; Nikolaitchik, O.A.; Grunwald, D.; Sardo, L.; Burdick, R.C.; Plisov, S.; Liang, E.; Tai, S.; Pathak, V.K.; et al. HIV-1 RNA Genome Dimerizes on the Plasma Membrane in the Presence of Gag Protein. Proc. Natl. Acad. Sci. USA 2016, 113, E201–E208. [Google Scholar] [CrossRef] [PubMed] [Green Version]
- Baumgärtel, V.; Ivanchenko, S.; Dupont, A.; Sergeev, M.; Wiseman, P.W.; Kräusslich, H.-G.; Bräuchle, C.; Müller, B.; Lamb, D.C. Live-Cell Visualization of Dynamics of HIV Budding Site Interactions with an ESCRT Component. Nat. Cell Biol. 2011, 13, 469–474. [Google Scholar] [CrossRef]
- Bleck, M.; Itano, M.S.; Johnson, D.S.; Thomas, V.K.; North, A.J.; Bieniasz, P.D.; Simon, S.M. Temporal and Spatial Organization of ESCRT Protein Recruitment during HIV-1 Budding. Proc. Natl. Acad. Sci. USA 2014, 111, 12211–12216. [Google Scholar] [CrossRef] [Green Version]
- Jouvenet, N.; Bieniasz, P.D.; Simon, S.M. Imaging the Biogenesis of Individual HIV-1 Virions in Live Cells. Nature 2008, 454, 236–240. [Google Scholar] [CrossRef]
- Sardo, L.; Hatch, S.C.; Chen, J.; Nikolaitchik, O.; Burdick, R.C.; Chen, D.; Westlake, C.J.; Lockett, S.; Pathak, V.K.; Hu, W.-S. Dynamics of HIV-1 RNA Near the Plasma Membrane during Virus Assembly. J. Virol. 2015, 89, 10832–10840. [Google Scholar] [CrossRef] [Green Version]
- Jouvenet, N.; Zhadina, M.; Bieniasz, P.D.; Simon, S.M. Dynamics of ESCRT Protein Recruitment during Retroviral Assembly. Nat. Cell Biol. 2011, 13, 394–401. [Google Scholar] [CrossRef] [Green Version]
- Sherer, N.M.; Lehmann, M.J.; Jimenez-Soto, L.F.; Horensavitz, C.; Pypaert, M.; Mothes, W. Retroviruses Can Establish Filopodial Bridges for Efficient Cell-to-Cell Transmission. Nat. Cell Biol. 2007, 9, 310–315. [Google Scholar] [CrossRef] [Green Version]
- Gousset, K.; Ablan, S.D.; Coren, L.V.; Ono, A.; Soheilian, F.; Nagashima, K.; Ott, D.E.; Freed, E.O. Real-Time Visualization of HIV-1 GAG Trafficking in Infected Macrophages. PLoS Pathog. 2008, 4, e1000015. [Google Scholar] [CrossRef] [Green Version]
- Gardiner, J.C.; Mauer, E.J.; Sherer, N.M. HIV-1 Gag, Envelope, and Extracellular Determinants Cooperate To Regulate the Stability and Turnover of Virological Synapses. J. Virol. 2016, 90, 6583–6597. [Google Scholar] [CrossRef] [PubMed] [Green Version]
- Symeonides, M.; Murooka, T.T.; Bellfy, L.N.; Roy, N.H.; Mempel, T.R.; Thali, M. HIV-1-Induced Small T Cell Syncytia Can Transfer Virus Particles to Target Cells through Transient Contacts. Viruses 2015, 7, 6590–6603. [Google Scholar] [CrossRef] [PubMed] [Green Version]
- Hübner, W.; McNerney, G.P.; Chen, P.; Dale, B.M.; Gordon, R.E.; Chuang, F.Y.S.; Li, X.-D.; Asmuth, D.M.; Huser, T.; Chen, B.K. Quantitative 3D Video Microscopy of HIV Transfer across T Cell Virological Synapses. Science 2009, 323, 1743–1747. [Google Scholar] [CrossRef] [PubMed] [Green Version]
- Pocock, G.M.; Zimdars, L.L.; Yuan, M.; Eliceiri, K.W.; Ahlquist, P.; Sherer, N.M. Diverse Activities of Viral Cis-Acting RNA Regulatory Elements Revealed Using Multicolor, Long-Term, Single-Cell Imaging. Mol. Biol. Cell 2017, 28, 476–487. [Google Scholar] [CrossRef]
- Schneider, C.A.; Rasband, W.S.; Eliceiri, K.W. NIH Image to ImageJ: 25 Years of Image Analysis. Nat. Methods 2012, 9, 671–675. [Google Scholar] [CrossRef]
- Schindelin, J.; Rueden, C.T.; Hiner, M.C.; Eliceiri, K.W. The ImageJ Ecosystem: An Open Platform for Biomedical Image Analysis. Mol. Reprod. Dev. 2015, 82, 518–529. [Google Scholar] [CrossRef] [Green Version]
- Dietz, C.; Rueden, C.T.; Helfrich, S.; Dobson, E.T.A.; Horn, M.; Eglinger, J.; Evans, E.L.; McLean, D.T.; Novitskaya, T.; Ricke, W.A.; et al. Integration of the ImageJ Ecosystem in the KNIME Analytics Platform. Front. Comput Sci 2020, 2, 8. [Google Scholar] [CrossRef]
- ImageJ Wiki. Available online: https://imagej.net/ (accessed on 18 February 2022).
- KNIME. Available online: https://www.knime.com/open-for-innovation-0 (accessed on 18 February 2022).
- Moore, J.; Linkert, M.; Blackburn, C.; Carroll, M.; Ferguson, R.K.; Flynn, H.; Gillen, K.; Leigh, R.; Li, S.; Lindner, D.; et al. OMERO and Bio-Formats 5: Flexible Access to Large Bioimaging Datasets at Scale. In Proceedings of the Medical Imaging 2015: Image Processing, Orlando, FL, USA, 20 March 2015; Volume 9413, pp. 37–42. [Google Scholar]
- Hiner, M.C.; Rueden, C.T.; Eliceiri, K.W. SCIFIO: An Extensible Framework to Support Scientific Image Formats. BMC Bioinform. 2016, 17, 521. [Google Scholar] [CrossRef] [Green Version]
- HIV RGB: A KNIME Workflow for Single Cell Tracking and Measurement. Available online: https://github.com/shererlab/hivrgb (accessed on 18 February 2022).
- Le Hir, H.; Gatfield, D.; Izaurralde, E.; Moore, M.J. The Exon-Exon Junction Complex Provides a Binding Platform for Factors Involved in MRNA Export and Nonsense-Mediated MRNA Decay. EMBO J. 2001, 20, 4987–4997. [Google Scholar] [CrossRef] [Green Version]
- Marshall, P.; Lemieux, C. The I-CeuI Endonuclease Recognizes a Sequence of 19 Base Pairs and Preferentially Cleaves the Coding Strand of the Chlamydomonas Moewusii Chloroplast Large Subunit RRNA Gene. Nucleic Acids Res. 1992, 20, 6401–6407. [Google Scholar] [CrossRef] [Green Version]
- Harris, M.E.; Hope, T.J. RNA Export: Insights from Viral Models. Essays Biochem. 2000, 36, 115–127. [Google Scholar] [PubMed]
- Malim, M.H.; Tiley, L.S.; McCarn, D.F.; Rusche, J.R.; Hauber, J.; Cullen, B.R. HIV-1 Structural Gene Expression Requires Binding of the Rev Trans-Activator to Its RNA Target Sequence. Cell 1990, 60, 675–683. [Google Scholar] [CrossRef]
- Malim, M.H.; Cullen, B.R. HIV-1 Structural Gene Expression Requires the Binding of Multiple Rev Monomers to the Viral RRE: Implications for HIV-1 Latency. Cell 1991, 65, 241–248. [Google Scholar] [CrossRef]
- Olsen, H.S.; Cochrane, A.W.; Dillon, P.J.; Nalin, C.M.; Rosen, C.A. Interaction of the Human Immunodeficiency Virus Type 1 Rev Protein with a Structured Region in Env MRNA Is Dependent on Multimer Formation Mediated through a Basic Stretch of Amino Acids. Genes Dev. 1990, 4, 1357–1364. [Google Scholar] [CrossRef] [Green Version]
- Daly, T.J.; Cook, K.S.; Gray, G.S.; Maione, T.E.; Rusche, J.R. Specific Binding of HIV-1 Recombinant Rev Protein to the Rev-Responsive Element in Vitro. Nature 1989, 342, 816–819. [Google Scholar] [CrossRef]
- Malim, M.H.; Böhnlein, S.; Hauber, J.; Cullen, B.R. Functional Dissection of the HIV-1 Rev Trans-Activator--Derivation of a Trans-Dominant Repressor of Rev Function. Cell 1989, 58, 205–214. [Google Scholar] [CrossRef]
- Malim, M.H.; Hauber, J.; Le, S.Y.; Maizel, J.V.; Cullen, B.R. The HIV-1 Rev Trans-Activator Acts through a Structured Target Sequence to Activate Nuclear Export of Unspliced Viral MRNA. Nature 1989, 338, 254–257. [Google Scholar] [CrossRef]
- Truant, R.; Cullen, B.R. The Arginine-Rich Domains Present in Human Immunodeficiency Virus Type 1 Tat and Rev Function as Direct Importin β-Dependent Nuclear Localization Signals. Mol. Cell. Biol. 1999, 19, 1210–1217. [Google Scholar] [CrossRef] [Green Version]
- Henderson, B.R.; Percipalle, P. Interactions between HIV Rev and Nuclear Import and Export Factors: The Rev Nuclear Localisation Signal Mediates Specific Binding to Human Importin-Β1. J. Mol. Biol. 1997, 274, 693–707. [Google Scholar] [CrossRef]
- Neville, M.; Stutz, F.; Lee, L.; Davis, L.I.; Rosbash, M. The Importin-Beta Family Member Crm1p Bridges the Interaction between Rev and the Nuclear Pore Complex during Nuclear Export. Curr. Biol. 1997, 7, 767–775. [Google Scholar] [CrossRef] [Green Version]
- Fornerod, M.; Ohno, M.; Yoshida, M.; Mattaj, I.W. CRM1 Is an Export Receptor for Leucine-Rich Nuclear Export Signals. Cell 1997, 90, 1051–1060. [Google Scholar] [CrossRef] [Green Version]
- Fukuda, M.; Asano, S.; Nakamura, T.; Adachi, M.; Yoshida, M.; Yanagida, M.; Nishida, E. CRM1 Is Responsible for Intracellular Transport Mediated by the Nuclear Export Signal. Nature 1997, 390, 308–311. [Google Scholar] [CrossRef] [PubMed]
- Aligeti, M.; Behrens, R.T.; Pocock, G.M.; Schindelin, J.; Dietz, C.; Eliceiri, K.W.; Swanson, C.M.; Malim, M.H.; Ahlquist, P.; Sherer, N.M. Cooperativity among Rev-Associated Nuclear Export Signals Regulates HIV-1 Gene Expression and Is a Determinant of Virus Species Tropism. J. Virol. 2014, 88, 14207–14221. [Google Scholar] [CrossRef] [Green Version]
- Becker, J.T.; Sherer, N.M. Subcellular Localization of HIV-1 Gag-Pol MRNAs Regulates Sites of Virion Assembly. J. Virol. 2017, 91. [Google Scholar] [CrossRef] [PubMed] [Green Version]
- NR-SAT—Elevans. Available online: https://hub.knime.com/elevans/spaces/Public/latest/NR-SAT~_Hlavtt7T5eT0Y5f (accessed on 18 February 2022).
- Wählby, C.; Sintorn, I.-M.; Erlandsson, F.; Borgefors, G.; Bengtsson, E. Combining Intensity, Edge and Shape Information for 2D and 3D Segmentation of Cell Nuclei in Tissue Sections. J. Microsc. 2004, 215, 67–76. [Google Scholar] [CrossRef] [PubMed]
- Tinevez, J.-Y.; Perry, N.; Schindelin, J.; Hoopes, G.M.; Reynolds, G.D.; Laplantine, E.; Bednarek, S.Y.; Shorte, S.L.; Eliceiri, K.W. TrackMate: An Open and Extensible Platform for Single-Particle Tracking. Methods 2017, 115, 80–90. [Google Scholar] [CrossRef]
- Thomas, S.L.; Oft, M.; Jaksche, H.; Casari, G.; Heger, P.; Dobrovnik, M.; Bevec, D.; Hauber, J. Functional Analysis of the Human Immunodeficiency Virus Type 1 Rev Protein Oligomerization Interface. J. Virol. 1998, 72, 2935–2944. [Google Scholar] [CrossRef] [PubMed] [Green Version]
- Di, Z.; Herpers, B.; Fredriksson, L.; Yan, K.; van de Water, B.; Verbeek, F.J.; Meerman, J.H.N. Automated Analysis of NF-ΚB Nuclear Translocation Kinetics in High-Throughput Screening. PLoS ONE 2012, 7, e52337. [Google Scholar] [CrossRef]
- Knowles, D.W.; Sudar, D.; Bator-Kelly, C.; Bissell, M.J.; Lelièvre, S.A. Automated Local Bright Feature Image Analysis of Nuclear Protein Distribution Identifies Changes in Tissue Phenotype. Proc. Natl. Acad. Sci. USA 2006, 103, 4445–4450. [Google Scholar] [CrossRef] [Green Version]
- Daugherty, M.D.; D’Orso, I.; Frankel, A.D. A Solution to Limited Genomic Capacity: Using Adaptable Binding Surfaces to Assemble the Functional HIV Rev Oligomer on RNA. Mol. Cell 2008, 31, 824–834. [Google Scholar] [CrossRef] [Green Version]
- Hauber, J.; Bouvier, M.; Malim, M.H.; Cullen, B.R. Phosphorylation of the Rev Gene Product of Human Immunodeficiency Virus Type 1. J. Virol. 1988, 62, 4801–4804. [Google Scholar] [CrossRef] [PubMed] [Green Version]


Publisher’s Note: MDPI stays neutral with regard to jurisdictional claims in published maps and institutional affiliations. |
© 2022 by the authors. Licensee MDPI, Basel, Switzerland. This article is an open access article distributed under the terms and conditions of the Creative Commons Attribution (CC BY) license (https://creativecommons.org/licenses/by/4.0/).
Share and Cite
Evans, E.L., III; Pocock, G.M.; Einsdorf, G.; Behrens, R.T.; Dobson, E.T.A.; Wiedenmann, M.; Birkhold, C.; Ahlquist, P.; Eliceiri, K.W.; Sherer, N.M. HIV RGB: Automated Single-Cell Analysis of HIV-1 Rev-Dependent RNA Nuclear Export and Translation Using Image Processing in KNIME. Viruses 2022, 14, 903. https://0-doi-org.brum.beds.ac.uk/10.3390/v14050903
Evans EL III, Pocock GM, Einsdorf G, Behrens RT, Dobson ETA, Wiedenmann M, Birkhold C, Ahlquist P, Eliceiri KW, Sherer NM. HIV RGB: Automated Single-Cell Analysis of HIV-1 Rev-Dependent RNA Nuclear Export and Translation Using Image Processing in KNIME. Viruses. 2022; 14(5):903. https://0-doi-org.brum.beds.ac.uk/10.3390/v14050903
Chicago/Turabian StyleEvans, Edward L., III, Ginger M. Pocock, Gabriel Einsdorf, Ryan T. Behrens, Ellen T. A. Dobson, Marcel Wiedenmann, Christian Birkhold, Paul Ahlquist, Kevin W. Eliceiri, and Nathan M. Sherer. 2022. "HIV RGB: Automated Single-Cell Analysis of HIV-1 Rev-Dependent RNA Nuclear Export and Translation Using Image Processing in KNIME" Viruses 14, no. 5: 903. https://0-doi-org.brum.beds.ac.uk/10.3390/v14050903